assessment f (workflow clinical) - u.s. department of ...€¦ · assessment f (workflow –...
TRANSCRIPT

Prepared by:
McKinsey & Company, Inc.
A Product of the CMS Alliance to Modernize Healthcare Federally Funded Research and Development Center Centers for Medicare & Medicaid Services (CMS)
Prepared For: U.S. Department of Veterans Affairs At the Request of: Veterans Access, Choice, and Accountability Act of 2014 Section 201: Independent Assessment of the Health Care Delivery Systems and Management Processes of the Department of Veterans Affairs
Assessment F (Workflow – Clinical)
September 1, 2015
Prepared for CAMH under:
Prime Contract No. HHS-M500-2012-00008I
Prime Task Order No. VA118A14F0373
This document was prepared for authorized distribution only. It has not been approved for public release.

Assessment F (Workflow – Clinical)
The views, opinions, and/or findings contained in this report are those of the assessment team and should not be construed as an official government position, policy, or decision.
ii
This page intentionally left blank.

Assessment F (Workflow – Clinical)
The views, opinions, and/or findings contained in this report are those of the assessment team and should not be construed as an official government position, policy, or decision.
iii
Preface Congress enacted and President Obama signed into law the Veterans Access, Choice, and Accountability Act of 2014 (Public Law 113-146) (“Veterans Choice Act”), as amended by the Department of Veterans Affairs (VA) Expiring Authorities Act of 2014 (Public Law 113-175), to improve access to timely, high-quality health care for Veterans. Under “Title II – Health Care Administrative Matters,” Section 201 calls for an Independent Assessment of 12 areas of VA’s health care delivery systems and management processes.
VA engaged the Institute of Medicine of the National Academies to prepare an assessment of access standards and engaged the Centers for Medicare & Medicaid Services (CMS) Alliance to Modernize Healthcare (CAMH)1 to serve as the program integrator and as primary developer of the remaining 11 Veterans Choice Act independent assessments. CAMH subcontracted with Grant Thornton, McKinsey & Company, and the RAND Corporation to conduct 10 independent assessments as specified in Section 201, with MITRE conducting the 11th assessment. Drawing on the results of the 12 assessments, CAMH also produced the Integrated Report in this volume, which contains key findings and recommendations. CAMH is furnishing the complete set of reports to the Secretary of Veterans Affairs, the Committee on Veterans’ Affairs of the Senate, the Committee on Veterans’ Affairs of the House of Representatives, and the Commission on Care.
The research addressed in this report was conducted by McKinsey & Company under a subcontract with The MITRE Corporation
1 The CMS Alliance to Modernize Healthcare (CAMH), sponsored by the Centers for Medicare & Medicaid Services
(CMS), is a federally funded research and development center (FFRDC) operated by The MITRE Corporation, a not-for-profit company chartered to work in the public interest. For additional information, see the CMS Alliance to Modernize Healthcare (CAMH) website (http://www.mitre.org/centers/cms-alliances-to-modernize-healthcare/who-we-are/the-camh-difference).

Assessment F (Workflow – Clinical)
The views, opinions, and/or findings contained in this report are those of the assessment team and should not be construed as an official government position, policy, or decision.
iv
This page intentionally left blank.

Assessment F (Workflow – Clinical)
The views, opinions, and/or findings contained in this report are those of the assessment team and should not be construed as an official government position, policy, or decision.
v
Executive Summary Part F (“Assessment F”), Section 201 of the Veterans Access, Choice, and Accountability Act of 2014 (“The Choice Act”) mandates an assessment of the “organization, workflow processes, and tools used by the Department to support clinical staffing, access to care, effective length-of-stay management and care transitions, positive patient experience, accurate documentation, and subsequent coding of inpatient services.” Assessment F looked at these five sub-assessments (clinical staffing, access to care, effective length-of-stay management and care transitions, positive patient experience, accurate documentation, and subsequent coding) as both individual components as well as part of the interdependent continuum of inpatient care2.
Inpatient care is delivered to more than 600,000 Veterans annually across more than 150 Veteran Affairs Medical Centers (VAMCs) in all 50 states and Puerto Rico (VSSC, 2014). The scale and variety of services the Veterans Health Administration (VHA) provides are extensive. VAMCs range considerably in complexity, from high-complexity, high-volume sites (“level 1a”) to lower-complexity facilities more focused on outpatient care (“level 3”)3. Approximately 80 percent of high- and medium-complexity facilities4 have Community Living Centers (CLCs—VA nursing homes), ~50 percent have Domiciliary Residential Rehab Treatment Programs , ~25 percent provide Polytrauma services5, ~20 percent are Regional Spinal Cord Injury Centers, and ~10 percent are Blind Rehabilitation Centers. VHA also has complex partnerships with other organizations: 100 percent of high- and medium-complexity facilities are academically affiliated and ~2 percent are joint DoD facilities. Ensuring consistently high-quality services and efficient operations across such a large and varied system is a considerable task.
Assessment F’s focus was exclusively on the acute inpatient care setting6. To understand the strengths and challenges of VHA practices across such a varied system, we interacted with more than 750 VHA employees, including front-line staff, VAMC leadership, and VHA subject matter experts at VA Central Office (VACO), VHA Central Office (VHACO), and VAMCs. We visited a representative sample of 21 VAMCs across the country, conducting interviews with leadership and staff, interdisciplinary workshops with front-line personnel and managers, and shadowing in acute inpatient units. We supplemented site visits with analysis of national VHA data sets, a system-wide survey and data call, and interviews. We then compared VHA practices against industry benchmarks and best practices.
2 Table 1-1 in section 1.3.6 provides a cross map of the sub-assessments’ findings and recommendations with the
organization, workflow processes and tools framework 3 VHA has five complexity levels: 1a, 1b, 1c, 2, and 3, with 1a being the most complex and 3 being the least
complex 4 Levels 1a, 1b, 1c, and 2. Our assessment is tasked with assessing inpatient care, and therefore focused on higher-
complexity facilities, which have more substantial inpatient services 5 Includes Polytrauma Rehabilitation Centers (~5 percent) and Polytrauma Network Sites (~20 percent) 6 Choice Act 201 specifies a focus on the inpatient setting, as such our assessment does not cover outpatient, VHA-
operated long-term care facilities (e.g., community living centers, domiciliary care), or VAMCs that do not provide acute medical care in the inpatient setting as their primary service (Level 3)

Assessment F (Workflow – Clinical)
The views, opinions, and/or findings contained in this report are those of the assessment team and should not be construed as an official government position, policy, or decision.
vi
Our assessment identified both cross-cutting strengths and opportunities for improvement as well as findings and recommendations specific to each of the five sub-assessment areas included in this report. Cross-cutting findings and recommendations can be found in Sections 3 and 4, while sub-assessment-specific findings and recommendations can be found in Sections 5 to 9. In brief, we found:
Cross-cutting findings: We observed three common themes supported by findings across sub-assessment areas.
o Ineffective data collection and management drives a lack of transparency into many key aspects of clinical operations, hindering VHA’s ability to effectively manage inpatient care. Despite having a well regarded electronic medical record (EMR) system and the capability of tracking extensive clinical data, poor data collection and management of operational metrics was a consistent theme heard during site visits. Furthermore, it was clearly evident from our central and local requests for specific information. Data that is standard in private sector hospitals was frequently inaccessible in a timely manner or not tracked in a usable format by VHA.
o VHA resources (e.g., staff, beds) do not always match Veterans’ care needs. The practical allocation and prioritization of resources across the VHA system may not be consistently aligned to meeting the broader health needs of the Veteran patient population. Mismatch of resources to patient care needs manifests itself in three ways: hiring that does not consistently match staffing needs; allocation of staff to tours (“shift”) that do not consistently match Veteran demand; and limited access to appropriate outpatient and post-/sub- acute care options.
o While best practices exist in selected pockets, communication and support for implementation at scale appears to be a challenge. Our site visits revealed several clear best practices in place at various VAMCs (please see Appendix A-2 for a list of best practices identified during site visits and highlighted throughout this report); however, adoption of these practices was isolated even within the facility. Case studies of particularly strong programs are included in all sub-assessments. Despite successfully adopting best practices in some units, however, facilities appeared to struggle to implement programs house-wide. Moreover, information-sharing between VAMCs appears to be limited and ad hoc. As one Assistant Director of Patient Care Services described, “I’m shameless about stealing what works at other places, the problem is, I don’t know what other places are doing. We need a way to connect, to learn from each other”7. This sentiment was echoed by staff across all of the facilities we visited.
Sub-assessment finding, clinical staffing: Siloed resource management (e.g., limited coordination across service lines on FTE requests), poor data management, and limited guidance on staffing methodology result in staffing practices that are seldom evidence-based, outside of a few best practice areas (such as nursing). This prevents VHA from knowing whether staffing allocations are appropriate. Furthermore lengthy hiring
7 Facility interview
Assessment F (Workflow – Clinical)
The views, opinions, and/or findings contained in this report are those of the assessment team and should not be construed as an official government position, policy, or decision.
vii
timelines and inconsistent alignment of staff to patient care needs have downstream implications.
Sub-assessment finding, access: Best practices exist at disparate facilities; however, their lack of systemic adoption, combined with an inaccurate understanding of patient demand and available capacity, and inconsistent admission and bed assignment practices, hinder inpatient access.
Sub-assessment finding, length-of-stay and care transitions: National efforts to improve length-of-stay have been hampered by challenges meeting discharge needs of patients requiring specialized post-acute care (e.g., homeless, psychiatric diagnoses), inefficiencies in care delivery practices (e.g., limited availability of weekend consults), and inconsistent approaches to discharge planning often delay care transitions and discharge beyond private sector benchmarks.
Sub-assessment finding, patient experience: Best practice innovations are evident at the national and local levels, but challenges with patient satisfaction data transparency and national implementation support limit system-wide adoption.
Sub-assessment finding, documentation and coding: Limited understanding by providers and coders of the link between coding and resource allocation, coupled with limited performance management, likely contribute to sub-optimal documentation practices yielding lost revenues and misaligned resources. Despite these challenges, coding performance is an area of relative strength and comparable with industry standards.
Cross-cutting recommendations: Across sub-assessments, our recommendations also fall under three main themes:
Improve clinical management through establishing clear operational metrics, and streamlining data collection focused on clinical priorities, monitoring, and performance management. Appropriately defining standards for high performance and having accurate information on how departments and facilities measure against defined targets is the foundation of managing operations. Site visits, data analysis, and comparison against best and standard practices suggest that VHA lacks such visibility into clinical operations, significantly reducing its ability to address challenges and innovate (see Section 3.1). We believe that improving transparency is critical to ensuring effective, timely, and efficient delivery of care to Veterans, across many of our sub-assessment areas. In part, transparency could be improved through enhanced data management, meaning both better data integrity and sharper focus on a targeted set of key metrics needed to assess performance. Equally important, VHA should ensure that facilities have clear operational guidelines on how to set and track appropriate performance goals (e.g., by providing comprehensive staffing methodologies for service lines with no national guidance).
Realign resourcing (for example, staff, facilities) to allow VHA to serve patients at the appropriate level of care (such as, increase Veteran access to sub-acute and post-acute care to reduce clinically inappropriate admissions and prolongation of acute inpatient stays). We observed many instances in which VHA resources were not appropriately matched to patient demand. As described in Section 3.2, there is a disconnect between resources and demand in delayed hiring of staff needed to support patient care, mis-

Assessment F (Workflow – Clinical)
The views, opinions, and/or findings contained in this report are those of the assessment team and should not be construed as an official government position, policy, or decision.
viii
allocation of staff to tours (i.e., shifts), and limited outpatient and post-acute care options needed to ensure treatment at the appropriate level of care. In order to provide high quality care that promotes the health and well-being of Veterans in a cost efficient manner, VHA should ensure that resourcing allows the system to serve patients at the appropriate level of care. Broadly, we see three categories of changes that could help effect this recommendation: improve hiring, allocate staff to match patient demand (e.g., align that staffing on weekend, holiday, and evening hours is sufficient to meet patient need), and increase access to outpatient and post-acute care options.
Scale existing best practices and support further innovation at the local and national levels. A consistent theme during our site visits and interviews was that the opportunity to build off of existing strengths within the system was encumbered by limited sharing of best practices across VAMCs (see Section 3.3). In instances where best practices have been developed nationally, challenges appear to exist due to unclear guidance on implementation, occasional flaws in the design of programs, and lack of VAMC adoption. In instances where best practices have been developed locally, scaling seems to be inhibited by limited infrastructure for information-sharing and lack of resources. To address both sets of challenges and fully leverage and build off of institutional strengths, we suggest improving practices through a combination of targeted national guidance (e.g., streamline Veteran-centered care initiatives and mandates) and nationally-supported local best practice-sharing and innovation (e.g., build infrastructure to promote cross-facility sharing of patient flow best practices).
Our cross-cutting recommendations are supported by individual recommendations in each sub-assessment. Furthermore individual recommendations have been cross mapped to prior assessments’ findings and recommendations in the appendices for each sub-assessment, highlighting the need for well-coordinated and comprehensive action. Understanding that several of recommendations will require national coordination -- while others could be implemented in the near-term at the facility level, we have provided additional tactical steps, titled near-term actions, for associated recommendations at the sub-assessment level and encourage facilities to review these and consider action quickly at the local level where appropriate.
Additionally, we believe there are several preconditions to successfully implementing our recommendations. These preconditions, described below, represent fundamental shifts in VHA operations and management, however we believe that they are necessary in order to fully and sustainably transform clinical workflows.
Clearly define the range of services VHA is responsible for providing, as well as its target Veteran recipients, define the degree to which VA will fund and provide inpatient care that does not meet clinical appropriateness criteria (for example, for homeless or difficult to place patients), and ensure sufficient resourcing to provide this care, whether through VHA facilities or contracts with external organizations.
Substantially streamline congressional mandates and VHA directives including reporting requests, required programs, and earmarked funding, in order to sharpen VHA’s focus and allow VAMCs the flexibility they require to address local care needs.

Assessment F (Workflow – Clinical)
The views, opinions, and/or findings contained in this report are those of the assessment team and should not be construed as an official government position, policy, or decision.
ix
Understand resource implications of new and existing congressional mandates and VACO VHACO directives that are judged necessary to ensure adequate resources are available without negatively impacting other programs and services.
Increase transparency and accountability for performance against a limited set of the most important metrics.
In summary, our assessment took an end-to-end view of inpatient clinical operations across five key sub-assessment areas and all high- and medium-complexity VAMCs. We acknowledge strengths and provide suggestions for addressing challenges in the provision of inpatient care across VHA. Implementing solutions to long-standing challenges will require collaboration among Congress and the Executive Branch, VA leadership (VACO, VHACO, VISN, and VAMC) and staff, as well as the unions, Veterans and external stakeholders. We see this assessment as an opportunity for improvement, to be achieved by all stakeholders through a combination of local, regional, and national action. Addressing these challenges will require sustained commitment as a part of an integrated transformation effort for the system as a whole.
Assessment F (Workflow – Clinical)
The views, opinions, and/or findings contained in this report are those of the assessment team and should not be construed as an official government position, policy, or decision.
x
This page intentionally left blank.

Assessment F (Workflow – Clinical)
The views, opinions, and/or findings contained in this report are those of the assessment team and should not be construed as an official government position, policy, or decision.
xi
Table of Contents
1 Introduction .................................................................................................................... 1
1.1 Purpose ............................................................................................................................ 1
1.2 Scope ................................................................................................................................ 1
1.3 Sub-Assessments ............................................................................................................. 1
Clinical Staffing ..................................................................................................... 3
Access ................................................................................................................... 3
Effective Length-of-Stay (LOS) Management and Care Transitions .................... 3
Positive Patient Experience ................................................................................. 4
Documentation and Coding ................................................................................. 4
Legislation ............................................................................................................ 4
2 Methodology ................................................................................................................... 7
2.1 VAMC Site Selection ......................................................................................................... 7
2.2 Data Sources and Analysis ............................................................................................... 7
2.3 Benchmarking ................................................................................................................ 10
3 Cross-Cutting Findings .................................................................................................... 11
3.1 Ineffective Data Collection and Management Drives a Lack of Transparency on Many Key Aspects of Clinical Operations, Hindering VHA’s Ability to Effectively Manage Inpatient Care ................................................................................................................ 11
3.2 VHA Resources (e.g., staff, beds) do not Always Match Veterans’ Care Needs ............ 12
3.3 While Best Practices Exist in Selected Pockets, Communication and Support for Implementation at Scale Appear to be a Challenge...................................................... 14
4 Cross-Cutting Recommendations and Implementation Considerations ........................... 17
4.1 Cross-Cutting Recommendations .................................................................................. 17
Improve Clinical Management Through Clear Operational Metrics, Streamlined Data Collection, Monitoring, and Performance Management .......................... 17
Ensure Resourcing (e.g., staff, facilities) Allows VHA to Serve Patients at the Appropriate Level of Care .................................................................................. 18
Scale Existing Best Practices and Support Further Innovation at the Local and National Levels ................................................................................................... 19
4.2 Implementation Considerations .................................................................................... 20
Preconditions for Implementation .................................................................... 20
Immediate Actions for Consideration ................................................................ 22
5 Clinical Staffing .............................................................................................................. 25
5.1 Summary ........................................................................................................................ 27
Assessment Approach ........................................................................................ 27
Summary of Findings.......................................................................................... 29
Summary of Recommendations ........................................................................ 29
Past Findings and Recommendations ................................................................ 30

Assessment F (Workflow – Clinical)
The views, opinions, and/or findings contained in this report are those of the assessment team and should not be construed as an official government position, policy, or decision.
xii
5.2 Findings .......................................................................................................................... 30
VHA Does not Have the Tools or Data to Set or Monitor Staffing Levels Appropriately ..................................................................................................... 30
5.2.1.1 The Nursing Service has Developed a Comprehensive, Evidence-Based Staffing Methodology, Though Other Occupations Lack Clear Guidance on Assessing Staffing Need ............................................................................ 31
5.2.1.2 Some Facilities Manage Data Well Locally; However, VHA as a Whole Does not Consistently Capture and Track Data Needed to Assess the Appropriateness of Staffing ...................................................................... 37
5.2.1.3 Resource Management is Siloed by Service Line, Resulting in Inconsistent Decision-making That Does not Always Match Needs ............................. 40
5.2.1.4 Local Resource Management Decision-making Does not Always Reflect National Service Line Staffing Guidance ................................................... 42
Hiring Timeline Significantly Exceeds Private Sector Benchmarks, Affecting Ability to Fill Vacancies ...................................................................................... 45
5.2.2.1 Hiring Requirements (e.g., credentialing, boarding) are Complex and Time-Consuming ....................................................................................... 48
5.2.2.2 Local Hiring Processing is Reported to be Inefficient ............................... 49
5.2.2.3 Attracting Talented Clinical Staff can be a Challenge Due to Low Pay Compared With Private Sector in Many Geographies .............................. 51
Allocation of Staff Does not Consistently Match Patient Care Need ................ 53
5.2.3.1 Hospital Operating Models are Skewed Toward Clinic Hours .................. 53
5.2.3.2 Access to Flex Resources is Limited, Inhibiting Ability to Meet Peaks in Demand or Manage Short-Term Understaffing ........................................ 56
5.3 Recommendations ......................................................................................................... 62
Increase Transparency of Staffing by Providing Evidence-Based Staffing Methodologies for all Clinical Staff and Improving Data Management ............ 62
5.3.1.1 Provide and Support Scalable, Evidence-Based Staffing Methodologies and Interdisciplinary Resource Management Processes .......................... 63
5.3.1.2 Improve Data Management ...................................................................... 65
Increase Timeliness of Hiring to Patient Care Teams ........................................ 66
5.3.2.1 Review and Streamline Hiring Requirements ........................................... 67
5.3.2.2 Increase HR Service Level Expectations Needed to Facilitate Streamlined Requirements ............................................................................................ 67
5.3.2.3 Communicate an Optimal Hiring Process to VAMCs, Clarifying Their Responsibilities and Encouraging Them to Complete Activities in Parallel................................................................................................................... 68
5.3.2.4 Expand Ability to Increase Pay to Match Market ..................................... 69
Allocate Staff to Match Patient Care Needs ...................................................... 70
5.3.3.1 Ensure That Staffing on WHEN Hours is Sufficient to Meet Patient Need 70
5.3.3.2 Make Contracting More Flexible and Efficient ......................................... 71
5.3.3.3 Increase Flexibility of Float Position Structure and Compensation .......... 72
Potential Opportunity ........................................................................................ 72
Assessment F (Workflow – Clinical)
The views, opinions, and/or findings contained in this report are those of the assessment team and should not be construed as an official government position, policy, or decision.
xiii
6 Access .................................................................................................................. 75
6.1 Summary ........................................................................................................................ 76
Assessment Approach ........................................................................................ 76
Summary of Findings.......................................................................................... 78
Summary of Recommendations ........................................................................ 80
Past Findings and Recommendations ................................................................ 80
6.2 Findings .......................................................................................................................... 81
Data Gaps Limit VHA’s Understanding of Patient Demand Patterns and Available VAMC Capacity (e.g., bed and staffing) ............................................. 81
6.2.1.1 Inaccurate View of Bed Capacity Across Multiple Tools ........................... 82
6.2.1.2 Incomplete View of Patient Demand, Including Unmet Patient Care Needs, Limits VHA’s Ability to Understand Demand Relative to Current Capacity ..................................................................................................... 84
Hospital Visits and Admissions (e.g., from the ED and surgical suite) That are not Clinically Appropriate Contribute to ED Bottlenecks and Limit Bed Availability .......................................................................................................... 86
6.2.2.1 Demographic Characteristics of Veterans ................................................ 90
6.2.2.2 Limited Access to Immediate (e.g., same day or same week) Primary and Urgent Care Clinic Appointments Contributes to ED Demand ................. 90
6.2.2.3 Insufficient Access to Sub-acute Facilities (e.g., short-term rehab, detox clinics) for Patients who Should not be Discharged Home Following an ED visit or Surgical Procedure, but do not Require Admission to an Inpatient Bed ............................................................................................................ 91
6.2.2.4 Minimal Physician Acceptance of and Accountability for Utilization Management Admission Standards (e.g., the evaluation of the appropriateness of health care services according to evidence based criteria) ...................................................................................................... 92
6.2.2.5 Lack of Integration Across Tools ............................................................... 93
Best Practices Related to Workflow and Performance Management Exist at Some Facilities, but Have not Been Scaled Across the System ......................... 93
6.2.3.1 Inconsistent Adoption of Proven Best Practices to Manage Patient Flow Across Facilities ......................................................................................... 94
6.2.3.2 Limited Cross-facility Communication and Sharing of Best Practices .... 102
6.3 Recommendations ....................................................................................................... 102
Develop an Accurate End-to-end Picture of Patient Demand and VAMC Capacity ............................................................................................................ 103
6.3.1.1 Simplify the Process and Required Approvals by Which Beds are Classified as Operational or Unavailable ................................................................ 103
6.3.1.2 Develop a Prioritized Set of Standardized Metrics to Understand Current Demand at the VAMC, VISN, and VHACO Levels and Implement an Automated Process to Collect and Aggregate this Data Across the System................................................................................................................. 104
Assessment F (Workflow – Clinical)
The views, opinions, and/or findings contained in this report are those of the assessment team and should not be construed as an official government position, policy, or decision.
xiv
Decrease the Number of Clinically Inappropriate Admissions Due to Limited Access to Sub-acute Care ................................................................................. 106
6.3.2.1 Ensure Appropriate Access to Near-team (e.g., same day, same week) Primary and Urgent Care ........................................................................ 106
6.3.2.2 Facilitate Access to Sub-Acute Resources for Veterans who are not Appropriate to go Home Without Support Following a Procedure or ED Visit, but do not Require Acute Hospital Care ........................................ 107
6.3.2.3 Staff Case Managers and Social Workers Consistently Across VAMC EDs................................................................................................................. 109
6.3.2.4 Build Provider Awareness Around the Importance and Nuances of UM Admission Criteria and Then Hold Physicians to Admissions Standards, Once Appropriate Sub-acute Resources are in Place ............................. 110
6.3.2.5 Educate Veterans and Their Families on the Resources Available at the VA Health Care System as well as When it is Appropriate to use Different Settings of Care ....................................................................................... 111
Expand use of Evidence-based Processes for Managing Patient Flow, Including Clear Role Assignments and Individual Performance Management ............... 111
6.3.3.1 Expedite the Initiation of Clinical Protocols in Triage ............................. 112
6.3.3.2 Segment ED Diagnostics and Care Through Fast-track Processes to Treat Non-Urgent Patients in a Dedicated Area by Dedicated Staff ................ 112
6.3.3.3 Standardize the Inpatient Flow Process (e.g., admission through bed placement) Including Clear Role Assignments and Individual Accountability for Patient Flow .............................................................. 113
6.3.3.4 Build the Infrastructure at the VHACO Level to Promote Cross-facility Sharing of Patient Flow Best Practices ................................................... 114
Potential Opportunity ...................................................................................... 115
7 Effective Length-of-Stay Management and Care Transitions .......................................... 117
7.1 Summary ...................................................................................................................... 117
Assessment Approach ...................................................................................... 117
Summary of Findings........................................................................................ 119
Summary of Recommendations ...................................................................... 121
Past Findings and Recommendations .............................................................. 121
7.2 Findings ........................................................................................................................ 121
Implementation of National LOS Programs and Initiatives has Failed to Achieve Organization-wide Improvements Despite Local Pockets of Best Practice Adoption .......................................................................................................... 122
7.2.1.1 Lack of Availability of LOS Performance Metrics at the Front-Line and Limited Performance Management Inhibit the Transparency and Emphasis Necessary to Drive Improvements ......................................... 123
7.2.1.2 Limited Organization-wide Engagement in the National Utilization Management (UM) Program Reduces the Program’s Potential Impact 125

Assessment F (Workflow – Clinical)
The views, opinions, and/or findings contained in this report are those of the assessment team and should not be construed as an official government position, policy, or decision.
xv
7.2.1.3 Variable Participation in National LOS Management Initiatives and Inconsistent Adoption of Best Practices Drive Variation In Recent LOS Improvements ......................................................................................... 127
Existing Post-acute Care Options (e.g., rehabilitation/skilled nursing facilities) do not Always Match Veteran Needs, Delaying Discharge ............................. 130
7.2.2.1 Veterans Requiring Placement Within Post-Acute Care Facilities Experience Significant Discharge Delays................................................. 134
7.2.2.2 Limited Social Resources (e.g., transitional housing/homeless programs) for Veterans Awaiting Discharge Prolongs LOS ...................................... 135
Typical VAMC Operating Models do not Promote Efficient Inpatient Care, Leading to Prolonged LOS ................................................................................ 137
7.2.3.1 Reduced Access to Consultative Services (e.g., specialist/allied health consults) Over the Weekend Heightens Discharge Challenges .............. 137
7.2.3.2 Inconsistent Implementation of Standard Protocols and Pathways Drives Variability in Care Patterns and may Increase Patient LOS .................... 140
Use of Discharge Planning Best Practices is Inconsistent, Decreasing Effectiveness and Coordination ....................................................................... 143
7.2.4.1 Suboptimal and Inconsistent Use of Case Managers Results in Reallocation of Critical Discharge Planning Responsibilities to Other Staff................................................................................................................. 143
7.2.4.2 Variable Implementation of key Processes Designed to Expedite Discharge Results in Avoidable Discharge Delays ................................... 145
7.2.4.3 Limited Adoption of Discharge Planning Tools may Inhibit Optimal Application of Case Management Efforts ............................................... 149
7.3 Recommendations ....................................................................................................... 151
Mitigate Discharge Delays Related to Post-acute Placement (e.g., increase availability of post-acute care options) ........................................................... 152
7.3.1.1 Increase Availability of Post-acute Care Options, Particularly for Special Needs Veteran Populations .................................................................... 152
7.3.1.2 Increase Resources for Patient Transportation and Provide Front-line Staff With Authority to Approve Transport When it Poses a Barrier to Timely Discharge ..................................................................................... 154
Build on Existing Best Practices, Both Internal and External to VHA, to Increase Local Adoption of Evidence-based Inpatient Care and Discharge Planning Practices ........................................................................................................... 155
7.3.2.1 Track Key Performance Measures Related to LOS Management Processes to Increase Transparency, Accountability, and Performance Improvement................................................................................................................. 156
7.3.2.2 Develop Evidence-based Care Pathways for Common Inpatient Clinical Processes, and Incorporate into EHR Tools and Clinical Workflows ...... 157
7.3.2.3 Promote Sharing and Implementation of Discharge Planning Best Practices Across VAMCs .......................................................................... 159
7.3.2.4 Increase Off-hours Coverage of Clinical Services Including Specialist Consults, Allied Health Evaluations, and Imaging/diagnostics ............... 160
Assessment F (Workflow – Clinical)
The views, opinions, and/or findings contained in this report are those of the assessment team and should not be construed as an official government position, policy, or decision.
xvi
Potential Opportunity ...................................................................................... 161
8 Patient Experience ........................................................................................................ 163
8.1 Summary ...................................................................................................................... 163
Assessment Approach ...................................................................................... 163
Summary of Findings........................................................................................ 169
Summary of Recommendations ...................................................................... 169
Past Findings and Recommendations .............................................................. 170
8.2 Findings ........................................................................................................................ 171
National and Facility-level Focus on the Prioritization and Provision of Veteran-centered Care has Driven Innovations in Best Practices ................................. 172
8.2.1.1 Program Offices, at the National Level, Support Patient-centered Clinical Innovation, Outcomes-based Research, and Education and Implementation Support ........................................................................ 173
8.2.1.2 Veteran-focused Initiatives, Developed Locally at Individual VAMCs, Exemplify Industry Best Practices at the Bedside ................................... 178
Adoption of Facility-level Best Practices and Engagement of Program Office Support Services are Varied Across VAMCs .................................................... 179
8.2.2.1 Central Office Reach is Limited by the Level of Facility Leadership Engagement ............................................................................................ 180
8.2.2.2 Structure to Codify and Share Facility-driven Initiatives Across the System is Limited ................................................................................................. 181
8.2.2.3 Implementation of Point-of-care Feedback Tools (e.g., GetWell Network, Truth Point) is Varied Across the System ................................................ 182
Challenges With Respect to Timeliness and Specificity in the SHEP Survey Results Limit VAMCs’ Ability to Drive Performance Improvement ................. 183
8.2.3.1 SHEP Results are Often Delayed by Three to Six Months and Reflect Aggregate VAMC Patient Satisfaction Scores (e.g., data is not segmented by individual department or unit) ........................................................... 184
8.2.3.2 Patient Satisfaction Metrics are not Consistently Included in Manager and Team Performance Reviews ................................................................... 184
8.3 Recommendations ....................................................................................................... 184
Collect More Timely and Relevant Patient Experience Data to Drive Transparency and Performance Improvement at the Facility, Department, and Individual Levels ............................................................................................... 185
8.3.1.1 Ensure VHA’s Patient Satisfaction Tool(s) Delivers Survey Results in a Timely (e.g., real-time or near real-time) and Actionable Format (e.g., segmented at VISN, VAMC, department, and unit Levels) ..................... 186
8.3.1.2 Include Patient Experience Outcome Metrics (e.g., Point-of-Care Feedback, SHEP feedback, VAMC peer and Leadership Observations, etc.) in Leadership and Department Performance Reviews ........................... 187
Strengthen National and Facility-level Support for Patient-centered Care Programs to Increase Adoption ....................................................................... 187

Assessment F (Workflow – Clinical)
The views, opinions, and/or findings contained in this report are those of the assessment team and should not be construed as an official government position, policy, or decision.
xvii
8.3.2.1 Coordinate and Consolidate Veteran-Centered Initiatives and Directives Across Program Offices ........................................................................... 188
8.3.2.2 Improve VAMC Leadership Turnover to Ensure a More Consistent Patient Experience Strategy at the Facility-level and Better Utilization of Available Resources ................................................................................................ 189
8.3.2.3 Encourage Innovation at The Facility Level by Building the Program Office Infrastructure to Support the Evaluation, Codification, and Implementation of Facility-Driven Patient Experience Initiatives .......... 189
Potential Opportunity ...................................................................................... 190
9 Accurate Documentation and Subsequent Coding of Inpatient Services ......................... 193
9.1 Summary ...................................................................................................................... 194
Assessment Approach ...................................................................................... 194
Summary of Findings........................................................................................ 195
Summary of Recommendations ...................................................................... 197
Past Findings and Recommendations .............................................................. 198
9.2 Findings ........................................................................................................................ 199
Inconsistent Emphasis on Clinical Documentation Impedes Consistent Capture of Complete Clinical Information, Hindering Appropriate Resource Allocation and Revenue Collection ................................................................................... 199
9.2.1.1 Limited Direct Integration of Health Information Management (HIM) and Finance Functions at the VAMC Level Weakens Leadership Prioritization of Documentation ................................................................................... 200
9.2.1.2 Inconsistent Provider Education and Training Practices are not Aligned With VHA’s View of the High Importance of Clinical Documentation .... 202
9.2.1.3 Lack of Performance Management Contributes to Low Priority on Documentation ....................................................................................... 205
Adoption of Documentation Best Practices is Variable, Resulting in Inconsistent Quality of Clinical Documentation System-wide ............................................. 208
9.2.2.1 Inconsistent Adoption of Provider Documentation Best Practices (e.g., template use, appropriate copy-paste) Challenges Effectiveness ......... 210
9.2.2.2 Ineffective Provider Query Practices and Limited Provider Responsiveness at Many Facilities Contribute to Persistence of Suboptimal Documentation ....................................................................................... 213
9.2.2.3 Incomplete Uptake of Clinical Documentation Improvement (CDI) Programs and Variable Best Practice Implementation has Limited Potential Impact from These Programs .................................................. 216
System-wide Focus on Coding Standards has Resulted in Coding Performance Typically Meeting or Exceeding Private Sector Benchmarks ........................... 218
9.2.3.1 Visibility Into Performance Through Establishment of Clear Coding Targets and Performance Tracking Supports Transparency and Improvement .......................................................................................... 219
Assessment F (Workflow – Clinical)
The views, opinions, and/or findings contained in this report are those of the assessment team and should not be construed as an official government position, policy, or decision.
xviii
9.2.3.2 Regular Application of Coder Auditing by Internal Coding Experts at the Facility-level Yields Feedback Loop to Identify Inaccuracies and Improve Performance ........................................................................................... 219
9.2.3.3 Use of Coding Software That Incorporates Best Practice Features (e.g., error checking, decision support) Facilitates Coding Accuracy .............. 220
9.3 Recommendations ....................................................................................................... 222
Increase Local Prioritization of Clinical Documentation Through Acceleration of National CDI Program and Targeted Provider Education and Training, Supported by Performance Management at the Facility and Provider Level . 222
9.3.1.1 Incorporate Documentation Metrics Into Regular Performance Reviews for Both Providers and Facilities ............................................................. 223
9.3.1.2 Reinforce CDI Program by Providing Targeted Guidance on National Documentation Priority Areas and by Creating a National Information-sharing Network for CDI Best Practice Sharing ....................................... 224
9.3.1.3 Develop and Deploy Provider Educational and Training Programs to Address Unique VHA Documentation Needs and Reemphasize the Importance of Documentation for Veterans and the Organization ....... 225
Strengthen Provider Documentation Standards (e.g., management of clinical templates, EHR review process) to Promote Optimal Capture of Patient Information and Improve Resulting Resource Management .......................... 227
9.3.2.1 Eliminate Duplicative Clinical Templates and Standardize Requirements for New Template Creation .................................................................... 227
9.3.2.2 Strengthen EHR Reviews to Ensure Appropriate use of Copy-paste, Including Implementation of CPRS Tool to Automate the Process ........ 228
9.3.2.3 Implement Standardized Processes for Following up on Outstanding Provider Queries and Improve Provider Accountability for Query Responsiveness ....................................................................................... 229
Potential Opportunity ...................................................................................... 230
Appendix A Detailed Methodology ............................................................................... A-1
A.1 VAMC Site Selection ...................................................................................................... A-1
A.1.1 VAMC Site Selection Variables .......................................................................... A-2
A.1.2 VAMC Sample Representativeness ................................................................... A-2
A.2 Summary of Best Practice Case Studies From High Performing Facilities .................. A-10
Appendix B Additional Detail on Clinical Staffing .......................................................... B-1
B.1 Professional Association Definitions of “Clinical Staff” ................................................ B-1
B.2 Differences in Staffing Practices by Clinical Occupation .............................................. B-1
B.3 Mapping to Organization, Workflow Processes, and Tools .......................................... B-2
B.4 Past Findings and Recommendations ........................................................................... B-4
B.5 Downshifting by Role, Based on Data Call .................................................................... B-6
B.6 Best Practices and Benchmarks .................................................................................... B-8
B.7 Additional Detail on Past Reform Efforts .................................................................... B-12
Assessment F (Workflow – Clinical)
The views, opinions, and/or findings contained in this report are those of the assessment team and should not be construed as an official government position, policy, or decision.
xix
B.8 Description of clinical Staffing Site Visit Assessment Workshop Improvement Idea Generation Process .................................................................................................... B-13
Appendix C Additional Detail on Access to Care ........................................................... C-1
C.1 Best Practices and Benchmarks .................................................................................... C-1
C.2 Assessment Mapping to Choice Act Legislation ........................................................... C-2
C.3 Past Findings and Recommendations Detail ................................................................ C-5
C.4 Description of ED Throughput Site Visit Assessment Workshop Improvement Idea Generation Process ...................................................................................................... C-6
Appendix D Additional Detail on Effective Length-of-Stay Management and Care Transitions ................................................................................................................. D-1
D.1 Best Practices and Benchmarks .................................................................................... D-1
D.2 Past Findings and Recommendations Detail ................................................................ D-3
D.3 Assessment Mapping to Choice Act Legislation ........................................................... D-4
D.4 Description of Discharge Planning Site Visit Assessment Workshop Improvement Idea Generation Process ...................................................................................................... D-6
D.5 Additional Supporting Figures ...................................................................................... D-7
Appendix E Additional Detail on Patient Experience ..................................................... E-1
E.1 Comparison of VHA and HCAHPS Questions and Scoring and Detail of VHA’s Methodology for Calculating Patient Satisfaction Scores ............................................ E-1
E.2 Best Practices and Benchmarks .................................................................................... E-5
E.3 Assessment Mapping to Choice Act Legislation ........................................................... E-6
E.4 Past Findings and Recommendations Detail ................................................................ E-8
Appendix F Additional Detail on Accurate Documentation and Subsequent Coding ...... F-1
F.1 Best Practices and Benchmarks .................................................................................... F-1
F.2 Past Findings and Recommendations Detail ................................................................ F-2
F.3 Assessment Mapping to Choice Act Legislation ........................................................... F-3
F.4 Description of Documentation and Coding Site Visit Assessment Workshop Improvement Idea Generation Process ....................................................................... F-5
F.5 Additional Supporting Figures ...................................................................................... F-6
Appendix G Bibliography .............................................................................................. G-1
Appendix H Acronyms .................................................................................................. H-1

Assessment F (Workflow – Clinical)
The views, opinions, and/or findings contained in this report are those of the assessment team and should not be construed as an official government position, policy, or decision.
xx
List of Figures
Figure 1-1. Relationships and Interdependencies Between Assessment F Sub-assessment Areas ............................................................................................................................. 2
Figure 5-1. Components of Clinical Staffing .................................................................................. 27
Figure 5-2. VHA Hiring Timeline .................................................................................................... 46
Figure 5-3. VHA Vacancy Rates vs. Private Sector Benchmarks ................................................... 47
Figure 5-4. Vacancy Rates Indicate Hiring Challenges .................................................................. 48
Figure 5-5. VHA Compared to National Benchmarks Reveals Disparity ....................................... 52
Figure 5-6. VHA Downshift Rate ................................................................................................... 55
Figure 5-7. Perceived Adequacy of Flexing Practices by Occupation ........................................... 57
Figure 5-8. Challenges Associated With Flexing Cited in Workshops With Nurses, Physicians, AHPs, and Ancillary Staff ............................................................................................................... 58
Figure 5-9. VHA Overtime Usage Comparison .............................................................................. 59
Figure 5-10. VAMC Overtime Use Comparison ............................................................................ 60
Figure 6-1. VAMC Bed Capacity .................................................................................................... 82
Figure 6-2. ED Acuity Analysis ....................................................................................................... 88
Figure 6-3. Inpatient Admissions for Patients With Limited Access to Sub-Acute Care Hinder Access and Patient Flow ............................................................................................................... 89
Figure 6-4. VHA Lags Market Averages ......................................................................................... 94
Figure 6-5. VAMC Case Study: ED Patient Flow ............................................................................ 96
Figure 6-6. Ineffective Coordination Congests Flow and Limits Access ..................................... 101
Figure 7-1. VHA LOS Trends Over Time ...................................................................................... 123
Figure 7-2. Overview of Discharge Locations.............................................................................. 131
Figure 7-3. LOS Differences, by Discharge Disposition ............................................................... 132
Figure 7-4. Breakdown of Reasons for Continued Stay Reviews Not Meeting InterQual Criteria ......................................................................................................................... 133
Figure 7-5. Discharges by Day of Week ...................................................................................... 139
Figure 7-6. LOS by Admission Day of Week for DRGs Requiring Consultations ......................... 140
Figure 7-7. VAMC Case Study: Interdisciplinary Discharge Meetings ........................................ 146
Figure 7-8. Roles Included in Interdisciplinary Discharge Meetings ........................................... 147
Figure 7-9. VHA Discharges by Noon .......................................................................................... 148

Assessment F (Workflow – Clinical)
The views, opinions, and/or findings contained in this report are those of the assessment team and should not be construed as an official government position, policy, or decision.
xxi
Figure 7-10. Primary Triggers to Prioritize Patients for Intensive Case Management Within VHA ......................................................................................................................... 151
Figure 8-1. Patient Satisfaction Scores (SHEP vs. HCAHPS) ........................................................ 167
Figure 8-2. Patient Satisfaction Variability (HCAHPS) ................................................................. 168
Figure 8-3. Veteran-Centered Care Initiatives ............................................................................ 173
Figure 8-4. Program Office Focus on Patient-Centered Care ..................................................... 176
Figure 8-5. Supplementary Patient Satisfaction Tools ................................................................ 183
Figure 9-1. Inpatient Documentation and Coding Process ......................................................... 196
Figure 9-2. Summary of VHA Provider Education Offerings ....................................................... 204
Figure 9-3. Role of Copy-Paste and Template Management in Clinical Documentation ........... 209
Figure 9-4. Comparison of Provider Query Responsiveness: VHA Versus Private Hospitals ..... 214
Figure 9-5. CDI Specialist Perspective on Most Effective Provider Query Technique ................ 215
Figure A-1. Distribution of VAMCs Against Key Characteristics .................................................. A-5
Figure B-1. Previous Reports’ Findings ........................................................................................ B-5
Figure B-2. Previous Reports’ Recommendations ....................................................................... B-6
Table C-1. Access to Care – Best Practices and Benchmarks ....................................................... C-1
Figure C-1. Sample Access to Care Issues Identified in Past Assessments .................................. C-5
Figure C-2. Sample Access to Care Recommendations From Past Assessments......................... C-6
Figure D-1. Sample LOS Management Issues Identified in Past Assessments ............................ D-3
Figure D-2. Sample LOS Management Recommendations From Past Assessments ................... D-4
Figure D-3. Illustrative Discharge Planning Checklist................................................................... D-7
Figure E-1. Sample Patient Experience Issues Identified in Past Assessments ........................... E-9
Figure E-2. Sample Access to Care Recommendations From Past Assessments ....................... E-10
Figure F-1. Sample Documentation and Coding Issues Identified in Past Assessments ............. F-2
Figure F-2. Sample Documentation and Coding Recommendations from Past Assessments .... F-3
Figure F-3. Illustrative Template Review Checklist ...................................................................... F-6
Figure F-4. Illustrative Provider Query Follow-Up Process .......................................................... F-7

Assessment F (Workflow – Clinical)
The views, opinions, and/or findings contained in this report are those of the assessment team and should not be construed as an official government position, policy, or decision.
xxii
List of Tables
Table 1-1. Elements of Veterans Access, Choice and Accountability Act ....................................... 5
Table 4-1. Potential Immediate Actions for Preconditions of Implementation ........................... 22
Table 5-1. Staffing Guidance Issued by National Leadership for key Clinical Service Lines ......... 32
Table 5-2. VAMC Case Study: Nurse Staffing Methodology ......................................................... 36
Table 5-3. VAMC Case Study: Local Data Management ............................................................... 39
Table 5-4. VAMC Case Study: Interdisciplinary Staffing ............................................................... 42
Table 6-1. VAMC Case Study: Data Management ........................................................................ 84
Table 6-2. VAMC Case Study: Fast-Track Options ........................................................................ 98
Table 7-1. VAMC Case Study: LOS Performance Management .................................................. 124
Table 7-2. Overview of NUMI Reviews and Recent Performance .............................................. 127
Table 7-3. VAMC Case Study: National Collaborative Impact .................................................... 129
Table 7-4. External Case Study: Inpatient Clinical Pathways ...................................................... 141
Table 7-5. VAMC Case Study: Inpatient Case Managers ............................................................ 145
Table 9-1. VAMC Case Study: Provider Documentation Training ............................................... 204
Table 9-2. External Case Study: Physician Documentation Performance Management............ 206
Table 9-3. VAMC Case Study: CDI Program Implementation ..................................................... 217
Table A-1. Fisher’s Exact Test Results .......................................................................................... A-3
Table B-3. Change in Staffing ....................................................................................................... B-6
Table B-4. Clinical Staffing – Best Practices and Benchmarks ..................................................... B-8
Table C-2. Mapping to Organization, Workflow Processes, and Tools Domains Specified by the Statute .......................................................................................................................... C-2
Table D-1. LOS Management – Best Practices and Benchmarks ................................................. D-1
Table D-2. Mapping of Drivers to Organization, Workflow Processes, and Tools Domains Specified by The Statute .............................................................................................................. D-4
Table E-1. SHEP and HCAHPs Questions and Methodology Comparison .................................... E-1
Table E-2. Patient Experience – Best Practices and Benchmarks ................................................ E-5
Table E-3. Mapping to Organization, Workflow Processes, and Tools Domains Specified by the Statute .......................................................................................................................... E-6
Table F-1. Documentation and Coding – Best Practices and Benchmarks .................................. F-1
Table F-2. Mapping of Drivers to Organization, Workflow Processes, and Tools Domains Specified by the Statute ............................................................................................................... F-3
Assessment F (Workflow – Clinical)
The views, opinions, and/or findings contained in this report are those of the assessment team and should not be construed as an official government position, policy, or decision.
xxiii
List of Best Practice Examples8
5-2 VAMC Case Study: Nurse Staffing Methodology ……………………………………………………………… 37
5-3 VAMC Case Study: Local Data Management ……………………………………………………………………. 41
5-4 VAMC Case Study: Interdisciplinary Staffing ……………………………………………………………………. 44
6-1 VAMC Case Study: VAMC Case Study: Data Management ………………………………………………. 87
6-2 VAMC Case Study: Fast Track Options …………………………………………………………………………….102
7-1 VAMC Case Study: LOS Performance Management ………………………………………………………. 129
7-3 VAMC Case Study: National Collaborative Impact …………………………………………………………. 134
7-4 External Case Study: Inpatient Clinical Pathways …………………………………………………………… 145
7-5 VAMC Case Study: Inpatient Case Managers …………………………………………………………………. 149
9-1 VAMC Case Study: Provider Documentation Training ……………………………………………………. 213
9-2 External Case Study: Physician Documentation Performance Mgmt. ……………………………. 214
9-3 VAMC Case Study: CDI Program Implementation ………………………………………………………….. 227
8 Please note that this is not intended to be a comprehensive representation of best practices across VHA or the
private sector, but is instead based on those sites that we visited and were identified through interviews and academic literature

Assessment F (Workflow – Clinical)
The views, opinions, and/or findings contained in this report are those of the assessment team and should not be construed as an official government position, policy, or decision.
xxiv
This page intentionally left blank.

Assessment F (Workflow – Clinical)
The views, opinions, and/or findings contained in this report are those of the assessment team and should not be construed as an official government position, policy, or decision.
1
1 Introduction
1.1 Purpose
With the goal of improving access, quality, and effectiveness of health care delivery for Veterans, the Veterans Access, Choice, and Accountability Act of 2014 (“The Choice Act”), Section 201 mandated a forward-looking, independent assessment of current practices and opportunities for improvement within VA facilities. Specifically, Assessment F is tasked with a review of the “organization, workflow processes, and tools used by the Department to support clinical staffing, access to care, effective length-of-stay management and care transitions, positive patient experience, accurate documentation, and subsequent coding of inpatient services” (Section 201, Part F).
1.2 Scope
Pursuant to the language provided in Section 201 of the Choice Act, the scope of our assessment focuses on the organization, workflow processes, and tools (i.e., structural components and approaches) in place within acute care hospitals to facilitate clinical staffing, access, effective length-of-stay management and care transitions, positive patient experience, and accurate documentation and subsequent coding, all within the acute inpatient setting. Comparison of current VHA practices to accepted best practices (drawn from literature and professional associations), as well as standard practices (drawn from public and private sector benchmarks) provided insight into alternative approaches and recommendations. While selected performance outcomes were used to prioritize areas of focus, a complete analysis of clinical, performance, operational, or other outcomes associated with the employed approaches was not in scope for this assessment. We would however, be remiss not to acknowledge that, per Assessment B, VA’s performance against reviewed clinical outcomes was found to be on-par or better than industry averages in many cases.
Assessment F is closely connected to several other assessments within the Choice Act, including, but not limited to, assessments B (capabilities and resources), E (scheduling), G (staffing), H (information technology), I (business processes) and L (leadership). In order to avoid overlap and duplicative analysis, assessments were completed in close coordination. We have indicated key instances where further relevant analysis is included in related assessment reports. Examples of these adjacencies include the VISN-VAMC relationship (Assessment L), surgical scheduling processes (Assessment E), clinical outcomes (Assessment B), and provider productivity (Assessment G).
1.3 Sub-Assessments
The five identified sub-assessment areas (clinical staffing, access to care, effective length-of-stay management and care transitions, positive patient experience, and accurate documentation and coding) for inpatient workflows are closely linked, driving and affecting each other in multiple ways (see Figure 1-1).

Assessment F (Workflow – Clinical)
The views, opinions, and/or findings contained in this report are those of the assessment team and should not be construed as an official government position, policy, or decision.
2
Figure 1-1. Relationships and Interdependencies Between Assessment F Sub-assessment Areas
Documentation and coding captures patient utilization of specific services. This data can be used to identify trends and changes in care needs of the patient population, which drive the allocation of resources (VERA, 2014). These resources include budgetary allocations for staffing. Sufficient staffing in turn affects facilities’ ability to provide access to safe, high-quality care that meets patient needs. Access is also affected by length-of-stay management and care transitions, insofar as delayed lengths-of-stay reduce facilities’ ability to admit new patients. Documentation and coding, staffing, access, and length-of-stay management and care transitions all affect the quality of care provided and patient experience, as well as cost of care (Kleinpell, 2008). The recommendations sections within sub-assessments highlight the potential impact of our recommendations on performance outcomes and costs, as appropriate.
Please note that for the purposes of this report, we have sequenced the individual sub-assessment sections in accordance with the legislation: clinical staffing, access to care, effective length-of-stay management and care transitions, positive patient experience, accurate documentation and coding. Subsections 1.3.1-1.3.5 provide an overview how we approach each one of these sub-assessments, followed by sub-section 1.3.6, which maps Assessment F to the Choice Act legislation.
Assessment F (Workflow – Clinical)
The views, opinions, and/or findings contained in this report are those of the assessment team and should not be construed as an official government position, policy, or decision.
3
Clinical Staffing
Clinical staffing accounts for a large portion of a hospital’s operating budget, and is the foundation for providing safe and effective patient care. Staffing levels drive access, affect patient outcomes, and influence patient and staff satisfaction. In keeping with standard industry approaches to staffing, we have examined four main aspects of staffing: (1) core staffing (i.e., resource management); (2) scheduling; (3) flexing (i.e., changes in staffing to meet variation in demand); and (4) supporting infrastructure. Given that Assessment F refers to “clinical staffing,” we have included roles primarily responsible for direct patient care: physicians, nurse practitioners, physician assistants, nurses, nursing assistants, psychologists, pharmacists, pharmacy technicians, allied health professionals (e.g., physical therapists), therapy assistants and health technicians (see Appendix B for more detail on defining clinical staff). Ancillary support (e.g., environmental services) and administrative roles (e.g., bed management) are examined insofar as they affect staffing of clinical roles. Staffing levels, productivity, and allocation of clinician time are the focus of Assessment G, and are therefore not included in Assessment F.
Access
The ability to receive the necessary level of care in the most appropriate setting is essential to the effectiveness and efficiency of a health care system. In the inpatient setting, “access” refers to the process by which patients, in need of acute hospital care, are appropriately triaged and admitted to an inpatient bed. Patients may be admitted through a series of different channels including: through the Emergency Department (ED), as a direct admission from a physician’s office, as a transfer from another facility, or as a scheduled admission following a procedure (i.e., a surgery that requires hospitalization following the procedure). Annually, approximately 75 percent of all VAMC admissions come through the ED, making ED throughput a major focus of our assessment. In particular we have examined three key processes related to inpatient access to care: (1) ED throughput and care delivery practices; (2) admission workflow from the ED and surgical suites; and (3) bed assignment following admission decision. Several factors contribute to inpatient access including, but not limited to, the availability of beds, staffing and individual provider capacity, scheduling of elective procedures relative to projected demand for beds, and the discharge of patients who no longer require acute care. While the scheduling process for elective outpatient procedures impacts inpatient access to care, it is an adjacency that falls in scope for Assessment E.
Effective Length-of-Stay (LOS) Management and Care Transitions
Length-of-stay (LOS) management and effective care transitions are key to VHA’s ability to optimally provide cost-efficient, patient-centered, high-quality care across its approximately 600,000 annual admissions.9 We have examined current VHA practices related to three key areas shown in the academic literature to impact effective LOS management and care transitions: (1) processes for providing timely and evidence-based care; (2) discharge planning;
9 2014 VHA Support Service Center (VSSC)

Assessment F (Workflow – Clinical)
The views, opinions, and/or findings contained in this report are those of the assessment team and should not be construed as an official government position, policy, or decision.
4
and (3) post-acute placement. Based on the inpatient focus outlined in part F of the Choice Act legislation, our assessment does not cover VHA-operated or partnered post-acute nor non-acute care facilities (e.g., community living centers, domiciliary care).10 It would however, be valuable for VHA to complete a similar assessment on these areas as well in order to fully gauge the impact on LOS and care transitioning.
Positive Patient Experience
Veterans receiving treatment from within the VHA system should benefit from best-in-class integrated care tailored to meet the specific needs of those who have served our country. Drawing on the academic literature on predictors of positive patient experience, we have chosen to focus on several key themes associated with patient experience: (1) engage Veterans and their families in care; (2) promote employee responsiveness and service recovery; (3) personalize patients’ health care to their individual needs; and (4) encourage open communication and shared decision-making. While patient experience is shaped throughout the continuum of care including the outpatient setting and touch points outside of clinical encounters, this section focuses exclusively on patient experience in the inpatient setting.
Documentation and Coding
Proper documentation and coding ensure that VHA is able to appropriately distribute its Congressional budgetary allocation, effectively collect revenues from third-party insurers, accurately track patient demographics, and successfully monitor performance (e.g., by assessing provider productivity) (VERA, 2014). We have examined three key areas that are industry standard for ensuring optimal documentation and coding performance: (1) provider documentation practices; (2) medical coding procedures; and (3) quality review processes. Separate assessments within the Choice Act are devoted to VHA’s information technology tools and strategies as they relate to clinical documentation (Assessment H) and the processes for billing and collection of third-party billable claims (Assessment I); the reports corresponding to these assessments should be consulted for additional details on these topics.
Legislation
In accordance with Part F of the Choice Act legislation, we have covered the organization, workflow processes, and tools used by VHA to support the five identified sub-assessment areas (clinical staffing, access to care, effective length-of-stay management and care transitions, positive patient experience, accurate documentation and coding) in the inpatient setting. Additionally, because organization, workflow processes, and tools are cross-cutting in nature, we have taken a broader view across the sub-assessments, as well. The specific elements of the legislation are discussed in depth in sections five through nine, as detailed in Table 1-1, with additional cross-cutting findings and recommendations detailed in sections three and four.
10 This is consistent with CMS’s definitions of what constitutes an inpatient stay (CMS, 2014)

Assessment F (Workflow – Clinical)
The views, opinions, and/or findings contained in this report are those of the assessment team and should not be construed as an official government position, policy, or decision.
5
Table 1-1. Elements of Veterans Access, Choice and Accountability Act
Veterans Choice Act Section 201: Assessment F
Corresponding Assessment Sections Sub-assessment Topic
Clinical staffing Organization Section 5.2.1.1, 5.2.1.3, 5.2.1.4, 5.2.2.2, 5.2.2.3, 5.2.2.4, 5.2.3.2, 5.3.1.1, 5.3.2.2, 5.3.2.3, 5.3.2.4, 5.3.3.3
Work-flow processes
Section 5.2.1.1, 5.2.1.2, 5.2.1.3, 5.2.1.4, 5.2.2.1, 5.2.2.2, 5.2.2.3, 5.2.3.1, 5.2.3.2, 5.3.1.1, 5.3.2.1, 5.3.2.2, 5.3.2.3, 5.3.2.4, 5.3.3.1, 5.3.3.2, 5.3.3.3
Tools Section 5.2.1.1, 5.2.1.2, 5.2.1.4, 5.3.1.1, 5.3.1.2, 5.3.2.1, 5.3.3.1
Access to care Organization Section 6.2.1.1, 6.2.1.2, 6.2.2.4, 6.2.3.1, 6.2.3.2, 6.3.1.1, 6.3.1.2, 6.3.1.3, 6.3.2.1, 6.3.2.2, 6.3.2.3, 6.3.2.4, 6.3.2.5, 6.3.3.1, 6.3.3.2, 6.3.3.3, 6.3.3.4
Work-flow processes
Section 6.2.1.1, 6.2.1.2, 6.2.2.2, 6.2.2.3, 6.2.2.4, 6.2.3.1, 6.2.1.3.2.3, 6.3.1.1, 6.3.1.3, 6.3.2.1, 6.3.2.2, 6.3.2.5, 6.3.3.1, 6.3.3.3, 6.3.3.4
Tools Section 6.2.1.1, 6.2.1.2, 6.2.2.2, 6.2.2.3, 6.2.2.4, 6.2.3.1, 6.2.3.2, 6.3.1.1, 6.3.1.2, 6.3.2.4, 6.3.3.1, 6.3.3.3, 6.3.3.4
Length of stay management and care transitions
Organization Section 7.2.1.1, 7.2.1.2, 7.2.1.3, 7.2.2.1, 7.2.2.2, 7.2.3.1, 7.2.4.1, 7.3.1.1, 7.3.1.2, 7.3.2.1, 7.3.2.3, 7.3.2.4
Work-flow processes
Section 7.2.1.1, 7.2.1.3, 7.2.2.1, 7.2.2.2, 7.2.3.1, 7.2.3.2, 7.2.4.2, 7.2.4.2, 7.3.1.1, 7.3.1.2, 7.3.2.1, 7.3.2.2, 7.3.2.3, 7.3.2.4
Tools Section 7.2.1.2, 7.2.3.2, 7.2.4.3, 7.3.2.1, 7.3.2.2, 7.3.2.3
Patient experience Organization Section 8.2.1.1, 8.2.1.2, 8.2.2.1, 8.2.2.2, 8.2.2.3, 8.2.3.1, 8.2.3.2, 8.3.1.2, 8.3.2.1, 8.3.2.2, 8.3.2.3
Work-flow processes
Section 8.2.1.2, 8.2.2.1, 8.2.2.2, 8.2.2.3, 8.2.3.1, 8.2.3.2, 8.3.1.1, 8.3.2.1, 8.3.2.3
Tools Section 8.2.1.1, 8.2.1.2, 8.2.2.3, 8.2.3.1, 8.3.1.1, 8.3.1.2, 8.3.2.1, 8.3.2.3

Assessment F (Workflow – Clinical)
The views, opinions, and/or findings contained in this report are those of the assessment team and should not be construed as an official government position, policy, or decision.
6
Veterans Choice Act Section 201: Assessment F
Corresponding Assessment Sections Sub-assessment Topic
Documentation and coding
Organization Section 9.2.1.1, 9.2.1.2, 9.2.1.3, 9.2.2.3, 9.2.3.1, 9.3.1.1, 9.3.1.2, 9.3.1.3, 9.3.2.2, 9.3.2.3
Work-flow processes
Section 9.2.1.2, 9.2.1.3, 9.2.2.1, 9.2.2.2, 9.2.2.3, 9.2.3.2, 9.3.1.1, 9.3.1.3, 9.3.2.2, 9.3.2.3
Tools 9.2.1.3, 9.2.2.1, 9.2.2.2, 9.2.3.1, 9.2.3.3, 9.3.1.1, 9.3.1.2, 9.3.1.3, 9.3.2.1, 9.3.2.2

Assessment F (Workflow – Clinical)
The views, opinions, and/or findings contained in this report are those of the assessment team and should not be construed as an official government position, policy, or decision.
7
2 Methodology A range of quantitative and qualitative tools were used to assess practices at VHA inpatient facilities. System-wide analysis of organizational data (e.g., policies and procedures) and performance data (in sub-assessments where evaluation of performance is included in the Choice Act language, e.g., “effective length-of-stay management”) was done to understand variation within the system and compare against benchmarks. This data analysis was supplemented by visits to 21 inpatient facilities across the nation, a survey distributed to relevant clinical staff roles at all VAMCs, a data call for local policy documents and data at all VAMCs, and interviews with subject matter experts both internal and external to VA. We also looked at previous studies and assessments of VHA’s inpatient clinical workflow. It is, however, important to note that this assessment has several limitations including the fact that we did not have access to survey Veterans or collect their input at scale, we operated under an aggressive time frame, and in many instances, as noted throughout this assessment, there were limitations on data. Additionally, due to the required independence of the Choice Act, Section 201 assessments, findings and recommendations were developed independently. We therefore expect these recommendations would be refined by VHA leadership and the “Commission on Care.”
2.1 VAMC Site Selection
Stratified random sampling was used to select a core set of VAMCs for on-site assessment. This set of VAMCs was representative of the VHA system as a whole across critical facility demographic and performance outcome metrics (see Appendix A for further detail). Given the focus of Assessment F on inpatient medical facilities, we chose to only visit VAMCs providing substantial inpatient medical care (complexity levels 1a, 1b, 1c, and 2), and did not include other types of facilities (e.g., community-based outpatient clinics [CBOCs], complexity level 3 facilities).
Additional information on distribution of VAMCs against specific service lines is shown in Appendix B. As figures in Appendix B indicate, 84 percent of complexity level 1 and 2 facilities have Community Living Centers (CLCs), 48 percent have Domiciliary Residential Rehab Treatment Programs, 2 percent are joint DoD facilities, 4 percent are Polytrauma Rehabilitation Centers, 20 percent are Polytrauma Network Sites, 20 percent are Regional Spinal Cord Injury Centers, 11 percent are Blind Rehabilitation Centers, and 100 percent are academically affiliated in some form.
2.2 Data Sources and Analysis
We analyzed data from several sources: (1) national VHA data sets; (2) a survey of relevant front-line clinical inpatient staff at all VAMCs; (3) a data call made to all VAMCs; (4) more than 150 interviews during visits to 21 VAMCs and with other subject matter experts; (5) 80 total assessment workshops held during site visits; and (6) more than 65 unit shadowing sessions conducted during site visits.
Assessment F (Workflow – Clinical)
The views, opinions, and/or findings contained in this report are those of the assessment team and should not be construed as an official government position, policy, or decision.
8
We believe that the interactive approach used during site visits differentiates this assessment from many others that have been conducted. We purposefully selected sites representing VHA as a whole, and not only conducted observations of their behavior and processes, but also took extra time to focus on gathering front-line employee input to better understand their actions and perspectives. Several interviewees thanked us for including them and made comments to the effect of “Most survey teams come to our facility and speak exclusively with senior leadership – it’s refreshing to be included in this important work, especially since we know what’s broken, what works, and what has failed in the past.” During our site visits, through the interviews, assessment workshops and shadowing sessions mentioned above, we met with more than 750 employees across roles, departments, and tenure levels. We believe this has enabled us to bring a broad perspective to the conversation on VHA’s strengths and challenges.
In many instances, VHA was unable to provide data typically used by private sector hospitals to manage performance. This was either because requested data did not exist (e.g., payroll data by shift), was not available at the national level (e.g., time from Post-Acute Care Unit (PACU) transfer order to admission to the floor), was reported to be so inaccurate that conclusions could not be drawn from it (e.g., number of operational beds), or required effort to compile beyond what time and resources could allow (e.g., hourly data on ED visits by facility). Lack of data impeded our ability to fully assess VHA clinical operations. Data challenges are also a finding in and of themselves: without basic information on its operations—such as the number of currently active inpatient beds—VHA has very limited ability to manage performance. This is a critical issue, which emerged in each of our sub-assessment areas.
Our approach to collecting data from various sources is included below. We primarily used descriptive statistics to analyze the data we collected (e.g., analyzing the frequency with which a particular tool was used). In some instances, we supplemented this approach with regression analysis, used to determine associations between different variables (e.g., to understand whether allied health professionals were more likely than nurses to believe that their occupation was adequately staffed).
National VHA data sets:
To develop a baseline understanding of current practices across VHA, we requested access to national VHA data sets. Key sources included: the survey of health care experiences and patients (SHEP), strategic analytics for improvement and learning (SAIL), national bed control database (NBCD), national utilization management integration (NUMI), inpatient evaluation center (IPEC), medical SAS inpatient dataset (MedSAS), emergency department integrated software (EDIS), national surgical office (NSO), human resources (HR), and payroll. It should be noted that we did not conduct a review to validate the accuracy of data that was provided.
Surveys:
To gather additional insight into front-line workers’ perspectives of VHA, we conducted a survey of staff perceptions of practices related to each of the sub-assessment areas within Assessment F. To ensure a breadth of perspectives and a sufficient response rate, the survey was sent to leadership at all VAMCs to distribute to all staff within selected relevant roles (e.g., Emergency Department charge nurses). 2,684 inpatient staff members responded to one or

Assessment F (Workflow – Clinical)
The views, opinions, and/or findings contained in this report are those of the assessment team and should not be construed as an official government position, policy, or decision.
9
more sections within the inpatient survey. Surveys were tailored to be role specific and ask for respondents’ perceptions of the organization, processes, and tools used to support each of the sub-assessment areas, meaning that total respondents varied by role, question, and sub-assessment. Due to the fact that VHA does not track the setting of work (i.e., inpatient or outpatient) in available human resource data and we did not control the distribution of the survey to the end-user, we are unable to calculate the significance of the total response rate, but do not believe it to be a representative sample across any of the roles. Given this, survey data should be viewed as providing anecdotal insights as opposed to a representative data sample.
Data call:
To access data that is captured in many cases solely at the facility level (e.g., FTEs by department, overtime use by department, type of tool utilized for specific tasks), as well as policies housed at individual VAMCs (e.g., side agreements with unions), we initiated a data call to all VAMCs. Approximately 120 unique VAMCs across 100 percent of VISNs responded to one or more portions of the data call, with an average of 60 unique VAMCs responding to each sub-assessment specific questionnaire.
Interviews:
To gain insight into facility-level strengths and challenges as well as current practices, we conducted nine individual and group interviews of key facility staff at each VAMC visited (e.g., Department chiefs, case managers, patient advocates) for a total of more than 150 interviews11 across 21 VAMCs. In addition to interviews conducted on-site at facilities, we interviewed 52 members of VA Central Office (VACO) and VHA Central Office (VHACO) leadership and subject matter experts identified by our assigned VA point-of-contact (POC).
Assessment workshops:
To understand clinical operations processes and the feasibility of potential solutions, we held four interdisciplinary assessment workshops at each of our 21 site visits, for a total of 80 workshops12. These workshops focused on clinical staffing, ED throughput (a major part of inpatient access), the discharge process (a key component of length-of-stay management), and documentation and coding. Workshops were held with an average of 5 to 7 interdisciplinary participants and included interactive activities such as process mapping, brainstorming of solutions, and ranking of proposed solutions.
Unit shadowing:
To identify current facility tools and processes, we gathered primarily quantitative data through shadowing front-line staff members in key departments (e.g., number of ICUs using
11 Individual iterviews were conducted by members of the Assessment F Team and often applied to multiple sub-
assessments of F, as a result the number of interviews cited by individual sub-assessments are not additive.
12 Four workshops were cancelled due to scheduling reasons and/or poor attendance

Assessment F (Workflow – Clinical)
The views, opinions, and/or findings contained in this report are those of the assessment team and should not be construed as an official government position, policy, or decision.
10
standardized vent-weaning protocols) across 21 VAMCs. Data was collected using standardized checklists, to ensure consistency.
2.3 Benchmarking
We used a two-pronged approach to benchmarking VHA organization, processes, and tools. First, we drew on the academic literature, recommendations made by professional associations, and case studies of high performing facilities (internal and external to VHA) to identify industry best practices. Professional associations were selected based on their influence on industry standards, indicated by the size of their membership and prevalence of use of their standards and products in clinical practice. Hospitals were identified as having best-in-class practices based on placement in hospital rankings (e.g., Hospital Consumer Assessment of Health Care Providers and Systems [HCAHPS] rating). We also selected high performing facilities based on recommendations by external experts, interviewing staff where possible and building case studies of highly effective practices, within and beyond VHA.
Second, in cases where there was no clear consensus in the literature or professional community as to the best practice, we used industry standard practices as the benchmark. We relied upon external surveys of private sector hospitals (published in academic literature or by professional associations) and interviews with median-performing facilities to develop a view of standard practices. We have noted where a practice is industry standard, rather than necessarily ideal.
VHA is unique relative to the private sector in many respects: its patient population, scale, and integrated nature are particularly clear examples. Private industry best practices as well as standard practices are therefore not always directly applicable to VHA. We have included these practices as benchmarks, however, to give a sense of how VHA clinical operations compare to those governing the health care provided to most Americans, in private facilities. As noted earlier, we have also reviewed internal best practices at high-performing VAMCs to illustrate organizational structures, processes, and tools that have been effective within VHA’s context.
Finally, an independent Blue Ribbon Panel, consisting of high-level health care industry experts, Veteran advocates, and other key opinion leaders was formed to provide expert input throughout the assessment process. The panel members possessed a thorough understanding of health care industry best practices and leading edge practices. The Blue Ribbon Panel provided advice and feedback on the emerging findings and recommendations for the assessment.

Assessment F (Workflow – Clinical)
The views, opinions, and/or findings contained in this report are those of the assessment team and should not be construed as an official government position, policy, or decision.
11
3 Cross-Cutting Findings We found three common themes across the sub-assessment areas included in this report: (1) ineffective data collection and management drives a lack of transparency on many key aspects of clinical operations, hindering VHA’s ability to effectively manage inpatient care; (2) VHA resources (e.g., staff, beds) do not always match Veterans’ care needs; and (3) while best practices exist in selected pockets, communication and support for implementation at scale appears to be a challenge.
3.1 Ineffective Data Collection and Management Drives a Lack of Transparency on Many Key Aspects of Clinical Operations, Hindering VHA’s Ability to Effectively Manage Inpatient Care
Despite having a well regarded EMR system and the capability of tracking extensive clinical data, poor data management was a consistent theme heard during site visits, and was clearly evident from our central and local requests for specific information. Data that is standard in private sector hospitals was frequently inaccessible in a timely manner or not tracked in a usable format by VHA. For example, VHA FTE and payroll data includes information by clinical occupation but not by department, which prevented planned analysis of the appropriateness of staffing, since needed staffing levels vary considerably by department (e.g., the ICU requires more concentrated nursing attention than medical/surgical floors; see Section 2 for more detail). VHA also lacks accurate insight into inpatient bed capacity (and, thereby, inpatient access). VHA assesses inpatient bed capacity using nationally reported “operational beds.” However, approximately 40 percent of facilities responding to our data call reported having to close beds temporarily due to staffing shortages; these temporary closures can actually last for extended periods, and are not reported nationally. This means that bed capacity on the ground may be substantially lower than VHACO has visibility into, affecting decision-making in areas such as construction and staffing (see Section 3 for more detail). We observed data integrity and availability issues significantly affecting VHA’s visibility into clinical operations in four of our five sub-assessment areas (described below) and believe that this likely affects VHA’s ability to manage operations at the local and national levels. While we were unable to conduct a root cause analysis as to the fundamental causes of poor data collection and management, we do believe that further exploration of this topic is necessary for VHA to improve clinical operations in a meaningful way.
Supporting sub-assessment findings:
Clinical staffing, 5.2.1: VHA does not have the tools or data to set or monitor staffing levels appropriately. Variable VHA HR and payroll data systems give different FTE numbers for the same clinical occupations and VAMCs. While the nursing service has developed a strong staffing methodology, many other clinical occupations lack any central guidance on how to estimate FTE need. As one AHP leader said, “We’ll be adding 10,000 patients [to one of our sites next year]…how many more PTs do I need? I don’t know.”
Assessment F (Workflow – Clinical)
The views, opinions, and/or findings contained in this report are those of the assessment team and should not be construed as an official government position, policy, or decision.
12
Access, 6.2.1: Data gaps limit VHA’s understanding of patient demand patterns and available VAMC capacity. Inconsistent methods for tracking physical bed counts and patient demand patterns at the unit and facility level limit VHA’s ability to analyze VAMC staffing and available bed capacity based on patient demand. While VHA maintains several different systems to manage access and flow, these systems do not integrate with one another, further limiting end users’ ability to aggregate information across systems.
Patient experience, 8.2.3: Challenges with respect to timeliness and specificity in the SHEP survey results limit VAMCs’ ability to drive performance improvement. Lack of timeliness (3-6 month delay in reports) and specificity (aggregate facility level results as opposed to unit or individual level) of SHEP survey results limit the perceived effectiveness, accuracy, and ability to execute against patient satisfaction results.
Documentation and coding, 9.2.1: Inconsistent emphasis on clinical documentation impedes consistent capture of complete clinical information, hindering appropriate resource allocation and revenue collection. Varied emphasis on accurate clinical documentation and coding across the organization results in potentially incomplete data. While some VAMCs have stressed proper documentation to maximize budgetary allocations and improve quality ratings, many have not. This is evidenced by differences in local approaches to documentation training: only 57 percent of physicians participating in the Choice Act survey reported that their facility provides training regarding documentation and coding.13
3.2 VHA Resources (e.g., staff, beds) do not Always Match Veterans’ Care Needs
The practical allocation and prioritization of resources across the VHA system may not be consistently aligned to meeting the broader health needs of the Veteran patient population. Mismatch of resources to patient care needs manifests itself in three ways: hiring that does not consistently match staffing needs; allocation of staff to tours (“shift”) that do not consistently match Veteran demand; and limited access to appropriate outpatient and post-/sub- acute care options.
As an example of limited outpatient and post-acute care options, we found many instances in which Veterans were admitted to the hospital despite not meeting acute criteria to warrant admission, or remained in the hospital past the point of medical necessity, due to challenges in accessing the appropriate level or type of care (e.g., primary care, detoxification center, post-acute rehabilitation). NUMI data14 indicates that 23 percent of inpatient admissions do not meet admission criteria (see Section 6 for more detail) and 34 percent of inpatient stays overall do not meet continued stay criteria (see Section 7 for more detail). The disconnect between resources and demand has clear implications on VHA’s ability to effectively and efficiently provide the care needed to improve the health and well-being of Veterans. Non-medically-
13 Choice Act survey (N=434) 14 NUMI (National Utilization Management Integration): supports national utilization management agenda by
providing a common tool for tracking performance on utilization management metrics across facilities

Assessment F (Workflow – Clinical)
The views, opinions, and/or findings contained in this report are those of the assessment team and should not be construed as an official government position, policy, or decision.
13
indicated stays may be well-intentioned, but they are a suboptimal use of acute medical resources. This reduces inpatient access, delays care transitions (increasing healthy patients’ exposure to hospital-acquired infections) and increases the overall cost of Veteran care. Supporting sub-assessment findings are listed below, indicating areas where we observed mismatch of resources to demand.
Supporting sub-assessment findings:
Clinical staffing, 5.2.2: Hiring timeline significantly exceeds private sector benchmarks, affecting ability to fill vacancies on patient care teams. VHA HR targets 60 days from receiving a request for a job posting to making a tentative offer; this timeline exceeds private sector timelines for hiring most clinical staff, and does not count steps needed to make a final offer. Interviewees and workshop participants consistently reported that hiring exceeds the 60 day target, reaching ~6 months for most clinical occupations. The length of the hiring process was cited as a challenge in 100 percent of staffing workshops.15
Clinical staffing, 5.2.3: Allocation of staff does not consistently match patient care need. We found that staffing levels drop considerably on evenings, nights, and weekends (e.g., by ~65-100 percent for intensivists, depending on the shift), often beyond what is recommended in the academic literature as safe minimum staffing levels, potentially affecting patient care.
Access, 6.2.2: Hospital visits and admissions that are not clinically appropriate contribute to ED bottlenecks and limit bed availability. More than 120,000 admissions, approximately 20-25 percent of admissions from the ED and following surgical procedures, fail to meet McKesson InterQual admissions criteria.16 Of those clinically inappropriate VHA admissions, we found that 30 percent or 7 percent of total admissions, are attributed to limited access to the appropriate setting of care (e.g., level of care availability, outpatient access, and social issues).
Length-of-stay, 7.2.2: Existing post-acute care options (e.g., rehabilitation/skilled nursing facilities) do not always match Veteran needs, delaying discharge. Patient LOS is, on average, ~3.1 days longer for Veterans discharged to post-acute care settings compared to patients discharged to home. Participants in 55 percent of on-site workshops reported challenges with transitioning Veterans into post-acute care, including difficulty arranging transportation, securing timely placement in VHA-operated programs, and contracting with community facilities.17
Length-of-stay, 7.2.3: Typical VAMC operating models do not promote efficient inpatient care, leading to prolonged LOS. Limited availability of important clinical services (e.g., specialty and allied health consults) on weekends contributes to ~15-45 percent increases in LOS for admissions extending through the weekend. In addition, implementation of
15 Site visit staffing assessment workshops (N=19) 16 McKesson InterQual is a tool that provides evidence-based clinical decision support on the appropriateness of
care (including admissions and continuing stays) 17 Site visit discharge planning assessment workshops (N=20)
Assessment F (Workflow – Clinical)
The views, opinions, and/or findings contained in this report are those of the assessment team and should not be construed as an official government position, policy, or decision.
14
evidence-based inpatient protocols and care pathways have been left to individual facilities, resulting in variable adoption nationally.
3.3 While Best Practices Exist in Selected Pockets, Communication and Support for Implementation at Scale Appear to be a Challenge
Our site visits revealed several clear best practices in place at various VAMCs; however, adoption of these practices was isolated even within the facility. Case studies of particularly strong programs are included in all sub-assessments. Despite successfully adopting best practices in some units, however, facilities appeared to struggle to implement programs house-wide. Moreover, information-sharing between VAMCs appears to be limited and ad hoc. As one Assistant Director of Patient Care Services described, “I’m shameless about stealing what works at other places, the problem is, I don’t know what other places are doing. We need a way to connect, to learn from each other”18. This sentiment was echoed by staff across all of the facilities we visited.
Supporting sub-assessment findings:
Access, 6.2.3: Best practices related to workflow and performance management exist at some facilities, but have not been scaled across the system. Despite successful implementation of many operational best practices (e.g., fast track, clinical protocols in triage, flow management teams) in select facilities, adoption is limited system-wide. Additionally, even in top-performing facilities based on ED length-of-stay and left without being seen rates, delays in inpatient access can result from insufficient bed availability and inconsistent admission and bed assignment processes.
Length-of-stay, 7.2.1: Implementation of national LOS programs and initiatives has failed to achieve organization-wide improvements despite local pockets of best practice adoption. National programs, including the Utilization Management (UM) program and several collaboratives (for example, Transitions Collaborative, Flow Collaborative), have been launched to address existing challenges with LOS and care transitions. Although several facilities have experienced improvements through participation in these programs, national LOS challenges persist: the difference between VHA LOS and average DRG-adjusted Medicare LOS has increased by 5 percent since beginning of FY2012, while restrictions on VHA programming have contributed to a ~50 percent decrease in the number of facility spots available within national collaboratives.19
Length-of-stay, 7.2.4: Use of discharge planning best practices is inconsistent, decreasing effectiveness and coordination. Nationwide, VHA adoption of practices to appropriately manage LOS and promote effective care transitions has not matched practices of high performing hospital systems. For example, only 48 percent of VAMCs20 have dedicated
18 Facility interview 19 Facility interview 20 VHA data call (2015) (N=60)

Assessment F (Workflow – Clinical)
The views, opinions, and/or findings contained in this report are those of the assessment team and should not be construed as an official government position, policy, or decision.
15
inpatient case managers to coordinate the overall discharge planning process (compared to private sector facilities that commonly employ a team of RN case managers, social workers, utilization management specialists, and discharge planners), which may result in avoidable discharge delays.
Patient experience, 8.2.2: Adoption of facility level best practices and engagement of program office support services are varied across VAMCs. While initiatives at both the central and facility levels exemplify Veteran-centered care and industry accepted best practices, adoption across the system is limited by the level of facility leadership engagement and insufficient infrastructure to codify and share facility-driven initiatives across the system.
Documentation and coding, 9.2.2: Adoption of documentation best practices is variable, resulting in inconsistent quality of clinical documentation system-wide. Interviewees and workshop participants during our site visits consistently reported challenges with clinical documentation, including 80 percent of sites reporting suboptimal template use and 55 percent reporting inappropriate use of copy-paste.21 The persistence of these challenges despite 87 percent of VAMCs22 reporting quarterly performance of EHR quality reviews suggests opportunities to improve the EHR review process.
Documentation and coding, 9.2.3: System-wide focus on coding standards has resulted in coding performance typically meeting or exceeding private sector benchmarks. National inpatient coding accuracy is ~93 percent23 and inpatient coding occurs ~4 days after discharge, suggesting that VHA coding metrics are closely aligned with industry benchmarks. Routine internal auditing of coding performance at the facility-level and development of a national dashboard for performance tracking appear to be contributing to strong overall performance.
21 Site visit documentation and coding assessment workshops (N=20) 22 VHA data call (2015) (N=56) 23 As mentioned in the introduction of this section, we did not independently verify this result (for example,
through a coding audit).

Assessment F (Workflow – Clinical)
The views, opinions, and/or findings contained in this report are those of the assessment team and should not be construed as an official government position, policy, or decision.
16
This page intentionally left blank.

Assessment F (Workflow – Clinical)
The views, opinions, and/or findings contained in this report are those of the assessment team and should not be construed as an official government position, policy, or decision.
17
4 Cross-Cutting Recommendations and Implementation Considerations
4.1 Cross-Cutting Recommendations
We have identified three priority recommendations for VA to consider to address the key findings included in Section 3, above: (1) improve clinical management through clear operational metrics, streamlined data collection, monitoring, and evaluation; (2) realign resourcing (e.g., staff, facilities) to allow VHA to serve patients at the appropriate level of care; and (3) scale existing best practices and support further innovation at the local and national levels.
In order to facilitate implementation, additional detail on the supporting themes, as well as potential near-term actions can be found in the sub-assessment sections of this report (Sections 5-9). Furthermore, we have suggested owners for each of the “potential near-term actions.” These owners should be viewed as suggestions based on our understanding of: (1) whether change is needed nation-wide or depends on specific facilities’ need, and (2) whether VACO resources will be required to facilitate actions. Ultimately, initiatives should be driven by owners that are dedicated to making the improvement happen and well-positioned to drive the change necessary to achieve impact.
Improve Clinical Management Through Clear Operational Metrics, Streamlined Data Collection, Monitoring, and Performance Management
Appropriately defining standards for high performance and having accurate information on how departments and facilities measure against defined targets is the foundation of managing operations. Site visits, data analysis, and comparison against best and standard practices suggest that VHA lacks such visibility into clinical operations, significantly reducing its ability to address challenges and innovate (see Section 3.1). We believe that improving transparency is critical to ensuring effective, timely, and efficient delivery of care to Veterans, across many of our sub-assessment areas. In part, transparency could be improved through enhanced data management, meaning both better data integrity and sharper focus on a targeted set of key metrics needed to assess performance. Equally important, VHA should ensure that facilities have clear operational guidelines on how to set and track appropriate performance goals (e.g., by providing comprehensive staffing methodologies for service lines with no national guidance). The sub-assessment recommendations listed below illustrate specific changes that could help VHA increase transparency.
Supporting sub-assessment recommendations:
Clinical staffing, 5.3.1: Increase transparency of staffing by providing evidence-based staffing methodologies for all clinical staff and improving data management. VHA should provide comprehensive staffing methodologies for services with no national guidance. VHA should also ensure that staffing is interdisciplinary, so that providers are staffed with the support they need to practice.

Assessment F (Workflow – Clinical)
The views, opinions, and/or findings contained in this report are those of the assessment team and should not be construed as an official government position, policy, or decision.
18
Access, 6.3.1: Develop an accurate end-to-end picture of patient demand and VAMC capacity. VHA should simplify the process and required approvals by which beds are classified as operational and standardize the definition and tracking of patient diversions. Additionally, VHA should develop a prioritized set of standardized metrics to track patient flow, including current demand and capacity, at the facility, VISN, and VHACO level, to be compared to models of patient demand.
Patient experience, 8.3.1: Collect more timely and relevant patient experience data to drive performance improvement at the facility, department, and individual level. VHA should ensure its patient satisfaction tool(s) delivers granular survey results (for example, at the individual department or unit level) in a timely (for example, real time or near real-time) and actionable format (for example consistent across the system).
Documentation and coding, 9.3.2: Strengthen provider documentation standards (e.g., management of clinical templates, EHR review process) to promote optimal capture of patient information and improve resulting resource management. VHA should improve documentation practices through enhanced governance focused on template management, targeted guidance regarding EHR reviews, and improved performance management reinforcing query responsiveness.
Ensure Resourcing (e.g., staff, facilities) Allows VHA to Serve Patients at the Appropriate Level of Care
We observed many instances in which VHA resources were not appropriately matched to patient demand. As described in Section 1.4.2, the disconnect between resources and demand was seen in delayed hiring of staff needed to support patient care, misallocation of staff to tours (i.e., shifts), and limited outpatient and post-acute care options needed to ensure treatment at the appropriate level of care. In order to provide high quality care that promotes the health and well-being of Veterans in a cost efficient manner, VHA should ensure that resourcing allows the system to serve patients at the appropriate level of care. Broadly, we see three categories of changes that could help effect this recommendation: improve hiring, allocate staff to match patient demand (e.g., align that staffing on weekend, holiday, and evening hours is sufficient to meet patient need), and increase access to outpatient and post-acute care options. Specific recommendations related to our sub-assessment areas are included below.
Supporting sub-assessment recommendations:
Clinical staffing, 5.3.2: Increase timeliness of hiring for patient care teams. VHA should refine HR service level agreements, streamline the hiring process, and review regulations that extend hiring timeline, for necessity.
Clinical staffing, 5.3.3: Allocate staff to match patient care need. VHA should ensure that staffing on evenings, nights, and weekends matches hospital volumes, and that facilities have access to flexible resources that can help manage short-term understaffing.
Access, 6.3.2: Decrease the number of clinically inappropriate admissions due to limited access to sub-acute care. VHA should assess the availability of alternative settings of care
Assessment F (Workflow – Clinical)
The views, opinions, and/or findings contained in this report are those of the assessment team and should not be construed as an official government position, policy, or decision.
19
(e.g., detox clinics, short-term rehabilitation centers), at the regional level, and dedicate appropriate patient support resources (e.g., case managers and social workers), at the facility level, to coordinate transitions from the ED and surgical departments. Once the infrastructure is in place to support these patients outside the acute setting, VAMCs should begin to hold physicians accountable for appropriateness of admissions (e.g., include utilization management in physician performance appraisals).
Length-of-stay, 7.3.1: Mitigate discharge delays related to post-acute placement (e.g., increase availability of post-acute care options). VHA should evaluate the availability of VHA-operated programs and community resources to meet the post-acute care needs of Veterans. Based on availability, VHA should create appropriate partnerships or develop VHA-operated services aligned with Veteran needs and the organization’s refined strategic mission.
Scale Existing Best Practices and Support Further Innovation at the Local and National Levels
A consistent theme during our site visits and interviews was the inconsistent adoption of best practices across VAMCs (see Section 1.4.3). In instances where best practices had been developed nationally, this challenge stemmed from unclear guidance on implementation, occasional flaws in the design of programs, and lack of VAMC adoption. In instances where best practices had been developed locally, scaling was inhibited by limited infrastructure for information-sharing and lack of resources. To address both sets of challenges, we suggest improving practices through a combination of targeted national guidance (e.g., streamline Veteran-centered care initiatives and directives) and nationally-supported local best practice-sharing and innovation (e.g., build infrastructure to promote cross-facility sharing of patient flow best practices). Specific recommendations to effect these changes, drawn from our sub-assessment recommendations, are included below.
Supporting sub-assessment recommendations:
Access, 6.3.3: Expand use of evidence-based processes for managing patient flow, including clear role assignments and individual performance management. VHA should focus on standardization in triage through the early initiation of clinical protocols, in ED diagnostics by segmenting low acuity demand through a fast track processes, and in admission and bed assignment through clearer role assignment and better utilization of available tools.
Length-of-stay, 7.3.2: Build on existing best practices, both internal and external to VHA, to increase local adoption of evidence-based inpatient care and discharge planning practices. VHA should provide technical support and facilitate targeted best practice sharing to assist facilities in improving upon local practices related to efficient care delivery and effective discharge planning. In addition, VHA should engage Veterans as active stakeholders in the care transition process by providing education regarding safe and effective transitions of care to the most appropriate post-acute care venue.
Patient experience, 8.3.2: Strengthen national and facility level support for patient-centered care programs to increase adoption. VHA should strengthen adoption through

Assessment F (Workflow – Clinical)
The views, opinions, and/or findings contained in this report are those of the assessment team and should not be construed as an official government position, policy, or decision.
20
improved coordination of Veteran-centered initiatives across program offices, improved leadership turnover at the VAMCs and facilitated sharing of facility-driven best practices.
Documentation and coding, 9.3.1: Increase local prioritization of clinical documentation through acceleration of national clinical documentation improvement (CDI) program and targeted provider education and training, supported by performance management at the facility and provider level. VHA should strengthen facility-level emphasis on accurate documentation and coding, building on existing programs and via new efforts. For example, VHA launched a national CDI program in 2013, but to date only 46 percent of VAMCs have implemented programs at the local level. VHA should strengthen the current CDI program by providing dedicated resourcing for CDI specialists at the facility level and by creating a national knowledge-sharing network to disseminate successful local practices.
4.2 Implementation Considerations
As previously noted and in alignment with Section 201 of the Choice Act, Section 201 assessments, findings and recommendations were developed independently. We therefore expect these recommendations will need to be refined and integrated by VHA leadership and the Commission on Care into the ongoing efforts.
Below, we have listed the changes that we believe are fundamental preconditions for successfully implementing the recommendations described in Sections 5-9, as well as suggested immediate actions to be taken at the national level.
Preconditions for Implementation
VHA clinical operations are driven by a complicated mix of congressional mandates, federal regulations, union agreements, VACO and VHACO policy, VISN supervision, and VAMC management. We see this assessment as an opportunity for solving long-standing challenges, to be achieved by all stakeholders through a combination of local, regional, and national action. Addressing these challenges will require sustained commitment as a part of an integrated transformation effort for the system as a whole.
The recommendations summarized earlier in this section include both fundamental shifts to the system as well as tactical changes that can be made at the local level, while more far-reaching solutions are being implemented. We believe there are four essential preconditions to implementing our recommendations in a sustainable manner and achieving excellence in inpatient clinical operations at VHA:
1. Clearly define the range of services VHA is responsible for providing, as well as its target Veteran recipients. Interviewees at every site we visited described the challenges of providing care for non-acute patients in the acute setting.24 These patients ranged from same-day surgical patients being admitted due to a lack of transportation to patients ready for discharge but without space in a sub-acute facility. Admissions were a
24 Site visit discharge planning assessment workshops (N=20)

Assessment F (Workflow – Clinical)
The views, opinions, and/or findings contained in this report are those of the assessment team and should not be construed as an official government position, policy, or decision.
21
large part of the challenge: staff described knowing that certain patients did not meet criteria for acute inpatient admission (e.g., a homeless Veteran in the ED with a diagnosis that does not meet criteria for admission) but admitting them nonetheless, either because they believe VHA had a duty to provide social care and other venues were not available or because they were concerned about potential political or media backlash from refusing admission. Placements to post-acute settings (e.g., skilled nursing facilities) were also reported to be difficult, due to limited VHA facilities and access to community resources (e.g., limited contracts with community facilities).25 Lack of clarity as to what care VHA is responsible for providing, and limited venues for providing appropriate inpatient alternatives, contribute to clinically inappropriate admissions, prolonged LOS, and delayed treatment for non-medical issues. VHA, Congress, and relevant stakeholders need to clearly define VHA’s mission and commit to providing resources needed to meet this mission.
2. Substantially streamline operational requirements and policy, including reporting requests, required programs, and earmarked funding, in order to sharpen VHA’s focus and allow VAMCs the flexibility they require to address local care needs. Interviewees consistently reported that their ability to deliver care and innovate was hindered by shifting priorities, ad hoc changes to policy, time-consuming reporting requirements, and heavy earmarking of funding. For example, though VHA creates infrastructure to support targeted initiatives (e.g., fall reduction), changing priorities hamper implementation: as one quality manager reported, “You don’t have enough time to implement before the next one [mandate] comes…Very good initiatives fail because [of this].”26 Some facilities reported being visited by over 50 assessment teams a year. Site visits are not tracked by a single entity at VHA, so this number could not be validated, however based on conversations with VHACO leadership, we believe that it is likely that visits between program office, VISN, and external accrediting/certifying bodies’ are indeed substantial in number. One staff member lamented, “We’re constantly being audited, it’s a challenge,” while multiple interviewees across sites expressed the challenge that assessments pose to providing efficient care and focusing on improvement efforts. VHA should work with Congress to streamline current operational requirements and policy to become more flexible, efficient, and effective.
3. Understand resource implications of new and existing mandates and directives. Unfunded mandates and directives were seen as a significant challenge by staff at the VAMCs we visited. For example, congressionally mandated clinical staff positions on primary care and home care teams were reported by providers during site visits, as having been filled by pulling clinical staff from the inpatient setting, potentially detracting from facilities’ ability to deliver care to hospitalized patients. Similarly, national guidance recommending implementation of clinical documentation improvement (CDI) programs at the facility-level has not been accompanied by corresponding funding to hire the CDI specialists to make these programs successful.
25 Site visit discharge planning assessment workshops (N=20) 26 Interview with a VAMC quality manager
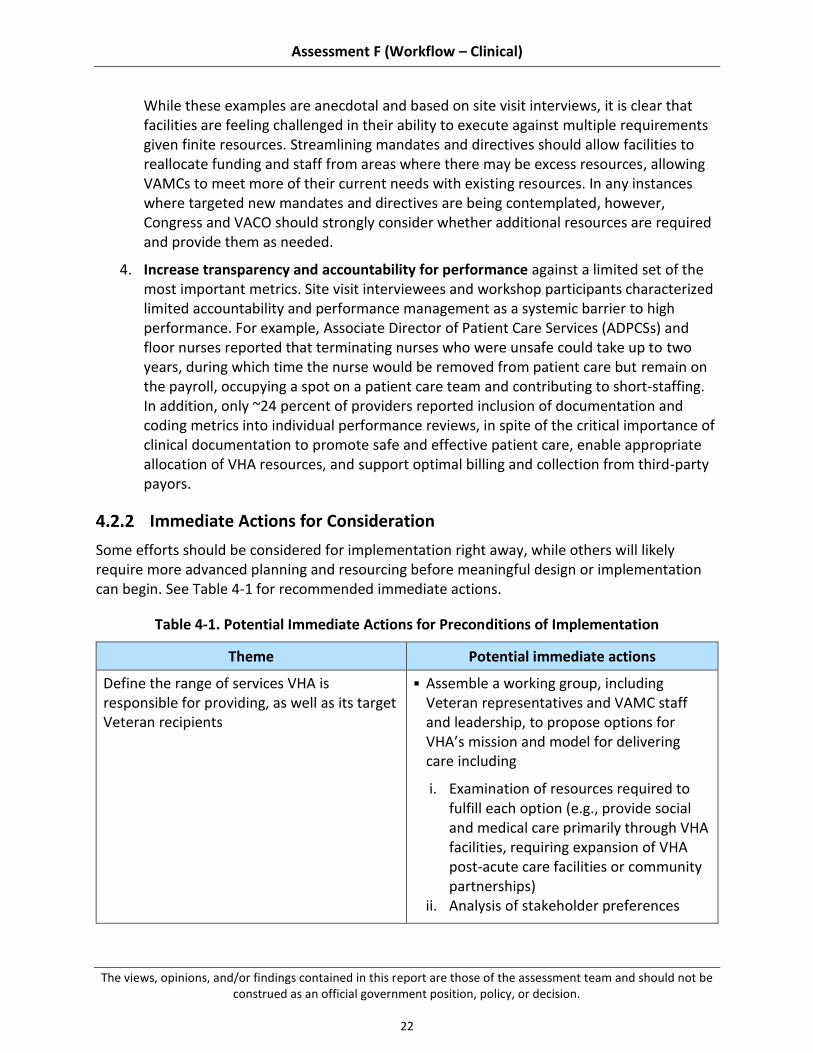
Assessment F (Workflow – Clinical)
The views, opinions, and/or findings contained in this report are those of the assessment team and should not be construed as an official government position, policy, or decision.
22
While these examples are anecdotal and based on site visit interviews, it is clear that facilities are feeling challenged in their ability to execute against multiple requirements given finite resources. Streamlining mandates and directives should allow facilities to reallocate funding and staff from areas where there may be excess resources, allowing VAMCs to meet more of their current needs with existing resources. In any instances where targeted new mandates and directives are being contemplated, however, Congress and VACO should strongly consider whether additional resources are required and provide them as needed.
4. Increase transparency and accountability for performance against a limited set of the most important metrics. Site visit interviewees and workshop participants characterized limited accountability and performance management as a systemic barrier to high performance. For example, Associate Director of Patient Care Services (ADPCSs) and floor nurses reported that terminating nurses who were unsafe could take up to two years, during which time the nurse would be removed from patient care but remain on the payroll, occupying a spot on a patient care team and contributing to short-staffing. In addition, only ~24 percent of providers reported inclusion of documentation and coding metrics into individual performance reviews, in spite of the critical importance of clinical documentation to promote safe and effective patient care, enable appropriate allocation of VHA resources, and support optimal billing and collection from third-party payors.
Immediate Actions for Consideration
Some efforts should be considered for implementation right away, while others will likely require more advanced planning and resourcing before meaningful design or implementation can begin. See Table 4-1 for recommended immediate actions.
Table 4-1. Potential Immediate Actions for Preconditions of Implementation
Theme Potential immediate actions
Define the range of services VHA is responsible for providing, as well as its target Veteran recipients
Assemble a working group, including Veteran representatives and VAMC staff and leadership, to propose options for VHA’s mission and model for delivering care including
i. Examination of resources required to fulfill each option (e.g., provide social and medical care primarily through VHA facilities, requiring expansion of VHA post-acute care facilities or community partnerships)
ii. Analysis of stakeholder preferences

Assessment F (Workflow – Clinical)
The views, opinions, and/or findings contained in this report are those of the assessment team and should not be construed as an official government position, policy, or decision.
23
Theme Potential immediate actions
Determine an organizational mission and the path forward
Substantially streamline central mandates and directives
Solicit input from VAMCs in developing a list of top priorities for clinical and operational focus
Align on the top priorities across VHA, limited to foundational areas that merit long-term focus and system-wide investment
Eliminate all existing mandates and directives that are not directly linked to the defined priorities, do not require national standardization, are duplicative, or are in conflict
Establish a high bar for the addition of new mandates and directives
Understand resource implications of new and existing mandates and directives
Conduct a full workforce assessment to understand what resources are needed and where efficiencies could be gained
Institute a policy that analysis of resource requirements (staff, funding, or otherwise), developed with input from the field, be included in all proposals for new national mandates and directives
Appoint an interdisciplinary board with cross-level representation (e.g., front-line, VISN leadership, VHACO) to determine the necessity of the mandate or directive and whether additional resourcing is needed.
Establish a very high bar for the acceptance of unfunded mandates (e.g., highly limited additional staff effort needed, demonstrated not to interfere with ability to deliver care)
Increase transparency and accountability for performance
Create a streamlined dashboard of critical metrics closely aligned to defined organizational priorities to truly provide visibility into performance
Remove redundant or unhelpful metrics from existing dashboards to ensure only

Assessment F (Workflow – Clinical)
The views, opinions, and/or findings contained in this report are those of the assessment team and should not be construed as an official government position, policy, or decision.
24
Theme Potential immediate actions
usable, actionable, and relevant data is being tracked
Review existing disciplinary processes across levels, to identify opportunities to streamline steps and accelerate the process

Assessment F (Workflow – Clinical)
The views, opinions, and/or findings contained in this report are those of the assessment team and should not be construed as an official government position, policy, or decision.
25
5 Clinical Staffing Part F (“Assessment F”), Section 201 of the Veterans Access, Choice, and Accountability Act of 2014 (“the Choice Act”) mandates an assessment of the organization, processes, and tools used to support clinical staffing. Academic literature has established clear links between the caliber, mix, and number of clinical staff – directly affected by staffing practices – and quality of patient care and experience outcomes (McHugh and Swain, 2014; Ward et al., 2013; Harris and Hall, 2012; Needleman et al., 2011; Mudge et al., 2006; McMillan and Ledder, 2001). Maintaining effective staffing practices is critical to ensuring the delivery of high quality care, staff satisfaction, and cost-effective practice. While clinical staffing has a significant impact on VHA budget and operations, as Sections 6-8 describe, appropriate staffing also facilitates access, effective length-of-stay management and care transitions, and patient experience. Having the right staff in the right places at the right time to meet the clinical care needs of Veterans is essential and warrants attention for those reasons. The Blueprint for Excellence states that “serving Veterans proficiently requires improvement of VA and VHA management and business processes. Bottlenecks in meeting human resource needs must be addressed to assure operational effectiveness as both a delivery system today and an integrated healthcare services network tomorrow” (Blueprint for Excellence, 2014).
Due to the fact that there are varying definitions of “clinical staff,” we have drawn on definitions from the American College of Physicians, American Medical Association, Utilization Review Committee, and Centers for Disease Control to interpret the term as providers and other licensed clinical staff able to provide care autonomously or under a clinician’s supervision (see Appendix A.1). Given the scope of Assessment F, we focus specifically on clinical staff providing inpatient care 27 – physicians, advanced practitioners, nurses, nurse assistants, allied health professionals, and several types of therapy assistants and health technicians – at facilities with significant acute care inpatient capacity.28 These staff members represent
27 Either fully (e.g., hospitalists) or in part (e.g., consulting physicians).
28 VHA divides facilities into five levels of complexity – Level 1a, 1b, 1c, 2, and 3. We have focused on Levels 1a, 1b, 1c, and 2, the high- and medium-complexity facilities, because Assessment F mandates an assessment of clinical workflows in the inpatient setting, and Level 3 facilities have very limited inpatient capacity.

Assessment F (Workflow – Clinical)
The views, opinions, and/or findings contained in this report are those of the assessment team and should not be construed as an official government position, policy, or decision.
26
approximately 124,000 FTEs29 (nearly 45 percent of VHA staff30,31) and $7.6 billion in net pay annually.32
Throughout this report, we refer to staffing of “service lines.” VHA service lines (sometimes shortened to “services”) are multidisciplinary clinical care organizations, and may be organized around a patient population (e.g., Homeless Veterans Treatment Program), an occupation (e.g., Nursing), or a function (e.g., Rehabilitation Services). Consistent with VHA, the terms “service line” and “service” are used interchangeably to refer to programs, occupations, and functions. Service lines function much like departments at many private sector hospitals, though they may refer to patient populations or occupations, rather than just functions, which is typically seen in the private sector. We therefore refer at various points to “service line staffing methodologies,” as well as, national and local “service line chiefs” who may lead specific programs, occupations, or functions at the VAMC or VHACO levels.
In keeping with standard industry approaches to staffing, we have examined four main aspects of staffing: (1) core staffing (i.e., resource management); (2) scheduling; (3) flexing (i.e., changes in staffing to meet variation in demand); and (4) supporting infrastructure. Figure 5.1, below, illustrates the linkages between these key areas and the main components of each. These components represent the primary focus areas, driven by findings from site visits and analyses, and are not exhaustive. See Table A-1 in Appendix A.2 for major differences in policies and practices for each of the core components by clinical occupation. Further information on staff productivity, a related concept, is included in Assessment G.
29 Based on VHA Healthcare Talent Management (HTM) FTE data for FY14. Includes all staff in a given occupation at
Level 1a, 1b, 1c, and 2 complexity VAMCs, as information was not available on the split between inpatient and outpatient FTE or work hours for each occupation. Occupations included: physicians (occupation code 0602), physician’s assistants (0603), nurse anesthetists (0605), nurses (0610), practical nurses (0620), nursing assistants (0621), psychologists (0180), social workers (0185), physical therapists (0633), occupational therapists (0631), kinesiotherapists (0635), rehabilitation therapy assistants (0636), speech pathologists and audiologists (0665), registered respiratory therapists (0601), certified respiratory therapists (0640), dietitians and nutritionists (0630), orthotists and prosthetists (0667), pharmacists (0660), and pharmacy technicians (0661). Ancillary support (e.g., environmental services) and administrative roles (e.g., bed management) are examined insofar as they affect staffing of clinical occupations.
30 Total VHA 2014 reported medical care FTEs = 278,249 FTEs (VA, 2015, VHA-26). 31 Other staff include Level 3 complexity VAMC staff in the categories referenced above, VAMC clinical staff working
only or primarily in the outpatient setting (e.g., dentists), VAMC non-clinical staff (e.g., administrative staff), staff at non-VAMC facilities (e.g., CBOCs, distribution centers), VHA Central Office (VHACO), and VA Central Office (VACO) staff.
32 Based on VHA Support Service Center (VSSC), Paid Accounting Integrated Data (PAID) FY14 payroll data. Does not include benefits. Net pay = gross pay – deductions.
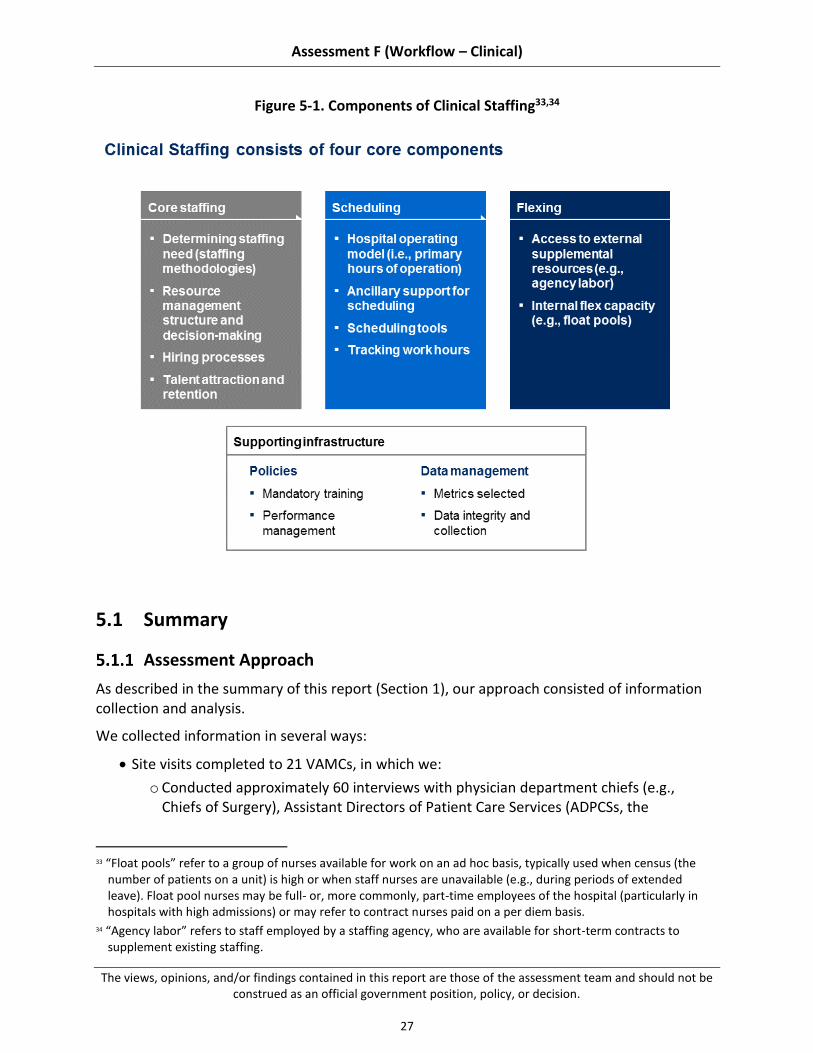
Assessment F (Workflow – Clinical)
The views, opinions, and/or findings contained in this report are those of the assessment team and should not be construed as an official government position, policy, or decision.
27
Figure 5-1. Components of Clinical Staffing33,34
5.1 Summary
Assessment Approach
As described in the summary of this report (Section 1), our approach consisted of information collection and analysis.
We collected information in several ways:
Site visits completed to 21 VAMCs, in which we:
o Conducted approximately 60 interviews with physician department chiefs (e.g., Chiefs of Surgery), Assistant Directors of Patient Care Services (ADPCSs, the
33 “Float pools” refer to a group of nurses available for work on an ad hoc basis, typically used when census (the
number of patients on a unit) is high or when staff nurses are unavailable (e.g., during periods of extended leave). Float pool nurses may be full- or, more commonly, part-time employees of the hospital (particularly in hospitals with high admissions) or may refer to contract nurses paid on a per diem basis.
34 “Agency labor” refers to staff employed by a staffing agency, who are available for short-term contracts to supplement existing staffing.

Assessment F (Workflow – Clinical)
The views, opinions, and/or findings contained in this report are those of the assessment team and should not be construed as an official government position, policy, or decision.
28
equivalent of Chief Nursing Officers at VAMCs), and Allied Health Professional (AHP) chiefs of service lines (e.g., Chief of Physical Medicine and Rehab [PM&R])
o Facilitated 19 workshops on staffing with front-line personnel from various clinical occupations35
Data call sent to leadership of clinical service lines to gather staffing data that is not consistently maintained at the national level (e.g., annual work hours by role, department, and shift), completed by 55 of the 121 Level 1 and 2 complexity VAMCs (~45 percent)36
Analysis of data gathered from national systems, including national Healthcare Talent Management and payroll data37
Interviews on staffing with over 10 VACO and VHACO medical, HR, contracting, and training and education subject matter experts
Having collected information to understand current VHA staffing practices, we then analyzed the effectiveness of these practices by comparing them against benchmarks. Where quantitative benchmarks are used (e.g., overtime usage), we have attempted to identify best practices (e.g., ideal overtime usage) where these are published by professional associations, have consensus in the literature, or are found in high performing VAMCs and/or private sector hospitals (both typical private sector hospitals and high-performing private sector hospitals, as identified through their performance in national lists such as NDNQI rankings). Where there is no such clarity as to the best practice, we have used survey data published by professional associations and profiles of typical private sector hospitals to establish standard practices (e.g., average overtime usage across U.S. private sector hospitals). We have noted in figures or footnotes whether figures cited are considered best practice or industry standard practice.
Our ability to effectively benchmark VHA practices was, in many instances, hampered by lack of VHA data. For example, VHACO does not have ready access to each VAMC’s staffing levels by unit or shift, precluding an analysis of skill mix and reduction in staffing on evenings and weekends (“downshifting”) by unit type.38 Given that clinical staffing needs vary considerably by type of unit (e.g., ICUs require a higher concentration of RN labor than Med/Surg floors), data access was a significant impediment to our ability to assess VHA staffing practices. VHA data management is inferior to that seen in the private sector, and likely affects VHA’s own ability to effectively make clinical staffing decisions and monitor staffing levels at the local, regional, and national levels.
35 Participants’ roles varied from site to site. Typical participants included nurses, charge nurses, nurse managers,
case managers and social workers, quality management and utilization management staff, medical support assistants, physical therapists, occupational therapists, pharmacists, and physicians. Two sites did not have workshops due to scheduling conflicts.
36 Total VAMC count depends on whether campuses of the same parent station are counted as separate VAMCs or one entity. We have based the count used in our site selection (122) on data drawn from VSSC, 2014 and SAIL, 2014 (see Appendix). In some instances, we use 121 as the denominator, based on data available in the data sets most commonly used for that section.
37 From VHA HTM and VHA VSSC 38 VHA data stewards estimated 6 to 12 months to pull this data, using a labor mapping technique.

Assessment F (Workflow – Clinical)
The views, opinions, and/or findings contained in this report are those of the assessment team and should not be construed as an official government position, policy, or decision.
29
Summary of Findings
We observed several key challenges, and a few points of strength, within VHA clinical staffing. These findings apply to VHA organization, processes, and tools; a detailed mapping to the organization, processes, and tools framework is available in Appendix A.3.
5.2.1 VHA does not have the tools or data to set or monitor staffing levels appropriately. The lack of methodologies for estimating staffing needs for many services means VHA does not consistently know to what level it should be staffing, while poor data management means that VHA does not always know its staffing levels.
5.2.2 Hiring timeline significantly exceeds private sector benchmarks, affecting ability to fill vacancies. The issue of hiring timelines was a consistent complaint in interviews and staffing workshops – a challenge which is likely due to a combination of complex regulations and inefficient processing – though lack of data impeded a conclusive analysis of causes.
5.2.3 Allocation of staff does not consistently match patient care needs. Data call results and site visits indicate that staffing on weekend, holiday, evening, and night (WHEN) hours may be insufficient, and that access to flex labor is limited.
Summary of Recommendations
Our assessment revealed several areas where VHA can build on current strengths or address existing challenges to improve clinical staffing. We recommend that VHA consider three strategic themes, as detailed below. As with the findings, these themes apply to VHA organization, processes, and tools.
5.3.1 Increase transparency of staffing by providing evidence-based staffing methodologies for all clinical staff and improving data management. VHA should develop methodologies and tools that allow facilities to estimate how many FTEs they need and monitor staffing levels on an ongoing basis.
5.3.2 Increase timeliness of hiring to patient care teams. VHA should accelerate its hiring timeline by streamlining requirements, holding HR staff more accountable for efficiency, and giving facilities the financial flexibility they need to attract talented candidates.
5.3.3 Allocate staff to match patient care needs. Once staff are hired to the facility, VHA needs to ensure it is allocating them to match patient care needs – this means relaxing required positions and regulations that prevent VAMCs from deciding when and where to allocate staff – and shifting expectations for hospital operating models from a clinic hours model to truly 24/7 staffing.
Implementing these changes would likely have multiple positive effects, many of which cannot be easily quantified or clearly attributed to staffing changes alone (particularly given limitations with available HR data). However, we have estimated the potential effects of two aspects of our recommendations, described in Section 5.3.5:
Assessment F (Workflow – Clinical)
The views, opinions, and/or findings contained in this report are those of the assessment team and should not be construed as an official government position, policy, or decision.
30
Potential savings from reduced overtime
Possible reduced hiring timeline from streamlined credentialing and boarding
Past Findings and Recommendations
Previous reports have also assessed staffing practices at VA. Many of these reports have identified findings similar to the ones we observed, and suggested changes similar to our recommendations. For example, past reports have noted the lack of reliable staffing data (VA OIG, 2012) and the length of the hiring process (VA OIG, 2004 and 2009; GAO, 2014). See Appendix A.4 for illustrative examples of past reports’ findings and recommendations. Note that these examples illustrate the type of factors identified in recent years, and are not intended to be a comprehensive listing.
These past assessments have tended to focus on specific issue areas and/or individual facilities, separately developing recommendations for improvement in discrete areas. In contrast, our assessment tries to take an end-to-end view of inpatient clinical operations across five key sub-assessment areas and all high- and medium-complexity VAMCs.
5.2 Findings
We have synthesized observations from site visits and data analysis into three primary findings, listed below. The sub-sections that follow (5.3.1, 5.3.2, and 5.3.4) describe these findings in detail, including information on what we believe to be the drivers of each finding.
5.2.1 VHA does not have the tools or data to set or monitor staffing levels appropriately
5.2.2 Hiring timeline significantly exceeds private sector benchmarks, affecting ability to fill vacancies
5.2.3 Allocation of staff does not consistently match patient care need
As noted in Section 5.1.1, data issues prevented us from conclusively assessing many areas of clinical staffing. We have used the national datasets that were available, information returned as part of the data call, and perceptions and experience reported or observed during site visits or via the staff survey. In many instances where data does not allow us to definitively comment, we have described the potential implications of the data points we do have, along with recommendations in Section 5.3 for further analysis.
VHA Does not Have the Tools or Data to Set or Monitor Staffing Levels Appropriately
Site visit interviewees and workshop participants often reported that their service lines were understaffed: about two-thirds of physician department chiefs, ADPCSs, and AHP leaders interviewed believed that staffing for their services was too low.39 VHA does not have clear definitions of what appropriate staffing levels are for most service lines, however, and staffing
39 Physician department chief N=19, ADPCS N=19, AHP leader N=21.

Assessment F (Workflow – Clinical)
The views, opinions, and/or findings contained in this report are those of the assessment team and should not be construed as an official government position, policy, or decision.
31
data is poor. Staffing levels are likely a mix of appropriate, too low, and excessive at different facilities for different occupations, but service line leaders do not have data on whether this is the case. Better information and clear staffing methodologies are needed so that leaders and staff can use a fact-driven approach to staffing based on best practice within and beyond VHA.
In particular, we find four key drivers affecting VHA’s ability to set staffing levels appropriately, described in this section:
5.2.1.1 The nursing service has developed a comprehensive, evidence-based staffing methodology, though other occupations lack clear guidance on assessing staffing need
5.2.1.2 Some facilities manage data well locally; however, VHA as a whole does not consistently capture and track data needed to assess the appropriateness of staffing
5.2.1.3 Resource management is siloed by service line, resulting in inconsistent decision-making that does not always match needs
5.2.1.4 Local resource management decision-making does not always reflect national service line staffing guidance
5.2.1.1 The Nursing Service has Developed a Comprehensive, Evidence-Based Staffing Methodology, Though Other Occupations Lack Clear Guidance on Assessing Staffing Need
In 2010, the Office of Nursing Services (ONS) released a national staffing methodology for nursing roles (VHA Directive 2010-034). This methodology draws upon academic literature and private sector industry benchmarks, and includes both an FTE calculator and guidance on the process for developing and vetting FTE requests (see case study in this section). The methodology has been well-received by local nursing services, though there have been challenges with implementation and approval processes (see Section 3.2.2).
Outside of nursing, staffing guidance is limited. Many clinical services provide no national guidance on how to set staffing levels (Table 5-1). Many other services have released national staffing directives, but these consist of minimum staffing and coverage levels, without a methodology to estimate FTEs required to deliver those levels (e.g., if the emergency department requires a particular level of on-call mental health support, what implications does that have for mental health staffing?).

Assessment F (Workflow – Clinical)
The views, opinions, and/or findings contained in this report are those of the assessment team and should not be construed as an official government position, policy, or decision.
32
Table 5-1. Staffing Guidance Issued by National Leadership for key Clinical Service Lines
National staffing guidance
Description
FTE calculator and process guidance
Nursing40 (includes assistant nurse managers,41 charge nurses, clinical nurse leaders, RNs, graduate nurses,42 LPNs/LVNs, NAs, and patient care health technicians)43
Minimum staffing and coverage levels
Emergency medicine (includes ED physicians, NPs, PAs, nursing staff, health care technicians,44 paramedics,45 patient support assistants (PSAs),46 pharmacists,47 clerical staff,48 social workers, and on-call mental health providers49)50
Ophthalmology51 (includes ophthalmologists, optometrists, and other eye care professionals, as well as required availability of prosthetics, laboratory, radiology, and other diagnostics and imaging)52
Pharmacy53
Radiology54 (includes radiologists and technologists)
40 Nursing coverage also included in other services’ staffing directives, e.g., emergency medicine (VHA Directive
2010-010) and surgical services (VHA Directive 2010-018). 41 While performing patient care 42 Not yet licensed, who have completed unit orientation 43 Nurse staffing directive (VHA Directive 2010-034) explicitly excludes nurse managers, assistant nurse managers
while performing administrative duties, advanced practice nurses (NPs and CNSs), unit secretaries/unit clerks, monitor technicians, one-to-one (1:1) sitters, escorts, students who are fulfilling educational requirements, and therapy assistants.
44 No specific target; mentioned as one of a group of “important supportive roles in the ED…The use of such additional staff is supported and encouraged” (VHA Directive 2010-010, 4)
45 Ibid. 46 Ibid. 47 Ibid. 48 Ibid. 49 May be provided by psychiatrists, psychologists, social workers, physician assistants, advanced practice nurses,
psychiatric residents, and psychology post-doctoral fellows 50 Staffing levels are provided for each occupation, without guidance on recommendation ratios between
occupations. 51 VHA Handbook 1121.01 52 Staffing levels are provided for each occupation, without guidance on recommendation ratios between
occupations. 53 Minimum coverage to support surgical services included in surgical infrastructure directive (VHA Directive 2010-
018), reference also made to pharmacists as “important supportive roles in the ED” made in the emergency medicine staffing directive (VHA Directive 2010-010, 4).
54 Minimum coverage to support surgical services also included in surgical infrastructure directive (VHA Directive 2010-018). Availability required to support ophthalmology (VHA Handbook 1121.01). Staffing levels are provided for each occupation, without guidance on recommendation ratios between occupations.

Assessment F (Workflow – Clinical)
The views, opinions, and/or findings contained in this report are those of the assessment team and should not be construed as an official government position, policy, or decision.
33
National staffing guidance
Description
Surgery (includes surgeons, CRNAs or other LIPs, surgical assistants, RNs, surgical technicians, anesthetists, and supporting services and diagnostics)55
No guidance Advanced practitioners (NPs, PAs, CNSs, and CRNAs) outside of emergency medicine56
All physician specialties other than emergency medicine, radiology, ophthalmology, and surgery57
Dietary and nutrition services
Hospitalist medicine
Inpatient mental health58
Occupational therapy
Physical medicine and rehabilitation59
Respiratory therapy60
Social work61
Speech pathology and audiology
Lack of staffing guidance and limited staffing guidance create three challenges: (1) service lines without staffing guidance use inconsistent practices based on outpatient staffing practices; (2) service lines with guidance on minimum levels struggle to estimate need above the minimum; and (3) service lines with guidance on minimum coverage struggle to estimate FTEs needed for coverage.
55 Including respiratory care, pharmacy, blood bank, physical therapy, SPD (supply, processing, and distribution),
and availability of EKG, basic laboratory, basic radiology, cardiac stress testing, pulmonary function test, CT scan, vascular ultrasound, radiology interpretation, interventional cardiology, vascular and non-vascular interventional radiology, pre-operative risk assessment and post-operative consultation and services, PACU care, ICU care, pathology, dialysis, biomedical engineering
56 Minimum anesthesiology coverage by an advanced practitioner to support surgical services included in surgical infrastructure directive (VHA Directive 2010-018).
57 Minimum coverage by specialty consultants (anesthesiology, cardiology, pulmonary, gastroenterology, hematology, infectious disease, interventional radiology, nephrology, neurology, orthopedic surgery, pathology, thoracic surgery, urology, vascular surgery) to support surgical services included in surgical infrastructure directive (VHA Directive 2010-018).
58 Minimum coverage to support emergency medicine included in emergency medicine staffing directive (VHA Directive 2010-010).
59 Minimum coverage to support surgical services included in surgical infrastructure directive (VHA Directive 2010-018).
60 Ibid. 61 Minimum coverage to support emergency medicine included in emergency medicine staffing directive (VHA
Directive 2010-010).

Assessment F (Workflow – Clinical)
The views, opinions, and/or findings contained in this report are those of the assessment team and should not be construed as an official government position, policy, or decision.
34
Service lines without staffing guidance use inconsistent practices based on outpatient staffing practices. Unsurprisingly, clinical occupations without comprehensive national staffing directives show variation in the data and processes used to estimate staffing need. For example, AHP leaders interviewed reported using a wide range of different metrics, varying from site to site: productivity (used by 76 percent of AHP leaders), historical census (52 percent), community standards (10 percent),62 and length-of-stay (5 percent), among other factors.63 Over half of AHP leaders and physician department chiefs interviewed reported that staffing was conducted on an entirely ad hoc basis, with no regular reviews.64 OIG has reported several times over the past decade on the need to develop staffing methodologies for clinical service lines (VA OIG 2015, 2012, 2009, 2006, 2006, 2004, and 2004b). In the absence of clear methodologies, many facilities rely primarily on productivity comparisons, largely based on encounters, to justify requests for additional staff. These metrics have two key limitations:
(a) Measuring patient care productivity primarily based on encounters tends to be a more accurate means of capturing outpatient rather than inpatient workload. Inpatient providers and licensed independent practitioners (LIPs) tend to have duties related to patient care that occur outside of the visit: e.g., a hospitalist coordinating with specialists on consults.
(b) Given issues with data integrity, comparing productivity against other VAMCs likely results in highly skewed perceptions of facilities’ relative productivity. Interviewees suggested that interpretations of codes for time outside of direct patient care (e.g., administrative time) varies considerably from site-to-site, making comparisons to other sites highly unreliable.
The academic literature tends to measure adequacy of physician staffing levels through physician-to-patient ratios (Epané and Weech-Maldonado, 2015; Ward et al., 2013; Phoenix Physicians, 2011; Collins, 2009; and Pronovost et al., 2002).65 Suggested ratios or hours targets (e.g., physical therapist hours per patient bed-day) would likely prove more helpful to VAMCs as a staffing tool than productivity targets (see Section 5.3.1, Recommendations). See Assessment G for additional detail on workload measurement.
Service lines with guidance on minimum levels struggle to estimate need above the minimum. Several service lines provide guidance on an absolute minimum number of providers needed, based on which services are provided at the facility. This makes it very difficult for large facilities to estimate whether they need
62 For example, comparison against staffing at other VAMCs of the same complexity level 63 N=21. These metrics are not mutually exclusive – many AHP leaders used several of the metrics listed, among
others. 64 AHP leader N=20; physician department chief N=20. 65 List is intended to illustrate key studies using staffing ratios to evaluate the adequacy of physician staffing. This
list is not exhaustive.
Assessment F (Workflow – Clinical)
The views, opinions, and/or findings contained in this report are those of the assessment team and should not be construed as an official government position, policy, or decision.
35
additional providers above the minimum. Surgical services provides an example: under the surgical infrastructure directive, facilities must have at least two general surgeon FTEs to be designated as intermediate surgical complexity (VHA, 2010). Intermediate complexity VAMCs66 range considerably in annual surgical admissions, however, meaning that two facilities with the same complexity but different numbers of admissions can have very different coverage levels and still meet minimum staffing level requirements. For example, both Cheyenne and Providence are intermediate complexity facilities with two general surgeon FTEs on staff, though Cheyenne has 160 surgical admissions each year and Providence has 466.67 This results in ratios of general surgeons to surgical admissions of ~80:1 and ~238:1. Providing absolute minimums creates the potential for significantly different coverage at facilities ostensibly delivering the same services. Service lines with guidance on minimum coverage struggle to estimate FTEs needed for coverage. Many services stipulate that a particular provider or service be available for a certain period of time or at a loosely defined level of accessibility. For example, the emergency medicine staffing directive requires that complexity Level 1a facilities have: …mental health coverage, at a minimum…on-site (based in the ED) from 7:00 am to 11:00 pm…mental health providers covering on-site…may participate in activities throughout the medical facilities; however, they must not undertake any…activities that would prevent them from coming immediately to the ED if called (VHA, 2010) This guidance provides facilities with considerable scope for interpretation on a daily basis. For example, how much capacity does a mental health provider need to set aside in order to be truly available to the ED during a given shift? Does this time need to be in set blocks between patient appointments, or should it be a more informal allocation? Provider coverage should reflect the patient population and provider caseload; minimum coverage targets are inflexible and not a true proxy for these factors. Additionally, coverage requirements do not easily translate into justification for an FTE request. Without a methodology to estimate FTEs required to meet coverage requirements, facilities may struggle to demonstrate a need for an additional provider.
In interviews, physician department chiefs and AHP leaders interviewed rarely perceived staffing practices for their occupations as highly effective, perhaps reflecting the lack of clear guidance for their services.68 By contrast, over half of ADPCSs saw the nurse staffing
66 Assuming that facilities with intermediate surgical complexity are also Level 2 complexity overall 67 VHA National Surgery Office data, FY15Q1-FY14Q2 68 “Effectiveness” was defined as the ability to use the staffing methodology to develop staffing requests matching
perceived staffing need – that is, whether existing processes or tools allow services to accurately estimate FTE requirements.” Physician department chief N=19, AHP leader N=21.
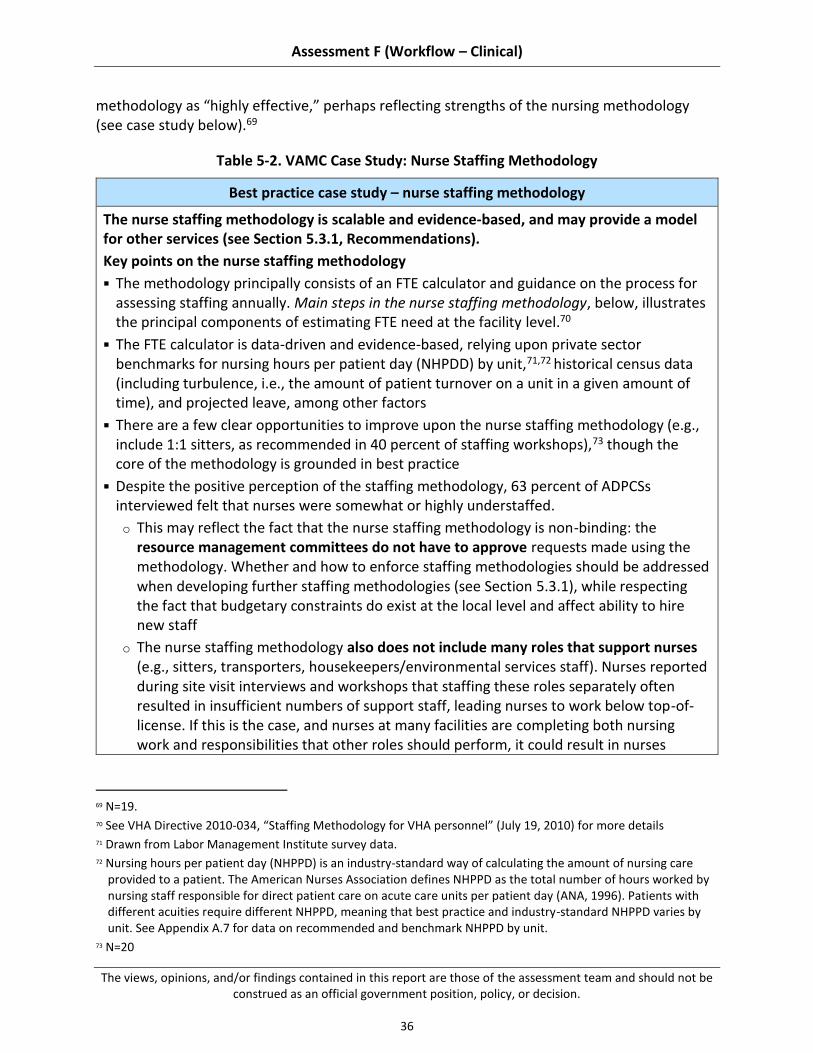
Assessment F (Workflow – Clinical)
The views, opinions, and/or findings contained in this report are those of the assessment team and should not be construed as an official government position, policy, or decision.
36
methodology as “highly effective,” perhaps reflecting strengths of the nursing methodology (see case study below).69
Table 5-2. VAMC Case Study: Nurse Staffing Methodology
Best practice case study – nurse staffing methodology
The nurse staffing methodology is scalable and evidence-based, and may provide a model for other services (see Section 5.3.1, Recommendations).
Key points on the nurse staffing methodology
The methodology principally consists of an FTE calculator and guidance on the process for assessing staffing annually. Main steps in the nurse staffing methodology, below, illustrates the principal components of estimating FTE need at the facility level.70
The FTE calculator is data-driven and evidence-based, relying upon private sector benchmarks for nursing hours per patient day (NHPDD) by unit,71,72 historical census data (including turbulence, i.e., the amount of patient turnover on a unit in a given amount of time), and projected leave, among other factors
There are a few clear opportunities to improve upon the nurse staffing methodology (e.g., include 1:1 sitters, as recommended in 40 percent of staffing workshops),73 though the core of the methodology is grounded in best practice
Despite the positive perception of the staffing methodology, 63 percent of ADPCSs interviewed felt that nurses were somewhat or highly understaffed.
o This may reflect the fact that the nurse staffing methodology is non-binding: the resource management committees do not have to approve requests made using the methodology. Whether and how to enforce staffing methodologies should be addressed when developing further staffing methodologies (see Section 5.3.1), while respecting the fact that budgetary constraints do exist at the local level and affect ability to hire new staff
o The nurse staffing methodology also does not include many roles that support nurses (e.g., sitters, transporters, housekeepers/environmental services staff). Nurses reported during site visit interviews and workshops that staffing these roles separately often resulted in insufficient numbers of support staff, leading nurses to work below top-of-license. If this is the case, and nurses at many facilities are completing both nursing work and responsibilities that other roles should perform, it could result in nurses
69 N=19. 70 See VHA Directive 2010-034, “Staffing Methodology for VHA personnel” (July 19, 2010) for more details 71 Drawn from Labor Management Institute survey data. 72 Nursing hours per patient day (NHPPD) is an industry-standard way of calculating the amount of nursing care
provided to a patient. The American Nurses Association defines NHPPD as the total number of hours worked by nursing staff responsible for direct patient care on acute care units per patient day (ANA, 1996). Patients with different acuities require different NHPPD, meaning that best practice and industry-standard NHPPD varies by unit. See Appendix A.7 for data on recommended and benchmark NHPPD by unit.
73 N=20
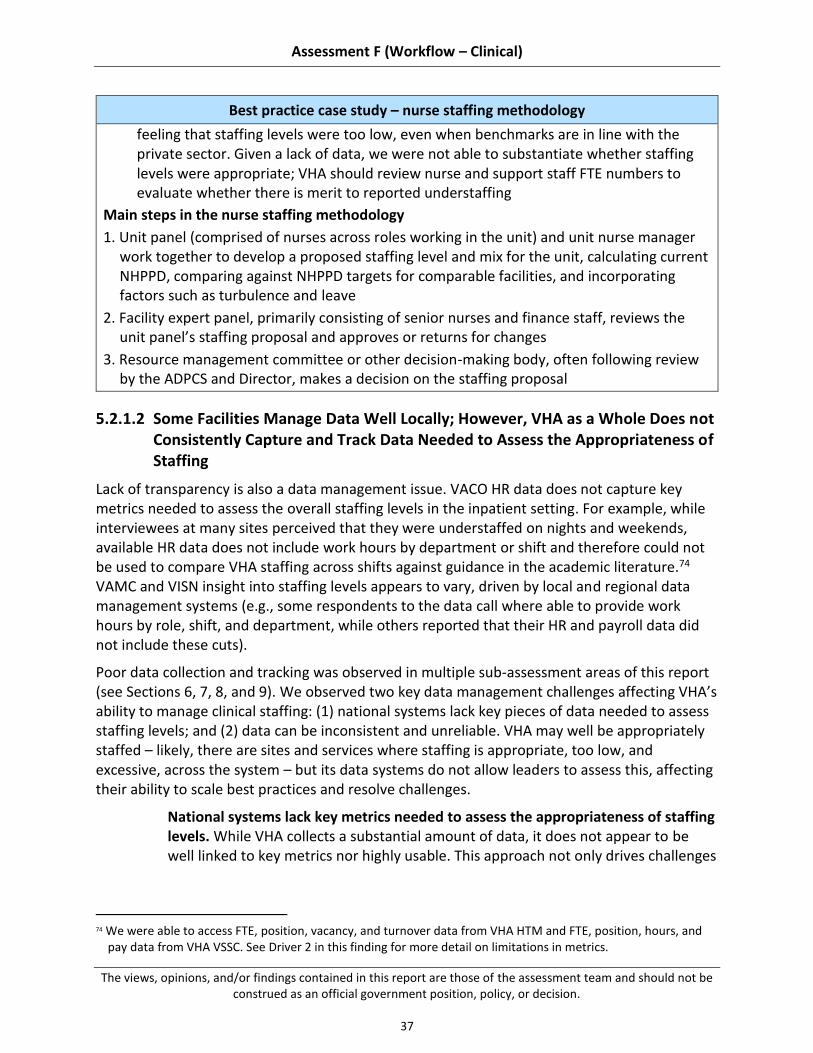
Assessment F (Workflow – Clinical)
The views, opinions, and/or findings contained in this report are those of the assessment team and should not be construed as an official government position, policy, or decision.
37
Best practice case study – nurse staffing methodology
feeling that staffing levels were too low, even when benchmarks are in line with the private sector. Given a lack of data, we were not able to substantiate whether staffing levels were appropriate; VHA should review nurse and support staff FTE numbers to evaluate whether there is merit to reported understaffing
Main steps in the nurse staffing methodology
1. Unit panel (comprised of nurses across roles working in the unit) and unit nurse manager work together to develop a proposed staffing level and mix for the unit, calculating current NHPPD, comparing against NHPPD targets for comparable facilities, and incorporating factors such as turbulence and leave
2. Facility expert panel, primarily consisting of senior nurses and finance staff, reviews the unit panel’s staffing proposal and approves or returns for changes
3. Resource management committee or other decision-making body, often following review by the ADPCS and Director, makes a decision on the staffing proposal
5.2.1.2 Some Facilities Manage Data Well Locally; However, VHA as a Whole Does not Consistently Capture and Track Data Needed to Assess the Appropriateness of Staffing
Lack of transparency is also a data management issue. VACO HR data does not capture key metrics needed to assess the overall staffing levels in the inpatient setting. For example, while interviewees at many sites perceived that they were understaffed on nights and weekends, available HR data does not include work hours by department or shift and therefore could not be used to compare VHA staffing across shifts against guidance in the academic literature.74 VAMC and VISN insight into staffing levels appears to vary, driven by local and regional data management systems (e.g., some respondents to the data call where able to provide work hours by role, shift, and department, while others reported that their HR and payroll data did not include these cuts).
Poor data collection and tracking was observed in multiple sub-assessment areas of this report (see Sections 6, 7, 8, and 9). We observed two key data management challenges affecting VHA’s ability to manage clinical staffing: (1) national systems lack key pieces of data needed to assess staffing levels; and (2) data can be inconsistent and unreliable. VHA may well be appropriately staffed – likely, there are sites and services where staffing is appropriate, too low, and excessive, across the system – but its data systems do not allow leaders to assess this, affecting their ability to scale best practices and resolve challenges.
National systems lack key metrics needed to assess the appropriateness of staffing levels. While VHA collects a substantial amount of data, it does not appear to be well linked to key metrics nor highly usable. This approach not only drives challenges
74 We were able to access FTE, position, vacancy, and turnover data from VHA HTM and FTE, position, hours, and
pay data from VHA VSSC. See Driver 2 in this finding for more detail on limitations in metrics.

Assessment F (Workflow – Clinical)
The views, opinions, and/or findings contained in this report are those of the assessment team and should not be construed as an official government position, policy, or decision.
38
for monitoring and evaluation, but should also be re-assessed for its impact on staff productivity. Key examples:
(a) Vacancy rates measure the distance between approved and filled positions, with no information provided on positions requested or recommended by existing staffing methodologies. This creates an inaccurate picture of the size of staffing need, as facilities may not have approved positions that are needed to deliver patient care at an optimal level, given the limitations of existing staffing methodologies for many service lines (see Section 5.2.1.1). At best, this data challenge means that vacancy rates are not useful metrics; at worst, current measurements give leaders a misleading understanding of staffing need, implying that vacancies are low for a given occupation and should therefore not be a priority, when the staffing methodology (for service lines where staffing methodologies do exist) may actually suggest significantly higher staffing levels are needed. VA should track requested positions, budgeted positions, and filled positions to increase transparency (see Section 5.3.1).
(b) FTE, hours, and payroll data is measured by occupation and VAMC, but not by department or outpatient versus inpatient setting.75 Appropriate staffing levels vary considerably by department (e.g., ICUs typically staff a 1:1 or 1:2 ratio of RNs to patients, compared to ~1:5 on med/surg floors [Labor Management Institute, 2014]). VHA HR data does not indicate the distribution of occupations to different departments, meaning VISN and VHACO management have no way of knowing whether VAMC departments are appropriately staffed.
(c) Hours data is not available by shift, though pay data is.76 This, coupled with the lack of data at the department level, means that VHA has no way of using HR data to evaluate whether WHEN hours staffing is adequate (as appropriate WHEN staffing varies considerably by department, e.g., outpatient clinics compared to acute inpatient units). Studies have established that sufficient staffing on WHEN shifts is critical to ensuring patients have full and speedy recoveries (Wallace et al., 2012,77 Cavallazzi et al., 2010; Ananthakrishnan et al.,
75 The team was able to access FTE, position, vacancy, and turnover data from VHA HTM and FTE, position, hours,
and pay data from VHA VSSC. 76 Ibid. 77 Wallace et al. find that night-time intensivist coverage reduces in-hospital mortality for facilities with a low-
intensity day-time intensivist staffing model (defined as optional consultation with an intensivist), and see no effect of nighttime coverage for facilities with high-intensity coverage. This finding corroborates other studies demonstrating positive effects of nighttime intensivist coverage in facilities with low-intensity day-time coverage (Blunt and Burchett, 2000) and no effects in facilities with high-intensity day-time coverage (Kerlin et al., 2013; Gajic et al., 2008).

Assessment F (Workflow – Clinical)
The views, opinions, and/or findings contained in this report are those of the assessment team and should not be construed as an official government position, policy, or decision.
39
2009; Aujesky et al., 2009; Shaheen et al., 2009; Peberdy et al., 2008;78 Brusco et al., 2007; and Kostis et al., 2007).79
Data can be inconsistent and unreliable. In addition to not collecting metrics needed to assess staffing, VHA also struggles to maintain data integrity. Comparing data available through national VHA data sets to responses submitted as part of our data call illustrates this challenge. For example, the VHA Paid Accounting Integrated Data [PAID] system indicates that one particular VAMC has 22 dietician and nutritionist FTEs in FY14, and the VHA Healthcare Talent Management Proclarity system provides a very similar figure of 23. Responding to our data call, however, this VAMC reported having 8.5 dietician and nutritionist FTEs, across the nutrition and food service line. The response rate to our data call on FTE information was low, and cannot be used to definitively assess discrepancies between national and local data sets. However, examples like this one do point to a significant potential challenge with respect to data integrity, which VHA should address in order to ensure transparency and visibility.
Table 5-3. VAMC Case Study: Local Data Management
Best practice case studies – local data management
Several VAMCs have invested in more robust data management at the local level, affording them greater insight into staffing levels and ability to manage them. This is in line with the Blueprint for Excellence which states that VHA will “advance value by measuring and supporting efficient clinical processes using industry-standard models of physician and staff productivity” (Blueprint for Excellence, 2014). These facilities provide a starting point for considering new national data management practices (see Section 5.3.1, Recommendations).
Selected examples:
The Fort Harrison, Montana VAMC has invested in AcuStaf, a scheduling and data tracking tool, and worked to integrate its functionalities with VHA information systems. Other visited facilities expressed that they had not been able to fully implement AcuStaf due to facility scheduling and payroll policies, or had found the data entry duplicative with existing VHA data collection requirements. Fort Harrison provides a model of effective implementation for other VAMCs.
The Palo Alto, California VAMC employs a statistician who, among other responsibilities, assists with monitoring and analyzing staffing data. Similar to many other facilities, Palo Alto produces morning staffing reports including census and personnel numbers. In addition, Palo Alto runs summary reports on staffing weekly, monthly, and quarterly by unit to ensure that
78 Studies cited found significant association between weekend admission, when staffing levels and mix decline,
and poorer outcomes. 79 Study found decreased LOS for patients who received Monday through Saturday physical therapy, as compared
to a control group receiving Monday through Friday therapy.

Assessment F (Workflow – Clinical)
The views, opinions, and/or findings contained in this report are those of the assessment team and should not be construed as an official government position, policy, or decision.
40
Best practice case studies – local data management
all leaders and staff have an accurate and current understanding of staffing levels and how they compare to targets.
5.2.1.3 Resource Management is Siloed by Service Line, Resulting in Inconsistent Decision-making That Does not Always Match Needs
VHA lacks transparency on staffing needs and levels, as described earlier in this section. Having developed staffing requests, however, decision-making on resource management can be highly inconsistent and problematic. In large part, this stems from VHA’s siloed organizational structure, a theme observed in other assessments (see Assessment L). Staffing decisions typically focus on single occupations, without considering the other occupations and services that support a given professional, even within a specific service line.
Clinical occupations are highly interrelated, with professionals relying on one another to provide clinical consults, continued care, and support enabling top-of-license practice. There is no definitive consensus in the literature or private industry as to whether health care organizations should staff along functional (e.g., surgery, internal medicine) or professional (e.g., physical therapy, nursing) lines (Hearld et al., 2008; West, 2001; and Snow and Hambrick, 1980). In either case, interdisciplinary collaboration on interdependent areas is critical to ensuring an appropriate staffing model. The academic literature has clearly established that interdisciplinary skill mix, driven by interdisciplinary collaboration on staffing, is critical to ensuring comprehensive, high-quality care for patients (Nancarrow et al., 201380). The Cleveland Clinic, a highly respected private sector hospital, emphasizes interdisciplinary collaboration on all key aspects of clinical operations; as the Director of its Center for Multidisciplinary Simulation, John Jelovsek, says, “When you get in the work environment, it’s more and more clear that the team causes the largest change in outcomes for patients” (quoted in Wood, 2012). Interviews with VHACO leadership and VAMC administration and staff suggest that VHA resource management is highly siloed by service line, with limited coordination at the national and local levels.
Siloing creates two key challenges: (1) national staffing guidance is not created in collaboration with related service lines; and (2) local staffing requests typically focus on individual occupations or professionals, not patient care teams. See Assessment L for additional findings on service line silos and recommended organizational changes that may help alleviate the challenges described below.
National staffing guidance is not created in collaboration with related service lines. Several service line chiefs interviewed reported that the level of collaboration
80 Nancarrow et al. conduct a comprehensive review of the existing academic literature on interdisciplinary
teamwork, finding 10 critical elements to effective collaboration: “positive leadership and management attributes; communication strategies and structures; personal rewards, training and development; appropriate resources and procedures; appropriate skill mix; supportive team climate; individual characteristics that support interdisciplinary team work; clarity of vision; quality and outcomes of care; and respecting and understanding roles” (Nancarrow et al., 2013, 11).

Assessment F (Workflow – Clinical)
The views, opinions, and/or findings contained in this report are those of the assessment team and should not be construed as an official government position, policy, or decision.
41
between their service and other related service lines on staffing was very low. As one VHACO service line chief said, “I’m not at all involved in developing other services’ solutions… I have no knowledge or awareness [of what staffing guidance they are developing].” The effect of silos at the national level is that policies are developed without significant input from other services that will be affected by new practices. For example, nursing and physician assistant service lines have reportedly not been involved in developing the staffing methodologies currently being created by specialty care services. Given how closely physicians, advanced practitioners, and nurses work together in the inpatient setting, changes in the staffing of one of these occupations has implications for the others, which might be overlooked without open Communication Local staffing requests typically focus on individual roles, not patient care teams. VAMCs typically approve staffing proposals through a resource management committee, comprised of senior hospital leaders tasked with making decisions on resource requests from all service lines. Resource management committees often require that service lines submitting requests attest to the fact that they developed their request in conjunction with related services, though several interviewees reported that this coordination rarely occurs in practice. As one Chief of PM&R described, “The goal of the resource management committee is to foster interdisciplinary communication, but it doesn't happen...as well as one might want.” While there does appear to be strong interdisciplinary coordination at some facilities (see case study in this section), a significant portion of VAMCs does not achieve integrated staffing requests across service lines. In 40 percent of staffing workshops conducted, participants cited limited coordination between service lines as a major challenge.81 Interviews conducted during site visits provide anecdotal evidence of limited coordination among service lines, with interviewees citing instances of:
(a) Transporters, environmental services, and sitters being rarely if ever staffed in conjunction with nurses, despite the interdependencies among these roles
(b) Orthopedic surgeons being hired without additional staffing of physical therapists or nurses to assist in recovery
(c) Physical therapists and occupational therapists being hired without additional staffing of ancillary staff (e.g., clerical support)
(d) Surgeons being hired without complementary staffing of OR technicians needed to support additional procedures
(e) Outpatient services being expanded, sometimes as a result of national directives, without increasing outpatient staff, resulting in inpatient and mixed staff covering outpatient services.
One impact of not staffing services together is the potential for understaffing of supporting roles. In 65 percent of staffing workshops, participants reported that limited ancillary support
81 N=20

Assessment F (Workflow – Clinical)
The views, opinions, and/or findings contained in this report are those of the assessment team and should not be construed as an official government position, policy, or decision.
42
coverage made it difficult for clinical staff to work at top-of-license.82 Low ancillary support staffing is also believed to affect patient flow and LOS (see Sections 6 and 7). A sizeable minority of physician department chiefs, ADPCSs, and AHP leaders cited making resource management more interdisciplinary as one of their top two priorities for improving core staffing: 19 percent, 29 percent, and 11 percent, respectively.83 This is line with the Blueprint for Excellence which states that “attention must be given to supporting physician practices with adequate non-physician staff for team-based and efficient care” (Blueprint for Excellence, 2014).
Table 5-4. VAMC Case Study: Interdisciplinary Staffing
Best practice case studies – interdisciplinary staffing
In contrast to the trend seen at many sites we visited, a few VAMCs have established the expectation that staffing occur in collaboration between services.
As an example,
The San Juan, Puerto Rico VAMC typically staffs by department, developing team-based staffing requests. As one service line chief said, “We work in conjunction with other services,” developing staffing requests in tandem. For example, internal medicine identified a need for additional PTs, OTs, and nurses for the ICU, and medicine, physical medicine and rehab, and the nursing service worked together to put together a consolidated staffing request.
5.2.1.4 Local Resource Management Decision-making Does not Always Reflect National Service Line Staffing Guidance
Interviewees at many sites suggested that local resource management committee decision-making does not always match national service line staffing guidance. In many cases this may be entirely appropriate: facility leaders face budgetary constraints and must consider trade-offs between many different expenditures, one of which is staffing. If a sizeable number of resource management committees is consistently not staffing to levels suggested by staffing methodologies, however, this either implies that methodologies are suggesting overly high staffing levels or that facilities lack the budgets they need to properly staff clinical care teams. Available data cannot be used to definitely prove either point. The finding that FTEs recommended by staffing methodologies are not always approved does, however, reinforce the finding that current staffing methodologies for many services do not allow facilities to appropriately assess staffing needs and generate consensus as to the need for FTEs.
The disconnect between resource management committee decision-making and national service line staffing guidance appears to be driven by the fact that: (1) evidence-based national staffing methodologies that do exist have no enforcement mechanisms; and (2) FTE ceilings limit potential staffing.
82 N=20 83 Physician department chief N=19, ADPCS N=18, AHP leader N=21
Assessment F (Workflow – Clinical)
The views, opinions, and/or findings contained in this report are those of the assessment team and should not be construed as an official government position, policy, or decision.
43
Several interviewees at the local and national levels suggested that resource management decision-making was highly relationship-driven. As one nursing leader described, “A lot [of whether staffing requests are approved] comes down to the relationship between the ADPCS and the Director.” This claim cannot be substantiated; but if it is an accurate characterization of decision-making at some facilities, it would be expected to affect the resource management challenges described below.
Evidence-based national staffing methodologies that do exist have no enforcement mechanisms. As noted in Section 5.2.1.1, not all service lines have staffing guidance. Several do, however. The nursing staffing methodology is the most robust, including NHPPD targets drawn from private sector benchmarks and an FTE calculator for estimating the number of FTEs needed to meet NHPPD targets. Several other services have recommended minimum coverage and staffing levels, reflecting service line leaders’ research into minimum staffing needed to safely deliver care. Though these methodologies are evidence-based, however, and typically provide guidance on minimum staffing needed to deliver care, they have no minimum implementation requirements:
(a) For the nursing service. The nursing staffing methodology does not recommend a single NHPPD target for each type of unit. Rather, facilities may choose to benchmark themselves against targets slightly above or below median private sector NHPPD targets, and we visited several facilities that benchmarked below private sector medians. Benchmarking below the median is highly likely to result in staffing targets that are below those seen as safe in the academic literature:
i. The academic literature has established a safe NHPPD of approximately nine for med/surg RNs, below which patient outcomes suffer (Aiken et al., 2003; Aiken et al., 2002; Needleman et al., 2002; Tourangeau et al., 2006; Kane et al., 2007a; Kane et al., 2007b). VHA takes its median NHPPD targets from the Labor Management Institute, which provides a median NHPPD for med/surg RNs of ~9.84 Given that private sector medians and the academic literature converge, benchmarking below median level necessarily produces NHPPD targets below what evidence establishes as safe.
ii. Facilities are also not required to approve requests made to meet NHPPD targets below the median. That facilities are not required to staff to estimates generated using the evidence-based nursing methodology may explain why the methodology itself is well-received (53 percent of ADPCSs described the methodology as highly effective85), but only about
84 The nurse staffing calculator uses data from the Labor Management Institute (LMI), which publishes NHPPD rates
based on its survey of hospitals across the U.S. The LMI reports that median direct NHPPD for med/surg RNs in surveyed private sector hospitals is ~9, and NHPPD in the second quartile ranges from 6.2-8.7.
85 ADPCS n=19. This is in contrast to 5% of physician department chiefs and 19% of AHP leaders. Physician department head n=19; AHP head n=21.

Assessment F (Workflow – Clinical)
The views, opinions, and/or findings contained in this report are those of the assessment team and should not be construed as an official government position, policy, or decision.
44
a third of ADPCSs believed that nurse staffing levels were adequate.86 As one ADPCS said, “The NHPPD figure would be right if we were staffed to it.”87
iii. Not staffing to recommended minimum levels has several potential effects: (1) Bed closures: 36 percent of respondents to our data call reported that they had previously closed beds due to insufficient staffing levels.88 (2) Not working to top-of-license: Site visit interviewees and workshop participants reported that nurses often completed tasks typically performed by support staff, due to low support staff levels. We could not corroborate this with existing data sets, but if this is true, it would imply that nursing hours spent on patient care are even lower than NHPPD data would suggest.
(b) For services with absolute minimum staffing and coverage levels. Minimums provided by several services are not mandatory, but are required in order to achieve complexity designations (e.g., emergency department versus urgent care clinic status, or standard, intermediate, or complex surgical complexity). However, as described in Section 5.2.1.1, guidance on minimum coverage levels does not always clearly translate into FTE recommendations, creating challenges in justifying staffing requests).
FTE ceilings limit potential staffing. Fifty-two percent of VAMCs we visited reported wanting greater flexibility and local autonomy on setting staffing numbers, including by eliminating or relaxing FTE caps and reducing nationally mandated positions. VHA sets salary ceilings at the national level (per annum ceilings set by the Under Secretary for Health89), which are then translated into FTE caps at the local level.90 Estimating and limiting annual spending on salary is a standard and necessary part of budgeting, and entirely appropriate for VHA to do. However, local FTE caps limit facilities’ ability to manage their own budget and make decisions on how and where to allocate staffing funding (e.g., hire two additional NPs or one physician, which may represent the same total salary payment but different FTE numbers).
86 37% of ADPCSs, n=19. This is similar to the rates for physician department chiefs (37%) and of AHP leaders (29%).
Physician department head n=19; AHP head n=21. 87 ADPCS interviewed during a site visit 88 N=113 89 See VA Handbook 5007, Part II, Chapter 2, p. II-6: “Per annum ceiling limitations shall be imposed by the Under
Secretary for Health on such pay and revised from time to time as necessary in the public interest for both patient care and treatment.”
90 See VA Handbook 5007, Part VI, Appendix J, p. VI-J-1: “Ceiling: The number of FTE (full-time employment equivalents) allocated for an occupation by local management officials.”
Assessment F (Workflow – Clinical)
The views, opinions, and/or findings contained in this report are those of the assessment team and should not be construed as an official government position, policy, or decision.
45
Hiring Timeline Significantly Exceeds Private Sector Benchmarks, Affecting Ability to Fill Vacancies
Participants in 100 percent of staffing workshops conducted during site visits cited the length of the hiring process as a critical core staffing challenge.91 Several past VA Inspector General (OIG) and Government Accountability Office (GAO) reports and the Blueprint for Excellence have also commented on this issue (for example, VA OIG, 2004 and 2009; GAO, 2014), suggesting it is a long-standing challenge.
Most interviewees and workshop participants claimed that hiring a new employee, from initiating the posting to the employee’s start date, typically lasts about six months for most clinical occupations. We were not able to access data showing the average hiring timeline, and therefore could not substantiate this claim. However, in interivews we were informed about VHA HR timeliness targets: HR aims to move from a request for a posting to a tentative offer in 60 days.92 This target does not include time to final offer, and is nonetheless still well beyond typical timelines in the private sector for many clinical occupations,93 as exemplified in Figure 5-2, below. Workshop participants suggest that HR is not meeting the 60-day timeliness target, but even if this target were consistently met, VHA hiring would still lag the private sector.
This delayed ability to hire has a significant effect on VHA’s ability to compete for the best clinical talent in the market and ensure that its hospitals consistently have enough staff. Assessment L also focuses on HR capabilities, and includes additional detail on this topic.
91 N=20 92 ADPCS interviewed during a site visit 93 Interviews with best practice private facilities suggest that particular physician specialties that are harder to
recruit for may take 6-12 months to hire for. Many other clinical staff may be hired in under two months, however (e.g., nurses, nursing assistants, many AHPs, health technicians)

Assessment F (Workflow – Clinical)
The views, opinions, and/or findings contained in this report are those of the assessment team and should not be construed as an official government position, policy, or decision.
46
Figure 5-2. VHA Hiring Timeline94
There may be systematic barriers within the public sector that result in longer hiring timelines; the disparity between VHA and private sector hiring timelines is substantial, however, and creates significant challenges. Interviewees and workshop participants claimed that delayed hiring processes contributed significantly to the length and number of vacancies. Candidates for many roles are often unwilling to wait roughly six months to be onboarded, especially when positions with other hospitals are readily available. VHA competes directly with the private sector for talent and the speed at which private sector hospitals can offer positions gives them a distinct competitive advantage in hiring. As Figure 5-3 shows, vacancy rates exceed private sector benchmarks for several clinical occupations. Even for occupations and facilities with relatively low vacancy rates, however, the impact of vacancies is likely exacerbated by delays in filling positions, which are reported as resulting in long-standing openings.
As Figure 5-4 shows, there is a considerable population of VAMCs with total vacancy rates for clinical occupations well above private sector benchmarks. Local variation exists in any system, public or private. Nearly half of VAMCs exceed benchmark vacancy rates, with nearly 30
94 VA hiring process flow based on interviews with VAMC clinical staff, VAMC HR staff, and VACO HR leaders.
Private sector hiring flow based on interviews with leading private hospitals

Assessment F (Workflow – Clinical)
The views, opinions, and/or findings contained in this report are those of the assessment team and should not be construed as an official government position, policy, or decision.
47
percent exceeding the high end of private sector benchmarks by 30 percent or more. This suggests that a substantial share of sites may be facing acute staffing challenges.
Figure 5-3. VHA Vacancy Rates vs. Private Sector Benchmarks
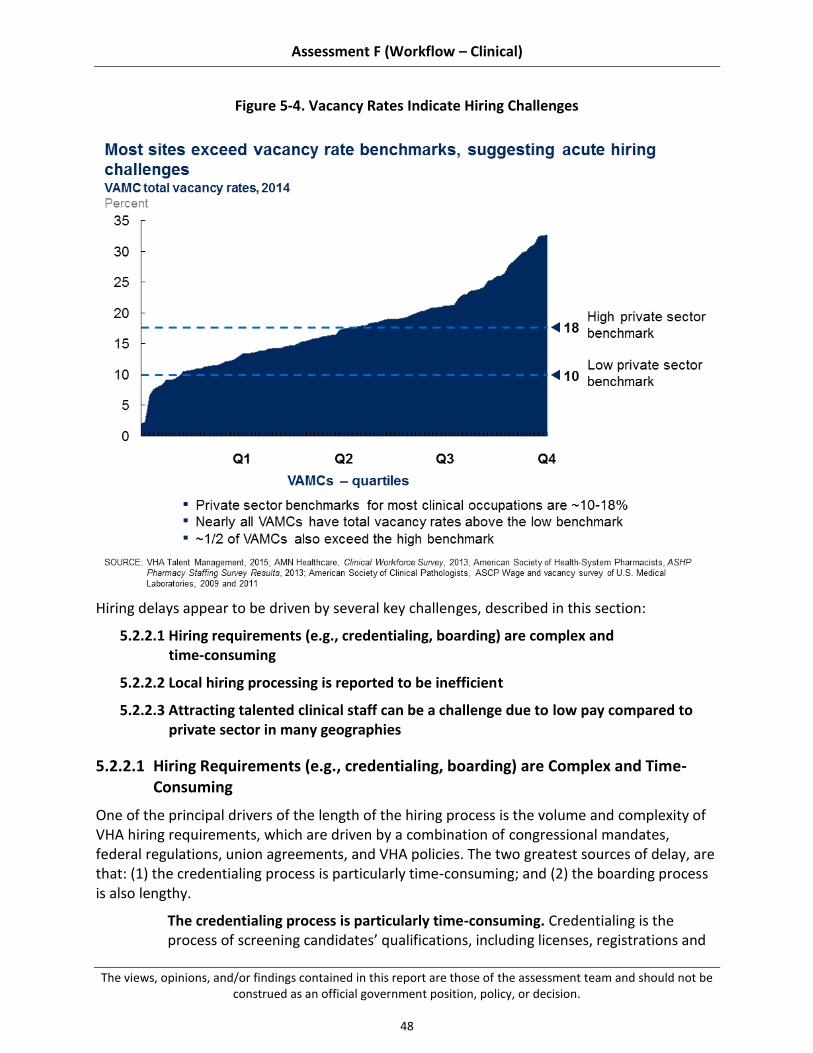
Assessment F (Workflow – Clinical)
The views, opinions, and/or findings contained in this report are those of the assessment team and should not be construed as an official government position, policy, or decision.
48
Figure 5-4. Vacancy Rates Indicate Hiring Challenges
Hiring delays appear to be driven by several key challenges, described in this section:
5.2.2.1 Hiring requirements (e.g., credentialing, boarding) are complex and time-consuming
5.2.2.2 Local hiring processing is reported to be inefficient
5.2.2.3 Attracting talented clinical staff can be a challenge due to low pay compared to private sector in many geographies
5.2.2.1 Hiring Requirements (e.g., credentialing, boarding) are Complex and Time-Consuming
One of the principal drivers of the length of the hiring process is the volume and complexity of VHA hiring requirements, which are driven by a combination of congressional mandates, federal regulations, union agreements, and VHA policies. The two greatest sources of delay, are that: (1) the credentialing process is particularly time-consuming; and (2) the boarding process is also lengthy.
The credentialing process is particularly time-consuming. Credentialing is the process of screening candidates’ qualifications, including licenses, registrations and

Assessment F (Workflow – Clinical)
The views, opinions, and/or findings contained in this report are those of the assessment team and should not be construed as an official government position, policy, or decision.
49
certifications, education, training, experience, current competencies, and health (see VHA Directive 1200, VHA Directive 2006-067, and VHA Handbook 1100.19). All hospitals must confirm that candidates’ licenses are valid and current. Where VHA credentialing differs from private hospitals’ credentialing processes, and becomes significantly more time-consuming, is in the volume of material that candidates must supply and that facilities must screen. Private sector facilities typically rely primarily on licenses and a candidate’s most recent reference(s) to assess their qualifications. The Joint Commission requires that organizations verify physician, LIP, and nurse licensure as part of their credentialing, but not transcripts or diplomas (Joint Commission, 2011a and 2011b). Many VAMCs require additional documentation. For example, job postings for OTs at many VAMCs95 require written documentation of having passed the National Board for Certification in Occupational Therapy (NBCOT) entry-level certification examination for OTs, in addition to a license to practice occupational therapy. This requirement is duplicative: obtaining a license in occupational therapy requires proof of having passed the NBCOT examination (American Occupational Therapy Association, 2015). VAMC staff that we interviewed reported that VAMCs also often require that candidates submit original transcripts, in addition to licenses, as well as references for extensive prior work experience. Assembling and then checking this information can be challenging and time-consuming, typically lasting several months for most candidates. VHA must ensure that its staff are qualified. However, the amount of substantiation currently required significantly exceeds industry standards. The boarding process is also lengthy. Boarding refers to the VAMC peer compensation panels that review a candidate’s qualifications and agree on their job offer, including compensation (see VHA Handbook 5007). This process can last up to 2 months, depending on how often the board meets and how easily it is able to agree on a compensation package. In contrast, while some private sector hospitals have compensation committees as well, these are usually only for physicians and LIPs, and typically compile packages in under 2 weeks.96 Furthermore, in many hospitals, managers and HR staff agree on compensation for clinical staff, without needing to go through a board at all.97,98
5.2.2.2 Local Hiring Processing is Reported to be Inefficient
Site visit interviewees and workshop participants also reported that local hiring processing was often inefficient, contributing to unnecessary delays in hiring. In particular: (1) facilities report inconsistent HR performance at the local level; (2) interviewees suggest that resource
95 Based on June, 2015 review of job postings for occupational therapy positions at the VAMCs in Richmond, VA; El
Paso, TX; Columbia, MO; Anchorage, AK; and Loma Linda, CA, posted online at VACareers.VA.gov 96 Based on interviews with best practice private sector hospitals 97 Ibid. 98 This is usually for staff other than physicians and LIPs.

Assessment F (Workflow – Clinical)
The views, opinions, and/or findings contained in this report are those of the assessment team and should not be construed as an official government position, policy, or decision.
50
management committees often do not backfill positions; and (3) VAMC staff report that hiring processes are not always completed in parallel. Delays in the receipt and incomplete nature of HR performance data, information on resource management committee decision-making, and/or information on clinical staff hiring processing inhibited our ability to corroborate these, and we have instead relied upon interviews. As a follow-on to this work, VHA should examine HR capabilities, resource management backfilling practices, and clinical staff hiring processing to ascertain whether and how these factors affect hiring timelines.
Facilities report inconsistent HR performance at the local level. Multiple leaders and front-line clinical staff interviewed during site visits cited poor local HR performance as a cause of delayed HR processing. One VAMC Chief of Mental Health characterized HR as a “black box,” claiming that simply getting approval from HR to post for a position could take up to seven months. A VAMC AHP leader described how "[HR] has delegated a lot of the work to the [clinical] services, for example, even scanning documents." Only 15 percent of workshop groups cited HR performance as a core staffing strength. Inconsistent HR performance may be due to understaffing (described below). It seems likely, however, that HR underperformance is often due to low performance standards and limited alignment on service levels. Interviewees suggest that resource management committees often do not backfill positions. Backfilling refers to the automatic approval of hiring to replace an existing position, without requiring re-justification of the position to the resource management committee. Interviewees and workshop participants at several sites claimed that their facilities had previously backfilled, but that budget concerns had led resource management committees to require justification of all positions, including ones previously approved. Ninety-five percent of sites reported that inability to backfill positions was a major core staffing challenge. Not backfilling means that the ~6-month hiring process cannot begin until staff members have vacated their positions, resulting in delayed hiring and loss of institutional knowledge, as incoming and outgoing staff do not overlap. VAMC staff report that hiring processes are not always completed in parallel. While VHA HR leaders reported that VHA regulations allow facilities to complete credentialing, privileging, and boarding concurrently with a candidate’s physical exam, drug test, and fingerprinting, several interviewees during site visits expressed their frustration that these processes were not completed in parallel, citing either national policy or union agreements as barriers. We were unable to corroborate claims that these processes are not consistently completed in parallel; however there does appear to be a misconception at the facility level as to what actions are allowable. A VACO HR leader interviewed suggested that service line leaders at many sites may simply not be aware of the fact that they can initiate several processes in tandem.
Assessment F (Workflow – Clinical)
The views, opinions, and/or findings contained in this report are those of the assessment team and should not be construed as an official government position, policy, or decision.
51
5.2.2.3 Attracting Talented Clinical Staff can be a Challenge Due to Low Pay Compared With Private Sector in Many Geographies
Hiring delays may also be driven by talent attraction challenges. Eighty-one percent of VAMCs we visited reported that compensation was a major talent attraction and retention challenge at their facility. As one Chief Hospitalist said, “[hospitalist] positions are posted but remain vacant since no one wants them.”99 Another specialist noted that he could “only afford to work at the VA because my wife is in private practice.”100
Two key pay related challenges may limit VAMCs ability to attract top talent: (1) VHA pay may lag national benchmarks; and (2) VAMCs and VISNs lack authority to meaningfully increase pay to match local market rates for many clinical occupations (Blueprint for Excellence, 2014). While a comprehensive compensation benchmarking assessment was not in-scope of the assessment, the issue of pay disparities was raised frequently enough that we believe it could be a contributor, especially for more specialized fields.
VHA pay may lag national benchmarks. As mentioned above, eighty-one percent of VAMCs we visited claimed that compensation impeded their ability to attract talented staff. This issue was anecdotally reported to be an especially acute challenge in hiring physicians. Given this, we completed a high-level analysis comparing mean physician pay in the private sector against mean VHA physician pay (Figure 5-5). As the figure below indicates, mean VHA pay is substantially lower than mean private sector pay for many physician specialties. VHA would need to conduct its own locality-based analyses with internal data to fully confirm this assessment and identify regional variations in disparity. Benchmarking benefits was also out of scope for this assessment, but should also be considered when looking at overall comparability of VHA physician compensation packages with those found in the private sector. It stands to reason, however, that pay disparities could deter some candidates, especially those expecting to earn well above national averages.
99 Chief Hospitalist at a rural VAMC, interviewed on a site visit 100 Specialist at an urban VAMC, interviewed on a site visit

Assessment F (Workflow – Clinical)
The views, opinions, and/or findings contained in this report are those of the assessment team and should not be construed as an official government position, policy, or decision.
52
Figure 5-5. VHA Compared to National Benchmarks Reveals Disparity
VAMCs and VISNs lack authority to meaningfully increase pay to match local market rates for many clinical occupations. VHA has implemented several pay structures intended to make salary more competitive. These primarily include market pay for physicians,101 locality pay for other clinical staff, incentive awards, and retention allowances. However, the effectiveness of these mechanisms is limited, by the fact that they are capped, in many cases require VISN approval, are not available for all occupations and are not well publicized amongst VAMC leadership. Across clinical occupations, incentive awards and retention allowances equal about one percent of regular pay, without substantial variation by occupation.102 This does mean that VHA guarantees a greater share of its compensation than is the case in the private sector where RVUs are managed, however the size of the overall pay discrepancy may not make this a valuable incentive. Challenges with implementation of incentive pay have been noted previously by the VA OIG (VA OIG, 2004), and HR leaders have suggested that this may be done as a way of managing budgetary constraints at the VAMC level.
101 Dentists as well, though dentists are not examined in this report given our inpatient focus 102 Ibid.

Assessment F (Workflow – Clinical)
The views, opinions, and/or findings contained in this report are those of the assessment team and should not be construed as an official government position, policy, or decision.
53
Whatever the reason for low utilization, facilities should be mindful of the potential effects on retention.
Allocation of Staff Does not Consistently Match Patient Care Need
Having identified the need for additional FTEs, approved the request, and hired on new staff, many VAMCs struggle to appropriately allocate staff. In part, allocation challenges manifest as persistent misallocation of staff to different tours (primarily, significant downshifting on the WHEN hours, though staffing levels may be too high in some places on the on-tour, i.e., daytime hours). Allocation challenges also emerge on a more day-to-day basis as limited access to flexible staffing options (e.g., agency staff), make it difficult for facilities to meet staffing needs when they have short-term understaffing (e.g., an unexpected vacancy).
This section covers two primary challenges related to allocation of staff:
5.2.3.1 Hospital operating models are skewed toward clinic hours
5.2.3.2 Access to flex resources is limited, inhibiting ability to meet peaks in demand or manage short-term understaffing
5.2.3.1 Hospital Operating Models are Skewed Toward Clinic Hours
Though many patients are admitted to the hospital on evenings and weekends, hospitals (public and private) tend to scale back staffing during these periods, reducing both the number and skill mix of staff on-site. The academic literature has clearly established that significant downshifting on the off-tour (i.e., weekends, holidays, evenings, and nights) worsens the quality of care; as Wong and Morra write, describing the health care system in general, “our current office-hours system of running hospitals threatens the lives of our sickest, most vulnerable patients” (Wong and Morra, 2011, p. 1050).
Admissions on weekends in particular are associated with worse patient outcomes, across hospitals (Cavallazzi et al., 2010; Ananthakrishnan et al., 2009; Aujesky et al., 2009; Shaheen et al., 2009; Kostis et al., 2007). Restricted off-tour services are also associated with delayed discharge and increased transfers (Menchine and Baraff, 2008; Conti, 2003; Varnava et al., 2002). Downshifting on nights is less clearly linked to adverse clinical outcomes (Ananthakrishnan et al., 2009; Aujesky et al., 2009; Shaheen et al., 2009; Kostis et al., 2007), though the literature on the effect of nurse understaffing implies that night tours should still meet minimum staffing and skill mix best practices to prevent increased mortality (Blegen et al., 2011; Patrician et al., 2011; Tourangeau et al., 2002; Bond et al., 1999). Moreover, the literature on risks inherent in physician hand-offs, likely to occur more often on nights and weekends, when physicians are covering for one another, may also suggest a need for more consistent physician staffing off-tour (Horwitz et al., 2008; Arora et al., 2005).
Sites responding to our data call demonstrated significant understaffing during WHEN hours compared to best practice and industry standard practice (see Figure 5-6 below). Response

Assessment F (Workflow – Clinical)
The views, opinions, and/or findings contained in this report are those of the assessment team and should not be construed as an official government position, policy, or decision.
54
rates were low, resulting in small sample sizes;103 however, this data still provides directional information on VA downshifting patterns, and corroborates site visit interviewees and workshop participants’ perceptions of WHEN hours understaffing (see Sections 6 and 7 for the perceived effect of downshifting on access and LOS).
Taken together, our quantitative and qualitative data points suggest that VAMCs may not be adequately staffed on the WHEN hours (see Appendix B.5 for full data). For example, data call results indicate that weeknight staffing declines by ~40-45 percent of daytime staffing among ED physicians, ~60-65 percent among hospitalists, and ~85-90 percent among intensivists. RN downshifting is less pronounced, decreasing by ~20-25 percent in the ED, ~10-15 percent on med/surg floors, and increasing in the ICU by ~40-45 percent, perhaps to account for reduced intensivist coverage. CNA support, by contrast, decreases by far more, ~70-75 percent in the ED, ~40-45 percent on med/surg floors, and ~55-60 percent in the ICU. This suggests that nurses may be assuming responsibilities typically performed by CNAs on the WHEN hours. This matches with interviews and workshop comments indicating that nurses in many facilities find that low levels of ancillary support impeded their ability to work at top-of-license. See Figure 5-6 below for average downshifting rates based on the data call made to Level 1 and 2 complexity VAMCs. Appendix B.5 includes citations from the academic literature and published survey data, used to assess best practice and standard practice, as well as the sample size (n-values) for each of the VHA statistics.
103 Low response rates were exacerbated by respondents’ inability in many cases to provide requested information
on annual work hours by shift and department. For example, respondents noted in response fields, “This information cannot be provided,” “Do not have access to that data at this time,” “Fiscal is not able to break the data down by each shift and weekday [versus] weekend,” “Unknown,” “Overall [x%]. We did not separate specialties,” and "Do not have a way to divide out weekend, weekday, nights or days so all the time is placed together.” These comments corroborate our finding, in Section 3.2.1, that VA lacks visibility into staffing levels.

Assessment F (Workflow – Clinical)
The views, opinions, and/or findings contained in this report are those of the assessment team and should not be construed as an official government position, policy, or decision.
55
Figure 5-6. VHA Downshift Rate
The available data does not allow us to comment definitively on whether VHA is, on average, understaffed on the off-tour, nor why this might be the case if understaffing is indeed occurring at many facilities. Based on site visits, however, we hypothesize that VAMCs’ clinic-based hospital operating model may stem from two main causes: (1) other core staffing challenges reduce ability to fully staff on the WHEN hours; and (2) VHA’s traditional value proposition for many staff has been sustainable lifestyle compared to the private sector.
Other core staffing challenges reduce ability to fully staff on the WHEN hours: The other core staffing challenges described earlier in this report likely make it more difficult to fully staff on the off-tour than might otherwise be the case. For example, if it is difficult to fully demonstrate need for an additional FTE in many service lines because there is no clear staffing guidance, it is likely especially difficult to demonstrate need for an additional FTE on shifts with lower demand (e.g., nocturnist). Poor data management may also mean that many facilities do not fully know the extent to which they downshift on the WHEN hours, and how this compares to patient need. We were only able to obtain data on downshifting through a data call made to all VAMCs. Many respondents to the data call were not able to report staffing data by department and shift, making comments such as, “Fiscal is not able to break the data down by each shift and weekday [versus]

Assessment F (Workflow – Clinical)
The views, opinions, and/or findings contained in this report are those of the assessment team and should not be construed as an official government position, policy, or decision.
56
weekend” and “Do not have a way to divide out weekend, weekday, nights or days so all the time is placed together.” These comments corroborate our finding, in Section 5.2.1, that VHA lacks transparency on staffing levels. Furthermore, uncompetitive salary and benefits for part-time staff likely also create particular challenges for WHEN hours staffing, where need might justify a partial but not full FTE. VHA’s traditional value proposition for many staff has been sustainable lifestyle compared to the private sector: Section 5.2.2 describes the average gap between VHA and private sector pay for many clinical occupations. The disparity is most pronounced for providers, as well as some nursing and AHP roles. Several site visit interviewees shared that the historical value proposition of a career at VHA was lower pay in exchange for substantial benefits and sustainable lifestyle. As one Chief of Medicine said, “The traditional promise of working at VA was lower pay in return for easier lifestyle and not being on call.” If this is the case, then we would expect low staffing on the WHEN hours, which are typically less attractive shifts. This is borne out by the downshifting rates shown in Appendix B.5. Physicians, for whom the private sector pay gap is significant, do downshift significantly, potentially reflecting a historical orientation toward clinic hours for these roles.
5.2.3.2 Access to Flex Resources is Limited, Inhibiting Ability to Meet Peaks in Demand or Manage Short-Term Understaffing
Ideally, facilities meet their staffing needs using their own employees, who are familiar with local practices, have worked together, and know the patient population. Short-term understaffing will occur from time to time, however, when facilities have unexpected vacancies or demand increases dramatically. In these instances, facilities rely upon a combination of increasing staff hours, float pools, per diem labor, agency labor, and other contract labor.
Excessive use of flex labor is a challenge at many private sector facilities, and is discouraged in the academic literature because it is expensive and often not optimal for patient care (Strzalka and Havens, 1996). Many VAMCs report having little to no ability to use flex labor, however, creating challenges meeting unexpected staffing need. As one senior VHACO nursing leader said, “You can wake up overnight with horrible shortages…and no way to fill.” Figure 5-7 summarizes provider, nursing, and allied health service line chiefs’ perceptions of the adequacy of flexing practices for their service. While there is some variation in perception by service line, only ~25 percent of respondents in each service line believed that flexing practices were highly effective, with ~75 percent believing that there were opportunities for improvement.

Assessment F (Workflow – Clinical)
The views, opinions, and/or findings contained in this report are those of the assessment team and should not be construed as an official government position, policy, or decision.
57
Figure 5-7. Perceived Adequacy of Flexing Practices by Occupation104
Figure 5-8 illustrates workshop participants’ perceptions of flexing challenges, showing the front-line perspective on this issue.105
104 Based on interviews with physician, nurse, and allied health service line chiefs. Physician department head n=7,
Assistant Director of Patient Care Services n=8, allied health service line chief n=9. 105 Attendee roles varied, but included nurses, physicians, AHPs, and ancillary staff
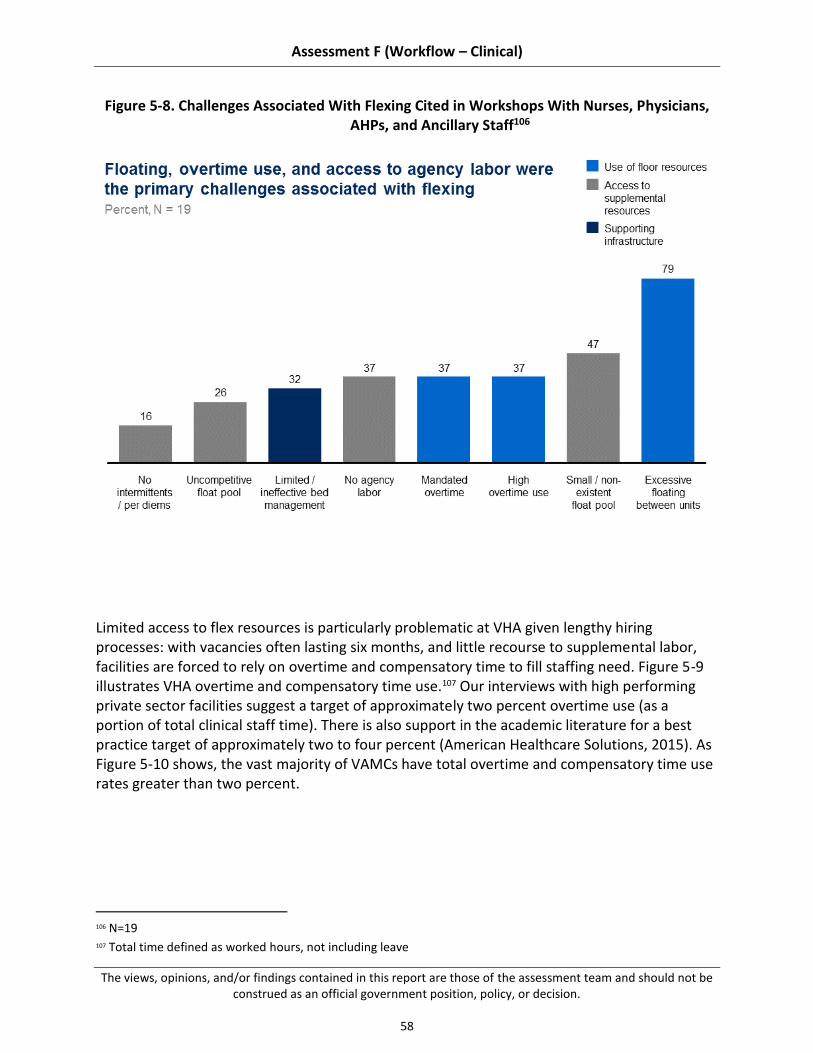
Assessment F (Workflow – Clinical)
The views, opinions, and/or findings contained in this report are those of the assessment team and should not be construed as an official government position, policy, or decision.
58
Figure 5-8. Challenges Associated With Flexing Cited in Workshops With Nurses, Physicians, AHPs, and Ancillary Staff106
Limited access to flex resources is particularly problematic at VHA given lengthy hiring processes: with vacancies often lasting six months, and little recourse to supplemental labor, facilities are forced to rely on overtime and compensatory time to fill staffing need. Figure 5-9 illustrates VHA overtime and compensatory time use.107 Our interviews with high performing private sector facilities suggest a target of approximately two percent overtime use (as a portion of total clinical staff time). There is also support in the academic literature for a best practice target of approximately two to four percent (American Healthcare Solutions, 2015). As Figure 5-10 shows, the vast majority of VAMCs have total overtime and compensatory time use rates greater than two percent.
106 N=19 107 Total time defined as worked hours, not including leave
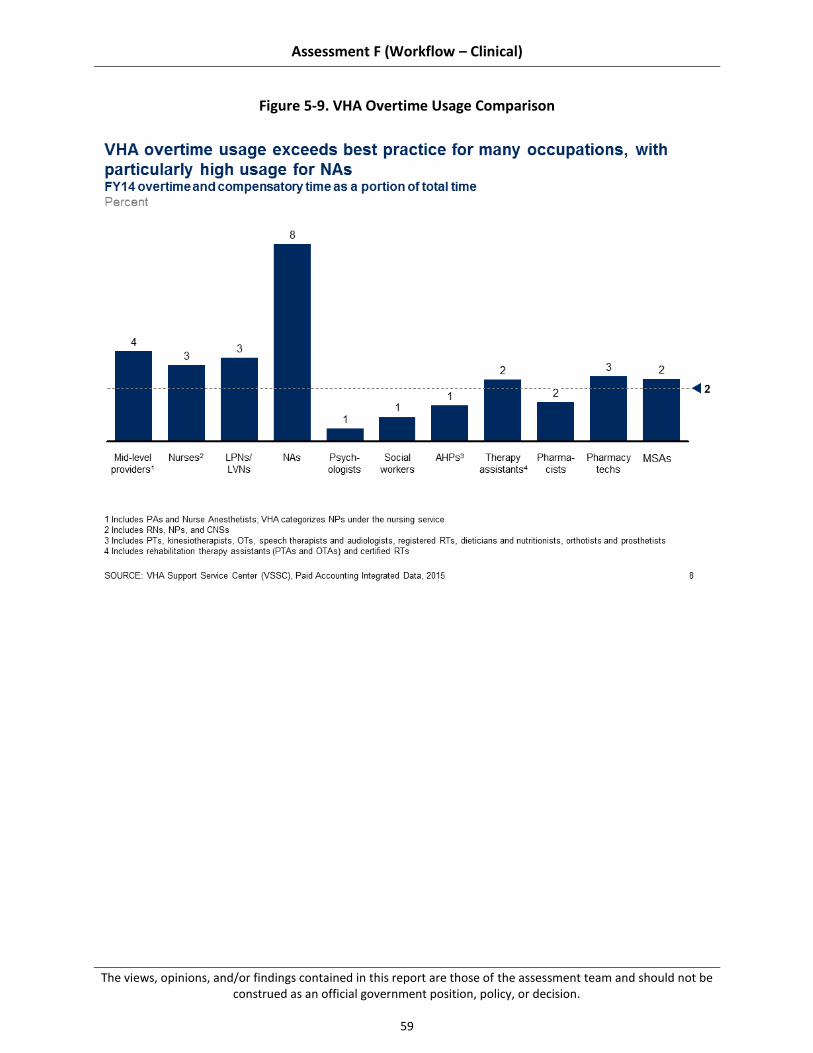
Assessment F (Workflow – Clinical)
The views, opinions, and/or findings contained in this report are those of the assessment team and should not be construed as an official government position, policy, or decision.
59
Figure 5-9. VHA Overtime Usage Comparison

Assessment F (Workflow – Clinical)
The views, opinions, and/or findings contained in this report are those of the assessment team and should not be construed as an official government position, policy, or decision.
60
Figure 5-10. VAMC Overtime Use Comparison
Limited access to flex resources primarily stems from two challenges: (1) contracting processes reduce ability to fill temporary staffing shortages with contract labor; and (2) few facilities have the per diem and float resources that front-line staff believe are needed to effectively flex capacity.
Contracting processes reduce ability to fill temporary staffing shortages with contract labor: Facilities report that contracting processes significantly delay their ability to meet short-term understaffing. Interviewees on site visits reported that contracting can take up to about four months, reducing ability to use agency labor to meet short-term staffing needs (as hiring takes approximately six months, contract labor is only helpful for the last roughly two months of understaffing). 108 Access to contract and agency labor is limited across service lines, especially so outside of the nursing service: only 30 percent of physician department chiefs and 14 percent of AHP leaders reported using locum tenens and agency therapists to supplement core
108 Based on site visit interviews with ADPCSs and workshops with nurses and nurse managers
Assessment F (Workflow – Clinical)
The views, opinions, and/or findings contained in this report are those of the assessment team and should not be construed as an official government position, policy, or decision.
61
staffing, respectively, compared to 55 percent of ADPCSs who reported using agency nurses during our site visits.109 Few facilities have the per diem and float resources that front-line staff believe are needed to effectively flex capacity: Access to flex labor sources is also due to limited per diem and float resources. We use per diem to refer to a standing roster of staff available for ad hoc shift work, and float resources to refer to standing float pools, which may consist of full-time or part-time employees. Float pool staff are intended to be allocated to different units based on changes in census or short-term staffing needs. Access to per diem and float pools is relatively limited across VHA: for example, 10 percent AHP leaders reported using per diems and/or float pools to supplement core staffing.110 This challenge appears to stem from:
(a) Contracting and competency requirements can limit on-going access to per diems: Several facilities expressed that use of per diems was limited by VHA restrictions on maximum total spend with any given provider. We were not able to corroborate this claim with available data, and encourage VHA to conduct a more complete review to fully substantiate. The anecdotal reporting through interviews at 21 VAMCs does suggest that access to contract labor is a significant challenge, however. VHA has established a Travel Nurse Corps (TNC) of VHA nurses available for short-term engagements, intended to serve the same function as private agencies providing travel nurses. Only 10 percent of ADPCSs interviewed said that they had used the TNC to supplement staffing, however.111 Many other ADPCSs said they had not used the service because it was too expensive or had low availability. This suggests there is either a need for a lower-cost VHA option or access to external agencies, at least in the nursing service.
(b) Float pools are challenging to maintain at VHA: Several facilities shared that they had previously established float pools but found them unsustainable, or had current float pools with many vacancies. In part, challenges maintaining float pools appear to be due to uncompetitive pay and benefits for part-time staff (float pools can be staffed by full-time employees, but are often staffed with part-time personnel). Staff at several facilities reported that staff in float pools often left for full-time positions at the VAMC or other facilities due to low compensation. In part, challenges maintaining float pools may also be due to staff preferences for working in units. Several facilities reported that staff hired into full-time float positions transferred to other units in the hospital when vacancies emerged, preferring the continuity of being on a unit. We did not have access to data on float pool turnover rates and reasons for leaving, and could not substantiate these claims. The consistency with which we heard this complaint,
109 Physician department chief N=20, ADPCS N=20, AHP leader N=21. ADPCS figure includes external agencies and
VA Travel Nurse Corps. 110 Physician department chief N=20, ADPCS N=20, AHP leader N=21 111 N=20

Assessment F (Workflow – Clinical)
The views, opinions, and/or findings contained in this report are those of the assessment team and should not be construed as an official government position, policy, or decision.
62
however, suggests that VHA should examine this potential challenge and review whether compensation for float positions is sufficient to attract and retain staff.
5.3 Recommendations
VHA staffing practices have multiple stakeholders: Congress and the executive branch, VACO, VHACO, VISN leadership, and VAMC management and staff. Encouraging innovation and addressing critical challenges in clinical staffing will require collaboration between all of these groups, and a commitment to making difficult, long-term change. Different recommendations should be owned by different groups (e.g., recommendation requiring changes to VACO policy versus local policy); however, support for change from all stakeholders is critical to effective implementation.
Our recommendations, building on existing strengths and addressing existing challenges in clinical staffing, can be categorized into three main themes.
5.3.1 Increase transparency of staffing by providing evidence-based staffing methodologies for all clinical staff and improving data management
5.3.2 Increase timeliness of hiring to patient care teams
5.3.3 Allocate staff to match patient care needs
These themes are consistent with practices suggested by the academic literature, professional associations, and high-performing hospitals within VHA and outside the system, as well as solutions proposed by front-line VHA staff – further details are included in "summary of supporting evidence" sections in each sub-recommendation (see Appendix B.8 for additional detail on our methodology for gathering this data). To help VHA implement our recommendations, we have also suggested next steps in the "potential near-term actions" sections of the sub-recommendations. Note, because different VAMCs may have already adopted some recommended practices or experience unique barriers, these suggestions should be tailored the individual circumstances of each VAMC. Each recommendation is supported by several sub-recommendations, which map to the “organization, workflow processes, and tools” domains specified in the Choice Act. For a detailed map of how the sub-recommendations relate to these domains, see Table B-2 in Appendix B.3.
Several recommendations overlap with other assessment areas. Where this occurs, we have referenced the relevant assessment area, where additional detail can be found.
Increase Transparency of Staffing by Providing Evidence-Based Staffing Methodologies for all Clinical Staff and Improving Data Management
As noted in Section 5.2.1, VHA lacks transparency on staffing levels, driven both by non-existent or limited staffing methodologies and poor data management. VHA may well be appropriately staffed, but it has very little information to assess whether this is the case, and therefore limited ability to manage staffing.
We suggest several changes aimed at improving the process to both develop and approve staffing requests:

Assessment F (Workflow – Clinical)
The views, opinions, and/or findings contained in this report are those of the assessment team and should not be construed as an official government position, policy, or decision.
63
5.3.1.1 Provide and support scalable, evidence-based staffing methodologies and interdisciplinary resource management processes
5.3.1.2 Improve data management
5.3.1.1 Provide and Support Scalable, Evidence-Based Staffing Methodologies and Interdisciplinary Resource Management Processes
Staffing guidance for most VHA clinical occupations is very limited, affecting services’ ability to accurately estimate FTE need. Private industry leaders typically employ robust, evidence-based staffing methodologies for clinical occupations. Consistent with these practices, VHA should provide clear guidance on how to assess FTE need and work across services to coordinate FTE requests.
Summary of supporting evidence:
See Sections 5.2.1.1, 5.2.1.3, and 5.2.1.4 for more detail on findings.
Seventy-six percent of sites visited112 proposed the development of a comprehensive evidence based staffing methodology, as a solution to core staffing challenges. As one VAMC Chief of PM&R said, “It would…be very helpful to the field for a staffing model to be provided by Central Office…we’ll be adding ten thousand patients [to one of our sites next year]…how many more PTs do I need? I don’t know.”
Professional societies like the Society of Critical Care Medicine and the American College of Emergency Physicians have published staffing principles to guide hospitals in making evidence-based staffing decisions. These guidelines include maximum suggested provider-to-patient ratios (e.g., intensivists-to-patients, recommended by the Society of Critical Care Medicine [Ward et al., 2013] and ED physicians-to-patients, recommended by the American College of Emergency Physicians [Collins, 2009]), which allow for clear benchmarking.
High performing private sector hospital networks have also established evidence-based, standard practices for evaluating staffing need across their systems. Intermountain Healthcare, for example, uses standard ‘Request for Provider’ and ‘Request for Clinician’ forms for establishing clinical need for new physician and advanced practitioner FTE requests. These forms include analysis of group finances, patient volume, population ratios, and RVUs, among other factors identified as important in assessing staffing need.113
Potential near-term actions:
VHACO: Task each function-based service line (e.g., surgical services), currently lacking national directives on staffing, with developing comprehensive staffing guidance in close coordination with related role-based service lines (e.g., nursing service, rehabilitative services).
112 N=16, out of 21 total VAMCs visited 113 Intermountain Healthcare SME interview (April 2, 2015)

Assessment F (Workflow – Clinical)
The views, opinions, and/or findings contained in this report are those of the assessment team and should not be construed as an official government position, policy, or decision.
64
VHACO: Solicit input from VAMC leadership and front-line staff in their service line and related services, to develop an interdisciplinary staffing methodology that includes:
o Staffing guidance by team or function, including staffing mix: methodologies should include guidelines for all key roles involved in delivering a particular kind of care. For example, staffing guidance for surgical services could include a suggested staffing mix of one orthopedic surgeon to a certain number of OR techs, OR nurses, and PTs. Such guidance must be flexible, acknowledging that multiple roles can serve similar functions on teams (e.g., NPs and PAs can complete many of the same responsibilities) or provide care along a continuum (e.g., a CRNA and an Anesthesiologist).
o Minimum staffing levels, coupled with target ratios of staff or staff time to patients or beds {would require accurate bed data – see Section 6 for more detail on issues with current bed data) above the minimum: staffing methodologies must be able to be adapted to facilities with different admissions numbers, to ensure that coverage is consistent regardless of facility size. Target ratios of staff to patients or beds (e.g., one physical therapists per a given number of patients), or of staff time to patients or beds (e.g., NHPPD, currently used by the nursing service) would allow facilities of varying sizes to estimate their FTE need. Furthermore, including minimum staffing levels up to a certain population threshold, beyond which ratios would be used, would ensure that very small facilities are still able to justify FTE needs based on the services they provide. Ratios and hours targets are evidence-based and used in the literature on clinical staffing and by professional associations (Ward et al., 2013; Epané and Weech-Maldonado, 2015; Phoenix Physicians, 2011; Collins, 2009; Schoo et al., 2006; Christie and Grimwood, 2006; Allied Health in Rehabilitation Consultative Committee, 2007; Australasian Faculty of Rehabilitation Medicine, 2005; ASHP, 2013).
o FTE calculator: Having aligned on target ratios of staff or staff time to patients or beds, service lines should develop calculators that translate target ratios into FTEs needed:
– The nursing FTE calculator includes many variables needed to do this (e.g., leave factor, turbulence), and can likely serve as a starting point for many services.
– The factors most relevant to each service will vary, however and VACO should task VACO-level service line leadership with identifying the factors most relevant to their service lines and then developing an FTE calculator.
o Guidance on process to develop staffing requests: staffing methodologies should also include guidance on how to solicit front-line input and how often to conduct comprehensive reviews of staffing levels (ideally, annually for most roles or in the case of a life-event of the hospital, e.g., opening of a new service line, closure of nearby hospital).
VHACO/VAMC: Service line leaders should clearly communicate the purpose of the new staffing methodologies when they are developed and train front-line managers and staff on how to use them.
Assessment F (Workflow – Clinical)
The views, opinions, and/or findings contained in this report are those of the assessment team and should not be construed as an official government position, policy, or decision.
65
VACO/VHACO/VISN/VAMC: Relax current restrictions on numbers and allocation of FTEs.
VACO/VHACO: Remove FTE caps in favor of setting staffing budgets, to increase facilities’ ability to manage their own staffing (e.g., allowing facilities to decide whether their needs are best met by hiring two NPs or one physician).
VACO/VHACO: Reduce earmarking of the salary budget and mandated positions, to allow facilities to staff according to local needs and reallocate staff to areas where patient volumes are highest (see Section 5.2.1 for more detail).
VAMC: Compare FTE levels suggested by new staffing methodologies (recommended above) to current staffing budgets at the facility. Identify areas where funding could be reallocated across the facility, and, having done so, evaluate whether and where there is a need for reductions or additional funding for salaries, and make any appropriate requests for changes in resourcing.
VAMC: Enforce interdisciplinary development of staffing requests at the local level by requiring that requests for new staff members include analysis of needed support from other roles (e.g., if adding a new surgeon, review whether additional OR tech capacity would be needed to support additional surgery volumes).
5.3.1.2 Improve Data Management
We observed poor FTE and payroll data management at VHA. Ensuring reliable data that includes key metrics needed to assess the appropriateness of staffing is an obvious precondition to managing staffing. Improving VHA data collection and tracking should be a clear priority as VHA considers how to increase visibility into its operations. Improving data management is also a precondition to achieving many of the other recommendations that we make (e.g., appropriately allocating staff to match patient care needs).
Summary of supporting evidence:
See Section 5.2.1.2 for more detail on findings.
The academic literature has established that staffing data (data on staff time, in particular) is critical to accurately assessing staffing need in the hospital setting (Howard and Felton, 2013).
State governments are increasingly moving to address the issue of FTE and payroll data management in private sector hospitals, requiring clear, comprehensive staffing data reports, maintained through improved data management, in order to ensure transparency (e.g., New Jersey, California, Illinois).114,115,116
High performing private sector hospitals clearly identify the metrics that they need to assess staffing need, and track this data consistently. Texas Children’s Hospital, for example, monitors “work hours per unit of service” (e.g., per patient visit, per procedure),
114 See the New Jersey Department of Health’s Hospital Care Staffing Reports 115 See the California Office for Statewide Health Planning and Development staffing database 116 See the Illinois Department of Public Health’s Health Care Report Card

Assessment F (Workflow – Clinical)
The views, opinions, and/or findings contained in this report are those of the assessment team and should not be construed as an official government position, policy, or decision.
66
supported by centralized data management provided by an external vendor, and uses this information in its staffing decision-making (HealthCatalyst, 2015).
Several VAMCs have developed local data management practices which allow them greater visibility into staffing at their facility (see Section 5.2.1.2) and represent best practices that other VAMCs could adopt. Palo Alto provides one best practice examples. It not only monitors staffing on a daily basis (as many facilities do, at least in the nursing service) but also analyzes data on a quarterly, semi-annual, and annual basis and employs a resident statistician to assist with data interpretation.
Potential near-term actions:
VACO: Update and streamline HR and payroll codes, capturing FTE, work hours, and pay data by occupation, specialty, department, outpatient versus inpatient setting, and shift.
VHACO: Review available tools for tracking staffing levels by shift, to more accurately capture work hours data. Time clocks may not be allowable, but VHA should identify alternative programs to capture this data and reduce manager workload on monitoring attendance.
VACO: Designate a single source for national HR data, to reduce inconsistencies between multiple sources and avoid duplication of effort.
VHACO/VAMC: Track metrics needed to assess the appropriateness of staffing, focusing on:
o Ratios of staff or staff time to patients or beds, measured by occupation, department, outpatient versus inpatient setting, and shift.
o Percentage decline in staffing by shift, measured by occupation, department, and outpatient versus inpatient setting.
o Requested positions, in addition to approved and filled positions, measured by occupation, department, and outpatient versus inpatient setting.
Increase Timeliness of Hiring to Patient Care Teams
Timely and efficient hiring is critical to ensuring consistent, high-quality medical care in the right setting with the right kinds of support. As noted in Section 5.2.2, workshop participants’ primary concern with core staffing was the length of the hiring process. Accelerating hiring could considerably reduce vacancy rates, improving the quality of care, patient experience, and staff satisfaction.
In particular, we suggest that VHA:
5.3.2.1 Review and streamline hiring requirements
5.3.2.2 Increase HR service level expectations needed to facilitate streamlined requirements
5.3.2.3 Communicate an optimal hiring process to VAMCs, clarifying their responsibilities and encouraging them to complete activities in parallel
5.3.2.4 Expand ability to increase pay to match market

Assessment F (Workflow – Clinical)
The views, opinions, and/or findings contained in this report are those of the assessment team and should not be construed as an official government position, policy, or decision.
67
5.3.2.1 Review and Streamline Hiring Requirements
VHA hiring requirements appear more substantial than those typically found in private sector hospitals. VHA must ensure that staff are qualified; however, comparison to private sector suggests that current safeguards and regulations are further-reaching, driving hiring delays that affect VAMCs’ ability to staff appropriately and thereby safely provide care. We recommend reviewing requirements to identify areas that could be streamlined, and setting clear timeliness targets for hiring processing.
Summary of supporting evidence:
See Section 5.2.2.1 for more detail on findings.
100 percent of the sites we visited suggested accelerating the hiring timeline, in part through streamlining credentialing and boarding requirements, as one of the key improvements they would make to core staffing117.
Standard practice in private sector hospitals is to use Joint Commission hiring and credentialing requirements, which include verification of licensure, but not the submission of transcripts, diplomas, test scores, or various other requirements VHA typically has.
Potential near-term actions:
VACO/VHACO: Review and standardize credentialing and boarding processes
o Identify requirements that may be eliminated or reduced without compromising quality and security.
o Compare current requirements with private and local standards.
o Obtain input from the field on perceived security requirements.
o Consider accepting credentials and recent references alone, for experienced providers, rather than requiring all transcripts and complete references (see Joint Commission requirements, described above).
o Ensure that requirements are standardized across VAMCs.
VACO: Set national timeliness targets for all aspects of the hiring process, not just the steps to a tentative offer, communicating these expectations to clinical leaders and HR.
5.3.2.2 Increase HR Service Level Expectations Needed to Facilitate Streamlined Requirements
Site visit interviewees and workshop participants reported that HR processing was often delayed. We refer readers to Assessment L for a detailed review of evidence suggesting that clear service level expectations are associated with efficient HR processing. We echo Assessment L’s recommendation that VHA employ clear HR service level expectations.
Summary of supporting evidence:
See Section 5.2.2.2 for more detail on findings.
117 N=21

Assessment F (Workflow – Clinical)
The views, opinions, and/or findings contained in this report are those of the assessment team and should not be construed as an official government position, policy, or decision.
68
29 percent of VAMCs we visited saw improving HR capabilities as the most critical element of accelerating the hiring timeline118.
See Assessment L for more detail on best practices in service level expectations.
Potential near-term actions:
VACO/VHACO/VISN/VAMC: Develop and enforce clear service level expectations for local and national HR staff, including:
o Clear targets for timeliness of HR processing.
o Performance bonus structure and/or recognition and growth opportunities.
o Ability to discipline in instances of underperformance.
VACO/VHACO: Review current training for VHA HR staff, ensuring that HR staff receive formal training and mentorship from tenured HR specialists (e.g., shadowing period or peer buddy system) in addition to existing educational programs.
5.3.2.3 Communicate an Optimal Hiring Process to VAMCs, Clarifying Their Responsibilities and Encouraging Them to Complete Activities in Parallel
HR does not bear sole responsibility for completing the hiring process; VAMC leadership and clinical staff also have clear roles in the hiring process, which interviewees reported they do not always complete in an efficient and timely manner. Clear understanding of all parties’ responsibilities and authorities is obviously critical to ensuring timely processing. We recommend clearly communicating which hiring processes are owned by VAMC leadership and clinical staff, and empowering facilities to conduct these processes in parallel.
Summary of supporting evidence:
See Section 5.2.2.2 for more detail on findings.
Interviews we conducted with high performing and typical private sector hospitals suggest that conducting background checks, credentialing, interviewing, and developing compensation packages in parallel is best practice. The private sector facilities we spoke with said that they were not always able to complete all activities in parallel, but strove to do so, suggesting that parallel processing wherever possible is a clear best practice.
Completing credentialing and privileging in parallel with a candidate’s physical exam, drug test, and fingerprinting could help reduce the overall HR timeline; currently, many VAMC staff believe that these processes cannot be conducted concurrently and do not launch them concurrently.
In addition, concurrent internal and external posting of positions could approximately halve total posting time (in instances where internal and external posting periods are approximately equal), allowing facilities to interview candidates more quickly.
Potential near-term actions:
118 N=6, out of 21 VAMCs visited
Assessment F (Workflow – Clinical)
The views, opinions, and/or findings contained in this report are those of the assessment team and should not be construed as an official government position, policy, or decision.
69
VHACO: Develop a clear list of the hiring processes for which VAMC administrators and clinical staff are responsible (e.g., interviewing candidates) and communicate this to VAMCs, including guidance on which activities may be conducted in parallel.
VACO: Create timeliness targets for components of the hiring process that are managed by service lines, in addition to targets for HR.
5.3.2.4 Expand Ability to Increase Pay to Match Market
In addition to delays related to internal processing, the hiring timeline appears also to be driven in many cases by challenges attracting talent to roles, due to uncompetitive pay (on average) compared to private sector. This factor is likely highly variable by geography, and would be best addressed by increasing local ability to adjust compensation packages to be competitive with market rates. However, while existing pay levers available to VAMCs (e.g., incentive awards, retention allowances) are limited, utilization and awareness of them appears to be highly variable across the country.
Summary of supporting evidence:
See Section 5.2.2.3 for more detail on findings.
81 percent of sites suggested increasing the competitiveness of compensation for VHA clinical staff as a way to fill vacancies and improve staffing.
Competitive compensation is clearly a key component of attracting talented clinical staff to positions, though obviously not the only element (Kneeland et al., 2010; Guthrie, 1999).
Several VAMCs have successfully petitioned for increases in pay to match local rates (e.g., Fort Harrison, which reported increased ability to recruit nurses following an increase in nurse pay). Making it easier for more sites to do this would improve VAMCs’ ability to attract talented staff in their market.
Potential near-term actions:
VACO/VHACO: Complete a compensation benchmarking assessment across VHA, comparing total compensation (including salary, benefits, performance pay, incentive awards, and other financial structures) to local markets. Following this assessment:
o VACO/VHACO: Expand financial awards to include clinical staff that are not currently eligible (e.g., AHPs, psychologists).
o VACO/VHACO: Increase threshold above which VISN must approve discretionary financial awards or market pay adjustments, increasing facilities’ ability to adjust pay to match local market rates.
o VAMC: Match salaries (across tenure levels) to local market rates, using existing financial awards and authorities; this may entail increases and decreases depending on the geography.
Congress and VACO: Explore whether legislative change is needed to allow VHA to match pay to local market rates, and if so, consider legislation reforming VHA pay caps and competitiveness.
Assessment F (Workflow – Clinical)
The views, opinions, and/or findings contained in this report are those of the assessment team and should not be construed as an official government position, policy, or decision.
70
Allocate Staff to Match Patient Care Needs
Sufficient staffing on the WHEN hours is a critical component of delivering safe, effective care. As noted in Section 5.2.3, VHA faces challenges allocating staff to match patient demand, driven by both sharp downshifting on the WHEN hours and limited access to flex labor sources. This affects facilities’ ability to ensure they are providing safe, efficient, and timely patient care and maintaining both patient and staff satisfaction.
We suggest several changes to better match staffing to patient need:
5.3.3.1 Ensure that staffing on WHEN hours is sufficient to meet patient need
5.3.3.2 Make contracting more flexible and efficient
5.3.3.3 Increase flexibility of float position structure and compensation
5.3.3.1 Ensure That Staffing on WHEN Hours is Sufficient to Meet Patient Need
Our data call and site visits indicate that downshifting at many facilities may not match levels recommended in the academic literature. Academic studies provide clear data on the association between WHEN staffing levels for many clinical occupations and patient care outcomes. VHA should ensure that staffing levels on the WHEN hours match with recommendations from the literature and professional associations.
Summary of supporting evidence:
See Section 5.2.3.1 for more detail on findings.
There is a substantial literature linking adequate staffing on WHEN hours to patient care and staff satisfaction outcomes. For example:
o Maintaining sufficient staffing on weekends is associated with improved patient care outcomes (Cavallazzi et al., 2010; Ananthakrishnan et al., 2009; Aujesky et al., 2009; Shaheen et al., 2009; Kostis et al., 2007).
o Maintaining off-tour staffing has been linked to improved LOS (Menchine and Baraff, 2008; Conti, 2003; Varnava et al., 2002).
o Ensuring sufficient staffing on nights is less clearly linked to improved clinical outcomes (Ananthakrishnan et al., 2009; Aujesky et al., 2009; Shaheen et al., 2009; Kostis et al., 2007), though the literature on the effect of adequate nurse staffing implies that night tours should still meet minimum staffing and skill mix best practices to ensure effective care (Blegen et al., 2011; Patrician et al., 2011; Tourangeau et al., 2002; Bond et al., 1999).
o Physician hand-offs, which have harmful effects on the quality of patient care, are less likely to occur when staffing levels are higher and physicians are not covering for one another (Horwitz et al., 2008; Arora et al., 2005).
o Please see Appendix A.7 for more detail.
Potential near-term actions:
VAMC: match staffing on off-tour to best practices and industry standard practices, by:
Assessment F (Workflow – Clinical)
The views, opinions, and/or findings contained in this report are those of the assessment team and should not be construed as an official government position, policy, or decision.
71
o Improving data management to ensure that the facility has visibility into staffing levels on the off-tour (see Recommendation 5.3.1 for more detail on this).
o Evaluating whether there are instances of overstaffing on the on-tour and staff that could be reallocated to the off-tour.
o Assessing whether additional staff are needed to support proper WHEN hours staffing based on opportunities for reallocation.
5.3.3.2 Make Contracting More Flexible and Efficient
Site visits and interviews with VACO and VHACO leadership indicate that VHA contracting regulations and processing are often complicated and inefficient. Sufficient access to flexible labor sources is critical to ensuring that VAMCs are able to manage inevitable short-term understaffing from unexpected vacancies and/or increases in patient load. We recommend evaluating current regulations to identify areas that could be streamlined, and reviewing current contracting support.
Summary of supporting evidence:
See Section 5.2.3.1 for more detail on findings.
Fifty-two percent of sites we visited cited improving access to contract labor as a critical change that needed to be made to improve flexing.
The academic literature has established that moderate, as-needed use of contract labor can be an effective and safe means of meeting short-term understaffing (Doty et al., 2009; Anderson et al., 1996; Griffiths et al., 2005).
VAMC leadership also reported that support for contracting at the local level was limited, resulting in clinical leaders often driving the contracting process, despite their lack of expertise in this area.
Potential near-term actions:
VACO/VHACO: Review federal contracting regulations governing VHA contracting to identify opportunities to streamline and reduce requirements.
VACO/VHACO: Evaluate potential for increased use of blanket purchase agreements and other similar contracting structures to establish standing relationships with contract labor providers, allowing for faster processing of requests for locum tenens and agency staff, in order to ensure VAMCs are able to provide safe, high-quality care even while experiencing staffing shortages. In particular, VHA should explore national blanket purchase agreements, facilitated by standardized credentialing requirements, allowing facilities to quickly draw from nationally-approved flexible labor sources when the need arises.
VAMC: Review accountabilities and performance management of contracting department and ensure that incentives and reporting structure promote accountability to VAMC leadership. At the same time, ensure that VAMC staff understand their responsibilities vis-à-vis contracting and are prepared and able to quickly carry out these responsibilities.

Assessment F (Workflow – Clinical)
The views, opinions, and/or findings contained in this report are those of the assessment team and should not be construed as an official government position, policy, or decision.
72
VHACO: Evaluate contracting support at VAMCs to identify any sites without sufficient support (e.g., sites with no current agency or per diem use), and increase coverage to address.
5.3.3.3 Increase Flexibility of Float Position Structure and Compensation
We observed that challenges accessing flex resources were also driven by limited internal float pool support at many facilities. High performing private sector hospitals often use float resources to manage day-to-day variations in patient load. VHA should address internal access to flex resources as a way to manage short-term understaffing (this should be a particular priority at larger facilities that likely have more consistent demand for floaters).
Summary of supporting evidence:
See Section 5.2.3.2 for more detail on findings.
Eighty-one percent of sites we visited suggested improving recruitment into float pools (often, via compensation increases to match local market rates) as one of the most pressing changes needed to improve flexing.
The academic literature suggests that competitiveness of compensation is important for attracting and retaining intermittent clinical staff (Hughes and Marcantonio, 1991).
Seventy-one percent of sites we visited reported wanting to add a float pool or increase the size of an existing float pool in order to better manage flexing. Several site visit interviewees reported significant challenges attracting and retaining float pool staff (see Section 5.2.3). While we could not access data needed to substantiate this claim, staff perceptions suggest that VHA may have a significant challenge in this area.
The Fargo VAMC has adopted shared positions, which split time across two units and act as a resource for both. This kind of shared resourcing appears to be especially useful in smaller facilities, where census is lower and particular occupations may not need a full FTE in any one given department or setting, or for larger facilities with like units that do not require a full FTE in any one single one.
Potential near-term actions:
VHACO: Establish guidelines for setting pay differentials for float staff based on local market rates to improve VAMCs ability to attract float staff.
VAMC: Create unit share positions where new staff are hired with the expectation of splitting time between designated units to build an expectation of floating amongst staff.
Potential Opportunity
Having the right number and type of staff on site at the right times is the foundation of delivering effective, efficient care. Sections 6, 7, 8, and 9 that follow are all directly affected by staffing allocations. Many VAMCs have entirely appropriate staffing models, with innovative practices; across the board, however, VHA lacks basic insight into whether staffing is appropriate, limited ability to hire staff quickly, and inconsistent allocation of staff. This creates significant potential for variation across the system, affecting the quality and level of care that

Assessment F (Workflow – Clinical)
The views, opinions, and/or findings contained in this report are those of the assessment team and should not be construed as an official government position, policy, or decision.
73
VHA provides to America’s Veterans. Congress, the federal government, the public, and VHA must work together to enhance VHA staffing practices and, thereby, care for Veterans.
Assessment F (Workflow – Clinical)
The views, opinions, and/or findings contained in this report are those of the assessment team and should not be construed as an official government position, policy, or decision.
74
This page intentionally left blank.

Assessment F (Workflow – Clinical)
The views, opinions, and/or findings contained in this report are those of the assessment team and should not be construed as an official government position, policy, or decision.
75
6 Access Part F (“Assessment F”), Section 201 of the Veterans Access, Choice, and Accountability Act of 2014 (“the Choice Act”) mandates an assessment of the organization, workflow processes, and tools used to support inpatient access to care. We define access as the processes by which patients, in need of acute hospital care, are appropriately triaged and admitted to an inpatient bed. Patients may be admitted through a series of different channels including: through the Emergency Department (ED), as a direct admission from a physician’s office, as a transfer from another facility, or as a scheduled admission following a procedure (e.g., a surgery that requires hospitalization following the procedure). Several factors contribute to inpatient access including, but not limited to, the availability of beds, the appropriateness of admissions, staffing and individual clinician capacity, scheduling of elective procedures relative to projected demand for beds, and the discharge of patients who no longer require acute care. Access to inpatient care is critical to ensure Veterans are afforded the ability to seek medical care at the appropriate setting when they need it most.
Across VHA’s 121 level 1 and 2 complexity acute-care Medical Centers (e.g., VAMCs that have an ED and provide extensive inpatient care),119 approximately 600,000 patients120 are admitted each year. This assessment primarily focuses on the ED, as more than 75 percent of VHA inpatients are admitted through this channel.121 Additionally, this assessment will focus on the bed management process by which patients are assigned a bed following direct admission, transfer, or surgery. While the scheduling process for elective procedures impacts inpatient access to care, it is an adjacency that falls in the scope for Assessment E. As a result, findings and recommendations related to scheduled procedures are addressed in Assessment E. Additionally, access bottlenecks related to patients who no longer require acute care yet continue to occupy inpatient beds, are covered in Section 7, length-of-stay management and care transitions, of this report. This section focuses exclusively on the organizational structure, workflow processes, and tools related to admissions in the acute setting and inpatient bed assignment. It supplements the findings outlined in Assessment A on current and projected Veteran demographics and in Assessment D on appropriate system-wide access standards, to assess the mechanisms in place, nationally and at the VAMCs, to support current Veteran demand for inpatient access to care.
119 Given the focus of Assessment F on inpatient medical facilities, we chose to only visit VAMCs providing
substantial inpatient medical care (complexity levels 1a, 1b, 1c, and 2), and did not include other types of facilities (e.g., community-based outpatient clinics [CBOCs], complexity level 3 facilities)
120 VHA Med SAS encounter level data for Levels 1 and 2 VAMCs (n=121 facilities, 586,000 admissions) 121 EDIS (FY14) patient intake data and National Surgery Office (FY14) admissions data. VHA data sources
triangulated with site visit interviews and ED throughput workshop (n=21) to verify percentages.
Assessment F (Workflow – Clinical)
The views, opinions, and/or findings contained in this report are those of the assessment team and should not be construed as an official government position, policy, or decision.
76
6.1 Summary
Assessment Approach
As described in the methodology of this report (Section 2), we collected information in several ways, using a common approach across sub-assessment areas within Assessment F:
Site visits completed to 21 VAMCs (complexity level 1a, 1b, 1c, and 2), in which we:
o Conducted over 50 interviews with administrative, ED, OR, bed management, and quality leadership, at the VAMC level, to gain their perspective on patient flow and inpatient access.
o Facilitated 21 ED throughput assessment workshops with 3 to 10 front-line ED and inpatient personnel representing a variety of disciplines (e.g., physicians, nurses, allied health professionals) to outline the facility’s ED flow, document strengths and challenges, and discuss potential solutions/recommendations.
o Observed processes and tools implemented to address patient flow challenges, firsthand, through facility tours and on-unit observations with both day and night shift ED and floor nurses.
Data call sent to leadership in ED, surgery, and bed management to gather data that is not consistently maintained at the national level (e.g., number of patients diverted from the ED due to insufficient bed availability, prevalence of best practices, current or planned performance management initiatives), completed by 55 respondents across 121 (45 percent) of VAMCs (complexity level 1a, 1b, 1c, and 2).122
Survey sent to all clinical staff (e.g., ED physicians; surgeons; hospitalists; charge, floor and utilization management nurses; and allied health professionals) across VAMCs to understand their perspective on inpatient flow and access, completed by 247 respondents, 71 respondents across 121 (59 percent ) of VAMCs (complexity level 1a, 1b, 1c, and 2).123 Due to the fact that VHA does not track the setting of work (i.e., inpatient or outpatient) in available human resource data and we did not control the distribution of the survey to the end-user we are unable to calculate the significance of the total response rate, but do not believe it to be a representative sample across any of the roles. Given this, survey data should be viewed as providing anecdotal insights as opposed to a representative data sample.
Data collection gathered from national tools (e.g., Emergency Department Integrated System, EDIS, National Bed Control Database, NBCD), including ED length of stay (LOS) for
122 Total VAMC count depends on whether campuses of the same parent station are counted as separate VAMCs
or one entity. We have based the count used in our site selection (122) on data drawn from VSSC, 2014 and SAIL, 2014 (see Appendix). In some instances, we use 121 as the denominator, based on data available in the data sets most commonly used for that section.
123 Total VAMC count depends on whether campuses of the same parent station are counted as separate VAMCs or one entity. We have based the count used in our site selection (122) on data drawn from VSSC, 2014 and SAIL, 2014 (see Appendix). In some instances, we use 121 as the denominator, based on data available in the data sets most commonly used for that section.

Assessment F (Workflow – Clinical)
The views, opinions, and/or findings contained in this report are those of the assessment team and should not be construed as an official government position, policy, or decision.
77
admitted patients and the number of patients who leave the hospital without being seen (LWBS).
Interviews with leadership from multiple VHACO offices, including the Department of Emergency Medicine and the Office of Systems Redesign and Improvement, focused on inpatient access.
Direct admits, surgery patients, and ED admissions are all funneled through the bed management process to receive bed assignments. Given the associated interdependencies across admission routes, a series of timeliness and quality metrics can be used to assess overall access to inpatient care and serve as proxy for bed availability across all admission channels (Hwang, 2011). While confounding factors influencing these metrics should be acknowledged, including number of ED visits that are not clinically appropriate, effects of inpatient bed occupancy, and discharge delays for patients without appropriate post-acute accommodations,124 these metrics taken as a whole still provide an industry-accepted proxy for inpatient access (Welch, 2011).
Having collected information to understand VHA’s practices with respect to inpatient access, we then assessed how these practices compared to best practices and industry benchmarks. Best practices and benchmarks, detailed in Appendix C-1, were identified through several sources, including:
Interviews with leadership from high-performing hospitals (internal and external to VHA), selected based on their admitted ED LOS, as reported to CMS or in EDIS125 (CMS Hospital Compare, 2014).
Academic literature (e.g., research on best practices related to ED throughput) and public reporting of benchmark data to CMS.
In aggregate, a greater percentage of VHA admissions originate in the ED (75 percent of admissions) as compared to market averages (50 percent of admissions) (Pines, 2013). Additionally, VAMCs have longer-admitted ED LOS and a higher rate of LWBS patients, as compared to market averages,126 as detailed in Section 6.2.3.127 When comparing VHA performance statistics with private facilities, however, it is important to note the impact of different clinical services and patient populations on access. For example, if a facility offers fewer surgical services, then it will likely have fewer planned surgical admissions thus its percentage of ED admissions will likely be higher as compared to a hospital with more surgical services. Further in looking a different patient populations, the prevalence of mental health, co-morbidities, and sociodemographic challenges (e.g., low income and homelessness), which are currently being assessed by Assessment A, can lead to increased ED demand (Hastings 2013; Tsai, 2015; Doran, 2013). As a result, there are several reasons why VHA’s unique patient
124 Site visit ED throughput workshops (N =21 sites) 125 EDIS (FY14) 126 EDIS (FY14) and CMS Hospital Compare (FY14) 127 VHA admit ED LOS is 277 minutes compared with a market average of 270, additionally LWBS rates are about
3 percent at VHA and the market average is 2 percent (VHA EDIS FY14 data, CMS Hospital Compare data FY14)

Assessment F (Workflow – Clinical)
The views, opinions, and/or findings contained in this report are those of the assessment team and should not be construed as an official government position, policy, or decision.
78
population could drive an increased ED demand, thus impacting its performance metrics relative to market averages:
Higher incidence of mental health: Patients with mental health diagnoses are less likely to seek regular medical treatment (Hoester, 2012). When they do seek medical treatment it is often in the ED following the advancement of their condition and exacerbation of symptoms (Hoester, 2012). When presenting in the ED, these patients may also require additional resources (e.g., some mental health patients in the ED require a 1:1 clinician ratio). These factors are especially relevant given that on average, 20 to 40 percent of recently returned service members and Veterans are diagnosed with a mental disorder, compared with only 4.2 percent of the general population (Behavioral Health Barometer, 2014; Report of the Department of Defense on Mental Health, 2007).
Higher incidence of co-morbidities: Patients with co-morbidities, especially related to cardiac disease, have greater ED use (Doran, 2013). This is noteworthy given the prevalence of hypertension among VHA patients is nearly double that of the private sector, 52 percent compared with 26 percent (Klein, 2011, Unique Veteran Users Report FY12, 2014).
Higher incidence of homelessness: Homelessness is a key predictor of ED utilization (Doran, 2013). In 2010 Veterans accounted for 10 percent of the adult population but 16 percent of the adult homeless population (Profile of Sheltered Homeless Veterans for FY9 & FY10, 2012). Despite recent efforts and reductions in Veteran homelessness, rates of homelessness are still more than 30 percent higher than those of the general public (National Alliance to End Homelessness, 2015).
Given these confounding factors, we have chosen to balance market comparisons and benchmarks from the private sector with comparisons and benchmarks internal to VHA as well. However, our ability to effectively benchmark VHA practices was, in many instances, hampered by the unavailability of VHA data. For example, VHACO does not maintain standardized, accurate data on its current inpatient capacity, including the number of operational inpatient beds per facility and staffing levels by unit or shift. Additionally, VHA does not have a clear picture of its demand (e.g., patients in need of care from a VAMC) as it does not track, at a national level, the number of patients diverted to another facility due to insufficient VAMC capacity. Given that this demand and capacity data has inpatient access implications (e.g., patients that cannot be cared for at VAMCs due to capacity issues are diverted or transferred to private facilities and cared for with non-VA care funding), data access was a significant impediment to our ability to assess VHA inpatient access. Furthermore, VHA data management is inferior to that seen in the private sector, as detailed in Section 6.2.1, which we presume affects VHA’s own ability to effectively manage inpatient access.
Summary of Findings
We observed several key areas of strength and challenge related to inpatient access at VHA. In accordance with the legislation, these findings apply to the organization, processes, and tools, currently in place at VHA; a detailed mapping to the organization, processes, and tools framework is available in Appendix C-2.

Assessment F (Workflow – Clinical)
The views, opinions, and/or findings contained in this report are those of the assessment team and should not be construed as an official government position, policy, or decision.
79
6.2.1 Data gaps limit VHA’s understanding of patient demand patterns and available VAMC capacity. VHA maintains several different tools to manage access and flow; however, a lack of integration across tools, inconsistent methods for tracking data, and gaps in key flow metrics result in highly variable, non-actionable demand and capacity data. For example, in looking at one facility, the national bed control database (NBCD) shows that 81 percent of that VAMC’s inpatient beds are operational128 (e.g., beds are available for patients); however, the facility reports that only 51 percent of their beds are available for patients129 due to unreported staffing and construction-related bed closures. Additionally, this facility does not consistently track its missed demand (e.g., patients who leave without being seen by a provider and/or patients who are diverted/transferred to another facility because the VAMC is at capacity or lacks required services), so it does not know if its limited bed capacity is impacting inpatient access. Refer to Section 5 for additional detail on capacity limitations due to staffing.
6.2.2 Hospital visits and admissions that are not clinically appropriate (e.g., from the ED and surgical suite) contribute to ED bottlenecks and limit bed availability. More than 120,000 admissions, approximately 20 to 25 percent130 of ED and post-operative admissions fail to meet McKesson InterQual admissions criteria,131 compared with 10 to 15 percent in the private sector (Sheehy, 2013; Stranges, 2010). Of those VHA admissions that failed to meet criteria, we found that 30 percent (7 percent of total admissions)132 are attributed to limited access to the appropriate setting of care (e.g., outpatient access, level-of-care availability, and social issues).
6.2.3 Best practices related to workflow and performance management exist at some facilities, but have not been scaled across the system. Compared with market averages, 50 percent of VAMCs report longer LOS for patients admitted from the ED and 59 percent report higher LWBS rates133 (i.e., more patients leave VAMCs without being seen by a provider). While some facilities have successfully operationalized industry-accepted best practices (e.g., fast track, clinical protocols in triage, flow management teams) — Boston VAMC’s missed opportunities134 are under 1 percent (the VAMC goal is under 3 percent135), adoption is limited system-wide.
128 VHA National Bed Control Database, patient transfer file (FY14) 129 Site visit ED throughput workshop (N=21 sites) 130 NUMI (FY14) admissions appropriateness 131 McKesson InterQual is a tool that provides evidence-based clinical decision support on the appropriateness of
care (including admissions and continuing stays) 132 NUMI (FY14) admissions appropriateness 133 VHA ED LOS and LWBS rates pulled from EDIS FY14 data and compared with CMS’s Hospital Compare data FY14 134 Missed opportunities defined as LWBS, left against medical advice (AMA), and elopement 135 Site visit interview (West Roxburry VAMC)

Assessment F (Workflow – Clinical)
The views, opinions, and/or findings contained in this report are those of the assessment team and should not be construed as an official government position, policy, or decision.
80
Summary of Recommendations
Our assessment revealed several areas where VHA can build on current strengths or address existing challenges to improve inpatient access to care. We recommend that VHA consider three strategic themes, as detailed below. As with the findings, these themes apply to VHA organization, processes, and tools.
6.3.1 Develop an accurate end-to-end picture of patient demand and VAMC capacity. VHA should simplify the process and required approvals by which beds are classified as operational and standardize the definition and tracking of patient demand. Additionally, VHA should develop a prioritized set of standardized metrics to track patient flow, including current demand and capacity, at the facility, VISN, and VHACO levels. Once that infrastructure is in place, VHA can consider building an analytical model to more accurately predict future patient demand.
6.3.2 Decrease the number of clinically inappropriate admissions due to limited access to sub-acute care. VHA should assess the availability of alternative settings of care, at the regional level or VISN level, first to understand any gaps and then to determine how best to address those gaps (e.g., through direct investment and/or community partnership). At the facility level, VAMCs should dedicate appropriate patient support resources (e.g., case managers and social workers) to coordinate transitions from the ED and surgical departments to these settings of care. Once the infrastructure is in place to support these patients outside the acute setting, VAMCs should begin to hold physicians accountable for appropriateness of admissions (e.g., include utilization management in physician performance appraisals).
6.3.3 Expand use of evidence-based processes for managing patient flow, including clear role assignments and individual performance management. VHA should focus on expediting care in the ED through the early initiation of clinical protocols in triage and implementation of fast track processes for low-acuity patients. Additionally admission and bed assignment processes should be streamlined through clearer role assignment and better utilization of available tools.
Past Findings and Recommendations
Over the last ten years, the majority of access assessments has focused on outpatient care. While outpatient access has clear impacts on inpatient access, there are different metrics for evaluating inpatient access (Perlin, 2004). Details related to these previous reports are outlined in Assessment E.
In focusing our effort on inpatient access to care, OIG assessments and academic research identified several factors that hinder ED throughput and patient flow. These assessments have focused primarily on factors related to organization and processes, as detailed in Appendix C-3 and C-4, and reflect many of the same challenges and opportunities that we found during our assessment. Previously identified challenges include:
1. Insufficient inpatient bed availability to meet ED demand

Assessment F (Workflow – Clinical)
The views, opinions, and/or findings contained in this report are those of the assessment team and should not be construed as an official government position, policy, or decision.
81
2. Ineffective triage and monitoring at some facilities
3. Inadequate specialty services in the ED, particularly mental health services
Note that these three examples illustrate the type of factors identified in recent years, and are not intended to be a comprehensive listing. These past assessments have tended to focus on specific issues and/or individual facilities, separately developing recommendations for improvement in discrete areas. In contrast, our assessment tries to take an end-to-end view of inpatient clinical operations across the five key sub-assessment areas and all high- and medium-complexity VAMCs.
6.2 Findings
Through our site visits, data analysis, interviews, and benchmarking we identified strengths and challenges to inpatient access across VHA inpatient care setting. The sub-sections that follow (6.2.1, 6.2.2, and 6.2.3) describe these findings in detail, including information on what we believe the drivers of each finding to be.
6.2.1 Data gaps limit VHA’s understanding of patient demand patterns and available VAMC capacity
6.2.2 Hospital visits and admissions that are not clinically appropriate (e.g., from the ED and surgical suite) contribute to ED bottlenecks and limit bed availability
6.2.3 Best practices related to workflow and performance management exist at some facilities, but have not been scaled across the system
As noted in Section 2.2, data issues prevented us from conclusively assessing many areas of inpatient access. We have used the national data sets that were available, information returned as part of the data call, and perceptions and experience reported or observed during site visits or via the staff survey. In many instances where data does not allow us to definitively comment, we have described the potential implications of the data points we do have, along with recommendations in Section 6.3 for further analysis.
Data Gaps Limit VHA’s Understanding of Patient Demand Patterns and Available VAMC Capacity (e.g., bed and staffing)
Inconsistent methods for tracking available physical bed counts and patient care needs at the unit and facility levels limit VHA’s ability to accurately manage VAMC capacity (e.g., staffing and bed availability) to patient demand. While, VHA has several different tools to monitor demand and capacity (e.g., National Bed Control System, Bed Management System, ED tracking system), they do not integrate with one another and each tool maintains its own master data. These technical limitations restrict end-users’ ability to aggregate information across tools. Given the challenges and inaccuracies we encountered in both gathering and analyzing data, it raises the hypothesis that data access and validity are also an impediment to VHA’s own ability to provide effective oversight.
Two key drivers of data challenges related to patient demand and inpatient capacity are:

Assessment F (Workflow – Clinical)
The views, opinions, and/or findings contained in this report are those of the assessment team and should not be construed as an official government position, policy, or decision.
82
6.2.1.1 Inaccurate view of bed capacity across multiple tools limits VHA’s ability to understand current capacity
6.2.1.2 Incomplete view of patient demand, including unmet patient care needs, limits VHA’s ability to understand demand relative to current capacity
6.2.1.1 Inaccurate View of Bed Capacity Across Multiple Tools
The VA National Bed Control Database (NBCD) and the VA Bed Management System (BMS) both track bed capacity, including the number of authorized beds, operational beds, and unavailable beds. The VHA handbook on Inpatient Bed Change Programs and Procedures defines “authorized beds as the potential capacity of a medical center, operational beds as the number of beds staffed and available for a potential admission, and unavailable beds as the number of beds closed for any reason” (VHA Handbook 1000.01, 2010). Our analysis, as demonstrated in Figure 6-1 shows that the actual number of available beds at a VAMC may be lower than the reported number of operational bed numbers, as tracked in NBCD and BMS.
Figure 6-1. VAMC Bed Capacity

Assessment F (Workflow – Clinical)
The views, opinions, and/or findings contained in this report are those of the assessment team and should not be construed as an official government position, policy, or decision.
83
The noted discrepancy in bed counts is likely a result of the heavily bureaucratic and political process required to officially adjust bed counts136. NBCD is used to provide Congressionally-mandated reports on VHA bed capacity and requires a formal process to make changes to a Medical Center’s bed counts. Prior to submitting a bed change request, a facility must receive pre-approval and communicate its proposed changes to external stakeholders, including Veteran Service Organizations and Congressional offices. Next, the VAMC and/or VISN must submit an electronic bed change request (a “bed letter”) through NBCD for approval from the VISN Director, VHACO Patient Care Services, the Deputy Under Secretary for Health for operations management and, in some instances, Congress. It is important to note that bed changes are only required for closures projected to be greater than 60 days (VHA Handbook 1000.01, 2010); which allows VAMCs the flexibility to not report bed closures they anticipate the closure will be less than 60 days.
Even once administrators have deemed a bed closure appropriate, there is often concern from the community. Some cities have held public forums to enable citizens to voice their opposition to the bed closures. Following the proposed closure of beds at a VAMC in South Dakota, one Veteran in a public forum stated, “public input needs to carry weight with any changes in the system, and there needs to be assurance that quality of service and care…is not compromised” (Wooster, 2011).
The result of this arduous bed change process and public concern is that VAMCs rarely submit formalized bed changes, resulting in inaccurate NBCD bed counts. In many cases this discrepancy incorrectly shows VAMCs working at well below capacity, because while they may have closed beds due to construction and/or insufficient staffing, those unavailable beds are not reflected in NBCD.137 Take the following illustrative example: A facility has 100 operational beds in NBCD but they can only staff 80 beds (e.g., 20 beds are closed locally) and their average daily patient census is 75; it appears as if the facility is running at 75 percent capacity but in actuality it is at 94 percent capacity. This scenario is common across VAMCs — 44 percent of VAMC data call respondents indicated that they have closed beds due to insufficient staffing138 and site visit interviewees stated that they regularly close beds without reporting bed closures to NBCD.139 Section 5 provides additional context on the drivers behind staffing-related bed closures including: hiring challenges, a misallocation of staff as compared with patient demand, and limited flex resources (e.g., float pool, agency) to account for short-term vacancies (e.g., call-offs, vacations, sick-leave).
One goal of BMS is to attempt to address this discrepancy by supporting the day-to-day management of patient placement and bed flow. BMS allows users to remove beds from the “Operating Beds” roster and designate them as unavailable. The challenge is that while BMS pulls operating bed data from NBCD, local updates made in BMS are not updated in VistA or NBCD (BMS Quarterly Bed Reconciliation Report, 2015). Some facilities choose not to “close”
136 VHACO leadership interview 137 VHACO SME Interview 138 Choice Act data call, staffing question (N=62) 139 Site visit ED throughout assessment workshops (N=21 sites)

Assessment F (Workflow – Clinical)
The views, opinions, and/or findings contained in this report are those of the assessment team and should not be construed as an official government position, policy, or decision.
84
beds in the BMS tool so they can rotate bed assignments and expedite bed turnover.140 This also limits the accuracy of the data.
6.2.1.2 Incomplete View of Patient Demand, Including Unmet Patient Care Needs, Limits VHA’s Ability to Understand Demand Relative to Current Capacity
In addition to an inaccurate view of available bed capacity, VHA has an incomplete understanding of inpatient demand. Literature emphasizes the importance of tracking demand from both the ED (e.g., the number of ED encounters by hour and acuity, percentages of beds occupied by hour, admission rates by hour and acuity) and scheduled procedures (e.g., the number of scheduled procedures requiring inpatient admissions per day) (Welch, 2011).
While VHA tracks some of these measures consistently; including the volume of ED visits and scheduled procedures; ED, inpatient, and surgical data is siloed in tools (e.g., EDIS and NSO). For example, the Emergency Department Integrated Software (EDIS)141 tracks ED encounters, the National Surgery Office tracks scheduled procedures, and BMS tracks inpatient bed occupancy, yet none of these tools integrates with one another.142 Sixty-seven percent of individuals interviewed during sites visited cited this lack of tool integration as a challenge to patient flow.143 As a result, most VAMCs lack an overall picture of demand across admission channels. Additionally, while EDIS tracks ED volume, disposition, and throughput measures for example, admitted LOS, discharged LOS, door to doctor, and LWBS rates) its accuracy is limited by inappropriate use of the tool. For example, EDIS data reliability metrics indicate that facilities are more than 90 percent accurate in documenting patient visits but only 50 percent reliable when inputting patient information required for timeliness and disposition metrics.144 This variability in data accuracy and reliability further limits VHA’s understanding of demand.
Some sites have developed sophisticated offline models, as demonstrated in Table 6-1, to reconcile data across the multiple tools; however, there is often a disconnect in the master data across tools challenging accuracy and reliability.
Table 6-1. VAMC Case Study: Data Management
Best practice case study – Palo Alto VAMC
Palo Alto aggregates patient flow data across VAMC tools, including: EDIS, NUMI, NBCD, and VistA, to provide front-line staff with daily reports and monthly dashboards on patient flow metrics and performance outcomes
Key reports from the data analytics team:
140 Site visit ED throughout assessment workshops (N=21 sites)
141 EDIS is an application that extends the functionality of CPRS to help health care professionals in the ED track manage flow, including: “adding ED patients to a display board, viewing patient information on the display board, editing patient information, and creating administrative reports (EDIS user guide 1.0, 2010). 142 Site visit ED throughput workshops (N =21 sites) 143 Site visit ED throughput workshops (N =21 sites) 144 EDIS FY14 data reliability metrics

Assessment F (Workflow – Clinical)
The views, opinions, and/or findings contained in this report are those of the assessment team and should not be construed as an official government position, policy, or decision.
85
Best practice case study – Palo Alto VAMC
Bed control report: Daily report for inpatient medicine and surgery teams, includes data on ED throughput, new admissions, and patient flow145
Admissions dashboard: Quarterly report for leadership and front line on admissions, fee costs, readmission rates, and utilization management146
Bed stewardship and inpatient flow dashboard: Quarterly report for leadership and front-line on LOS, occupancy rates, census by unit, observation rates, and transfer rates147
Lessons learned:
Develop, track, and distribute metrics that are most important to your team: ED and inpatient teams use the bed control report during their daily medical and surgical rounds; this has enabled the front-line to hone key metrics and has driven more accurate and timely input of those metrics (e.g., because data entry errors are readily apparent during rounding)148
Outline workarounds to address gaps in tool functionality: ED always conducts a MRSA swab prior to admission; the time of this swab is used as a proxy to “start the clock” in measuring time from ED decision to admit to inpatient bed placement149
Create early wins to gain front-line acceptance: Limited access to prosthetics was a common complaint in the ED, so one of the department’s first process improvement initiatives was to use data to show the impact of prosthetic delays on patient flow and wait times, this has considerably improved access to prosthetics in the ED150
Impact from the data analytics team:
Time from admission order to bed order time has decreased by almost 30min151
ED LOS has remained constant from February 2014 to March 2015 despite a 37 percent increase in patient demand 152
Admissions delays due to bed availability have decreased from 92 percent in March FY13 to 30 percent in March FY15153
Observation admissions have more than doubled since Feb 2014154
145 Palo Alto bed control data (FY14-FY15) 146 Palo Alto performance dashboard (FY13-FY15) 147 Palo Alto bed stewardship and inpatient flow dashboard (FY13-FY15) 148 Palo Alto interview with ED nurse manager 149 Palo Alto interview with ED nurse manager 150 Palo Alto interview with ED nurse manager 151 Palo Alto bed control data (FY14-FY15) 152 Palo Alto bed control data (FY14-FY15) 153 Palo Alto bed stewardship and inpatient flow dashboard (FY13-FY15) 154 Palo Alto bed stewardship and inpatient flow dashboard (FY13-FY15)

Assessment F (Workflow – Clinical)
The views, opinions, and/or findings contained in this report are those of the assessment team and should not be construed as an official government position, policy, or decision.
86
Best practice case study – Palo Alto VAMC
Boarder percentages (e.g., patient who stay over 6 hours in the ED) have decreased from 79 percent in FY14 to 57 percent in FY15155
In addition to tracking patients cared for, literature also supports the importance of understanding missed or unmet patient demand (Welch, 2011). EDIS tracks missed opportunities (e.g., left without being seen, against medical advice); however, we did not observe a standardized process for tracking patients who are diverted or transferred to another facility because a VAMC is at capacity due to staffing or occupancy constraints. Some facilities have started to track diversions and transfers locally, but there are several challenges with this approach:
There are not standard definitions for diversions and transfers — e.g., some VAMCs define diversion as an inability to accept ambulances while others declare diversion when all inpatient beds are full, or when the wait time for an inpatient bed will be in excess of 2 hours.156
There are not standard processes for diverting or transferring patients — e.g., some VAMCs send patients in the ED to other hospitals when inpatient beds are not available, while others board those patients in the ED.157
There is not a standard approach for tracking diversion and transfer data — e.g., most VAMCs track hours on diversion, but not patients diverted or transferred; without understanding the number of patients sent to another facility due to capacity constraints, VHA is unable to quantify its missed demand.158
At a central level, VHA tracks the spend on non-VHA care consults, but it does not segment this spend by the cause of the consults (e.g., diversions, availability of specialty, patient choice). Understanding the financial losses associated with missed demand, if they exist, would allow VHA to better understand its capacity at a basic level and provide clear support for increasing capacity (e.g., new physical beds and/or additional staffing) if necessary.
Hospital Visits and Admissions (e.g., from the ED and surgical suite) That are not Clinically Appropriate Contribute to ED Bottlenecks and Limit Bed Availability
As seen in the private sector, VAMC EDs often serve as a “catch-all” for patients who cannot find care in a more appropriate, lower-acuity setting. These low-acuity patients congest the ED, thus limiting access for other patients who require acute care.159
155 Palo Alto performance dashboard (FY13-FY15) 156 Site visit assessment workshops (N=21 sites) 157 Site visit assessment workshops (N=21 sites) 158 Site visit assessment workshops (N=21 sites) 159 Site visit ED throughput workshop (N=21 sites)

Assessment F (Workflow – Clinical)
The views, opinions, and/or findings contained in this report are those of the assessment team and should not be construed as an official government position, policy, or decision.
87
The admission of patients who do not require acute medical care further congests the ED and limits bed availability. In many instances, it may be imprudent to discharge these Veterans home due to a variety of concerns, including: lack of housing and/or transportation issues following a procedure requiring sedation; mental health and substance abuse challenges; and an inability to care for themselves. A chief of surgery at one VAMC explained, “We have many patients who travel a long distance for an outpatient surgical procedure but who, following the procedure and the administration of conscious sedation drugs, have no one to drive them home and care for them while the medication wears off. Since we do not have domiciliary care or inpatient rehabilitation, our only option is to admit these patients [or proactively cancel their surgery].160” However, admitting these patients without an acute medical need not only limits bed availability for patients who do not require acute care and has clear financial implications, as detailed in Section 6.3.5., but it also puts those patients at risk for hospital-acquired infections. The CDC reports that 1 in 25 hospital patients has at least one hospital-acquired infection. As a result, patients who do not have an acute medical need for an inpatient stay are at a greater risk of disease if admitted (Magill, 2014).
In analyzing admissions through the ED, VHA admissions are approximately 65 percent higher than the national average, as shown in Figure 6.2.161 While this variation could be attributed to the complexity of the VHA patient population, as outlined in Section 6.1.1, the acuity of patients that present in the ED, as defined by the Emergency Severity Index (ESI), are on par with national averages. ESI is a five-level ED triage algorithm that stratifies patients into five groups from least to most urgent based on patient acuity and resources needs, with an ESI-1 as the most urgent score. It is important to note that while ESI is an accepted tool to stratify patients based on acuity and resource needs, it is not designed to capture the nuances and complexity of the patient beyond their most acute needs. Given the co-morbidities and social dynamics of the VHA patient population162 (e.g., mental health issues, substance abuse, homelessness) as compared with the general population, it is reasonable to assume that some of this discrepancy in admission rates may be justified. However, even assuming that a greater proportion of VHA admissions is justified due to patient demographics and comorbidities, VHA admission percentages are still considerably higher than those in the private sector and warrants further study.
160 Site visit department chief interview 161 EDIS FY14 admissions data 162 Refer to assessment A for additional detail
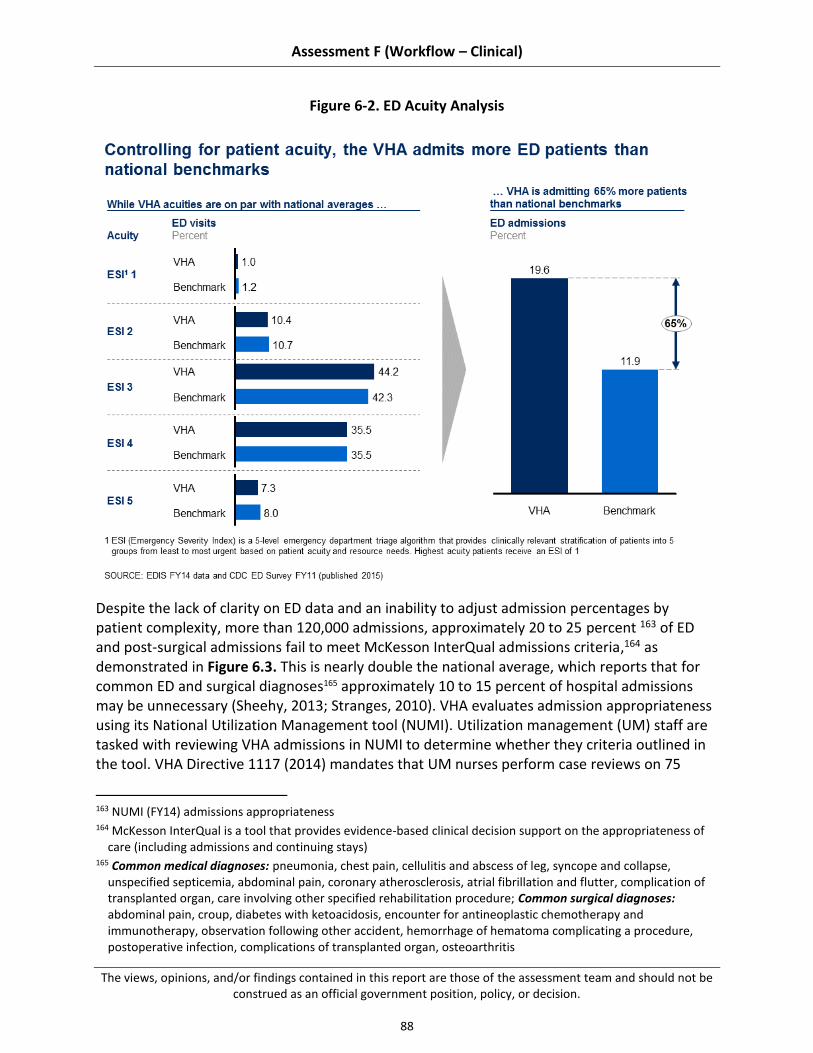
Assessment F (Workflow – Clinical)
The views, opinions, and/or findings contained in this report are those of the assessment team and should not be construed as an official government position, policy, or decision.
88
Figure 6-2. ED Acuity Analysis
Despite the lack of clarity on ED data and an inability to adjust admission percentages by patient complexity, more than 120,000 admissions, approximately 20 to 25 percent 163 of ED and post-surgical admissions fail to meet McKesson InterQual admissions criteria,164 as demonstrated in Figure 6.3. This is nearly double the national average, which reports that for common ED and surgical diagnoses165 approximately 10 to 15 percent of hospital admissions may be unnecessary (Sheehy, 2013; Stranges, 2010). VHA evaluates admission appropriateness using its National Utilization Management tool (NUMI). Utilization management (UM) staff are tasked with reviewing VHA admissions in NUMI to determine whether they criteria outlined in the tool. VHA Directive 1117 (2014) mandates that UM nurses perform case reviews on 75
163 NUMI (FY14) admissions appropriateness 164 McKesson InterQual is a tool that provides evidence-based clinical decision support on the appropriateness of
care (including admissions and continuing stays) 165 Common medical diagnoses: pneumonia, chest pain, cellulitis and abscess of leg, syncope and collapse,
unspecified septicemia, abdominal pain, coronary atherosclerosis, atrial fibrillation and flutter, complication of transplanted organ, care involving other specified rehabilitation procedure; Common surgical diagnoses: abdominal pain, croup, diabetes with ketoacidosis, encounter for antineoplastic chemotherapy and immunotherapy, observation following other accident, hemorrhage of hematoma complicating a procedure, postoperative infection, complications of transplanted organ, osteoarthritis

Assessment F (Workflow – Clinical)
The views, opinions, and/or findings contained in this report are those of the assessment team and should not be construed as an official government position, policy, or decision.
89
percent of admissions, observation stays, and subsequent days of care and enter results into the NUMI application. Of VHA admissions that fail to meet InterQual criteria, 30 percent (or seven percent166 of total admissions) are attributed to limited access to appropriate care, as an alternative to the inpatient setting (e.g., level of care availability, outpatient access, and social issues). In contrast to VHA, private sector hospitals must adhere to stringent criteria for Medicare inpatient admissions (e.g., InterQual) or face CMS fines through the Recovery Audit Contractor program (RAC)167 (Sheehy, 2013).
Figure 6-3. Inpatient Admissions for Patients With Limited Access to Sub-Acute Care Hinder Access and Patient Flow
Four key drivers of clinically inappropriate visits and admissions that were highlighted through our assessment, include:
166 NUMI (FY14) admissions appropriateness 167 “The Recovery Audit Program’s mission is to identify and correct Medicare improper payments through the
efficient detection and collection of overpayments made on claims of health care services provided to Medicare beneficiaries, and the identification of underpayments to providers so that the CMS can implement actions that will prevent future improper payments in all 50 states.” (CMS.gov, 2015)
Assessment F (Workflow – Clinical)
The views, opinions, and/or findings contained in this report are those of the assessment team and should not be construed as an official government position, policy, or decision.
90
6.2.2.1 Demographic characteristics of Veterans (e.g., higher incidence of mental health diagnoses, co-morbidities, and homelessness among Veterans as compared to the general population)
6.2.2.2 Limited access to immediate (e.g., same day or same week) primary and urgent care clinic appointments, contributing to ED demand
6.2.2.3 Insufficient access to sub-acute facilities (e.g., short-term rehab, detox clinics) for patients who should not be discharged home following an ED visit or surgical procedure, but do not require admission to an inpatient bed
6.2.2.4 Minimal physician acceptance of and accountability for utilization management admission standards (e.g., the evaluation of the appropriateness of health care services according to evidence based criteria)
6.2.2.5 Lack of integration across tools
6.2.2.1 Demographic Characteristics of Veterans
As discussed in Section 6.1.1, VHA serves a unique patient population with a higher prevalence of mental health, co-morbidities, and homelessness, as compared with the general public (Behavioral Health Barometer, 2014; Report of the Department of Defense on Mental Health, 2007; Klein, 2011; Unique Veteran Users Report FY12, 2014; Profile of Sheltered Homeless Veterans for FY9 and FY10, 2012). Each of these characteristics is a predictor of higher repeat ED utilization, especially for care that may be better provided in a lower-acuity setting (Hastings 2013; Tsai, 2015; Doran, 2013). Refer to Assessment A for additional detail on Veteran demographics and demand for health care services.
6.2.2.2 Limited Access to Immediate (e.g., same day or same week) Primary and Urgent Care Clinic Appointments Contributes to ED Demand
ED leadership across sites commented on the volume of ED visits that are not clinically appropriate, remarking that patients rely on the ED for prescription refills, primary and follow-up care, as well as other non-urgent needs (Doran, 2013).168 More than 70 percent of front-line employees who attended our ED workshop attribute this clinically inappropriate volume to outpatient access challenges, including understaffing of primary care and inconvenient clinic hours (e.g., lack of night and weekend availability).169 While we are not addressing clinic access, as clinic scheduling is detailed in Assessment E, limited access to outpatient care is a key contributor to inpatient access challenges.
168 Site visit ED shadowing sessions (N=21 sites) 169 Site visit ED throughput workshops and shadowing sessions (N =21 sites)

Assessment F (Workflow – Clinical)
The views, opinions, and/or findings contained in this report are those of the assessment team and should not be construed as an official government position, policy, or decision.
91
6.2.2.3 Insufficient Access to Sub-acute Facilities (e.g., short-term rehab, detox clinics) for Patients who Should not be Discharged Home Following an ED visit or Surgical Procedure, but do not Require Admission to an Inpatient Bed
As demonstrated in Figure 6-3, more than 30 percent of admissions that fail to meet InterQual criteria are due to limited access to appropriate care settings.170 Limited access may be attributed to: (1) insufficient number of sub-acute facilities; and (2) inadequate support in the hospital to help patients and physicians navigate admission alternatives.
Insufficient number of sub-acute facilities: Fifty-five percent of VAMCs visited attribute the high number of admissions that fail to meet NUMI criteria to a lack of VHA or contracted facilities for sub-acute care (e.g., detox clinics, short-term rehab).171,172 Literature further supports this connection between availability of care alternatives and a reduction in clinically inappropriate hospital utilization, showing that offering transitional and long-term housing to homeless ED patients in conjunction with case management support led to a 29 percent reduction in admissions and a 24 percent decrease in ED visits compared with usual care (Sadowski, 2009). Fargo VAMC recently contracted with a community detox center to care for patients who present in the ED for substance abuse issues. The detox center provides 24/7 care for those patients who do not require acute medical attention.173 While it is too soon to assess the impact of this facility, ED staff have noticed an improvement in ED congestion. Additional detail on current health care capabilities and resources can be found in Assessment B and detail related to appropriate system-wide access to health care furnished by and through the department may be found in Assessment D. Inadequate support in the ED and surgical suites to help patients and physicians navigate admission alternatives (e.g., more appropriate sub-acute settings of care): Fifty percent of VHA survey respondents reported staffing a case manager and/or social worker in the ED174; however, in many instances these individuals are only staffed during the day such that VAMCs lack night and weekend support; 69 percent of case managers interviewed during site visits reported that case managers and social workers are currently understaffed.175 The result is that even when alternate facilities may be available for care – e.g., the detox center in Fargo or funding for conscious sedation patients to stay in a domiciliary unit – physicians and patients are unaware of these facilities and lack appropriate support to transition to these facilities.
170 NUMI admissions appropriateness data (FY14) 171 Site visit discharge planning workshops (N =20 sites) 172 VAMC site visit Case Manager interviews (N=21 sites with one to five case manager and/or social workers in
each interview) 173 Site visit ED throughput assessment workshop 174 Choice Act Survey (N=101 respondents) 175 Site visit ED throughput assessment workshop
Assessment F (Workflow – Clinical)
The views, opinions, and/or findings contained in this report are those of the assessment team and should not be construed as an official government position, policy, or decision.
92
Current literature shows a correlation between case management in the ED and decreases in ED visits, as well as “improved clinical and social outcomes among frequent ED users” (Kumar, 2013). One study shows that a targeted interdisciplinary case management program in the ED led to a 7 percent decrease in ED visits among a historically challenging patient population, similar to VHA’s population (e.g., patients who presented with psychiatric disease, substance abuse, medication non-compliance, and/or unstable housing) (Pillow, 2013).
6.2.2.4 Minimal Physician Acceptance of and Accountability for Utilization Management Admission Standards (e.g., the evaluation of the appropriateness of health care services according to evidence based criteria)
While over 50 percent of department chiefs interviewed cite UM as a high or very high priority at their VAMC,176 they also recognize that “without alternatives (e.g., sub-acute facilities) and resources (e.g., case managers/social workers to help patient navigate alternative settings of care), UM is not very helpful in driving down inappropriate admissions.177” The perceived effectiveness of UM programs varies across VAMCs with 30 percent of facilities stating that their UM program has considerable impact, 30 percent citing marginal impact, and 35 percent identifying little to no impact (5 percent no response).178 Limited physician engagement and adherence to UM standards are likely attributable to: (1) insufficient collaboration between UM RNs, ED physicians, and hospitalists; and (2) lack of physician performance standards around admission appropriateness.
Insufficient collaboration between UM RNs, ED physicians, and hospitalists: Several different conclusions may be drawn from the high percentage of admissions that fail to meet UM criteria because of clinical judgment, as was demonstrated in Figure 6-4. Namely, physicians place little value on UM criteria, and/or documentation does not accurately reflect patients’ care contributing to ineffective UM reviews (addressed in Section 9). McKesson’s InterQual criteria supports more than 3,700 hospitals across the country (McKesson website, 2015), so we believe it is a relevant algorithm, albeit with potential for customization to reflect VA patient characteristics. Section 9 provides additional detail on provider documentation as a potential limiter to effective UM. Across many facilities a tension exists between UM nurses and providers. One department chief commented that this tension is eased when “UM teams work directly with the providers, such that they can make admissions decisions as a team relying on both InterQual criteria and clinical judgment.”179 We observed this in one facility where the UM nurse sat in the ED and conducted prospective admissions reviews with the admitting providers. While effective in driving admission
176 Site visit Department Chief interviews (n=21 facilities with one to three department chiefs in each interview) 177 Site visit Department Chief interviews (n=21 facilities with one to three department chiefs in each interview) 178 Site visit Department Chief interviews (n=21 facilities with one to three department chiefs in each interview) 179 Site visit Department Chief interviews (n=21 facilities with one to three department chiefs in each interview)
Assessment F (Workflow – Clinical)
The views, opinions, and/or findings contained in this report are those of the assessment team and should not be construed as an official government position, policy, or decision.
93
appropriateness, this collaborative model is not the norm as we only observed it in a few facilities (less than 5 percent) who staffed UM nurses in the ED.180 Lack of physician performance standards around admission appropriateness: None of the facilities observed included UM’s admission appropriateness metrics in physicians’ performance appraisals. This is in direct contrast with best practices that promote individual ownership and accountability to drive change (Luxford, 2011) and decrease admissions that fail to meet NUMI criteria. While the infrastructure is not currently in place to support the care of all patients in alternative, non-acute settings, physicians also lack the incentives to direct patients to these settings.
6.2.2.5 Lack of Integration Across Tools
Adding to the complexity and inaccuracy of demand data, EDIS and BMS both track patient flow and throughput effectiveness, but they do not integrate with each another or with the VistA suite.181 Sixty-seven percent of facilities visited cited tool issues (e.g., limited functionality of tool, lack of integration, insufficient training) as a challenge to patient flow.182
Some sites have developed sophisticated offline models, as demonstrated in Table 6-2 to reconcile data across the multiple tools, but there is often a disconnect in the master data across these tools challenging accuracy and reliability.
Best Practices Related to Workflow and Performance Management Exist at Some Facilities, but Have not Been Scaled Across the System
Despite successful implementation of many operational best practices (e.g., fast track, clinical protocols in triage, flow management teams) in select facilities, as detailed in Figure 6-4, adoption is limited system-wide. Additionally, even in top-performing facilities based on ED LOS and LWBS rates, delays in inpatient access can result from insufficient bed availability and inconsistent admission and bed assignment processes.
On average, more than 50 percent of VAMCs have a longer-admitted ED LOS, as compared with the market average (EDIS FY14 and CMS HCAHPS FY14), also shown in Figure 6-4.183 While VHA does serve a complex patient population as described in Section 6.1.1, VHA’s ED acuity (as measured by ESI) is on a par with national averages, as was demonstrated in Figure 6-2. This suggests an opportunity to improve throughput by a more consistent, system-wide implementation of best practices with corresponding performance management.
Two key factors contribute to variability in best practice adoption across the system:
180 Site visit ED throughput workshop (n=21 sites) 181 Site visit ED throughput workshop (n=21 sites) 182 Site visit ED throughput workshop (n=21 sites) 183 More than 70 percent of VAMCs have a longer door-to-doctor time compared with market averages and more
than 55 percent of VAMCs have a higher LWBS rate (EDIS FY14 and CMS FY14).

Assessment F (Workflow – Clinical)
The views, opinions, and/or findings contained in this report are those of the assessment team and should not be construed as an official government position, policy, or decision.
94
6.2.3.1 Inconsistent adoption of proven best practices to manage patient flow within facilities (e.g., early initiation of clinical protocols in ED triage, fast-track processes for low-acuity patients, team focused on managing flow)
6.2.3.2 Limited cross-facility communication and sharing of best practices
Figure 6-4. VHA Lags Market Averages
6.2.3.1 Inconsistent Adoption of Proven Best Practices to Manage Patient Flow Across Facilities
VHA’s centralized Department of Emergency Medicine has taken a logical approach in driving ED performance improvement. It started by standardizing data collection and reporting through the use of the EDIS tool,184 implemented in 2012 (EDIS Installation Guide, 2014). EDIS provides a common tool to track patient flow through the ED as well as measure throughput and effectiveness at a facility, VISN, and national level that is foundational to other improvements. While the Medical Centers use the EDIS tool to varying levels of sophistication, we observed
184 EDIS: Emergency Department Integrated Tracking System

Assessment F (Workflow – Clinical)
The views, opinions, and/or findings contained in this report are those of the assessment team and should not be construed as an official government position, policy, or decision.
95
100 percent utilization across our site visits.185 In light of Finding 6.2.1, data gaps limit VHA understanding of patient demand patterns and available VAMC capacity, this achievement is no small feat.
According to the Department of Emergency Medicine,186 its objective in its next phase is to drive best practice adoption using data and trends from EDIS and eventually from BMS. In the current state, best practice adoption is driven at a local level and varies across the system. This is most evident in the implementation of the following: (1) clinical protocols to initiate care in triage; (2) segmented process for the care of lower-acuity ED patients; and (3) flow management processes and roles to expedite admission and bed placement.
Some facilities, like Boston VAMC as demonstrated below in Figure 6-5, have successfully implemented each of these practices, while others are slower to adopt or have not adopted at all. Boston attributes its success to strong clinical leadership at the facility and ED levels, particularly between the ED Director and ED unit manager.187
185 Site visit ED throughput workshops (N=21 sites) 186 VHACO SME interview 187 Site visit ED throughput workshop (Boston VAMC)

Assessment F (Workflow – Clinical)
The views, opinions, and/or findings contained in this report are those of the assessment team and should not be construed as an official government position, policy, or decision.
96
Figure 6-5. VAMC Case Study: ED Patient Flow
Varied implementation of clinical protocols in triage: Expediting care through the initiation of clinical protocols improves both patient safety and flow (Love, 2012). Dependent on ED volume, two approaches may be taken to expedite the initiation of clinical protocols in triage: staffing a provider (or advanced practitioner) in triage and/or establish standing order sets for RNs to initiate protocols under the supervision of a provider. Across sites surveyed, 24 percent of VAMC data call recipients reported staffing a provider in triage188 and 24 percent of VAMC survey respondents reported using standing orders;189 across data call and survey respondents 68 percent of facilities reported that they neither staff a provider in triage nor utilize standing orders.190 A provider in triage (e.g., a physician or advanced practitioner) has the ability to write orders, start clinical protocols, and discharge patients thereby improving both patient safety and flow. This is evident at Kaiser, which exclusively staffs providers in
188 Choice Act data call (N= 55 sites) 189 Choice Act survey (N=71 sites) 190 Choice Act data call and survey (N= 91 sites)

Assessment F (Workflow – Clinical)
The views, opinions, and/or findings contained in this report are those of the assessment team and should not be construed as an official government position, policy, or decision.
97
ED triage191. Additionally, St Louis VAMC saw a 17 percent decrease in its daily mean ED LOS following the addition of a provider in triage (Day, 2013). While literature supports the staffing of a provider in triage in high-volume EDs, it may not be appropriate in smaller facilities that cannot support dedicating a full-time physician or advanced practitioner. An alternative, observed at some VAMCs and high-performing institutions, is the establishment of RN standing orders. Standing orders follow evidence-based guidelines for specific disease sets or chief complaints and allow RNs in triage to initiate diagnostic tests and or interventions before the provider sees the patients. This has been shown in the literature to decrease ED LOS by improving patient turnover and bed availability (Retezar, 2011). Boston VAMC relies on RN standing orders to manage flow and expedite care — in many cases critical diagnostics (labs, imaging) are completed by the time the physician sees the patient. Standing orders have allowed Boston to consistently maintain a favorable LOS – it scores in the top quartile of VAMCs.192 The facility attributes its successful implementation to nurse competencies and strong relationships and trust between the ED physicians and nurses.193 Varied implementation of ED fast-track processes for lower-acuity patients: As was demonstrated in Section 6.2.2.2, the number of low-acuity, clinically inappropriate194 ED visits is a major challenge to patient flow; 86 percent of VHA ED visits are classified as low to moderate acuity based on the emergency severity index (ESI 3, 4, and 5).195,196 While this is felt most acutely in the evening when outpatient clinics are closed, as detailed in Finding 6.2.2.2, this is also cited as an issue during the day when clinics are open.197 Evidence supports the use of a fast-track process to treat these non-urgent patients in a dedicated area by dedicated staff, so as to minimize long wait times and prevent congestion of the main ED from low-acuity patients. Staffing a provider in fast-track allows the facility to care for and discharge lower-acuity patients without taking up resources in the main ED. In one study, the prevalence of a fast-track process decreased wait times by 51 minutes, length of stay by 28 minutes, and LWBS rates by 4 percent without a change in mortality and revisit rates (Sanchez, 2006). Facility-developed fast-track processes were seen in a little more than 50 percent of VAMC sites visited198 and, consistent with evidence,
191 Choice Act interview with Kaiser (2015) 192 EDIS FY14 (admitted ED LOS) 193 Site visit ED throughput workshop (Boston VAMC) 194 Inappropriate visits described as patients who would be better seen in a lower setting of care (e.g., clinic or
primary care) 195 EDIS acuity analysis FY14 (109 VAMCs, 3 were excluded due to data quality) 196 Emergency Severity Index is a five-level ED triage algorithm that provides clinically relevant stratification of
patients into five groups from least to most urgent based on patient acuity and resource needs. 197 Site visit ED throughput workshop (N=21 sites) 198 Site visit ED shadowing sessions (N=21 sites)

Assessment F (Workflow – Clinical)
The views, opinions, and/or findings contained in this report are those of the assessment team and should not be construed as an official government position, policy, or decision.
98
were cited as being successful in segmenting and caring for low-acuity ED visits and minimizing the disruption to inpatient access199 (Sanchez, 2006). Boston VAMC and Lexington VAMC have each implemented traditional fast track process in which dedicated providers see low acuity patients in a designated area of the ED.200 Both facilities have shown considerable success from segmenting patients by acuity and discharging patients directly from the fast-track area. Boston VAMC channels more than 30 percent of its patients triaged through its fast track process (Institute for Healthcare Improvement, 2014) and scores in the top quartile of VAMCs in ED LOS, and Lexington VAMC scores in the top of quartile of facilities in door to doctor time.201 Palo Alto has taken a different approach to treating low acuity patients. ED leadership recognized the value in segmenting patients by acuity, but understood that they did not have the space nor the resources to designate a “fast track” area in the ED and administer diagnostic testing (e.g., imaging and lab) in the ED for those patients. Instead, the ED has coordinated with on-site outpatient clinics to share diagnostic services through a “fast pass” process, as detailed in Table 6-2. As a result, Palo Alto has seen a 20 percent decrease in ED LOS for Medical admissions since 2012.202
Table 6-2. VAMC Case Study: Fast-Track Options
Palo Alto VAMC Alternative Fast Track
Context
Palo Alto VAMC set the following patient flow goals for the ED203
Door to triage: 10 minutes
Door to doctor: 20 minutes
Decision to admit to patient placement in an inpatient bed: 1.5 hours
Approach
To achieve these goals, VA has instituted a “fast pass” system to expedite care for lower acuity patients; the system has the following components:
Low acuity patients are given a map and directed to the on-site outpatient clinic for diagnostic testing204
199 Site visit ED throughput workshops and shadowing sessions (N=21 sites) 200 Site visit ED throughput workshops (N=21 sites) 201 EDIS FY14 (N=109 facilities, 3 excluded due to data quality issues) 202 Palo Alto Bed Control data (EDIS FY12 to FY15) 203 Site visit ED throughput workshop 204 Site visit ED throughput workshop (Palo Alto)
Assessment F (Workflow – Clinical)
The views, opinions, and/or findings contained in this report are those of the assessment team and should not be construed as an official government position, policy, or decision.
99
Palo Alto VAMC Alternative Fast Track
Outpatient diagnostics maintain two lines, one to see the patients from the ED and one for traditional appointments; the ED patients have priority205
Patients are tracked through EDIS such that their ED nurses know where they are and can identify any delays care206
Impact
Since implementing this “fast process” in conjunction with other process improvement initiative the VAMC has been able to meet its throughput objectives 80 percent of the time207
Front line ED staff commented that the fast track process not only “creates ED real estate [for higher acuity patients], but it is also popular among patients, as evident by our ED [Press Ganey] patient satisfaction scores208"
Varied implementation of flow management processes and roles to expedite admission and bed placement: Inpatient bed availability was cited as a challenge across visited VAMCs; 71 percent cited lack of bed availability as a primary source of ED bottlenecks.209 While clinically inappropriate admissions and challenges with discharge contribute to bed availability issues, as detailed in Finding 6.2.1 and Section 7 respectively, inefficiencies in bed management further delay bed assignment limiting access for new ED and surgical admissions. Inefficiencies in bed management were associated with three factors: (a) inconsistent bed management organizational structure across VAMCs; (b) bed assignment order delays; (c) variable use of BMS.
(a) Inconsistent bed management organizational structure: There is considerable variability across VAMCs in their approach to bed management and flow. Sixty-one percent of VAMCs visited cited their bed coordinators as a strength in managing patient flow,210 but stressed that most coordinators are only staffed during the day contributing to evening admission delays. A few facilities have begun to implement flow teams to support bed management and expedite admissions following bed turnover, but processes are variable. Boston VAMC, for example, has implemented an inpatient flow coordination center that manages all transfers, scheduled admissions, bed management, flow coordination, and collaborative care (for example, UM and discharge planning). Additionally, the coordination center engages a flow committee that includes an interdisciplinary
205 Site visit ED throughput workshop (Palo Alto) 206 Site visit ED throughput workshop (Palo Alto) 207 Site visit ED throughput workshop (Palo Alto) 208 Site visit ED throughput workshop (Palo Alto) 209 Site visit ED throughput workshops (N=21 sites) 210 Site visit ED throughput workshop (N=21 sites)
Assessment F (Workflow – Clinical)
The views, opinions, and/or findings contained in this report are those of the assessment team and should not be construed as an official government position, policy, or decision.
100
team of nurses, bed managers, physicians, and leadership to drive performance improvement projects. Previous projects have included a review of the admission process, ED physicians are now responsible for the admit decisions, and an analysis of observation utilization.211 Complementing its inpatient flow team, Boston also started an ED flow group, in 2006, that meets weekly to discuss open issues related to ED throughput from the week before. The ED flow group includes all ED staff (e.g., nurses, physicians, housekeepers, clerks) and each participant is responsible for leading new performance improvement pilots.212 The VAMC highlights its flow team as one reason it has been able to maintain ED LOS under the VHA goal of 4 hours for the past 2 years.213
(b) Bed assignment order delays: Across VAMCs, considerable delays often result from waiting to identify and assign patient beds until after the admission orders are written. As was depicted in Figure 6-6, ED physicians are often responsible for the initial admit decision, but bed assignment does not begin until after the hospitalist or resident (in a teaching facility) writes the admission order. While this process should incorporate checks and balances, especially for residents, executing these processes sequentially rather than in parallel, delays bed assignment and ED LOS.214 One academic medical center streamlined its bed assignment and flow management processes through its active bed management program. Under this program physicians are designated as “triage hospitalists” and responsible for both admission decisions as well as bed management and flow. This has enabled admission and bed assignment decisions to happen almost simultaneously, and led to a 98 minute decrease in ED LOS (Howell, 2008).
Fargo VAMC has expedited the bed assignment process through a collaboration between the ED physicians and hospitalists. Once the ED physician makes the decision to admit, the bed coordinator is paged and bed assignment is initiated. Simultaneously, the ED physician calls the hospitalist to discuss the patient and admission orders. The hospitalist writes subsequent orders while the bed management team is identifying available placement.215 This process has helped Fargo VAMC maintain an ED LOS for admitted patients of 204 minutes, which is well under the VHA goal of 240 minutes.216 While orders are required to physically move a patient to an inpatient bed, no VHA directive to date precludes the upfront identification and assignment of a bed.217
211 Interview with the Nurse Executive at Boston VAMC 212 Site visit ED throughput workshop (Boston VAMC) 213 EDIS FY13 and FY14 214 Site visit ED throughput workshop (N=21 sites) 215 Site visit ED throughput workshop (N=21 sites) 216 EDIS FY14 217 VHACO SME interview
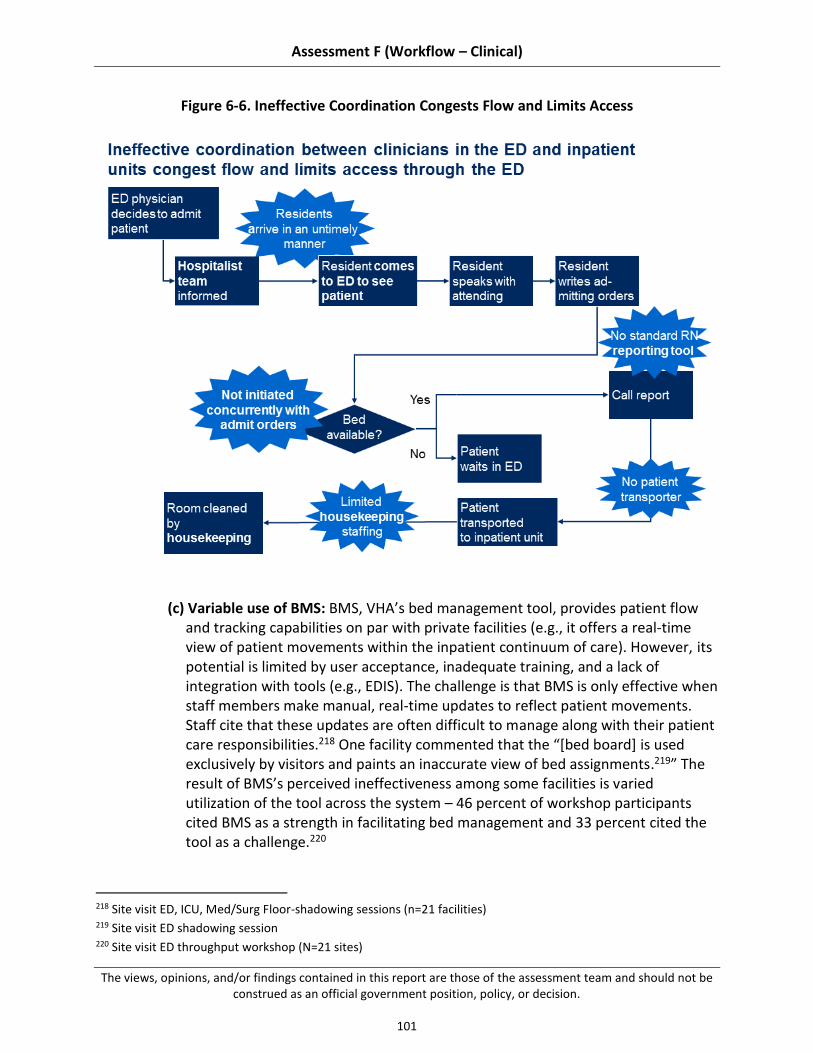
Assessment F (Workflow – Clinical)
The views, opinions, and/or findings contained in this report are those of the assessment team and should not be construed as an official government position, policy, or decision.
101
Figure 6-6. Ineffective Coordination Congests Flow and Limits Access
(c) Variable use of BMS: BMS, VHA’s bed management tool, provides patient flow and tracking capabilities on par with private facilities (e.g., it offers a real-time view of patient movements within the inpatient continuum of care). However, its potential is limited by user acceptance, inadequate training, and a lack of integration with tools (e.g., EDIS). The challenge is that BMS is only effective when staff members make manual, real-time updates to reflect patient movements. Staff cite that these updates are often difficult to manage along with their patient care responsibilities.218 One facility commented that the “[bed board] is used exclusively by visitors and paints an inaccurate view of bed assignments.219” The result of BMS’s perceived ineffectiveness among some facilities is varied utilization of the tool across the system – 46 percent of workshop participants cited BMS as a strength in facilitating bed management and 33 percent cited the tool as a challenge.220
218 Site visit ED, ICU, Med/Surg Floor-shadowing sessions (n=21 facilities) 219 Site visit ED shadowing session 220 Site visit ED throughput workshop (N=21 sites)

Assessment F (Workflow – Clinical)
The views, opinions, and/or findings contained in this report are those of the assessment team and should not be construed as an official government position, policy, or decision.
102
In contrast, a few facilities recognize the value of BMS and prioritize real-time updates stating, “We live and die by our bed board”221 and “BMS’ ability to queue beds has considerably improved our bed turnaround; the tool has also allowed us to better forecast bed needs.”222 Literature supports this view, stating that bed management tools, when implemented as part of a successful process improvement initiative, have shown to have a 55 percent improvement in overall bed turnaround time over a 3-year period, including a 29 percent improvement in housekeeping turnaround and a 42 percent improvement in patient transportation (Tortorella, 2013).
6.2.3.2 Limited Cross-facility Communication and Sharing of Best Practices
Despite the number of best practices implemented at individual facilities, there is little support at the VISN and national levels to facilitate cross-facility communication and implementation of proven best practices at scale.223 In speaking with individual facilities, most are unaware of the initiatives employed at other EDs to manage throughput and flow.224 This extends to triage, diagnostics, and bed management, as well as data management and performance improvement. The Department of Emergency Medicine plans to promote best practice adoption, and has initiated an emergency medicine mail group that sends daily emails with the goal of connecting individual VAMC EDs, but the department has yet to reach its full potential.225 Some facilities, especially at the VISN level, share best practices through local contacts, but the perceived impression among more than 25 percent of the VAMC ED leaders we interviewed is that VISN and VHACO provide little tactical support in operationalizing best practices and implementing them system-wide.226
6.3 Recommendations
VHA inpatient access practices have multiple stakeholders: Congress and the executive branch, VACO, VHACO, VISN leadership, and VAMC management and staff. Encouraging innovation and addressing challenges in inpatient access will require collaboration between all of these groups, and a commitment to making difficult, long-term change. Different recommendations should be owned by different groups (e.g., recommendation requiring changes to VACO policy versus local policy) – however, support for change from all stakeholders is critical to effective implementation.
Our recommendations, building on existing strengths and addressing existing challenges in inpatient access to care, can be categorized into three main themes.
6.3.1 Develop an accurate end-to-end picture of patient demand and VAMC capacity
221 Site visit ED shadowing session (N=21 sites) 222 Site visit ED throughput workshop (N=21 sites) 223 Site visit ED throughput assessment workshop and ED shadowing (N=21 sites) 224 Site visit ED throughput assessment workshop and ED shadowing (N=21 sites) 225 Site visit ED throughput assessment workshop and ED shadowing (N=21 sites) 226 Site visit ED throughput assessment workshop and ED shadowing (N=21 site)

Assessment F (Workflow – Clinical)
The views, opinions, and/or findings contained in this report are those of the assessment team and should not be construed as an official government position, policy, or decision.
103
6.3.2 Decrease the number of clinically inappropriate admissions due to limited access to sub-acute care
6.3.3 Expand use of evidence-based processes for managing patient flow, including clear role assignments and individual performance management
These themes are consistent with practices suggested by the academic literature, professional associations, and high-performing hospitals within VHA and outside the system, as well as solutions proposed by front-line VHA staff – further details are included in "summary of supporting evidence" sections in each sub-recommendation (see Appendix C.4 for additional detail on our methodology for gathering this data). To help VHA implement our recommendations, we have also suggested next steps in the "potential near-term actions" sections of the sub-recommendations. Note, because different VAMCs may have already adopted some recommended practices or experience unique barriers, these suggestions should be tailored the individual circumstances of each VAMC. Each recommendation is supported by several sub-recommendations, which map to the “organization, workflow processes, and tools” domains specified in the Choice Act. For a detailed map of how the sub-recommendations relate to these domains, see Table C-2 in Appendix C.3.
Several recommendations overlap with other assessment areas. Where this occurs, we have referenced the relevant assessment area, where additional detail can be found.
Develop an Accurate End-to-end Picture of Patient Demand and VAMC Capacity
Data gaps limit VHA’s understanding of patient demand patterns and available VAMC capacity (e.g., bed and staffing). To address this gap, VHA should first simplify the process and required approvals by which beds are classified as operational and then standardize the definition and tracking of patient demand patterns. Following development of clear metrics and aggregation of accurate data, VHA should consider building an analytical model to predict future patient demand.
6.3.1.1 Simplify the Process and Required Approvals by Which Beds are Classified as Operational or Unavailable
We observed through national data analysis, site visits, and interviews with VHACO leadership that VHA has an inaccurate view of current bed capacity. VHA should promote the accurate reporting of bed closures by simplifying the process by which VAMCs report short-term closures. This in turn should provide VHA with a more accurate view of available inpatient capacity (e.g., operational beds).
Summary supporting evidence:
See Section 6.2.1.1 for more detail on findings.
Assessment F (Workflow – Clinical)
The views, opinions, and/or findings contained in this report are those of the assessment team and should not be construed as an official government position, policy, or decision.
104
More than 40 percent of facilities reported closing beds without submitting a formal request through the “bed letter” process.227
Senior Program Office leadership described the bed closure process as an “archaic way of managing and reporting bed capacity; there are often significant discrepancies between the number of authorized beds in the National Bed Database and the actual number of beds in operation at the VAMCs."228
Potential near-term actions:
VACO/VHACO: Reduce the approval requirements for temporary bed closures to encourage facilities to accurately report bed closures.
VACO/VHACO/VISN: Support individual VAMCs’ decisions to close beds due to patient safety risks from insufficient staffing.
VAMC: Drive staffing and resource discussions based on an accurate picture of operating capacity.
VHACO: Configure BMS so that it reports the aggregate number of operational beds at the facility, but still allows VAMCs to keep all beds “open” in the tool so they can rotate bed assignments and expedite bed turnover.
VHACO/VISN/VAMC: Build awareness at the facility level on the importance of accurate bed reporting and its relevance to resource planning.
6.3.1.2 Develop a Prioritized Set of Standardized Metrics to Understand Current Demand at the VAMC, VISN, and VHACO Levels and Implement an Automated Process to Collect and Aggregate this Data Across the System
We observed considerable variability in patient demand tracking, including unmet demand, across VAMCs. Literature supports that a comprehensive understanding of demand and capacity data is key to inpatient access and providing timely care (Welch, 2011). For example, appropriate tracking of the number of diversions (e.g., patients that VHA cannot care for in-house due to capacity limitations) is critical to preventing future access issues. Standardizing the definition and automating the tracking of current demand should provide VHA with a more accurate picture of regional and national demand so that it can better forecast its capacity needs.
Supporting summary evidence findings:
See Section 6.2.1.2 for more detail on findings.
More than 30 percent of VAMCs visited recommended building a team to track performance metrics including demand and patient flow.229
227 Choice Act data call (N=55 sites) 228 VHACO SME interview 229 Site visit ED throughput workshops (N=21 sites)
Assessment F (Workflow – Clinical)
The views, opinions, and/or findings contained in this report are those of the assessment team and should not be construed as an official government position, policy, or decision.
105
More than 40 percent of percent VAMCs visited recommend integrating patient flow tools (e.g., BMS, EDIS, VistA), in line with commercial EHR tools (e.g., Epic, Cerner, and Meditech) to allow better end-to-end reporting on patient flow230 (as an indicator of demand and capacity).
Less than 10 percent of VAMC data call respondents reported on the number of patients that were diverted or transferred from their facility over the past year.231
Potential near-term actions:
VACO: Develop a standardized cross-cutting, balanced performance management scorecard with a range of domains of performance, including operational metrics related to patient demand and hospital capacity; refer to Assessment L for additional detail on this action.
VHACO: Convene an interdisciplinary committee to identify a prioritized subset of key patient flow metrics (e.g., diversions, ED LOS, LWBS, bed turnover time) and data sources (e.g., patient intake file, EDIS, NUMI, BMS, and CPRS) to be measured across VAMCs.
VHACO: Establish a daily report that pulls the patient flow data elements, identified by the VHACO Committee, required to understand the full picture of ED and inpatient surgical demand as well as available capacity, including daily and seasonable variations in census.
VHACO: Consider integrating EDIS and BMS tools with VistA/CPRS to provide a common tool to track patient flow at the facility, VISN, and national levels; refer to Assessment H for additional details on information systems.
VACO/VHACO: Develop the process and capabilities to automatically track diversion and transfer data and pull it into a standardized report that includes the number of patients diverted per day and hour as well as the spend on non-VA care for diverted patients.
VHACO: Consider building or enhancing the functionality of existing tools to predict future patient demand based on historical data.
VAMC: Build a team responsible for tracking performance metrics and disseminating that information to front-line staff, at least weekly, to encourage accountability for patient flow.
VAMC: Outline a diversion/transfer policy in collaboration with regional public and private hospitals that details when patients may be diverted and the process to identify open beds in the community.
VHACO: Develop a standardized cross-cutting, balanced performance management scorecard with a range of domains of performance, including operational metrics related to patient demand and hospital capacity; refer to Assessment L for additional detail on this action.
230 Site visit ED throughput workshops (N=21 sites) 231 Choice Act data call (n=55 sites)

Assessment F (Workflow – Clinical)
The views, opinions, and/or findings contained in this report are those of the assessment team and should not be construed as an official government position, policy, or decision.
106
Decrease the Number of Clinically Inappropriate Admissions Due to Limited Access to Sub-acute Care
Given that the NUMI reports that more than 30,000 VAMC admissions would be better served in an alternative setting of care,232 decreasing these admissions that fail to meet NUMI criteria would require both an investment in sub-acute care (e.g., home health, detox clinics, short-term rehabilitation) at the national VHA level and a dedication, at the facility level, to allocate appropriate patient support resources (e.g., case managers and social workers) in the ED and surgical departments. These patient support resources are critical in helping physicians identify alternative settings of care and helping patients transition to them from an ED visit or surgical procedure. Additionally, patients should be educated on the appropriate utilization of VHA health care including the outpatient care resources available to them (e.g., patient advocate care teams, complementary and alternative medicine) as well as the safety risks associated with a clinically inappropriate hospital stay (e.g., hospital-acquired infections). Once the infrastructure is in place to support these patients outside the acute setting, VAMCs should begin to hold physicians accountable for appropriateness of admissions (e.g., include UM in physician performance appraisals). It is critical to highlight, however, that physicians cannot be held to these performance standards until appropriate community support is in place. To achieve this reduction in appropriate visits, we suggest the following changes:
6.3.2.1 Ensure appropriate access to near-team (e.g., same day, same week) primary and urgent care
6.3.2.2 Facilitate access to sub-acute resources for Veterans who are not appropriate to go home without support following a procedure or ED visit, but do not require acute hospital care
6.3.2.3 Staff case managers and social workers consistently across VAMC EDs to connect patients with appropriate sub-acute resources and help them navigate transitions following a procedure or ED visit
6.3.2.4 Build provider awareness around the importance and nuances of UM admission criteria and then hold physicians to admissions standards
6.3.2.5 Educate Veterans and their families on the resources available in the VA health care system as well as when it is appropriate to use different settings of care
6.3.2.1 Ensure Appropriate Access to Near-team (e.g., same day, same week) Primary and Urgent Care
Our assessment identified that limited access to immediate (e.g., same day or same week) primary and urgent care clinic appointments is contributing to ED demand. We recommend
232 NUMI admissions appropriateness FY14

Assessment F (Workflow – Clinical)
The views, opinions, and/or findings contained in this report are those of the assessment team and should not be construed as an official government position, policy, or decision.
107
promoting access to primary and urgent care to decrease low-acuity ED demand and better meet the needs of patients who require immediate non-acute care.
Summary supporting evidence:
See Section 6.2.2.2 for more detail on findings.
Sixty percent of VAMCs visited limited access to outpatient care as a major challenge to inpatient access.233
Forty-three percent of VAMCs visited stated that increasing access to clinics and primary care (e.g., extended hours and number of short-term/same-day appointments) would improve ED throughput by decreasing the number of ED visits that are not clinically appropriate.234
Boston VAMC demonstrated success by allocating a set number of same-day primary care appointments for ED patients; its one percent missed opportunity rates are well under VHA’s goal of under three percent.235,236
Potential near-term actions:
VHACO/VISN: Conduct a national assessment of current VHA resources (e.g., access to primary care and urgent care services) based on present and future low-acuity patient demand.
VACO/VHACO: Develop baseline standards for regional immediate, low-acuity care options based on current and projected regional patient demographics (e.g., walk-in clinic hours to support low-acuity ED demand); refer to Assessments A and B for additional detail on Veteran demographics.
VHACO/VISN: Optimize clinic scheduling and productivity to increase the number of available appointments; refer to Assessment E for additional detail on improving clinic capacity through more efficient scheduling and utilization of appointments.
VACO: Evaluate the impact of creating and/or expanding VHA facilities to meet demand gaps for immediate appointments.
6.3.2.2 Facilitate Access to Sub-Acute Resources for Veterans who are not Appropriate to go Home Without Support Following a Procedure or ED Visit, but do not Require Acute Hospital Care
Our assessment revealed insufficient access to sub-acute facilities (e.g., short-term rehabilitation, observation/domiciliary departments, detox clinics, homeless housing, mental health support, home health care). Literature supports the connection between the availability of sub-acute care and a reduction in inappropriate hospital utilization (Sadowski, 2009). Access
233 Site visit ED throughput workshops (N=21 sites) 234 Ibid. 235 Missed opportunities include LWBS, left against medical advice (AMA), and elopement 236 Site visit interview with Boston VAMC’s ED nurse manager
Assessment F (Workflow – Clinical)
The views, opinions, and/or findings contained in this report are those of the assessment team and should not be construed as an official government position, policy, or decision.
108
to sub-acute facilities should be improved through increased VHA-operated facilities and/or increased contracts with private facilities.
Summary supporting evidence:
See Section 6.2.2.3 for more detail on findings.
Seventy percent of VAMCs visited attributed the high number of clinically inappropriate admissions to a lack of sub-acute resources, including observation and domiciliary units, homeless housing, and detox centers.237
Sixty percent of VAMCs visited suggested increasing the capacity of VHA-operated sub-acute facilities.238
Fifty percent of VAMCs visited suggested increasing the ability to contract with sub-acute facilities.239
Refer to Assessments B and D reports for more details regarding this recommendation.
Potential near-term actions:
VACO/VHACO/VISN/VAMC: Conduct a national, market-by-market assessment of current sub-acute resources based on present and future patient demand; refer to Assessments B and D for additional details regarding current health care capabilities and future patient demographics.
VACO/VHACO: Conduct a review of admission criteria for domiciliary and homeless housing and ensure a streamlined process is in place to facilitate direct admissions from VAMCs.
VHACO: Develop baseline standards for regional sub-acute options based on current and projected regional patient demographics (e.g., review the number of detox admissions over the past year and the number of substance abuse patients within a regional VHA patient population and then determine the number of detox clinic beds necessary to support those patients).
VACO/VHACO/VAMC: Evaluate the impact of creating and/or expanding VHA sub-acute facilities to meet demand gaps with private facility contracts, as available (e.g., compare the patient safety risks and regional financial cost of inpatient admissions for detox patients who do not have a medical need, with the fully loaded cost of contracting and/or building a detox clinic).
237 Site visit ED throughput workshops (N=21 sites) 238 Site visit workshop on discharge planning (n=20 facilities); front-line staff proposed a variety of different
solutions to decrease inpatient length of stay through better sub-acute placement; refer to Section 6; the same recommendations can be applied to improve inpatient access
239 Site visit workshop on discharge planning (n=20 facilities); front-line staff proposed a variety of different solutions to decrease inpatient length of stay through better sub-acute placement; refer to Section 6; the same recommendations can be applied to improve inpatient access

Assessment F (Workflow – Clinical)
The views, opinions, and/or findings contained in this report are those of the assessment team and should not be construed as an official government position, policy, or decision.
109
6.3.2.3 Staff Case Managers and Social Workers Consistently Across VAMC EDs
We observed inadequate support in the ED and surgical suites to help patients and physicians navigate admission alternatives. Evidence shows a correlation between case management in the ED and decreased ED visits (Kumar, 2013). We suggest staffing case managers and/or social workers to connect patients with appropriate sub-acute resources and help them navigate transitions following a procedure or ED visit.
Summary supporting evidence:
See Section 6.2.2.3 for more detail on findings.
Forty-four percent of sites surveyed staff case management/social work in the ED240, but 67 percent of case managers interviewed during site visits stated that current case managers/social workers are understaffed.241
Thirty-three percent of data call respondents stated that additional case management and social work in the ED would improve access by decreasing clinically inappropriate admissions.242
Potential near-term actions:
VACO/VHACO: Convene an interdisciplinary team to establish guidelines on staffing case managers/social workers to ED volume.
o VACO/VHACO: Consider evidence-based literature, VHA patient populations, case manager/social worker salaries, costs of clinically inappropriate admissions, and availability of sub-acute resources, as outlined in Section 6.3.1.2, when developing guidelines.
o VAMC: Consider assigning a social worker or case management team to manage the relationship with new sub-acute facilities.
VACO/VHACO: Assess facilities need for funding to support staffing to these guidelines (e.g., private contracts or VHA facilities) as detailed in Section 6.3.2.2.
VHACO: Establish a standardized process for identifying target patients (e.g., nurse checklist, criteria at registration, physician consult).
VAMC: Design an escalation process for case management and social work to engage leadership on complex cases.
VAMC: Outline a process (e.g., checklist) for identifying the appropriate setting of care based on physician diagnosis and available resources.
VAMC: Hold brief interdisciplinary meetings on a regular cadence to promote collaboration among UM and ED and floor nurses, physicians, and case management/social work to discuss challenging cases and improvement opportunities.
240 Choice Act survey (N=127 respondents) 241 Site visit ED throughput workshop (N=21 sites) 242 Site visit ED throughput workshop (N=21 sites)

Assessment F (Workflow – Clinical)
The views, opinions, and/or findings contained in this report are those of the assessment team and should not be construed as an official government position, policy, or decision.
110
6.3.2.4 Build Provider Awareness Around the Importance and Nuances of UM Admission Criteria and Then Hold Physicians to Admissions Standards, Once Appropriate Sub-acute Resources are in Place
Our assessment revealed that there is minimal acceptance of and accountability for UM admission standards. Evidence supports that physician adherence to performance improvement initiatives (e.g., UM) is best achieved when the system promotes individual ownership and accountability (Patel, 2014). As a result, we recommend engaging physicians to establish UM performance standards and then holding physicians to those standards (e.g., include UM’s admission appropriateness metrics in physicians’ performance appraisals), once appropriate sub-acute resources are in place.
Summary supporting evidence:
See Section 6.2.2.4 for more detail on findings.
Twenty to twenty five percent of admissions fail to meet InterQual criteria indicating an opportunity for better physician adherence to admission criteria (NUMI, 2014).
None of the VAMCs visited included UM admission appropriateness metrics in physician’s performance appraisals.243
Potential near-term actions:
VHACO: Review McKesson InterQual criteria with an interdisciplinary team of ED physicians, hospitalists, and UM to understand the strengths of the NUMI tool and to establish accepted workarounds to address tool limitations.
VHACO/VAMC: Gain buy-in by engaging physicians in the development of any performance management standards related to NUMI admission criteria.
VAMC: Staff UM nurses in the ED to collaborate with physicians on admission appropriateness.
VHACO/VAMC: Hold physicians accountable to those agreed-upon performance standards (e.g., through performance pay, promotions), but create a system of checks and balances so that physicians are not penalized for admitting a patient when there is not a safe, alternate location of care, as outlined in Section 6.3.1.2. The objective of this recommendation is to promote Veteran care in the most appropriate location, not to limit care when it fails to adhere to predefined guidelines that do not encompass the specifics of a complex case.
VAMC: Design an escalation process for case management and social work to engage leadership on complex cases.
243 Site visit ED throughput workshops (N = 21 sites)

Assessment F (Workflow – Clinical)
The views, opinions, and/or findings contained in this report are those of the assessment team and should not be construed as an official government position, policy, or decision.
111
6.3.2.5 Educate Veterans and Their Families on the Resources Available at the VA Health Care System as well as When it is Appropriate to use Different Settings of Care
While we observed training focused on complementary alternative medicine and wellness (e.g., myHealthy vet), we did not observe education for patients on appropriate utilization, as supported by literature. As a result, VHA should use patient education to drive more appropriate utilization of acute and sub-acute care.
Summary supporting evidence:
See Section 8.2.1 for more detail on findings.
In one study, patient education led to a considerable decrease in hospital utilization (40 percent reduction in ED visits and 33 percent reduction in admissions) for an inner city Medicaid population; patients were taught in their home and over the telephone how to control their illness and when to seek attention from primary care versus the ED (Fedder, 2003).
Many patient education campaigns have effectively promoted appropriate use of healthcare services (e.g., they have decreased inappropriate utilization of antibiotics) through a targeted, long-term patient education campaign (Huttner, 2010).
Potential near-term actions:
VACO/VHACO: Develop a national campaign about health care utilization (e.g., when to go to primary care, urgent care, the risks associated with a hospitalization).
VHACO/VAMC: Staff VHA educators (e.g., clinicians, social workers) to provide training to Veterans through a variety of different channels (e.g., VA orientation following enrollment, VAMC lunch and learns, during discharge planning).
VACO/VHACO/VISN: Engage Veteran Service Organizations to support the training (e.g., answer Veteran questions) and distribute educational materials.
Expand use of Evidence-based Processes for Managing Patient Flow, Including Clear Role Assignments and Individual Performance Management
We observed variability across VAMCs in the utilization of evidence-based best practices, as detailed in Section 6.2.3, indicating an opportunity to improve system-wide adoption. We suggest four evidence-based changes to improve system-wide patient care and flow:
6.3.3.1 Expedite the initiation of clinical protocols in triage
6.3.3.2 Segment ED diagnostics and care through fast track processes to treat non-urgent patients in a dedicated area by dedicated staff
6.3.3.3 Standardize the inpatient flow process (e.g., admission through bed placement) including clear role assignments and individual accountability for patient flow

Assessment F (Workflow – Clinical)
The views, opinions, and/or findings contained in this report are those of the assessment team and should not be construed as an official government position, policy, or decision.
112
6.3.3.4 Build the infrastructure at the VHACO level to promote cross-facility sharing of patient flow best practices
6.3.3.1 Expedite the Initiation of Clinical Protocols in Triage
Our assessment identified inconsistent utilization of clinical protocols in triage. Evidence supports expediting care in triage by staffing a provider in triage or utilizing RN standing to initiate clinical protocols (Day, 2013; Retezar, 2011).
Summary supporting evidence:
See Section 6.2.3.1 for more detail on findings.
One study demonstrated that diagnostic testing in triage was associated with a 14 percent reduction in mean treatment time, regardless of chief complaint (Retezar, 2011).
St. Louis VAMC saw a 17 percent decrease in its mean ED LOS after staffing a provider in triage (Day, 2013).
Boston VAMC attributes its patient flow performance244 to its standing RN orders.245
VAMC site visit participants (80 percent of sites visited) staff or recommend staffing a provider in triage or instituting RN standing orders.246
Potential near-term actions (following implementation of Section 6.3.2):
VHACO: Convene a national interdisciplinary team or leverage an existing group (e.g., a flow collaborative, emergency medicine group) including physicians, advanced practitioners, and nurses to establish evidence-based clinical protocols.
VHACO/VAMC: Utilize RN standing order sets in low-volume facilities and staff a provider (or advanced practitioner) in triage for large volume facilities.
VHACO/VAMC: Train ED clinicians on all clinical protocols and hold individuals accountable for consistent implementation of protocols (e.g., enforce the use of clinical protocols by including as an element of ED clinicians performance appraisals).
6.3.3.2 Segment ED Diagnostics and Care Through Fast-track Processes to Treat Non-Urgent Patients in a Dedicated Area by Dedicated Staff
We observed varied implementation of ED fast-track processes for lower-acuity patients. Evidence supports the use of a fast-track process to treat non-urgent patients, in a dedicated area to prevent congestion of the main ED for low-acuity patients.
Summary supporting evidence:
See Section 6.2.3.1 for more detail on findings.
244 Boston VAMC scores in the top quartile of VAMCs for ED LOS (e.g., Boston VAMC’s ED LOS is shorter than 75
percent of VAMCs) EDIS FY14. 245 Site visit interview with Boston VAMC ED nurse manager 246 Site visit ED throughput workshops (N=21 sites)

Assessment F (Workflow – Clinical)
The views, opinions, and/or findings contained in this report are those of the assessment team and should not be construed as an official government position, policy, or decision.
113
Palo Alto has seen a 20 percent decrease in its ED LOS for medical admissions since 2012 when it initiated its “fast-pass,” fast-track process.247
Literature shows that the presence of a fast-track process in the ED decreases ED wait times, ED LOS, and LWBS rates without changes in mortality or revisit rates (Sanchez, 2006).
Potential near-term actions (following implementation of Section 6.3.2):
VAMC: Review ED layout, provider staffing, and demand picture to determine whether there are the resources, space, and demand to support sectioning off part of the ED for fast-track, low-acuity patients.
VAMC: Explore alternative fast-track solutions, if constrained by space and/or resources, including a conveyance model where patients rotate through diagnostic stations so that only a few ED rooms are required.
6.3.3.3 Standardize the Inpatient Flow Process (e.g., admission through bed placement) Including Clear Role Assignments and Individual Accountability for Patient Flow
Our assessment revealed inconsistency in the implementation of flow management processes and roles to expedite admission and bed placement. In line with the evidence, we recommend assigning individuals to manage patient flow (e.g., bed manager and charge nurses), standardizing the admission process including hand-offs between ED and inpatient clinicians (e.g., physicians and nurses), and enforcing the use of BMS and other patient flow tools.
Summary supporting evidence:
See Section 6.2.3.1 for more detail on findings.
More than 50 percent of VAMCS visited248 attributed patient flow challenges to delays in physician orders, availability of floor nurses to take reports, and limited capacity for charge nurses to manage flow in addition to their direct patient care responsibilities.
More than 40 percent of VAMCs visited249 recommended staffing a charge nurse who is responsible for managing flow (e.g., they do not take a full patient load) (Thomas, 2005); recommended by 43 percent of VAMCs visited.
More than 55 percent of VAMCs visited250 recommended standardizing and streamlining the patient handoff process between ED and inpatient nurses.
Potential near-term actions:
VHACO/VAMC: Update ED and IP charge nurse’s responsibilities so that they do not take a patient load, but rather support the staff nurses and manage patient flow.
247 Palo Alto data bed control data (FY12, FY13, FY14) 248 Site visit ED throughput workshops (N=21 sites) 249 Site visit ED throughput workshops (N=21 sites) 250 Site visit ED throughput workshops (N=21 sites)
Assessment F (Workflow – Clinical)
The views, opinions, and/or findings contained in this report are those of the assessment team and should not be construed as an official government position, policy, or decision.
114
VAMC: Establish a bed management flow team including nurse leadership from each department as well as bed management, and hold daily meetings on bed availability, potential discharges, and upcoming admissions.
VAMC: Convene an interdisciplinary team of ED physicians, hospitalists, charge nurses, and flow coordinators to map out the admission process.
VAMC: Engage ED and floor nurses to establish a standardized process for reporting on admitted patients.
VHACO/VAMC: Increase awareness across departments about BMS, so that individuals understand the its capabilities and their ability to portray an accurate view of inpatient capacity, as detailed in the recommendations in Section 6.3.1; once user acceptance has been achieved, distribute responsibility for updating the tool and enforce accuracy by incorporating BMS and EDIS reports in daily flow meetings.
6.3.3.4 Build the Infrastructure at the VHACO Level to Promote Cross-facility Sharing of Patient Flow Best Practices
While the Department of Emergency Medicine has built the capabilities to measure ED throughput through EDIS, we observed little cross-facility communication and sharing of best practices. Building the infrastructure at the national level to support better collaboration across VAMCs should improve performance variability across the system (Welch, 2011).
Summary supporting evidence:
See Section 6.2.3.2 for more detail on findings.
Considerable variability across VAMCs in performance metrics (e.g., 72 percent of VAMCs have longer door-to-doctor times as compared to market averages251) indicates a clear opportunity to establish a system-wide approach to scaling-up of successfully implemented, facility-led patient flow initiatives.
The Cleveland Clinic, e.g., holds an innovation summit each year to discuss best practices from academic literature as well as practical, front-line-submitted solutions so that lower-performing facilities may learn from higher-performing facilities (Cleveland Clinic, 2010).
Potential near-term actions:
VHACO: Establish community of practice calls and workshops, at the national level, for ED and patient flow leadership at the facilities to discuss challenges and share solutions.
VHACO: Convene an interdisciplinary team, or leverage existing teams, to review and evaluate patient flow best practices, submitted by VAMCs and identified in the literature, to establish a system-wide database of proven best practice models.
VHACO: Provide field implementation teams to support VAMCs with the implementation of proven best practices.
251 EDIS FY14 and CMS Hospital Compare (ED) FY14
Assessment F (Workflow – Clinical)
The views, opinions, and/or findings contained in this report are those of the assessment team and should not be construed as an official government position, policy, or decision.
115
Potential Opportunity
One of the key opportunities to be captured by improving inpatient access, through the recommendations described above, is driving additional capacity for patients who are diverted to other facilities or leave the ED without being seen. Not only do diversions limit patient access and contribute to patient safety risks and decreased satisfaction, but they also have significant financial impact. In most instances, VHA is responsible for care delivered at private facilities for diverted, service-connected Veterans. Given that 20 to 25 percent of admissions fail to meet VHA’s UM admission criteria, compared with 10 percent to 15 percent in the private sector, there is an opportunity to free capacity by better adhering to criteria (Sheehy, 2013; Stranges, 2010). Furthermore, improved staffing allocations and optimized patient flow practices should also improve efficiency and potentially free capacity.
In addition to freeing capacity, admissions that are not clinically appropriate have broader financial impact. On average, the costs of an inpatient stay far exceeds the cost of sub-acute care. As a result, it is much more cost-effective to treat Veterans at the correct level of care rather than admit them to an inpatient bed. Most importantly, however, clinically inappropriate admissions increase a patient’s risk for hospital-acquired infections and other safety risks (Magill, 2014). As one nurse stated, “Hospitals are not a safe place, but keeping patients in the hospital has been our culture for a long time”252 (Magill, 2014). Treating patients in the correct setting of care is not only fiscally sensible, but it is also in Veterans’ best interest.
As detailed in findings, we do not have comprehensive and accurate data on current capacity (e.g., number of operational beds) and diversions (both number and financial impact) to appropriately size the opportunity of freeing capacity through better adherence to admissions criteria. Our assumption is that improving capacity will decrease the number of diversions and spend on non-VA care as well as increase patient satisfaction by driving down wait times for beds and LWBS rates. However, a larger and more accurate data source is required to confirm our hypothesis and appropriately size the opportunity at each facility and across the system.
252 Site visit interview (nurse manager)

Assessment F (Workflow – Clinical)
The views, opinions, and/or findings contained in this report are those of the assessment team and should not be construed as an official government position, policy, or decision.
116
This page intentionally left blank.

Assessment F (Workflow – Clinical)
The views, opinions, and/or findings contained in this report are those of the assessment team and should not be construed as an official government position, policy, or decision.
117
7 Effective Length-of-Stay Management and Care Transitions Part F (“Assessment F”), Section 201 of the Veterans Access, Choice, and Accountability Act of 2014 (“the Choice Act”) mandates an assessment of the organization, processes, and tools used to support length-of-stay (LOS) management and effective care transitions. There is significant evidence in academic literature suggesting that improvements in LOS management and care transition processes are associated with a number of positive outcomes, including improved health care quality, decreased hospital complications, reduced readmissions, decreased hospital costs, and improved patient satisfaction (Parry, 2009; Kleinpell, 2008; Coleman, 2006; Bull, 1994). Thus, LOS management and effective care transitions are important not only to promote efficiency and drive potential cost savings, but also to prevent exposing Veterans to avoidable hospital-associated harms when inpatient stays extend longer than clinical conditions warrant (Leape, 2009; IOM, 2001). Since inpatient facilities across VHA admit, care for, and discharge approximately 600,000 Veterans annually,253 LOS management and effective care transitions are key to VHA’s ability to optimally provide care that is patient-centered, high-quality, and cost-efficient.
Based on the language of the Choice Act legislation, the scope of this assessment area includes the organization, workflow processes, and tools in place at VHA facilities that support LOS management and effective care transitions within the acute care and inpatient mental health settings. Given that the legislation specifies a focus on the inpatient setting, our assessment does not cover outpatient or VHA-operated long-term care facilities (e.g., community living centers, domiciliary care).254 This section (Section 7) of the report does not cover emergency department (ED) operations and workflows, as the ED is not considered to be an inpatient venue of care. However, additional details regarding ED operations and practices are contained within Section 6 of this report, as the ED is a primary point of entry to the inpatient setting and therefore, critical to an assessment of access to inpatient care.
7.1 Summary
Assessment Approach
As described in the Methodology section of this report (Section 2), we collected information in several ways, using a common approach across sub-assessment areas within Assessment F:
Visits to 21 VAMCs, to conduct:
o Forty-two interviews with case managers, social workers managers, quality mangers, and utilization management coordinators
253 2014 VHA Support Service Center (VSSC) 254 This is consistent with CMS’s definitions of what constitutes an inpatient stay (CMS, 2014)
Assessment F (Workflow – Clinical)
The views, opinions, and/or findings contained in this report are those of the assessment team and should not be construed as an official government position, policy, or decision.
118
o Twenty255 assessment workshops with front-line personnel, including physicians, nurses, social workers, case managers, and utilization management nurses (about 125 staff total)
o Forty-two unit shadowing sessions of intensive care units (ICUs) and medical/surgical acute care units as well as 21 facility tours
Survey256 sent to all relevant clinical occupations across all VAMCs (e.g., physicians, case managers, nurses, social workers, allied health professionals), completed by 1,275 respondents257 across 92 VAMCs258. Due to the fact that VHA does not track the setting of work (i.e., inpatient or outpatient) in available human resource data and we did not control the distribution of the survey to the end-user we are unable to calculate the significance of the total response rate, but do not believe it to be a representative sample across any of the roles. Given this, survey data should be viewed as providing anecdotal insights as opposed to a representative data sample.
Request for local policy documents from all VAMCs (“data call”), returned by 49 (41 percent) VAMCs259
Data collection from national data systems, including LOS data260 and National Utilization Management Integration (NUMI) data
Interviews with internal VHA subject-matter experts (SMEs) with knowledge of current national LOS management and care transition programs, policies, and practices
Having collected information to understand VHA’s practices with respect to LOS management and promotion of effective care transitions, we then assessed how these practices compared to best practices and industry benchmarks. Best practices and benchmarks, detailed in Table D-1 of Appendix D.1, were identified through several sources, including:
255 A discharge planning assessment workshop was not held at one of our sites due to scheduling and patient care
conflicts. 256 As noted in the Methodology section (Section 2), we do not believe that the survey constitutes a representative
sample of VHA staff. 257 Total indicates number of staff from complexity level 1a, 1b, 1c, or 2 VAMCs responding to any survey question
related to LOS management and care transitions; number of respondents for each survey question varies due to customization of questions according to clinical occupation.
258 Only includes VAMCs with complexity level 1a, 1b, 1c, or 2 259 Based on total 121 VAMCs with complexity level 1a, 1b, 1c, or 2 260 We analyzed LOS data from two sources as part of this assessment: encounter-level data from the VA
Information Resource Center (VIReC) VHA Medical SAS (MedSAS) Inpatient Dataset and data from the VHA Inpatient Evaluation Center (IPEC). Because data contained within the IPEC system truncates any patient lengths-of-stay longer than 35 days, we used the VHA MedSAS Inpatient Dataset for externally benchmarking national VHA LOS outcomes. Prior to analysis of the MedSAS Dataset, we excluded records of patients whose stays included a segment within VHA long-term care and rehabilitation settings (e.g., domiciliary care, blind rehabilitation) to avoid inappropriately inflating VHA LOS performance. To assess for differences in facility-level LOS performance, we used data from VHA’s Inpatient Evaluation Center (IPEC).

Assessment F (Workflow – Clinical)
The views, opinions, and/or findings contained in this report are those of the assessment team and should not be construed as an official government position, policy, or decision.
119
Interviews with high-performing private hospital systems (e.g., hospitals with short LOS, adjusted for mix of Diagnosis-Related Group (DRG) admissions, from the 2013 AHA Survey)
Academic literature (e.g., research supporting interdisciplinary discharge planning as a driver of decreased LOS)
Surveys conducted by professional organizations (e.g., American Case Management Association (ACMA) survey of case management processes and tools commonly used by private hospitals)
There are several areas in which significant academic research has been conducted to rigorously examine which practices are true drivers of care transition effectiveness and/or improved LOS. Where this is the case, we have attempted to compare VHA’s current practices with practices that have been demonstrated effective in the academic literature. In other areas, however, there has been little, if any, academic research to confirm effectiveness of certain organizational features, processes, and tools. Where this is the case, we have compared VHA’s practices to what is common across the industry and/or what is reported by high-performing organizations as best practice.
Summary of Findings
Our analysis suggests that for all acute inpatient admissions across VHA, the average DRG-mix-adjusted LOS is about 2.1 days (56 percent) longer than Medicare averages.261 This difference is based on the industry-standard methodology of comparing LOS for VHA patients with a given DRG to the average Medicare patient with the same DRG. Note that this methodology does not account for Veteran-specific mental health and sociodemographic factors, which are likely to drive an increased burden of co-morbid disease relative to civilian populations and which are not fully accounted for by DRG-mix adjustment alone (Behavioral Health Barometer, 2014; Report of the Department of Defense on Mental Health, 2007).
While patient co-morbidity factors may contribute to increased LOS relative to Medicare patients in the private sector, inter-VAMC variability on LOS outcomes suggests that other factors are also at play. VHA tracks a measure called OMELOS262 (observed-minus-expected LOS) to adjust for the impact of Veteran co-morbidities on LOS outcomes across the organization. Note that because the “expected” LOS used in the calculation is based on internal VHA LOS averages and a Veteran-only predictive model, this methodology cannot be used for external comparisons. Despite OMELOS being an internal comparator only, the approximate 3.4-day variability (1.7 days shorter than “expected” to 1.7 days longer than “expected”263) in
261 Based on comparison of average LOS across VHA facilities versus CMS’s FY2014 published geometric mean
length-of-stay (GMLOS), accounting for the VHA’s FY2014 DRG mix 262 OMELOS is a VHA-specific LOS metric designed to account for inter-facility LOS differences driven by patient
complexity: it is calculated by subtracting actual LOS from “expected” LOS as determined by a multivariate regression model of VHA LOS based on several patient-level predictors (e.g., age, diagnosis, co-morbid diagnoses, lab values, source of admission)
263 VHA IPEC data (FY2014)

Assessment F (Workflow – Clinical)
The views, opinions, and/or findings contained in this report are those of the assessment team and should not be construed as an official government position, policy, or decision.
120
acuity-adjusted OMELOS across VAMCs suggests that variability in practices adopted at the facility level and varied availability of supporting resources and services may also be contributing to LOS differences compared with the private sector. This inter-VAMC variability in practices was confirmed by our site visits, as described in greater detail within this report.
Our assessment revealed four main findings with respect to VHA’s strengths and challenges in LOS management and effective care transitions (see Section 7.2 for details regarding each finding):
7.2.1 Implementation of national LOS programs and initiatives has failed to achieve organization-wide improvements despite local pockets of best practice adoption. National programs, including the Utilization Management (UM) program and several collaboratives (e.g., Transitions Collaborative, Flow Collaborative), have been launched to address existing challenges with LOS and care transitions. Although several facilities have experienced improvements through participation in these programs, national LOS challenges persist: the difference between VHA LOS and average DRG-adjusted Medicare LOS has increased by five percent since the beginning of FY2012.
7.2.2 Existing post-acute care options (e.g., rehabilitation/skilled nursing facilities) do not always match Veteran needs, delaying discharge. Patient LOS is, on average, about 5.1 days longer for Veterans discharged to post-acute care settings compared with patients discharged elsewhere. Participants in 55 percent of on-site workshops reported challenges with transitioning Veterans into post-acute care, including difficulties arranging for post-acute rehabilitation, securing timely placement in VHA-operated programs, and contracting with community facilities.
7.2.3 Typical VAMC operating models do not promote efficient inpatient care, leading to prolonged LOS. Limited availability of important clinical services (e.g., specialty and allied health consults) on weekends may contribute to the approximately 18 to 32 percent increases in LOS for admissions extending through the weekend.264 In addition, development and implementation of evidence-based inpatient care pathways have been left to individual facilities, resulting in variable adoption nationally.
7.2.4 Use of discharge planning best practices is inconsistent, decreasing effectiveness and coordination. Nationwide adoption of practices to appropriately manage LOS and promote effective care transitions has not matched practices of high-performing hospital systems. For example, only 55 percent of VAMCs have dedicated inpatient case managers to coordinate the overall discharge planning process, which may result in avoidable discharge delays.
264 VHA MedSAS data (FY14)
Assessment F (Workflow – Clinical)
The views, opinions, and/or findings contained in this report are those of the assessment team and should not be construed as an official government position, policy, or decision.
121
Summary of Recommendations
Our assessment revealed several areas where VHA can build on current strengths or address existing challenges to improve LOS and care transition management. We recommend that VHA consider two strategic themes, as detailed below. As with the findings, these themes apply to VHA organization, processes, and tools.
7.3.1 Mitigate discharge delays related to post-acute placement (e.g., increase availability of post-acute care options). VAMCs experience significant LOS challenges with patients requiring facility-level post-acute care following discharge. VHA should evaluate current and projected future capacity within both VHA-operated and community-based post-acute care facilities, address mismatches to better meet post-acute care needs of Veterans, and ensure sufficient patient education regarding post-acute care options.
7.3.2 Build on existing best practices, both internal and external to VHA, to increase local adoption of evidence-based inpatient care and discharge planning practices. VAMCs across the organization have shown varying degrees of dedication to adoption of practices that promote efficient and effective patient care. VHA should provide technical support and facilitate targeted best practice sharing to assist facilities in improving upon local practices related to efficient care delivery and effective discharge planning. Additionally, VHA should engage Veterans as active stakeholders in the care transition process by providing education regarding safe and effective transitions of care to the most appropriate post-acute care venue.
Past Findings and Recommendations
Several past assessments have commented on VHA’s LOS management and care transition practices. Within academic literature, VHA challenges with increased LOS have been observed since the late 1980s (Rogers, 1989; Wolinsky, 1987), although research conducted a decade ago suggested a gradual narrowing of LOS differences (Rosenthal, 2003). While there have been no recent, comprehensive, national assessments of VHA’s overall LOS management practices, OIG facility-level reviews and assessments of VHA service lines have identified challenges at individual facilities and for specific clinical services. The findings and resulting recommendations from these assessments are outlined in Figures D-1 and D-2 of Appendix D.2.
These past assessments have tended to focus on specific issue areas and/or individual facilities, separately developing recommendations for improvement in discrete areas. In contrast, our assessment tries to take an end-to-end view of inpatient clinical operations across the five key sub-assessment areas and all high- and medium-complexity VAMCs.
7.2 Findings
Our assessment revealed four main findings related to VHA’s current LOS management and care transitions processes:
7.2.1 Implementation of national LOS programs and initiatives has failed to achieve organization-wide improvements despite local pockets of best practice adoption

Assessment F (Workflow – Clinical)
The views, opinions, and/or findings contained in this report are those of the assessment team and should not be construed as an official government position, policy, or decision.
122
7.2.2 Existing post-acute care options (e.g., rehabilitation/skilled nursing facilities) do not always match Veteran needs, delaying discharge
7.2.3 Typical VAMC operating models do not promote efficient inpatient care, leading to prolonged LOS
7.2.4 Use of discharge planning best practices is inconsistent, decreasing effectiveness and coordination
These findings are based on several key sources of insight. We have used the national datasets that were available, information returned as part of the data call, and perceptions and experience reported or observed during site visits or via the staff survey. In many instances where data does not allow us to definitively comment, we have described the potential implications of the data points we do have, along with recommendations in Section 7.3 for further analysis.
Underlying each finding are several drivers; these drivers map to the “organization, workflow processes, and tools” domains specified in the Choice Act. For a detailed map of how the drivers relate to these domains, see Table D-2 in Appendix D.3.
Implementation of National LOS Programs and Initiatives has Failed to Achieve Organization-wide Improvements Despite Local Pockets of Best Practice Adoption
As outlined in Section 7.1.2, LOS within VHA is significantly longer than the DRG-adjusted average for Medicare patients treated within the private sector. Recognition of this and other LOS challenges has spurred the development of several initiatives aimed at improving VHA’s LOS management practices, including establishment of a national utilization management (UM) program and development of several national “collaboratives” focused on effective LOS management and care transition practices. Our assessment suggests that while these efforts may have yielded pockets of improvement, overall VHA LOS has failed to improve during the past 3 years (Figure 7-1), with the difference between VHA LOS and average DRG-adjusted private sector Medicare LOS increasing from 52 percent to 57 percent during FY2012-FY2014. Our assessment indicates the following three factors as barriers to national improvement:
7.2.1.1 Lack of availability of LOS performance metrics at the front-line and limited performance management inhibit the transparency and emphasis necessary to drive improvements
7.2.1.2 Limited organization-wide engagement in the national utilization management (UM) program reduces the program’s potential impact
7.2.1.3 Variable participation in national LOS management-focused “collaboratives” and inconsistent adoption of best practices drive variation in recent LOS improvements

Assessment F (Workflow – Clinical)
The views, opinions, and/or findings contained in this report are those of the assessment team and should not be construed as an official government position, policy, or decision.
123
Figure 7-1. VHA LOS Trends Over Time
7.2.1.1 Lack of Availability of LOS Performance Metrics at the Front-Line and Limited Performance Management Inhibit the Transparency and Emphasis Necessary to Drive Improvements
The use of performance management with associated incentives to promote desired outcomes (e.g., quality) has become increasingly common in health care. While managers and health services researchers often focus on the performance improvements possible through aligning of incentives with desired outcomes, research has also demonstrated that transparency alone can also be a powerful driver of performance improvement (Custers, 2008; Lindenauer, 2007). Our assessment suggests that VHA may not be fully reaping the benefits of transparency and performance management to drive LOS and care transition improvements, because: (1) LOS performance is not consistently and effectively communicated to front-line clinical staff; and (2) performance management systems rarely incorporate staff performance on LOS-related metrics.
LOS performance is not consistently and effectively communicated to front-line clinical staff. Our assessment indicates gaps in VAMC communications of LOS performance to front-line clinical staff. Although one LOS performance measure is

Assessment F (Workflow – Clinical)
The views, opinions, and/or findings contained in this report are those of the assessment team and should not be construed as an official government position, policy, or decision.
124
incorporated into the SAIL report (adjusted LOS), among VHA hospitalists, only 48 percent reported receiving periodic updates regarding their performance in appropriately managing LOS.265 Of these, only 22 percent indicated that LOS performance is communicated at the individual level, whereas 56 percent and 73 percent reported that this information is communicated at the facility- or service- line level, respectively.266 Overall, this suggests that only about 11 percent of VHA providers have individual-level LOS metrics communicated to them. This gap in LOS performance communication applies to other clinical stakeholder groups as well: among nurse managers, charge nurses, and case managers, 20 percent reported that LOS metrics are not regularly communicated and an additional 31 percent suggested that communications regarding performance are “ineffective.”267 This data reveals gaps in common VHA practices related to promoting performance transparency, a practice that has been shown effective in the academic literature to yield LOS improvements (Zemencuk, 2006). Performance management processes rarely incorporate staff performance on LOS-related metrics. VHA Handbook 5013/11 establishes expectations that VAMCs conduct annual performance ratings of clinical staff (2012). While these reviews provide an opportunity to discuss performance across many key dimensions, our analysis indicates that they are rarely used to discuss LOS performance. Among VHA hospitalists, only 6 percent reported that LOS metrics were a topic of discussion during regular performance reviews.268 Our analysis of standardized VHA forms used in physician performance evaluations supports this survey data, as we found that LOS performance is not incorporated within the categories against which physicians are evaluated within VA Form 10-2623a. While our national assessment indicates limited organization-wide adoption of performance management practices focused on LOS, some facilities have seen positive results by incorporating LOS metrics into regular provider reviews (see case study below).
Table 7-1. VAMC Case Study: LOS Performance Management
Best practice case study – Bay Pines VAMC
From about 2008-2013, the Bay Pines VAMC incorporated provider-level data from the National Utilization Management Integration (NUMI)269 system into regular provider performance reviews to promote LOS performance improvements.
265 Choice Act survey (N=86) 266 Percentages sum to greater than 100 due to respondents selecting multiple levels at which LOS performance is
reported. 267 Choice Act survey (N=237); responses categorized as “ineffective” if respondent selected either “somewhat
ineffective” or “very ineffective”; respondents answering “don’t know” were excluded from this analysis. 268 Choice Act survey (N=86) 269 The National Utilization Management Integration (NUMI), explained in depth in Section 7.2.1.2, tracks
appropriate use of inpatient resources by categorizing each day of an inpatient stay as appropriate or not based
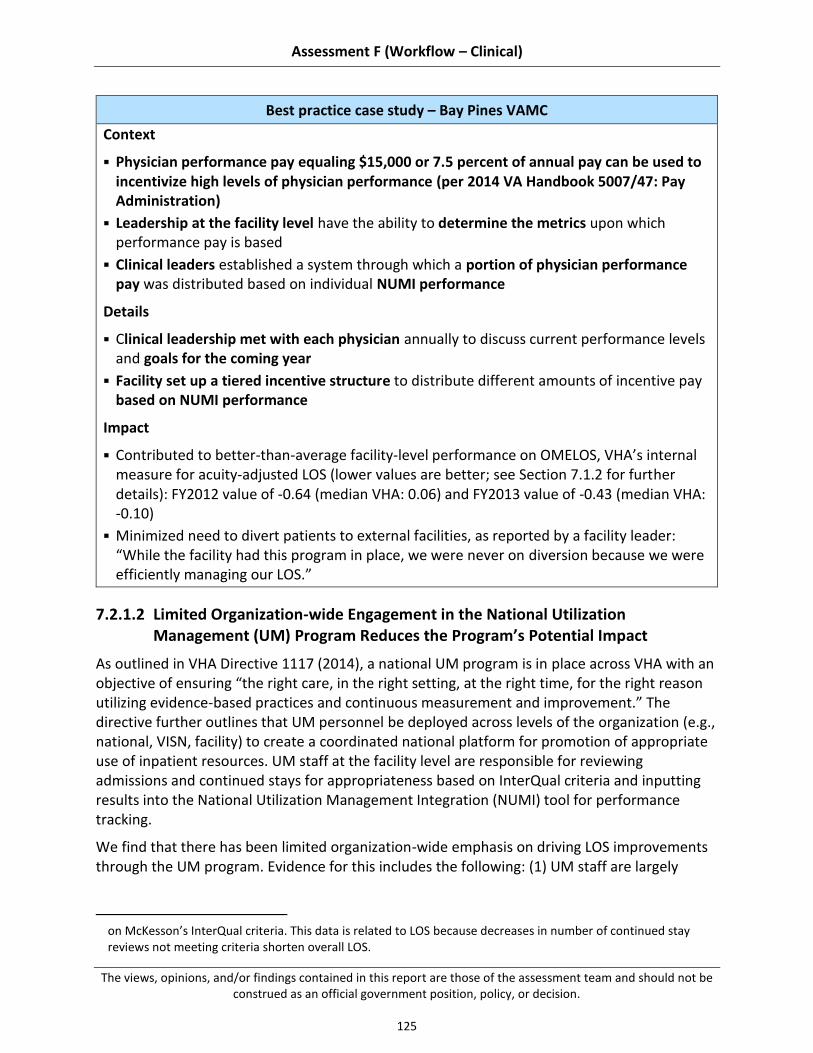
Assessment F (Workflow – Clinical)
The views, opinions, and/or findings contained in this report are those of the assessment team and should not be construed as an official government position, policy, or decision.
125
Best practice case study – Bay Pines VAMC
Context
Physician performance pay equaling $15,000 or 7.5 percent of annual pay can be used to incentivize high levels of physician performance (per 2014 VA Handbook 5007/47: Pay Administration)
Leadership at the facility level have the ability to determine the metrics upon which performance pay is based
Clinical leaders established a system through which a portion of physician performance pay was distributed based on individual NUMI performance
Details
Clinical leadership met with each physician annually to discuss current performance levels and goals for the coming year
Facility set up a tiered incentive structure to distribute different amounts of incentive pay based on NUMI performance
Impact
Contributed to better-than-average facility-level performance on OMELOS, VHA’s internal measure for acuity-adjusted LOS (lower values are better; see Section 7.1.2 for further details): FY2012 value of -0.64 (median VHA: 0.06) and FY2013 value of -0.43 (median VHA: -0.10)
Minimized need to divert patients to external facilities, as reported by a facility leader: “While the facility had this program in place, we were never on diversion because we were efficiently managing our LOS.”
7.2.1.2 Limited Organization-wide Engagement in the National Utilization Management (UM) Program Reduces the Program’s Potential Impact
As outlined in VHA Directive 1117 (2014), a national UM program is in place across VHA with an objective of ensuring “the right care, in the right setting, at the right time, for the right reason utilizing evidence-based practices and continuous measurement and improvement.” The directive further outlines that UM personnel be deployed across levels of the organization (e.g., national, VISN, facility) to create a coordinated national platform for promotion of appropriate use of inpatient resources. UM staff at the facility level are responsible for reviewing admissions and continued stays for appropriateness based on InterQual criteria and inputting results into the National Utilization Management Integration (NUMI) tool for performance tracking.
We find that there has been limited organization-wide emphasis on driving LOS improvements through the UM program. Evidence for this includes the following: (1) UM staff are largely
on McKesson’s InterQual criteria. This data is related to LOS because decreases in number of continued stay reviews not meeting criteria shorten overall LOS.

Assessment F (Workflow – Clinical)
The views, opinions, and/or findings contained in this report are those of the assessment team and should not be construed as an official government position, policy, or decision.
126
tasked with case reviews rather than prospective LOS and discharge management; (2) NUMI metrics are not incorporated into the facility SAIL report, limiting executive leadership emphasis; and (3) front-line clinical staff (e.g., nurses) are consistently unfamiliar with UM metrics and their interpretation.
UM staff are largely tasked with case reviews rather than prospective LOS and discharge management. VHA Directive 1117 (2014) dictates that UM nurses perform case reviews on 75 percent of admissions, observation stays, and subsequent days of care and enter results into the NUMI application. The directive also recommends that UM nurses collaborate with clinical staff (e.g., care coordinators, case managers, discharge planners, nursing staff) and “participate in daily rounds, bed huddles, or Interdisciplinary Team meetings as appropriate.” Our assessment suggests that the expectations for UM nurses to perform case reviews and also collaborate with clinical staff are seen as competing priorities. As one facility-level UM program manager stated: “We’d love for our UM nurses to be able to work more with the clinical teams, but there is no way that we could do that and still make sure that all the reviews get done.” This issue has undermined front-line engagement with the UM program, as front-line clinical staff often indicated that they had limited interaction with UM nurses to drive performance improvements. As one physician stated: “We repeatedly see the same causes of reviews not meeting criteria day after day, and many are issues that are out of our control. It would be better to collaborate regarding the patients where we can actually make a change.” These challenges have contributed to low organization-wide confidence in the ability of the national UM program to drive significant LOS management improvements. For example, 33 percent of facility-level quality management and utilization management coordinators interviewed during site visits stated that they felt the UM program would have “relatively low to no impact” on LOS outcomes at their facility compared to only 29 percent of respondents who expected the UM program to have “high impact.”270 NUMI metrics are not incorporated into the facility-level performance plans, limiting executive leadership emphasis. As shown in Table 7-1, utilization of the NUMI application has been strong across the organization, with UM nurses reviewing 79 percent of all inpatient days during FY2014. However, trends in performance (proportion of UM reviews meeting InterQual criteria) suggest limitations in VHA’s ability to drive true performance improvements through the UM program and NUMI: data from the past 2 years indicates that the percentage of continued stay reviews meeting criteria has remained between 60 percent and 70 percent, with no consistent recent upward trend. One factor that may contribute is that NUMI metrics are currently not incorporated within the national SAIL report, which may drive limited engagement from VAMC leadership. This is illustrated by a
270 Site visits quality manager / utilization management coordinator interviews (N=21)

Assessment F (Workflow – Clinical)
The views, opinions, and/or findings contained in this report are those of the assessment team and should not be construed as an official government position, policy, or decision.
127
facility-level leader who commented: “If NUMI metrics are not part of my performance plan, I’m not going to worry about it.”271
Table 7-2. Overview of NUMI Reviews and Recent Performance272
Review type
Description
Utilization (percent of cases
reviewed)
Performance (percent of cases meeting
criteria)
Target FY2014 Target FY2014
Continued stays
Assessment of whether patient’s clinical status continues to warrant inpatient acute care versus care at some other level
75 79 80 66
Front-line clinical staff (e.g., nurses) are consistently unfamiliar with UM metrics and their interpretation. Observations during our site visits suggest that engagement of front-line staff in the UM program has also been limited. For example, we found that although NUMI indicators are integrated into the BMS boards on the acute care units, 95 percent of staff nurses observed during our site visits were unable to communicate the meaning of these indicators.273 This observation may reflect insufficient training of front-line staff to date regarding this NUMI feature and suggests that additional education may be needed to ensure that front-line staff have the right information and training to fully engage in national UM efforts.
7.2.1.3 Variable Participation in National LOS Management Initiatives and Inconsistent Adoption of Best Practices Drive Variation In Recent LOS Improvements
In addition to the national UM program, VHA has implemented various other initiatives to improve patient flow and facilitate effective care transitions. Much of this work has been done through collaboratives launched by the VHA Office of Systems Redesign and Improvement.274 Since 2006, VHA has offered a number of collaboratives with potential impact on LOS management issues, including the Fix Collaborative (focused on addressing hospital LOS), the Transitioning Levels of Care Collaborative (focused on improving efficiency of care transitions), the Bedside Care Collaborative (focused on improving care delivery patterns), and the Patient Flow Collaborative (focused on the impact of flow and optimal use of VHA’s Bed Management System). These collaboratives convene staff from VAMCs across the country to learn about
271 Interview with VHA national leader 272 NUMI continued stay review data (FY2014) 273 Site visit med/surg unit shadowing sessions (N=21) 274 Interview with VHACO leader

Assessment F (Workflow – Clinical)
The views, opinions, and/or findings contained in this report are those of the assessment team and should not be construed as an official government position, policy, or decision.
128
evidence-based best practices in inpatient clinical operations and to share learnings from successful local initiatives. While there may be similar opportunities to collaborate with external hospital organizations to share learnings and best practices, our assessment did not provide evidence that VHA has systematically pursued these opportunities for external collaboration to promote increased performance improvement.
Our analysis suggests that the impact of these initiatives may have been limited by (1) shifting support for continuously administering the collaboratives; and (2) variable participation in national collaboratives due to lack of facility-level support and inability to accommodate all willing participants.
Shifting support for continuously administering the collaboratives. Shifting priorities at the national level have yielded inconsistent focus on LOS improvement efforts across the organization. This is illustrated by the recent experience of VHA’s various collaboratives during FY2013-FY2014. After being administered successfully for 3 to 4 years, all collaboratives were halted in 2012 due to a national travel ban275 across the organization. Only recently was this travel ban lifted, and the Transitions Collaborative resumed again during FY2015.276 Furthermore, VHA’s investment in these collaboratives may be decreasing over time. As reported during a recent interview: “The caps on the number of VAMCs that can participate in the collaboratives continue to get tighter and tighter. At the same time, the number of approved participants is getting to be less and less. We used to be able to take an entire team of six to participate in the collaboratives, but now we have to send two and the rest of the team participates virtually. It doesn’t have the same effect on promoting change back at the facility when not all team members are able to fully participate in the collaboratives.”277 Variable participation in national collaboratives due to lack of facility-level support and inability to accommodate all willing participants. Impact from national collaboratives has varied significantly across the organization, in part driven by variable participation. One potential barrier to broader participation is inconsistent support from facility-level leadership across the organization. As stated during a recent interview: “Buy-in from facility leadership is critical for participation in collaboratives. Not only must the facility cover all travel expenses, but it also requires a willingness to grant participating team members protected time on a weekly basis to meet together, discuss progress, and continue to move initiatives forward. All of this has a cost, and some directors just aren’t willing to pay it.”278 In addition, because participation in LOS improvement collaboratives is by application and there are limited positions available, collaboratives are not always
275 Additional information regarding travel restrictions can be found in Assessment L 276 Interview with Transitions Collaborative leader 277 Interview with collaborative participant 278 Interview with collaborative participant

Assessment F (Workflow – Clinical)
The views, opinions, and/or findings contained in this report are those of the assessment team and should not be construed as an official government position, policy, or decision.
129
able to accommodate all would-be participants. Our analysis suggests that a total of 53 unique VAMCs participated in the 2010-2012 round of national collaboratives.279 While some of this may be due to lack of communication regarding the collaboratives, our interview with organizers of the recently launched Transitions Collaborative suggest that capacity constraints may also contribute: organizers received about roughly 40 VAMC applications for about 25 open positions.280 Our analysis revealed evidence that committed participation in these collaboratives may lead to improvements in outcomes. The example of the West Roxbury VAMC is illustrative. During a recent interview, a clinical leader from the facility remarked: “Participating in the national Flow Collaborative was extremely valuable in promoting performance improvement at our VAMC.” With the support of facility-level executive leadership and as a result of efforts initiated as part of the collaborative, West Roxbury has aggressively pursued interventions to improve its LOS management and care transition practices. As a result, West Roxbury’s acuity-adjusted LOS has decreased approximately 20 hours over a 6-year period. Additional details regarding West Roxbury’s approach to performance improvement and recent results are shown in the case study below.
Table 7-3. VAMC Case Study: National Collaborative Impact
Best practice case study – West Roxbury VAMC
As part of the national Flow Collaborative, the West Roxbury VAMC has implemented several initiatives to improve patient flow and reduce LOS.
Context
Selected to participate in VHA’s national Flow Collaborative
Served as a pilot for a broader national initiative
Modeled several interventions to mirror concepts first applied within the Cleveland VAMC
Initiatives implemented
Created flow center to enable co-location of several stakeholders (e.g., transfer coordinator, scheduler, bed management coordinator) with responsibility for various aspects of patient flow
Restructured case management and utilization management departments to combine into a single role (“collaborative care nurses”) under the flow center organizational structure
Organized flow center committee to meet every other week to discuss opportunities to improve flow and LOS management
279 FIX Collaborative Team Participation data (includes VAMCs participating in at least one of three collaboratives
during 2010-2012: Bedside Care, Patient Flow Coordination, of Transitioning Levels of Care) 280 Interview with Transitions Collaborative leader; of the 25 VAMCs accepted, only 12 are approved for in-person
participation (remaining facilities participate virtually via teleconference)

Assessment F (Workflow – Clinical)
The views, opinions, and/or findings contained in this report are those of the assessment team and should not be construed as an official government position, policy, or decision.
130
Best practice case study – West Roxbury VAMC
Impact
Improved OMELOS (internal measure for acuity-adjusted LOS; see Section 7.1.2 for further details) by about 20 hours (0.85 days) over a 6-year period through targeted improvement initiatives implemented through both the Flow Center and other facility-level efforts
Promoted increased awareness and emphasis on performance improvement: “We have a much better, system-level understanding of the flow. I think every VAMC should have a flow center.”
Existing Post-acute Care Options (e.g., rehabilitation/skilled nursing facilities) do not Always Match Veteran Needs, Delaying Discharge
One critical enabler of effective discharge planning is the ability to efficiently and effectively transition patients from the inpatient setting to the next appropriate care venue. This is a key step in the discharge planning process as inadequate coordination and planning can lead not only to discharge delays but also to avoidable hospital readmissions (Fox, 2013). If discharge options are not appropriately matched to patient needs, LOS may be increased and quality of care may suffer.
Veterans can be discharged from the acute care inpatient setting to a variety of venues (Figure 7-2). Effective discharge planning for patients transitioning to specialized post-acute care and social settings is critical given the prevalence of complex medical and psychosocial co-morbidities within these patient populations. Our assessment suggests challenges related to VHA’s ability to efficiently transition these Veterans to post-acute care settings. These challenges contribute to extended LOS, as evidenced by about a 3.5- to 5-day LOS increase for patients requiring placement within a post-acute care facility or specialized social program compared with patients discharged to home (Figure 7-3). Difficulty with Veteran placement is also indicated by data captured within VHA’s NUMI system: post-acute placement and social issues (e.g., lack of caregiver support) drive roughly 26 percent of VHA’s bed days of care that fail to meet InterQual criteria (Figure 7-4).281 This finding is particularly notable because these Veterans comprise only about 9 percent of overall VHA admissions.
281 NUMI continued stay review data (FY2014)

Assessment F (Workflow – Clinical)
The views, opinions, and/or findings contained in this report are those of the assessment team and should not be construed as an official government position, policy, or decision.
131
Figure 7-2. Overview of Discharge Locations

Assessment F (Workflow – Clinical)
The views, opinions, and/or findings contained in this report are those of the assessment team and should not be construed as an official government position, policy, or decision.
132
Figure 7-3. LOS Differences, by Discharge Disposition

Assessment F (Workflow – Clinical)
The views, opinions, and/or findings contained in this report are those of the assessment team and should not be construed as an official government position, policy, or decision.
133
Figure 7-4. Breakdown of Reasons for Continued Stay Reviews Not Meeting InterQual Criteria
As noted in Figure 7-4 above, VHA’s NUMI data indicates several reasons for inpatient days not meeting InterQual criteria. Each of these reasons warrants further exploration to identify potential opportunities to improve LOS. Our interactions with front-line staff during site visits disproportionately highlighted issues related to post-acute placement and social resources; as such, we consider these issues in greater detail within Sections 7.2.2.1–7.2.2.2. Due to the broad nature of the “other” category and its lower frequency of mention, we chose not to analyze this category in greater detail. The “outpatient care” and “inpatient level of care capacity” categories are discussed in section 5. While each of these criteria impact the appropriateness of a patient’s continued stay, as defined in NUMI, a patient’s level of care has minimal impact on his or her overall length of stay. Given the frequency with which “clinical” is recorded as the reason for inpatient days not meeting criteria (49 percent of days not meeting criteria), this cohort warrants special attention. Our on-site interactions with clinicians suggest that this category likely represents a heterogeneous Veteran population for whom InterQual criteria fail to fully capture the patient complexity justifying inpatient admission. Other potential justifications for the high proportion of patients failing to meet InterQual continued stay criteria for reasons related to clinical judgment are that physicians place little value on UM criteria or that clinical documentation does not accurately reflect patients’ care contributing to

Assessment F (Workflow – Clinical)
The views, opinions, and/or findings contained in this report are those of the assessment team and should not be construed as an official government position, policy, or decision.
134
ineffective UM reviews (addressed in Section 9). McKesson’s InterQual criteria supports more than 3,700 hospitals across the country (McKesson website, 2015), so we believe it is a relevant algorithm, albeit with potential for customization to reflect VA patient characteristics. Section 9 provides additional detail on provider documentation as a potential limiter to effective UM.
Our assessment demonstrated the following key issues affecting VHA’s ability to effectively transition patients to settings for appropriate post-acute care:
7.2.2.1 Veterans requiring placement within post-acute care facilities experience significant discharge delays
7.2.2.2 Limited social resources (e.g., transitional housing, homeless programs) for Veterans awaiting discharge prolongs LOS
7.2.2.1 Veterans Requiring Placement Within Post-Acute Care Facilities Experience Significant Discharge Delays
VAMCs experience significant difficulty with patients being discharged to post-acute care facilities. This is evidenced by the following: (1) VHA data indicates prolonged LOS and frequent reviews not meeting criteria due to placement issues; and (2) front-line staff report significant difficulty with post-acute placement.
VHA data indicates prolonged LOS and frequent reviews not meeting criteria due to placement issues. We found that while LOS management is a challenge across VHA, it is a particular challenge for Veterans discharged to post-acute care facilities. Our analysis of national datasets indicates that LOS for these patients exceeds LOS for Veterans discharged to home by about 5.1 days (Figure 7-3). Data tracked within the NUMI tool provides further evidence of discharge delays suggested by VHA LOS data. During FY14, about 19 percent of continued stay reviews not meeting criteria were due to post-acute placement issues, making post-acute placement issues the most common non-clinical reason for reviews not meeting criteria (Figure 7-4). Front-line staff report significant difficulty with post-acute placement. Challenges with post-acute placement were commonly reported by front-line staff. Staff at 55 percent of sites reported this discharge barrier during assessment workshops,282 and case managers/social workers cited this issue more commonly than any other discharge barrier (42 percent of interviewees).283 Patient placement issues were reported to be particularly acute for specific Veteran subgroups, including aggressive-demented patients and patients requiring long-term ventilator care. Front-line staff at several facilities indicated that this challenge is influenced by an inability to efficiently contract with post-acute care facilities in the community (reported by 25 percent of sites).284
282 Site visit discharge planning assessment workshops (N=20) 283 Site visit case manager / social worker interviews (N=21) 284 Site visit discharge planning assessment workshops (N=20)

Assessment F (Workflow – Clinical)
The views, opinions, and/or findings contained in this report are those of the assessment team and should not be construed as an official government position, policy, or decision.
135
VHA has created a network of Community Living Centers (CLCs) in an attempt to address Veteran placement challenges. At present, approximately 75 percent of VAMCs have dedicated CLCs, which are VHA-operated post-acute care facilities whose offerings range from short-term rehabilitation, to long-term care for psychiatric illness, to hospice and palliative care services.285 Access to a CLC would be expected to alleviate post-acute Veteran placement issues to some degree. However, our analysis of NUMI data suggests minimal differences between VAMCs with CLCs and those without in frequency of continued stay reviews not meeting InterQual criteria due to post-acute placement issues (19.3 percent for facilities with CLCs versus 17.9 percent for facilities without CLCs). This finding supports themes expressed by front-line staff during site visits, namely that some CLCs have capacity issues and that CLC placement requires lengthy qualification processes, leading to discharge delays.286 Based on the scope of our assessment outlined within the Choice Act, we did not assess capacity within VHA-operated CLCs or current and projected Veteran post-acute care demand. However, an assessment of these adjacent areas would be beneficial to developing a more comprehensive understanding of VHA’s challenges related to post-acute placement.
7.2.2.2 Limited Social Resources (e.g., transitional housing/homeless programs) for Veterans Awaiting Discharge Prolongs LOS
Features of the Veteran population make VHA particularly susceptible to discharge challenges related to availability of social resources in the post-acute setting. The academic literature has documented increased prevalence of several key social factors within the Veteran population, including homelessness, PTSD, substance abuse, and limited family support (Tsai, 2015). These and other social factors can create barriers to discharge, as Veterans may be medically ready to leave the acute care inpatient setting but may be difficult to place in a more appropriate setting.
Each of the following implicates social resources as contributing to Veteran discharge delays: (1) VHA data indicates prolonged LOS and frequent reviews not meeting criteria due to social issues; (2) front-line staff report social issues as a prominent discharge barrier; and (3) staff reported consistent challenges arranging transportation for Veterans during site visits.
VHA data indicates prolonged LOS and frequent reviews not meeting criteria due to social issues. LOS for Veterans requiring discharge to settings to address social issues (e.g., transitional housing, domiciliary care for homeless Veterans) is about 3.5 days longer than for Veterans discharged to home, as indicated in Figure 7-3. Data from the NUMI tool also suggests that social issues often lead to inpatient bed-
285 VSSC (2014) 286 Site visit discharge planning assessment workshops (N=20)

Assessment F (Workflow – Clinical)
The views, opinions, and/or findings contained in this report are those of the assessment team and should not be construed as an official government position, policy, or decision.
136
days that do not meet InterQual criteria for continued stay. During FY2014, 7.1 percent of inpatient continued stay reviews not meeting criteria were due to social issues (Figure 7-4). Of these reviews not meeting criteria, 65 percent were due to either homelessness or lack of caregiver support. This data indicates that limited access to social resources outside the inpatient setting drives discharge delays and prolongs LOS. Front-line staff report social issues as a prominent discharge barrier. During our site visits, social issues were consistently cited as a source of discharge delays. To illustrate, 50 percent of sites reported challenges with holding patients in the inpatient setting for non-medical reasons due to scarce outside resources (e.g., limited availability in substance abuse treatment programs).287 When asked to rank eight potential discharge challenges according to their impact on prolonging LOS, “social factors” was ranked as the largest challenge, rated as the number one discharge barrier by 47 percent of front-line staff.288 Comments made by front-line staff during site visits further reinforce this point. One case manager reported: “Our VISN has developed many strong programs to address social issues like substance abuse and homelessness, but it is often very difficult to place patients in these programs, even when these programs are operated by other facilities within the VISN.”289 A comprehensive assessment of capacity within VHA’s post-acute social programs was out of scope for our assessment, but it would be helpful to better understand how widespread these issues are as well as their underlying drivers and potential solutions across the organization. Staff reported consistent challenges arranging transportation for Veterans during site visits. Timely transportation from the acute care facility to post-acute care settings is a key enabler of effective LOS management. During our on-site assessment workshops, 80 percent of sites reported limited transportation options as a common discharge barrier for Veterans otherwise ready for discharge.290 Many factors were reported as contributing to problems with transportation, including unavailability of family members to provide rides for Veterans, limited availability of Veteran Transportation Services (VTS) at key times, inadequate contracts with community transportation partners, and overly stringent qualification standards for Veteran travel benefits. These difficulties may contribute to delayed care transitions and inefficient use of inpatient resources. We did not comprehensively assess VHA’s transportation programs and policies for determining Veteran eligibility; additional analysis would be beneficial to understand the root causes of the transportation issues raised on-site.
287 Site visit discharge planning assessment workshops (N=20) 288 Site visit discharge planning pre-assessment workshop polls (N=100) 289 Site visit case manager / social worker interview 290 Site visit discharge planning assessment workshops (N=20)
Assessment F (Workflow – Clinical)
The views, opinions, and/or findings contained in this report are those of the assessment team and should not be construed as an official government position, policy, or decision.
137
Typical VAMC Operating Models do not Promote Efficient Inpatient Care, Leading to Prolonged LOS
High-performing hospital organizations create opportunities for LOS improvements by employing an operating model emphasizing timely access to needed clinical services. In many cases, this means moving away from traditional patterns of inpatient care delivery in favor of practices that promote patient-centered and evidence-based care. For example, abundant evidence from the academic literature supports 7-day-per-week coverage of consultative services as an intervention to accelerate progression of inpatient care and improve LOS (Engel, 2013; Kolber, 2013; Rapoport, 1989). In addition, improvements in quality and efficiency have been achieved through implementation of inpatient clinical protocols, which are standardized processes for delivering a specific intervention (e.g., ventilator weaning) in the inpatient setting (Girard, 2008; Gao, 2005). Finally, high-performing hospital systems have improved efficiency and quality of inpatient care processes through development of inpatient clinical pathways, which are standard processes for managing the admission-to-discharge needs of specific patient sub-groups (e.g., patients undergoing knee replacement/extensive colon surgery) (Winther, 2015; Wind, 2006). These changes to the hospital operating model are key enablers of improved LOS performance because they accelerate inpatient care processes, expedite recovery, and facilitate appropriate discharge to lower levels of care.
Our assessment suggested challenges with specific elements of VHA’s operating model. For example, 60 percent of participants in our on-site discharge planning workshops reported delays obtaining consults and tests as a barrier to timely progression of care.291 Furthermore, implementation of standard, evidence-based protocols and pathways has been left to individual facilities, resulting in significant variation within and among VAMCs in patterns of care for managing similar clinical problems. Improvements to VHA’s practices for diagnosing and treating patients are needed to enable efficient progression of care, which contributes to both high-quality outcomes and appropriate use of inpatient resources.
We identified two drivers of VHA’s challenges in providing inpatient care through an efficient, evidence-based approach:
7.2.3.1 Reduced access to consultative services (e.g., specialist/allied health consults) over the weekend heightens discharge challenges
7.2.3.2 Inconsistent implementation of standard protocols and pathways drives variability in care patterns and may increase patient LOS
7.2.3.1 Reduced Access to Consultative Services (e.g., specialist/allied health consults) Over the Weekend Heightens Discharge Challenges
Section 2.2 of this report outlines in detail VHA’s challenges with respect to staffing during off-tour hours. These challenges not only drive gaps in VHA’s ability to safely and effectively respond to patient needs, but also have implications for LOS management and efficacy of care transitions. Our analysis of VHA national data has revealed that: (1) discharges are less common
291 Site visit discharge planning assessment workshops (N=20)
Assessment F (Workflow – Clinical)
The views, opinions, and/or findings contained in this report are those of the assessment team and should not be construed as an official government position, policy, or decision.
138
over the weekend; and (2) LOS is prolonged over the weekend, particularly for patients requiring specialty and allied health support. These observations support the hypothesis that limited weekend coverage of key clinical personnel is one key driver of prolonged LOS for VHA.
Discharges are less common over the weekend. Analysis of VHA encounter-level data suggests that only about 14 percent of VHA discharges occur on Saturday or Sunday (Figure 7-5).292 In a true 24/7 system operating without distinction between weekdays and weekends, this expected number would be about 28 percent. Although industry-wide benchmarks for weekend discharge percentages are limited, data from Intermountain Healthcare indicates that weekend discharges within its system comprise about 25 percent of overall discharges.293 This suggests that gaps in VHA’s weekend operating model may prolong LOS. This is consistent with reports from front-line staff at several VAMCs, one of whom stated: “In terms of hours of operation, our facility is more like a clinic than a true 24/7 inpatient acute care hospital.”294
292 VHA Medical SAS Inpatient Dataset (FY2014) 293 Intermountain Healthcare SME interview (May 19, 2015) 294 Site visit discharge planning assessment workshops (N=20)

Assessment F (Workflow – Clinical)
The views, opinions, and/or findings contained in this report are those of the assessment team and should not be construed as an official government position, policy, or decision.
139
Figure 7-5. Discharges by Day of Week
LOS is prolonged over the weekend, particularly for patients requiring specialty and allied health support. Data collected within the National Utilization Management Integration (NUMI) tool provides evidence for increased LOS for patients whose stay extend into the weekend: there is a 2.7 percent increase in continued stay reviews not meeting criteria on weekends (36.3 percent) versus weekdays (33.6 percent).295 In addition, our analysis of VHA encounter-level data suggests that patient stays for diagnoses commonly requiring consultative services are prolonged when these stays extend over the weekend. This is illustrated in Figure 7-6 by increased LOS for Veterans admitted Thursday through Sunday for stroke (about 18 percent LOS increase), joint replacement (about 32 percent LOS increase), and angina (about 18 percent LOS increase).296,297 However, due to the unavailability of time-stamped consult data, we were unable to analyze
295 NUMI continued stay review data (FY2014) 296 VHA MedSAS data (FY2014) 297 Patients treated in the inpatient setting for these diagnoses regularly require early evaluation and, in many
cases, reevaluation by specialty consultants to ensure progression of treatment and readiness for safe discharge.

Assessment F (Workflow – Clinical)
The views, opinions, and/or findings contained in this report are those of the assessment team and should not be construed as an official government position, policy, or decision.
140
discrepancies, by day of week, between when a consult was ordered and when it was administered.
Figure 7-6. LOS by Admission Day of Week for DRGs Requiring Consultations
7.2.3.2 Inconsistent Implementation of Standard Protocols and Pathways Drives Variability in Care Patterns and may Increase Patient LOS
Evidence from the academic literature suggests that provider organizations can achieve significant gains in quality and efficiency of inpatient care through implementation of evidence-based protocols and pathways (Silow-Carroll, 2007). While it is not possible to homogenize all care delivery processes, alignment of care patterns for common interventions (e.g., ventilator weaning in the ICU, early mobility for post-operative patients) and diagnoses (e.g., knee replacement, sepsis) through evidence-based protocols and pathways has been shown, in many instances, to reduce patient complications and decrease overall LOS (Drolet, 2013; Blackwood, 2011). Many high-performing hospital systems, including Intermountain Healthcare, have driven significant improvements in clinical quality and efficiency through implementation of standard, evidence-based practices (see case study below).

Assessment F (Workflow – Clinical)
The views, opinions, and/or findings contained in this report are those of the assessment team and should not be construed as an official government position, policy, or decision.
141
Table 7-4. External Case Study: Inpatient Clinical Pathways
Best practice external case study – Intermountain Healthcare298
To increase the adoption of evidence-based care, the Intermountain Healthcare has developed clinical pathways promoting a standard approach to managing common clinical conditions across the organization (Intermountain Healthcare Interview, 2015).
Intermountain’s approach to care pathway development and implementation
Identify priority diagnoses with significant variability in existing patterns of care delivery as potential candidates for pathway development
Review the academic literature to determine current best practices for care delivery to patients with target diagnoses
Align on standard processes and patterns of care to treat the diagnosis and educate providers regarding their use
Embed care pathways into existing clinical workflow through creation of standard order sets, making the standard of care the “default option”
Illustrative results
Extensive colon surgery pathway (Early Recovery After Surgery): decreased average LOS from 11 days to 4 days
Sepsis identification pathway: reduced ICU mortality for patients with sepsis and decreased LOS by several days
Our assessment indicates that: (1) VHA’s national evidence-based practice efforts have almost exclusively focused on development of guidelines for use in the outpatient setting; and (2) while adoption of inpatient protocols and clinical pathways is commonly reported organization-wide, consistent use appears to be limited by lack of information regarding their availability.
VHA’s national evidence-based practice efforts have almost exclusively focused on development of guidelines for use in the outpatient setting. VHA has a long history of working to implement evidence-based practice into clinical workflows (Chou, 2007; Bauer, 1999). In collaboration with the Department of Defense (DoD), VHA established the VA/DoD Evidence-Based Practice Guideline Work Group in 1998, a group heralded by the Institute of Medicine for its efforts to develop and implement evidence-based practice guidelines.299 However, the standards developed by the work group have focused exclusively on care processes for the outpatient setting, limiting their impact on inpatient care delivery.300 This outpatient focus was confirmed by a national leader, who stated in a recent interview: “We’ve focused exclusively on development of outpatient clinical practice guidelines, which are
298 Intermountain Healthcare SME interview (May 19, 2015) 299 From VA/DoD Clinical Practice Guidelines website (http://www.healthquality.va.gov/) 300 Interview with VHACO leader

Assessment F (Workflow – Clinical)
The views, opinions, and/or findings contained in this report are those of the assessment team and should not be construed as an official government position, policy, or decision.
142
distinct from clinical pathways. Pathways tend to be a more local phenomenon to reflect local practice patterns and processes. I’m not sure that national has a role in determining how inpatient care should be delivered at the local level.”301 This leader also suggested that the VA/DoD workgroup’s outpatient focus is reflective of the distribution of care provided by the organization: because VHA provides a greater volume of care in the outpatient setting, guideline development has focused preferentially on this setting. While adoption of inpatient protocols and clinical pathways is commonly reported organization-wide, consistent use appears to be limited by lack of information regarding their availability. Our on-site observations suggest that inpatient protocols and clinical pathways are commonly available, but their use is inconsistent across VHA. ICU staff commonly acknowledged the existence of protocols and clinical pathways during site visits (81 percent of sites).302 Our survey supports this finding, with 80 percent of participating nurses reporting existence of protocols or pathways at their facility.303 While existence of protocols and pathways is common, nurses also frequently expressed barriers to their consistent use, including limited development of resources at the national level, unfamiliarity with the breadth of protocols and pathways in place at the local level, and difficulty in navigating the online resources where protocols and pathways are housed.304 Survey responses further reinforce the existence of knowledge gaps regarding available protocols and pathways: 37 percent of physicians reported that they didn’t know whether their facility had protocols or pathways (this is in addition to the 12 percent of physicians who stated that their facility did not have these resources at all).305 Due to a lack of organization-wide data reporting adherence to protocols and clinical pathways, we were unable to systematically examine utilization patterns across the organization. However, our site visit interactions do provide some insight into the types of resources that are currently in place. When referencing protocols and pathways currently in place at their facility, nurses commonly referred to protocols only (e.g., ventilator weaning protocol, central line bundle). None of the sites that we visited as part of our assessment referenced the existence of care pathways to guide care delivery from admission to discharge. While we are unable to confirm whether this is the case organization-wide, our assessment suggests that development of comprehensive care pathways has been, at best, extremely limited across VHA.
301 Interview with VHACO leader 302 Site visit ICU shadowing sessions (N=21) 303 Choice Act survey (N=294) 304 Site visit ICU shadowing session comments (N=21) 305 Choice Act survey (N=406)

Assessment F (Workflow – Clinical)
The views, opinions, and/or findings contained in this report are those of the assessment team and should not be construed as an official government position, policy, or decision.
143
Use of Discharge Planning Best Practices is Inconsistent, Decreasing Effectiveness and Coordination
Effective discharge planning practices are key to promoting efficiency as well as effectiveness of the care transition process. This has been demonstrated within the academic literature, with studies showing that well-planned discharges contribute to decreases in both LOS and readmission rate (Miani, 2014; Fox, 2013). Our assessment indicates that VHA has not systematically implemented practices to encourage timely and effective transitions of care. For example, just over half (55 percent) of VAMCs have dedicated case managers across inpatient units.306 In addition, while interdisciplinary discharge meetings have been implemented by about 79 percent of VAMCs, variable attendance challenges effectiveness.307 Finally, adoption of case management tools has been ad hoc and driven by individual facilities, potentially resulting in gaps in comprehensiveness of these tools. These and other challenges contribute to gaps in VHA’s discharge planning practices relative to high-performing hospital organizations and may prolong LOS and challenge safe and effective transitions of care.
We discovered that three key drivers of VHA’s current challenges with discharge planning are:
7.2.4.1 Suboptimal and inconsistent use of case managers results in re-allocation of critical discharge planning responsibilities to other staff
7.2.4.2 Variable deployment of key processes designed to expedite discharge results in avoidable discharge delays
7.2.4.3 Limited adoption of discharge planning tools may inhibit optimal application of case management efforts
7.2.4.1 Suboptimal and Inconsistent Use of Case Managers Results in Reallocation of Critical Discharge Planning Responsibilities to Other Staff
Private hospitals typically employ dedicated inpatient case managers308 to manage the discharge process end-to-end and ensure completion of all tasks necessary for safe and timely care transitions (ACMA, 2013). Our assessment revealed several instances of key discharge-related tasks being performed by other staff, including physicians calling nursing homes to arrange patient placement, floor nurses performing initial social evaluations to identify potential discharge barriers, and patient advocates coordinating care among medical service lines (e.g., coordination of orthopedics with prosthetics service).309 These practices may both
306 Choice Act data call (N=49) 307 Site visit med/surg and ICU shadowing sessions (N=42) 308 Case managers are often registered nurses by training with specialized expertise in discharge planning to ensure
that the acute and chronic needs of patients are appropriately met. Case managers often work in collaboration with social workers (responsible for handling complex psychosocial issues including patient placement and insurance eligibility) and utilization management (UM) specialists (responsible for ensuring that each patient’s use of intensive inpatient resources is appropriate).
309 Site visit discharge planning assessment workshops (N=20)

Assessment F (Workflow – Clinical)
The views, opinions, and/or findings contained in this report are those of the assessment team and should not be construed as an official government position, policy, or decision.
144
inhibit top-of-license practice and also delay care transitions as staff members without deep expertise in discharge planning perform key discharge tasks in addition to their primary duties.
Our assessment revealed several reasons for these care patterns, including: (1) less than half of VAMCs have assigned inpatient case managers across inpatient units; and (2) even where deployed, case manager roles and duties vary significantly from one VAMC to another.
Less than half of VAMCs have assigned inpatient case managers across inpatient units. Private sector hospitals typically employ a robust team of case management and social work professionals to promote timely discharge. According to a recent industry survey, the average private sector hospital employs twelve RN case managers, eight social workers, two to three utilization management (UM) or utilization review (UR) specialists, and one discharge specialist (ACMA, 2013). In contrast, only 55 percent of respondents to our data call indicated deployment of dedicated inpatient case managers at their facility.310 The lack of assigned personnel to manage the discharge planning process at many facilities likely contributes to LOS management challenges. Case manager roles and duties vary significantly from one VAMC to another. We observed significant variability among VAMCs in both titles and roles for case managers across adopting facilities. At facilities where the inpatient case management role had been implemented, titles for the role were varied and included care coordinators, discharge planners, collaborative care nurses, and collaborative care case managers. In addition to title differences, the duties of these staff varied from one facility to another: some shared utilization management duties while others focused exclusively on discharge planning, some had only inpatient responsibilities while others had duties that spanned both inpatient and outpatient settings. This variability resulted in some initial difficulties for facilities newly implementing the case manager role, as reflected by a case manager who commented during one site visit: “There were significant growing pains with implementation of the role less than a year ago. At first, it was unclear what duties should fall to the case manager versus the social worker. We’ve started to work some of the issues out, but there has definitely been some duplication of effort.” In contrast, other VAMCs have experienced tremendous success with implementation of case managers (see case study below). Variable results from implementation of the case manager role across VAMCs suggests gaps in dissemination of best practices across the organization.
310 Choice Act data call (N=49)
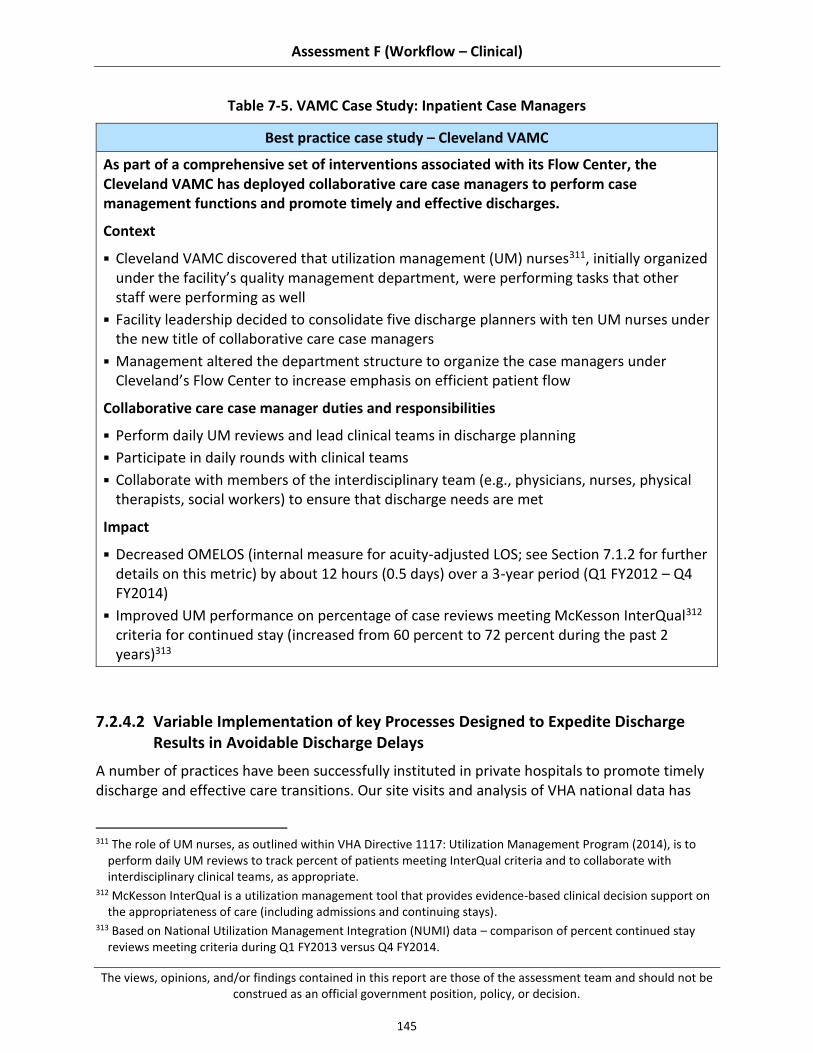
Assessment F (Workflow – Clinical)
The views, opinions, and/or findings contained in this report are those of the assessment team and should not be construed as an official government position, policy, or decision.
145
Table 7-5. VAMC Case Study: Inpatient Case Managers
Best practice case study – Cleveland VAMC
As part of a comprehensive set of interventions associated with its Flow Center, the Cleveland VAMC has deployed collaborative care case managers to perform case management functions and promote timely and effective discharges.
Context
Cleveland VAMC discovered that utilization management (UM) nurses311, initially organized under the facility’s quality management department, were performing tasks that other staff were performing as well
Facility leadership decided to consolidate five discharge planners with ten UM nurses under the new title of collaborative care case managers
Management altered the department structure to organize the case managers under Cleveland’s Flow Center to increase emphasis on efficient patient flow
Collaborative care case manager duties and responsibilities
Perform daily UM reviews and lead clinical teams in discharge planning
Participate in daily rounds with clinical teams
Collaborate with members of the interdisciplinary team (e.g., physicians, nurses, physical therapists, social workers) to ensure that discharge needs are met
Impact
Decreased OMELOS (internal measure for acuity-adjusted LOS; see Section 7.1.2 for further details on this metric) by about 12 hours (0.5 days) over a 3-year period (Q1 FY2012 – Q4 FY2014)
Improved UM performance on percentage of case reviews meeting McKesson InterQual312 criteria for continued stay (increased from 60 percent to 72 percent during the past 2 years)313
7.2.4.2 Variable Implementation of key Processes Designed to Expedite Discharge Results in Avoidable Discharge Delays
A number of practices have been successfully instituted in private hospitals to promote timely discharge and effective care transitions. Our site visits and analysis of VHA national data has
311 The role of UM nurses, as outlined within VHA Directive 1117: Utilization Management Program (2014), is to
perform daily UM reviews to track percent of patients meeting InterQual criteria and to collaborate with interdisciplinary clinical teams, as appropriate.
312 McKesson InterQual is a utilization management tool that provides evidence-based clinical decision support on the appropriateness of care (including admissions and continuing stays).
313 Based on National Utilization Management Integration (NUMI) data – comparison of percent continued stay reviews meeting criteria during Q1 FY2013 versus Q4 FY2014.

Assessment F (Workflow – Clinical)
The views, opinions, and/or findings contained in this report are those of the assessment team and should not be construed as an official government position, policy, or decision.
146
revealed the following gaps within VHA compared to best practice in the industry: (1) many, but not all, VAMCs perform interdisciplinary discharge planning meetings, but with variable attendance from key stakeholders; and (2) processes to promote early morning discharges are infrequently adopted.
Many, but not all, VAMCs perform interdisciplinary discharge planning meetings, but with variable attendance from key stakeholders. Private hospitals commonly employ interdisciplinary team meetings to promote early recognition and resolution of potential discharge barriers (Wong, 2011). This interprofessional collaboration has been shown in several studies to drive improvements in patient care (Zwarenstein, 2009). One academic medical center reported an 18 percent reduction in LOS from instituting effective interdisciplinary discharge meetings (Southwick, 2014). Our assessment demonstrated that several VAMCs have also successfully deployed daily interdisciplinary discharge meetings to improve LOS management (Figure 7-7 contains an illustrative example).
Figure 7-7. VAMC Case Study: Interdisciplinary Discharge Meetings
While common, the practice of holding daily interdisciplinary discharge meetings is not universal across VAMCs. Of sites visited during our assessment, 79 percent of

Assessment F (Workflow – Clinical)
The views, opinions, and/or findings contained in this report are those of the assessment team and should not be construed as an official government position, policy, or decision.
147
ICU and acute care units reported daily adoption of these meetings.314 Our interactions with front-line clinical staff during site visits suggest that interdisciplinary meetings are typically designed to involve an appropriate mix of professionals across clinical roles, as shown in Figure 7-8.315 However, participants at 65 percent of our assessment workshops reported challenges with inconsistent attendance at these meetings for key clinical roles, potentially contributing to discharge delays when not all stakeholders are involved in or aware of discharge preparations.316 This observation and our site visit finding that not all VAMCs have adopted these meetings suggest that potential impact from optimal interdisciplinary discharge meeting adoption has not been fully realized across VHA.
Figure 7-8. Roles Included in Interdisciplinary Discharge Meetings
Processes to promote early morning discharges are infrequently adopted. Many private hospitals have implemented processes to promote discharges earlier in the
314 Site visit med/surg and ICU shadowing sessions (N=42) 315 Site visit assessment workshop participants frequently cited the lack of allied health professional involvement in
interdisciplinary meetings as a barrier to effectiveness 316 Site visit discharge planning assessment workshops (N=20)
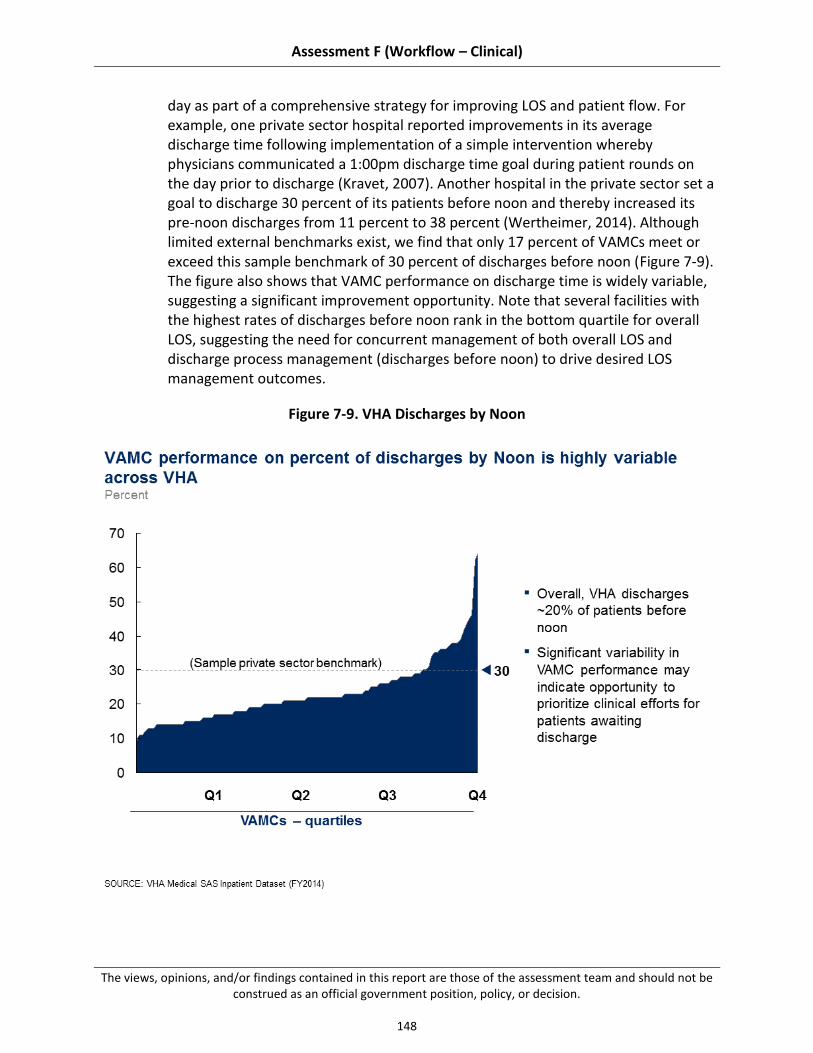
Assessment F (Workflow – Clinical)
The views, opinions, and/or findings contained in this report are those of the assessment team and should not be construed as an official government position, policy, or decision.
148
day as part of a comprehensive strategy for improving LOS and patient flow. For example, one private sector hospital reported improvements in its average discharge time following implementation of a simple intervention whereby physicians communicated a 1:00pm discharge time goal during patient rounds on the day prior to discharge (Kravet, 2007). Another hospital in the private sector set a goal to discharge 30 percent of its patients before noon and thereby increased its pre-noon discharges from 11 percent to 38 percent (Wertheimer, 2014). Although limited external benchmarks exist, we find that only 17 percent of VAMCs meet or exceed this sample benchmark of 30 percent of discharges before noon (Figure 7-9). The figure also shows that VAMC performance on discharge time is widely variable, suggesting a significant improvement opportunity. Note that several facilities with the highest rates of discharges before noon rank in the bottom quartile for overall LOS, suggesting the need for concurrent management of both overall LOS and discharge process management (discharges before noon) to drive desired LOS management outcomes.
Figure 7-9. VHA Discharges by Noon

Assessment F (Workflow – Clinical)
The views, opinions, and/or findings contained in this report are those of the assessment team and should not be construed as an official government position, policy, or decision.
149
7.2.4.3 Limited Adoption of Discharge Planning Tools may Inhibit Optimal Application of Case Management Efforts
Several discharge planning tools are commonly used in private hospitals to promote safe and timely discharge. Two commonly used tools are discharge checklists and case management software tools (Halasyamani, 2006; ACMA, 2013). Our site visits and data collection have revealed gaps in VHA’s suite of such tools, namely: (1) discharge checklists are developed at the local level and do not always address a comprehensive set of discharge needs; and (2) VHA has not adopted case management software tools.
Discharge checklists are developed ad hoc at the local level. Across VAMCs, there is no consistent tool used to facilitate comprehensive discharge planning. This can contribute to an inconsistent and incomplete discharge planning process, poor patient preparation, and last-minute scrambles at the time of discharge. Where implemented in private hospitals, discharge checklists have minimized these negative outcomes by ensuring that a comprehensive set of patient needs is addressed in an organized manner prior to discharge (Halasyamani, 2006). In order to address potential gaps in post-discharge care, some VAMCs have developed their own local tools to standardize the discharge process and streamline care transitions. Analysis of materials received through the data call suggests that discharge checklists have not been adopted across VHA: only 70 percent of VAMCs submitting documents as part of the data call submitted a discharge checklist, as requested.317 Furthermore, of discharge checklists submitted, several are targeted to the needs of specific patients (e.g., patients with heart failure/behavioral health issues) rather than designed for Veterans in general. While these locally developed resources may promote effective discharges in many cases, the fact that these tools have been inconsistently adopted across facilities and are not applicable to all Veterans suggests potential gaps in the tools used by VAMCs to effectively plan discharges. VHA has not adopted case management software tools. Case management software tools have been developed to address many of the common pain points within the discharge planning process. Some tools are designed to identify patients at high risk for readmissions and avoidable hospital days so that staff may intervene to prevent these outcomes. These software platforms risk-stratify patients based on presence of co-morbid conditions, lack of social/family support, and other important patient factors. Other tools address the labor-intensive and manual nature of the post-acute placement process by automating key steps (e.g., identifying post-acute care facilities with capacity, electronically transferring patient data). According to industry survey data, these tools have been implemented by about 30 percent to 50 percent of private sector facilities (ACMA, 2013). Though there have been no
317 Choice Act data call (N=67)

Assessment F (Workflow – Clinical)
The views, opinions, and/or findings contained in this report are those of the assessment team and should not be construed as an official government position, policy, or decision.
150
academic studies to definitively prove the benefits of these tools, our interviews with experienced inpatient case managers confirmed that use of these tools is becoming increasingly common within private sector hospitals.
Based on evidence gathered from our site visits, VAMCs have not implemented software tools to facilitate the discharge planning and patient placement processes. Case management staff at one facility reported that implementation of tools had been proposed at their facility but not initiated due to privacy/security concerns. This is consistent with our findings from interviews with national VHA leaders, one of whom commented: “Our efforts to implement a case management tool were essentially ‘dead on arrival.’ IT leadership said it was incompatible with VA IT culture because of privacy and security concerns, and the effort went nowhere.”
Lack of adoption of these tools may exacerbate existing challenges with effective discharge planning. For example, in the absence of tools to trigger patients in need of intensive case management based on patient factors, VHA case managers report using traditional approaches to prioritize interventions. These approaches include comprehensive assessments of all new admissions, reliance on MD/RN consults, or informal identification of priority patients during interdisciplinary rounds, among others (Figure 7-10). Reliance on these methods may result in inefficiencies, as suggested by 33 percent of case managers who indicated during interviews that there are better ways, in their view, to trigger patients for case management interventions.318
318 Site visit case manager / social worker interviews (N=21)

Assessment F (Workflow – Clinical)
The views, opinions, and/or findings contained in this report are those of the assessment team and should not be construed as an official government position, policy, or decision.
151
Figure 7-10. Primary Triggers to Prioritize Patients for Intensive Case Management Within VHA
7.3 Recommendations
VHA LOS management and care transition practices have multiple stakeholders: Congress and the executive branch, VACO, VHACO, VISN leadership, and VAMC management and staff. Encouraging innovation and addressing critical challenges in effective LOS management and care transitions will require collaboration among all of these groups, and a commitment to making difficult, long-term change. Different recommendations should be owned by different groups (e.g., recommendation requiring changes to VACO policy versus local policy) -- however, support for change from all stakeholders is critical to effective implementation.
Our recommendations, building on existing strengths and addressing existing challenges in effective LOS management and care transitions, can be categorized into two main themes.
7.3.1 Mitigate discharge delays related to post-acute placement (e.g., increase availability of post-acute care options)
7.3.2 Build on existing best practices, both internal and external to VHA, to increase local adoption of evidence-based inpatient care and discharge planning practices
Assessment F (Workflow – Clinical)
The views, opinions, and/or findings contained in this report are those of the assessment team and should not be construed as an official government position, policy, or decision.
152
These themes are consistent with practices suggested by the academic literature, professional associations, and high-performing hospitals within VHA and outside the system, as well as solutions proposed by front-line VHA staff – further details are included in "summary of supporting evidence" sections in each sub-recommendation (see Appendix D.4 for additional detail on our methodology for gathering this data). To help VHA implement our recommendations, we have also suggested next steps in the "potential near-term actions" sections of the sub-recommendations. Note, because different VAMCs may have already adopted some recommended practices or experience unique barriers, these suggestions should be tailored the individual circumstances of each VAMC. Each recommendation is supported by several sub-recommendations, which map to the “organization, workflow processes, and tools” domains specified in the Choice Act. For a detailed map of how the sub-recommendations relate to these domains, see Table D-2 in Appendix D.3.
Several recommendations overlap with other assessment areas. Where this occurs, we have referenced the relevant assessment area, where additional detail can be found.
Mitigate Discharge Delays Related to Post-acute Placement (e.g., increase availability of post-acute care options)
Improvements to VHA’s care transition processes for patients requiring post-acute placement are key to addressing overall LOS challenges. Several challenges exist with respect to VHA’s ability to transition Veterans from the acute inpatient setting to the next venue of care. The most pressing discharge-related challenge identified in this assessment was difficulty placing patients in post-acute care facilities. While this challenge is not unique to VHA, leading provider organizations that have aggressively addressed this discharge barrier have experienced improvements not only in efficiency, but also in important quality metrics (e.g., decreased hospital readmission rates) (Sandvik, 2013).
Priority recommendations to improve Veteran access to appropriate post-acute care are provided below:
7.3.1.1 Increase availability of post-acute care options, particularly for special needs Veteran populations
7.3.1.2 Increase resources for patient transportation and provide front-line staff with authority to approve transport when it poses a barrier to timely discharge
7.3.1.1 Increase Availability of Post-acute Care Options, Particularly for Special Needs Veteran Populations
Analysis of VHA data suggests that LOS for patients requiring placement within post-acute care facilities and social support programs is about 3.5 to 5 days longer than patients discharged to home. Although some portion of this observed increase may be due to differences in Veteran health status, frequent site visit reports of discharge barriers related to Veteran placement indicate that delays in the care transition process also contribute. Private sector hospitals facing similar challenges have improved LOS and quality outcomes by increasing access to post-acute care facilities. VHA should address discharge barriers related to Veteran post-acute placement

Assessment F (Workflow – Clinical)
The views, opinions, and/or findings contained in this report are those of the assessment team and should not be construed as an official government position, policy, or decision.
153
to improve LOS and streamline care transitions. Doing so will require additional analysis of capacity and availability of post-acute care facilities, both VHA-operated and within the community. Because a comprehensive review of these facilities was out of scope for this assessment, we recommend additional steps below to better understand and respond to post-acute care needs of Veterans.
Summary of supporting evidence:
See Sections 7.2.2.1 and 7.2.2.2 for more detail on findings.
Proposals from clinical staff participating in on-site workshops suggest consistent front-line recognition of Veteran post-acute placement issues, with participants recommending increased capacity within VHA-operated CLCs and other post-acute care facilities (60 percent of sites), increased ability to contract with post-acute facilities in the community (50 percent of sites), and expansion of programs and services matched to Veteran needs (50 percent of sites).319
Evidence from an academic study of critical access hospitals (CAHs) suggests that acute care facilities can reduce LOS by increasing availability of post-acute care options for patients, including patients with complex clinical needs (e.g., ventilator patients) (Lindsay, 2014).
Potential near-term actions:
VHACO: Conduct national review of current and projected post-acute care capacity and availability of specialized programs (e.g., substance abuse rehabilitation, medical foster homes for Veterans with limited caregiver support) in communities surrounding VAMCs, compared with current and projected Veteran needs.
o VACO/VHACO: Project Veteran need for post-acute care across geographies based on current and future trends in patients requiring facility-level care or placement in specialized programs after discharge.
o VHACO: Assess current and projected future capacity within VHA-operated post-acute care facilities (e.g., CLCs, domiciliary care); compare with projections of future inpatient acute care needs to identify potential opportunities to convert inpatient space into capacity for post-acute care.
o VHACO: Provide projections and recommendations to local VAMCs, highlighting geographies with urgent current post-acute care needs as well as those with projected needs in the near term.
VHACO: Streamline nationally-outlined processes for contracting with community post-acute care facilities to enable increased formation of VAMC-community partnerships.
VAMC: Address gaps in local post-acute care capacity and avoidable sources of discharge delay related to inefficient care transitions.
o VAMC: Identify community facilities with existing VHA contracts as well as potential community partners for future contracting.
319 Site visit discharge planning assessment workshops (N=20)

Assessment F (Workflow – Clinical)
The views, opinions, and/or findings contained in this report are those of the assessment team and should not be construed as an official government position, policy, or decision.
154
o VAMC: Form local partnerships with high-quality community facilities (through establishment of contracts) to address gaps in current VHA post-acute and social care coverage.
o VAMC: Map transition process for Veterans discharged to post-acute care facilities to identify and mitigate addressable barriers to timely discharge.
7.3.1.2 Increase Resources for Patient Transportation and Provide Front-line Staff With Authority to Approve Transport When it Poses a Barrier to Timely Discharge
Our site visits indicated that timely access to transportation is often a significant barrier to discharge. Recommendations from industry associations suggest efficiency gains through improved patient transportation processes and resources. VHA should act to address discharge challenges related to transportation that cause extended stays in the acute care setting.
Summary of supporting evidence:
See Section 7.2.2.2 for more detail on findings.
Proposals from clinical staff participating in on-site workshops suggest front-line support for transportation-focused interventions, with 75 percent of sites proposing increased transportation options or relaxed transportation eligibility standards to improve facility LOS outcomes.320
Evidence from a comparable large, public sector health system suggests timely arrangement of patient transportation is a key enabler of successful discharge practices (NHS, 2008).
Recommendation from health care improvement organizations includes a proactive focus on arranging patient transportation as part of comprehensive efforts to facilitate timely discharge (IHI, 2014).
Potential near-term actions:
VACO/VHACO: Revise national transportation policies to permit local clinical staff to arrange and cover costs of transportation for a limited number of Veteran cases in which transportation barriers inappropriately extend inpatient stays.
o VACO/VHACO: Base eligibility determinations for exceptions to national transportation policy on NUMI continued stay case reviews flagged as not meeting criteria due to transportation concerns.
o VACO/VHACO: Set limit on annual allowable expenses for transportation exceptions based on facility-specific factors (e.g., number of Veterans served, Veteran catchment area, federal mileage guidelines).
320 Site visit discharge planning assessment workshops (N=20)
Assessment F (Workflow – Clinical)
The views, opinions, and/or findings contained in this report are those of the assessment team and should not be construed as an official government position, policy, or decision.
155
VAMC: Review local capacity and utilization of existing VHA transportation resources to understand performance overall as well as during periods of reported capacity limitations (e.g., nights, weekends).
VISN/VAMC: Expand alternative local transportation options (e.g., contracts with community-based transportation, programs for volunteer transportation services) to address gaps in facility-level patient transport coverage.
Build on Existing Best Practices, Both Internal and External to VHA, to Increase Local Adoption of Evidence-based Inpatient Care and Discharge Planning Practices
Adoption of evidence-based practices for efficient inpatient care delivery and effective discharge planning across VHA is key to LOS management efforts. Our assessment revealed inefficiencies in the approach that many VAMCs employ to providing efficient clinical care and managing discharges, including lack of performance management focused on LOS metrics, limited implementation of care pathways to align patterns of care with best clinical evidence, and variable discharge planning processes across the organization. As evidenced in the academic literature, acting to fill these gaps may have positive effects on patient LOS (Shepperd, 2004), avoidable readmissions (Naylor, 1999), and patient satisfaction (Hager, 2010).
As outlined in Section 7.2.1, VHA has launched several collaboratives with the potential to address these issues. However, system-wide impact from these collaboratives has been limited due to variable participation related both to limited ability of VHA to support VAMCs nationwide and to unequal facility-level desire to participate in collaboratives. As a result, care practices in place across facilities are in varying stages of maturity, particularly with respect to discharge planning (facilities that have been frequent participants in collaboratives and have spurred local performance improvement have more robust discharge planning processes than other VAMCs). In consideration of these facility-level differences, it is critical that VHA’s strategy to improve LOS management is one of local empowerment and best practice promotion to enable facilities to adopt those practices that will move them from their current state to the next appropriate step in promoting effective and efficient care practices. Improvements in VHA’s approach to data transparency and performance management are critical to enabling these improvement efforts by creating a shared understanding of current and targeted future performance on LOS management metrics.
Priority recommendations to enhance VHA’s inpatient care practices are provided below:
7.3.2.1 Track key performance measures related to LOS management processes to increase transparency, accountability, and performance improvement
7.3.2.2 Develop evidence-based care pathways for common inpatient clinical processes, and incorporate into EHR tools and clinical workflows
7.3.2.3 Promote sharing and implementation of discharge planning best practices across VAMCs

Assessment F (Workflow – Clinical)
The views, opinions, and/or findings contained in this report are those of the assessment team and should not be construed as an official government position, policy, or decision.
156
7.3.2.4 Increase off-hours coverage of clinical services including specialist consults, allied health evaluations, and imaging/diagnostics
As indicated above, we have included enhanced performance management as the first sub-recommendation, as implementation of performance management structures related to LOS are foundational to supporting the other sub-recommendations.
7.3.2.1 Track Key Performance Measures Related to LOS Management Processes to Increase Transparency, Accountability, and Performance Improvement
Our assessment revealed gaps in VHA’s approach to consistently communicating LOS performance to facility leadership and clinical staff. Evidence from the academic literature indicates that data transparency and performance management can be powerful tools to drive operational improvements in health care. VHA should undertake efforts to increase facility and individual-level transparency into UM and LOS performance and promote accountability for improvements to alter perceptions of local stakeholders and support other performance improvement efforts.
Summary of supporting evidence:
See Section 7.2.1.1 for more detail on findings.
Research in the health services literature suggests that hospital management approach is an important contributor to LOS performance (Jong, 2006).
Experience of leading hospitals demonstrates that operational improvements can be driven through increased data transparency (e.g., performance tracking dashboards) (McLaughlin, 2014).
Recommendation from the Society of Hospital Medicine includes using LOS as one of 10 performance metrics for evaluating hospital physicians (SHM, 2006).
Evidence from the medical literature suggests that even simple interventions such as profiling physician performance on LOS relative to peers can be effective in reducing LOS (Zemencuk, 2006).
Experience of the Bay Pines VAMC illustrates that integration of NUMI performance metrics into the physician bonus structure yielded local operational improvements, including improved NUMI performance on continued stay reviews, improvements in patient flow, and elimination of the VAMC’s need to divert patients to outside facilities (see case study in Section 7.2.1.1).
Potential near-term actions:
VHACO/VAMC: Incorporate an optimal set of LOS metrics into national SAIL report and promote facility-level performance improvements through annual aspirational target setting.
o VHACO: Designate a limited set of outcomes-oriented metrics to assess facility-level improvements to LOS practices (e.g., percent of discharges by noon, percent of discharge orders entered by 9:00am, and percent of patients with pre-discharge order entered).

Assessment F (Workflow – Clinical)
The views, opinions, and/or findings contained in this report are those of the assessment team and should not be construed as an official government position, policy, or decision.
157
o VHACO: Balance current SAIL LOS metric (adjusted LOS) with the limited set of outcome-oriented metrics to create an optimized set for drawing LOS performance comparisons across facilities on key outcomes and processes.
o VHACO/VAMC: Set national targets and annual aspirational facility-level goals to promote consistent performance improvement.
VAMC: Profile unit-level performance on LOS management metrics (e.g., OMELOS, continued stay appropriateness from NUMI reviews, percent of discharges before noon) at the local level and regularly recognize high-performing units to accelerate adoption of best practices facility-wide.
VAMC: Incorporate physician performance on LOS metrics into annual physician performance plans developed at the local level, with a portion (amount to be determined by the facility) of physician performance pay tied to achievement of LOS performance goals.
7.3.2.2 Develop Evidence-based Care Pathways for Common Inpatient Clinical Processes, and Incorporate into EHR Tools and Clinical Workflows
Our observations of clinical units and discussions with front-line staff suggest opportunity to improve VHA’s approach to care delivery for common Veteran inpatient conditions through consistent adoption of evidence-based practices. This approach would more closely mirror high-performing organizations that have adopted standard processes to promote patient care that is effective, efficient, and evidence-based. To achieve this goal, we recommend that VHA collaborate with local physicians both to strengthen local adoption of standard clinical protocols across the organization and to develop evidence-based care pathways and promote their local implementation as part of a sustained VHA transformation effort.
Summary of supporting evidence:
See Section 7.2.3.2 for more detail on findings.
Proposals from clinical staff participating in on-site workshops suggest front-line support for increased use of standard processes to deliver inpatient care, with 35 percent of sites recommending development and implementation of protocols or care pathways as an intervention to improve LOS management practices.321
Research from the academic literature supports the use of clinical protocols to improve inpatient LOS for select processes (e.g., early mobility protocols for rehabilitation) (Drolet, 2013).
Evidence from the academic research supports the use of inpatient care pathways outlining admission-to-discharge processes to streamline inpatient stays related to several conditions and procedures, including knee replacement and colon surgery (Peterson, 2008; Bradshaw, 1998).
321 Site visit discharge planning assessment workshops (N=20)

Assessment F (Workflow – Clinical)
The views, opinions, and/or findings contained in this report are those of the assessment team and should not be construed as an official government position, policy, or decision.
158
Experience of an illustrative high-performing provider organization demonstrates LOS and quality benefits through implementation of care pathways, including reductions in mortality through implementation of a sepsis pathway and sizable LOS reductions through implementation of a perioperative colon surgery pathway (see case study in Section 7.2.3.2).
Potential near-term actions:
VHACO: Increase availability of data at the front line (e.g., percent of Veterans with sepsis receiving standard sepsis bundle, percent of Veterans receiving timely physical therapy as part of early mobilization protocol) to drive transparency into current patterns of care delivery organization-wide.
VHACO/VAMC: Promote consistent national use of standard evidence-based protocols for common, high-impact interventions (e.g., ventilator weaning, sepsis bundles) through performance management.
o VHACO/VAMC: Develop national resource that aggregates evidence-based protocols for key inpatient interventions (e.g., ventilator weaning, sepsis bundles), leveraging protocols currently in place across the organization.
o VHACO/VAMC: Ensure that evidence-based protocols are embedded within clinical decision support tools (e.g., computerized physician order entry, electronic health record templates) to facilitate adoption of evidence-based practices.
o VHACO: Align data collection and reporting capabilities to track the use of priority protocols and performance on related quality metrics across the organization.
VHACO/VAMC: Organize a national VHA center of excellence to begin the development and implementation of clinical pathways, evidence-based processes addressing the admission-to-discharge needs for inpatient treatment of common Veteran diagnoses.
o VHACO: Designate a full-time champion to lead the center of excellence as part of VHA’s broader transformation efforts, selecting an individual with clinical experience and extensive knowledge of quality and performance improvement techniques.
o VHACO/VAMC: Engage with clinical leaders from across VHA of various roles and specialties throughout the pathway development and refinement process.
o VHACO/VAMC: Assess current state of care pathway implementation across the organization (call for existing care paths from VAMCs promoted by national recognition for facilities with existing best practices).
o VHACO: Select three to five national clinical priorities for initial care pathway development work, optimizing for processes with considerable variability in practice patterns and ample evidence from the academic literature to support positive impact from inpatient pathway development.
o VHACO: Collaborate with VA/DoD Evidence-Based Practice Guideline Work Group to ensure alignment and a prevent duplication of efforts.

Assessment F (Workflow – Clinical)
The views, opinions, and/or findings contained in this report are those of the assessment team and should not be construed as an official government position, policy, or decision.
159
o VHACO: Develop data collection and reporting capabilities to monitor implementation of pathways and associated quality outcome improvements at the facility-level.
7.3.2.3 Promote Sharing and Implementation of Discharge Planning Best Practices Across VAMCs
Our assessment revealed that while select VAMCs have implemented best practices in discharge planning, these practices have not been consistently adopted across VHA. Key areas of significant national variability are the deployment of case managers to oversee the discharge planning process and the adoption of standardized discharge processes. Evidence from the medical literature demonstrates significant opportunity for LOS improvement through improved discharge planning. VHA should undertake a national effort to promote discharge planning best practice adoption, building upon existing pockets of strength to broaden implementation of practices that have demonstrated impact in improving LOS outcomes at select VAMCs.
Summary of supporting evidence:
See Sections 7.2.4.1, 7.2.4.2, and 7.2.4.3 for more detail on findings.
Proposals from clinical staff participating in on-site workshops suggest front-line support for improved discharge planning, including the following interventions:
o Prioritization of early morning rounding/consults/diagnostics for patients awaiting discharge (70 percent of sites)
o Deployment of dedicated inpatient case managers (50 percent of sites overall, and 91 percent of sites without dedicated case managers at present)
o Initiation of discharge planning process earlier during admission (45 percent of sites)
o Improvement to processes for securing needed materials (e.g., medications, durable medical equipment) prior to discharge (45 percent of sites)
o Standardization of the overall discharge process (35 percent of sites)322
Evidence from the academic literature supports improved outcomes (e.g., patient readmission rate) through implementation of hospital-based case management (Kim, 2005).
Research in the medical literature demonstrates improvements in LOS and readmission rates through development of tailored discharge plans (Shepperd, 2004).
Experience of the Cleveland VAMC suggests improvements in UM metrics through deployment of inpatient “collaborative care case managers” to both manage discharge planning process and perform UM reviews (see case study in Section 7.4.2.1).
Experience of West Roxbury VAMC illustrates LOS improvements (about a 20-hour improvement in OMELOS over a 6-year period) through implementation of “collaborative
322 Site visit discharge planning assessment workshops (N=20)
Assessment F (Workflow – Clinical)
The views, opinions, and/or findings contained in this report are those of the assessment team and should not be construed as an official government position, policy, or decision.
160
care nurses” and adoption of targeted, daily interdisciplinary meetings (see Section 7.2.4.2).
Potential near-term actions:
VHACO: Provide national technical support (e.g., informational materials based on effective facility-level strategies to inpatient case management) to assist VAMCs in crafting facility-level approach to inpatient case manager deployment.
VAMC: Deploy inpatient case managers with assigned responsibility for managing the overall discharge process at VAMCs lacking personnel dedicated to this role.
VHACO/VAMC: Develop national resources and guidance to assist facilities in creating a standard discharge process suited to local needs that addresses a comprehensive set of discharge planning components, including:
o VAMC: Standards for timing of initial patient discharge needs assessment (e.g., 90 percent of patient assessments conducted within 48 hours of admission).
o VAMC: Expectations regarding frequency, duration, facilitation, and expected participants for regularly-programmed interdisciplinary discharge meetings.
o VAMC: Standard operating procedures granting priority scheduling of rounds / labs / diagnostics for patients awaiting discharge.
o VAMC: Goals for timing of key discharge tasks (e.g., entry of pre-discharge order, performance of medication reconciliation, provision of patient education, entry of discharge order).
o VAMC: Checklist to promote timely execution of a comprehensive set of pre-discharge tasks (see Figure D-3 in Appendix D.5 for a sample discharge checklist, adapted from the checklist in use at Salt Lake City VAMC).
VACO/VHACO/VAMC: Increase national and local efforts to engage Veterans and their families in optimal use of their VA health care benefits.
o VACO/VHACO: Launch national campaign to educate Veterans and their families on the optimal setting to receive care for different complaints and clinical conditions.
o VAMC: Provide Veteran education regarding risks and benefits of acute inpatient hospitalization as part of regular discharge planning processes at the local level.
o VAMC: Incorporate early communication with Veteran families regarding appropriate use of inpatient care into locally-developed discharge planning processes.
7.3.2.4 Increase Off-hours Coverage of Clinical Services Including Specialist Consults, Allied Health Evaluations, and Imaging/diagnostics
Our findings on-site indicate significant challenges with VHA’s operating model related to the ability to provide needed care outside of normal business hours. The medical literature supports LOS improvements through optimized coverage of consultative and other key clinical services, particularly during weekends. VHA should undertake improvements in this domain to match the practices of high-performing hospital organizations, reducing unnecessary delays in care and ensuring optimal use of inpatient bed capacity and resources.
Assessment F (Workflow – Clinical)
The views, opinions, and/or findings contained in this report are those of the assessment team and should not be construed as an official government position, policy, or decision.
161
Summary of supporting evidence:
See Section 7.2.3.1 for more detail on findings.
Proposals from clinical staff participating in on-site workshops suggest front-line recognition of LOS challenges during off-hours, with 95 percent of facilities recommending increased access to consultative services during off-hours to reduce avoidable discharge delays.323
Evidence from the academic literature supports LOS improvements through increased access to weekend services, including physical therapy (Kolber, 2013; Rapoport, 1989).
Experience of high-performing hospitals demonstrates improved LOS outcomes resulting from 7-day-per-week coverage of consultative services (Engel, 2013).
Potential near-term actions:
VAMC: Match consultative, diagnostic, and clinical support services to patient needs, particularly during weekends when limited services contribute to extended LOS; refer to Section 5.3.3.1 of this report for additional detail on this action.
Potential Opportunity
Improvements to LOS management and care transition practices have the potential to generate impact across a number of important dimensions. By increasing efficiency of inpatient processes, VHA has the opportunity to shorten LOS, which could reduce potential issues with access to inpatient care for VAMCs with capacity concerns.324 Other positive, though less quantifiable, outcomes would be expected based on the reported experience of other hospitals and previously cited evidence from the academic literature. These outcomes include increased patient satisfaction, improved quality of care, reduced readmission rates, improved patient adherence to post-discharge care plans, and enhanced quality of life for Veterans (Winther, 2015; Lagoe, 2011; Kleinpell, 2008; Siggeirsdottir, 2005). These benefits, though difficult to quantify, provide sufficient justification for VHA to undertake the reforms necessary to improve LOS in order to deliver on the organization’s stated mission of “honoring America’s Veterans by providing exceptional health care.”
Regarding the quantifiable benefits of improved LOS management, reduction in VHA national LOS could free significant capacity within the inpatient setting. As previously noted, VHA LOS exceeds DRG-adjusted Medicare average for patients treated in the private sector by 2.1 days (55 percent) (see Section 7.1.2). Despite Veteran-specific factors that likely account for some of the observed LOS difference, discrepancies in facility-level outcomes across VHA (about a 4-day range in OMELOS, see Section 7.1.2) and our observations regarding the variability of best practice adoption across the organization (see Sections 7.2.1-7.2.4) suggest that LOS outcomes could be improved by improving VHA’s current capabilities and practices. Even small
323 Site visit discharge planning assessment workshops (N=20) 324 As noted in Section 6, our assessment indicated a lack of robust data at the national level regarding inpatient
capacity and utilization metrics, preventing a comprehensive analysis of where LOS improvements might ease access concerns across the organization.

Assessment F (Workflow – Clinical)
The views, opinions, and/or findings contained in this report are those of the assessment team and should not be construed as an official government position, policy, or decision.
162
improvements in overall LOS represent a significant opportunity across VHA’s current approximately 600,000 annual admissions: for every 1 percent reduction in average LOS, VHA would free roughly 35,000 bed-days, which represents the potential to accommodate approximately ~6,000 additional admissions annually within VHA’s system (about 1 percent of current overall admissions).325
325 Note that in order to realize these potential capacity gains, VHA would likely need to alter current staffing to
effectively care for an increased volume of new admissions. This is based on the finding from the academic literature that patients require more time-intensive care during the early phases of admission compared to the pre-discharge period.

Assessment F (Workflow – Clinical)
The views, opinions, and/or findings contained in this report are those of the assessment team and should not be construed as an official government position, policy, or decision.
163
8 Patient Experience Part F (“Assessment F”), Section 201 of the Veterans Access, Choice, and Accountability Act of 2014 (“the Choice Act”) mandates an assessment of the organization, processes, and tools used to support positive patient experience. It is important to note that in recent years, the understanding of what patient experience means has evolved to go beyond the basic provision of high-quality medical care (Wolf, 2014). The core elements of patient experience encompass interactions with health care staff and processes across the continuum of care, involving the individualization of care and communication, and the engagement with patients as members of the care team in order to meet and exceed their expectations (Staniszewska, 2014, The Beryle Institute, 2010; Wolf, 2014). VHA has adopted a similar definition with their patient-centered care (PCC) program, which is designed for VHA to “…partner with our Veterans to be mission-ready for their lives, optimizing their health in service of what matters to them.”326
In light of industry focus and the potential for new access choices for Veterans through the Choice Card, promoting a positive patient experience will be increasingly important for patient acquisition and retention, continuity of care, and quality (Manary, 2013).327,328 While patient experience is shaped throughout the continuum of care including the outpatient setting and touch points outside of formal clinical encounters, in keeping with the legislation, this section will focus exclusively on patient experience in the inpatient setting.
8.1 Summary
Assessment Approach
As described in the methodology of this report (Section 2), we collected information in several ways, using a common approach across sub-assessment areas within Assessment F:
Visits to 21 VAMCs (complexity level 1a, 1b, 1c, and 2)329, to conduct over 300 interviews with leadership (e.g., VAMC Director, Assistant Director for Patient Care Services, Quality Manager) and front-line personnel (e.g., patient advocates, nurses, physicians, and allied health professionals) on Veteran-centered care and patient satisfaction.
Data call sent to a clinical, quality, and patient advocacy staff across all VAMCs to gather objective data that is not consistently maintained at the national level (e.g., patient
326 VHA’s definition of patient-centered care 327 Increased patient acquisition and retention: Satisfied patients are over three times more likely to return to a
provider they have been to before. 328 Improved Patient Access and Health: Positive correlation exists nationally between CMS quality scores and
HCAHPS (Hospital Consumer Assessment of Healthcare Providers and Systems) scores. 329 Given the focus of Assessment F on inpatient medical facilities, we chose to only visit and include data call and
survey results from VAMCs providing substantial inpatient medical care (complexity levels 1a, 1b, 1c, and 2), and did not include other types of facilities (e.g., community-based outpatient clinics [CBOCs], complexity level 3 facilities).
Assessment F (Workflow – Clinical)
The views, opinions, and/or findings contained in this report are those of the assessment team and should not be construed as an official government position, policy, or decision.
164
advocacy organizational structure, prevalence of best practices), completed by 51 respondents across 121 (42 percent) VAMCs (complexity level 1a, 1b, 1c, and 2).330
Data collection from the national Survey of Healthcare Experiences of Patients (SHEP) which is sent to all patients following discharge from a VAMC; data is aggregated at the VAMC, VISN, and system-level.
Interviews with leadership from multiple VACO and VHACO offices, including the Office of Patient Centered Care and Cultural Transformation (OPCC&CT) and MyVA, focused on patient experience and Veteran-centered care.
Having collected information to understand VHA’s practices and performance with respect to positive patient experience, we then assessed how these practices compared to best practices and industry benchmarks. Best practices and benchmarks were identified through several sources, including:
Interviews with leadership from high performing hospitals (internal and external to VHA), selected from among organizations that scored in the 95th percentile in the Hospital Consumer Assessment of Healthcare Providers and Systems (HCAHPS),331 a nationalized survey tool to collect data on patient experiences and perspectives.
Academic literature (e.g., research supporting a link between employee training, leadership support, and Veteran engagement in promoting a positive patient experience).
VHA’s instrument to measure inpatient satisfaction, the SHEP survey, was designed to “systematically obtain information from patients that can be used to identify problems or complaints that need attention and to improve the quality of health care services delivered to Veterans” (VA Form 10-1465-1, 2007). The survey is mailed to all patients discharged from a VAMC and includes a series of questions, as outlined in Appendix E-1, that prompt the patient to evaluate his or her experiences related to: hospital cleanliness and quietness, communication with doctors and nurses, overall responsiveness, communication about medications, discharge information, and care transitions.332 Discharged patients are also prompted to rate their overall hospital experience and their willingness to recommend the hospital. Results are aggregated at VAMC level and used to evaluate individual facility performance, as well as system-wide and regional comparisons (VA Form 10-1465-1, 2007).
330 Total VAMC count depends on whether campuses of the same parent station are counted as separate VAMCs
or one entity. We have based the count used in our site selection (122) on data drawn from VSSC, 2014 and SAIL, 2014 (see Appendix). In some instances, we use 121 as the denominator, based on data available in the data sets most commonly used for that section.
331 CMS HCAHPS refers to the Center for Medicare and Medicaid’s Hospital Consumer Assessment of Healthcare Providers and Systems, a survey tool that compares the “top box” or most positive responses to HCAHPS survey questions. The “top-box” response is "Always” for five HCAHPS composites (Communication with Nurses; Communication with Doctors; Responsiveness of Hospital Staff; Pain Management; and Communication about Medicines) and two individual items (Cleanliness of Hospital Environment; Quietness of Hospital Environment), "Yes" for the sixth composite, Discharge Information; “9” or “10” (High) for the Overall Hospital Rating item, and "Would definitely recommend” for the Recommend the Hospital item (VHA Facility Safety Report, 2012)
332 VHA SHEP Scores (FY14)

Assessment F (Workflow – Clinical)
The views, opinions, and/or findings contained in this report are those of the assessment team and should not be construed as an official government position, policy, or decision.
165
SHEP closely follows the guidelines described by the Centers for Medicare and Medicaid Services’ (CMS) Hospital Consumer Assessment of Healthcare Providers and Systems (HCAHPS) tool to assess private facilities (for example, the questions and scoring in both surveys are verbatim, as outlined in Appendix E-1).333 We have benchmarked VAMC SHEP scores with HCAHPS scores as HCAHPS is the industry standard for measuring patient experience, however we recognize there may be other aspects of experience that HCAHPS does not measure (e.g., financial and clinical outcomes).
To enable an analogous comparison of VHA SHEP scores to private HCAHPS scores, we used VHA’s methodology for calculating composite scores across the common inpatient dimensions of care334 (detailed methodology outlined in Appendix E-1). It is relevant to note, however, that there may be some variability in SHEP and HCAHPS scores as a result of the techniques used to administer the survey. HCAHPS requires that all patients be surveyed between 48 hours and 6 weeks of discharge through one of four survey modes: mail, telephone, mail with telephone follow-up, or active interactive voice recognition (HCAHPS Fact Sheet, 2015). While VHA meets these guidelines, it administers all surveys through the mail, 2 weeks post discharge (VA701-13-R-0313-002, 2013).
Despite comparability of collection tools, there are additional factors to consider when comparing patient satisfaction at VHA with that of private facilities, including impact of both discrete patient populations and facility characteristics on satisfaction scores. For example, Veterans strong affiliation with the mission of VA and sense of connection with fellow Veterans may result in higher patient satisfaction scores as compared to a community health system. Conversely, literature shows that patient populations with high rates of mental health and socio-demographic challenges (e.g., low income and homelessness) have been shown to negatively skew patient experience scores (Westaway, 2003), while obstetric (OB) patients have been shown to report disproportionately positive experiences (Patel, 2011). As a result, there are several reasons why VHA’s scores could be anticipated to be lower than the market average:
Higher prevalence of mental illness. On average 20 to 40 percent of recently returned service members and Veterans are found to have a mental disorder, compared with only 4.2 percent of the general population (Behavioral Health Barometer, 2014; Report of the Department of Defense on Mental Health, 2007).335
Higher prevalence of low-income patients. Twenty-three percent of Veterans have a household income under $30,000, while only 17 percent of private households are below $30,000. The Federal Poverty Line for a family of four is $24,250 (Office of the Assistant Secretary for Planning and Evaluation, 2015). According to VA’s National Center for
333 SHEP FY14, HCAHPS training materials 2015 (HCAHPSonline.org) 334 Cleanliness of the hospital environment, communication about medicine, communication with doctors,
communication with nurses, discharge information, quietness of the hospital environment, overall rating of the hospital, willingness to recommend hospital, care transitions, pain management, and responsiveness of hospital staff
335 Refer to Assessments A and B for additional information on Veteran demographics.

Assessment F (Workflow – Clinical)
The views, opinions, and/or findings contained in this report are those of the assessment team and should not be construed as an official government position, policy, or decision.
166
Veteran Analysis and Statistics, as disabled Veterans’ household income increases the likelihood that they use VA health care decreases (Unique Veteran Users Report FY12, 2014).
Higher incidence of homelessness. In 2015 the rate of homelessness amongst the general population was 18.3 homeless people per 10,000 people compared with 25.5 homeless Veterans per 10,000 Veterans (National Alliance to End Homelessness, 2015)
No OB services. Women account for only eight percent of VA users (Unique Veteran Users Report FY12, 2014), though the number of women Veterans who use VA benefits is increasing (up 27.5 percent since 2005). While private facilities’ HCAHPS scores are elevated by the inclusion of OB services, these do not exist in VHA facilities (Patel, 2011).
While it is difficult to quantify the impact, positive or negative of these factors, VHA’s patient satisfaction scores are slightly lower than private facilities, as outlined in Figure 8-1 and 8-2. VHA’s average score across the 11 dimensions, calculated using the methodology described above, is within six points of the market average, and VHA exceeds the market average in care transition by 20 percentage points.336 While VHA does have top performing facilities in line with high performing private facilities (e.g., Cleveland Clinic’s average score across all HCAHPS measures is 86.1 and Palo Alto VAMC’s average is 86.2), the average VAMC score of 82.4 percent is below the Cleveland Clinic’s aggregate score of 86 percent.337 Additionally, variability does exist across the system, as detailed in Figure 8-2, (e.g., standard deviation of SHEP scores is 3.6 compared with market standard deviation of 4.3)338 indicating an opportunity to leverage the best practices of high-performing facilities (both internal and external to VHA) to support the improvement of lower-performing facilities. Historically VHA patient satisfaction scores on care transitions have exceeded national averages, this is surprising given the findings in Section 7; unfortunately, the scope and approach for our assessment did not allow us to delve into the root cause behind this discrepancy. Appendix E-2 outlines patient experience best practices as related to health systems’ organizational structure, workflow processes, and tools.
336 VHA SHEP Scores (FY14) and CMS HCAHPS scores (FY14) 337 VHA SHEP Scores (FY14) and CMS HCAHPS scores (FY14) 338 VHA SHEP Scores (FY14) and CMS HCAHPS scores (FY14)
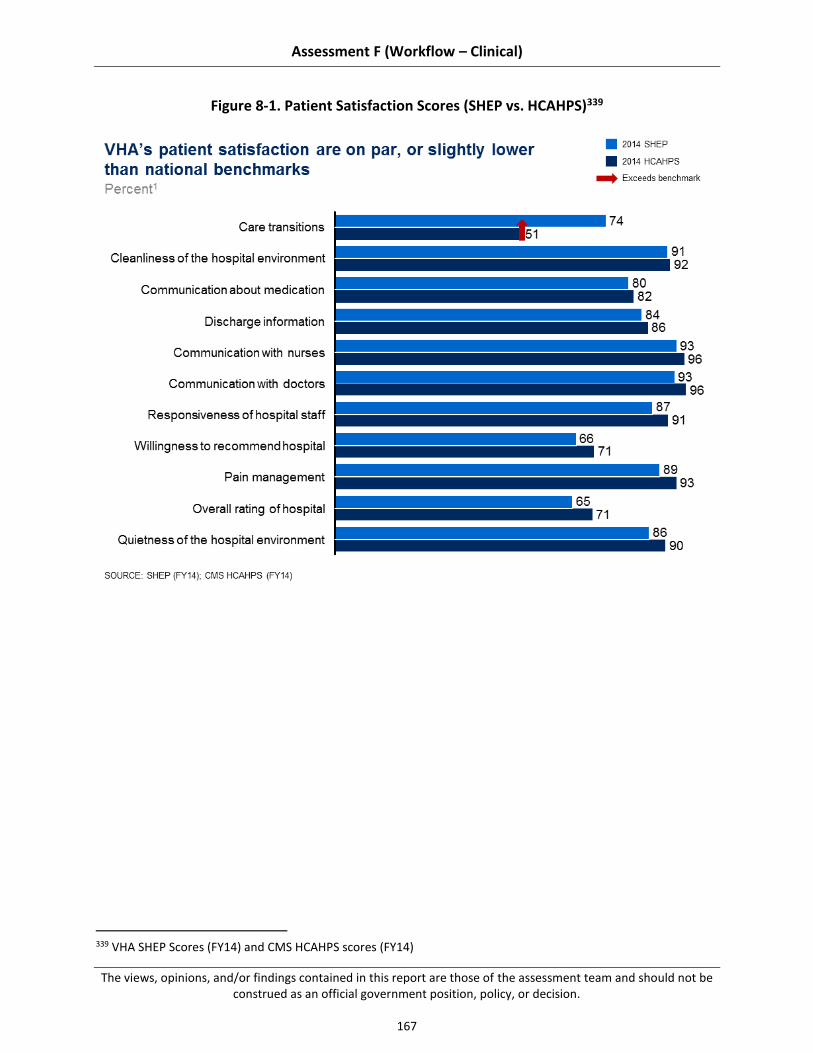
Assessment F (Workflow – Clinical)
The views, opinions, and/or findings contained in this report are those of the assessment team and should not be construed as an official government position, policy, or decision.
167
Figure 8-1. Patient Satisfaction Scores (SHEP vs. HCAHPS)339
339 VHA SHEP Scores (FY14) and CMS HCAHPS scores (FY14)
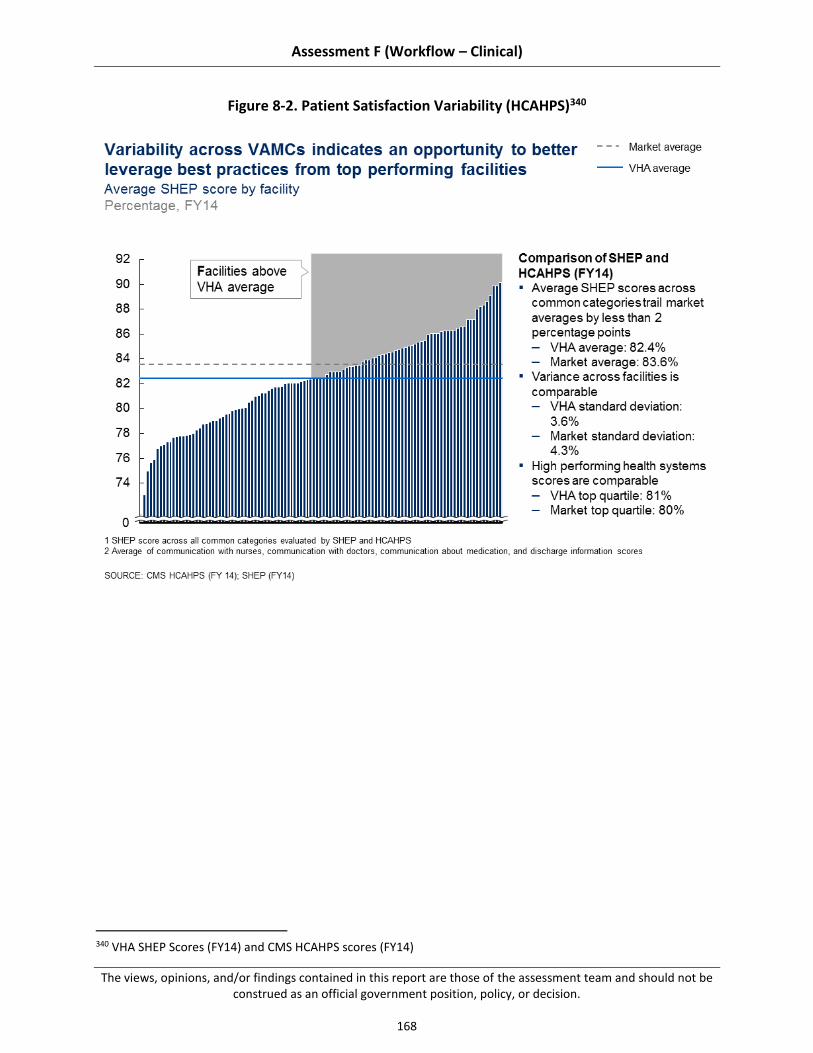
Assessment F (Workflow – Clinical)
The views, opinions, and/or findings contained in this report are those of the assessment team and should not be construed as an official government position, policy, or decision.
168
Figure 8-2. Patient Satisfaction Variability (HCAHPS)340
340 VHA SHEP Scores (FY14) and CMS HCAHPS scores (FY14)
Assessment F (Workflow – Clinical)
The views, opinions, and/or findings contained in this report are those of the assessment team and should not be construed as an official government position, policy, or decision.
169
Summary of Findings
We observed several key areas of strength and challenges related to patient experience at VHA. These findings apply to VHA organization, processes, and tools as specified in the legislation; a detailed mapping is available in Appendix E-3.
8.2.1 National and facility-level focus on the prioritization and provision of Veteran-centered care has driven pockets of best practice innovation. More than 90 percent of VAMCs visited cited Veteran-focused staff as a key strength of their facility.341 Many individuals cited Veterans as the chief reason they decided to work for VHA, even when faced with more lucrative offers.342 This focus on the Veteran is evident across organizational levels. One example is Palo Alto’s Veteran and Family Advisory Committee that was founded to engage Veterans and their families as active participants in patient care and hospital operations. To achieve this level of engagement, the VAMC includes patient advisory members on all hospital committees to ensure the Veteran voice is heard. Palo Alto has assisted several other hospitals, including the Mayo Clinic, to implement similar models.343
8.2.2 Adoption of best practices and engagement of Program Office support services are varied across VAMCs. While initiatives at both the Central Office and selected facilities exemplify Veteran-centered care and industry-accepted best practices, system-wide adoption is limited due to inconsistency in facility leadership, which drives a lack of prioritization on patient experience best practice implementation, and insufficient VHACO infrastructure to codify and share facility-driven initiatives across the system.
8.2.3 Challenges with respect to timeliness and specificity in the SHEP survey results limit VAMCs’ ability to drive performance improvement. Lack of timeliness (e.g., reports are delayed 3 to 6 months344) and specificity (e.g., data is not segmented by individual department, or unit) of SHEP survey results limits the perceived effectiveness, accuracy, and actionability of patient satisfaction results.
Summary of Recommendations
Our assessment revealed several areas where VHA can build on current strengths or address existing challenges to improve patient experience. We recommend that VHA consider two strategic themes, as detailed below. As with the findings, these themes apply to VHA organization, processes, and tools.
8.3.1 Collect More Timely and Relevant Patient Experience Data to Drive Performance Improvement at the Facility, Department, and Individual Level. VHA should ensure
341 Site visits, interviews with patient advocate and quality manager, and ED throughput workshop (N=21 sites) 342 Site visits staffing workshop (N=19 sites) 343 Palo Alto VAMC follow up discussion: Office of Patient Experience 344 Site visit patient advocate interviews (N=21 sites)
Assessment F (Workflow – Clinical)
The views, opinions, and/or findings contained in this report are those of the assessment team and should not be construed as an official government position, policy, or decision.
170
its patient satisfaction tool(s) delivers granular survey results (for example, at the individual department or unit level) in a timely (e.g., real-time or near real-time) and actionable format (e.g., consistent across the system).
8.3.2 Strengthen national and facility level support for patient-centered care programs to increase adoption. VHA should strengthen adoption of best practices by providing the infrastructure to support the evaluation, codification, and implementation of facility-driven initiatives. This level of system-wide adoption can only be achieved through improved coordination, consistency, and support from leadership at the VACO, VHACO, VISN and VAMC levels.
Past Findings and Recommendations
In 1995, VHA launched a “major reengineering of its health care system with aims that included better use of information technology, measurement and reporting of performance, and integration of services and realigned payment models” (Jha, 2003). While the focus of this system redesign was improved quality – and results showed dramatic improvement in quality345 (Jha, 2003) — patient satisfaction following the redesign has been favorable. In 1999, 80 percent of users were more satisfied with their hospital experience as compared to 2 years earlier. Additionally, in 1999, VHA outscored private hospitals in overall customer satisfaction as measured by the American Customer Satisfaction Index (Edmondson, 2006). VA was recognized in 2004 for setting national benchmarks in patient satisfaction while having proportionally fewer resources, as compared to the private sector (Perlin, 2004).
While patient satisfaction at VHA is often cited as a strength, the Voice of the Veteran, the American Legion task force, and the American Customer Satisfaction Index have identified some limiting factors and recommendations for improvement, as detailed in Appendix E-4. Examples of these limitations include, but are not limited to:
1. An excessive number of quality and patient satisfaction performance measures
2. Deficiencies with patient satisfaction reporting, as evidenced by the 3- to 6-month delay in survey results
3. Challenges in staffing front-line clinical employees and patient advocates due to the lengthy hiring process.
In 2011, VHA established the Office of Patient Centered Care and Cultural Transformation (OPCC& CT) with the goal of moving VHA from a “disease-based and reactive health care system to one that concentrates on Whole Health: a personalized, proactive, and patient-
345 The VHA exceeded Medicare averages between 1997 and 1999 across five inpatient clinical quality metrics
related to acute myocardial infarction (AMI) and congestive heart failure (CHF). AMI measures include: aspirin within 24 hours after MI, aspirin at discharge, and beta blocker at discharge. VHA exceeds the Medicare average on these measures by 8 percent, 10 percent, and 19 percent, respectively. CHF measures include: ejection fraction measured and ACE inhibitor if injection fraction is <40 percent; VHA exceeds the Medicare average by 27 percent and 25 percent respectively (Jha, 2003).

Assessment F (Workflow – Clinical)
The views, opinions, and/or findings contained in this report are those of the assessment team and should not be construed as an official government position, policy, or decision.
171
driven” approach to health care (VHA OPCC&CT Resource Guide, 2015).346 The OPCC&CT is dedicated to providing care that is
“...personalized: tailoring a person’s health care to their individual characteristics, proactive: using strategies that strengthen the person’s innate capacity for health and healing, and patient-driven: health care that is based in and driven by what really matters to the person in their life” (Krejci, 2014).
In 2013, the OPPC&CT published a report on lessons learned from implementing patient-centered care (PCC) practices at its four established centers of innovation, New Jersey VAMC, Greater Los Angeles VAMC, North Texas VAMC, and Birmingham VAMC. The report outlines seven core themes that impacted the implementation of patient-centered care and span across seven themes that are core to an effective implementation (OPCC&CT Lessons from the Field, 2013):
Recognize the role of leadership.
Engage Veteran patients and family members.
Enculturate staff to adopt a patient-centered perspective.
[Foster] innovation.
[Recognize] staff roles and priorities.
[Recognize] challenges of VA procedures and infrastructure.
Implement environment of care changes.
These prior assessments have tended to focus on specific issue areas and/or individual facilities, separately developing recommendations for improvement in discrete areas. In contrast, our assessment tries to take an end-to-end view of inpatient clinical operations across five key sub-assessment areas and all high- and medium-complexity VAMCs.
8.2 Findings
Through our site visits, data analysis, interviews, and benchmarking, we identified strengths and challenges in patient experience across the VHA inpatient care setting. The sub-sections that follow (8.2.1, 8.2.2, and 8.2.3) describe these findings in detail, including information on what we believe the drivers of each finding to be.
8.2.1 National and facility level focus on the prioritization and provision of Veteran centered care has driven innovations in best practice
8.2.2 Adoption of best practices and engagement of program office support services are varied across VAMCs
8.2.3 Challenges with respect to timeliness and specificity in the SHEP survey results limit VAMCs’ ability to drive performance improvement
346 Additional detail on the OPCC&CT outlined in Section 8.2.1.

Assessment F (Workflow – Clinical)
The views, opinions, and/or findings contained in this report are those of the assessment team and should not be construed as an official government position, policy, or decision.
172
As noted in Section 2.2, data issues prevented us from conclusively assessing many areas of patient experience. We have used the national datasets that were available, information returned as part of the data call, and perceptions and experience reported or observed during site visits or via the staff survey. In many instances where data does not allow us to definitively comment, we have described the potential implications of the data points we do have, along with recommendations in Section 5.3 for further analysis.
National and Facility-level Focus on the Prioritization and Provision of Veteran-centered Care has Driven Innovations in Best Practices
More than 90 percent of VAMCs visited cited Veteran-focused staff as a key strength of their facility.347 This prioritization of Veteran-centered care appears to cascade across organizational levels, as detailed in Figure 8-3. It is evident at the national level through organization-wide training programs and at the VAMC level through initiatives that connect staff and Veterans, as well as tailored programs that engage and empower Veterans in their own care.
At the national level, consistent with industry best practices that support compulsory system-wide patient-centered care training (Luxford, 2011), a Veteran-centered care training program has been consistently rolled out to all VAMC employees348. One example coming out of that training is what was termed by some in VHA as the “elevator culture” – as a sign of respect, employees consistently yield to Veterans getting on or off the elevator. We’ve observed this practice by employees at each of the sites visited.349
Additionally, national and facility-level initiatives focus on connecting staff with Veterans. Examples include the national “No Veteran Dies Alone” program and Maine VAMC’s local community garden and Culinary Health on Wheels (CHOW) programs. No Veteran Dies Alone is a volunteer program that brings nurses and volunteers in on their days off to sit with dying patients. An ICU nurse describes this program as “a blessing to be able to give back to them, when they have given so much for us” (Knake, 2010). CHOW engages Veterans and employees alike, to grow fruits and vegetables in the VAMC’s community garden; much of each gardener’s crops are donated to Veterans in need. Additionally, the CHOW program provides education on how to prepare healthy, low-cost meals350 (VA Maine Healthcare Facebook page, 2015).
Finally, interviewed patient advocates explained a growing trend in facility-level initiatives to engage patients in their own care and experience. Examples of these initiatives include Veteran tasting panels to improve food quality, Veteran and family advisory councils (detailed in Section 8.2.1.2), and Veteran volunteers.351 This practice of creating a collaborative care environment empowers Veterans to become actively involved in the improvement of overall patient
347 Site visits interviews with patient advocates, and quality manager and ED throughput workshops (N=21 sites) 348 Site visit interviews with patient advocates (N=21 sites) 349 Site visit ICU shadowing session (N=21 sites) 350 Maine VAMC interview with patient advocate 351 Site visit interviews with patient advocates (N=21 sites)

Assessment F (Workflow – Clinical)
The views, opinions, and/or findings contained in this report are those of the assessment team and should not be construed as an official government position, policy, or decision.
173
experience and exemplifies evidence-based best practices that recommend engaging the patient as an active participant in his or her care (Wolf, 2014; Hibbard, 2013).
Figure 8-3. Veteran-Centered Care Initiatives
Supporting this national and facility-level focus on the prioritization and provision of Veteran-centered are two key drivers:
8.2.1.1 Program offices (e.g., OPCC&CT, myVA, National Center for Health Promotion and Disease Prevention) at the national level, support patient-centered clinical innovation, outcomes-based research, and education and implementation support
8.2.1.1 Veteran-focused initiatives, developed locally at individual VAMCs, exemplify industry best practices at the bedside
8.2.1.1 Program Offices, at the National Level, Support Patient-centered Clinical Innovation, Outcomes-based Research, and Education and Implementation Support
At the national level, several offices and initiatives (for example, OPCC&CT, myVA, National Center for Health Promotion and Disease Prevention) appear committed to promoting Veteran-
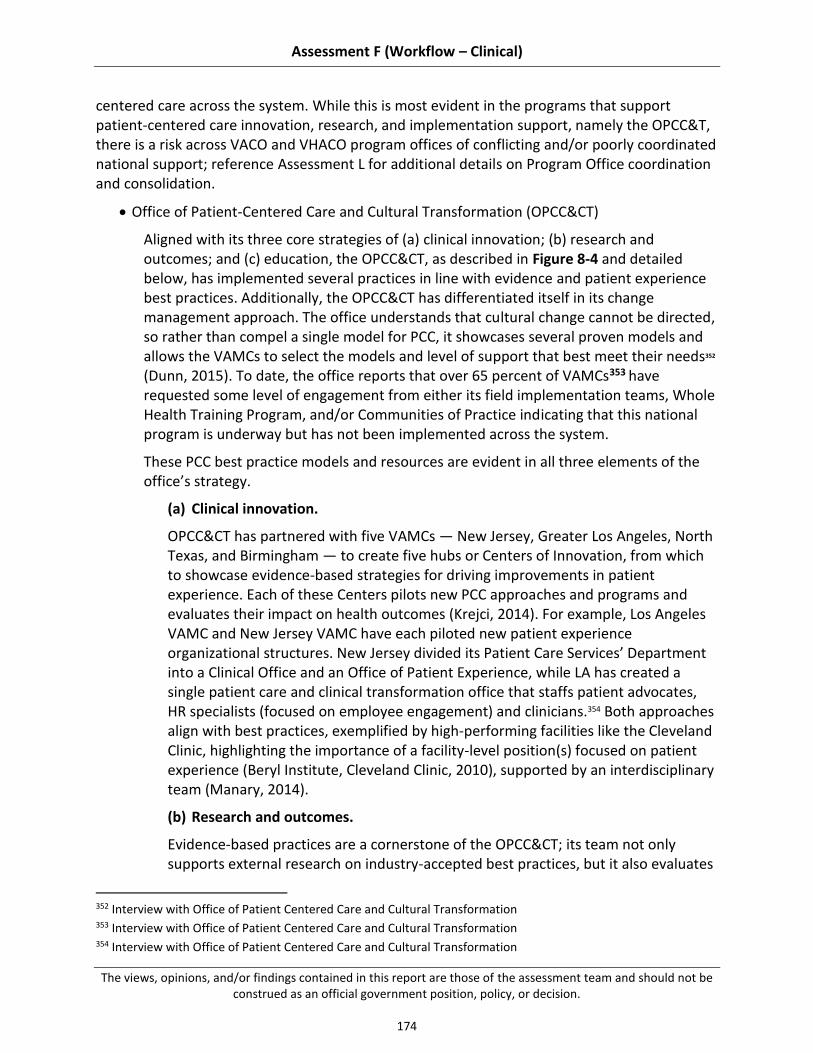
Assessment F (Workflow – Clinical)
The views, opinions, and/or findings contained in this report are those of the assessment team and should not be construed as an official government position, policy, or decision.
174
centered care across the system. While this is most evident in the programs that support patient-centered care innovation, research, and implementation support, namely the OPCC&T, there is a risk across VACO and VHACO program offices of conflicting and/or poorly coordinated national support; reference Assessment L for additional details on Program Office coordination and consolidation.
Office of Patient-Centered Care and Cultural Transformation (OPCC&CT)
Aligned with its three core strategies of (a) clinical innovation; (b) research and outcomes; and (c) education, the OPCC&CT, as described in Figure 8-4 and detailed below, has implemented several practices in line with evidence and patient experience best practices. Additionally, the OPCC&CT has differentiated itself in its change management approach. The office understands that cultural change cannot be directed, so rather than compel a single model for PCC, it showcases several proven models and allows the VAMCs to select the models and level of support that best meet their needs352 (Dunn, 2015). To date, the office reports that over 65 percent of VAMCs353 have requested some level of engagement from either its field implementation teams, Whole Health Training Program, and/or Communities of Practice indicating that this national program is underway but has not been implemented across the system.
These PCC best practice models and resources are evident in all three elements of the office’s strategy.
(a) Clinical innovation.
OPCC&CT has partnered with five VAMCs — New Jersey, Greater Los Angeles, North Texas, and Birmingham — to create five hubs or Centers of Innovation, from which to showcase evidence-based strategies for driving improvements in patient experience. Each of these Centers pilots new PCC approaches and programs and evaluates their impact on health outcomes (Krejci, 2014). For example, Los Angeles VAMC and New Jersey VAMC have each piloted new patient experience organizational structures. New Jersey divided its Patient Care Services’ Department into a Clinical Office and an Office of Patient Experience, while LA has created a single patient care and clinical transformation office that staffs patient advocates, HR specialists (focused on employee engagement) and clinicians.354 Both approaches align with best practices, exemplified by high-performing facilities like the Cleveland Clinic, highlighting the importance of a facility-level position(s) focused on patient experience (Beryl Institute, Cleveland Clinic, 2010), supported by an interdisciplinary team (Manary, 2014).
(b) Research and outcomes.
Evidence-based practices are a cornerstone of the OPCC&CT; its team not only supports external research on industry-accepted best practices, but it also evaluates
352 Interview with Office of Patient Centered Care and Cultural Transformation 353 Interview with Office of Patient Centered Care and Cultural Transformation 354 Interview with Office of Patient Centered Care and Cultural Transformation

Assessment F (Workflow – Clinical)
The views, opinions, and/or findings contained in this report are those of the assessment team and should not be construed as an official government position, policy, or decision.
175
the health outcomes of pilot initiatives at each of the Centers of Innovation. OPCC&CT recently partnered with the Bravewell Collaborative to pilot the Patients Receiving Integrated Medicine Interventions Effecting Registry (PREMIER). The data registry is intended to “provide foundational new knowledge on how integrated medicine is being used in real-world settings…to ultimately inform future clinical trials as well as decision-making in clinical settings” (Krejci, 2014). OPCC&CT uses its findings from research to support evidence-based programs that deliver patient-centered care to VAMCs across the system (Capturing proactive patient centered care, 2014).
(c) Education.
As detailed above, OPCC&CT provides support and training to VAMCs that request assistance, but does not compel patient experience initiatives or new models of care. Field implementation teams (FIT) are deployed to sites that request additional support. Initially their strategy focused on inspiring facility leadership; however, the team is adapting its focus to the front-line. Lessons learned from patient-centered care highlighting the importance of leadership and front-line engagement came directly from the field implementation teams.355
Whole Health (WH) is a “custom-designed clinical education program” designed by the University of Wisconsin – Madison Integrative Medicine focused on “empowering self-healing” through complementary alternative medicine including “nutrition, stress management, movement, and mindful awareness” (Whole Health: Change the Conversation). Administrators and clinicians alike cite the effectiveness of this program stating, “Whole heath was life-changing for me; I really appreciate the meditation and the art of guiding others, truly listening, and getting patients to think about what health goals they have, even in my capacity as an administrative person356” and “I immediately was able to start using principles, and asking questions like: What is the most important thing to you. These questions make it more clear what the Veteran is thinking about and what is important.”357
Community of practice calls and workshops are held regularly to enhance collaboration across facilities and connect VAMCs with experts. Current communities of practice include: integrated health, patient-centered care, patient advocacy, and the Veteran experience. One patient advocate attendee at a 2015 workshop commented, "It was good to sit in a room with other advocates and hear that they were dealing with the same challenges we had… It was clear that they [OPCC&CT moderators] cared about our perspective.”358 These calls and workshops
355 Interview with Office of Patient Centered Care and Cultural Transformation 356 Whole Health: Change the Conversation (Advancing skills in the delivery of personalized, proactive, and patient-
driven care) (2014) 357 Whole Health: Change the Conversation (Advancing skills in the delivery of personalized, proactive, and patient-
driven care) (2014) 358 Site visit interview with patient advocates (N = 21 sites)

Assessment F (Workflow – Clinical)
The views, opinions, and/or findings contained in this report are those of the assessment team and should not be construed as an official government position, policy, or decision.
176
not only facilitate collaboration, but they also empower the front-line to take ownership of performance improvement (Luxford, 2011).
Figure 8-4. Program Office Focus on Patient-Centered Care
Program offices with patient experience functions
In addition to the resources available through OPCC&CT, many other program offices have similar and/or complementary initiatives. While each of these offices appears focused on Veteran-centered care, there may be some overlap and duplication across offices.
National programs include, but are not limited to:
Office of Patient-Centered Care and Cultural Transformation (OPCC&CT). Founded in 2011, it “creates a structure to oversee [VHA’s cultural transformation to patient-centered care], employing and training staff, establishing Centers of Excellence, and guide and support the transformation of every VHA Network and health care facility.” (Gaudet, 2014)
National Center for Health Promotion and Disease Prevention “provides programs, education, resources, coordination, and oversight to field staff to prevent illness and
Assessment F (Workflow – Clinical)
The views, opinions, and/or findings contained in this report are those of the assessment team and should not be construed as an official government position, policy, or decision.
177
enhance health, well-being, and quality of life for Veterans.” (VA Functional Organizational Manuel, 2014)
Specialty Care Services “ensures the best overall preventative, clinical, spiritual, religious, and nutritional care is made available to Veteran patients.” (VA Functional Organizational Manuel, 2014)
Analytics and Business Intelligence “supports the External Peer Review (EPRP) and SHEP tool including developing measures to track clinical and other outcomes based on the philosophies of evidence-based practice.” (VA Functional Organizational Manuel 2014)
National leadership council “provides the governance structure for all policies, plans, and procedures across the entire VHA, including Veteran experience.” (VA Functional Organizational Manuel, 2014)
Among program offices there may be a risk of replicating and or complicating support functions and performance measures, related to Veteran-centered care; reference Assessment L for more detail on Program Office overlap. For example, one study reported that the number of VAMC quality and patient satisfaction measures have increased from 11 to 500 since 2000 (Wong, 2012). In reviewing program offices focused on Veteran-centered initiatives, it appears that OPCC&CT’s focus on Whole Health and complementary alternative medicine overlaps with the National Center for Health Promotion and Disease Prevention’s focus on wellness and prevention, and the Specialty Care Services’ focus on clinical, spiritual, religious, and nutritional support. Additionally, while the Senior Leadership Council provides advisory and governance structure, it is unclear what level of leadership and oversight is provided by the National Leadership Council as compared to the other VACO and VHACO program offices. Furthermore, it is unclear whether the leadership from the above-mentioned program offices sit on the National Leadership Council for Veteran experience. A senior VHA official expressed this lack of collaboration and coordination across Program Office stating: “Central Office should be strategic and not driven by fear [as a result of poor publicity in the news]. We often react to the point of micromanagement where everyone is trying to manage operations. Program Office coordination to get to an enterprise solution is an area that needs to improve.”359 The MyVA initiative was launched in September 2014 with the objective of “empowering employees to deliver excellent customer service…improving or eliminating process that impede great customer service…and by rethinking internal structures and processes to become more Veteran-centric and productive.”360 The program aims to achieve these objectives by integrating and coordinating services across VA including VHA, Veterans Benefit Administration (VBA), and National Cemetery Association (NCA).
359 VHACO SME Interview (2015) 360 VACO SME Interview (2014)

Assessment F (Workflow – Clinical)
The views, opinions, and/or findings contained in this report are those of the assessment team and should not be construed as an official government position, policy, or decision.
178
One example of such coordination, is the program’s regional approach to standardizing Veteran-centered care across the system in collaboration with OPCC&CT.361 Since this approach is still in the planning phases, it is unclear how effectively myVA will coordinate across these program offices, but myVA is working closely with OPCC&CT in an effort to improve Veteran-centered care in field by aligning on initiatives and minimizing central office redundancy.
8.2.1.2 Veteran-focused Initiatives, Developed Locally at Individual VAMCs, Exemplify Industry Best Practices at the Bedside
We have observed many examples of patient experience initiatives, across facilities, that exemplify best practices in (1) Veteran engagement; (2) communication and education; and (3) training. However, there is great variability in the types of programs implemented and their impact. Appendix E-2 outlines best practices exemplified in the literature and high-performing institutions. The following section details the prevalence of those identified best practices across VAMCs.
Veteran and family engagement (Hibbard, 2013 and Wolf, 2014). Palo Alto VAMC implemented a Veteran and Family Advisory Committee in 2010 to ensure that Veteran and family viewpoints are heard by the Medical Center.362 Since its founding, the committee has met with over 110 staff and discussed nearly 100 projects and initiatives.363 With the council’s feedback, the VAMC has enhanced patient education materials and implemented sources for real-time patient feedback; it is currently developing a patient safety campaign and two family lounges. In describing the council, Veteran and family members who have applied and been selected to serve on the committee have said, “I am grateful to be part of the solution that affects our loved ones” and “It feels good to make improvements for the health care of Veterans” (VFAC brochure, 2013). In light of its success, Palo Alto VAMC has developed a workshop to assist other VAMCs in implementing similar Veteran and family engagement models. Additionally, Palo Alto VAMC has assisted the Mayo Clinic in refining its approach to patient and family activation in care.364 Palo Alto’s VAMC follows four core principles, adapted from OPCC&CT: “Listen to and honor Veteran and family choices; share complete and unbiased information; encourage Veterans and families to participate in care and decision-making at the level they choose; and [promote collaboration such that] Veterans, families, and staff work together to improve clinical care, patient experience,
361 VACO SME Interview (2015) 362 Palo Alto VAMC follow-up discussion: Office of Patient Experience 363 Palo Alto VAMC follow-up discussion: Office of Patient Experience 364 Palo Alto VAMC follow-up discussion: Office of Patient Experience

Assessment F (Workflow – Clinical)
The views, opinions, and/or findings contained in this report are those of the assessment team and should not be construed as an official government position, policy, or decision.
179
policies, programs, and facility design.”365 Immediate service recovery through timely communication and patient education (Hibbard, 2013; Beryl, 2010). More than 84 percent of facilities366 self-report engaging volunteers and front-line staff to round on patients daily to identify and resolve any complaints at the point of care. Of the facilities visited, 75 percent communicate with patients and family through updated whiteboards that indicate their provider team, plan, or discharge, approach to pain management, and other relevant information. 367 More than 80 percent of facilities front-line staff visited cited patient education as a strength. 368 Albuquerque VAMC has developed and implemented “CHF project red,” a video that provides nursing, pharmacy, and nutrition counseling for admitted patients with CHF. The video is played for the patient several times throughout his or her stay and nurses provide individual education at the bedside to reinforce the material.369 Empowered front-line to develop and own performance improvement (Luxford, 2011). Most facilities (more than 95 percent)370 have implemented initiatives targeted at improving patient satisfaction, including but not limited to those detailed above. Gainesville VAMC successfully piloted its resource-neutral “Mobility Tech program” that trained nursing techs to help get patients out of bed earlier and assist them with physical therapy exercises. Results have shown a 48 percent reduction in falls on one floor and a 9.7 percent reduction in readmissions. Gainesville anticipates that the impact of this program, when appropriately scaled, will include improved patient satisfaction and pain management, and reduced lengths of stay.371
Adoption of Facility-level Best Practices and Engagement of Program Office Support Services are Varied Across VAMCs
While initiatives at both the central and facility levels exemplify Veteran-centered care and industry accepted best practices, consistent adoption across the system is limited. As detailed above, most facilities have implemented some initiatives focused on patient satisfaction, but there is little consistency in the types of initiatives and their impact. For example, in the Gainesville mobility example, the program has shown promising results, but it has only been implemented on one floor in one VAMC. Additionally, though most VAMCs cite patient training
365 Palo Alto VAMC follow-up discussion: Office of Patient Experience 366 Choice Act data call (N=51 sites) 367 Site visit shadowing sessions (N=21 medical/surgical floors) 368 Site visit interviews with patient advocate and quality manager and discharge planning workshops (N=21 sites) 369 Site visit discharge planning workshop (N = 20 sites) 370 Site visit patient advocate interviews (N=21 sites) 371 Gainesville site visit Medical floor shadow session
Assessment F (Workflow – Clinical)
The views, opinions, and/or findings contained in this report are those of the assessment team and should not be construed as an official government position, policy, or decision.
180
as a strength, patient education programs like project red have been implemented sporadically across the system; we observed this program in less than 15 percent of sites visited.372 Limited adoption and standardization may be attributed to three key drivers:
8.2.2.1 Central Office reach is limited by the level of facility leadership engagement
8.2.2.2 Structure to codify and share facility-driven initiatives across the system is limited
8.2.2.3 Implementation of point-of-care feedback tools (e.g., GetWell Network, Truth Point) is varied across the system
8.2.2.1 Central Office Reach is Limited by the Level of Facility Leadership Engagement
OPCC&CT followed a logical implementation approach when initially rolling out its PCC programs at individual VAMCs. It first publicized its FIT programs at the VACO, VHACO, VISN, and VAMC levels, offering its support service to all interested VAMC directors.373 When engaged by a VAMC Director, OPCC&CT deployed a team to visit the VAMC and conduct an initial diagnostic, including informal interviews and discussion with senior leadership and listening sessions with front-line staff.374 Following these site visits, the FIT team prepared an individualized report for the VAMC director with a basic roadmap that outlined next steps for implementing new PCC models.375 The problem with this model was the high degree of facility leadership turnover. As one OPCC&CT leader stated, “One of the hardest things is when we start working with a facility and the leadership leaves and no one is left to continue to the program; we have left many promising facilities right in the middle of an implementation.376”
In light of leadership turnover, OPCC&CT has since moved to a staff engagement model, deploying specialty teams focused on topics such as nursing or patient advocacy.377 While this approach is effective in driving some front-line change, without strong leadership its large-scale potential is limited, as supported in academic literature (Singer, 2013). Ad hoc projects with front-line staff likely lack coordination with the facility’s overall strategy. Moreover, 38 percent of site visit interviewees stated that they were overwhelmed by the number of compulsory programs and initiatives.378 Without clear leadership support to help prioritize initiatives, it is unlikely that staff will have the capacity to both meet mandated and directive obligations and engage the FIT program. Finally, staff engagement is a critical component of PCC and patient experience (Luxford, 2011). One program leader expressed concern regarding staff engagement saying, “If we don’t treat our facility leaders a little differently, how are they going to empower
372 Site visit discharge planning workshops (N=20 sites) 373 VHACO Subject-matter expert interview (2015) 374 VHACO Subject-matter expert interview (2015) 375 VHACO Subject-matter expert interview (2015) 376 Interview with Office of Patient Centered Care and Cultural Transformation 377 Interview with Office of Patient Centered Care and Cultural Transformation 378 Site visit patient advocate interviews (n=21 facilities)

Assessment F (Workflow – Clinical)
The views, opinions, and/or findings contained in this report are those of the assessment team and should not be construed as an official government position, policy, or decision.
181
their staff?”379 Refer to Assessment L for additional detail on leadership engagement and turnover.
In April of 2014, following broad system implementation challenges, the OPCC&CT was asked to create the Integrating Health Coordinating Center (IHC) to “identify and remove barriers to providing IH across the system; and be a resource for clinical practices and education for both Veterans and clinicians (Krejci, 2014).” While the goal of this center is improved coordination, results are still preliminary.
8.2.2.2 Structure to Codify and Share Facility-driven Initiatives Across the System is Limited
Despite of the number of VAMC PCC initiatives, there is little support at the VISN and national levels to implement facility-driven best practices across the system.380 While OPCC&CT promotes industry best practices through its research arm and pilot programs, it struggles with sharing facility-driven best practices across the system. The office is starting to promote collaboration through its workshops and communities of practices, but recognizes that there is a gap in identifying practices in the field, evaluating those practices, codifying them, and pushing them back out to the field at the appropriate time.381
It is clear by the prevalence of facility-driven best practices that there is an opportunity to better leverage innovation in the field to impact patient experience. For example, Gainesville VAMC’s Mobility Tech program382 was recognized at a national innovation summit. However, despite proven results and savings from length-of-stay reductions, it did not receive the necessary support to implement the program across the VAMC, let alone the VISN or system. The perceived issue is the Centers of Innovation focus primarily on the initial innovation, but with little tactical support in operationalizing facility-driven best practices and implementing them system-wide.383
Palo Alto’s Veteran and Family Advisory Council, detailed in Section 8.2.1.2, has overcome this challenge. While the council was developed in-house, Palo Alto’s Office of Patient Experience has worked with OPCC&CT to facilitate workshops and trainings at other facilities.384 The success of this implementation compared with others is likely due to several factors:
Demonstrated sustained success at the facility level385 – the council was initially stood up in 2010.386
379 Interview with Office of Patient Centered Care and Cultural Transformation 380 Interview with Office of Patient Centered Care and Cultural Transformation 381 Interview with Office of Patient Centered Care and Cultural Transformation 382 Mobility Tech program is a resource-neutral initiative that engages techs, trained by physical therapists, to
ambulate Med/Surg patients; results show the patients are ambulated earlier and with more regularity than previously demonstrated contributing to higher patient satisfaction and earlier discharges (Gainesville, VAMC)
383 VAMC site visit interviews (n=21 facilities) 384 VAMC follow-up interview with Palo Alto’s Office of Patient Experience 385 Interview with Office of Patient Centered Care and Cultural Transformation 386 VAMC follow-up interview with Palo Alto’s Office of Patient Experience

Assessment F (Workflow – Clinical)
The views, opinions, and/or findings contained in this report are those of the assessment team and should not be construed as an official government position, policy, or decision.
182
Considerable interest from the field, as well as external organizations like the Mayo Clinic.387
Dedicated facility leadership willing to manage training workshops in partnership with OPCC&CT, in addition to their daily jobs.
It is important to note; however, that Palo Alto is a large urban VAMC. This approach of dedicating VAMC resources to train other facilities is unlikely to be scalable without VHACO support, especially in smaller more resource-constrained VAMCs.
8.2.2.3 Implementation of Point-of-care Feedback Tools (e.g., GetWell Network, Truth Point) is Varied Across the System
Select VAMCs are piloting real-time feedback tools, demonstrated in Figure 8-5. These tools are targeted at soliciting patient feedback at the bedside, but adoption appears to be limited; 40 percent of data call respondents reported388 that their VAMC has implemented at least one real-time or near real-time tool to supplement SHEP data. Funding for these tools comes exclusively from the VAMCs or VISNs, so there is minimal Central Office oversight and/or support.389 The GetWell network has been piloted across several facilities but its potential is limited by security restrictions – for example, the vendor has not received approval to integrate with VistA.390 Unlike the other feedback solicitation tools, the GetWell network software is designed to customize satisfaction questions and education to a patient’s specific condition. Without VistA integration; however, the tool asks patients a standard set of questions and provides common education (e.g., nutrition). Several individuals interviewed during site visits commented that approval was imminent, but to date it is not approved.391 One high-performing VAMC stated, “We listened to the vendor’s pitch but we are not willing to invest money until Central Office has bought into the program and documented its impact.”392
387 VAMC follow-up interview with Palo Alto’s Office of Patient Experience 388 Choice Act Data Call (N=51 sites) 389 VHA SME interview 390 VHA site visit interview (N=21 sites) 391 Site visit patient advocate interview (N=21 sites) 392 Site visit patient advocate interview
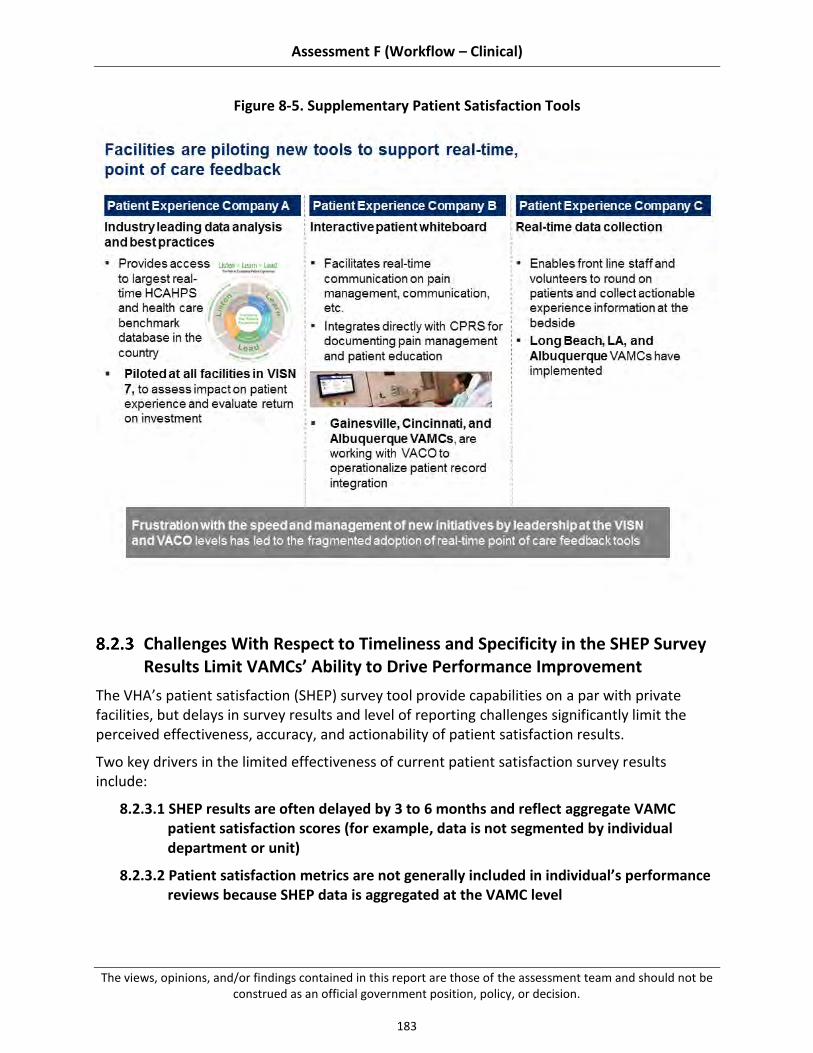
Assessment F (Workflow – Clinical)
The views, opinions, and/or findings contained in this report are those of the assessment team and should not be construed as an official government position, policy, or decision.
183
Figure 8-5. Supplementary Patient Satisfaction Tools
Challenges With Respect to Timeliness and Specificity in the SHEP Survey Results Limit VAMCs’ Ability to Drive Performance Improvement
The VHA’s patient satisfaction (SHEP) survey tool provide capabilities on a par with private facilities, but delays in survey results and level of reporting challenges significantly limit the perceived effectiveness, accuracy, and actionability of patient satisfaction results.
Two key drivers in the limited effectiveness of current patient satisfaction survey results include:
8.2.3.1 SHEP results are often delayed by 3 to 6 months and reflect aggregate VAMC patient satisfaction scores (for example, data is not segmented by individual department or unit)
8.2.3.2 Patient satisfaction metrics are not generally included in individual’s performance reviews because SHEP data is aggregated at the VAMC level

Assessment F (Workflow – Clinical)
The views, opinions, and/or findings contained in this report are those of the assessment team and should not be construed as an official government position, policy, or decision.
184
8.2.3.1 SHEP Results are Often Delayed by Three to Six Months and Reflect Aggregate VAMC Patient Satisfaction Scores (e.g., data is not segmented by individual department or unit)
Patient satisfaction survey results were cited as a challenge at more than 62 percent of VAMCs visited.393 SHEP survey results are considerably delayed (e.g., about a 3- to 6-months lag) and provide data at the facility level, which dilutes the impact of performance outcome data at the department and unit levels. More specifically, interviews with front-line employees found a general perception that SHEP data are obsolete and irrelevant.394 In comparison, private organizations receive HCAHPS scores from CMS at least once every 3 weeks, with many receiving data real-time through patient experience tools (CMS HCAHPS website, 2015; Patient Voice: Every Patient Matters. Every Voice Counts, 2015) at the unit or department level.
8.2.3.2 Patient Satisfaction Metrics are not Consistently Included in Manager and Team Performance Reviews
Industry best practices promote individual ownership and accountability of patient experience (Luxford, 2011). However, 60 percent of VAMC data call respondents395 stated that patient satisfaction is a component of their department’s performance assessments; this drops to 43 percent of VAMC data call respondents396 when focused exclusively on VAMC leadership. While this variability is likely due to the accuracy and availability of patient satisfaction data across VAMCs, it contrasts with high performing health systems, like Intermountain Healthcare, which include patient satisfaction as a component of all managers’ performance reviews – senior leadership through front-line managers.397
Academic literature shows correlations between positive patient experience and employee engagement (Manary, 2014). One study, in particular, showed that health systems with higher levels of physician engagement had, on average, HCAHPS scores that were 8.2 points higher than facilities with lower levels of physician engagement (Manary, 2014). To achieve this level of engagement across levels, academic literature recommends that all staff be empowered to prioritize and innovate change as well as be held accountable for patient experience outcomes (Robert Wood Johnson, 2012).
8.3 Recommendations
VHA patient experience practices have multiple stakeholders: Congress and the executive branch, VACO, VHACO, VISN leadership, and VAMC management and staff. Encouraging innovation and addressing challenges in patient experience will require collaboration between all of these groups, and a commitment to making difficult, long-term change. Different
393 Site visit patient advocate interviews, N=21 sites) 394 Site visit patient advocate interviews (N=21 sites) 395 Data call on patient experience (N=51 sites) 396 Data call on patient experience (N=51 sites) 397 Intermountain Healthcare SME interview (April 2, 2015)
Assessment F (Workflow – Clinical)
The views, opinions, and/or findings contained in this report are those of the assessment team and should not be construed as an official government position, policy, or decision.
185
recommendations should be owned by different groups (for example, recommendation requiring changes to VACO policy versus local policy) – however, support for change from all stakeholders is critical to effective implementation.
Our recommendations, building on existing strengths and addressing existing challenges in patient experience, can be categorized into two main themes.
8.3.1 Collect more timely and relevant patient experience data to drive transparency and performance improvement at the facility, department, and individual levels
8.3.2 Strengthen national and facility-level support for patient-centered care programs to increase adoption
These themes are consistent with practices suggested by the academic literature, professional associations, and high-performing hospitals within VHA and outside the system, as well as solutions proposed by front-line VHA staff – this information is included in "summary of supporting evidence" sections in each sub-recommendation. To help VHA implement our recommendations, we have also suggested next steps in the "potential near-term actions" sections of the sub-recommendations. Note, because different VAMCs may have already adopted some recommended practices or experience unique barriers, these suggestions should be tailored the individual circumstances of each VAMC. Each recommendation is supported by several sub-recommendations, which map to the “organization, workflow processes, and tools” domains specified in the Choice Act. For a detailed map of how the sub-recommendations relate to these domains, see Table E-3 in Appendix E.3.
Several recommendations overlap with other assessment areas. Where this occurs, we have referenced the relevant assessment area, which has additional detail.
Collect More Timely and Relevant Patient Experience Data to Drive Transparency and Performance Improvement at the Facility, Department, and Individual Levels
Delays in survey results and level of reporting challenges significantly limit the perceived effectiveness, accuracy, and actionability of patient satisfaction results. Over 60 percent of VAMCs visited398 cited SHEP limitations as a challenge in driving patient experience performance improvement. We suggest two key changes to better drive performance improvement from patient satisfaction data:
8.3.1.1 Ensure VHA’s patient satisfaction feedback tool(s) delivers survey results in a timely (real time or near real-time) and actionable format (for example, segmented at the VISN, VAMC, department and unit levels)
8.3.1.2 Include patient experience metrics in leadership and department level performance reviews
398 Site visits patient advocate interviews (N=21 sites)

Assessment F (Workflow – Clinical)
The views, opinions, and/or findings contained in this report are those of the assessment team and should not be construed as an official government position, policy, or decision.
186
8.3.1.1 Ensure VHA’s Patient Satisfaction Tool(s) Delivers Survey Results in a Timely (e.g., real-time or near real-time) and Actionable Format (e.g., segmented at VISN, VAMC, department, and unit Levels)
Our assessment revealed challenges with the current SHEP survey process. Evidence supports that organizations, at a minimum, should collect patient satisfaction information real-time or near real-time at the individual department level. Expediting the reporting of patient satisfaction survey results and delivering data at the department or individual unit level would provide VHA with the support needed to drive more timely service recovery and performance management across the system.
Summary of supporting evidence:
See Section 8.2.3.1 for more detail on findings.
Forty percent of data call respondents supplement current SHEP results with a real time, or near-real time point-of-care feedback solicitation tool that provides granular real-time results.399
High performing patient experience vendors administer surveys over the phone as soon as 48 hours post-discharge (HCAHPS Fast Facts, 2015) and provide individual-level reporting (Patient Voice: Every Patient Matters. Every Voice Counts, 2015; Leebov, 2001).
Top-scoring HCAHPS facility, Cleveland Clinic, created an intelligence team responsible for the development and maintenance of an internal web-based dashboard that shows real-time survey results, benchmark comparisons, and performance indicators (Cleveland Clinic, 2010).
Potential near-term actions:
VACO/VHACO: Engage an interdisciplinary group — including Veterans, OPCC&CT resources, VAMC front-line staff and leadership, and IT — to evaluate standard and supplementary patient experience feedback tools implemented across VAMCs and determine if a single tool can sufficiently meet VHA’s needs in terms of actionability, granularity, and timeliness. The group should evaluate the tools’:
o Timeliness of survey administration (for example, when are patients solicited) and results turnaround
o Level of granularity of results (for example, facility-level, department-level, unit-level)
o Configuration capabilities to meet individual VAMC needs (for example, enable the VAMC to focus on immediate service recovery or Veteran engagement) and VHA’s overall patient experience strategy
o Potential to be leveraged in the outpatient setting
o Ability to integrate with current tools (e.g., VistA)
VHACO: Evaluate the impact of nationally funding a single point-of-care tool, rather than funding several tools at the facility level.
399 Choice Act data call (N=51 sites)

Assessment F (Workflow – Clinical)
The views, opinions, and/or findings contained in this report are those of the assessment team and should not be construed as an official government position, policy, or decision.
187
VACO/VHACO: Negotiate contracts with the key vendor(s) as determined in the previous step.
8.3.1.2 Include Patient Experience Outcome Metrics (e.g., Point-of-Care Feedback, SHEP feedback, VAMC peer and Leadership Observations, etc.) in Leadership and Department Performance Reviews
Our data call and site visits identified considerable variability in patient experience performance management across VAMCS. Literature shows that clinician adherence to performance improvement initiatives is best achieved when the system promotes individual ownership and accountability (Patel, 2014). As a result, we recommend engaging leadership and front-line staff to outline department-level patient experience standards and then holding leadership and departments to those standards (Patel, 2014).
Summary of supporting evidence:
See Section 8.2.3.2 for more detail on findings.
Over 60 percent of VAMC data call respondents400 reported that they include patient experience metrics as a component of individual performance reviews in line with industry best practices (Luxford, 2011).
Top-scoring HCAHPS facility, Intermountain Healthcare, includes patient satisfaction in all managers’ performance appraisals, senior leadership through front-line managers.401
Potential near-term actions:
VHACO: Develop a standardized cross-cutting, balanced performance management scorecard with a range of domains of performance, including patient experience; refer to Assessment L for additional detail on this action.
VACO/VHACO: Deploy a coordinated program office (for example, led by OPCC&CT or myVA) effort to provide VAMCs with the tools (e.g., training, communication frameworks) necessary to deliver a positive patient experience.
VAMCs: Engage an interdisciplinary team to develop achievable and meaningful performance management standards.
VACO/VHACO/VISN/VAMC: Hold managers and teams across all levels of VA accountable to those agreed-upon performance standards (e.g., through performance pay, promotions, suspensions).
Strengthen National and Facility-level Support for Patient-centered Care Programs to Increase Adoption
While central Program Offices (e.g., OPCC&CT) are building the infrastructure to support the system-wide implementation of best practices, several challenges (as detailed Section 8.2.1)
400 Choice Act data call (N=51 sites) 401 Intermountain Healthcare SME interview (April 2, 2015)

Assessment F (Workflow – Clinical)
The views, opinions, and/or findings contained in this report are those of the assessment team and should not be construed as an official government position, policy, or decision.
188
limit system-wide adoption. We suggest several changes aimed at improving adoption, including:
8.3.2.1 Coordinate Veteran-centered initiatives across Program Offices
8.3.2.2 Promote consistent leadership at the VAMCs
8.3.2.3 Facilitate sharing of facility-driven best practices
8.3.2.1 Coordinate and Consolidate Veteran-Centered Initiatives and Directives Across Program Offices
We discovered, through site visits and interviews with VACO and VHACO leadership that VISNs and VAMCs receive hundreds of directives from a variety of different Program Offices.402 While many of these appear to be focused on Veteran-centered care, there is a risk of conflicting or poorly coordinated national support. Our recommended approach would prioritize and streamline facility directives, best practices, and performance benchmarks across Program Offices, such that the VAMCs receive a limited set of prioritized requirements from VHACO, as exemplified by high-performing facilities. This approach would also provide VAMCs with additional capacity (for example, they would have fewer directives to respond to) and the autonomy to focus on programs most important to them (e.g., Veteran engagement, service-level advocates, whole health training).
Summary of supporting evidence:
See Section 8.2.1 for more detail on findings.
VAMC performance measures have increased exponentially over the past 15 years; VAMC employees are unable to keep up with current performance measures and directives, let alone focus on new patient-centered care initiatives (Wong, 2012).
Program office leadership has stated, “We’ve seen improvement [in coordination of program offices], but it needs to improve. That’s part of a very clear Central Office vision, clarity on the direction we’re going, not everyone interpreting it their own way403” and “There’s a lot of goodness in the system, but sometimes there is too much goodness coming at the facilities, and they’re overwhelmed.404”
Potential near-term actions:
Refer to Assessment L for details related to the implementation of this recommendation.
402 VAMC site visit interview: patient advocates (N=21 facilities) 403 VACO SME interview 404 VACO SME interview

Assessment F (Workflow – Clinical)
The views, opinions, and/or findings contained in this report are those of the assessment team and should not be construed as an official government position, policy, or decision.
189
8.3.2.2 Improve VAMC Leadership Turnover to Ensure a More Consistent Patient Experience Strategy at the Facility-level and Better Utilization of Available Resources
Our assessment has shown that VHACO’s effectiveness in driving system-wide adoption of patient experience best practices is limited by inconsistent VAMC leadership. A more stable leadership structure would not only help facilities focus their efforts on a prioritized set of initiatives (for example, priorities are not constantly changing every time the leadership turns over), but it would also help the Central Office disseminate information about new programs and implementation support (for example, VAMC leadership can effectively bridge the Central Office and front-line). Improving turnover would require both filling current vacancies and establishing longer leadership tours at the VAMCs.
Summary of supporting evidence:
See Section 8.2.2.1 for more detail on findings.
Of the VAMC Quadrads, 39 percent have at least one current vacancy; three Medical Centers operate with only one permanent Quadrad member.405
Academic literature supports that strong, consistent executive leadership is required to drive system-wide cultural change. (Singer, 2013).
Potential near-term actions:
VHACO: Address current VAMC leadership vacancies; refer to Assessment L for more detail on this recommendation.
VHACO: Promote longer VAMC leadership tours to encourage greater management consistency at the facilities.
8.3.2.3 Encourage Innovation at The Facility Level by Building the Program Office Infrastructure to Support the Evaluation, Codification, and Implementation of Facility-Driven Patient Experience Initiatives
We observed many examples of facility-driven best practices indicating an opportunity to better leverage innovation in the field to impact patient experience. However, appropriate Program Office-level support (e.g., OPCC&CT) is needed to facilitate best practice sharing and implementation across the system.406
Summary of supporting evidence:
See Section 8.3.1.3 for more detail on findings.
Of VAMCs visited, 100 percent have implemented patient experience initiatives (for example, quiet program, community gardens, volunteer rounding) at their local facility.407
405 VHA Office of Workforce Solutions (2015) 406 VHA Interview with OPCC&CT 407 Site visits interviews with Patient Advocate (n=21 facilities)

Assessment F (Workflow – Clinical)
The views, opinions, and/or findings contained in this report are those of the assessment team and should not be construed as an official government position, policy, or decision.
190
As a leading facility in Veteran and family engagement, Palo Alto VAMC exemplifies successful facility-led innovation through the rollout of its Veteran and Family Advisory Committee workshop in collaboration with OPCC&CT.408
Top-scoring HCAHPS facility, the Cleveland Clinic, holds an innovation summit each year to discuss patient experience best practices from academic literature as well as practical, front-line-submitted solutions such that lower-performing facilities may learn from higher-performing facilities (Cleveland Clinic, 2010).
Potential near-term actions:
VHACO: Increase awareness of OPCC&CT through dynamic communication campaigns highlighting new initiatives (national and facility levels) and available resources.
VHACO: Ensure that the OPCC&CT is sufficiently resourced to meet the implementation needs of the VAMCs.
OPCC&CT: Develop a process where individual facilities can apply to pilot a PCC best practice; similar to the Centers of Innovation; this would allow VAMCs to develop, manage, and evaluate the effectiveness of their initiative, in collaboration with OPCC&CT, and eventually showcase proven, best practices to other VAMCs.
VAMCs: Submit case studies of unique patient-centered care practices to OPCC&CT for syndication.
Potential Opportunity
Our analysis shows that mean patient satisfaction scores are slightly lower than national averages, notwithstanding significant confounding factors that make comparison difficult, as discussed in Section 8.1.1. While aggregate VHA scores are on a par with national averages, some facilities in the bottom quartile trail national averages by as much as 12 percent as demonstrated in Figure 8-2.409
If VHA is able to bring its bottom quartile to the national average, it would lead to positive impact across the following dimensions.
Increased patient acquisition and retention. Satisfied patients are three times more likely to return to a provider they have been seen before (Manary, 2013).
o Patient satisfaction is predictive of an individual’s choice in medical care (Fan, 2005), which drives improved continuity of care (Corrigan, 2012).
o Dual users of non-VA and VA facilities (e.g., Veterans who are presumably not experiencing the full benefits of VA continuity of care) reported lower satisfaction with their care (Fan, 2005).
Improved health outcomes. Positive correlation exists nationally between CMS quality scores and patient satisfaction scores (Price, 2014).
408 VHA interview with OPCC&CT and Palo Alto Veteran and Family Advisory Committee 409 SHEP data (FY14) and CMS HCAHPS data (FY14)

Assessment F (Workflow – Clinical)
The views, opinions, and/or findings contained in this report are those of the assessment team and should not be construed as an official government position, policy, or decision.
191
Improved patient access and health. Positive correlation exists nationally between CMS quality scores and HCAHPS scores (which serve as a proxy for SHEP scores) (Price, 2014).
VHA has demonstrated excellent patient satisfaction across many of its facilities. For example, Long Beach VAMC has demonstrated close to a five percent increase in its scores from 2012 to 2014 related to care transition decision-making, communication about medication, and cleanliness of the hospital.410 Additionally, the VAMC was able to increase its care transition decision-making above the VHA average in three years. This increase in scores may be attributed to the VAMC’s recent hiring of a Chief of Patient Experience, its improved focus on Veteran and employee engagement (for example, training on “what it means to be a patient” and recognition pins for employees who receive compliments from patients), and recent implementation of patient-centered care initiatives (e.g., thank-you cards for Veterans on discharge, “Patient-Centered Care” celebration month”).411 Given Long Beach’s success, improvement in lower-performing facilities should be plausible provided the implementation support structure is established across facilities to facilitate the sharing of best practices and lessons learned.412
410 VHA SHEP (FY12 to FY14) 411 Site visit interview with Long Beach VAMC Chief of Patient Experience 412 VHA SHEP scores (FY14) and CMS HCAHPS scores (FY14)

Assessment F (Workflow – Clinical)
The views, opinions, and/or findings contained in this report are those of the assessment team and should not be construed as an official government position, policy, or decision.
192
This page intentionally left blank.
Assessment F (Workflow – Clinical)
The views, opinions, and/or findings contained in this report are those of the assessment team and should not be construed as an official government position, policy, or decision.
193
9 Accurate Documentation and Subsequent Coding of Inpatient Services
Part F (“Assessment F”), Section 201 of the Veterans Access, Choice, and Accountability Act of 2014 (“the Choice Act”) mandates an assessment of the organization, workflow processes, and tools used to support accurate documentation and subsequent coding of inpatient services. Documentation and coding in health care are considered critical in supporting appropriate billing and collection of third-party payment as well as for generating insight across a number of other purposes including abstraction of quality metrics, measurement of provider workload and productivity, and identification of demographic and epidemiologic trends within the population. Use of coded administrative data for these purposes is supported by studies suggesting that administrative data represents a viable alternative to manual chart reviews for understanding patient conditions (Humphries, 2000; Kieszak, 1999). While some concerns remain across the industry (among both public and private health care organizations) regarding coding’s ability to fully capture the complexity of patients served, medical coding will likely continue to play a significant role in health care given current payment models and prevailing methodologies for assessing quality of clinical care (Lawson, 2012).
The role of documentation and coding is similarly vital within VHA because it influences the organization’s ability to effectively collect payments for services provided to 23–26 percent413 of patients with billable third-party insurance (Patient Insurance Statistics 2014), appropriately match existing services and develop new services to meet Veteran needs, and accurately allocate funding across VAMCs through the Veterans Equitable Resource Allocation (VERA) system.414 Because most of VHA’s budget is allocated through the VERA system, accurate documentation and coding is vital to appropriately match available resources to a dispersed and heterogeneous Veteran population (Wasserman, 2003).
Based on the language of the Choice Act legislation, the scope of this assessment area includes the practices employed by VAMCs to ensure that information recorded in VHA’s clinical documentation and coding systems is both accurate and complete. While we did assess VHA’s internal quality assurance processes, we did not conduct an independent audit of the accuracy of provider documentation or medical coding. It should also be noted that assessments of VHA’s information technology tools/strategies and the processes for billing/collection of third-party billable claims are covered by assessment areas H and I respectively; the corresponding assessment reports should be consulted for additional details on these topics.
413 Represents range (October FY2013 through November FY2015) of monthly percent total inpatient and
outpatient records capturing services provided to Veterans with billable insurance 414 The Veterans Equitable Resource Allocation (VERA) model was instituted in April 1997 as a means of distributing
VHA funding across the organization based on need rather than historical funding patterns. VERA funding is based on several factors, including “number of patients, adjustments for regional variances in labor and contract costs, high cost patients, education support, research support, equipment, and non-recurring maintenance” (VERA 2014: Equitable Funding Across 20 Health Care Networks). Given that adjustments for high cost patients and patient volume are based on information captured within documentation and coding systems, accurate capture of clinical information is critical to appropriate resource allocation.

Assessment F (Workflow – Clinical)
The views, opinions, and/or findings contained in this report are those of the assessment team and should not be construed as an official government position, policy, or decision.
194
9.1 Summary
Assessment Approach
As described in the summary of this report (Section 1), we collected information in several ways, using a common approach across sub-assessment areas within Assessment F:
Visits to 21 VAMCs to conduct:
o Forty-two interviews with health information management (HIM) leaders, medical coders, and physician service line chiefs
o Twenty415 assessment workshops with front-line personnel, including physicians, utilization management (UM) personnel, clinical documentation (CDI) specialists, HIM leaders, and medical coders (approximately 115 staff total)
Survey416 sent to relevant clinical occupations across all VAMCs, completed by 979 respondents417 across 92 VAMCs418. Due to the fact that VHA does not track the setting of work (i.e., inpatient or outpatient) in available human resource data and VISN and VAMC Directors were responsible for the distribution of the survey to the end-user we are unable to calculate the significance of the total response rate, but do not believe it to be a representative sample across any of the roles. Given this, survey data should be viewed as providing anecdotal insights as opposed to a representative data sample.
Request for local policy documents from all VAMCs (“data call”); documentation and coding section returned by 52 (43 percent) VAMCs419
Data collection from national data systems, including HIM Executive Summary, HIM Inventory, and Physician Query Tracking (PQT) data
Having collected information to understand VHA’s practices with respect to accurate documentation and subsequent coding, we then assessed how these practices compared to best practices and industry benchmarks. Best practices and benchmarks, detailed in Table F-1 of Appendix F.1 were identified through several sources, including:
Interviews with high-performing private hospitals (e.g., including national multi-hospital systems, hospitals with an employed physician workforce, and hospitals that are part of an integrated delivery network to ensure comparability with VHA)
415 A documentation and coding assessment workshop was not held at one of our sites due to scheduling and
patient care conflicts. 416 As noted in the Methodology section (Section 2), we do not believe that the survey constitutes a representative
sample of VHA staff. 417 Total indicates number of staff from complexity level 1a, 1b, 1c, or 2 VAMCs responding to any survey question
related to documentation and coding; number of respondents for each survey question varies due to customization of questions according to clinical occupation.
418 Only includes VAMCs with complexity level 1a, 1b, 1c, or 2 419 Based on total 121 VAMCs with complexity level 1a, 1b, 1c, or 2

Assessment F (Workflow – Clinical)
The views, opinions, and/or findings contained in this report are those of the assessment team and should not be construed as an official government position, policy, or decision.
195
Academic literature (e.g., research supporting a link between coding accuracy and measurement of quality outcomes)
Resources from medical coding professional organizations (e.g., guidance from American Health Information Management Association (AHIMA) on developing a compliant provider query process)
A number of documentation and coding practices have been shown within academic literature to promote accurate capture of information within clinical and administrative systems. We supplemented this evidence from academic literature with guidance from professional associations (e.g., AHIMA), interviews with other best practice hospital organizations, and industry surveys to comprehensively identify best practices for benchmarking current VHA processes.
Summary of Findings
The process of inpatient documentation and coding consists of four main steps, as outlined in Figure 9-1. Effective management of the overall process requires a collaborative effort from providers, medical coders, and facility leadership to ensure that clinical findings are documented optimally, codes are assigned accurately, and management is engaged consistently in promoting and enabling high performance.

Assessment F (Workflow – Clinical)
The views, opinions, and/or findings contained in this report are those of the assessment team and should not be construed as an official government position, policy, or decision.
196
Figure 9-1. Inpatient Documentation and Coding Process
Our assessment revealed three main findings with respect to VHA’s strengths and challenges in documentation and coding (see Section 9.2 for details regarding each finding):
9.2.1 Inconsistent emphasis on clinical documentation impedes consistent capture of complete clinical information, hindering appropriate resource allocation and revenue collection. Varied and generally low emphasis on accurate clinical documentation and coding across the organization results in potentially incomplete data. While some VAMCs have stressed proper documentation to maximize budgetary allocations and improve quality ratings, many have not. This is evidenced by differences in local approaches to documentation training: only 57 percent of physicians participating in the Choice Act survey reported that their facility provides training regarding documentation and coding.420
9.2.2 Adoption of documentation best practices is variable, resulting in inconsistent quality of clinical documentation system-wide. Industry professional organizations
420 Choice Act survey (N=406)

Assessment F (Workflow – Clinical)
The views, opinions, and/or findings contained in this report are those of the assessment team and should not be construed as an official government position, policy, or decision.
197
have established documentation standards to ensure integrity of data captured within electronic health care records (Arrowood, 2013). These standards include recommendations for appropriate use of clinical templates (e.g., designing templates to meet requirements for both billing and clinical data-sharing) and for processes to ensure appropriate use of copy-paste functionality (e.g., conducting reviews to ensure that certain clinical information, like patient vital signs, are not being inappropriately copied from one encounter to another). In spite of national efforts to address these issues through required monthly electronic health record (EHR) quality reviews, VHA clinical staff and medical coders reported that challenges persist: 80 percent of sites reported limited template utilization or use of suboptimal templates and 55 percent reported inappropriate use of copy-paste.421
9.2.3 System-wide focus on coding standards has resulted in coding performance typically meeting or exceeding private sector benchmarks. VHA inpatient coding accuracy422 is about 93 percent nationally and inpatient coding occurs, on average, 4 days after discharge, suggesting that VHA coding performance is closely aligned with industry benchmarks. Routine internal auditing of coding performance at the facility-level and development of a national dashboard for performance tracking appear to be contributing to strong coding reliability. However, the potential existence of suboptimal documentation upon which coding is based may inhibit coders’ ability to optimize coding to match clinical actualities.
Summary of Recommendations
Our assessment revealed several areas where VHA can build on current strengths or address existing challenges to improve documentation coding. We recommend that VHA consider two strategic themes, as detailed below. As with the findings, these themes apply to VHA organization, processes, and tools.
9.3.1 Increase local prioritization of clinical documentation through acceleration of national CDI program and targeted provider education and training, supported by performance management at the facility and provider level. VHA launched a national clinical documentation improvement (CDI) program in 2013, but, to date, only 46 percent of VAMCs have implemented programs at the local level.423 VHA should strengthen the current CDI program by outlining national documentation improvement priorities, providing targeted guidance, and creating a national knowledge-sharing network to disseminate successful local practices. These efforts should be reinforced by targeted provider education, transparency tied to meaningful
421 Site visit documentation and coding assessment workshops (N=20) 422 Note that accuracy in this context refers to inter-coder reliability, or the extent to which an expert coder would
assign the same medical codes based on existing clinical documentation; high coding accuracy does not necessarily mean that codes represent a patient’s true condition, as insufficient or inaccurate provider documentation may inhibit optimal assignment of codes
423 2014 HIM Inventory (N=134)

Assessment F (Workflow – Clinical)
The views, opinions, and/or findings contained in this report are those of the assessment team and should not be construed as an official government position, policy, or decision.
198
outcomes (e.g., percent of claims not billable to insurance due to incomplete documentation), and performance management for both facilities and providers to increase prioritization of clinical documentation across VHA (see Assessment I report for additional details).
9.3.2 Strengthen provider documentation standards (e.g., management of clinical templates, EHR review process) to promote optimal capture of patient information and improve resulting resource management. Challenges with clinical documentation were common across VAMCs, as evidenced by 80 percent of participants in documentation and coding assessment workshops reporting suboptimal template use and management practices.424 VHA should improve documentation practices through enhanced governance focused on template management, targeted guidance regarding EHR reviews, and improved performance management reinforcing query responsiveness.
Our assessment did not provide evidence of organization-wide challenges with medical coding tools and processes. As such, we did not make any recommendations targeted specifically to medical coding. As VHA is able to achieve improvements in documentation patterns through the recommendations above and other targeted actions, leadership should continue to monitor coding performance to evaluate whether targeted changes are needed.
Past Findings and Recommendations
Several recent assessments have indirectly identified findings related to VHA documentation and coding practices, although these issues have not been the primary focus areas of past assessments. Recent findings from national assessments include clinical documentation not containing all necessary information for third-party billing (OIG, 2013; OIG, 2012), documentation not meeting requirements for patient transfer or discharge (OIG, 2010), documentation inaccuracies (OIG, 2009), and coding discrepancies for select patient subgroups (Carlson, 2010). In addition to these national level assessments, a few documentation and coding topics have been incorporated into OIG’s facility-level comprehensive reviews, revealing additional challenges including lack of facility-level EHR review committees (OIG, 2010), inadequate implementation of copy-paste audits (OIG, 2012), and poorly-developed standards for resident documentation and oversight (OIG, 2007).425 Illustrative findings and recommendations from recent assessments are outlined within Figures F-1 and F-2 in Appendix F.2.
These past assessments have tended to focus on specific issue areas and/or individual facilities, separately developing recommendations for improvement in discrete areas. In contrast, our assessment tries to take an end-to-end view of inpatient clinical operations across five key sub-assessment areas and all high- and medium-complexity VAMCs.
424 Site visit documentation and coding assessment workshops (N=20) 425 Note that these are illustrative of the types of issues identified recently; they are not intended to be a
comprehensive listing.

Assessment F (Workflow – Clinical)
The views, opinions, and/or findings contained in this report are those of the assessment team and should not be construed as an official government position, policy, or decision.
199
9.2 Findings
Our assessment revealed three main findings related to VHA’s current documentation and coding practices.
9.2.1 Inconsistent emphasis on clinical documentation impedes consistent capture of complete clinical information, hindering appropriate resource allocation and revenue collection
9.2.2 Adoption of documentation best practices is variable, resulting in inconsistent quality of clinical documentation system-wide
9.2.3 System-wide focus on coding standards has resulted in coding performance typically meeting or exceeding private sector benchmarks
These findings are based on several key sources of insight. We have used the national data sets that were available, information returned as part of the data call, and perceptions and experience reported or observed during site visits or via the staff survey. In many instances where data does not allow us to definitively comment, we have described the potential implications of the data points we do have, along with recommendations in Section 9.3 for further analysis.
Underlying each finding are several drivers; these drivers map to the “organization, workflow processes, and tools” domains specified in the Choice Act. For a detailed map of how the drivers relate to these domains, see Table F-2 in Appendix F.3.
Inconsistent Emphasis on Clinical Documentation Impedes Consistent Capture of Complete Clinical Information, Hindering Appropriate Resource Allocation and Revenue Collection
VHA’s unique financial and reimbursement model contributes to misunderstandings regarding the proper role of documentation and coding within VHA relative to private sector providers. Within the private sector, the prevailing reimbursement model is a fee-for-service system wherein hospitals and providers receive payment from health insurance companies following provision of medical services and submission of coded medical documentation that justifies appropriateness of treatment. The importance of proper clinical documentation and coding is well-understood and innately reinforced within this system: encounters that are inappropriately coded or insufficiently supported by clinical documentation may be subject to review or rejection, contributing to compliance risks and lost revenues. The fee-for-service system also closely aligns the reimbursement incentives of facilities with those of providers, as the accurate and complete clinical documentation required to support facility reimbursement also ensures that providers are able to collect for the services they provide to patients.
In contrast to this system, VHA’s funding for patient care comes from two sources: VAMC funding is primarily provided though the Veterans Equitable Resource Allocation (VERA) system, supplemented by third-party reimbursements for the 23-26 percent of services provided to
Assessment F (Workflow – Clinical)
The views, opinions, and/or findings contained in this report are those of the assessment team and should not be construed as an official government position, policy, or decision.
200
Veterans with billable insurance coverage.426 Funds disbursed through the VERA system do not follow a traditional fee-for-service approach. Instead, the VERA system is designed to equitably distribute VHA’s budget based on the number and characteristics (e.g., service connection, income levels, other special health care needs) of Veterans cared for at each facility (VHA, 2014; Wasserman, 2003). Although the VERA system is critically dependent on information from clinical documentation, the link between documentation patterns and VERA funding is less direct than within fee-for-service models. In addition, individual provider incentives supporting optimal documentation may be weakened within VHA’s reimbursement system, specifically because providers are salaried and have few formal incentives to improve documentation patterns (e.g., performance incentives rewarding optimal documentation, penalties for sub-standard documentation practices).
Despite VHA differences relative to private sector, documentation and coding remain critical to VHA’s ability to effectively and efficiently provide inpatient care. As one VHACO leader stated during an interview: “There is no difference between VHA and the private sector in the importance of documentation and coding—it is just as important here as it is there.”427 Clinical documentation and coding are essential not only to VHA’s ability to properly allocate overall funding through the VERA system and appropriately bill and collect from third-party insurers, but also to:
Efficiently measure organizational performance on key quality measures, assuring quality of care that matches or exceeds that of the private sector.
Proactively identify trends in Veteran populations and design programs and interventions suited to changing Veteran needs.
Accurately capture provider clinical workload to support appropriate clinical staffing.
Despite these considerations, we found that the organizational emphasis placed on accurate clinical documentation does not consistently match the private sector. Our analysis suggests that this is driven by the following:
9.2.1.1 Limited direct integration of health information management (HIM) and finance functions at the VAMC level weakens leadership prioritization of documentation
9.2.1.2 Inconsistent provider education and training practices are not aligned with VHA’s view of the high importance of clinical documentation
9.2.1.3 Lack of performance management contributes to low priority on documentation
9.2.1.1 Limited Direct Integration of Health Information Management (HIM) and Finance Functions at the VAMC Level Weakens Leadership Prioritization of Documentation
Strong organizational ties between Health Information Management (HIM) and a hospital’s finance department are common in the private sector given the critical influence of coding on
426 VHA Patient Insurance Statistics 2014 427 Interview with VHACO leader

Assessment F (Workflow – Clinical)
The views, opinions, and/or findings contained in this report are those of the assessment team and should not be construed as an official government position, policy, or decision.
201
reimbursement, facilitate communication, frequent interactions, and enhanced collaboration between the departments. Within VHA, we find this coordination to be weaker, as evidenced by: (1) lack of national guidance on recommended HIM organizational structure; and (2) less than one-fifth of cases where HIM reports to a member of the VAMC executive leadership team.
Lack of national guidance on recommended HIM organizational structure. Limited national direction related to the positioning of the HIM function at the facility level has contributed to varied organizational designs. VHA Handbook 1907.01: Health Information Management and Health Records, which outlines basic HIM functions and responsibilities of key stakeholders, does not endorse a specific organizational structure (VHA, 2014). Other national VHA policies are similarly silent on HIM organizational structure, as suggested by a national HIM leader, who stated: “There have been several reorganizations over the years and HIM has landed at various places within the organization. Many facilities are currently organized with HIM under health administrative services (HAS), but this is not mandated by any official directives.”428
Data from the national HIM inventory and our review of organizational charts obtained through the national data call confirm differences in organizational design. We found that the HIM function is positioned under the HAS service in 69 percent of cases, although some facilities employ an alternative organizational structure (e.g., reporting through chief of staff).429 Organizational charts obtained through the data call reveal that even for the subset of facilities with HIM organized under HAS, reporting structure for HIM varies from one facility to another: some HIM chiefs report directly to the HAS chief while others report through an associate HAS chief at lower level of the organization. This variability in organizational design often positions HIM leaders deeper within the facility’s reporting structure and is likely to generate differences in the visibility, inclusion, and prioritization of the HIM function from one facility to another, contributing to differences in facility-level emphasis on documentation and coding performance.
Less than one-fifth of cases where HIM reports to a member of the VAMC executive leadership team. Across VAMCs, only 17 percent of HIM chiefs report to a member of the hospital executive leadership team.430 This does not mirror common practice within private hospitals, where 46 percent of HIM chiefs indicate that they report to their hospital’s chief financial officer (Johns, 2013). This is important because studies in the academic literature have suggested a link between successful health information management outcomes and lines of authority and visible management support (Van der Meijden, 2003). The prevailing organizational design choices and reporting structures employed by VAMCs may dilute the focus that
428 Interview with VHACO leader 429 2014 HIM Inventory (N=134) 430 2014 HIM Inventory (N=134)
Assessment F (Workflow – Clinical)
The views, opinions, and/or findings contained in this report are those of the assessment team and should not be construed as an official government position, policy, or decision.
202
hospital leadership and other staff place on documentation and coding issues, resulting in weaker facility-level culture surrounding the importance of documentation and coding.
9.2.1.2 Inconsistent Provider Education and Training Practices are not Aligned With VHA’s View of the High Importance of Clinical Documentation
Studies in the academic literature have provided evidence that physician education and training can be effective in improving documentation practices (Russo, 2013). Provider education sessions not only provide a vehicle to address common provider documentation challenges, but they also reinforce the critical role of documentation to support high-quality patient care and ensure appropriate resourcing at the facility-level. This is particularly critical in a VHA context because about 78 percent of VAMCs host physician trainees through affiliations with academic medical centers, which leads to frequent rotation of trainees and supervising physicians and decreases provider familiarity with VHA documentation systems and best practices (VHA, 2009). Our assessment suggests that: (1) provider education and training sessions are offered inconsistently across the organization; and (2) lack of VHA provider emphasis on complete and accurate documentation is often inconsistent with the role documentation plays to support reimbursement.
Provider education and training sessions are delivered inconsistently across the organization. According to interviews with high-performing hospital organizations, provider documentation training and education are critical to improve clinical documentation. In order to be successful, these organizations develop engaging training materials targeted to the specific documentation needs of provider sub-groups (e.g., cardiology training focused on the documentation elements necessary for heart failure encounters). Our interviews with facility HIM chiefs indicate that provider education and training is a significant barrier to optimal documentation across VHA, with 67 percent of interviewees reporting this challenge at their VAMC.431 Across VHA, only 53 percent of HIM departments at the VAMC-level report offering regularly-scheduled provider education trainings.432 This is consistent with provider responses to the Choice Act survey: only 57 percent of respondents reported trainings on proper medical record documentation offered by their facility.433 In addition, providers reported significant differences in the frequency with which trainings are offered or required across the organization (Figure 9-2). Where provider training is in place, the majority of respondents reported that trainings are “somewhat effective” (65 percent of total respondents), with only 14 percent reporting that trainings are “highly effective.”434 While provider training has not
431 Site visit HIM chief interviews (N=21) 432 2014 HIM Inventory (N=134) 433 Choice Act survey (N=406) 434 Choice Act Survey (N=228)
Assessment F (Workflow – Clinical)
The views, opinions, and/or findings contained in this report are those of the assessment team and should not be construed as an official government position, policy, or decision.
203
been consistently implemented across the organization, we found that many VAMCs have developed local training programs and policies to address facility-level challenges. These efforts have contributed to improvements in documentation quality and other key metrics, as illustrated by the experience of the Durham VAMC (see case study below). VHA’s lack of consistency in provider training practices contrasts with reports of one high-performing hospital system. According to a recent interview with Intermountain Healthcare, its providers are required to participate in mandatory trainings at hiring and mandatory trainings every six months, targeting specialty-specific documentation needs. Additional training opportunities are also available as needed, based on request.435 Gaps in VHA’s approach to training relative to Intermountain suggest a missed opportunity to signal the importance of documentation and to equip providers with the guidance needed to document optimally. This deficiency was widely recognized by front-line staff during site visits: 50 percent of sites reported inadequate provider education and training as a challenge to clinical documentation.436
435 Intermountain Healthcare SME (May 5, 2015) 436 Site visit documentation and coding assessment workshops (N=20)
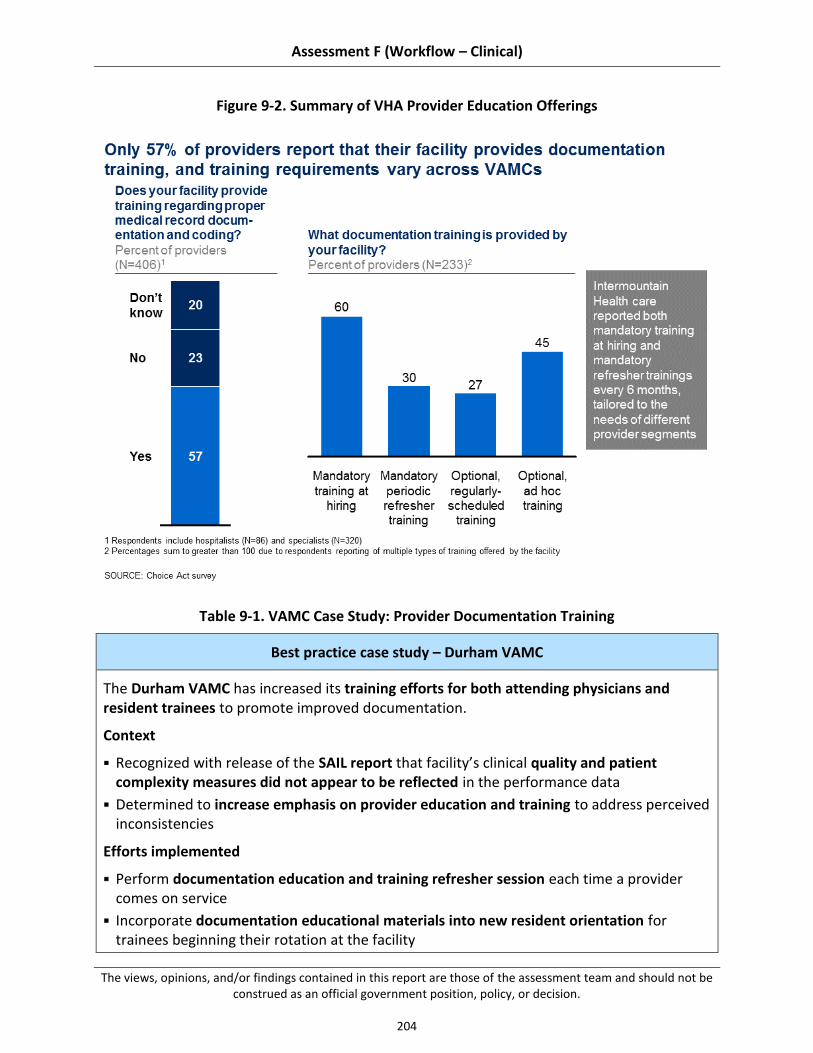
Assessment F (Workflow – Clinical)
The views, opinions, and/or findings contained in this report are those of the assessment team and should not be construed as an official government position, policy, or decision.
204
Figure 9-2. Summary of VHA Provider Education Offerings
Table 9-1. VAMC Case Study: Provider Documentation Training
Best practice case study – Durham VAMC
The Durham VAMC has increased its training efforts for both attending physicians and resident trainees to promote improved documentation.
Context
Recognized with release of the SAIL report that facility’s clinical quality and patient complexity measures did not appear to be reflected in the performance data
Determined to increase emphasis on provider education and training to address perceived inconsistencies
Efforts implemented
Perform documentation education and training refresher session each time a provider comes on service
Incorporate documentation educational materials into new resident orientation for trainees beginning their rotation at the facility

Assessment F (Workflow – Clinical)
The views, opinions, and/or findings contained in this report are those of the assessment team and should not be construed as an official government position, policy, or decision.
205
Best practice case study – Durham VAMC
Include review of resident discharge summaries into regular morning report sessions with trainees to promote improvement of common documentation problems
Impact
More accurately reflected patient complexity, resulting in an increased facility average case mix index from ~1.0 to ~1.2 over a four-year period
Lack of VHA provider emphasis on complete and accurate documentation is often inconsistent with the role documentation plays to support reimbursement. Inconsistent recognition of the importance of accurate clinical documentation among providers was commonly reported during our assessment. To illustrate, one VHACO leader described an experience that occurred while discussing clinical documentation with a provider. In response to a recommendation that providers be more specific in their documentation to enable accurate coding, the provider countered: “We really don’t need to document that specifically in the VA. That’s not how we get paid.”437 We heard similar sentiments expressed during other site visits, including from one provider who commented: “Part of the VA’s value proposition is that you get to focus on the medicine—if they start cracking down on the paperwork, then what’s the selling point? Why work here?”438 Data from polls conducted during our documentation and coding assessment workshops suggests that these cultural views are common among providers across the system: 56 percent of providers indicated that accuracy of documentation and coding within VHA is less than private sector.439
9.2.1.3 Lack of Performance Management Contributes to Low Priority on Documentation
Our analysis suggests limited efforts to promote improvement in the quality of information captured within clinical and administrative systems through performance management. This performance management issue is exhibited in at least three ways: (1) physicians often lack formal incentives to document optimally; (2) documentation and coding metrics are not directly included within the facility-level Strategic Analytics for Improvement and Learning (SAIL) report; and (3) administrative staff are not evaluated on their ability to reliably capture patient demographic and insurance information.
Physicians often lack formal incentives to document optimally. Performance management is a powerful tool that many organizations use to promote desired behaviors. There is evidence that this tool can be effectively applied to physicians,
437 Interview with VHACO leader 438 Site visit documentation and coding assessment workshop comment 439 Site visit documentation and coding pre-assessment workshop polls (N=16)

Assessment F (Workflow – Clinical)
The views, opinions, and/or findings contained in this report are those of the assessment team and should not be construed as an official government position, policy, or decision.
206
with the academic literature suggesting that physicians respond predictably to incentives (Barro, 2003). High-performing hospital systems use performance management and incentives to promote optimal documentation (see case study below).
Table 9-2. External Case Study: Physician Documentation Performance Management
Best practice external case study – Intermountain Healthcare440
To support its goals of ensuring accurate capture of patient information, Intermountain Healthcare has implemented provider education and performance management related to clinical documentation (Intermountain Healthcare Interview, 2015).
Details
Collaborates with providers regarding potential documentation metrics for incorporation into annual provider reviews
Aligns on documentation metrics with clear links to quality of care to increased provider support and engagement
Sets one to two annual documentation performance goals with physicians, with performance linked to compensation
Impact
Experienced improvements in patient case mix to match true clinical condition of patients treated
“Our training and performance management processes have significantly increased our organization’s readiness for the upcoming ICD-10 transition.”
Observations from our site visits suggest that performance management is infrequently applied to physician documentation practices (e.g., physicians are not evaluated based on the quality of their clinical documentation). Many physicians suggested that they receive little if any feedback on their documentation within the VHA system. This contrasts with standard practice at private hospitals, as suggested by one VHA physician’s comments: “When I started working at a new hospital in the private sector, a medical coder was assigned to work with me during my first few months to make sure I was documenting and coding everything appropriately. Here in the VA, it is rare for me to get any feedback regarding my documentation.” HIM chiefs frequently referenced a lack of provider performance management as a barrier to effective documentation, with 38 percent of VAMC HIM chiefs citing lack
440 Intermountain Healthcare SME interview (May 5, 2015)

Assessment F (Workflow – Clinical)
The views, opinions, and/or findings contained in this report are those of the assessment team and should not be construed as an official government position, policy, or decision.
207
of formal physician incentives as the biggest barrier to documentation and coding accuracy for their facilities.441
These site visit findings are validated by provider perspectives gathered from the Choice Act survey. Though approximately two-thirds (67 percent) of providers report having received some feedback regarding the quality of their clinical documentation during the last year,442 only 36 percent of those providers indicated that the feedback come as part of regular performance evaluations.443 Overall, this suggests that approximately 24 percent of providers are evaluated on their documentation as part of regular performance reviews. This is consistent with our analysis of VHA-published provider review materials obtained as part of our assessment: VA Form 10-2623a, the national “Proficiency Report” used for provider evaluations, does not contain performance metrics related to provider documentation.
Documentation and coding metrics are not directly included within the facility-level SAIL report. Quality managers interviewed during site visits indicated that facility performance on measures contained within the Strategic Analytics for Improvement and Learning (SAIL) report has been a recent focus for many VAMCs.444 The SAIL report contains 33 performance metrics across a number of important clinical and operational domains, including quality (e.g., hospital complication rates), efficiency (e.g., length-of-stay), patient experience (e.g., customer satisfaction), and access (e.g., wait times). This report has been an important VHA tool for assessing performance nationally and for directing facility-level improvement efforts. We found that the SAIL report does not contain any metrics directly assessing documentation and coding performance. However, clinical staff at many VAMCs suggested that many of the metrics contained within the SAIL report are critically dependent upon accurate clinical documentation. For example, rates of catheter associated urinary tract infections (a metric tracked within the SAIL report) are derived from clinical data, and inaccuracies in EHR documentation can lead to erroneous conclusions regarding the quality of care provided by a facility. This observation has caused select facilities to focus on documentation improvements as a mechanism to improve performance on quality measures, as suggested by one physician leader who stated: “When we first looked at our facility’s performance on the SAIL data, we were shocked because a lot of our performance data just didn’t seem right. We found that many of the issues were related to how we were capturing information within the medical record. We focused on documentation improvements and were able to improve our performance on quality measures, yielding changes in our facility rating from 2-star to 5-star in a very short time.” A
441 Site visit HIM chief interviews (N=21) 442 Choice Act survey (N=406) 443 Choice Act survey (N=272) 444 Site visit quality manager / utilization manager interviews (N=21)

Assessment F (Workflow – Clinical)
The views, opinions, and/or findings contained in this report are those of the assessment team and should not be construed as an official government position, policy, or decision.
208
similar view was expressed by some, but not all, other VAMCs, prompting variable documentation improvement efforts as a means of improving SAIL performance. Administrative staff are not evaluated on their ability to consistently capture patient demographic and insurance information. Consistent capture of patient demographic and insurance information has implications for VHA’s ability to provide high-quality clinical care as well as for facilities’ ability to appropriately capture third-party reimbursement. However, 90 percent of sites suggested significant challenges in consistently capturing this information.445 Workshop participants reported several drivers of these challenges including inconsistent use of registration scripts, insufficient training of clerks, and lack of standardized processes to verify patient information for patients admitted emergently. Based on this information, many of the challenges associated with patient registration and information verification could be addressed by aligning on processes for information verification and enhancing performance management practices for patient registration staff. Issues related to the capture of insurance information create downstream challenges with coding, as failure to accurately capture insurance information during an admission results in the generation of numerous “new insurance late check-out” (NILCO) records for delayed coding. The generation of NILCO records is part of VHA’s process to ensure that third party billing occurs for all encounters for patients with third party billable insurance. VHA has a system in place to check patient encounters that are initially not flagged as being billable to third party insurance to verify insurance status and identify encounters that may be billable. Records identified through this process are assigned to medical coders for coding of the physician services rendered on behalf of these patients and submission to third party payors, potentially disrupting coder workflows. For additional information on VHA’s challenges with timely insurance identification, please reference Assessment Report I.
Adoption of Documentation Best Practices is Variable, Resulting in Inconsistent Quality of Clinical Documentation System-wide
Accurate and complete clinical documentation is the cornerstone of effective health information management and transparency into performance. One critical enabler of effective clinical documentation is the use of electronic health records (EHRs), an area in which VHA has traditionally been viewed as an industry leader (HHS, 2015). With organization-wide implementation of the Veteran’s Health Information System and Technology Architecture (VistA) dating back to 1985, VHA boasts longer experience with the use of electronic health records than nearly any other health care organization. And despite the recent development of commercial systems for medical documentation, VistA continues to be highly-regarded among clinical personnel, with recent surveys suggesting that physicians prefer VistA’s CPRS to most commercial EHRs (Medscape, 2012).
445 Site visit documentation and coding assessment workshops (N=20)

Assessment F (Workflow – Clinical)
The views, opinions, and/or findings contained in this report are those of the assessment team and should not be construed as an official government position, policy, or decision.
209
However, an EHR is only effective so long as the data captured within it is accurate. As shown in Figure 9-3, provider documentation is the first of several steps in the documentation and coding process. Because of the interdependencies of further steps, it is critical that health care organizations ensure that complete and accurate clinical documentation is consistently captured within the health record. To support these purposes, industry professional organizations have established documentation standards to ensure integrity of health care records, including optimal template management and the appropriate use of copy-paste (Arrowood, 2013).
Figure 9-3. Role of Copy-Paste and Template Management in Clinical Documentation
For quality assurance, health care organizations implement processes to ensure that provider documentation practices are compliant with the high standards that ensure that clinical documentation is reliable for coding, billing, and communicating accurate information among providers. Our assessment revealed that facilities continue to report challenges with the quality of clinical documentation, in spite of the quality assurance practices currently in place. These issues may contribute to inaccurate data capture and preclude appropriate billing and decision-making based on captured data. We identified the following challenges associated with clinical documentation:

Assessment F (Workflow – Clinical)
The views, opinions, and/or findings contained in this report are those of the assessment team and should not be construed as an official government position, policy, or decision.
210
9.2.2.1 Inconsistent adoption of provider documentation best practices (e.g., template use, appropriate copy-paste) challenges effectiveness
9.2.2.2 Ineffective provider query practices and limited provider responsiveness at many facilities contribute to persistence of suboptimal documentation
9.2.2.3 Incomplete uptake of clinical documentation improvement (CDI) programs and variable best practice implementation has limited potential impact from these programs
As mentioned in section 9.2.1.3, lack of robust performance management and transparency appears to contribute to limited prioritization of accurate documentation and coding across the organization. In turn, this lack of emphasis at the facility and provider level may result in the many of the suboptimal decisions and behaviors reported in 9.2.2.1–9.2.2.3. Because of this, VHA should consider efforts to promote transparency and performance management around documentation and coding performance as foundational to any efforts to address the suboptimal practices outlined in this section.
9.2.2.1 Inconsistent Adoption of Provider Documentation Best Practices (e.g., template use, appropriate copy-paste) Challenges Effectiveness
Consistent adoption of appropriate documentation practices is critical to maintaining the integrity of information captured within EHR systems. Because of this, professional organizations have laid out expectations regarding the appropriate use of copy-paste, effective implementation of clinical templates, and robust processes for EHR quality assurance to promote optimal documentation (Arrowood, 2013). Our assessment suggests several documentation challenges for VHA, including: (1) templates are not consistently used or optimally managed; (2) copy-paste is not always used appropriately, challenging usability of clinical documentation; and (3) health record review processes have not effectively resolved all documentation challenges.
Templates are not consistently used or optimally managed. Use of well-designed clinical templates helps support effective documentation and coding in the following ways:
Facilitates effective written communication among providers
Ensures capture of all critical information to support accurate coding
Enhances coder productivity by standardizing location of key information within patient records
Because of these benefits, industry professional organizations have promoted template use for clinical documentation, in particular as a potential strategy to address the upcoming industry-wide transition to ICD-10 in October 2015, which will require more specific clinical documentation to support accurate medical coding (Clark, 2012).
We found the appropriate use of existing clinical templates to be a challenge across VAMCs. Clinical and administrative staff at 80 percent of site visits reported issues

Assessment F (Workflow – Clinical)
The views, opinions, and/or findings contained in this report are those of the assessment team and should not be construed as an official government position, policy, or decision.
211
with appropriate template use, making this the most commonly-reported challenge related to provider documentation patterns.446 Specifically, sites reported challenges with consistent use of template notes instead of free text notes, completion of all necessary fields within templates, and use of the same template across similar patient encounters. Our assessment suggests that issues raised regarding template use may originate, in many cases, from insufficient controls on template creation at certain VAMCs. VHA Handbook 1907.01 specifies that new templates must be approved prior to implementation (VHA, 2014). However, the directive does not lay out a standard approval process for use across VHA. Data from our VHA data call suggests inconsistencies in the approach taken at the VAMC level to template management.447 For example, one facility reported a policy whereby a template proposed by an individual physician could be approved through a single review by a committee at the VAMC level. In contrast, another VAMC reported a more extensive process requiring service line alignment to develop new templates followed by approvals at both the VAMC and VISN levels before implementing a new template.
Select VAMCs have launched efforts to rationalize the number and design of available clinical templates. For example, the Palo Alto VAMC undertook a full review of its nursing templates during an 18-month period starting in 2013. The initiative commenced with compilation of a comprehensive listing of all nursing templates in use at the facility. Each of the original 1,400 templates identified was reviewed to determine whether it should be maintained or eliminated. Through the review process, Palo Alto was able to decrease the number of nursing templates by more than 50 percent. The nursing service also strengthened its review criteria for proposed new templates in order to maintain improvements.
Although we did not assess the quality of local clinical templates resulting from template management practices currently in place, the perspectives conveyed by participants during our on-site documentation and coding assessment workshops suggest the need for improvements. Many of the improvement ideas proposed during our workshops relate to the lack of alignment of template design with coding requirements. This emphasis on template design was grounded in the concern that, in some cases, existing templates may contribute to miscommunication of patient status between providers and coders due to their lack of key documentation elements necessary to support accurate and medically appropriate coding.448
Copy-paste is not always used appropriately, challenging usability of clinical documentation. The appropriate use of copy-paste within EHRs promotes provider efficiency in documentation by enabling consistent and timely capture of complex
446 Site visit documentation and coding assessment workshops (N=20) 447 Choice Act data call template management process descriptions 448 Site visit documentation and coding assessment workshops (N=20)
Assessment F (Workflow – Clinical)
The views, opinions, and/or findings contained in this report are those of the assessment team and should not be construed as an official government position, policy, or decision.
212
patient data that doesn’t change over time (Figure 9-3). However, widespread use of copy-paste also presents a number of potential challenges, including:
Propagation of outdated or inaccurate information
Expansion in the quantity of potentially redundant clinical information
Difficulty in determining authorship of documentation (AHIMA, 2014)
Our analysis suggests that use of copy-paste across VHA is a widespread challenge. During documentation and coding assessment workshops conducted during site visits, 55 percent of sites reported inappropriate use of copy-paste within clinical documentation.449 Coders commonly expressed that unwarranted use of the copy-paste function slows down medical coding and can lead to challenges in interpreting the record for coding when information within a single note is internally inconsistent. The challenge of efficiently interpreting clinical documentation when copy-paste is used indiscriminately was reflected by the comments of a medical coder, who stated: “Sorting through the noise created by copy-paste is a huge challenge. It is almost impossible to find the information that you’re looking for when you have to scroll through screen after screen of copied documentation. And even when you find what you’re looking for, all the copy-paste makes you wonder how accurate it really is: when the note says that the catheter was removed three days in a row, it diminishes your confidence in the rest of the information contained in the patient record.”450
Health record review processes have not effectively resolved all documentation challenges. Expectations regarding performance of regular facility-level EHR quality reviews are outlined within VHA Handbook 1907.01: Health Information Management and Health Records (2014). This directive dictates quarterly review of the EHR focused on a number of key dimensions, including appropriateness of copy-paste use, evaluation of proposed new templates, and presence of unsigned progress notes. A 2014 OIG Combined Assessment Summary Report indicated strong compliance with this process, suggesting that ~75 percent of facilities perform EHR quality reviews at least quarterly (OIG, 2014). Our assessment also suggests that the majority of VAMCs are performing nationally-directed EHR quality reviews, with 88 percent of facilities reporting that they reviewed copy-paste use at least quarterly during the last year.451 However, as previously noted, challenges persist with respect to appropriate use of templates and copy-paste functionality. Given that both of these issues are intended to be addressed through EHR quality reviews, the EHR quality review processes currently in place do not appear to be consistently yielding the desired improvements in documentation quality. Our assessment suggests that this may be, in part, due to
449 Site visit documentation and coding assessment workshops (N=20) 450 Site visit documentation and coding assessment workshop participant comment 451 Choice Act data call (N=49)

Assessment F (Workflow – Clinical)
The views, opinions, and/or findings contained in this report are those of the assessment team and should not be construed as an official government position, policy, or decision.
213
variability in locally-outlined EHR quality review processes. To illustrate, only 55 percent of facilities submitting documents through the VHA data call submitted EHR review policies as requested.452 Even among VAMCs submitting policies, we observed significant variability in the depth with which quality review processes are outlined. These differences likely contribute to variation in VHA’s ability to drive desired documentation improvements through consistent EHR reviews.
9.2.2.2 Ineffective Provider Query Practices and Limited Provider Responsiveness at Many Facilities Contribute to Persistence of Suboptimal Documentation
As part of a collaborative documentation and coding process, medical coders submit queries to providers when clinical documentation is incomplete or unclear. When providers respond to queries and appropriately addend clinical documentation, coding quality is enhanced because coders are able to appropriately code encounters based on a patient’s true clinical condition and the level of care provided rather than incomplete clinical documentation initially captured in the medical record (Arrowood, 2013).
National HIM leadership has put in place the technical infrastructure to support performance of provider querying and consistent tracking of results across VHA. In 2012, VHA launched the Physician Query Tracking (PQT) tool. This tool supports provider querying by allowing HIM personnel to track the number of queries submitted to providers, provider response rates, and query outcomes. Trending query data has the potential to yield insights into problematic documentation practices and suggest whether documentation practices are improving over time. In spite of availability of the PQT tool organization-wide, it has not been fully adopted. We found that ineffective provider query practices continue to inhibit optimal documentation and coding, as evidenced by: (1) variable adoption of the provider query process and query tools across VHA; (2) low provider responsiveness to queries; (3) use of suboptimal methods for querying providers; and (4) variable use of the PQT tool’s reporting and tracking capabilities.
Variable adoption of the provider query process and query tools across VHA. Handbook 1907.01 outlines expectations that all VAMCs implement a provider querying process at the facility-level to ensure quality of the information captured within the EHR (VHA, 2014). Data from the PQT tool suggests that while adoption of provider querying has improved over time, the practice has not yet been embraced at all facilities, with 10 percent of VAMCs not querying providers during FY2014 (compared to 20 percent in FY2013 and 41 percent in FY2012).453 Our site visit findings are consistent with this data and also suggest that adoption of provider querying continues to gain traction across VHA: at least two facilities that we visited reported implementation of the provider query process during Q2 of FY2015. Low provider responsiveness to queries. Provider responsiveness to queries within VHA does not match performance within private hospitals. Figure 9-4 compares the
452 Choice Act data call (N=67) 453 Physician Query Tracking (PQT) tool (FY2012-FY2014); participation in query process defined as facilities
submitting a queries on at least 0.1 percent of Quantim encounters (1 in 1,000)
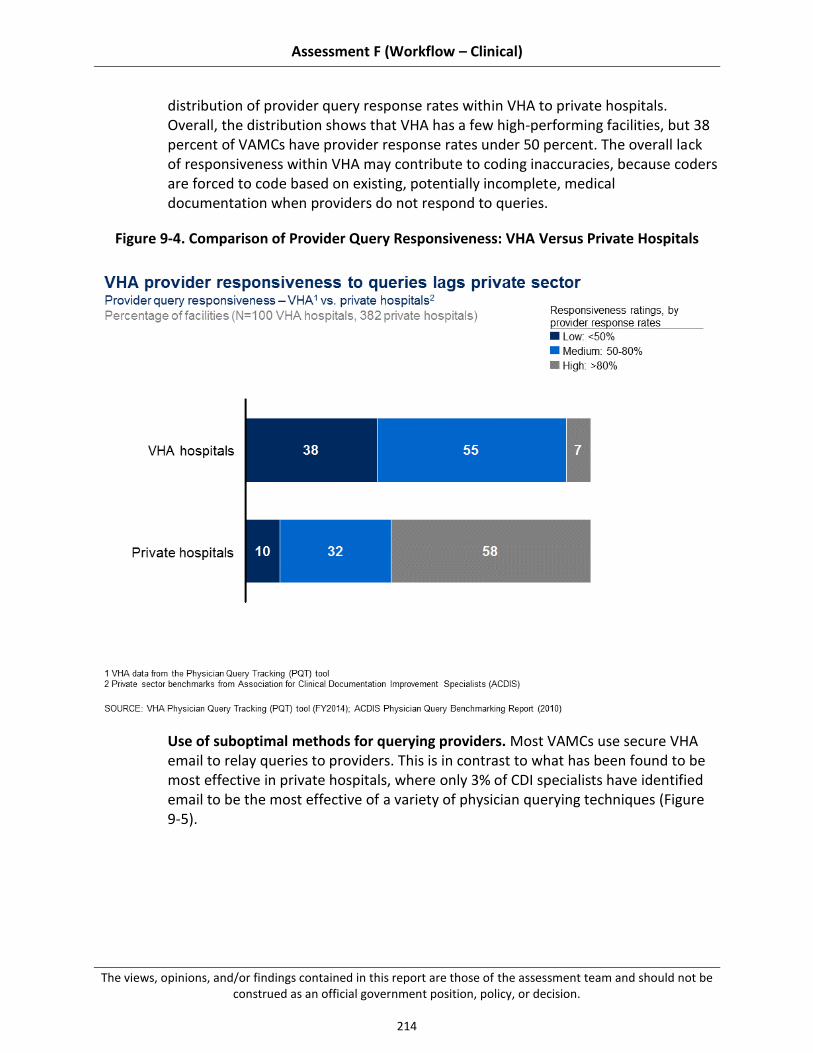
Assessment F (Workflow – Clinical)
The views, opinions, and/or findings contained in this report are those of the assessment team and should not be construed as an official government position, policy, or decision.
214
distribution of provider query response rates within VHA to private hospitals. Overall, the distribution shows that VHA has a few high-performing facilities, but 38 percent of VAMCs have provider response rates under 50 percent. The overall lack of responsiveness within VHA may contribute to coding inaccuracies, because coders are forced to code based on existing, potentially incomplete, medical documentation when providers do not respond to queries.
Figure 9-4. Comparison of Provider Query Responsiveness: VHA Versus Private Hospitals
Use of suboptimal methods for querying providers. Most VAMCs use secure VHA email to relay queries to providers. This is in contrast to what has been found to be most effective in private hospitals, where only 3% of CDI specialists have identified email to be the most effective of a variety of physician querying techniques (Figure 9-5).

Assessment F (Workflow – Clinical)
The views, opinions, and/or findings contained in this report are those of the assessment team and should not be construed as an official government position, policy, or decision.
215
Figure 9-5. CDI Specialist Perspective on Most Effective Provider Query Technique
VHA physicians raised several concerns about the use of email as the primary mode of provider querying. Limited off-site accessibility to secure VHA email, high number of e-mails received per day, and low overall utilization of VHA email were all sited as factors inhibiting providers’ ability to respond to email-based queries in a timely fashion. This problem becomes particularly acute in the context of VAMCs affiliated with academic medical centers, where providers may spend as few as two days per month treating patients within VHA facilities, causing these providers to have even more limited access to secure VHA email systems. As on VHA physician noted: “Many providers at our facility split time between VA and an academic medical center. For those that spend one day per week or fewer at VA and rarely check VA email when they are not at the facility, is it really feasible for them to notice and then respond to a query by the time the coders need their response for coding?”
Variable use of the PQT tool’s reporting and tracking capabilities. Even among facilities that have embraced provider querying and attained high levels of provider responsiveness, our assessment suggests variable use of the PQT tool’s full reporting capabilities to drive documentation improvements. For instance, one VAMC reported using the tool consistently to assess patterns and issues with documentation to identify improvement opportunities. The HIM leader at the facility

Assessment F (Workflow – Clinical)
The views, opinions, and/or findings contained in this report are those of the assessment team and should not be construed as an official government position, policy, or decision.
216
stated: “We use the PQT tool to target individual providers. Sometimes the issues are with individual providers, other times with provider teams. We use the data to pull up patterns for review and then go out and train the providers that need training.” In contrast, another facility has embraced the PQT tool and reports strong provider engagement and responsiveness, but leaders stated they scarcely use data from the PQT tool to design their documentation improvement efforts. Variation in the use of the PQT tool’s reporting and tracking capabilities may contribute to differences in the effectiveness of local efforts to improve documentation practices.
9.2.2.3 Incomplete Uptake of Clinical Documentation Improvement (CDI) Programs and Variable Best Practice Implementation has Limited Potential Impact from These Programs
Recent industry trends toward increased tracking and reporting of clinical quality measures has caused many health care organizations to increase the scrutiny with which they examine medical documentation. This increased emphasis on proper documentation patterns has led to the development of clinical documentation improvement (CDI) programs across the industry (Towers, 2013; Danzi, 2000). These programs aim to improve provider documentation practices by providing training and education on compliant documentation to physicians, a skill that is not taught in medical school (Arrowood, 2013). There is significant heterogeneity across health care organizations in the approach to CDI program implementation, although a common model involves the hiring of dedicated CDI specialists (who can either be expert coders or nurses with a working knowledge of medical coding) to work with a physician advisor to promote documentation accuracy through performance measurement and provider education. Well-functioning CDI programs play a vital role in promoting accuracy and completeness of clinical documentation.
The national VHA HIM office provided guidance to facilities on implementing CDI programs by releasing the VHA CDI Program Guide in March 2013. This resource outlines several key objectives of CDI programs, including review of provider documentation for high-priority clinical records, promotion of provider buy-in, and provision of targeted provider education and training. Each facility was encouraged to implement a CDI program conforming to the objectives and specifications outlined in the program guide. Our assessment suggests that: (1) VAMC uptake of CDI programs has been incomplete; and (2) CDI program impact has been inconsistent across participating facilities.
VAMC uptake of CDI programs has been incomplete. We found that VAMCs have not uniformly adopted CDI programs. According to the 2014 HIM Inventory, 46 percent of VAMCs reported having a CDI program (compared to 31 percent of VAMCs in 2013).454 Lack of facility-level support for these programs appears to be one barrier to more widespread adoption.455
454 2014 HIM Inventory (N=134) 455 Site visit HIM chief interviews (N=21)

Assessment F (Workflow – Clinical)
The views, opinions, and/or findings contained in this report are those of the assessment team and should not be construed as an official government position, policy, or decision.
217
CDI program impact has been inconsistent across participating facilities. Our analysis suggests variability in the approach that facilities have taken to CDI program implementation. For instance, we would expect to see consistent implementation of provider querying for VAMCs with CDI programs, given that provider querying is a core activity promoted by CDI. However, we found that 3 of the 43 (7 percent) VAMCs (complexity level 1a, 1b, 1c, and 2) reporting CDI program implementation submit queries on less than 0.1 percent of encounters, suggesting limited use of the provider query process in spite of CDI program adoption.456 In addition, we found that while 57 percent of the highest-performing VAMCs on provider query responsiveness do have CDI programs, overall query responsiveness for VAMCs with CDI programs is only slightly higher than for VAMCs without CDI programs (58 percent versus 51 percent).457 This data suggests that while some VAMCs may have implemented particularly effective practices as part of their CDI efforts, not all facilities have been as effective with their CDI program implementations.
VAMCs implementing CDI have reported varying degrees of success with their locally-designed programs. For example, the Lexington VAMC has driven improvements in measured clinical quality and accurate patient classification through its CDI program (see case study below). However, not all VAMCs have experienced the same outcomes, as illustrated by on local HIM chief who stated, “We recently implemented a CDI program here but we haven’t yet seen the results we were hoping for. We would love to know what is working at other facilities.” These facility-level differences in CDI effectiveness and variability in implementation of core CDI components may indicate gaps in VHA’s national approach to local CDI program implementation.
Table 9-3. VAMC Case Study: CDI Program Implementation
Best practice case study – Lexington VAMC
The Lexington VAMC has implemented a CDI program to promote documentation improvement and accurate capture of data to reflect the quality of care delivered by the facility.
Details
Dedicated one CDI specialist to manage to facility’s program and to work directly with clinicians on documentation improvement and training
Designated a CDI physician advisor to champion CDI efforts and provide training to physicians on documentation issues
Implemented the “Madison Model” patient classification assessment tools to ensure review of patient records with high-priority clinical conditions to ensure that documentation and coding of these records accurately captures patient complexity
456 Physician Query Tracking (PQT) tool (FY2014); 2014 HIM Inventory (N=134) 457 Four of the seven facilities with query response rates over 80 percent participate in the CDI program
Assessment F (Workflow – Clinical)
The views, opinions, and/or findings contained in this report are those of the assessment team and should not be construed as an official government position, policy, or decision.
218
Best practice case study – Lexington VAMC
Impact
In one year, the facility moved from a one-star rating to a five-star rating based on improved capture of measures that contribute to clinical quality
System-wide Focus on Coding Standards has Resulted in Coding Performance Typically Meeting or Exceeding Private Sector Benchmarks
Coding is the process by which clinical documentation is translated into industry standard medical codes. This process is performed by medical coders who are trained to assign medical codes consistently and appropriately based on provider documentation. Maintaining coding accuracy is of critical importance because coding data is used for various secondary purposes (e.g., billing, analytics, quality reporting). Medical coding professional associations recommend that hospitals set a minimum coding accuracy target of 95 percent (AHIMA, 2008).458 In addition to accuracy targets, hospital organizations also commonly set targets for coding timeliness to ensure that records can be closed and sent to payors for billing, facilitating prompt revenue collection. Timeliness targets vary across organizations, but are typically set between three and seven days after discharge (HCPro, 2011).
Our assessment indicates that VHA performance on coding timeliness (e.g., time from patient discharge to coding) and accuracy (e.g., reliability of coding based on existing clinical documentation) is closely aligned with private sector benchmarks. According to the most recent national VHA audit of 10 randomly-selected facilities, the overall inpatient coding accuracy rate was found to be 93 percent.459,460 With respect to coding timeliness, recent VHA data indicates an average inpatient coding turnaround time of four days after discharge.461 Our analysis suggests the following as key drivers of high performance:
9.2.3.1 Visibility into performance through establishment of clear coding targets and performance tracking supports transparency and improvement
9.2.3.2 Regular application of coder auditing by internal coding experts at the facility-level yields feedback loop to identify inaccuracies and improve performance
9.2.3.3 Use of coding software that incorporates best practice features (e.g., error checking, decision support) facilitates coding accuracy
458 Note that accuracy in this context refers to inter-coder reliability, or the extent to which an expert coder would
assign the same medical codes based on existing clinical documentation; high coding accuracy means that does not necessarily mean that codes represent a patient’s true condition, as insufficient or inaccurate provider documentation may inhibit optimal assignment of codes
459 VHA Coding and Billing Audit Results (2013-2014) 460 As mentioned in the introduction of this section, we did not independently verify this result (e.g., through a
coding audit). 461 VHA HIM Executive Summary (2014)

Assessment F (Workflow – Clinical)
The views, opinions, and/or findings contained in this report are those of the assessment team and should not be construed as an official government position, policy, or decision.
219
9.2.3.1 Visibility Into Performance Through Establishment of Clear Coding Targets and Performance Tracking Supports Transparency and Improvement
The ability to accurately monitor performance trends over time is a key enabler of performance improvement. This has been shown across a variety of health care domains, including patient safety and operational efficiency (Donaldson, 2005). In order to ensure high performance for medical coding professionals distributed across VHA’s national geographic footprint, visibility into performance is key to promoting improvement. Implementation and sound practices to promote high medical coding performance was evidenced by: (1) establishment of clear medical coding performance targets across the organization; and (2) development of an executive summary dashboard for medical coding performance tracking.
Establishment of clear medical coding performance targets across the organization. VHA Handbook 1907.03: Health Information Management Clinical Coding Program Procedures establishes clear performance standards across a number of critical performance domains (VHA, 2012). For example, a consistent, national coding accuracy standard is set at 95 percent, consistent with benchmarks established in private industry. We found that establishment of this standard has created remarkable consistency in target-setting across the organization, as evidenced by 97 percent of VAMCs reporting establishment of accuracy targets aligned with national targets.462 Development of an executive summary dashboard for medical coding performance tracking. In support of the organization’s efforts to promote timely and accurate coding, VHA disseminates a quarterly health information management executive summary dashboard to facilitate performance comparisons and tracking of improvements over time. This dashboard, first published at the beginning of FY2013, highlights performance across a number of key coding metrics, including time from discharge to coding and presence of unsigned progress notes. This tool contributes to VHA’s coding performance by providing a tool for consistent tracking of performance across the organization and identification of improvement opportunities.
9.2.3.2 Regular Application of Coder Auditing by Internal Coding Experts at the Facility-level Yields Feedback Loop to Identify Inaccuracies and Improve Performance
For high-performing hospital organizations, compliance of medical coding practices is critical to ensuring accurate capture of clinical data, identifying potential gaps in capabilities of coders, and protecting against allegations of fraud and abuse. Regular auditing of medical coding is a key process to ensure coding compliance (Prophet, 1998). Assurance of compliant coding practices across VHA are supported by: (1) clear guidance on expectations for coder auditing procedures; and (2) consistent adoption of coder auditing procedures at the facility level.
462 VHA 2014 HIM Inventory (N=134)
Assessment F (Workflow – Clinical)
The views, opinions, and/or findings contained in this report are those of the assessment team and should not be construed as an official government position, policy, or decision.
220
Clear guidance on expectations for coder auditing procedures. As outlined above, VHA’s national HIM office has established clear expectations regarding quality assurance processes for medical coding, as outlined in VHA Handbook 1907.03 (VHA, 2012). In addition to establishment of a clear 95 percent performance target, the handbook also specifies that “coder assigned codes [be] reviewed internally by a qualified coder at the highest level of knowledge and skill, or by utilizing an external coding consultation group that has knowledge of and experience in VA coding practices and requirements.” This guidance provides clear expectations to VAMC HIM leadership on the processes expected to ensure compliance of medical coding practices. In addition, we found the practice of performing regular internal audits of coding quality to be consistent with the practices in place at high-performing provider organizations.463 Consistent adoption of coder auditing procedures at the facility level. Our interviews during site visits and information from national datasets suggest that coder audits have been consistently implemented across VHA. Responses captured in the 2014 HIM Inventory indicate that 89 percent of facilities conduct regular or routine auditing of coding staff.464 While 25 percent of facilities report contracting for external coding audit services, our interviews with facility-level HIM chiefs suggest that the majority of the auditing is conducted by experienced coders at the facility-level.465 These practices have driven high rates of accuracy for medical coding, as suggested by a national accuracy rate of 93 percent from the most recent national audit and self-reported performance from the data call, wherein respondents reported an average accuracy rate of approximately 93 percent during the last 15 months.466 Implementation of monthly coder auditing creates a regular feedback cycle that accelerates identification of challenges and performance improvements. Among HIM staff responding to our survey, 83 percent indicated that coders receive feedback regarding the accuracy of their medical coding at least quarterly; 89 percent of these respondents reported that monthly audits were either “very effective” or “somewhat effective” at identifying errors and changing behaviors.467 These survey responses suggest that regular coder auditing may contribute to accurate assignment of codes across the organization.
9.2.3.3 Use of Coding Software That Incorporates Best Practice Features (e.g., error checking, decision support) Facilitates Coding Accuracy
The process of medical coding has become increasingly reliant on electronic systems during the past decade, introducing the need for effective software systems to support coding functions
463 Interview with a large national provider organization with robust proprietary revenue cycle capabilities 464 2014 HIM Inventory (N=134) 465 2014 HIM Inventory (N=134); site visit HIM chief interviews (N=21) 466 Choice Act data call (N=40) 467 Choice Act survey (N=29)

Assessment F (Workflow – Clinical)
The views, opinions, and/or findings contained in this report are those of the assessment team and should not be construed as an official government position, policy, or decision.
221
(Towers, 2013). VHA currently uses the Nuance Clintegrity 360 suite of products to support its coding efforts across the organization. Our assessment found that the software tools currently in place for VHA support the efforts of coders to accurately assign codes to patient records. Specifically, our assessment suggests that: (1) VHA’s medical encoder software incorporates features to support coding accuracy; and (2) users report high degree of satisfaction with existing coding software.
VHA’s medical encoder software incorporates features to support coding accuracy. Given the current complexities of medical code assignment, qualified medical coders rely on software platforms to support accurate code assignment to clinical encounters. The medical encoder used within the Clintegrity 360 system in place at VAMCs nationally is the Quadramed encoder. This product is a standard coding tool that is also used by 12 percent of organizations within the private sector, making it the second most common medical encoder in use throughout the industry (HCPro, 2011). Our site visit (shadowing observations of medical coders) suggested that VHA’s coding software incorporates critical features to support accurate coding assignment, including decision support and error checking tools, reporting and auditing capabilities, and educational resources (e.g., online code books).468 According to our survey, 60 percent of HIM staff reported referencing decision support tools included within the encoder at least several times per week,469 and 90 percent reported that these resources are either “highly effective” or “somewhat effective” at identifying and preventing errors in medical coding.470 Users report high degree of satisfaction with existing coding software. Our site visit shadowing sessions and on-site interviews with medical coders and HIM leadership revealed overall satisfaction with VHA’s coding tools. Facility-level HIM chiefs voiced their satisfaction with VHA’s current coding product, with 95 percent of site visits interviewees indicating that VHA’s code editing software meets coding needs.471 These views were corroborated by our survey, wherein 90 percent of HIM staff rated VHA’s medical coding systems as “very easy to use” or “moderately easy to use.”472 Finally, satisfaction with existing capabilities of current coding tools was indicated by findings from our documentation and coding assessment workshops: of the >200 potential improvement ideas suggested to enhance VHA’s documentation and coding performance, none suggested changing the organization’s medical encoder or incorporating new features.473
468 Site visit medical coding shadowing observations (N=10) 469 Choice Act survey (N=25) 470 Choice Act survey (N=29) 471 Site visit HIM chief interviews (N=21) 472 Choice Act survey (N=31) 473 Site visit documentation and coding assessment workshops (N=20)
Assessment F (Workflow – Clinical)
The views, opinions, and/or findings contained in this report are those of the assessment team and should not be construed as an official government position, policy, or decision.
222
9.3 Recommendations
VHA documentation and coding practices have multiple stakeholders: Congress and the Executive branch, VACO, VHACO, VISN leadership, and VAMC management and staff. Encouraging innovation and addressing critical challenges in documentation and coding will require collaboration among all of these groups, and a commitment to making difficult, long-term change. Different recommendations should be owned by different groups (e.g., recommendation requiring changes to VACO policy versus local policy) -- however, support for change from all stakeholders is critical to effective implementation.
Our recommendations, building on existing strengths and addressing existing challenges in documentation and coding, can be categorized into two main themes.
9.3.1 Increase local prioritization of clinical documentation through acceleration of national CDI program and targeted provider education and training, supported by performance management at the facility and provider level
9.3.2 Strengthen provider documentation standards (e.g., management of clinical templates, EHR review process) to promote optimal capture of patient information and improve resulting resource management
These themes are consistent with practices suggested by the academic literature, professional associations, and high-performing hospitals within VHA and outside the system, as well as solutions proposed by front-line VHA staff – this information is included in "summary of supporting evidence" sections in each sub-recommendation (see Appendix F.4 for additional detail on our methodology for gathering this data). To help VHA implement our recommendations, we have also suggested next steps in the "potential near-term actions" sections of the sub-recommendations. Note, because different VAMCs may have already adopted some recommended practices or experience unique barriers, these suggestions should be tailored the individual circumstances of each VAMC. Each recommendation is supported by several sub-recommendations, which map to the “organization, workflow processes, and tools” domains specified in the Choice Act. For a detailed map of how the sub-recommendations relate to these domains, see Table F-2 in Appendix F.3.
Several recommendations overlap with other assessment areas. Where this occurs, we have referenced the relevant assessment area, which has additional detail.
Increase Local Prioritization of Clinical Documentation Through Acceleration of National CDI Program and Targeted Provider Education and Training, Supported by Performance Management at the Facility and Provider Level
As noted in section 9.2.1, one of VHA’s key challenges in promoting accurate documentation and coding is a lack of understanding across various organizational levels regarding the importance of documentation and coding practices for VHA. Changes in the culture surrounding the importance of documentation and coding could increase the integrity of data contained in

Assessment F (Workflow – Clinical)
The views, opinions, and/or findings contained in this report are those of the assessment team and should not be construed as an official government position, policy, or decision.
223
VHA’s systems, increasing opportunities for revenue collection and improving VHA’s internal resource allocation and quality measurement capabilities.
To facilitate the needed cultural change, we recommend the following:
9.3.1.1 Incorporate documentation metrics into regular performance reviews for both providers and facilities
9.3.1.2 Reinforce CDI program by providing targeted guidance on national documentation priority areas and by creating a national information-sharing network for CDI best practice sharing
9.3.1.3 Develop and deploy provider educational and training programs to address unique VHA documentation needs and reemphasize the importance of documentation for Veterans and the organization
9.3.1.1 Incorporate Documentation Metrics Into Regular Performance Reviews for Both Providers and Facilities
Our assessment revealed evidence of low prioritization of documentation and coding across the organization. Establishment of stronger performance management systems focused on documentation and coding performance could improve prioritization organization-wide. VHA should use enhanced data transparency and performance management systems to motivate VAMC efforts to improve clinical documentation.
Summary of supporting evidence:
See Section 9.2.1.3 for more detail on findings.
Proposals from staff participating in on-site workshops suggest front-line support for increased transparency and performance management, with 60 percent of sites recommending increased provider accountability for documentation performance as a solution to improve performance474
Experience from a high-performing hospital organization demonstrates the effectiveness of incorporating documentation metrics (e.g., responsiveness to queries, timeliness of discharge summary completion, presence of unsigned progress notes, improvements in provider case-mix over time) into performance reviews to promote improved documentation practices (see case study in Section 9.2.1)
Potential near term actions:
VHACO: Incorporate composite documentation and coding quality metric into the national SAIL report for facility-level performance tracking.
o VHACO: Review documentation quality metrics currently tracked within HIM reports and other national data sources (e.g., allocation resource center data, patient case mix data) to identify critical performance tracking metrics.
474 Site visit documentation and coding assessment workshops (N=20)
Assessment F (Workflow – Clinical)
The views, opinions, and/or findings contained in this report are those of the assessment team and should not be construed as an official government position, policy, or decision.
224
o VHACO: Align on a single metric that reflects the quality of local clinical documentation practices for incorporation into the SAIL report.
o VHACO: Confirm impact and determine appropriate roll-out of education and training to facilities on the impact of clinical documentation on the measurement of other metrics currently included within SAIL report (e.g., quality metrics).
VHACO/VAMC: Create a national provider performance dashboard to track documentation quality metrics at the individual provider level, enabling increased performance management at the local level.
o VHACO: Identify and increase emphasis on new and existing outcomes-oriented documentation quality metrics (e.g., percent of discharge summaries complete within 48 hours, number of unsigned progress notes) for tracking performance of local clinical service lines and individual providers.
o VHACO/VAMC: Provide education and training to facility-level chiefs of staff on capabilities of performance dashboard and recommended uses with local service line chiefs and physicians.
o VAMC: Assign responsibility for facility-level documentation performance to local chiefs of staff to signal documentation’s importance among providers.
o VAMC: Incorporate individualized documentation improvement goals within annual provider performance plans and reviews, reinforced by incentives for high performance on key metrics.
VACO/VHACO: Improve national capabilities for tracking impact of documentation practices on opportunities for billing and reimbursement.
o Refer to Assessment I for additional details.
9.3.1.2 Reinforce CDI Program by Providing Targeted Guidance on National Documentation Priority Areas and by Creating a National Information-sharing Network for CDI Best Practice Sharing
VHA has experienced difficulty in improving organization-wide documentation performance through current CDI efforts. Recommendations from industry professional organizations support the use of CDI programs to drive improvements in documentation practices. VHA should reinforce and improve current CDI efforts to support enhancements in provider documentation patterns and increased prioritization of accurate clinical documentation across VHA.
Summary of supporting evidence:
See Section 9.2.2.3 for more detail on findings.
Proposals from staff participating in on-site workshops demonstrate pockets of enthusiasm for CDI implementation at the local level, with 38 percent of facilities lacking

Assessment F (Workflow – Clinical)
The views, opinions, and/or findings contained in this report are those of the assessment team and should not be construed as an official government position, policy, or decision.
225
CDI programs recommending implementation to address documentation and coding challenges.475
Evidence from the academic literature suggests improvements in key documentation outcomes (e.g., percent correct DRG assignment) through implementation of CDI programs with dedicated CDI specialists (Hicks, 2003).
Experience of Lexington VAMC demonstrates potential to improve quality outcomes and optimize resource allocation through CDI efforts (see case study in Section 9.2.2.3).
Potential near term actions:
VHACO/VAMC: Focus national CDI efforts on a subset of priority documentation areas.
o VHACO/VAMC: Outline three to five priority clinical areas requiring documentation improvements (e.g., increased specificity in documenting heart failure) based on information captured nationally within the PQT tool and insights from facility-level HIM chiefs; rotate priority clinical areas periodically in response to documentation improvements and identification of new challenges.
o VHACO: Develop national educational materials regarding each priority area and how to promote documentation improvements (e.g., provider groups to target for education, clinical templates to facilitate comprehensive capture of required clinical data).
o VHACO: Track progress by outlining and following a set of targeted metrics expected to improve through effective CDI implementation (e.g., average case mix for patients with DRGs targeted by CDI efforts).
VHACO/VAMC: Create a national information-sharing network for dissemination of CDI best practices.
o VHACO/VAMC: Review key performance metrics (e.g., query responsiveness, changes in VERA allocations, changes in quality performance as measure by SAIL report) for sites that have implemented CDI programs, identifying sites that have experienced significant recent improvements.
o VHACO/VAMC: Engage with high-performing CDI facilities to identify common features of high-performers.
o VHACO/VAMC: Showcase practices and results of high performing facilities as part of existing HIM webcasts and in brief presentations to facility HIM chiefs and CDI specialists to promote broader program support and dissemination of best practices.
9.3.1.3 Develop and Deploy Provider Educational and Training Programs to Address Unique VHA Documentation Needs and Reemphasize the Importance of Documentation for Veterans and the Organization
Our assessment indicates that inconsistent provider training and education in documentation standards may be one driver of documentation challenges. High-performing hospital
475 Site visit documentation and coding assessment workshops (N=13)

Assessment F (Workflow – Clinical)
The views, opinions, and/or findings contained in this report are those of the assessment team and should not be construed as an official government position, policy, or decision.
226
organizations have improved provider documentation through consistent, targeted provider training and education programs. We recommend targeted improvements to current VHA provider documentation training and education practices to address these difficulties and ensure appropriate messaging regarding documentation’s critical role for the organization.
Summary of supporting evidence:
See Section 9.2.1.2 for more detail on findings.
Proposals from staff participating in on-site workshops indicate nearly universal support for increased provider documentation training, with 95 percent of sites recommending increased provider education and training to improve documentation practices.476
Studies within the academic literature have demonstrated positive impact on provider documentation patterns following targeted training and education (Danzi, 2000).
Experience of Durham VAMC suggests that effective provider training supports accurate documentation and improvement in secondary metrics based on coding (e.g., accurate measurement of case mix) (see case study in Section 9.2.1.2).
Potential near term actions:
VHACO: Develop national communication and training materials to reinforce the key role of documentation within VHA and to address VHA-specific documentation needs.
o VHACO: Align on coherent national messaging (e.g., accurate documentation improves quality of care for Veterans and supports increased revenue collection locally to address priority facility-level needs) to promote documentation improvement efforts from key clinical stakeholders.
o VHACO: Prepare provider training materials addressing the components of documentation that are unique within VHA context.
o VHACO: Develop national, service-line specific provider documentation “tip cards” addressing common documentation pitfalls associated with different service lines.
VAMC: Develop local strategies for continuous provider education and training on documentation issues.
o VAMC: Deliver an in-person, peer-led education session establishing a common understanding regarding the proper role of documentation for VHA.
o VAMC: Establish expectations for mandatory provider attendance at occasional, service-line specific trainings addressing key facility-level and service-line specific priority documentation issues.
o VAMC: Offer additional targeted training opportunities at the request of service line chiefs (e.g., individualized training for providers with high query volumes, service line training for service line documentation challenges) to address priority issues as they arise at the facility level.
476 Site visit documentation and coding assessment workshops (N=20)

Assessment F (Workflow – Clinical)
The views, opinions, and/or findings contained in this report are those of the assessment team and should not be construed as an official government position, policy, or decision.
227
VAMC: Create local systems to allow for provider input on desired documentation training topics and align training sessions with common provider challenges and concerns.
Strengthen Provider Documentation Standards (e.g., management of clinical templates, EHR review process) to Promote Optimal Capture of Patient Information and Improve Resulting Resource Management
VHA HIM and clinical staff commonly reported documentation patterns that are misaligned with industry best practice. Efforts to address these challenges has the potential to improve the quality of clinical documentation and resultant medical coding, improving care for Veterans as well as VHA’s ability to optimize third party revenue collections.
To bring about desired improvements in VHA documentation patterns, we recommend the following:
9.3.2.1 Eliminate duplicative clinical templates and standardize requirements for new template creation
9.3.2.2 Strengthen EHR reviews to ensure appropriate use of copy-paste, including implementation of CPRS tool to automate the process
9.3.2.3 Implement standardized processes for following up on outstanding provider queries and improve provider accountability for query responsiveness
9.3.2.1 Eliminate Duplicative Clinical Templates and Standardize Requirements for New Template Creation
Our interactions with providers and coders during site visits indicated that appropriate template use and management are common challenges to optimal documentation across VAMCs. Recommendations from industry professional associations emphasize the benefits of clinical templates to coding accuracy, documentation readability, and ICD-10 readiness. VHA should improve its template management and use practices to improve coder efficiency and increase the organization’s readiness for the upcoming ICD-10 transition.
Summary of supporting evidence:
See Section 9.2.2.1 for more detail on findings.
Proposals from staff participating in on-site workshops emphasize the need for improved template management and use practices, with 75 percent of sites recommending this solution to improve current documentation practices.477
Recommendations from industry professional organizations indicate potential benefits in documentation completion, documentation quality, coder productivity, and coding accuracy from clinical template usage (Clark, 2012).
477 Site visit documentation and coding assessment workshops (N=20)

Assessment F (Workflow – Clinical)
The views, opinions, and/or findings contained in this report are those of the assessment team and should not be construed as an official government position, policy, or decision.
228
Experience of Palo Alto VAMC demonstrates opportunity to streamline the number and design of clinical templates to improve documentation consistency (see case study in Section 9.2.2).
Potential near term actions:
VHACO: Maintain a national “template library” to allow sharing among facilities and promote broader adoption of effective clinical templates.
o VACO/VHACO: Create national online resource for posting and downloading national example clinical templates and to promote inter-VAMC sharing of locally adapted templates.
o VHACO: Conduct national materials request to aggregate high-performing clinical templates developed at the local level.
o VHACO: Review locally-developed templates to create best practice national example clinical templates for priority clinical note types.
o VHACO: Ensure that design of national example clinical templates is consistent with VHA’s data interoperability and data standards goals (refer to Assessment H report for additional detail).
VAMC: Conduct local review of existing provider templates to identify opportunities to streamline and improve templates across note types.
o VAMC: Eliminate duplicative templates based on current frequency of use and effectiveness of design (e.g., comprehensiveness, readability).
o VAMC: Create a standard listing of preferred provider templates for inpatient notes across disciplines and note types (e.g., surgery history and physical template, cardiology consultation template).
VHACO/VAMC: Strengthen local criteria for creation of new templates to ensure optimal design and avoid unnecessary duplication.
o VHACO/VAMC: Ensure inclusion of coders on local and national EHR review committees to ensure that their views (e.g., impact on coding efficiency, inclusion of all data necessary to code optimally) are represented when considering development of new clinical templates.
o VAMC: Use standard checklists from professional associations to ensure that new templates meet industry standards for quality and necessity (see Figure F-3 in Appendix F.5).
9.3.2.2 Strengthen EHR Reviews to Ensure Appropriate use of Copy-paste, Including Implementation of CPRS Tool to Automate the Process
Our analysis indicates that EHR quality reviews undertaken at the facility level have not entirely addressed challenges with clinical documentation practices. Although the majority of facilities have processes in place to review the EHR, it appears that gaps remain in the ability of these reviews to improve documentation practices. Implementation of consistent, comprehensive EHR quality reviews are recommend by professional coding associations to ensure

Assessment F (Workflow – Clinical)
The views, opinions, and/or findings contained in this report are those of the assessment team and should not be construed as an official government position, policy, or decision.
229
documentation compliance and quality. VHA should improve its current EHR quality review process to ensure that documentation integrity is maintained across VHA.
Summary of supporting evidence:
See Section 9.2.2.1 for more detail on findings.
Proposals from staff participating in on-site workshops suggest consistent desire to improve documentation, with 50 percent of sites recommending targeted enhancements to CPRS to promote more consistent documentation practices; many of the proposals focused on addressing the inappropriate use of copy-paste.478
Recommendations from coding professional organizations highlight the need for regular review of clinical documentation through EHR audits to ensure appropriate documentation practices (Arrowood, 2013).
Interview findings indicate that VHA is in the process of incorporating a copy-paste identification feature within CPRS, which is expected to be released in June 2015 and will automate identification of copy-paste usage to facilitate further review.479
Potential near term actions:
VHACO/VAMC: Enhance local processes for reviewing copy-paste use within CPRS through targeted national guidance and implementation of supporting tools.
o VHACO: Proceed with organization-wide launch of automated copy-paste identification tool and train local facility HIM leadership on the tool’s functionality to drive increased efficiency and effectiveness of local chart review.
o VAMC: Develop local policies to address inappropriate use of copy-paste (e.g., provider notification standards, training requirements for providers found to be noncompliant, remedial actions for pattern of repeat inappropriate use).
o VAMC: Incorporate expectations regarding appropriate copy-paste use within national provider educational and training sessions (see recommendation 9.3.1.2).
9.3.2.3 Implement Standardized Processes for Following up on Outstanding Provider Queries and Improve Provider Accountability for Query Responsiveness
Our analysis of data from VHA’s PQT tool indicates that provider query efforts have been hampered by low provider responsiveness. High-performing private sector hospital systems have developed robust query processes with clear expectations and accountability for responsiveness to promote documentation improvements. VHA should implement tactical improvements to query practices currently in place across the organization to help promote timely provider accessibility of queries and increased overall responsiveness.
Summary of supporting evidence:
See Section 9.2.2.2 for more detail on findings.
478 Site visit documentation and coding assessment workshops (N=20) 479 Interview with VHACO leadership

Assessment F (Workflow – Clinical)
The views, opinions, and/or findings contained in this report are those of the assessment team and should not be construed as an official government position, policy, or decision.
230
Evidence from industry surveys suggests that alternative processes for submitting and answering queries may supplement email-based querying to improve responsiveness (ACDIS, 2011).
Recommendations from professional associations indicate that providing outcomes data on key query metrics promotes increased provider responsiveness to queries (Towers, 2013).
Potential near term actions:
VHACO/VAMC: Provide national training and guidance to facility-level HIM chiefs on use VHA’s PQT tool to track query responsiveness at the individual provider level.
o VHACO: Disseminate educational materials and best practice suggestions for using PQT tool’s reporting capabilities to promote transparency and improved performance.
o VAMC: Track and report individual-level outcomes on key physician query metrics (e.g., volume of queries, response rate).
VAMC: Clarify local processes and expectations regarding provider responses to coder queries.
o VAMC: Develop standard processes at the local level to follow up on unresolved queries, including query notification methods outside of email when providers do not initially respond (see Figure F-4 in Appendix F.5 for an illustrative provider follow-up process).
o VAMC: Incorporate expectations for provider responsiveness to queries within local bylaws and general rules.
o VAMC: Outline local performance management procedures to address provider query unresponsiveness (e.g., notification standards, training requirements for providers found to be noncompliant, remedial actions for continued unresponsiveness).
Potential Opportunity
We have outlined a series of recommendations to address VHA’s current documentation and coding challenges. The expected benefits to VHA of improving documentation practices are both financial and non-financial. With respect to financial benefits, recent OIG reports indicate that VHA has the potential to increase revenue collection through improved documentation and coding practices on encounters that could be submitted to third-party insurers for reimbursement (OIG, 2012; OIG, 2011).480 Another financial benefit from improved documentation is the ability to appropriately match budgetary allocations to VAMCs through VERA; we did not attempt to quantify the size of this opportunity. Finally, several non-financial benefits would result from improved coding, including improved data abstraction regarding
480 These revenue estimates capture the opportunity size from improvement to both inpatient and outpatient
encounters; opportunity size is based on improvements to documentation, capture of patient insurance information, and coding (e.g., accurate indication of patient service connection status).

Assessment F (Workflow – Clinical)
The views, opinions, and/or findings contained in this report are those of the assessment team and should not be construed as an official government position, policy, or decision.
231
quality of care, increased insight into true Veteran demographic and health status trends, and improved epidemiologic tracking of disease.
Assessment F (Workflow – Clinical)
The views, opinions, and/or findings contained in this report are those of the assessment team and should not be construed as an official government position, policy, or decision.
232
This page intentionally left blank.

Assessment F (Workflow – Clinical)
The views, opinions, and/or findings contained in this report are those of the assessment team and should not be construed as an official government position, policy, or decision.
A-1
Appendix A Detailed Methodology To ensure a broad range of sources, our assessment draws upon national data sets, national surveys, expert interviews, and visits to select VAMCs across the country, at which we conducted interviews, focus groups, and observations. Given Assessment F’s focus on inpatient care, we have chosen to only visit VAMCs providing inpatient care, and no other types of facilities.
A.1 VAMC Site Selection
To increase consistency and generalizability of findings, assessment teams have coordinated our sampling methods to the extent possible while ensuring the sampling methodology reflected assessment-specific considerations. We have selected a core set of VAMCs to visit, which are representative of the VAMC system as a whole across critical facility demographic and performance outcome metrics.
The VAMC site selection process followed the following steps:
1. Stratification of facilities: Stratified random sampling, with VISN as strata, was used to select an initial long-list of facilities. To reduce sample size, a subset of VISNs was randomly selected, from which one of the two initially selected sites was randomly de-selected.
2. Review of distribution: Chi-square testing was used on each of the key facility profile and performance variables to ensure the distribution of scores in the sample is representative of the population. Variables were chosen to reflect anticipated drivers of facility performance, and included: VISN, rurality, adjusted admissions, complexity level (on VHA rating scale), adjusted LOS, patient satisfaction, cumulative access score, and facility age.
3. Refinement of facility selection: Initial facility list was vetted with internal and external SMEs and augmented as needed, to include facilities that are considered critical for inclusion (e.g., a Polytrauma Center, facilities with innovative tools/practice) and ensure that all selected facilities had the range of services being assessed.
This method resulted in a sample of 23 facilities that is representative across each of the criteria used in selection. Assessment F then deselected the three complexity level 3 sites chosen as part of the initial sample, as these facilities do not provide extensive inpatient services and were therefore not of interest for our assessment. We retested the representativeness of the sample, and found that the sample of 20 level 1 and 2 facilities was still representative across our key criteria.
We also visited Miami as a case study, per the recommendation of VHA experts that Florida would be of particular interest given its growing Veteran population and unique challenges. This resulted in a total of 21 VAMC site visits (20 randomly selected VAMCs and 1 case study).
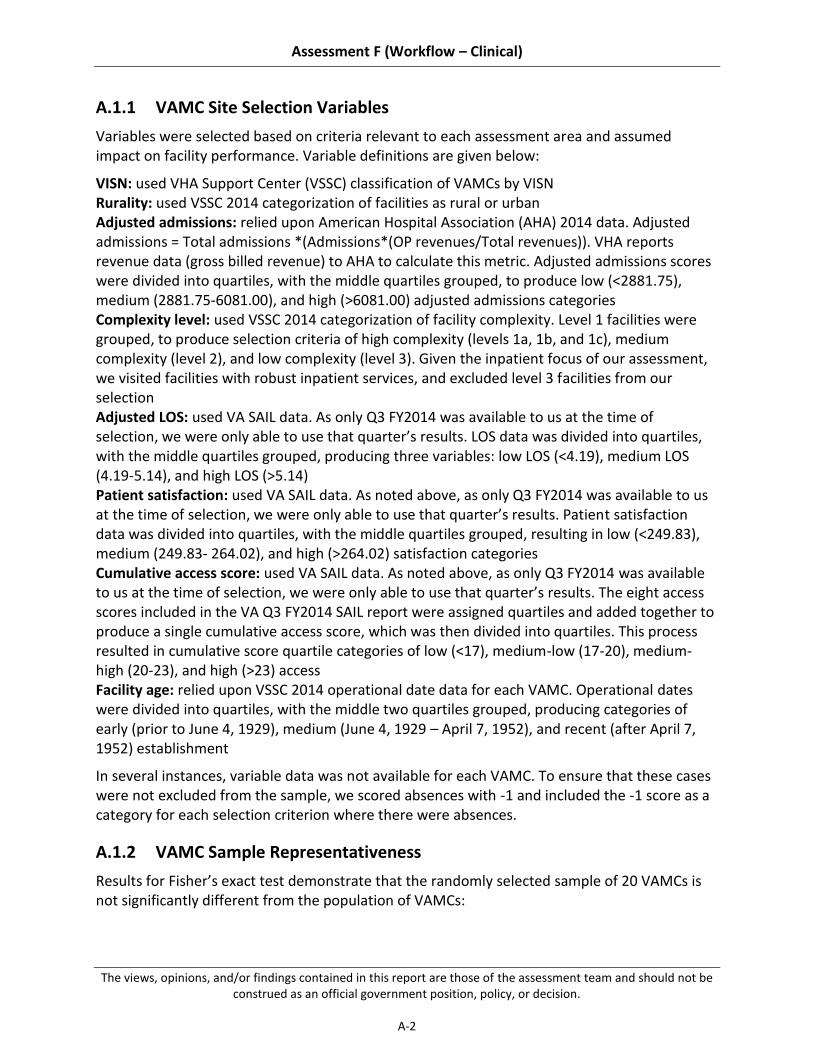
Assessment F (Workflow – Clinical)
The views, opinions, and/or findings contained in this report are those of the assessment team and should not be construed as an official government position, policy, or decision.
A-2
A.1.1 VAMC Site Selection Variables
Variables were selected based on criteria relevant to each assessment area and assumed impact on facility performance. Variable definitions are given below:
VISN: used VHA Support Center (VSSC) classification of VAMCs by VISN Rurality: used VSSC 2014 categorization of facilities as rural or urban Adjusted admissions: relied upon American Hospital Association (AHA) 2014 data. Adjusted admissions = Total admissions *(Admissions*(OP revenues/Total revenues)). VHA reports revenue data (gross billed revenue) to AHA to calculate this metric. Adjusted admissions scores were divided into quartiles, with the middle quartiles grouped, to produce low (<2881.75), medium (2881.75-6081.00), and high (>6081.00) adjusted admissions categories Complexity level: used VSSC 2014 categorization of facility complexity. Level 1 facilities were grouped, to produce selection criteria of high complexity (levels 1a, 1b, and 1c), medium complexity (level 2), and low complexity (level 3). Given the inpatient focus of our assessment, we visited facilities with robust inpatient services, and excluded level 3 facilities from our selection Adjusted LOS: used VA SAIL data. As only Q3 FY2014 was available to us at the time of selection, we were only able to use that quarter’s results. LOS data was divided into quartiles, with the middle quartiles grouped, producing three variables: low LOS (<4.19), medium LOS (4.19-5.14), and high LOS (>5.14) Patient satisfaction: used VA SAIL data. As noted above, as only Q3 FY2014 was available to us at the time of selection, we were only able to use that quarter’s results. Patient satisfaction data was divided into quartiles, with the middle quartiles grouped, resulting in low (<249.83), medium (249.83- 264.02), and high (>264.02) satisfaction categories Cumulative access score: used VA SAIL data. As noted above, as only Q3 FY2014 was available to us at the time of selection, we were only able to use that quarter’s results. The eight access scores included in the VA Q3 FY2014 SAIL report were assigned quartiles and added together to produce a single cumulative access score, which was then divided into quartiles. This process resulted in cumulative score quartile categories of low (<17), medium-low (17-20), medium-high (20-23), and high (>23) access Facility age: relied upon VSSC 2014 operational date data for each VAMC. Operational dates were divided into quartiles, with the middle two quartiles grouped, producing categories of early (prior to June 4, 1929), medium (June 4, 1929 – April 7, 1952), and recent (after April 7, 1952) establishment
In several instances, variable data was not available for each VAMC. To ensure that these cases were not excluded from the sample, we scored absences with -1 and included the -1 score as a category for each selection criterion where there were absences.
A.1.2 VAMC Sample Representativeness
Results for Fisher’s exact test demonstrate that the randomly selected sample of 20 VAMCs is not significantly different from the population of VAMCs:

Assessment F (Workflow – Clinical)
The views, opinions, and/or findings contained in this report are those of the assessment team and should not be construed as an official government position, policy, or decision.
A-3
Table A-1. Fisher’s Exact Test Results
numerical_complexity_level_variable (p-value for Fisher's Exact Test: 0.84)
Population % pop Selected % Selected Difference
-1 2 2% 0 0% -2%
1 88 72% 16 80% 8%
2 32 26% 4 20% -6%
Total 122 100% 20 100%
rurality_numerical_variable (p-value for Fisher's Exact Test: 0.72)
Population % pop Selected % Selected Difference
0 15 12% 3 15% 3%
1 107 88% 17 85% -3%
Total 122 100% 20 100%
adjusted_admissions_quartile (p-value for Fisher's Exact Test: 0.88)
Population % pop Selected % Selected Difference
-1 18 15% 2 10% -5%
1 16 13% 2 10% -3%
2 56 46% 9 45% -1%
3 32 26% 7 35% 9%
Total 122 100% 20 100%
adjusted_los_quartile (p-value for Fisher's Exact Test: 0.81)
Population % pop Selected % Selected Difference
-1 28 23% 3 15% -8%
1 18 15% 2 10% -5%
2 49 40% 10 50% 10%
3 27 22% 5 25% 3%
Total 122 100% 20 100%
adjusted_patient_satisfaction_quartile (p-value for Fisher's Exact Test: 0.91)
Population % pop Selected % Selected Difference
-1 28 23% 3 15% -8%
1 27 22% 5 25% 3%
2 47 39% 8 40% 1%
3 20 16% 4 20% 4%
Total 122 100% 20 100%

Assessment F (Workflow – Clinical)
The views, opinions, and/or findings contained in this report are those of the assessment team and should not be construed as an official government position, policy, or decision.
A-4
cumulative_access_score_quartile (p-value for Fisher's Exact Test: 0.85)
Population % pop Selected % Selected Difference
-1 27 22% 3 15% -7%
1 28 23% 7 35% 12%
2 25 20% 4 20% 0%
3 23 19% 3 15% -4%
4 19 16% 3 15% -1%
Total 122 100% 20 100%
operational_date_quartile (p-value for Fisher's Exact Test: 0.86)
Population % pop Selected % Selected Difference
1 29 24% 5 25% 1%
2 56 46% 8 40% -6%
3 37 30% 7 35% 5%
Total 122 100% 20 100%
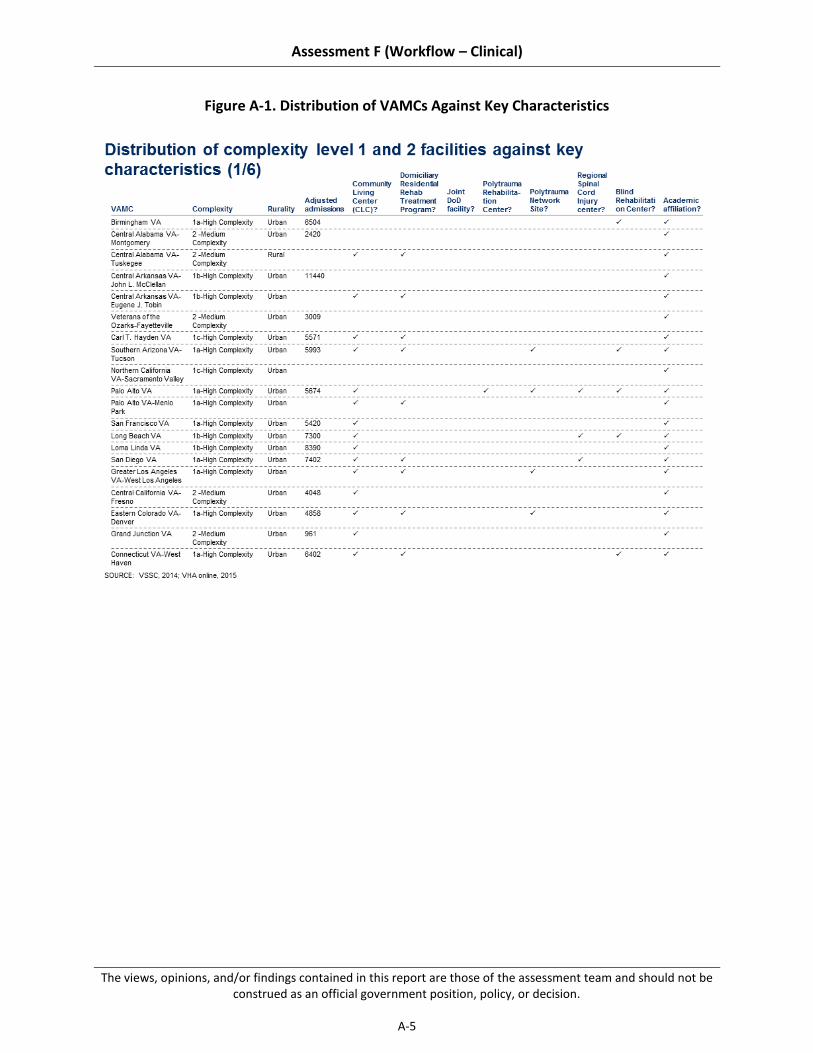
Assessment F (Workflow – Clinical)
The views, opinions, and/or findings contained in this report are those of the assessment team and should not be construed as an official government position, policy, or decision.
A-5
Figure A-1. Distribution of VAMCs Against Key Characteristics
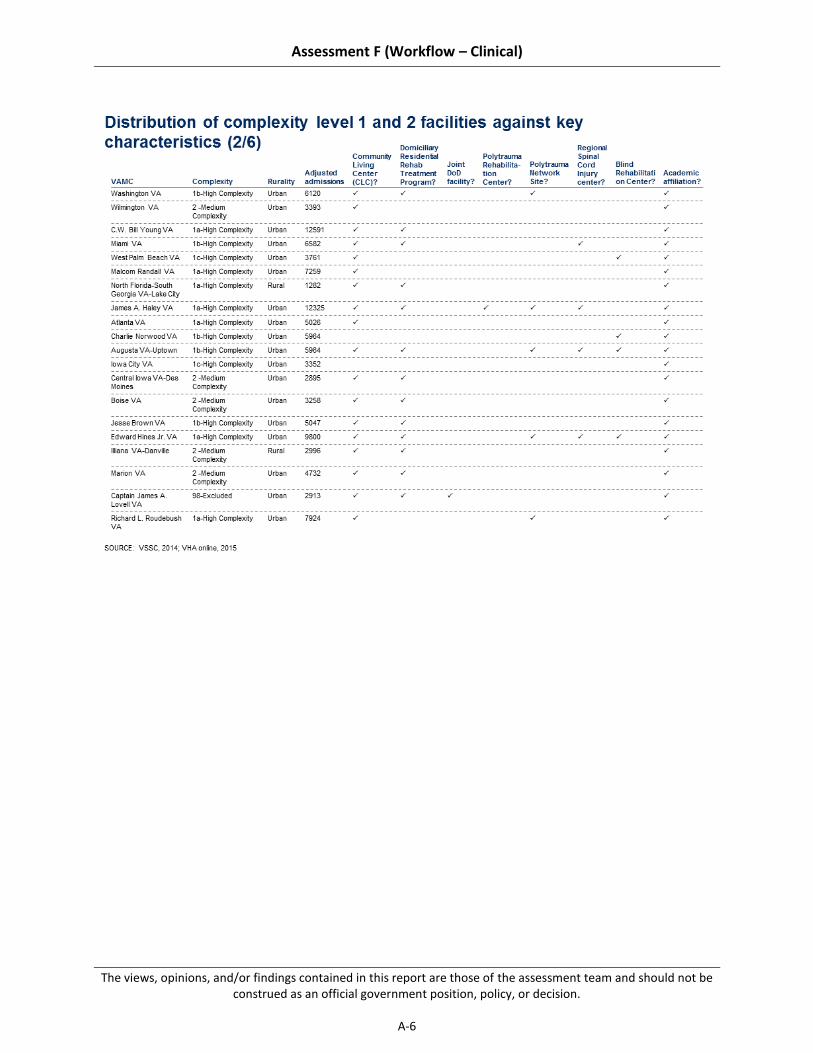
Assessment F (Workflow – Clinical)
The views, opinions, and/or findings contained in this report are those of the assessment team and should not be construed as an official government position, policy, or decision.
A-6

Assessment F (Workflow – Clinical)
The views, opinions, and/or findings contained in this report are those of the assessment team and should not be construed as an official government position, policy, or decision.
A-7

Assessment F (Workflow – Clinical)
The views, opinions, and/or findings contained in this report are those of the assessment team and should not be construed as an official government position, policy, or decision.
A-8

Assessment F (Workflow – Clinical)
The views, opinions, and/or findings contained in this report are those of the assessment team and should not be construed as an official government position, policy, or decision.
A-9
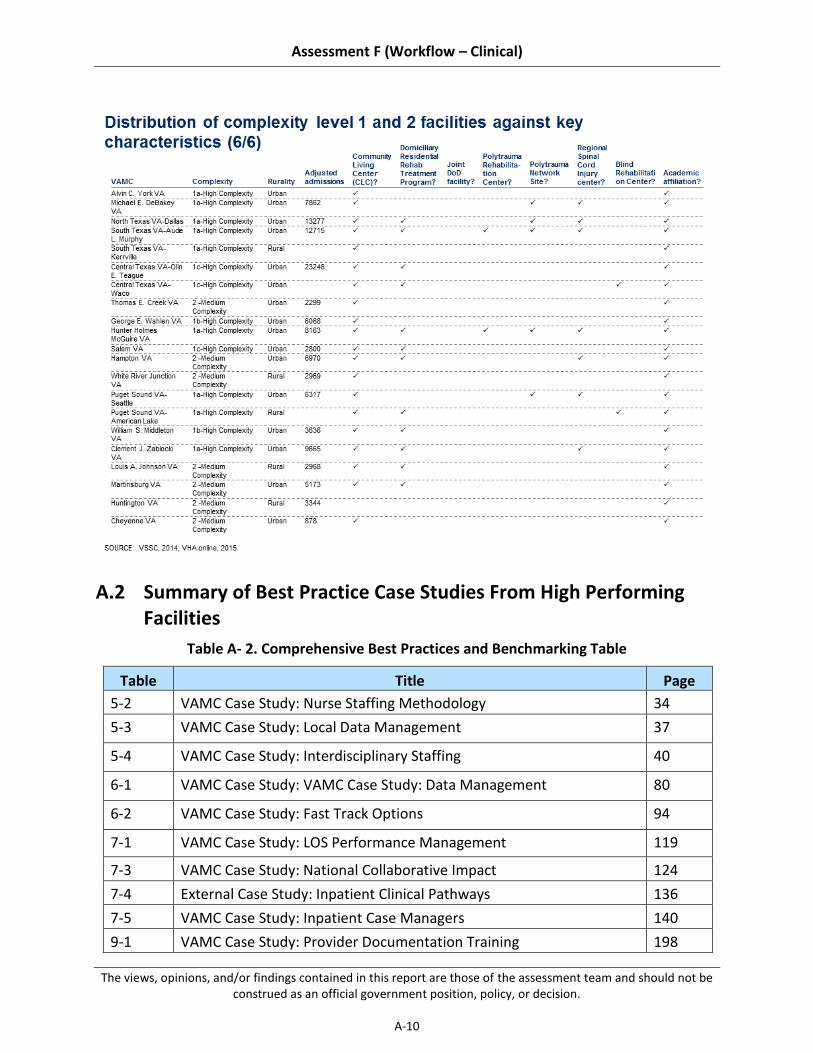
Assessment F (Workflow – Clinical)
The views, opinions, and/or findings contained in this report are those of the assessment team and should not be construed as an official government position, policy, or decision.
A-10
A.2 Summary of Best Practice Case Studies From High Performing Facilities
Table A- 2. Comprehensive Best Practices and Benchmarking Table
Table Title Page
5-2 VAMC Case Study: Nurse Staffing Methodology 34
5-3 VAMC Case Study: Local Data Management 37
5-4 VAMC Case Study: Interdisciplinary Staffing 40
6-1 VAMC Case Study: VAMC Case Study: Data Management 80
6-2 VAMC Case Study: Fast Track Options 94
7-1 VAMC Case Study: LOS Performance Management 119
7-3 VAMC Case Study: National Collaborative Impact 124
7-4 External Case Study: Inpatient Clinical Pathways 136
7-5 VAMC Case Study: Inpatient Case Managers 140
9-1 VAMC Case Study: Provider Documentation Training 198

Assessment F (Workflow – Clinical)
The views, opinions, and/or findings contained in this report are those of the assessment team and should not be construed as an official government position, policy, or decision.
A-11
Table Title Page
9-2 External Case Study: Physician Documentation Performance Mgmt. 200
9-3 VAMC Case Study: CDI Program Implementation 211

Assessment F (Workflow – Clinical)
The views, opinions, and/or findings contained in this report are those of the assessment team and should not be construed as an official government position, policy, or decision.
A-12
This page intentionally left blank.
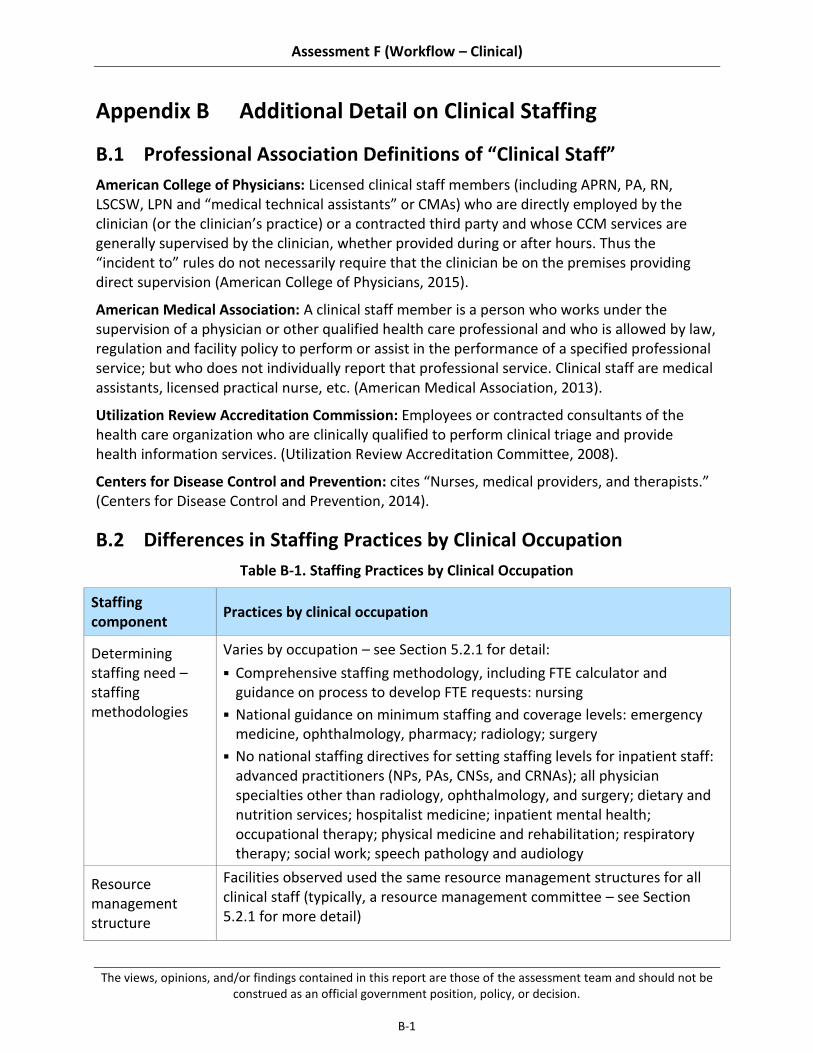
Assessment F (Workflow – Clinical)
The views, opinions, and/or findings contained in this report are those of the assessment team and should not be construed as an official government position, policy, or decision.
B-1
Appendix B Additional Detail on Clinical Staffing
B.1 Professional Association Definitions of “Clinical Staff”
American College of Physicians: Licensed clinical staff members (including APRN, PA, RN, LSCSW, LPN and “medical technical assistants” or CMAs) who are directly employed by the clinician (or the clinician’s practice) or a contracted third party and whose CCM services are generally supervised by the clinician, whether provided during or after hours. Thus the “incident to” rules do not necessarily require that the clinician be on the premises providing direct supervision (American College of Physicians, 2015).
American Medical Association: A clinical staff member is a person who works under the supervision of a physician or other qualified health care professional and who is allowed by law, regulation and facility policy to perform or assist in the performance of a specified professional service; but who does not individually report that professional service. Clinical staff are medical assistants, licensed practical nurse, etc. (American Medical Association, 2013).
Utilization Review Accreditation Commission: Employees or contracted consultants of the health care organization who are clinically qualified to perform clinical triage and provide health information services. (Utilization Review Accreditation Committee, 2008).
Centers for Disease Control and Prevention: cites “Nurses, medical providers, and therapists.” (Centers for Disease Control and Prevention, 2014).
B.2 Differences in Staffing Practices by Clinical Occupation
Table B-1. Staffing Practices by Clinical Occupation
Staffing component
Practices by clinical occupation
Determining staffing need – staffing methodologies
Varies by occupation – see Section 5.2.1 for detail:
Comprehensive staffing methodology, including FTE calculator and guidance on process to develop FTE requests: nursing
National guidance on minimum staffing and coverage levels: emergency medicine, ophthalmology, pharmacy; radiology; surgery
No national staffing directives for setting staffing levels for inpatient staff: advanced practitioners (NPs, PAs, CNSs, and CRNAs); all physician specialties other than radiology, ophthalmology, and surgery; dietary and nutrition services; hospitalist medicine; inpatient mental health; occupational therapy; physical medicine and rehabilitation; respiratory therapy; social work; speech pathology and audiology
Resource management structure
Facilities observed used the same resource management structures for all clinical staff (typically, a resource management committee – see Section 5.2.1 for more detail)
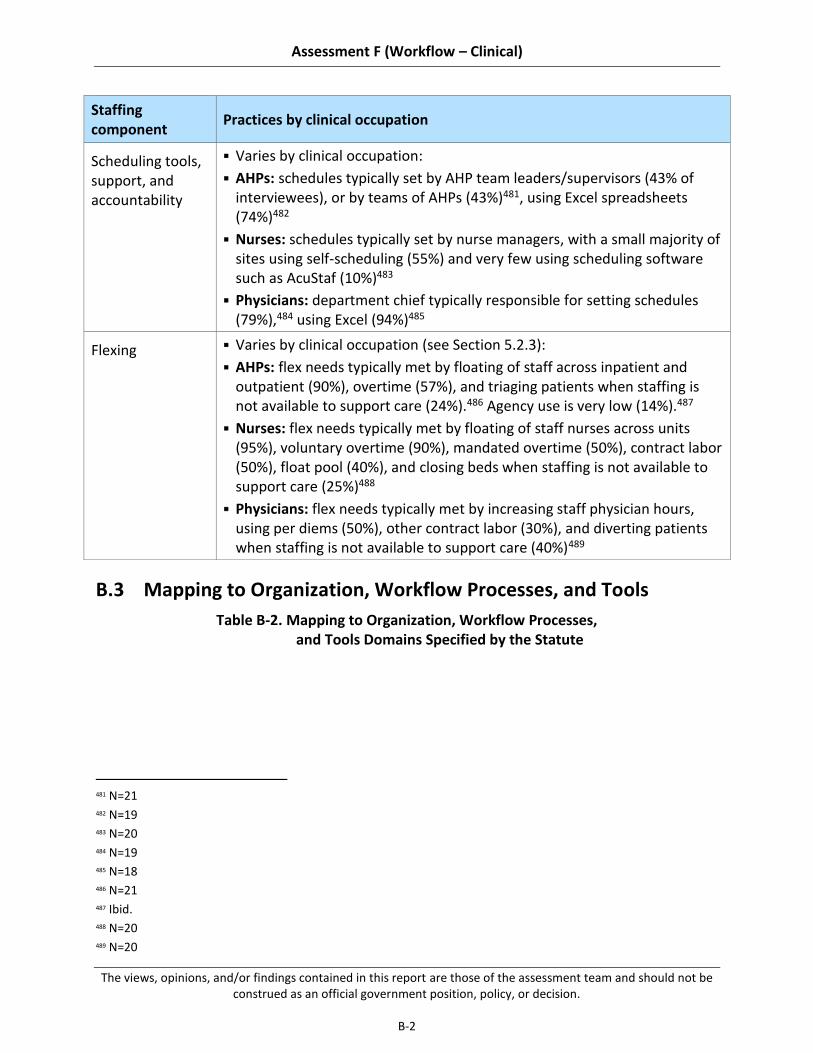
Assessment F (Workflow – Clinical)
The views, opinions, and/or findings contained in this report are those of the assessment team and should not be construed as an official government position, policy, or decision.
B-2
Staffing component
Practices by clinical occupation
Scheduling tools, support, and accountability
Varies by clinical occupation:
AHPs: schedules typically set by AHP team leaders/supervisors (43% of interviewees), or by teams of AHPs (43%)481, using Excel spreadsheets (74%)482
Nurses: schedules typically set by nurse managers, with a small majority of sites using self-scheduling (55%) and very few using scheduling software such as AcuStaf (10%)483
Physicians: department chief typically responsible for setting schedules (79%),484 using Excel (94%)485
Flexing Varies by clinical occupation (see Section 5.2.3):
AHPs: flex needs typically met by floating of staff across inpatient and outpatient (90%), overtime (57%), and triaging patients when staffing is not available to support care (24%).486 Agency use is very low (14%).487
Nurses: flex needs typically met by floating of staff nurses across units (95%), voluntary overtime (90%), mandated overtime (50%), contract labor (50%), float pool (40%), and closing beds when staffing is not available to support care (25%)488
Physicians: flex needs typically met by increasing staff physician hours, using per diems (50%), other contract labor (30%), and diverting patients when staffing is not available to support care (40%)489
B.3 Mapping to Organization, Workflow Processes, and Tools
Table B-2. Mapping to Organization, Workflow Processes, and Tools Domains Specified by the Statute
481 N=21 482 N=19 483 N=20 484 N=19 485 N=18 486 N=21 487 Ibid. 488 N=20 489 N=20

Assessment F (Workflow – Clinical)
The views, opinions, and/or findings contained in this report are those of the assessment team and should not be construed as an official government position, policy, or decision.
B-3
Findings and recommendations Organization Workflow processes
Tools
5.2.1: VHA does not have the tools or data to set or monitor staffing levels appropriately
5.2.1.1: The nursing service has developed a comprehensive, evidence-based staffing methodology, though other occupations lack clear guidance on assessing staffing need
5.2.1.2: Some facilities manage data well locally; however, VHA as a whole does not consistently capture and track data needed to assess the appropriateness of staffing
5.2.1.3: Resource management is siloed by service line, resulting in inconsistent decision-making that does not always match needs
5.2.1.4: Local resource management decision-making does not always reflect national service line staffing guidance
5.2.2: Hiring timeline significantly exceeds private sector benchmarks, affecting ability to fill vacancies
5.2.2.1: Hiring requirements (e.g., credentialing, boarding) are complex and time-consuming
5.2.2.2: Local hiring processing is reported to be inefficient
5.2.2.3: Attracting talented clinical staff can be a challenge due to low pay compared to private sector in many geographies
5.2.3: Allocation of staff does not consistently match patient care need
5.2.3.1: Hospital operating models are skewed toward clinic hours
5.2.3.2: Access to flex resources is limited, inhibiting ability to meet peaks in demand or manage short-term understaffing
5.3.1 Increase transparency of staffing by providing evidence-based staffing methodologies for all clinical staff and improving data management
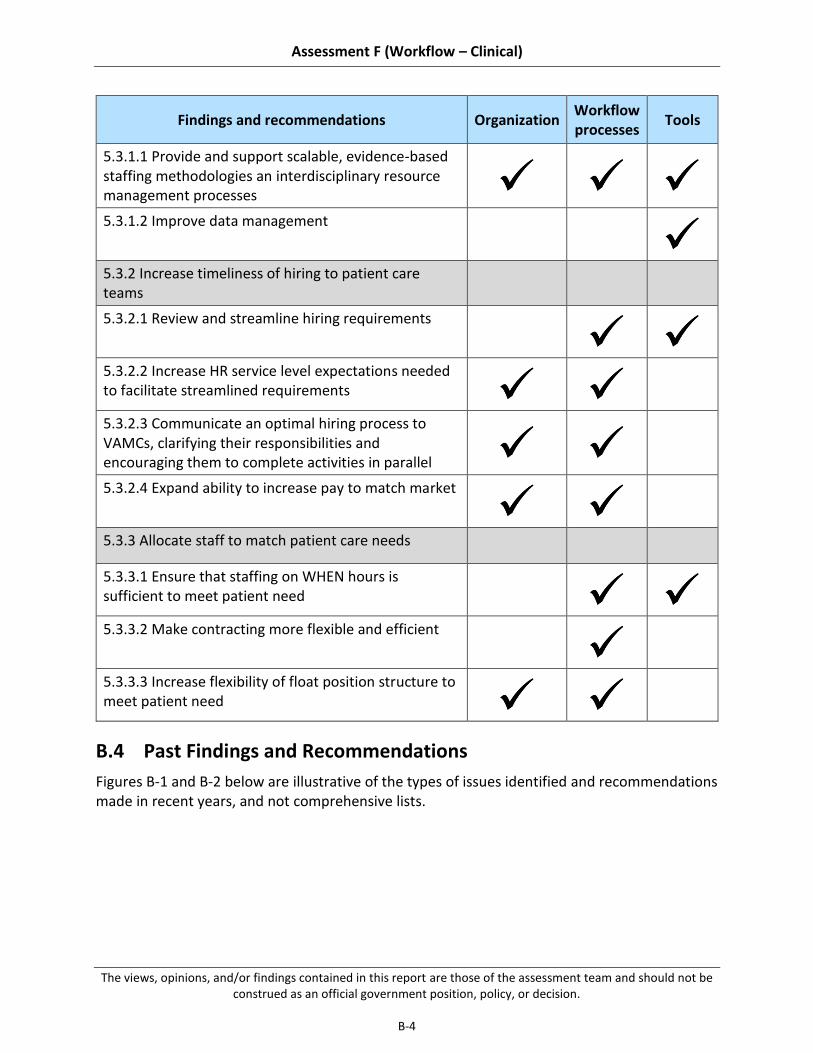
Assessment F (Workflow – Clinical)
The views, opinions, and/or findings contained in this report are those of the assessment team and should not be construed as an official government position, policy, or decision.
B-4
Findings and recommendations Organization Workflow processes
Tools
5.3.1.1 Provide and support scalable, evidence-based staffing methodologies an interdisciplinary resource management processes
5.3.1.2 Improve data management
5.3.2 Increase timeliness of hiring to patient care teams
5.3.2.1 Review and streamline hiring requirements
5.3.2.2 Increase HR service level expectations needed to facilitate streamlined requirements
5.3.2.3 Communicate an optimal hiring process to VAMCs, clarifying their responsibilities and encouraging them to complete activities in parallel
5.3.2.4 Expand ability to increase pay to match market
5.3.3 Allocate staff to match patient care needs
5.3.3.1 Ensure that staffing on WHEN hours is sufficient to meet patient need
5.3.3.2 Make contracting more flexible and efficient
5.3.3.3 Increase flexibility of float position structure to meet patient need
B.4 Past Findings and Recommendations
Figures B-1 and B-2 below are illustrative of the types of issues identified and recommendations made in recent years, and not comprehensive lists.

Assessment F (Workflow – Clinical)
The views, opinions, and/or findings contained in this report are those of the assessment team and should not be construed as an official government position, policy, or decision.
B-5
Figure B-1. Previous Reports’ Findings

Assessment F (Workflow – Clinical)
The views, opinions, and/or findings contained in this report are those of the assessment team and should not be construed as an official government position, policy, or decision.
B-6
Figure B-2. Previous Reports’ Recommendations
B.5 Downshifting by Role, Based on Data Call
Table B-3. Change in Staffing
Best / standard practice % change
in staffing Level 1 and 2 complexity VAMC % change in staffing (based on
data call)
Dept490 All WHEN shifts Weeknights Weekend days Weekend nights
490 Clinical staff and auxiliary support staff not listed were not included due to lack of responses to data call

Assessment F (Workflow – Clinical)
The views, opinions, and/or findings contained in this report are those of the assessment team and should not be construed as an official government position, policy, or decision.
B-7
ED MDs: 0%491
RNs: 0%492
CNAs: 0%493
EMS: no clear best practice
MDs: -40-45% 494
RNs: -20-25%495
CNAs: -70-75%496
EMS: -60-65%497
MDs: -30-35%
RNs: -20-25%
CNAs: -55-60%
EMS: -45-50%
MDs: -30-35%
RNs: 0 to -5%
CNAs: -55-60%
EMS: -100%
Med / Surg
Hospitalists and/or LIPs: 0%63
RNs: -8%64
CNAs: -28%64
EMS: no clear best practice
Hospitalists: -60-65%498
LIPs: -90-95%499
RNs: -10-15%500
CNAs: -40-45%501
EMS: -65-70%502
Hospitalists: -55-60%
LIPs: -75-80%
RNs: -10-15%
CNAs: -35-40
EMS: -80-85%
Hospitalists: -70-75%
LIPs: -95-100%
RNs: -35-40%
CNAs: -50-55%
EMS: -80-85%
ICU MDs: depends on
intensity of day-time staffing503
RNs: -564
CNAs: -7%64
EMS: no clear best practice
MDs: -85-90%504
RNs: 40-45%505
CNAs: -55-60%506
EMS: -95-100%507
MDs: -65-70%
RNs: 0-5%
CNAs: -60-65%
EMS: -70-75%
MDs: -85-90%
RNs: 0 to -5%
CNAs: -55-60
EMS: -100%
491 Best practice, based on the academic literature, suggests that WHEN staffing should approximately match
weekday staffing, especially on weekend days (Cavallazzi et al., 2010; Ananthakrishnan et al., 2009; Aujesky et al., 2009; Shaheen et al., 2009; Peberdy et al., 2008; Kostis et al., 2007)
492 Standard practice, drawn from hospital survey data (Labor Management Institute, 2014) 493 Ibid. 494 N=14 495 N=8 496 N=4 497 N=2 498 N=15 499 N=9. Includes inpatient medicine and inpatient surgery units 500 N=21. Includes inpatient medicine and inpatient surgery units. 501 N=15. Includes inpatient medicine and inpatient surgery units. 502 N=7. Includes inpatient medicine and inpatient surgery units 503 The literature is mixed on the effect of night-time intensivists on patient outcomes. However, recent studies
appear to be converging on the view that staffing night-time intensivists improves outcomes for facilities with low-intensity day-time intensivist staffing (i.e., optional intensivist consultation) and has no significant effect on facilities with high-intensity day-time intensivist staffing (i.e., mandatory intensivist consultation or where intensivist has primary responsibility for patient care) (Wallace et al., 2012). This finding corroborates earlier literature finding positive effects of night-time intensivist coverage in facilities with low-intensity day-time coverage (Blunt and Burchett, 2000) and no effects in facilities with high-intensity day-time coverage (Kerlin et al., 2013; Gajic et al., 2008).
504 N=6 505 N=6 506 N=4 507 N=2

Assessment F (Workflow – Clinical)
The views, opinions, and/or findings contained in this report are those of the assessment team and should not be construed as an official government position, policy, or decision.
B-8
Hospital-wide508
PTs: no clear best practice
OTs: no clear best practice
RTs: no clear best practice
Speech and audiology: no clear best practice
PTs: -100%509
OTs: -100%510
RTs: -30-35%511
Speech and audiology: -95-100%512
PTs: -85-90%
OTs: -85-90%
RTs: -40-45%
Speech and audiology: -75-80%
PTs: -100%
OTs: -100%
RTs: -45-50%
Speech and audiology: -100%
B.6 Best Practices and Benchmarks
Table B-4. Clinical Staffing – Best Practices and Benchmarks
Category Component Best practice / benchmark
Organization Staffing ratio513 Ensure physician, NP, and PA staffing appropriate to each care setting:
Hospital-wide: 1 staff physician to 3.7 occupied beds (Sanofi, 2014);514 1 resident physician to 2.9 occupied beds (Sanofi, 2014);515 1 PA to 9.1 occupied beds (Sanofi, 2014)516
Critical care ICU: 1 intensivist to 14 patients (Ward et al., 2013)517; use of high-intensity model (i.e., mandatory intensivist consultation or closed ICU) rather than low-intensity model (no intensivist or
508 Where best or standard practices are not department-specific (e.g., for staff that serve multiple departments) 509 N=23 510 N=21 511 N=20 512 N=13 513 Percentages and ratios refer to day shift. 514 Industry standard practice, based on Sanofi survey of hospitals. Figure is hospital-wide, and refers to multi-
hospital systems (MHS). Sanofi provides data on MHS and non-MHS hospitals. We judged MHS systems to be a more appropriate benchmark for the VA integrated health care system than non-MHS hospitals. Figure reported as 0.27 physicians per occupied bed, converted to physician-to-occupied bed ratio.
515 See footnote 3 for detail on source. Figure reported as 0.35 physicians per occupied bed, converted to physician-to-occupied bed ratio.
516 See footnote 3 for detail on source. Figure reported as 0.11 PAs per occupied bed, converted to PA-to-occupied bed ratio.
517 Figure represents best practice; Ward et al. found that outcomes worsened after the intensivist-to-patient ratio dropped below 1:14.

Assessment F (Workflow – Clinical)
The views, opinions, and/or findings contained in this report are those of the assessment team and should not be construed as an official government position, policy, or decision.
B-9
Category Component Best practice / benchmark
elective intensivist consultation) (Pronovost et al., 2002)518
Med/Surg: : at least 0.13 hospitalists per 1,000 adjusted patient days (Epané and Weech-Maldonado, 2015)519
ED: 1 ED physician to 2.2 patients per hour (Phoenix Physicians, 2011; Collins, 2009)520
Ensure RN, CNA, and LPN/LVN staffing appropriate to each care setting (Labor Management Institute, 2014)521,522:
Hospital-wide: N/A
Critical care ICU: 1 RN to 1.8 patients, 1 CNA to 9 patients, and if LPNs/LVNs are used, 1 LPN/LVN to 5.9 patients523
Med/Surg: 1 RN to 4.8 patients, 1 CNA to 8.7 patients , and if LPNs/LVNs are used, 1 LPN/LVN to 11.9 patients524
ED: 1 RN to 6 patents, 1 CNA to 10.9 patients, and if LPNs/LVNs are used, 1 LPN/LVN to 3.5 patients 525
518 Pronovost et al. find that high-intensity intensivist staffing models are associated with reduced mortality and
LOS. 519 Epané and Weech-Maldonado found high-intensity hospitalist staffing (defined as mandatory intensivist
consultation or closed ICU; represented upper quartile of their sample, 0.13 – 24.06 hospitalists per 1,000 adjusted patient days) reduced LOS.
520 Figure is an average of best practice recommendations by the American College of Emergency Physicians (1.8 to 2.8 patients per physician per hour) and a white paper by Phoenix Physicians (2 to 2.25 patients per physician per hour).
521 LPN/LVN roles are gradually being phased out of most private sector facilities via attrition, per recommendation of the Institute of Medicine (Institute of Medicine, 2011). Having a lower LPN/LVN-to-patient ratio than that seen in Labor Management Institute survey data should not necessarily be taken as meaning a facility is not meeting best practice.
522 CNA-to-patient ratios seen in the Labor Management Institute survey day may reflect use of sitters to meet 1:1 patient needs in many hospitals (e.g., for suicidal patients). If sitters are not used in a VAMC, CNA-to-patient ratios may need to be greater than ratios seen in private facilities.
523 Results in nurse staffing model composition of 66% RNs, 20% LPNs/LVNs, and 13% CNAs. 524 Results in nurse staffing model composition of 51% RNs, 21% LPNs/LVNs, and 28% CNAs. 525 Results in nurse staffing model composition of 31% RNs, 53% LPNs/LVNs, and 17% CNAs. The ratio of CNAs to
patients seen in EDs surveyed by the Labor Management Institute may be relatively high because EDs are consistently using ancillary support roles such as unit clerks and transporters to perform clerical and transport functions. While VAMCs should also ensure that these supporting roles are used to support nurses and nursing assistants, if they do not consistently staff unit clerks and transporters, they should likely use a CNA-to-patient ratio closer to that seen on the floors (~1:9).

Assessment F (Workflow – Clinical)
The views, opinions, and/or findings contained in this report are those of the assessment team and should not be construed as an official government position, policy, or decision.
B-10
Category Component Best practice / benchmark
Ensure AHP and therapy assistant staffing appropriate to providing inpatient care across the facility, based on best estimates in currently limited literature: 526
PTs: ICU, 2 hrs/bd.dy (Ridoutt et al., 2006); Med/Surg, 0.3-0.5 hrs/bd.dy (Christie and Grimwood, 2006); average across hospital setting, 1.3 hrs/bd.dy (Allied Health in Rehabilitation Consultative Committee, 2007; Australasian Faculty of Rehabilitation Medicine, 2005)527
OTs: Med/Surg, 0.1-0.3 hrs/bd.dy (Christie and Grimwood, 2006); average across hospital setting, 1.2 hrs/bd.dy (Allied Health in Rehabilitation Consultative Committee, 2007; Australasian Faculty of Rehabilitation Medicine, 2005)
Speech pathologists: average across hospital setting, 0.6 hrs/bd.dy (Allied Health in Rehabilitation Consultative Committee, 2007; Australasian Faculty of Rehabilitation Medicine, 2005)
Dieticians: average across hospital setting, 0.4 hrs/bd.dy (Allied Health in Rehabilitation Consultative Committee, 2007; Australasian Faculty of Rehabilitation Medicine, 2005)
Podiatrists: average across hospital setting, 0.1 hrs/bd.dy (Allied Health in Rehabilitation Consultative Committee, 2007; Australasian Faculty of Rehabilitation Medicine, 2005)
Clinical psychiatrists: average across hospital setting, excluding mental health units, 0.4 hrs/bd.dy (Allied Health in Rehabilitation Consultative Committee, 2007; Australasian Faculty of Rehabilitation Medicine, 2005)
526 Estimating AHP staffing need is an issue industry-wide, with no clear consensus on best practice data and
methodology to support AHP staffing decision-making. As Cartmill et al. write, “The evidence for use of staffing ratios for allied health practitioners is scarce and lags behind the fields of nursing and medicine” (Cartmill et al., 2012, 1). We have drawn on such guidance as does exist in the literature, though this research is far less definitive than the body of work on nurse and physician staffing. For further discussion of challenges in AHP staffing decision-making, see Fraher et al., 2011.
527 Allied Health in Rehabilitation Consultative Committee and Australasian Faculty of Rehabilitation Medicine averages taken from each organization’s published standards for amputation, arthritis, burns, cardiac, head injury, major multi-trauma, neurological, orthopedic, pain, pulmonary, spinal, amputation (acute), amputation (rehab), and TBI.
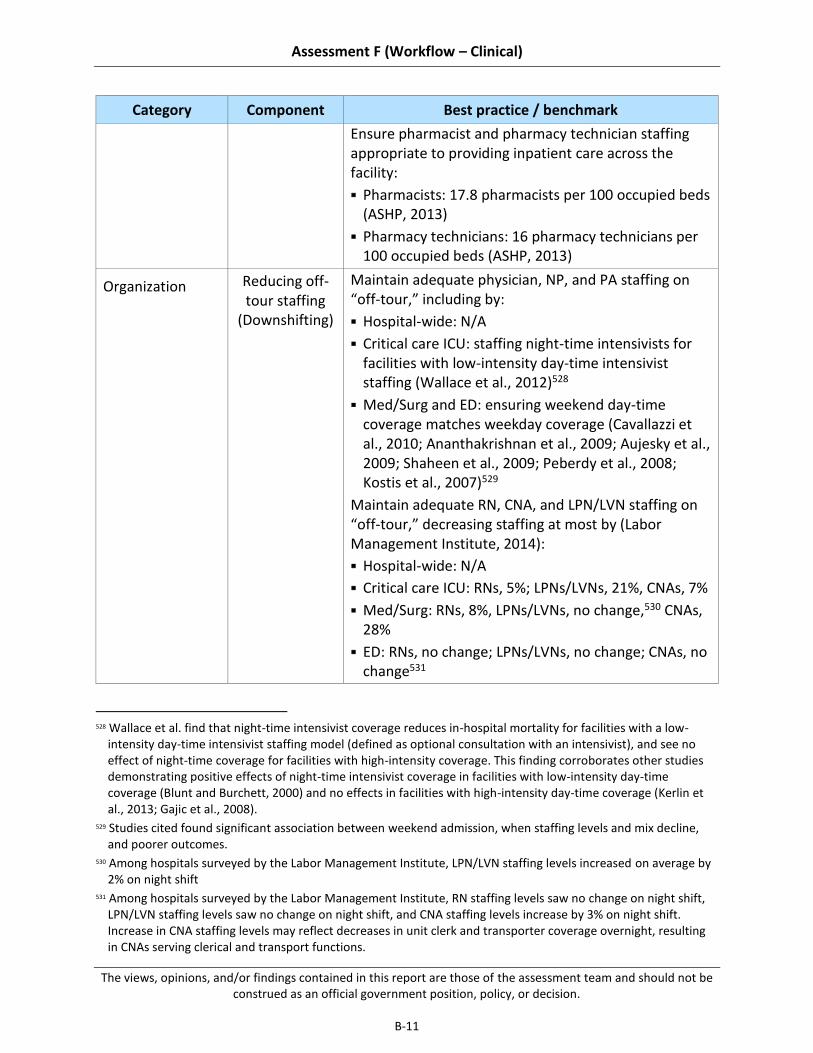
Assessment F (Workflow – Clinical)
The views, opinions, and/or findings contained in this report are those of the assessment team and should not be construed as an official government position, policy, or decision.
B-11
Category Component Best practice / benchmark
Ensure pharmacist and pharmacy technician staffing appropriate to providing inpatient care across the facility:
Pharmacists: 17.8 pharmacists per 100 occupied beds (ASHP, 2013)
Pharmacy technicians: 16 pharmacy technicians per 100 occupied beds (ASHP, 2013)
Organization Reducing off-tour staffing
(Downshifting)
Maintain adequate physician, NP, and PA staffing on “off-tour,” including by:
Hospital-wide: N/A
Critical care ICU: staffing night-time intensivists for facilities with low-intensity day-time intensivist staffing (Wallace et al., 2012)528
Med/Surg and ED: ensuring weekend day-time coverage matches weekday coverage (Cavallazzi et al., 2010; Ananthakrishnan et al., 2009; Aujesky et al., 2009; Shaheen et al., 2009; Peberdy et al., 2008; Kostis et al., 2007)529
Maintain adequate RN, CNA, and LPN/LVN staffing on “off-tour,” decreasing staffing at most by (Labor Management Institute, 2014):
Hospital-wide: N/A
Critical care ICU: RNs, 5%; LPNs/LVNs, 21%, CNAs, 7%
Med/Surg: RNs, 8%, LPNs/LVNs, no change,530 CNAs, 28%
ED: RNs, no change; LPNs/LVNs, no change; CNAs, no change531
528 Wallace et al. find that night-time intensivist coverage reduces in-hospital mortality for facilities with a low-
intensity day-time intensivist staffing model (defined as optional consultation with an intensivist), and see no effect of night-time coverage for facilities with high-intensity coverage. This finding corroborates other studies demonstrating positive effects of night-time intensivist coverage in facilities with low-intensity day-time coverage (Blunt and Burchett, 2000) and no effects in facilities with high-intensity day-time coverage (Kerlin et al., 2013; Gajic et al., 2008).
529 Studies cited found significant association between weekend admission, when staffing levels and mix decline, and poorer outcomes.
530 Among hospitals surveyed by the Labor Management Institute, LPN/LVN staffing levels increased on average by 2% on night shift
531 Among hospitals surveyed by the Labor Management Institute, RN staffing levels saw no change on night shift, LPN/LVN staffing levels saw no change on night shift, and CNA staffing levels increase by 3% on night shift. Increase in CNA staffing levels may reflect decreases in unit clerk and transporter coverage overnight, resulting in CNAs serving clerical and transport functions.

Assessment F (Workflow – Clinical)
The views, opinions, and/or findings contained in this report are those of the assessment team and should not be construed as an official government position, policy, or decision.
B-12
Category Component Best practice / benchmark
Maintain adequate AHP staffing on “off-tour,” including by:
Hospital-wide: providing weekend physical therapy service for inpatients (Brusco et al., 2007)532
Critical care ICU, Med/Surg, and EDU: other best practices for AHP downshifting have not yet been clearly established in the literature
Processes Flex labor sources
Prioritize use of float pool nurses rather than agency and travel nurses (Strzalka and Havens, 1996)533
Limit use of agency and travel nurses to <2% to total number of nursing hours worked (Labor Management Institute, 2014)534
Tools Scheduling tools
Use self-scheduling for nurses (Hung, 2002; Teahan, 1998)535
Use predictive scheduling models for roles without set shifts and large cohorts (Ernst et al., 2004; Warner and Prawda, 1972)
B.7 Additional Detail on Past Reform Efforts
ORGANIZATION
Limited exercise and existence of recruitment and retention authorities (e.g., ability to incent retention and use of Title 38 positions) (VA OIG, 2004a)
High turnover (VA OIG, 2004a)
Insufficient staffing mix (VA OIG, 2011)
Siloed resource management organization and processes (GAO, 2015)
Inconsistent and insufficient clinical care support staffing (OIG, 2004a)
Inefficiency in contracting for temporary labor (OIG, 2010)
532 Study found decreased LOS for patients who received Monday through Saturday physical therapy, as compared
to a control group receiving Monday through Friday therapy. 533 Strzalka and Havens found that float pool nurses performed better than agency nurses on key clinical indicators. 534 Based on Labor Management Institute survey data, finding mean average of agency to total number of nursing
hours worked of 1.3%, and mean average of traveler to total number of nursing hours worked of 1.7%. 535 Use of self-scheduling is associated with reduced managerial time spent on scheduling, improved nurse morale,
and some decreases in turnover due to improved morale.
Assessment F (Workflow – Clinical)
The views, opinions, and/or findings contained in this report are those of the assessment team and should not be construed as an official government position, policy, or decision.
B-13
PROCESSES
Inconsistent or problematic implementation of standardized staffing methodologies (VA OIG, 2011; 2013; GAO, 2015)
No clear staffing methodology or targets (e.g., productivity standards) (VA OIG, 2015; 2012; 2009; 2006; 2006; 2004; 2004)
Lengthy HR process delaying hiring (GAO, 2015; VA OIG, 2004; 2009)
Overly high use of overtime and informal floating to meet flex needs (OIG, 2004)
Excessive downshifting resulting in insufficient staffing on off-tour (OIG, 2011; 2009)
TOOLS
Unreliable or non-existent staffing data (VA OIG, 2015; 2012)
B.8 Description of clinical Staffing Site Visit Assessment Workshop Improvement Idea Generation Process
Our site visits provided an opportunity to generate potential improvement ideas with front-line staff members familiar with the clinical staffing challenges affecting their facility. As part of each on-site clinical staffing workshop (N=19), we facilitated a conversation regarding barriers to effective access to inpatient care at their facility and then asked participants (~120 total staff members composed of physicians, nurses, allied health professionals) to generate improvement ideas that would strengthen facility-level processes and outcomes. Upon completion of all site visits, we compiled the 262 proposed solutions and grouped similar improvement ideas to assess how often participants cited improvement ideas aligned with our recommendations. Data from this exercise is often included within the “summary of supporting evidence” sections for each sub-recommendation.
Assessment F (Workflow – Clinical)
The views, opinions, and/or findings contained in this report are those of the assessment team and should not be construed as an official government position, policy, or decision.
B-14
This page intentionally left blank.

Assessment F (Workflow – Clinical)
The views, opinions, and/or findings contained in this report are those of the assessment team and should not be construed as an official government position, policy, or decision.
C-1
Appendix C Additional Detail on Access to Care
C.1 Best Practices and Benchmarks
We have identified several inpatient access-to-care best practices and benchmarks in the areas outlined below.
Table C-1. Access to Care – Best Practices and Benchmarks
Category Component Best practice / benchmark
Organization Top of license practice
Staff mid-level providers, particularly in triage (Russ, 2010)
Staff sufficient support roles (e.g., transporters, techs, sitters) to support clinical staff (Chang, 2012)
Organization Leadership Staff a board-certified, dedicated ED Director (Patel, 2014)
Facilitate a collaborative environment among leadership and staff in the ED and inpatient departments (Patel, 2014)
Organization Performance management
Tie clinician individual performance to patient flow performance outcomes (Patel, 2014)
Use a multidisciplinary team to identify opportunities to improve patient flow (California Healthcare Foundation, 2011)
Processes ED triage/flow Utilize RN standing order sets for common symptoms (e.g., abdominal pain, chest pain) (Retezar, 2011)
Implement a fast-track process (outside of the main ED) for low-acuity patients to expedite patient flow
Avoid bed assignments for low-acuity patients and instead have them rotate through stations for labs, imaging, doctor consultation, etc. (conveyance model) (Sanchez, 2006, Storrow, 2008)
Discharge patients directly from the fast-track care area (Sanchez, 2006)
Establish and follow a formalized escalation/diversion process to determine when a facility is at capacity (Handel, 2010)
Processes Bed assignment and admission
Implement a standard bed management algorithm to identify the appropriate bed and unit (e.g., setting of care) for each patient on admission (Chen, 2012)
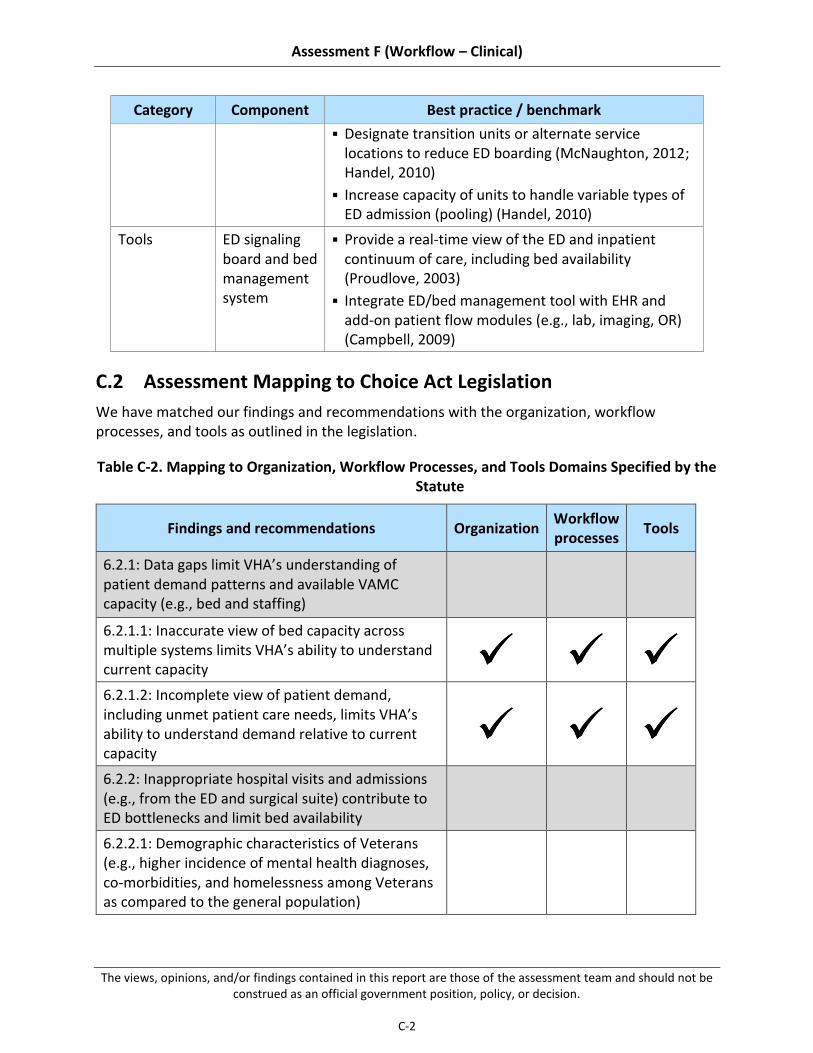
Assessment F (Workflow – Clinical)
The views, opinions, and/or findings contained in this report are those of the assessment team and should not be construed as an official government position, policy, or decision.
C-2
Category Component Best practice / benchmark
Designate transition units or alternate service locations to reduce ED boarding (McNaughton, 2012; Handel, 2010)
Increase capacity of units to handle variable types of ED admission (pooling) (Handel, 2010)
Tools ED signaling board and bed management system
Provide a real-time view of the ED and inpatient continuum of care, including bed availability (Proudlove, 2003)
Integrate ED/bed management tool with EHR and add-on patient flow modules (e.g., lab, imaging, OR) (Campbell, 2009)
C.2 Assessment Mapping to Choice Act Legislation
We have matched our findings and recommendations with the organization, workflow processes, and tools as outlined in the legislation.
Table C-2. Mapping to Organization, Workflow Processes, and Tools Domains Specified by the Statute
Findings and recommendations Organization Workflow processes
Tools
6.2.1: Data gaps limit VHA’s understanding of patient demand patterns and available VAMC capacity (e.g., bed and staffing)
6.2.1.1: Inaccurate view of bed capacity across multiple systems limits VHA’s ability to understand current capacity
6.2.1.2: Incomplete view of patient demand, including unmet patient care needs, limits VHA’s ability to understand demand relative to current capacity
6.2.2: Inappropriate hospital visits and admissions (e.g., from the ED and surgical suite) contribute to ED bottlenecks and limit bed availability
6.2.2.1: Demographic characteristics of Veterans (e.g., higher incidence of mental health diagnoses, co-morbidities, and homelessness among Veterans as compared to the general population)

Assessment F (Workflow – Clinical)
The views, opinions, and/or findings contained in this report are those of the assessment team and should not be construed as an official government position, policy, or decision.
C-3
Findings and recommendations Organization Workflow processes
Tools
6.2.2.2: Limited access to immediate (e.g., same day or same week) primary and urgent care clinic appointments, contributing to ED demand
6.2.2.3: Insufficient access to sub-acute facilities (e.g., short-term rehab, detox clinics) for patients who should not be discharged home following an ED visit or surgical procedure, but do not require admission to an inpatient bed
6.2.2.4: Minimal physician acceptance of and accountability for UM admission standards (e.g., the evaluation of the appropriateness of health care services according to evidence based criteria)
6.2.3: Best practices related to workflow and performance management exist at some facilities, but have not been scaled across the system
6.2.3.1: Inconsistent adoption of proven best practices to manage patient flow within facilities (e.g., early initiation of clinical protocols in ED triage, fast-track processes for low-acuity patients, team focused on managing flow)
6.2.3.2: Limited cross-facility communication and sharing of best practices
6.3.1: Develop an accurate end-to-end picture of patient demand and VAMC capacity
6.3.1.1: Simplify the process and required approvals by which beds are classified as operational or unavailable
6.3.1.2: Develop a prioritized set of standardized metrics to understand current demand at the VAMC, VISN, and VHACO levels and implement an automated process to collect and aggregate this data across the system
6.3.1.3: Expand use of evidence-based processes for managing patient flow, including clear role
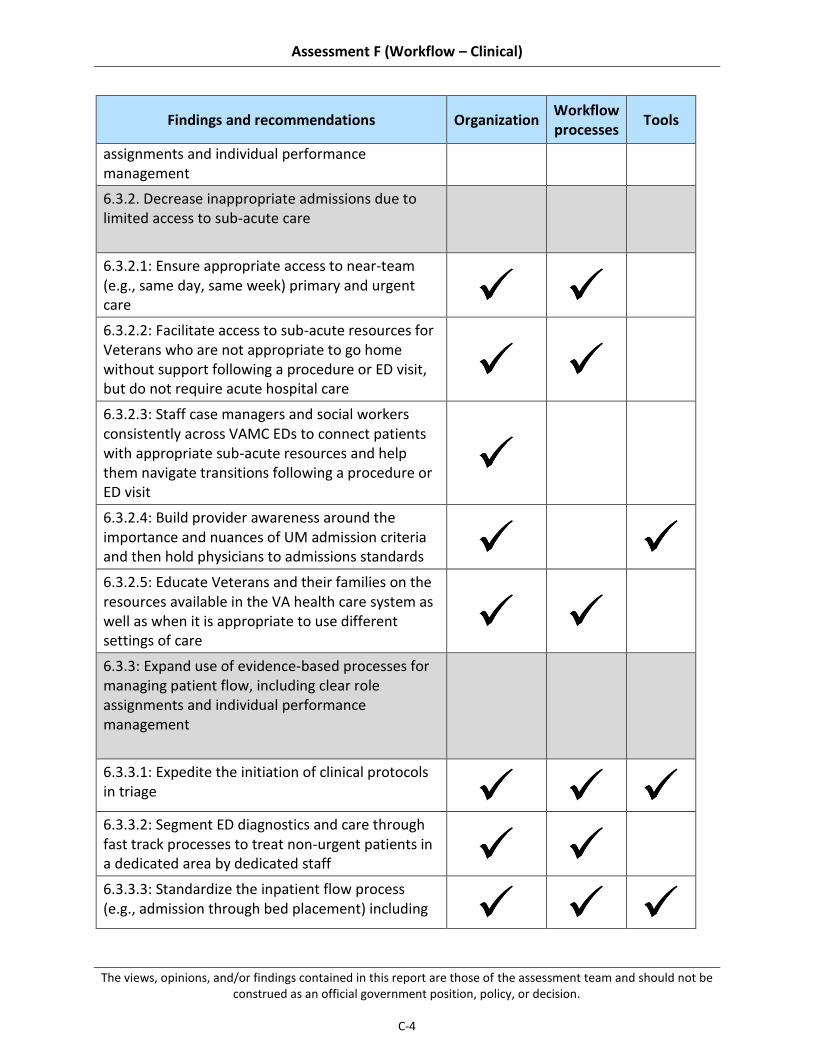
Assessment F (Workflow – Clinical)
The views, opinions, and/or findings contained in this report are those of the assessment team and should not be construed as an official government position, policy, or decision.
C-4
Findings and recommendations Organization Workflow processes
Tools
assignments and individual performance management
6.3.2. Decrease inappropriate admissions due to limited access to sub-acute care
6.3.2.1: Ensure appropriate access to near-team (e.g., same day, same week) primary and urgent care
6.3.2.2: Facilitate access to sub-acute resources for Veterans who are not appropriate to go home without support following a procedure or ED visit, but do not require acute hospital care
6.3.2.3: Staff case managers and social workers consistently across VAMC EDs to connect patients with appropriate sub-acute resources and help them navigate transitions following a procedure or ED visit
6.3.2.4: Build provider awareness around the importance and nuances of UM admission criteria and then hold physicians to admissions standards
6.3.2.5: Educate Veterans and their families on the resources available in the VA health care system as well as when it is appropriate to use different settings of care
6.3.3: Expand use of evidence-based processes for managing patient flow, including clear role assignments and individual performance management
6.3.3.1: Expedite the initiation of clinical protocols in triage
6.3.3.2: Segment ED diagnostics and care through fast track processes to treat non-urgent patients in a dedicated area by dedicated staff
6.3.3.3: Standardize the inpatient flow process (e.g., admission through bed placement) including

Assessment F (Workflow – Clinical)
The views, opinions, and/or findings contained in this report are those of the assessment team and should not be construed as an official government position, policy, or decision.
C-5
Findings and recommendations Organization Workflow processes
Tools
clear role assignments and individual accountability for patient flow
6.3.3.4: Build the infrastructure at the VHACO level to promote cross-facility sharing of patient flow best practices
C.3 Past Findings and Recommendations Detail
Figure C-1. Sample Access to Care Issues Identified in Past Assessments
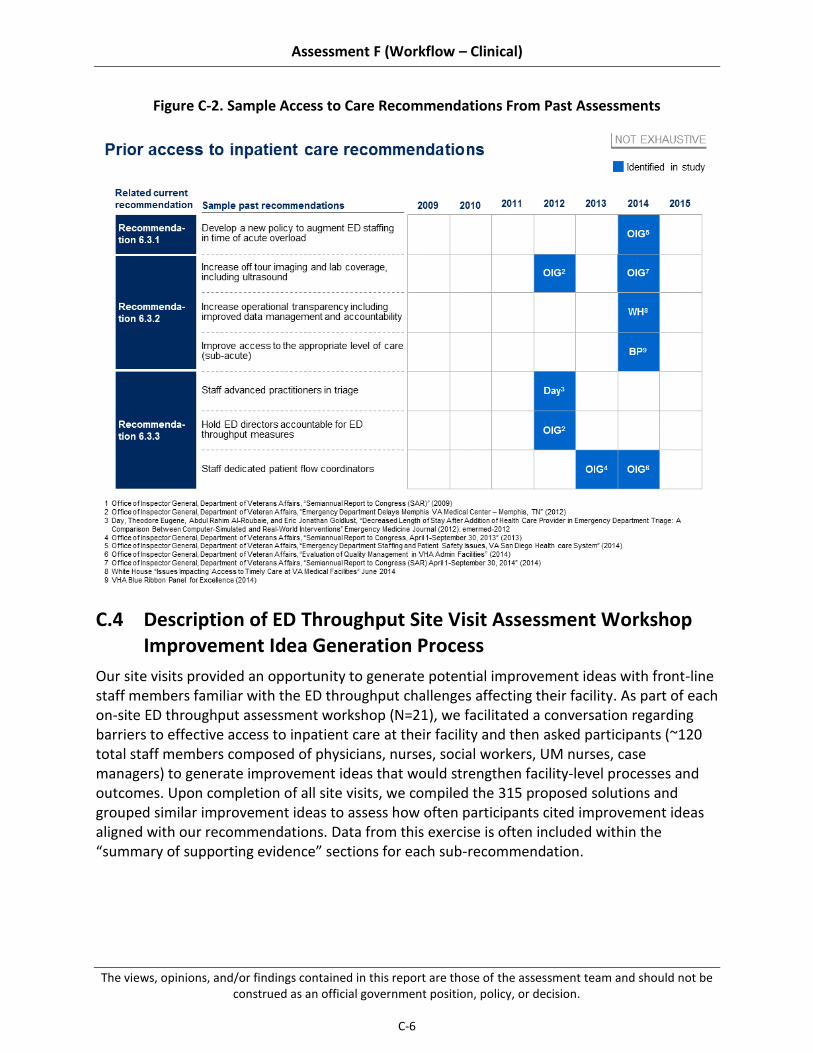
Assessment F (Workflow – Clinical)
The views, opinions, and/or findings contained in this report are those of the assessment team and should not be construed as an official government position, policy, or decision.
C-6
Figure C-2. Sample Access to Care Recommendations From Past Assessments
C.4 Description of ED Throughput Site Visit Assessment Workshop Improvement Idea Generation Process
Our site visits provided an opportunity to generate potential improvement ideas with front-line staff members familiar with the ED throughput challenges affecting their facility. As part of each on-site ED throughput assessment workshop (N=21), we facilitated a conversation regarding barriers to effective access to inpatient care at their facility and then asked participants (~120 total staff members composed of physicians, nurses, social workers, UM nurses, case managers) to generate improvement ideas that would strengthen facility-level processes and outcomes. Upon completion of all site visits, we compiled the 315 proposed solutions and grouped similar improvement ideas to assess how often participants cited improvement ideas aligned with our recommendations. Data from this exercise is often included within the “summary of supporting evidence” sections for each sub-recommendation.

Assessment F (Workflow – Clinical)
The views, opinions, and/or findings contained in this report are those of the assessment team and should not be construed as an official government position, policy, or decision.
D-1
Appendix D Additional Detail on Effective Length-of-Stay Management and Care Transitions
D.1 Best Practices and Benchmarks
We have identified several LOS management/effective care transitions best practices and benchmarks in the following areas:
Table D-1. LOS Management – Best Practices and Benchmarks
Category Component Best practices / benchmarks
Organization Case management department structure
Dedicate inpatient-focused case managers/discharge planners (Kim, 2005)
Employ proper staffing levels and mix of case management professionals, including RN case managers, social workers, utilization review specialists, and other supporting personnel (ACMA, 2013)
Organization Hospital operating model and service availability
Provide adequate coverage of clinical and support personnel across days and times to minimize delays in patient care due to e.g., inability to fill a PT consult, limited prosthetics staff off-tour (Engel, 2013; Kolber, 2013; Rapoport, 1989)
Organization Post-acute care facility availability
Ensure adequate capacity within facilities to support unique post-acute care needs of patients treated in the inpatient setting (Lindsay, 2014)
Workflow processes
Interdisciplinary discharge-focused meetings
Hold daily interdisciplinary discharge-focused meetings to enable early identification of discharge barriers and facilitate interventions to mitigate anticipated delays (Shepperd, 2004; Curley, 1998)
Promote attendance from all key stakeholders (e.g., providers, case managers, social work, UM, PT/OT, pharmacy) for effective interdisciplinary collaboration (Zwarenstein, 2009)
Workflow processes
Discharge planning
Initiate discharge planning at time of admission (Cherlin, 2013; ACMA, 2013)
Set goals to increase percentage of early morning discharges (Wertheimer, 2014; Kravet, 2007)
Workflow processes
Clinical pathway adoption
Employ accepted clinical protocols to standardize delivery of key interventions (e.g., ventilator weaning, early mobility) around evidence-based standards (Girard, 2008; Gao, 2005)

Assessment F (Workflow – Clinical)
The views, opinions, and/or findings contained in this report are those of the assessment team and should not be construed as an official government position, policy, or decision.
D-2
Category Component Best practices / benchmarks
Implement clinical pathways specific to key diagnoses to increase delivery of efficient, evidence-based care (Winther, 2015; Wind, 2006)
Tools Utilization management trackers
Use tools that standardize tracking of UM metrics and promote transparency into local performance (Wickizer, 1989)
Tools Case management prioritization system
Support case management activities with tools that target interventions to priority patient subgroups (ACMA, 2013)
Tools Discharge planning tools / checklists
Use aids that streamline discharge process (e.g., checklists) by ensuring consideration of all relevant discharge needs (Soong, 2013; Halasyamani, 2006)
Tools Post-acute care coordination and communication tool
Support coordination with post-acute care facilities using tools to streamline process of locating and communicating with local facilities (ACMA, 2013)
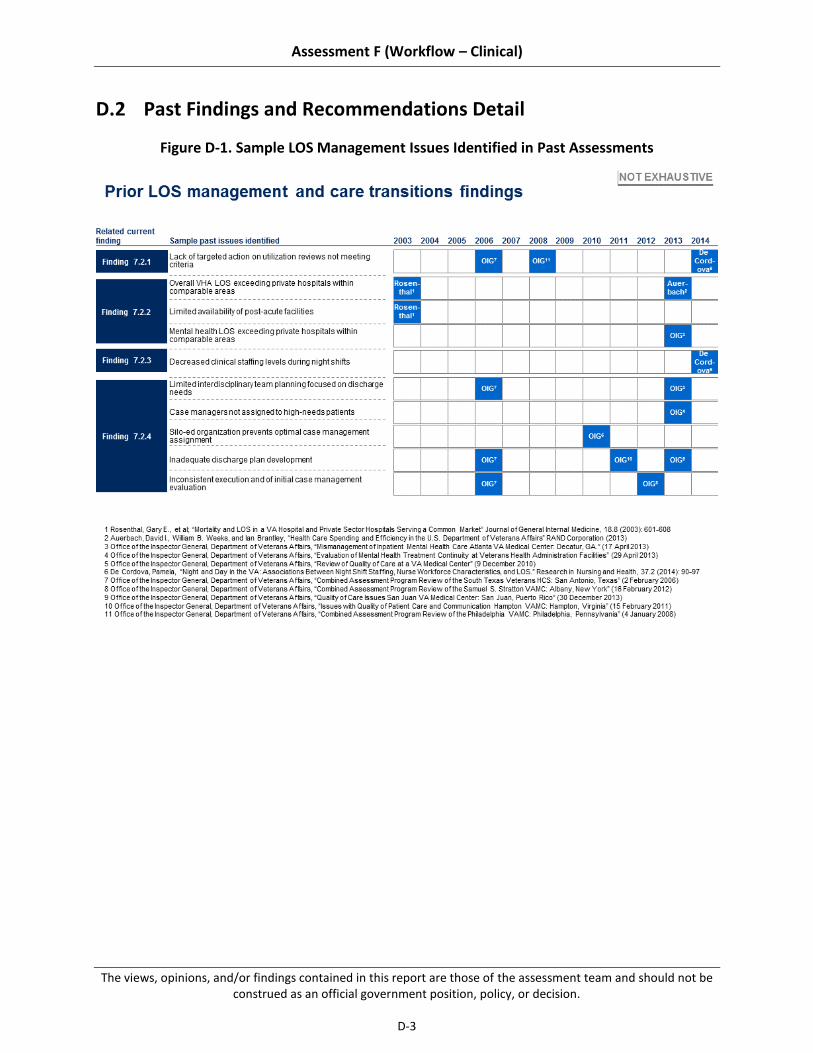
Assessment F (Workflow – Clinical)
The views, opinions, and/or findings contained in this report are those of the assessment team and should not be construed as an official government position, policy, or decision.
D-3
D.2 Past Findings and Recommendations Detail
Figure D-1. Sample LOS Management Issues Identified in Past Assessments

Assessment F (Workflow – Clinical)
The views, opinions, and/or findings contained in this report are those of the assessment team and should not be construed as an official government position, policy, or decision.
D-4
Figure D-2. Sample LOS Management Recommendations From Past Assessments
D.3 Assessment Mapping to Choice Act Legislation
We have matched our findings and recommendations with the organization, workflow processes, and tools domains outlined in the legislation.
Table D-2. Mapping of Drivers to Organization, Workflow Processes, and Tools Domains Specified by The Statute
Findings and recommendations Organization Workflow processes
Tools
7.2.1: Implementation of national LOS programs and initiatives has failed to achieve organization-wide improvements despite local pockets of best practice adoption
7.2.1.1: Lack of availability of LOS performance metrics at the front-line and limited performance

Assessment F (Workflow – Clinical)
The views, opinions, and/or findings contained in this report are those of the assessment team and should not be construed as an official government position, policy, or decision.
D-5
Findings and recommendations Organization Workflow processes
Tools
management inhibit the transparency and emphasis necessary to drive improvements
7.2.1.2: Limited organization-wide engagement in the national utilization management (UM) program reduces the program’s potential impact
7.2.1.3: Variable participation in national LOS management initiatives and inconsistent adoption of best practices drive variation in recent LOS improvements
7.2.2: Existing post-acute care options (e.g., rehabilitation / skilled nursing facilities) do not always match Veteran needs, delaying discharge
7.2.2.1: Veterans requiring placement within post-acute care facilities experience significant discharge delays
7.2.2.2: Limited social resources (e.g., transitional housing / homeless programs) for Veterans awaiting discharge prolongs LOS
7.2.3: Typical VAMC operating models do not promote efficient inpatient care, leading to prolonged LOS
7.2.3.1: Reduced access to consultative services (e.g., specialist / allied health consults) over the weekend heightens discharge challenges
7.2.3.2: Inconsistent implementation of standard protocols and pathways drives variability in care patterns and may increase patient LOS
7.2.4: Use of discharge planning best practices is inconsistent, decreasing effectiveness and coordination
7.2.4.1: Suboptimal and inconsistent use of case managers results in re-allocation of critical discharge planning responsibilities to other staff
7.2.4.2: Variable implementation of key processes designed to expedite discharge results in avoidable discharge delays
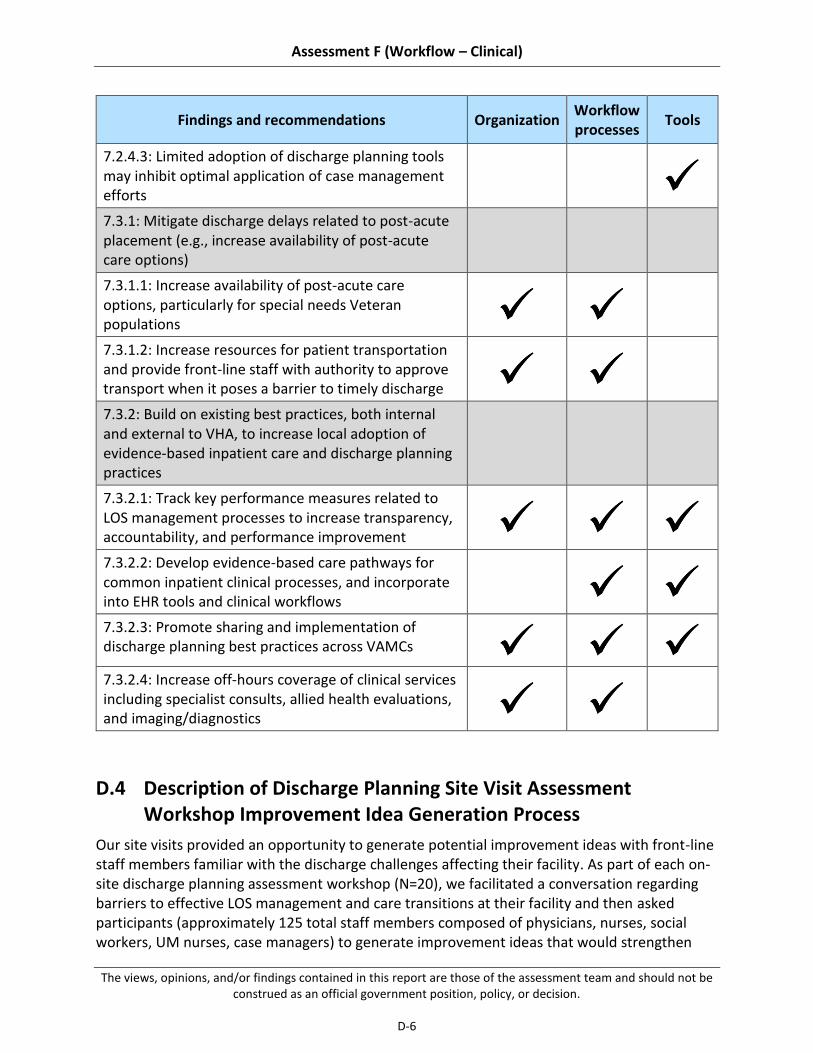
Assessment F (Workflow – Clinical)
The views, opinions, and/or findings contained in this report are those of the assessment team and should not be construed as an official government position, policy, or decision.
D-6
Findings and recommendations Organization Workflow processes
Tools
7.2.4.3: Limited adoption of discharge planning tools may inhibit optimal application of case management efforts
7.3.1: Mitigate discharge delays related to post-acute placement (e.g., increase availability of post-acute care options)
7.3.1.1: Increase availability of post-acute care options, particularly for special needs Veteran populations
7.3.1.2: Increase resources for patient transportation and provide front-line staff with authority to approve transport when it poses a barrier to timely discharge
7.3.2: Build on existing best practices, both internal and external to VHA, to increase local adoption of evidence-based inpatient care and discharge planning practices
7.3.2.1: Track key performance measures related to LOS management processes to increase transparency, accountability, and performance improvement
7.3.2.2: Develop evidence-based care pathways for common inpatient clinical processes, and incorporate into EHR tools and clinical workflows
7.3.2.3: Promote sharing and implementation of discharge planning best practices across VAMCs
7.3.2.4: Increase off-hours coverage of clinical services including specialist consults, allied health evaluations, and imaging/diagnostics
D.4 Description of Discharge Planning Site Visit Assessment Workshop Improvement Idea Generation Process
Our site visits provided an opportunity to generate potential improvement ideas with front-line staff members familiar with the discharge challenges affecting their facility. As part of each on-site discharge planning assessment workshop (N=20), we facilitated a conversation regarding barriers to effective LOS management and care transitions at their facility and then asked participants (approximately 125 total staff members composed of physicians, nurses, social workers, UM nurses, case managers) to generate improvement ideas that would strengthen
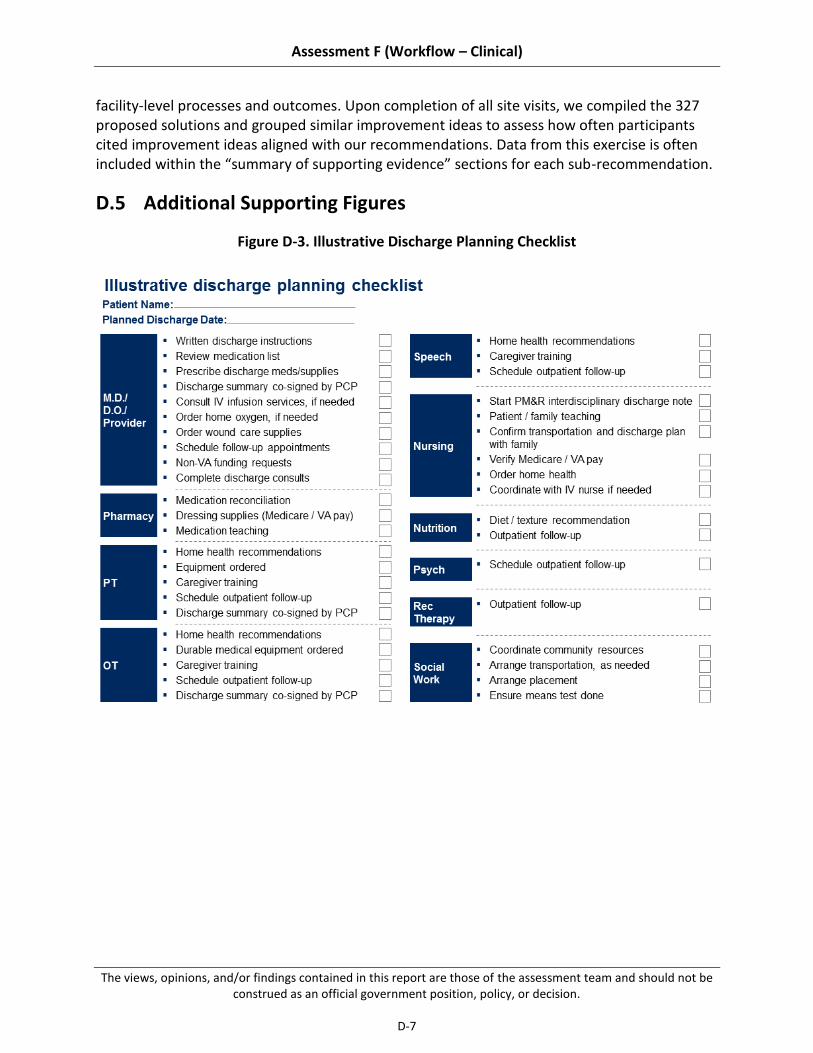
Assessment F (Workflow – Clinical)
The views, opinions, and/or findings contained in this report are those of the assessment team and should not be construed as an official government position, policy, or decision.
D-7
facility-level processes and outcomes. Upon completion of all site visits, we compiled the 327 proposed solutions and grouped similar improvement ideas to assess how often participants cited improvement ideas aligned with our recommendations. Data from this exercise is often included within the “summary of supporting evidence” sections for each sub-recommendation.
D.5 Additional Supporting Figures
Figure D-3. Illustrative Discharge Planning Checklist

Assessment F (Workflow – Clinical)
The views, opinions, and/or findings contained in this report are those of the assessment team and should not be construed as an official government position, policy, or decision.
D-8
This page intentionally left blank.

Assessment F (Workflow – Clinical)
The views, opinions, and/or findings contained in this report are those of the assessment team and should not be construed as an official government position, policy, or decision.
E-1
Appendix E Additional Detail on Patient Experience
E.1 Comparison of VHA and HCAHPS Questions and Scoring and Detail of VHA’s Methodology for Calculating Patient Satisfaction Scores
The order of measures is in line with Figure 8-1.536
Table E-1. SHEP and HCAHPs Questions and Methodology Comparison
Please answer the following questions about your stay at the hospital named on the cover. Do not include any other hospital stays in your answer.
SHEP/HCAHPS Reporting measure
SHEP/HCAHPS Survey Questions
SHEP/HCAHPS Scoring
SHEP methodology applied to HCAHPS
Care Transition Question 1. During this hospital stay, staff took my preferences and those of my family or caregiver into account in deciding what my health care needs would be when I left.
Question 2. When I left the hospital, I had a good understanding of the things I was responsible for in managing my health.
Question 3. When I left the hospital, I clearly understood the purpose for taking each of my medications.
Questions 1, 2, 3 have the following response scale:
Strongly disagree
Disagree
Agree
Strongly agree
The score on each item is calculated as the percentage of responses that fall in the top category (Strongly agree). Care Transition is then calculated as the average of the site's scores on the three items.
Cleanliness of the Hospital Environment
Question 1. During this hospital stay, how often were your room and bathroom kept clean?
Question 1 has the following response scale:
Never
Sometimes
The reporting measure is calculated as the percentage of responses that fall in the top two categories (Usually, Always).
536 SHEP FY14 and HCAHPS training materials (HCAHPS.online.org)

Assessment F (Workflow – Clinical)
The views, opinions, and/or findings contained in this report are those of the assessment team and should not be construed as an official government position, policy, or decision.
E-2
Please answer the following questions about your stay at the hospital named on the cover. Do not include any other hospital stays in your answer.
SHEP/HCAHPS Reporting measure
SHEP/HCAHPS Survey Questions
SHEP/HCAHPS Scoring
SHEP methodology applied to HCAHPS
Usually
Always
Communication about Medication
Question 1. Before giving you any new medicine, how often did hospital staff tell you what the medicine was for?
Question 2. Before giving you any new medicine, how often did hospital staff describe possible side effects in a way you could understand?
Questions 1 & 2 have the following response scale:
Never
Sometimes
Usually
Always
The score on each item is calculated as the percentage of responses that fall in the top two categories (Usually, Always). Communication about Medication is then calculated as the average of the site's scores on the two items.
Discharge Information
Question 1. During this hospital stay, did doctors, nurses, or other hospital staff talk with you about whether you would have the help you needed when you left the hospital?
Question 2. During this hospital stay, did you get information in writing about what symptoms or health problems to look out for after you left the hospital?
Questions 1 & 2 have the following response scale:
Yes
No
The score on each item is calculated as the percentage of “Yes” responses.
Discharge Information is then calculated as the average of the site's scores on the two items.
Communication with Nurses
Question 1. During this hospital stay, how often did nurses treat you with courtesy and respect?
Questions 1, 2, & 3 have the following response scale:
Never
Sometimes
The score on each item is calculated as the percentage of responses that fall in the top two categories (Usually, Always).
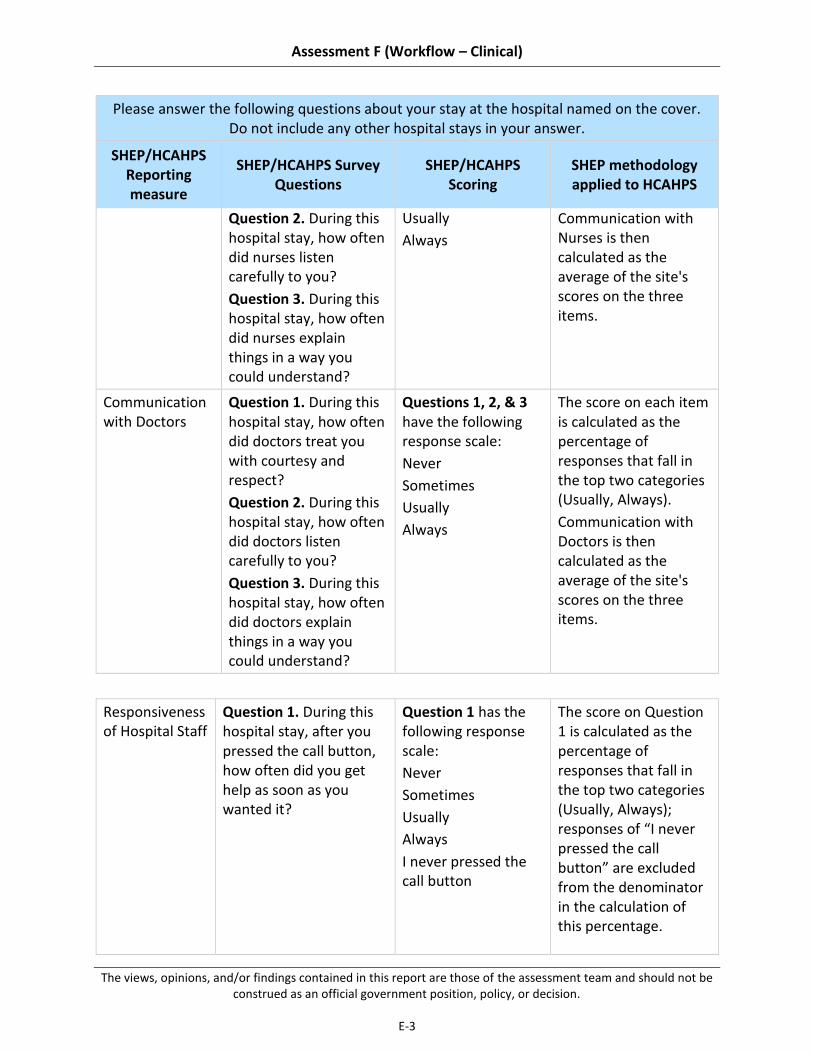
Assessment F (Workflow – Clinical)
The views, opinions, and/or findings contained in this report are those of the assessment team and should not be construed as an official government position, policy, or decision.
E-3
Please answer the following questions about your stay at the hospital named on the cover. Do not include any other hospital stays in your answer.
SHEP/HCAHPS Reporting measure
SHEP/HCAHPS Survey Questions
SHEP/HCAHPS Scoring
SHEP methodology applied to HCAHPS
Question 2. During this hospital stay, how often did nurses listen carefully to you?
Question 3. During this hospital stay, how often did nurses explain things in a way you could understand?
Usually
Always
Communication with Nurses is then calculated as the average of the site's scores on the three items.
Communication with Doctors
Question 1. During this hospital stay, how often did doctors treat you with courtesy and respect?
Question 2. During this hospital stay, how often did doctors listen carefully to you?
Question 3. During this hospital stay, how often did doctors explain things in a way you could understand?
Questions 1, 2, & 3 have the following response scale:
Never
Sometimes
Usually
Always
The score on each item is calculated as the percentage of responses that fall in the top two categories (Usually, Always).
Communication with Doctors is then calculated as the average of the site's scores on the three items.
Responsiveness of Hospital Staff
Question 1. During this hospital stay, after you pressed the call button, how often did you get help as soon as you wanted it?
Question 1 has the following response scale:
Never
Sometimes
Usually
Always
I never pressed the call button
The score on Question 1 is calculated as the percentage of responses that fall in the top two categories (Usually, Always); responses of “I never pressed the call button” are excluded from the denominator in the calculation of this percentage.

Assessment F (Workflow – Clinical)
The views, opinions, and/or findings contained in this report are those of the assessment team and should not be construed as an official government position, policy, or decision.
E-4
Question 2. How often did you get help in getting to the bathroom or using a bedpan as soon as you wanted?
Question 2 has the following response scale:
Never
Sometimes
Usually
Always
The score on Question 2 is calculated as the percentage of responses that fall in the top two categories (Usually, Always). "Responsiveness" is then calculated as the average of the site's scores on the two items.
Willingness to Recommend Hospital
Question 1. Would you recommend this hospital to your friends and family?
Question 1 has the following response scale:
Definitely no
Probably no
Probably yes
Definitely yes
The reporting measure is calculated as the percentage of responses in the top category (Definitely yes).
Pain Management
Question 1. During this hospital stay, how often was your pain well controlled?
Question 2. During this hospital stay, how often did the hospital staff do everything they could to help you with your pain?
Questions 1 & 2 have the following response scale:
Never
Sometimes
Usually
Always
The score on each item is calculated as the percentage of responses that fall in the top two categories (Usually, Always).
Pain Control is then calculated as the average of the site's scores on the two items.
Overall Rating of Hospital
Question 1. Using any number from 0 to 10, where 0 is the worst hospital possible and 10 is the best hospital possible, what number would you use to rate this hospital during your stay?
Question 1 has the following response scale:
0, 1, 2, 3, 4, 5,
6, 7, 8, 9, 10
The reporting measure is calculated as the percentage of responses that fall in the top two categories (9, 10).
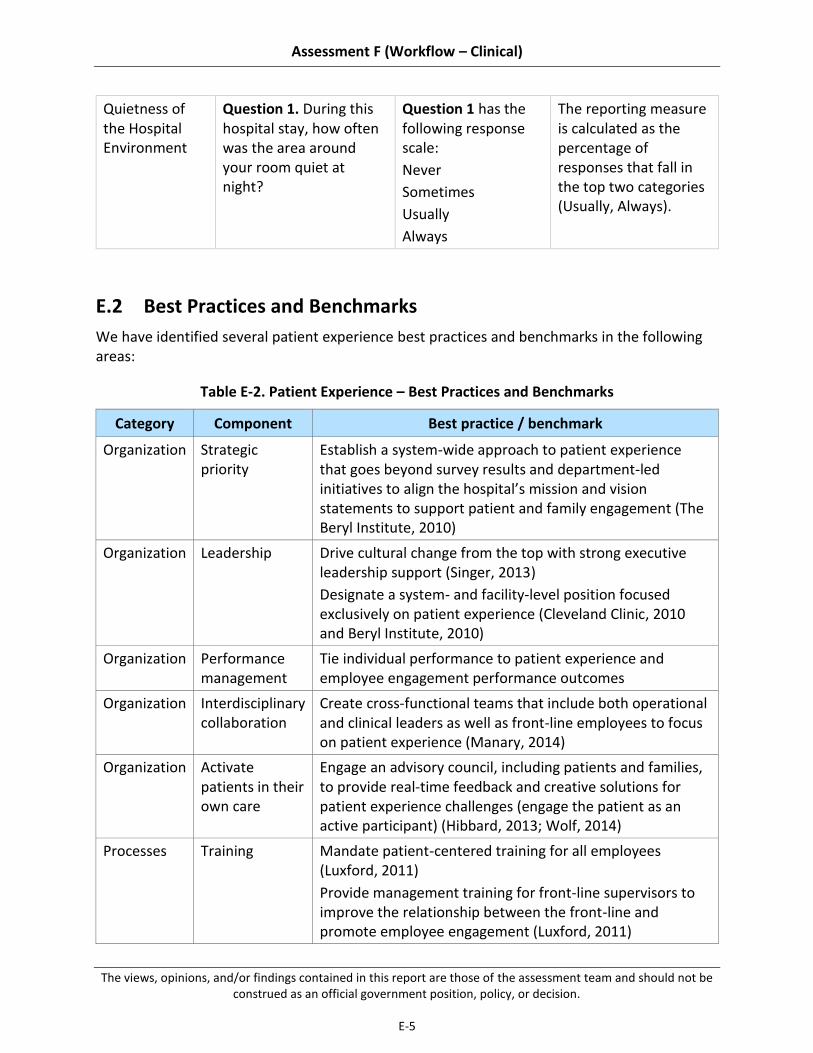
Assessment F (Workflow – Clinical)
The views, opinions, and/or findings contained in this report are those of the assessment team and should not be construed as an official government position, policy, or decision.
E-5
Quietness of the Hospital Environment
Question 1. During this hospital stay, how often was the area around your room quiet at night?
Question 1 has the following response scale:
Never
Sometimes
Usually
Always
The reporting measure is calculated as the percentage of responses that fall in the top two categories (Usually, Always).
E.2 Best Practices and Benchmarks
We have identified several patient experience best practices and benchmarks in the following areas:
Table E-2. Patient Experience – Best Practices and Benchmarks
Category Component Best practice / benchmark
Organization Strategic priority
Establish a system-wide approach to patient experience that goes beyond survey results and department-led initiatives to align the hospital’s mission and vision statements to support patient and family engagement (The Beryl Institute, 2010)
Organization Leadership Drive cultural change from the top with strong executive leadership support (Singer, 2013)
Designate a system- and facility-level position focused exclusively on patient experience (Cleveland Clinic, 2010 and Beryl Institute, 2010)
Organization Performance management
Tie individual performance to patient experience and employee engagement performance outcomes
Organization Interdisciplinary collaboration
Create cross-functional teams that include both operational and clinical leaders as well as front-line employees to focus on patient experience (Manary, 2014)
Organization Activate patients in their own care
Engage an advisory council, including patients and families, to provide real-time feedback and creative solutions for patient experience challenges (engage the patient as an active participant) (Hibbard, 2013; Wolf, 2014)
Processes Training Mandate patient-centered training for all employees (Luxford, 2011)
Provide management training for front-line supervisors to improve the relationship between the front-line and promote employee engagement (Luxford, 2011)

Assessment F (Workflow – Clinical)
The views, opinions, and/or findings contained in this report are those of the assessment team and should not be construed as an official government position, policy, or decision.
E-6
Category Component Best practice / benchmark
Processes Rounding Establish a cadence for leadership rounding on patients and staff; personalized recognition of high-performing staff (Singer, 2013)
Provide immediate service recovery by rounding on patients several times per day (or even hourly) (Hibbard, 2013)
Processes Patient and employee engagement
Employ a communication framework across staff to assist with patient interaction and promote immediate service recovery (Locatelli, 2014)
Educate patients and family on discharge planning immediately following admission and throughout a patient’s stay (Beryl, 2010)
Empower front-line to develop and own performance improvement (potentially in an anonymous fashion) (Luxford, 2011)
Tools Feedback solicitation
Solicit patient and employee feedback regularly (Beryl, 2010)
Provide a real-time, or near real-time, view of patient and employee satisfaction (Beryl, 2010)
Track performance improvement to patient and employee feedback (Beryl, 2010)
Tools Careboards Communicate with patients and family through updated white boards that indicate their provider team, plan. or discharge, approach to pain management, etc. (Locatelli, 2014)
E.3 Assessment Mapping to Choice Act Legislation
We have matched our findings and recommendations with the organization, workflow processes, and tools as outlined in the legislation.
Table E-3. Mapping to Organization, Workflow Processes, and Tools Domains Specified by the Statute
Findings and recommendations Organization Workflow processes
Tools
8.2.1: National and facility-level focus on the prioritization and provision of Veteran-Centered care has driven innovations in best practices

Assessment F (Workflow – Clinical)
The views, opinions, and/or findings contained in this report are those of the assessment team and should not be construed as an official government position, policy, or decision.
E-7
Findings and recommendations Organization Workflow processes
Tools
8.2.1.1: Veteran-focused initiatives, developed locally at individual VAMCs, exemplify industry best practices at the bedside
8.2.1.2: Veteran-focused initiatives, developed locally at individual VAMCs, exemplify industry best practices at the bedside
8.2.2: Adoption of best practices and engagement of Program Office support services are varied across VAMCs.
8.2.2.1: Central Office reach is limited by the level of facility leadership engagement
8.2.2.2: Structure to codify and share facility-driven initiatives across the system is limited
8.2.2.3: Implementation of point-of-care feedback tools (e.g., GetWell Network, Truth Point) is varied across the system
8.2.3: Challenges with respect to timeliness and specificity in the SHEP survey results limit VAMCs’ ability to drive performance improvement
8.2.3.1: SHEP results are often delayed by 3 to 6 months and reflect aggregate VAMC patient satisfaction scores (for example, data is not segmented by individual department or unit)
8.2.3.2: Patient satisfaction metrics are not generally included in individual’s performance reviews because SHEP data is aggregated at the VAMC level
8.3.1: Collect more timely and relevant patient experience data to drive transparency and performance improvement at the facility, department, and individual levels
8.3.1.1: Ensure VHA’s patient satisfaction feedback tool(s) delivers survey results in a timely (real time or near real-time) and actionable format (for example, segmented at the VISN, VAMC, department and unit levels)

Assessment F (Workflow – Clinical)
The views, opinions, and/or findings contained in this report are those of the assessment team and should not be construed as an official government position, policy, or decision.
E-8
Findings and recommendations Organization Workflow processes
Tools
8.3.1.2: Include patient experience metrics in leadership and department level performance reviews
8.3.2: Strengthen national and facility-level support for patient-centered care programs to increase adoption
8.3.2.1: Coordinate Veteran-centered initiatives across Program Offices
8.3.2.2: Promote consistent leadership at the VAMCs
8.3.2.3: Facilitate sharing of facility-driven best practices
E.4 Past Findings and Recommendations Detail
Figures E-1 and E-2 below are illustrative of the types of issues identified and recommendations made in recent years, and are not comprehensive lists.
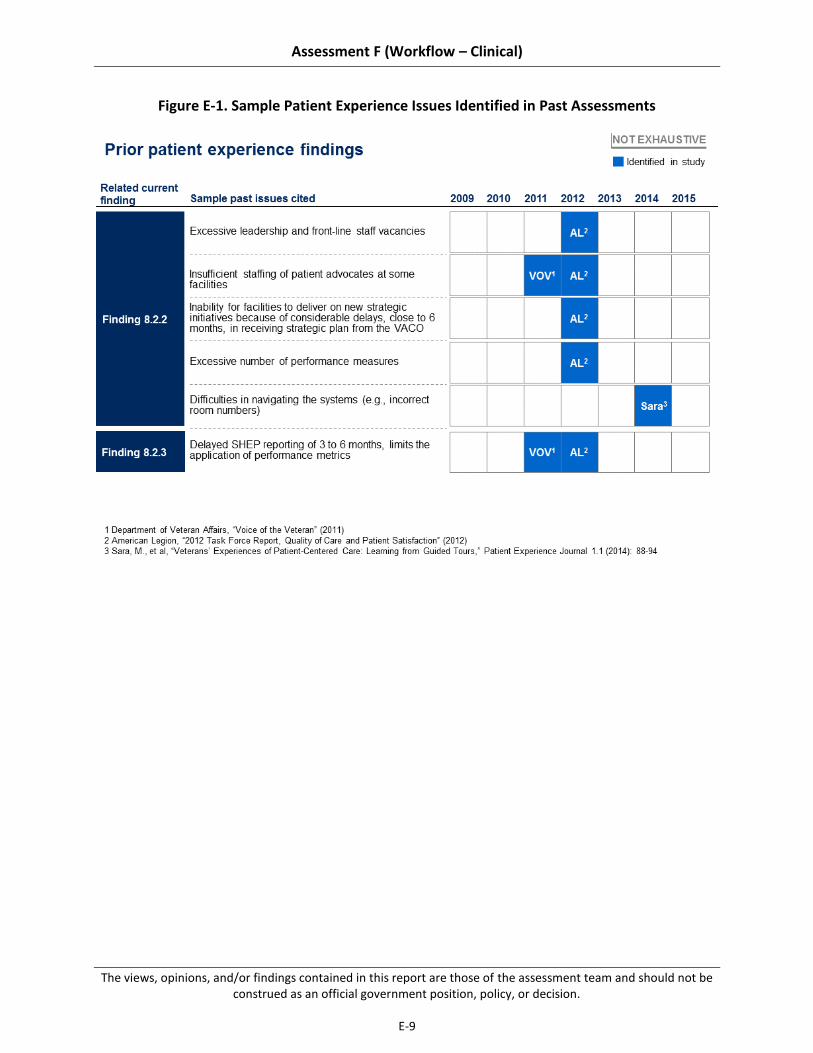
Assessment F (Workflow – Clinical)
The views, opinions, and/or findings contained in this report are those of the assessment team and should not be construed as an official government position, policy, or decision.
E-9
Figure E-1. Sample Patient Experience Issues Identified in Past Assessments

Assessment F (Workflow – Clinical)
The views, opinions, and/or findings contained in this report are those of the assessment team and should not be construed as an official government position, policy, or decision.
E-10
Figure E-2. Sample Access to Care Recommendations From Past Assessments

Assessment F (Workflow – Clinical)
The views, opinions, and/or findings contained in this report are those of the assessment team and should not be construed as an official government position, policy, or decision.
F-1
Appendix F Additional Detail on Accurate Documentation and Subsequent Coding
F.1 Best Practices and Benchmarks
We have identified several documentation and coding best practices and benchmarks in the following areas:
Table F-1. Documentation and Coding – Best Practices and Benchmarks
Category Component Best practices / benchmarks
Organization HIMS organizational structure
Organize HIMS reporting structure to promote proper emphasis on documentation and coding from senior hospital leadership (Johns, 2013)
Organization Performance management
Promote provider buy-in on documentation and coding objectives through performance management and supporting incentives (Intermountain Healthcare Interview, 2015)
Organization CDI program implementation
Establish multi-disciplinary clinical documentation improvement (CDI) programs with emphasis on review of provider documentation, increased provider engagement, and education and training for non-coding staff (Arrowood, 2013; Danzi, 2000)
Workflow processes
Provider documentation training
Conduct targeted provider documentation training sessions to teach and reinforce proper documentation patterns (Russo, 2013)
Workflow processes
Documentation quality assurance
Maintain integrity of the medical record through effective quality review processes (Arrowood, 2013)
Workflow processes
Coding quality assurance
Implement coder audits to ensure reliability of coding and to provide training and focused coaching for performance issues (Prophet, 1998)
Workflow processes
Provider query processes
Clarify ambiguous or unclear documentation consistently to ensure that translation from medical documentation to codes is reflective of the patient’s true clinical condition (Prophet, 2001)
Tools Electronic health record (EHR)
Standardize information capture to enable extraction of needed data from the medical record (e.g., for coding, quality measurement) (Clark, 2012)
Incorporate program features that encourage proper documentation practices (e.g., automated copy-paste audits) (Arrowood, 2013)

Assessment F (Workflow – Clinical)
The views, opinions, and/or findings contained in this report are those of the assessment team and should not be construed as an official government position, policy, or decision.
F-2
Category Component Best practices / benchmarks
Tools Coding software Incorporate resources within the core coding environment to facilitate proper code assignment (e.g., error checking, decision support) (Fletcher, 2002)
Train coders adequately to ensure competency and promote targeted improvements, as needed (Santos, 2008)
F.2 Past Findings and Recommendations Detail
Figure F-1. Sample Documentation and Coding Issues Identified in Past Assessments

Assessment F (Workflow – Clinical)
The views, opinions, and/or findings contained in this report are those of the assessment team and should not be construed as an official government position, policy, or decision.
F-3
Figure F-2. Sample Documentation and Coding Recommendations from Past Assessments
F.3 Assessment Mapping to Choice Act Legislation
We have matched our findings and recommendations with the organization, workflow processes, and tools domains outlined in the legislation.
Table F-2. Mapping of Drivers to Organization, Workflow Processes, and Tools Domains Specified by the Statute
Findings and recommendations Organization Workflow processes
Tools
9.2.1: Inconsistent focus on clinical documentation impedes consistent capture of complete clinical information, hindering appropriate resource allocation and revenue collection
9.2.1.1: Limited direct integration of health information management (HIM) and finance functions

Assessment F (Workflow – Clinical)
The views, opinions, and/or findings contained in this report are those of the assessment team and should not be construed as an official government position, policy, or decision.
F-4
Findings and recommendations Organization Workflow processes
Tools
at the VAMC level weakens leadership prioritization of documentation
9.2.1.2: Inconsistent provider education and training practices are not aligned with VHA’s view of the high importance of clinical documentation
9.2.1.3: Lack of performance management contributes to low priority on documentation
9.2.2: Adoption of documentation best practices is variable, resulting in inconsistent quality of clinical documentation system-wide
9.2.2.1: Inconsistent adoption of provider documentation best practices (e.g., template use, appropriate copy-paste) challenges effectiveness
9.2.2.2: Ineffective provider query practices and limited provider responsiveness at many facilities contribute to persistence of suboptimal documentation
9.2.2.3: Incomplete uptake of clinical documentation improvement (CDI) programs and variable best practice implementation has limited potential impact from these programs
9.2.3: VHA’s performance on coding accuracy and timeliness closely matches or exceeds private sector
9.2.3.1: Visibility into performance through establishment of clear coding targets and performance tracking supports transparency and improvement
9.2.3.2: Regular application of coder auditing by internal coding experts at the facility-level yields feedback loop to identify inaccuracies and improve performance
9.2.3.3: Use of coding software that incorporates best practice features (e.g., error checking, decision support) facilitates coding accuracy
9.3.1: Increase local prioritization of clinical documentation through acceleration of national CDI program and targeted provider education and training,

Assessment F (Workflow – Clinical)
The views, opinions, and/or findings contained in this report are those of the assessment team and should not be construed as an official government position, policy, or decision.
F-5
Findings and recommendations Organization Workflow processes
Tools
supported by performance management at the facility and provider level.
9.3.1.1: Incorporate documentation metrics into regular performance reviews for both providers and facilities
9.3.1.2: Reinforce CDI program by providing targeted guidance on national documentation priority areas and by creating a national information-sharing network for CDI best practice sharing
9.3.1.3: Develop and deploy provider educational and training programs to address unique VHA documentation needs and reemphasize the importance of documentation for Veterans and the organization
9.3.2: Strengthen provider documentation standards (e.g., management of clinical templates, EHR review process) to promote optimal capture of patient information and improve resulting resource management.
9.3.2.1: Eliminate duplicative clinical templates and standardize requirements for new template creation
9.3.2.2: Strengthen EHR reviews to ensure appropriate use of copy-paste, including implementation of CPRS tool to automate the process
9.3.2.3: Implement standardized processes for following up on outstanding provider queries and improve provider accountability for query responsiveness
F.4 Description of Documentation and Coding Site Visit Assessment Workshop Improvement Idea Generation Process
Our site visits provided an opportunity to generate potential improvement ideas with front-line staff members familiar with the documentation and coding challenges affecting their facility. As part of each on-site documentation and coding assessment workshop (N=20), we facilitated a conversation regarding barriers to accurate documentation and coding at their facility and then asked participants (approximately 115 total staff members composed of physicians, medical

Assessment F (Workflow – Clinical)
The views, opinions, and/or findings contained in this report are those of the assessment team and should not be construed as an official government position, policy, or decision.
F-6
coders, utilization management nurses, and HIM chiefs) to generate improvement ideas that would strengthen facility-level processes and outcomes. Upon completion of all site visits, we compiled the 210 proposed solutions and grouped similar improvement ideas to assess how often participants cited improvement ideas aligned with our recommendations. Data from this exercise is often included within the “summary of supporting evidence” sections for each sub-recommendation.
F.5 Additional Supporting Figures
Figure F-3. Illustrative Template Review Checklist

Assessment F (Workflow – Clinical)
The views, opinions, and/or findings contained in this report are those of the assessment team and should not be construed as an official government position, policy, or decision.
F-7
Figure F-4. Illustrative Provider Query Follow-Up Process

Assessment F (Workflow – Clinical)
The views, opinions, and/or findings contained in this report are those of the assessment team and should not be construed as an official government position, policy, or decision.
F-8
This page intentionally left blank.
Assessment F (Workflow – Clinical)
The views, opinions, and/or findings contained in this report are those of the assessment team and should not be construed as an official government position, policy, or decision.
G-1
Appendix G Bibliography ACDIS (Association of Clinical Documentation Improvement Specialists). (2011, January).
2010 Physician Query Benchmarking Report. Retrieved from http://www.hcpro.com/ content/265437.pdf
ACMA (American Case Management Association). (2013). 2013 ACMA National Hospital case management survey. Retrieved from http://www.acmaweb.org/2013_survey/ 2013_nhcms.pdf
Aiken, L.H., Clarke, S.P., Sloane, D.M., Sochalski, J., Silber, J.H. (2002). Hospital nurse staffing and patient mortality, nurse burnout, and job dissatisfaction. Journal of the American Medical Association, 288(16), 1987-1993.
Aiken, L.H., Clarke S.P., Cheung R.B., et al. (2003). Educational levels of hospital nurses and surgical patient mortality. Journal of the American Medical Association, 290(12), 1619-1623.
Allied Health in Rehabilitation Consultative Committee. (2007, July). Guidelines for allied health: Resources required for the provision of quality rehabilitation services, Ver. 10, 1-16. Retrieved from http://dmsweb.daa.asn.au/files/Interest_Groups_National/ Rehab_Aged_Care/VIC__Chapter/GUI_guidelines_for_allied_health_version_10.pdf
American College of Physicians (ACP). (2015). Chronic Care Management Toolkit, 2015. Retrieved from www.acponline.org.
American Health Information Management Association (AHIMA) Distance Education. (2008). Benchmarking coding quality. Retrieved March 24, 2015, from http://campus.ahima.org/ audio/2008/RB072408.pdf
American Health Information Management Association (AHIMA) – HIM Body of Knowledge. (2009). Auditing copy and paste. Retrieved from http://library.ahima.org/xpedio/groups/public/documents/ahima/bok1_042416.hcsp?dDocName=bok1_042416
American Health Information Management Association (AHIMA). (2014, March 17). Appropriate use of the copy and paste functionality in electronic health records. Retrieved March 26, 2015, from http://library.ahima.org/xpedio/groups/public/ documents/ahima/bok1_050621.pdf
American Healthcare Solutions. (2015, January 11). Improving productivity: Spotlight on critical access facilities. Retrieved from http://www.hfmaregion11symposium.org/ materials/260_Ss-2__Improving_Productivity_a_Critical_Access_Facilities_-Stephanie_Dorwart.pdf
American Hospital Association. (2014). AHA Annual survey database, 2014. Retrieved from www.aha.org
American Medical Association. (2013). Current Procedural Terminology, 2013.Retrieved from http://www.ama.org

Assessment F (Workflow – Clinical)
The views, opinions, and/or findings contained in this report are those of the assessment team and should not be construed as an official government position, policy, or decision.
G-2
American Nurses Association. (1996). Nursing quality indicators: Definitions and implications. Washington, DC: American Nurses Publishing.
American Society of Health-System Pharmacists. (2013). ASHP pharmacy staffing survey results. Retrieved from http://www.ashp.org/DocLibrary/MemberCenter/SPPM/2013-ASHP-Staffing-Survey.pdf
Ananthakrishnan, A. N., McGinley, E. L., & Saeian, K. (2009). Outcomes of weekend admissions for upper gastrointestinal hemorrhage: A nationwide analysis. Clinical Gastroenterology and Hepatology, 7(3), 296-302e1. doi: 10.1016/j.cgh.2008.08.013
Anderson, F. D., Maloney, J. P., Knight, C.D. & Jennings, B. M. (1996). Utilization of supplemental agency nurses in an Army medical center. Military Medicine, 161(1), 48-53. Retrieved from http://www.ncbi.nlm.nih.gov/pubmed/11082752
Arora, V., Johnson, J., Lovinger, D., Humphrey, H. J., Meltzer, D. O. (2005). Communication failures in patient sign-out and suggestions for improvement: A critical incident analysis. Quality and Safety in Health Care, 14(6), 401-407. doi: 10.1136/qshc.2005.015107
Arrowood, D., Choate, E., Curtis, E., DeCathelineau, S., Drury, B., Fenton, S., ... & Williams, M. (2013). Integrity of the healthcare record. Best practices for EHR documentation. Journal of AHIMA/American Health Information Management Association, 84(8), 58.
Aujesky, D., Jimenez, D., Mor, M. K., Geng, M., Fine, M. J., & Ibrahim, S. A. (2009, February 24). Weekend versus weekday admission and mortality after acute pulmonary embolism. Circulation, 119.(7), 962-968. doi: 10.1161/circulationaha.108.824292
Australasian Faculty of Rehabilitation Medicine. Standards 2005: Adult rehabilitation medicine services in public and private hospitals. (2005). 1-12.
Barro, J., & Beaulieu, N. (2003). Selection and improvement: Physician responses to financial incentives. Retrieved from http://www.nber.org/papers/w10017.pdf
Bauer, M. S., Callahan, A. M., Jampala, C., Petty, F., Sajatovic, M., Schaefer, V., . . . Powell, B. J. (1999). Clinical practice guidelines for bipolar disorder from the Department of Veterans Affairs. Journal of Clinical Psychiatry, 60(1), 9-21. Retrieved from http://www.ncbi. nlm. nih.gov/pubmed/10074872
Blackwood, B., Alderdice, F., Burns, K., Cardwell, C., Lavery, G., O’Halloran P. (2011, January 13). Use of weaning protocols for reducing duration of mechanical ventilation in critically ill adult patients: Cochrane systematic review and meta-analysis. BMJ, 342. doi: http://dx. doi.org/10.1136/bmj.c7237
Blegen, M. A, Goode, C. J., Spetz, J., Vaughn, T., & Park, S. H. (2011). Nurse staffing effects on patient outcomes: safety-net and non-safety-net hospitals. Medical Care, 49(4), 406-414. doi: 10.1097/MLR.0b013e318202e129
Blunt, M. C., & Burchett, K. R. (2000, August 26). Out-of-hours consultant cover and case-mix-adjusted mortality in intensive care.” Lancet, 356(9231), 735-736. doi: 10.1016/S0140-6736(00)02634-9

Assessment F (Workflow – Clinical)
The views, opinions, and/or findings contained in this report are those of the assessment team and should not be construed as an official government position, policy, or decision.
G-3
Bond, C. A., Raehl, C. L., Pitterle, M. E., & Franke, T. (1999, February). Health care professional staffing, hospital characteristics, and hospital mortality rates. Pharmacotherapy, 19(2), 130-8. doi: 10.1592/phco.19.3.130.30915
Bradshaw, B. G., Liu, S. S., & Thirlby, R. C. (1998). Standardized Perioperative Care Protocols and Reduced Length of Stay After Colon Surgery. Journal of the American College of Surgeons, 186(5), 501-506. Retrieved from http://www.ncbi.nlm.nih.gov/pubmed/9583689
Brusco, N. K., Shields, N., Taylor N. F., & Paratz, J. (2007). A Saturday physiotherapy service may decrease length of stay in patients undergoing rehabilitation in hospital: A randomised controlled trial. Australian Journal of Physiotherapy, 53(2), 75-81. Retrieved from http://www.researchgate.net/profile/Nora_Shields/publication/6301165_A_Saturday_physiotherapy_service_may_decrease_length_of_stay_in_patients_undergoing_rehabilitation_in_hospital_a_randomised_controlled_trial/links/0c96051521fb9879c2000000.pdf
Bull, M. J. (1994). Patients’ and professionals’ perceptions of quality in discharge planning. Journal of Nursing Care Quality, 8(2), 47-61. Retrieved from http://www.ncbi.nlm.nih.gov/ pubmed/8312594
California Healthcare Foundation. (2011, April). Using tracking tools to improve patient flow in hospitals. Retrieved from http://www.chcf.org/~/media/media%20library %20Files/PDF/U/PDF%20UsingPatientTrackingToolsInHospitals.pdf
Campbell, E. M., Guappone, K. P., Sittig, D. F., Dykstra, R. H., & Ash, J. S.(2009, January). Computerized provider order entry adoption: Implications for clinical workflow. Journal of General Internal Medicine, 24(1), 21-26. doi: 10.1007/s11606-008-0857-9
Carlson, K. F., Nugent S.M., Grill J., & Sayer N.A. (2010). Accuracy of external cause-of-injury coding in VA polytrauma patient discharge records. Journal of Rehabilitation Research & Development, 47(8), 689-697. doi:10.1682/JRRD.2009.08.0118
Cavallazzi, R, Marik, PE, Hirani, A, Pachinburavan, M, Vasu, TS, Leiby, BE. (2010). Association between time of admission to the ICU and mortality: a systematic review and metaanalysis. Chest, 138(1), 68-75.
Centers for Disease Control. (2014). Clinical Staff Information. Retrieved from http://www.cdc.gov/longtermcare/staff.html
Center for Disease Control. (2011). National Hospital Ambulatory Medical Care Survey: 2011 Emergency Department summary tables. Retrieved from http://www.cdc.gov/ nchs/data/ahcd/nhamcs_emergency/2011_ed_web_tables.pdf
Centers for Medicare & Medicaid Services (CMS.gov). (2015, April 21). CMS countdown to ICD-10. Retrieved from http://www.cms.gov/Medicare/Coding/ICD10/index.html
Centers for Medicare & Medicain Services (CMS.gov). Hospital compare data – Survey of Patient Experiences (Hospital Consumer Assessment of Healthcare Providers and Systems Survey – HCAHPS). Retrieved from https://www.medicare.gov/hospitalcompare/Data/Measures-Displayed.html
Assessment F (Workflow – Clinical)
The views, opinions, and/or findings contained in this report are those of the assessment team and should not be construed as an official government position, policy, or decision.
G-4
Centers for Medicare & Medicain Services (CMS.gov). (2014). Hospital compare data – Timely and Effective Care (Emergency Department Throughput). Retrieved from https://www.medicare.gov/hospitalcompare/Data/Measures-Displayed.html
Chang, G., Weiss, A. P., Orav, E. J., Smallwood, J. A., Gonzalez, S., Kosowsky, J. M., & Rauch, S. L. (2012). Bottlenecks in the Emergency Department: The psychiatric clinicians' perspective. General Hospital Psychiatry, 34(4), 403-409. doi: 10.1016/j.genhosppsych.2012.03.005
Chen, L. M., Render, M., Sales, A., Kennedy, E. H., Wiitala, W., & Hofer, T. P. (2012, September 12). Intensive care unit admitting patterns in the Veterans Affairs Health Care System. Archives of Internal Medicine, 172(16), 1220-1226. doi: 10.1001/archinternmed.2012.2606
Cherlin, E. J., Curry, L. A., Thompson, J. W., Greysen, S. R., Spatz, E., Krumholz, H. M., & Bradley, E. H. (2013). Features of high-quality discharge planning for patients following acute myocardial infarction. Journal of General Internal Medicine, 28(3), 436-443. doi: 10.1007/s11606-012-2234-y
Chou, R., Qaseem, A., Snow, V., Casey, D., Cross, J. T., Shekelle, P., & Owens, D. K. (2007). Diagnosis and treatment of low back pain: A joint clinical practice guideline from the American College of Physicians and the American Pain Society. Annals of Internal Medicine, 147(7), 478-491. Retrieved from http://www.ncbi.nlm.nih.gov/ pubmed/17909209
Christie, H, Grimwood, M. (2006). Staffing: Can Physiotherapists and Occupational Therapists predict EFT per bed in acute care facilities? The Leading Edge, 32, 1-15.
Clark, J. S., Eichelmann, T. A., Fuller, J. C., Hays, S., Lobdell, B. B., Mangat, N., ... & Warner, D. M. (2012). Electronic documentation templates support ICD-10-CM/PCS implementation. Journal of AHIMA/American Health Information Management Association, 83(10), 66-71.
Cleveland Clinic. (2010). Focus on the patient experience: Office of Patient Experience. Retrieved from http://my.clevelandclinic.org/ccf/media/files/Patient-Experience/OPE-Newsletter-5-26-10.pdf
Coleman, E. A., Parry, C., Chalmers, S., & Min, S. J. (2006). The care transitions intervention: Results of a randomized controlled trial. Archives of Internal Medicine, 166(17), 1822-1828. Retrieved from http://www.ncbi.nlm.nih.gov/pubmed/17000937
Collins, M. (2009, August). Staffing an ED appropriately and efficiently. ACEP News. Retrieved from http://www.acep.org/Clinical---Practice-Management/Staffing-an-ED-Appropriately-and-Efficiently/
Committee on Quality of Health Care in America Institute of Medicine(IOM). (2001, March). Crossing the quality chasm: A new health system for the 21st century. Washington, DC: National Academy Press. Retrieved from http://www.nap.edu/openbook.php?isbn =0309072808
Conti, CR. (2003) Restricted weekend services result in delays in discharges from hospital. Clin Cardiol. 26(1)

Assessment F (Workflow – Clinical)
The views, opinions, and/or findings contained in this report are those of the assessment team and should not be construed as an official government position, policy, or decision.
G-5
Corrigan, J. M. (2012). Continuity of care: important, but only the first step. Israel journal of health policy research, 1(1), 1-3.
Curley, C., McEachern, J. E., & Speroff, T. (1998, August). A firm trial of interdisciplinary rounds on the inpatient medical wards: An intervention designed using continuous quality improvement. Medical Care, 36(8), AS4-AS12. Retrieved from http://www.jstor.org/ stable/3767037?seq=1#page_scan_tab_contents
Custers, T., Hurley, J., Klazinga, N. S., & Brown, A. D. (2008). Selecting effective incentive structures in health care: A decision framework to support health care purchasers in finding the right incentives to drive performance. BMC Health Services Research, 8(1), 66. doi: 10.1186/1472-6963-8-66
Danzi, J. T., Masencup, B., Brucker, M. A., & Dixon-Lee, C. (2000). Case study: Clinical documentation improvement program supports coding accuracy. Topics in Health Information Management, 21(2), 24-29. Retrieved from http://www.ncbi.nlm.nih.gov/ pubmed/11143276
Day, T. E., Al-Roubaie, A. R., & Goldlust, E. J. (2013, February). Decreased length of stay after addition of healthcare provider in Emergency Department triage: A comparison between computer-simulated and real-world interventions. Emergency Medicine Journal, 134-138. doi:10.1136/emermed-2012-201113
Department of Defense Task Force on Mental Health. (2007). An achievable vision: Report of the Department of Defense on Mental Health. Retrieved from http://healthjournalism.org/ resources-reports-details.php?id=17
NHS: Institute for Innovation and Improvement. (2008). Discharge planning. Retrieved from http://www.institute.nhs.uk/quality_and_service_improvement_tools/quality_and_service_improvement_tools/discharge_planning.html
Donaldson, N., Brown, D. S., Aydin, C. E., Bolton, M. L., & Rutledge, D. N. (2005). Leveraging nurse-related dashboard benchmarks to expedite performance improvement and document excellence. Journal of Nursing Administration, 35(4), 163-72. Retrieved from http://www.ncbi.nlm.nih.gov/pubmed/15834255
Doran, K. M., Raven, M. C., & Rosenheck, R. A. (2013, August). What drives frequent emergency department use in an integrated health system? National data from the Veterans Health Administration. Annals of Emergency Medicine, 62(2), 151-159. doi: 10.1016/ j.annemergmed.2013.02.016
Doty, B., Andres, M., Zuckerman, R. & Borgstrom, D. (2009). Use of locum tenens surgeons to provide surgical care in small rural hospitals. World Journal of Surgery, 33(2), 228-232. doi: 10.1007/s00268-008-9820-5
Drolet, A., DeJuilio, P., Harkless, S., Henricks, S., Kamin, E., Leddy, E.A., . . . Williams, S. (2013, February). Move to improve: The feasibility of using an early mobility protocol to increase ambulation in the intensive and intermediate care settings. Physical Therapy, 93(2), 197-207. doi: 10.2522/ptj.20110400
Assessment F (Workflow – Clinical)
The views, opinions, and/or findings contained in this report are those of the assessment team and should not be construed as an official government position, policy, or decision.
G-6
Dunn, L. (2015). CEOs love talking about culture. Here’s why they shouldn’t. Becker’s Hospital Review. Retrieved from http://www.beckershospitalreview.com/healthcare-blog/ceos-love-talking-about-culture-here-s-why-they-shouldn-t.html
Edmondson, E. A., Golden, B. R., & Young, G. J. (2006). Turnaround at the Veterans Health Administration. Boston, MA: Harvard Business School Publishing. VA Maine Healthcare Facebook page https://www.facebook.com/VAMaine
Engel, H. J., Tatebe, S., Alonzo, P. B., Mustille, R. L., & Rivera, M. J. (2013). Physical therapist–established intensive care unit early mobilization program: Quality improvement project for critical care at the University of California San Francisco Medical Center. Physical Therapy, 93(7), 975-985. doi: 10.2522/ptj.20110420
Epané, J. P. & Weech-Maldonado, R. (2015, January 15). Hospitalists as a staffing innovation: Eoes it impact hospital efficiency? Innovation and Entrepreneurship in Health, 2015(2), 1-8. doi: http://dx.doi.org/10.2147/IEH.S63132
Ernst, AT, Jiang, H, Krishnamoorthy, M, Sier, D. (2004). Staff scheduling and rostering: a review of applications, methods, and models. European Journal of Operations Research, 153, 3-27.
Fan, V. S., Burman, M., McDonell, M. B., & Fihn, S. D. (2005). Continuity of care and other determinants of patient satisfaction with primary care. Journal of General Internal Medicine, 20(3), 226-233.
Fedder, D. O., Chang, R. J., Curry, S., & Nichols, G. (2003). The effectiveness of a community health worker outreach program on healthcare utilization of west baltimore city medicaid patients with diabetes with or without hypertension. Ethnicity and Disease, 13(1), 22-27.
Fletcher, R. (2002). The importance of addressing inaccurate diagnosis related group assignment as a risk area. Journal of Health Care Compliance, 4(5), 40-46.
Fox, M. T., Persaud, M., Maimets, I., Brooks, D., O’Brien, K., & Tregunno, D. (2013). Effectiveness of early discharge planning in acutely ill or injured hospitalized older adults: A systematic review and meta-analysis. BMC Geriatrics, 13(1), 70. doi: 10.1186/1471-2318-13-70
Fraher, E., Harden, B., Kimball, M. (2011). An international call to arms to improve allied health workforce planning. Journal of Allied Health, 40(1), 43-49. Retrieved from http://www.ncbi.nlm.nih.gov/pubmed/21399852
Gajic, O., Afessa, B., Hanson, A. C., Krpata, T., Yilmaz, M., Mohamed, S. F., . . . Wylam, M. E. (2008, January). Effect of 24-hour mandatory versus on-demand critical care specialist presence on quality of care and family and provider satisfaction in the Intensive Care Unit of a teaching hospital. Critical Care Medicine, 36(1), 36-44. Retrieved from http://www.ncbi.nlm.nih.gov/pubmed/18007270
Gao, F., Melody, T., Daniels, D. F., Giles, S., & Fox, S. (2005). The impact of compliance with 6-hour and 24-hour sepsis bundles on hospital mortality in patients with severe sepsis: A prospective observational study. Critical Care, 9(6), R764-R770. doi: 10.1186/cc3909
Assessment F (Workflow – Clinical)
The views, opinions, and/or findings contained in this report are those of the assessment team and should not be construed as an official government position, policy, or decision.
G-7
Gaudet, T. (2014). The Transformation of Healthcare [Powerpoint slides]. Retrieved from http://www.nationalhealthcouncil.org/sites/default/files/NHC_Files/Pdf_Files/Gaudet-2014VHLC.pdf
Girard, T. D., Kress, J. P., Fuchs, B. D., Thomason, J. W., Schweickert, W. D., Pun, B. T., . . . Ely, E. W. (2008). Efficacy and safety of a paired sedation and ventilator weaning protocol for mechanically ventilated patients in intensive care (Awakening and Breathing controlled trial): A randomised controlled trial. The Lancet, 371(9607), 126-134. doi: 10.1016/S0140-6736(08)60105-1
Griffiths, J. D., Price-Lloyd, N., Smithies, M., & Williams, J. E. (2005). Modelling the requirement for supplementary nurses in an Intensive Care Unit. Journal of the Operational Research Society, 56(2), 126-133. Retrieved from http://www.jstor.org/stable/4102163
Guthrie, M. B. (1999). Challenges in developing physician leadership and management. Frontiers of Health Services Management, 15(4), 3-26. Retrieved from https://www. questia.com/library/journal/1P3-41905737/challenges-in-developing-physician-leadership-and
Hager, J. S. (2010). Effects of a discharge planning intervention on perceived readiness for discharge. Doctor of Nursing Practice Systems Change Projects. Paper 2. Retrieved from http://sophia.stkate.edu/cgi/viewcontent.cgi?article=1002&context=dnp_projects
Halasyamani, L., Kripalani, S., Coleman, E., Schnipper, J., Walraven, C., Nagamine, J., . . . Manning, D. (2006). Transition of care for hospitalized elderly patients: Development of a discharge checklist for hospitalists. Journal of Hospital Medicine, 1, 354-360. doi: 10.1002/jhm.129
Handel, D. A., Hilton, J. A., Ward, M. J., Rabin, E., Zwemer, F. L. Jr., & Pines, J. M. (2010, August). Emergency Department throughput, crowding, and financial outcomes for hospitals. Academic Emergency Medicine, 17(8), 840-847. doi: 10.1111/j.1553-2712.2010.00814.x
Hastings, Susan Nicole, et al. "Health services use of older veterans treated and released from Veterans affairs medical center emergency departments." Journal of the American Geriatrics Society 61.9 (2013): 1515-1521.
Harris, A. & McGillis Hall, L. (2012, March). Evidence to inform staff mix decision-making: A focused literature review. Canadian Nurses Association. Retrieved from https://www. cna-aiic.ca/~/media/cna/page-content/pdf-en/staff_mix_literature_review_e.pdf?la=en
HCPro. (2011). 2011 Coder Productivity Survey: A supplement to medical records briefing. Retrieved March 19, 2015, from http://www.hcpro.com/content/267408.pdf
HealthCatalyst. (2015). How to reduce healthcare labor costs by using an EDW and analytics. Retrieved from https://www.healthcatalyst.com/success_stories/texas-childrens-hospital-using-a-healthcare-enterprise-data-warehouse-and-analytics-to-reduce-labor-costs
Hearld, L., Alexander, J., Fraser, I., & Jiang, H. J. (2008). Review: How do hospital organizational structure and processes affect quality of care? A critical review of research methods. Medical Care Research and Review 65(3), 259-299.
Assessment F (Workflow – Clinical)
The views, opinions, and/or findings contained in this report are those of the assessment team and should not be construed as an official government position, policy, or decision.
G-8
Hibbard, J. H. & Greene, J. (2013, February). What the evidence shows about patient activation: Better health outcomes and care experiences; fewer data on costs. Health Affairs, 32(2), 207-214. doi: 10.1377/hlthaff.2012.1061
Hicks, T. A. & Gentleman, C. A. (2003). Improving physician documentation through a clinical documentation management program. Nursing Administration Quarterly, 27(4), 285-289. Retrieved from http://www.ncbi.nlm.nih.gov/pubmed/14649019
Hoerster, Katherine D., et al. "Health and health behavior differences: US Military, veteran, and civilian men." American journal of preventive medicine 43.5 (2012): 483-489.
Horwitz, L. I., Moin, T., Krumholz, H. M., Wang, L., & Bradley, E. H. (2008, September). Consequences of inadequate sign-out for patient care. Archives of Internal Medicine 168(16), 1755-1760. doi: 10.1001/archinte.168.16.1755
American Occupational Therapy Association (AOTA). (2015). How to get a license. Retrieved from http://www.aota.org/advocacy-policy/state-policy/licensure/how-to.aspx
Howard, C. M. & Felton, K. W. (2013). Determining hospital risk management staffing through analytics. Journal of Healthcare Risk Management, 33(2), 36-42. doi: 10.1002/jhrm.21125
Howell, E., Bessman, E., Kravet, S., Kolodner, K., Marshall, R., & Wright, S. (2008). Active bed management by hospitalists and Emergency Department throughput. Annals of Internal Medicine, 149(11), 804-811. doi:10.7326/0003-4819-149-11-200812020-00006
Hughes, K. K. & Marcantonio, R. J. (1991). Recruitment, retention, and compensation of agency and hospital nurses. Journal of Nursing Administration, 21(10), 46-52. Retrieved from http://journals.lww.com/jonajournal/Citation/1991/10000/ Recruitment,_Retention,_ and_Compensation_of_Agency.12.aspx
Humphries, K. H., Rankin, J. M., Carere, R. G., Buller, C. E., Kiely, F. M., & Spinelli, J. J. (2000). Co-morbidity data in outcomes research: Are clinical data derived from administrative databases a reliable alternative to chart review? Journal of Clinical Epidemiology, 53(4), 343-349. Retrieved from http://www.ncbi.nlm.nih.gov/pubmed/10785564
Hung, R. (2002). A note on nurse self-scheduling. Nursing Economics, 20(1), 37-39. Retrieved from http://www.ncbi.nlm.nih.gov/pubmed/11892546
Huttner, B., Goossens, H., Verheij, T., & Harbarth, S. (2010). Characteristics and outcomes of public campaigns aimed at improving the use of antibiotics in outpatients in high-income countries. The Lancet infectious diseases, 10(1), 17-31.
Hwang, U., McCarthy, M. L., Aronsky, D., Asplin, B., Crane, P. W., Craven, C. K., . . . Bernstein, S. L. (2011, May). Measures of crowding in the Emergency Department: A systematic review. Academic Emergency Medicine, 18(5), 527-538. doi: 10.1111/j.1553-2712.2011.01054.x
Institute for Healthcare Improvement (IHI). (2014). Better patient flow means breaking down the silos. Retrieved from http://www.ihi.org/resources/Pages/ ImprovementStories/BetterPatientFlowMeansBreakingDowntheSilos.aspx

Assessment F (Workflow – Clinical)
The views, opinions, and/or findings contained in this report are those of the assessment team and should not be construed as an official government position, policy, or decision.
G-9
Institute of Medicine (U.S). (2001, March). Committee on Quality of Health Care in America. Crossing the quality chasm: A new health system for the 21st century. Retrieved from http://www.nap.edu/html/quality_chasm/reportbrief.pdf
“Intermountain Healthcare.” Telephone interview. 2 April 2015.
“Intermountain Healthcare.” Telephone Interview. 5 May 2015.
“Intermountain Healthcare.” Telephone Interview. 19 May 2015.
Jha, A. K., Perlin, J. B., Kizer, K. W., & Dudley, R. A. (2003). Effect of the transformation of the Veterans Affairs Health Care System on the quality of care. New England Journal of Medicine, 348(22), 2218-2227. doi: 10.1056/NEJMsa021899
Johns, M. L.(2013.) Breaking the glass ceiling: Structural, cultural, and organizational barriers preventing women from achieving senior and executive positions. Perspectives in Health Information Management, 1-11. Retrieved from http://www.ncbi. nlm.nih.gov/pmc/articles/PMC3544145/
Joint Commission. (2011). Approved: New standard regarding credentialing and privileging requirements for licensed independent practitioners in long-term care. Joint Commission Perspectives 31(7).
Joint Commission. (2011, July 5). Credentialing standard: Long-term care and Medicare/Medicaid long-term care accreditation programs. HR.02.01.04.
Jong, J. D., Westert, G. P., Lagoe, R., & Groenewegen, P. P. (2006). Variation in hospital length of stay: Do physicians adapt their length of stay decisions to what is usual in the hospital where they work? Health Services Research, 41(2), 374-394. Retrieved from http://www. ncbi.nlm.nih.gov/pubmed/16584454
Kane, R. L., Shamliyan, T., Mueller, C., Duval, S., Wilt, T. (2007). Nurse staffing and quality of patient care. AHRQ Publication No. 151. Available at: www.ahrq.gov/downloads/pub/evidence/pdf/nursestaff/nursestaff.pdf.
Kane, R. L., Shamliyan, T., Mueller, C., Duval, S., Wilt, T. (2007). The association of registered nurse staffing levels and patient outcomes. Medical Care, 45 (12), 1195-1204.
Kerlin, M. P., Small, D. S., Cooney, E., Fuchs, B. D., Bellini, L. M., Mikkelsen, M.E., . . . Halpern, S. D. (2013, June 6). A randomized trial of nighttime physician staffing in an Intensive Care Unit. New England Journal of Medicine, 368(23), 2201-2209. doi: 10.1056/ NEJMoa1302854
Kieszak, S. M., Flanders, W. D., Kosinski, A. S., Shipp, C. C., & Karp, H. (1999). A comparison of the Charlson comorbidity index derived from medical record data and administrative billing data. Journal of Clinical Epidemiology, 52(2), 137-142. Retrieved from http://www.ncbi.nlm. nih.gov/pubmed/10201654
Kim, Y. J. & Soeken, K. L. ( 2005). A meta-analysis of the effect of hospital-based case management on hospital length-of-stay and readmission. Journal of Nursing Research, 54(4), 255-264. Retrieved from http://www.ncbi.nlm.nih.gov/pubmed/16027568

Assessment F (Workflow – Clinical)
The views, opinions, and/or findings contained in this report are those of the assessment team and should not be construed as an official government position, policy, or decision.
G-10
Klein, S. (2011). The Veterans Health Administration: Implementing patient-centered medical homes in the nation's largest integrated delivery system. Retrieved from http://www.commonwealthfund.org/publications/case-studies/2011/sep/va-medical-homes
Kleinpell, R. M., Munro, C. L., & Giuliano, K. K. (2008). Targeting health care-associated infections: Evidence-based strategies. In R. D. Hughes (Ed.), Patient Safety and Quality: An Evidence-Based Handbook for Nurses. (Chapter 42). Rockville, MD: Agency for Healthcare Research and Quality.
Knake, Lindasay. ” Saginaw VA hospital program gives veterans company, support in their final days.” The Sagninaw News. Sept. 2010.
Kneeland, P. P., Kneeland, C., & Wachter, R. (2010). Bleeding talent: A lesson from industry on embracing physician workforce challenges. Journal of Hospital Medicine, 5(5), 306-310. doi: 10.1002/jhm.594
Kolber, M. J., Hanney, W. J., Lamb, B. M., & Trukman, B. (2013). Does physical therapy visit frequency influence acute care length of stay following knee arthroplasty? A Systematic Review. 29(1), 25-29. doi: 10.1097/TGR.0b013e3182767262
Kostis, W. J., Demissie, K., Marcella, S. W., Shao, Y. H., Wilson, A. C., Moreyra A. E., & Myocardial Infarction Data Acquisition System (MIDAS 10) Study Group. (2007, March 15). Weekend versus weekday admission and mortality from myocardial infarction. New England Journal of Medicine, 356(11), 1099–1109. doi: 10.1056/NEJMoa063355
Kravet, S. J., Levine, R. B., Rubin, H. R., & Wright, S. M. (2007). Discharging patients earlier in the day: A concept worth evaluating. The Health Care Manager, 26(2), 142-146. Retrieved from http://www.ncbi.nlm.nih.gov/pubmed/17464227
Krejci, Laura P., Kennita Carter, and Tracy Gaudet. "Whole Health: The Vision and Implementation of Personalized, Proactive, Patient-driven Health Care for Veterans." Medical care 52 (2014): S5-S8.
VHA Blueprint for Excellence (2014)
Kumar, Gayathri S., and Robin Klein. "Effectiveness of case management strategies in reducing emergency department visits in frequent user patient populations: a systematic review." The Journal of emergency medicine 44.3 (2013): 717-729.
Labor Management Institute. (2014, February 28). 2013 Survey of Hours Report. Retrieved from http://lminstitute.com/products/2013-electronic-annual-survey-of-hours-report
Lagoe, R. J., Johnson, P. E., & Murphy, M. P. (2011). Inpatient hospital complications and lengths of stay: A short report. BMC Research Notes, 4, 135. doi: 10.1186/1756-0500-4-135
Lawson, E. H., Louie, R., Zingmond, D. S., Brook, R. H., Hall, B. L., Han, L., . . . Ko, C. Y. (2012). A comparison of clinical registry versus administrative claims data for reporting of 30-day surgical complications. Annals of Surgery, 256(6), 973-981. doi: 10.1097/SLA. 0b013e31826b4c4f
Assessment F (Workflow – Clinical)
The views, opinions, and/or findings contained in this report are those of the assessment team and should not be construed as an official government position, policy, or decision.
G-11
Leape, L., Berwick, D., Clancy, C., Conway, J., Gluck, P., Guest, J., . . . Isaac, T. (2009). Transforming healthcare: A safety imperative. Quality and Safety in Health Care, 18(6), 424-428. doi: 10.1136/qshc.2009.036954
Leebov, W. (2001). How to help your staff strengthen customer service: A do-able approach. Clinical Leadership & Management Review. The Journal of CLMA, 15(3), 192-195. Retrieved from http://www.ncbi.nlm.nih.gov/pubmed/11392707
Lindenauer, P. K., Remus, D., Roman, S., Rothberg, M. B., Benjamin, E. M., Ma, A., & Bratzler, D. W. (2007). Public reporting and pay for performance in hospital quality improvement. New England Journal of Medicine, 356(5), 486-496. Retrieved from http://www.ncbi.nlm. nih.gov/pubmed/17259444
Lindsay, M., Palmer, K., Hill, T., Schauer, W., Buckingham, T., & Tenenbaum, J. (2014). New Models for Rural Post-Acute Care: Critical Access Hospitals Optimize Patient Outcomes, Value, and Financial Stability. Retrieved from http://www.allevant.com/assets/documents/ New%20Models%20for%20Rural%20Post%20Acute%20Care%20White%20Paper.pdf
Locatelli, S. M., Turcios, S., & LaVela, S. L. (2014). Veterans’ experiences of patient-centered care: Learning from guided tours. Patient Experience Journal, 1(1), 88-94. Retrieved from http://pxjournal.org/cgi/viewcontent.cgi?article=1013&context=journal
Love, R. A., Murphy, J. A., Lietz, T. E. & Jordan, K. S. (2012). The effectiveness of a provider in triage in the Emergency Department: A quality improvement initiative to improve patient flow. Advanced Emergency Nursing Journal, 34(1), 65-74. doi: 10.1097/TME. 0b013e3182435543
Luxford, K., Safran, D. G., & Delbanco, T. (2011, October). Promoting patient-centered care: A qualitative study of facilitators and barriers in healthcare organizations with a reputation for improving the patient experience. International Journal for Quality in Health Care, 23(5), 510-515. doi: 10.1093/intqhc/mzr024
Magill, S. S., Edwards, J. R., Bamberg, W., Beldavs, Z. G., Dumyati, G., Kainer, M. A., . . . Fridkin, S. K. (2014). Multistate point-prevalence survey of health care-associated infections. New England Journal of Medicine, 370(13), 1198-1208. doi: 10.1056/NEJMoa1306801
Manary, M. P., Boulding, W., Staelin, R., & Glickman, S. W. (2013, January 17). The patient experience and health outcomes. New England Journal of Medicine, 368(3), 201-203. doi: 10.1056/NEJMp1211775
Manary, M., Staelin, R., Kosel, K., Schulman, K. A., & Glickman, S. W. (2014, June 20). Organizational characteristics and patient experiences with hospital care: a survey study of hospital chief patient experience officers. American Journal of Medical Quality. doi: 10.1177/1062860614539994
McHugh, G. & Swain, I. D. (2014, May 14). A comparison between reported therapy staffing levels and the Department of Health therapy staffing guidelines for stroke rehabilitation: A national survey. BMC Health Services Research. doi: 10.1186/1472-6963-14-216

Assessment F (Workflow – Clinical)
The views, opinions, and/or findings contained in this report are those of the assessment team and should not be construed as an official government position, policy, or decision.
G-12
McLaughlin, N., Afsar-Manesh, N., Ragland, V., Buxey, F., & Martin, N. A. (2014). Tracking and sustaining improvement initiatives: Leveraging quality dashboards to lead change in a Neurosurgical Department. Neurosurgery, 74(3), 235-244. doi: 10.1227/NEU. 0000000000000265
McMillan, T. M. & Ledder, H. (2001, December). A survey of services provided by community neurorehabilitation teams in southeast England. Clinical Rehabilitation, 15(6), 582-588. doi: 10.1191/0269215501cr541oa
McNaughton, C., Self, W. H., Jones, I. D., Arbogast, P. G., Chen, N., Dittus, R. S. & Russ, S. (2012, October). ED crowding and the use of nontraditional beds. The American Journal of Emergency Medicine, 30(8), 1474-1480. doi: 10.1016/j.ajem.2011.12.007
Medical Group Management Association (MGMA). (2014). MGMA Physician Compensation and Production Survey.
Medscape. (2012, August 23). EHR Report 2012: Physicians Rank top EHRs. Retrieved March 19, 2015, from http://www.medscape.com/features/slideshow/EHR2012#1
Menchine, M. D. & Baraff, L. J. (2008, April). On-call specialists and higher level of care transfers in California Emergency Departments. Academic Emergency Medicine, 15(4), 329-336. doi: 10.1111/j.1553-2712.2008.00071.x
Miani, C., Ball, S., Pitchforth, E., Exley, J., King, S., Roland, M., . . . Nolte, E. (2014). Organisational interventions to reduce length of stay in hospital. Health Services and Delivery Research, 2(52). doi: 10.3310/hsdr02520
Mudge, A., Laracy, S., Richter, K., & Denaro, C. (2006). Controlled trial of multidisciplinary care teams for acutely ill medical inpatients: Enhanced multidisciplinary care. Internal Medicine Journal, 36(9), 558-563. Retrieved from http://www.ncbi.nlm.nih.gov/pubmed/16911547
Mundinger, M. O., Kane, R. L., Lenz, E. R., Totten, A. M., Tsai, W. Y., Cleary, P.D., . . . Shelanski, M. L. (2000). Primary care outcomes in patients treated by nurse practitioners or physicians: A randomized trial. Journal of the American Medical Association 283(1), 59-68. doi: 10.1001/jama.283.1.59
Nancarrow, SA, Booth, A, Ariss, S, Smith, T, Enderby, P, Roots, A. (2013). Ten principles of good interdisciplinary team work. Human Resources for Health, 11(19).
National Alliance to End Homelessness. (2015). The State of Homelessness in America 2015. Washington, DC.
Naylor, M. D., Brooten, D., Campbell, R., Jacobsen, B. S., Mezey, M. D., Pauly, M. V., & Schwartz, J. S. (1999). Comprehensive discharge planning and home follow-up of hospitalized elders – A randomized clinical trial. Journal of the American Medical Association, 281(7), 613-620. Retrieved from http://www.ncbi.nlm.nih.gov/pubmed/10029122
Needleman J, Buerhaus P, Mattke S, Stewart M, Zelevinsky K. (2002). Nurse-staffing levels and the quality of care in hospitals. N Engl J Med, 346(22), 1715-22.

Assessment F (Workflow – Clinical)
The views, opinions, and/or findings contained in this report are those of the assessment team and should not be construed as an official government position, policy, or decision.
G-13
Needleman, J., Buerhaus, P., Pankratz, V. S., Leibson, C. L., Stevens, S. R., & Harris, M. (2011). Nurse staffing and inpatient hospital mortality. New England Journal of Medicine, 364, 1037-1045. doi: 10.1056/NEJMsa1001025
Office of the Assistant Secretary for Planning and Evaluation (2015). 2015 Poverty Guidelines. Retrieved from: http://aspe.hhs.gov/2015-poverty-guidelines
Office of the Inspector General, Department of Veterans Affairs. (2012, August 30). Audit of Medical Care Collections Fund Billing of VA-Provided Care. Washington, DC.
Office of the Inspector General, Department of Veterans Affairs. (2012, December 27). Audit of Physician Staffing Levels for Specialty Care Services. Washington, DC.
Office of the Inspector General, Department of Veterans Affairs. (2009, April 6). Audit of Veterans Health Administration Mental Health Initiative Funding. Washington, DC.
Office of the Inspector General, Department of Veterans Affairs. (2010, June 7). Audit of VISN Procurement Practices for FSS Professional and Allied Healthcare Staffing Services. Washington, DC.
Office of the Inspector General, Department of Veterans Affairs. (2013, April 30). Combined Assessment Program Summary Report: Evaluation of Nurse Staffing in Veterans Health Administration Facilities. Washington, DC.
Office of the Inspector General, Department of Veterans Affairs. (2012, May 17). Combined Assessment Program Summary Report: Evaluation of Quality Management in Veterans Health Administration Facilities Fiscal Year 2011. Washington, DC.
Office of the Inspector General, Department of Veterans Affairs. (2006, February 2). Combined Assessment Program Review of the Oklahoma City VA Medical Center: Oklahoma City, Oklahoma. Washington, DC
Office of the Inspector General, Department of Veterans Affairs. (2008, January 4). Combined Assessment Program Review of the Philadelphia VA Medical Center: Philadelphia, Pennsylvania. Washington, DC.
Office of the Inspector General, Department of Veterans Affairs. (2012, February 16). Combined Assessment Program Review of the Samuel S. Stratton VA Medical Center: Albany, New York. Washington, DC.
Office of the Inspector General, Department of Veterans Affairs. (2006, February 2). Combined Assessment Program Review of the South Texas Veterans Health Care System: San Antonio, Texas. Washington, DC.
Office of the Inspector General, Department of Veterans Affairs. (2012, February 29). Combined Assessment Program Review of the VA Gulf Coast Veterans Health Care System: Biloxi, Mississippi. Washington, DC.
Office of the Inspector General, Department of Veteran Affairs (2012). Emergency Department Delays Memphis VA Medical Center – Memphis, TN. Washington, DC

Assessment F (Workflow – Clinical)
The views, opinions, and/or findings contained in this report are those of the assessment team and should not be construed as an official government position, policy, or decision.
G-14
Office of the Inspector General, Department of Veteran Affairs (2014). Emergency Department Staffing and Patient Safety Issues, VA San Diego Health care System. Washington, DC
Office of the Inspector General, Department of Veterans Affairs. (2010, April 28). Evaluation of Emergency Departments and Urgent Care Clinics in Veterans Health Administration Facilities. Washington, DC.
Office of the Inspector General, Department of Veteran Affairs (2014). Evaluation of Quality Management in VHA Admin Facilities. Washington, DC
Office of the Inspector General, Department of Veterans Affairs. (2006, June 12). Follow-Up Evaluation of Clinical and Administrative Issues, Bay Pines Health Care System, Bay Pines, Florida. Washington, DC.
Office of the Inspector General, Department of Veterans Affairs. (2011, June 22). Healthcare Inspection: A Follow-up Review of VHA Mental Health Residential Rehabilitation Treatment Programs (MH RRTP). Washington, DC.
Office of the Inspector General, Department of Veterans Affairs. (2004, August 13). Healthcare Inspection: Evaluation of Nurse Staffing in Veterans Health Administration Facilities. Washington, DC.
Office of the Inspector General, Department of Veterans Affairs. (2009, June 25). Healthcare Inspection: Review of Veterans Health Administration Residential Mental Health Care Facilities. Washington, DC.
Office of the Inspector General, Department of Veterans Affairs. (2011, February 15). Issues with Quality of Patient Care and Communication Hampton VA Medical Center: Hampton, Virginia. Washington, DC.
Office of the Inspector General, Department of Veterans Affairs. (2004, August 11). Issues at VA Medical Center Bay Pines, Florida, and Procurement and Deployment of the Core Financial and Logistics System (CoreFLS). Washington, DC.
Office of the Inspector General, Department of Veterans Affairs. (2013, April 17). Mismanagement of Inpatient Mental Health Care Atlanta VA Medical Center: Decatur, Georgia. Washington, DC.
Office of the Inspector General, Department of Veterans Affairs. (2015, January 30). OIG Determination of Veterans Health Administration’s Occupational Staffing Shortages. Washington, DC.
Office of the Inspector General, Department of Veterans Affairs. (2009, September 18). Quality of Care, Documentation, and Courtesy Issues, Hampton VA Medical Center: Hampton, Virginia. Washington, DC.
Office of the Inspector General, Department of Veterans Affairs. (2013, December 30). Quality of Care Issues San Juan VA Medical Center: San Juan, Puerto Rico. Washington, DC.
Office of the Inspector General, Department of Veterans Affairs. (2010, December 9). Review of Quality of Care at a VA Medical Center. Washington, DC.

Assessment F (Workflow – Clinical)
The views, opinions, and/or findings contained in this report are those of the assessment team and should not be construed as an official government position, policy, or decision.
G-15
Office of the Inspector General, Department of Veterans Affairs. (2007, January 8). Review of Resident Supervision Documentation and Billing Practices in Veterans Health Administration Facilities. Washington, DC.
Office of the Inspector General, Department of Veterans Affairs. (2006, September 27). Review of Selected Financial and Administrative Operations at VISN 1 Medical Facilities. Washington, DC.
Office of the Inspector General, Department of Veterans Affairs. (2012, April 23). Review of Veterans’ Access to Mental Health Care. Washington, DC.
Office of the Inspector General, Department of Veterans Affairs. (2014). Semiannual Report to Congress (SAR) April 1-September 30, 2014. Washington, DC.
Office of the Inspector General, Department of Veterans Affairs. (2013). Semiannual Report to Congress, April 1-September 30, 2013. Washington, DC
Office of the Inspector General, Department of Veterans Affairs. (2009). Semiannual Report to Congress (SAR). Washington, DC
Office of the Inspector General, Department of Veterans Affairs (2010). Semiannual Report to Congress (SAR). Washington, DC
Our Businesses. (2015). In McKesson. Retrieved June 11, 2015, from http://www.mckesson. com/about-mckesson/our-businesses
Parry, M. J., Watt, W. J., Hodnett, E., Tranmer, J., Dennis, C. L., & Brooks, D. (2009). Cardiac home education and support trial (CHEST): A pilot study. Canadian Journal of Cardiology, 25(12), e393-e398. Retrieved from http://www.ncbi.nlm.nih.gov/pubmed/19960132
Patel, I., Chang, J., Srivastava, J., Feldman, S., Levender, M., & Balkrishnan, R. (2011). Patient satisfaction with obstetricians and gynecologists compared with other specialties: Analysis of US self-reported survey data. Journal of Patient Related Outcome Measures, 2, 21-26. doi: 10.2147/PROM.S15747
Patel, P. B., Combs, M. A., & Vindson, D. R. (2014). Reduction of admit wait Times: The effect of a leadership‐based program. Academic Emergency Medicine, 21(3), 266-273. doi: 10.1111/acem.12327
Patient Voice: Every Patient Matters. Every Voice Counts. (2015). Retrieved from: http://www.pressganey.com/ourSolutions/patient-voice/regulatory-surveys/hcahps-survey.aspx
Patrician, P.A., Loan, L., McCarthy, M., Fridman, M., Donaldson, N., Bingham, M., & Brosch, L. R. (2011). The association of shift-level nurse staffing with adverse patient events. Journal of Nursing Administration, 41(2), 64–70. doi: 10.1097/NNA.0b013e31820594bf
Peberdy, M. A., Ornato, J. P., Larkin, L., Braithewait, R. S., Kashner, M., Carey, S. M., . . . Berg, R. A. (2008). Survival from in-hospital cardiac arrest during nights and weekends. Journal of the American Medical Association, 299(7), 785-792. doi: 10.1001/jama.299.7.785
Assessment F (Workflow – Clinical)
The views, opinions, and/or findings contained in this report are those of the assessment team and should not be construed as an official government position, policy, or decision.
G-16
Perlin, J. B., Kolodner, R. M., & Roswell, R. H. (2004). The Veterans Health Administration: Quality, value, accountability, and information as transforming strategies for patient-centered care. HealthCare Papers, 5(4), 10-24. Retrieved from http://www.ncbi.nlm. nih.gov/pubmed/16088305
Peterson, M. G., Cioppa-Mosca, J., Finerty, E., Graziano, S., King, S., & Sculpo, T. P. (2008). Effectiveness of best practice implementation in reducing hip arthroplasty length of stay. The Journal of Arthroplasty 23(1), 69-73. doi: 10.1016/j.arth.2006.12.044
Phoenix Physicians LLC. (2011). Throughput in the Emergency Department: What is the responsibility of your ER physician group? Retrieved from http://www. phoenixphysicians.com/downloads/PhoenixWhitePaper-ThroughputInTheED.pdf
Pillow, M. T., Doctor, S., Brown, S., Carter, K., & Mulliken, R. (2013). An emergency department-initiated, web-based, multidisciplinary approach to decreasing Emergency Department visits by the top frequent visitors using patient care plans. The Journal of Emergency Medicine, 44(4), 853-860. doi: 10.1016/j.jemermed.2012.08.020
Pines, J. M., Mutter, R. L., & Zocchi, M. S. (2013). Variation in emergency department admission rates across the United States. Medical Care Research and Review, 1077558712470565
Price, R. A., Elliott, M. N., Zaslavsky, A. M., Hays, R. D., Lehrman, W. G., Rybowski, L., ... & Cleary, P. D. (2014). Examining the role of patient experience surveys in measuring health care quality. Medical Care Research and Review, 71(5), 522-554
Pronovost, P. J., Angus, D. C., Dorman, T., Robinson, K. A., Dremsizov, T. T., & Young, T. L. (2002). Physician staffing patterns and clinical outcomes in critically ill patients: A systematic review. Journal of the American Medical Association, 288(17), 2151-2162. Retrieved from http://www.ncbi.nlm.nih.gov/pubmed/12413375
Prophet, S. (2001) Practice brief: Developing a physician query process. Journal of AHIMA, 72(9), 88I-M. Retrieved from http://pinnacleapps.com/HIM205/AppendixC.pdf
Prophet, Sue. "Coding Compliance: Practical Strategies for Success." Journal of AHIMA 69,
no.1 (1998): 50-61.
Proudlove, N. C., Gordon, K., & Boaden, R. (2003). Can good bed management solve the overcrowding in accident and Emergency Departments? Emergency Medicine Journal 20, 149-155. doi: 10.1136/emj.20.2.149
Rapoport, J. & Judd-Van Eerd, M. (1989). Impact of physical therapy weekend coverage on length of stay in an acute care community hospital. Physical Therapy, 69(1), 32-37. Retrieved from http://www.ncbi.nlm.nih.gov/pubmed/2911615
Retezar, R., Bessman, E., Ding, R., Zeger, S. L., & McCarthy, M. L. (2011). The effect of triage diagnostic standing orders on Emergency Department treatment time. Annals of emergency medicine 57(2), 89-99. doi: 10.1016/j.annemergmed.2010.05.016
Robert Wood Johnson Foundation and Shaller Consulting Group. (2012, April). Improving patient experience in the inpatient setting: A case study of three hospitals. Retrieved from

Assessment F (Workflow – Clinical)
The views, opinions, and/or findings contained in this report are those of the assessment team and should not be construed as an official government position, policy, or decision.
G-17
https://www.ruralcenter.org/tasc/resources/improving-patient-experience-inpatient-setting-case-study-three-hospitals
Rogers, J. L., Feinglass, J., Martin, G. J., Hughes, R. L., Handler, I., & Stoms, G. B. (1989). Longer hospitalization at Veterans Administration hospitals than private hospitals: Verification and additional insights. Medical Care, 27(10), 928-936. Retrieved from http://www.ncbi.nlm. nih.gov/pubmed/2796412.
Rosenthal, G. E., Kaboli, P. J., & Barnett, M. J. (2003). Differences in length of stay in Veterans Health Administration and other United States hospitals: Is the gap closing? Medical Care, 41(8), 882-894. Retrieved from http://www.ncbi.nlm.nih.gov/pubmed/12886169
Rosenthal, G. E., Sarrazin, M. V., Harper, D. L., & Fuehrer, S. M. (2003). Mortality and length of stay in a Veterans Administration hospital and private sector hospitals serving a common market. Journal of General Internal Medicine, 18(8), 601-608. doi: 10.1046/j.1525-1497.2003.11209.x
Russ, S., Jones, I., Aronsky, D., Dittus, R. S., & Slovis, C. M. (2010). Placing physician orders at triage: The effect on length of stay. Annals of Emergency Medicine 56(1), 27-33. doi: 10.1016/j.annemergmed.2010.02.006
Russo, R., Fitzgerald, S. P., Eveland, J. D., Fuchs, B. D., & Redmon, D. P. (2013). Improving physician clinical documentation quality: Evaluating two self-efficacy-based training programs. Health Care Management Review, 38(1), 29-39. doi: 10.1097/HMR. 0b013e31824c4c61
Saleem, J. J., Flanagen, M. E., Wilck, N. E., Demetriades, J., & Doebelling, B. N. (2013). The next-generation electronic health record: Perspectives of key leaders from the US Department of Veterans Affairs. Journal of the American Medical Informatics Association, 20(e1), e175-e177. doi: 10.1136/amiajnl-2013-001748
Sanchez, M., Smally, A. J., Grant, R. J., & Jacobs, L. M. (2006). Effects of a fast-track area on Emergency Department performance. The Journal of Emergency Medicine 31(1), 117-120. Retrieved from http://www.ncbi.nlm.nih.gov/pubmed/16798173
Sadowski LS, Kee RA, VanderWeele TJ, Buchanan D. Effect of a housing and case management program on emergency department visits and hospitalizations among chronically ill homeless adults: a randomized trial. JAMA. 2009; 301:1771–8.
Sandvik, D., Bade, P., Dunham, A., & Hendrickson, S. (2013). A hospital-to-nursing home transfer process associated with low hospital readmission rates while targeting uality of care, patient safety, and convenience: A 20-year perspective. Journal of the American Medical Directors Association, 14(5), 367-374. doi: 10.1016/j.jamda.2012.12.007
Sanofi: Managed Care Digest Series. (2014). Post-reform integration trends shift to performance based delivery model, 9th Edition. Retrieved from https://www. managedcaredigest.com/ereader/HospitalsSystemsDigest/files/assets/common/downloads/2012_2013HospSysDigest.pdf

Assessment F (Workflow – Clinical)
The views, opinions, and/or findings contained in this report are those of the assessment team and should not be construed as an official government position, policy, or decision.
G-18
Santos, S., Murphy, G., Baxter, K., & Robinson, K. M. (2008). Organisational factors affecting the quality of hospital clinical coding. Health Information Management Journal, 37(1), 25-37. Retrieved from http://www.himaa.org.au/members/journal/HIMJ_37_1_2008/ Santos%20et%20al%20Organisational%20factors%20affecting%20quality%20coding.pdf
Sara, M., Turcios, B. S., & CEPEP, S. (2014). Veterans’ experiences of patient-centered care: Learning from guided tours. Patient Experience Journal, 1(1), 88-94.
Schiff, G. D. & Bates, D. W. (2010). Can electronic clinical documentation help prevent diagnostic errors? New England Journal of Medicine, 362(12), 1066-1069. doi: 10.1056/NEJMp0911734
Schoo, A., Ridoutt, L., & Santos, T. (2006). Workload capacity measures for use in allied health workforce planning. Victoria Department of Human Services, 1-62. Retrieved from http://www.humancapitalalliance.com.au/downloads/DH39%20Workload%20Capacity%20Measures.pdf
Shaheen, A. A., Kaplan, G. G., & Myers, R. P. (2009). Weekend versus weekday admission and mortality from gastrointestinal hemorrhage caused by peptic ulcer disease. Clinical Gastroenterology and Hepatology, 7(3), 303–310. doi: 10.1016/j.cgh.2008.08.033
Shepperd, S., Parkes, J., McClaren, J., & Phillips, C. (2004). Discharge planning from hospital to home. The Cochrane Database of Systemic Reviews, 1. Retrieved from http://www.ncbi. nlm.nih.gov/pubmed/14973952
Sheehy, Ann M., et al. "Hospitalized but not admitted: characteristics of patients with “observation status” at an academic medical center." JAMA internal medicine 173.21 (2013): 1991-1998. Retrieved from http://www.ncbi.nlm.nih.gov/pubmed/23835927
SHM (Society of Hospital Medicine). (2006). Measuring hospitalist performance: Metrics, reports, and dashboards. Retrieved March 21, 2015, from http://www.hospitalmedicine.org/CMDownload.aspx?ContentKey=c15c7125-c57d-40f0-954d-bc0acd3240db&ContentItemKey=b664aaff-5c98-4a04-8653-5d45edc8166d)
Siggeirsdottir, K., Olafsson, O., Jonsson, H., Iwarsson, S., Gudnason, V., & Jonsson, B. Y. (2005). Short hospital stay augmented with education and home-based rehabilitation improves function and quality of life after hip replacement: Randomized study of 50 patients with 6 months of follow-up. Acta Orthopaedica, 76(4), 555-562. Retrieved from http://www. ncbi.nlm.nih.gov/pubmed/16195074
Silow-Carroll, S., Alteras, T., & Meyer, J. A. (2007). Hospital quality improvement: strategies and lessons from US hospitals. USA: Commonwealth Fund.
Singer, S. J., Rivard, P. E., Hayes, J. E., Shokeen, P., Gaba, D., & Rosen, A. (2013). Improving patient care through leadership engagement with frontline staff: A Department of Veterans Affairs case study. Joint Commission Journal on Quality and Patient Safety, 39(8), 349-360. Retrieved from http://www.ncbi.nlm.nih.gov/pubmed/23991508
Snow, C. & Hambrick, D. (1980). Measuring organizational strategies: Some theoretical and methodological problems. Academy of Management Review 5(4), 527-538.
Assessment F (Workflow – Clinical)
The views, opinions, and/or findings contained in this report are those of the assessment team and should not be construed as an official government position, policy, or decision.
G-19
Soong, C., Daub, S., Lee, J., Majewski, C., Musing, E., Nord, P., . . . Bell, C. M. (2013). Development of a checklist of safe discharge practices for hospital patients. Journal of Hospital Medicine, 8(8), 444-449. doi: 10.1002/jhm.2032
Southwick, F., Lewis, M., Treloar, D., Cherabuddi, K., Radhakrishnan, N., Leverence, R., . . . Cottler, L. (2014, July). Applying athletic principles to medical rounds to improve teaching and patient care. Academic Medicine, 89(7), 1018-1023. doi: 10.1097/ACM.0000000000000278
Staniszewska, S., Boardman, F., Gunn, L., Roberts, J., Clay, D., Seers, K., . . . O' Flynn, N. (2014, February). The Warwick Patient Experiences Framework: Patient-based evidence in clinical guidelines. International Journal for Quality in Health Care, 26(2),151-157. doi: 10.1093/intqhc/mzu003
Storrow, A. B., Zhou, C., Gaddis, G., Han, J. H., Miller, K., Klubert, D., . . . Aronsky, D. (2008, November). Decreasing lab turnaround time improves Emergency Department throughput and decreases emergency medical services diversion: A simulation model. Academic Emergency Medicine, 15(11), 1130-1135. doi: 10.1111/j.1553-2712.2008.00181.x
Stranges, E. & Stocks, C. (2010, November). Potentially preventable hospitalizations for acute and chronic conditions, 2008. Agency for Healthcare Research and Quality – Healthcare Cost and Utilization Project. Retrieved from https://www.hcup- us.ahrq.gov/ reports/statbriefs/sb99.pdf
Strzalka A, Havens, DS. (1996). Nursing care quality: comparison of unit-hired, hospital float pool, and agency nurses. J Nurs Care Qual.,10(4), 59-65.
Substance Abuse and Mental Health Service Administration (SAMHSA). (2014) Behavioral Health Barometer: United States, 2014. Retrieved from http://www.samhsa.gov/data/ sites/default/files/National_BHBarometer_2014/National_BHBarometer_2014.pdf
Teahan, B. (1998, November). Implementation of a self-scheduling system: A solution to more than just schedules! Journal of Nursing Management, 6(6), 361-368. doi: 10.1046/j.1365-2834.1998.00096.x
The Beryl Institute. (2010). Insights into the patient experience: 2010 member survey. Retrieved from https://theberylinstitute.site-ym.com/store/ViewProduct.aspx?id=599475
The Beryl Institute. (2010, July). Zeroing in on patient experience: Views and woes from the Frontlines. Retrieved from http://www.beryl.net/system/files/images/ Zeroing_in_on_Patient_Experience_Jul2010_sp.pdf
The Joint Commission. (2011). Approved: New standard regarding credentialing and privileging requirements for licensed independent practitioners in long term care. Joint Commission Perspectives, 31(7), 3-5. Retrieved from http://www.jointcommission. org/assets/1/6/s3-Credentialing_and_Priviliging_LTC_article-July_2011_Perspectives.pdf
The Joint Commission. (2011, July 5). Credentialing standard: Long-term care and Medicare/Medicaid Long-Term Care Accreditation Programs. HR.02.01.04. Retrieved from http://www.jointcommission.org/assets/1/18/20110705_LTC_Credentialing.pdf

Assessment F (Workflow – Clinical)
The views, opinions, and/or findings contained in this report are those of the assessment team and should not be construed as an official government position, policy, or decision.
G-20
Thomas, Donna. (2005, April). Best practices: redesigning the charge nurse role to manage patient flow. George Washington School of Medicine and Health Sciences. Retrieved from http://smhs.gwu.edu/urgentmatters/news/best-practices-redesigning-charge-nurse-role-manage-patient-flow
Tortorella, F., Ukanowicz, D., Douglas-Ntagha, P., Ray, R., & Triller, M. (2013, January). Improving bed turnover time with a bed management system. Journal of Nursing Administration, 43(1), 37-43. doi: 10.1097/NNA.0b013e3182785fe7
Tourangeau, AE, Cranley, LA, Jeffs, L. (2006). Impact of nursing on hospital patient mortality: a focused review and related policy implications. Qual Saf Health Care, 15(1), 4–8.
Tourangeau, A. E., Giovannetti, P., Tu, J. V., & Wood, M. (2002, March). Nursing-related determinants of 30-day mortality for hospitalized patients. Canadian Journal of Nursing Research 33(4), 71-88. Retrieved from http://www.ncbi.nlm.nih.gov/pubmed/11998198
Towers, A. L. (2013). Clinical documentation improvement: A physician perspective. Journal of AHIMA, 84(7), 34-41. Retrieved from http://www.ncbi.nlm.nih.gov/pubmed/23926870
Tsai, J. & Rosenheck, R. A. (2015). Risk factors for homelessness among US veterans. Epidemiologic Reviews, 37, 177-195. doi: 10.1093/epirev/mxu004
United States Government Accountability Office. (2014, October). VA Healthcare: Actions Needed to Ensure Adequate and Qualified Nurse Staffing. Retrieved from http://www.gao. gov/assets/670/666538.pdf
U.S. Department of Defense Task Force on Mental Health. (2007). An Achievable Vision: Report of the Department of Defense Task Force on Mental Health. Falls Church, VA: Defense Health Board.
U.S. Department of Health and Human Services, Substance Abuse and Mental Health Services Administration (2013). Behavioral Health Barometer: United States, 2013. (HHS Publication No. SMA-13-4796). Rockville, MD: Substance Abuse and Mental Health Services Administration.
U.S. Department of Health and Human Services (2015). Find your Path Forward: Costs of Care. Retrieved from http://longtermcare.gov/landing/
U.S. Department of Veterans Affairs. (2015). BMS Quarterly Bed Reconciliation Report. Washington, DC: U.S. Government Printing Office.
U.S. Department of Veterans Affairs. (2013). Emergency Department Integration Software (EDIS), Version 2.1.1 Increment 3, Client Installation Guide. Document Version 3.6. Washington, DC: U.S. Government Printing Office.
U.S. Department of Veterans Affairs. (2014). Functional Organizational Manual: Description of Organization Structure, Missions, Functions, Tasks, and Authorities-V2.0.a. Washington, DC: U.S. Government Printing Office.

Assessment F (Workflow – Clinical)
The views, opinions, and/or findings contained in this report are those of the assessment team and should not be construed as an official government position, policy, or decision.
G-21
U.S. Department of Veterans Affairs, National Center for Veterans Analysis and Statistics (NCVAS). (2012). Profile of Sheltered Homeless Veterans for Fiscal Years 2009 and 2010. Washington, DC.
U.S. Department of Veterans Affairs, National Center for Veterans Analysis and Statistics (NCVAS) (2014). Unique Veteran Users Report FY2012. Washington, DC.
U.S. Department of Veterans Affairs. (2008). Survey of Healthcare Experiences of Patients Recently Discharged (Inpatient) Long Form. Washington, DC: U.S. Government Printing Office.
U.S. Department of Veterans Affairs. (2013). Survey of Healthcare Experiences of Patients (SHEP) Program Statement of Work. Washington, DC: U.S. Government Printing Office.
U.S. Department of Veterans Affairs. (2014). VERA 2014: Equitable Funding Across 20 Health Care Networks. Washington, DC: U.S. Government Printing Office.
US Department of Veterans Affairs. (2013). Veterans and Family Advisory Brochure (VFAC).
U.S. Department of Veterans Affairs. (2014). VHA Blueprint for Excellence.
U.S. Department of Veterans Affairs. (2014). VHA Directive 1117.
U.S. Department of Veterans Affairs. (2009). VHA Directive 1200.
U.S. Department of Veterans Affairs. (2008). VHA Directive 2006-067.
U.S. Department of Veterans Affairs. (2010). VHA Directive 2010-010.
U.S. Department of Veterans Affairs. (2010). VHA Directive 2010-018.
U.S. Department of Veterans Affairs. (2010). VHA Directive 2010-034.
US Department of Veterans Affairs. (2012). VHA Handbook 1100.19.
US Department of Veterans Affairs. (2013). VHA Handbook 5007.
US Department of Veterans Affairs. (2010). VHA Handbook 1000.01.
US Department of Veterans Affairs. (2011). VHA Handbook 1121.01.
US Department of Veterans Affairs. (2014). VHA Handbook 1907.01.
US Department of Veterans Affairs. (2014). VHA Handbook 5007/47.
US Department of Veterans Affairs. (2011). VHA Handbook 5013/11.
US Department of Veterans Affars (2007) VA Form 10-1465-1.
US Department of Veterans Affairs. (2015). VHA Office of Patient Centered Care and Cultural Transformation Resource Guide.
U.S. Department of Veterans Affairs. (2015). VHA Healthcare Talent Management Office. Mean Physician Pay Data. Internal Data from VHA PAID System. Received Summer 2015.
U.S. Department of Veterans Affairs. (2014). VHA Office of Quality, Safety, and Value. IPEC data. Internal Data from VHA IPEC System. Received Summer 2015
Assessment F (Workflow – Clinical)
The views, opinions, and/or findings contained in this report are those of the assessment team and should not be construed as an official government position, policy, or decision.
G-22
U.S. Department of Veterans Affairs. (2014). VHA Office of Quality, Safety, and Value. MedSAS data. Internal Data from VHA IPEC System. Received Summer 2015
U.S. Department of Veterans Affairs. (2014). VHA Office of Quality, Safety, and Value. NUMI data. Internal Data from VHA IPEC System. Received Summer 2015
U.S. Department of Veterans Affairs. (2011). Voice of the Veteran.
US Department of Veterans Affairs (2015). VA Maine Healthcare Facebook. Retrieved from https://www.facebook.com/VAMaine
U.S. Department of Veterans Affairs. (2014). VSSC data. provided by MITRE 2014.
Utilization Review Committee. (2008). Health Utilization Management Standards. Retrieved from www.urac.org
Van der Meijden, M. J., Tange, H. J., Troost, J., & Hasman, A. (2003). Determinants of success of inpatient clinical information systems: A literature review. Journal of the American Medical Directors Association, 10(3), 235-243. doi: 10.1197/jamia.M1094
Varnava, A. M., Sedgwick, J. E., Deaner, A., Ranjadayalan, K., & Timmis, A. D. (2002, March). Restricted weekend service inappropriately delays discharge after acute myocardial infarction. Heart, 87(3), 216–219. doi: 10.1136/heart.87.3.216
Wallace, D. J., Angus, D. C., Barnato, A. E., Kramer, A. A., & Kahn, J. (2012, May 31). Nighttime intensivist staffing and mortality among critically ill patients. New England Journal of Medicine, 366, 2093-2101. doi: 10.1056/NEJMsa1201918
Ward, N. S., Afessa, B., Kleinpell, R., Tisherman, S., Ries, M., Howell, M., . . . Kahn, J. (2013, February). Intensivist/patient ratios in closed ICUs: A statement rrom the Society of Critical Care Medicine Taskforce on ICU staffing. Journal of Critical Care Medicine, 41(2), 638-645. doi: 10.1097/CCM.0b013e3182741478
Warner, MD and Prawda, J. (1972). A mathematical programming model for scheduling nursing personnel in a hospital. Management Science, 19(4), 411-422.
Wasserman, J., Ringel, J. S., Ricci, K. A., Malkin, J. D., Schoenbaum, M. O., Wynn, B., . . . Rastegar, A. (2003). Analysis of potential adjustments to the Veterans Equitable Resource Allocation (VERA) system. Retrieved from http://www.rand.org/content/dam/rand/pubs /monograph_reports/MR1629/MR1629.pref.pdf
Welch, S. J., Asplin, B. R., Stone-Griffith, S., Davidson, S. J., Augustine, J., Schuur, J., & Alliance, E. D. B. (2011). Emergency department operational metrics, measures and definitions: results of the second performance measures and benchmarking summit. Annals of emergency medicine, 58(1), 33-40.
West, Elizabeth. (2001). Management matters: The link between hospital organization and quality of patient care. Quality in Health Care 10, 40-48
Westaway, M. S., Rheeder, P., Van Zyl, D. G., & Seager, J. R. (2003). Interpersonal and organizational dimensions of patient satisfaction: The moderating effects of health status.

Assessment F (Workflow – Clinical)
The views, opinions, and/or findings contained in this report are those of the assessment team and should not be construed as an official government position, policy, or decision.
G-23
International Journal for Quality in Health Care, 15(4), 337-344. doi: http://dx.doi.org/ 10.1093/intqhc/mzg042
White House (2014). Issues Impacting Access to Timely Care at VA Medical Facilities.
Wickizer, T. M., Wheeler, J. R., & Feldstein, P. J. (1989). Does utilization review reduce unnecessary hospital care and contain costs? Medical Care, 27(6), 632-647. Retrieved from http://www.jstor.org/stable/3765229
Wind, J., Polle, S. W., Fung Kon, J., Dejong, C. H., von Meyenfeldt, M. F., Ubbink, D. T., . . . Bemelman, W. A. (2006). Systematic review of enhanced recovery programmes in colonic surgery. British Journal of Surgery, 93(7), 800-809. Retrieved from http://www.ncbi.nlm. nih.gov/pubmed/16775831
Winther, S. B., Foss, O. A., Wik, T. S., Davis, S. P., Engdal, M., Jessen, V., & Husby, O. S. (2015). 1-year follow-up of 920 hip and knee arthroplasty patients after implementing fast-track. Acta Orthopaedica, 86(1), 145-146. doi: 10.3109/17453674.2014.957089
Wolf, J. A., Niederhauser, V., Marshburn, D., & LaVela, S. L. (2014). Defining patient experience. Patient Experience Journal, 1(1). Retrieved from http://pxjournal.org/cgi/ viewcontent.cgi?article=1004&context=journal
Wolinsky, F. D., Coe, R. M., & Mosely, R. R. (1987). Length of stay in the VA: Long-term care in short-term hospitals. Medical Care, 25(3): 250-253. Retrieved from http://www.jstor. org/stable/3765254
Wong F. A., (2012). 2012 Task Force Report: Quality of care and patient satisfaction. American Legion. Retrieved from http://www.legion.org/documents/legion/ pdf/swsreport2012.pdf
Wong, E. L. Y., Yam, C. H. K., Cheung, A. W. L., Leung, M. C. M., Chan, F. W. K., Wong, F. Y. Y., & Yeoh, E. K. (2011). Barriers to effective discharge planning: A qualitative study investigating the perspectives of frontline healthcare professionals. BMC Health Services Research, 11. doi:10.1186/1472-6963-11-242
Wong, H. J. & Morra, D. (2011, April 16). Excellent hospital care for all: Open and operating 24/7. Journal of General Internal Medicine, 26(9), 1050-1052. doi: 10.1007/s11606-011-1715-8
Wood, D. (2012). Collaborative healthcare teams a growing success story. AMN Healthcare (Online). Retrieved from http://www.amnhealthcare.com/latest-healthcare-news/collaborative-healthcare-teams-growing-success-story
Wooster, K. (2011, December 13). VA proposes Hot Springs Medical Center closures: Community. Rapid City Journal. Retrieved June 11, 2015, from ://rapidcityjournal.com/ httpnews/local/communities/hot-springs/va-proposes-hot-springs-medical-center-closures/article_56b5a98e-2545-11e1-a04d-001871e3ce6c.html
Zemencuk, J. K., Hofer, T. P., Hayward, R. A., Moseley,R. H. & Saint, S. (2006). What effect does physician “profiling” have on inpatient physician satisfaction and hospital length of stay? BMC Health Services Research, 6(1). doi:10.1186/1472-6963-6-45

Assessment F (Workflow – Clinical)
The views, opinions, and/or findings contained in this report are those of the assessment team and should not be construed as an official government position, policy, or decision.
G-24
Zwarenstein, M., Goldman, J., & Reeves, S. (2009). Interprofessional collaboration: Effects of practice-based interventions on professional practice and healthcare outcomes. The Cochrane Database Systematic Reviews, 3. Retrieved from http://www.ncbi.nlm.nih.gov/ pubmed/19588316.

Assessment F (Workflow – Clinical)
The views, opinions, and/or findings contained in this report are those of the assessment team and should not be construed as an official government position, policy, or decision.
H-1
Appendix H Acronyms
ACMA American Case Management Association
ADPCS Assistant Director of Patient Care Services
AHIMA American Health Information Management Association
AHP Allied Health Professional
ANA American Nurses Association
APRN Advanced Practice Registered Nurse
ASHP American Society of Health-System Pharmacists
BMS Bed Management System
CAMH CMS Alliance to Modernize Healthcare
CMS Centers for Medicare & Medicaid Services
CNS Clinical Nurse Specialist
FFRDC Federally Funded Research and Development Center
HHS Department of Health and Human Services
CBOC Community-Based Outpatient Clinics
CDC Center for Disease Control
CDI Clinical Documentation Improvement
CLC Community Living Center
CNA Certified Nursing Assistant
CPRS Computerized Patient Record System
CRNA Certified Registered Nurse Anesthetist
DRG Diagnosis-Related Group
ED Emergency Department
EDIS Emergency Department Integrated Software
EHR Electronic Health Record
FIT Field Implementation Teams
FTE Full-time Equivalent
GAO Government Accountability Office
HCAHPS Hospital Consumer Assessment of Healthcare Providers and Systems
HIM Health Information Management
HTM Healthcare Talent Management

Assessment F (Workflow– Clinical)
The views, opinions, and/or findings contained in this report are those of the assessment team and should not be construed as an official government position, policy, or decision.
H-2
ICU Intensive Care Unit
IHC Integrating Health Coordination Center
IPEC Inpatient Evaluation Center
LIP Licensed Independent Practitioner
LMI Labor Management Institute
LOS Length-of-Stay
LPN Licensed Practical Nurse
LSCSW Licensed Specialist Clinical Social Worker
LVN Licensed Vocational Nurse
LWBS Left Without Being Seen
MD Medical Doctor
MHS Multi-hospital Systems
NBCD National Bed Control Database
NBCOT National Board for Certification in Occupational Therapy
NCA National Cemetery Association
NHPPD Nursing Hours Per Patient Day
NP Nurse Practitioner
NUMI National Utilization Management Integration
OIG Office of the Inspector General
OMELOS Observed-Minus-Expected Length-of-Stay
ONS Office of Nursing Services
OPCC&CT Office of Patient Centered Care and Cultural Transformation
OR Operating Room
OT Occupational Therapist
PA Physician Assistant
PAID Paid Accounting Integrated Data
PCC Patient Centered Care
PM&R Physical Medicine & Rehabilitation
PSA Patient Support Assistant
PT Physical Therapist
RN Registered Nurse
Assessment F (Workflow – Clinical)
The views, opinions, and/or findings contained in this report are those of the assessment team and should not be construed as an official government position, policy, or decision.
H-3
RT Respiratory Therapist
RVU Relative Value Unit
SAIL Strategic Analytics for Improvement and Learning
SHEP Survey of Patients' Hospital Experiences
TNS Travel Nurse Corps
UM Utilization Management
VA Veterans Affairs
VACO Veterans Affairs Central Office
VAMC Veterans Affairs Medical Center
VBA Veterans Benefits Administration
VERA Veterans Equitable Resource Allocation
VHA Veterans Health Administration
VHACO Veteran Health Administration Central Office
VISN Veterans Integrated Service Networks
VistA Veterans Health Information Systems and Technology Architecture
VSSC VA Support Service Center
WHEN Weekend, Holiday, Evening, Nights
Assessment F (Workflow– Clinical)
The views, opinions, and/or findings contained in this report are those of the assessment team and should not be construed as an official government position, policy, or decision.
H-4
This page intentionally left blank.