assessment of catastrophe risk and potential losses in...
TRANSCRIPT
Assessment of Catastrophe Risk and Potential Losses in Industry
Paul Kleindorfer INSEAD;
Wharton Risk Management Center, University of Pennsylvania
Ulku G. Oktem Wharton Risk Management Center,
University of Pennsylvania; Near-Miss Management LLC
Ankur Pariyani Near-Miss Management LLC
Warren D. Seider Chemical and Biomolecular Engineering,
University of Pennsylvania
March 2012 Working Paper # 2012-10
_____________________________________________________________________ Risk Management and Decision Processes Center The Wharton School, University of Pennsylvania 3730 Walnut Street, Jon Huntsman Hall, Suite 500
Philadelphia, PA, 19104 USA
Phone: 215‐898‐4589 Fax: 215‐573‐2130
http://opim.wharton.upenn.edu/risk/ ___________________________________________________________________________

THE WHARTON RISK MANAGEMENT AND DECISION PROCESSES CENTER
Established in 1984, the Wharton Risk Management and Decision Processes Center develops and promotes effective corporate and public policies for low‐probability events with potentially catastrophic consequences through the integration of risk assessment, and risk perception with risk management strategies. Natural disasters, technological hazards, and national and international security issues (e.g., terrorism risk insurance markets, protection of critical infrastructure, global security) are among the extreme events that are the focus of the Center’s research.
The Risk Center’s neutrality allows it to undertake large‐scale projects in conjunction with other researchers and organizations in the public and private sectors. Building on the disciplines of economics, decision sciences, finance, insurance, marketing and psychology, the Center supports and undertakes field and experimental studies of risk and uncertainty to better understand how individuals and organizations make choices under conditions of risk and uncertainty. Risk Center research also investigates the effectiveness of strategies such as risk communication, information sharing, incentive systems, insurance, regulation and public‐private collaborations at a national and international scale. From these findings, the Wharton Risk Center’s research team – over 50 faculty, fellows and doctoral students – is able to design new approaches to enable individuals and organizations to make better decisions regarding risk under various regulatory and market conditions.
The Center is also concerned with training leading decision makers. It actively engages multiple viewpoints, including top‐level representatives from industry, government, international organizations, interest groups and academics through its research and policy publications, and through sponsored seminars, roundtables and forums.
More information is available at http://opim.wharton.upenn.edu/risk.

1
ASSESSMENT OF CATASTROPHE RISK AND POTENTIAL LOSSES IN INDUSTRY
Paul Kleindorfer, Distinguished Research Professor in Technology and Operations Management, INSEAD, France
Ulku G. Oktem1, Senior Fellow, Risk Management and Decision Processes Center, Wharton School, Philadelphia, PA, USA, Founder and Managing Partner, Near-Miss Management LLC, Philadelphia, PA, USA
Ankur Pariyani, Founder and Technology Lead, Near-Miss Management LLC, Philadelphia, PA, USA
Warren D. Seider, Professor, Department of Chemical and Biomolecular Engineering, University of Pennsylvania, PA, USA
Abstract
This paper describes the potential contribution of near-miss management systems to improving company profitability and reducing the frequency and severity of major industrial accidents. The near-miss concept has long been understood in different industries, as examples in this paper illustrate. However, what has been largely missing is the integration of near-miss management into the culture and day to day operations in a manner that underlines the critical connections between near-misses and behavior. Often, near-miss management has played an ex post forensic role in risk management rather than the alerting role as a means of summarizing leading indicators and precursors of hazardous conditions. This paper describes several strands of recent research that aim to correct this and to make near-miss management an organic element of Enterprise Risk Management. In addition, a new concept, “potential safety profit loss”, is introduced to calculate the potential monetary losses due to unexpected shutdowns and accidents..
Key words
Near-Miss, Enterprise Risk Management, Safety Pyramid, Leading Risk Indicators, Potential Safety Losses
1 To whom all correspondence must be addressed.
Introduction
Catastrophic events in (process) industries are categorized as “Low-Probability, High-Consequence Occurrences”. Although in industry the word “catastrophe” is mainly associated with loss of lives, equipment and/or major environmental damage (definition of classic “industrial catastrophe”), in this paper, we use the terminology “catastrophic event” to encompass any unplanned event or accident that results in significant “business losses”, including major business disruptions that can stem from natural hazards, major accidents, supply-chain disruptions, and product recalls. These events may result from natural sources or management system failures, and may be connected to broader external drivers of risk such as climate change or sudden shifts in technology and regulation.
Catastrophic events have been increasing in both frequency and severity in recent years. These have been especially visible in the process industries (Kleindorfer et al, 2007) and in financial services (Muermann and Oktem, 2002; Oktem et al. 2010), but there is a growing recognition of the importance of Enterprise Risk Management to prevent catastrophic events in other industries as well. The reasons for this heightened sensitivity to events causing major business losses arises from several factors: (a) increasing global population and, therefore, proximity of housing to industrial facilities (ref: EPA study: “An Analysis of Urbanization and Hazard Mitigation Practices near Hazardous Liquid Transmission Pipelines”), (b) increasing size and complexity of industrial facilities, and (c) global interdependencies of

2
both large and small industries to each other (Kunreuther and Michel-Kerjan, 2007). Thus, understanding the risks involved in industrial operations and reducing both the likelihood of occurrence of major accidents and their impact are of great interest to corporate risk managers. In this paper, we will focus on “near-miss management” as an assessment approach for reducing the frequency and severity of industrial accidents.
The essence of near-miss management stems from the fact that accidents typically have a history of warning signals that are leading indicators or precursors of major events causing business disruptions. Thus, assessment of company and site vulnerabilities should not just be focused on external data or on ex post major accident reviews, but rather on the effective definition, measurement and auditing of performance against leading indicators of vulnerability and resiliency. That is, near-miss management should not be an isolated activity relegated to special staff or company-wide risk management committees. It should be organically integrated into the operations and employee/management responsibilities to help Enterprise Risk Management. Near-Miss Concept
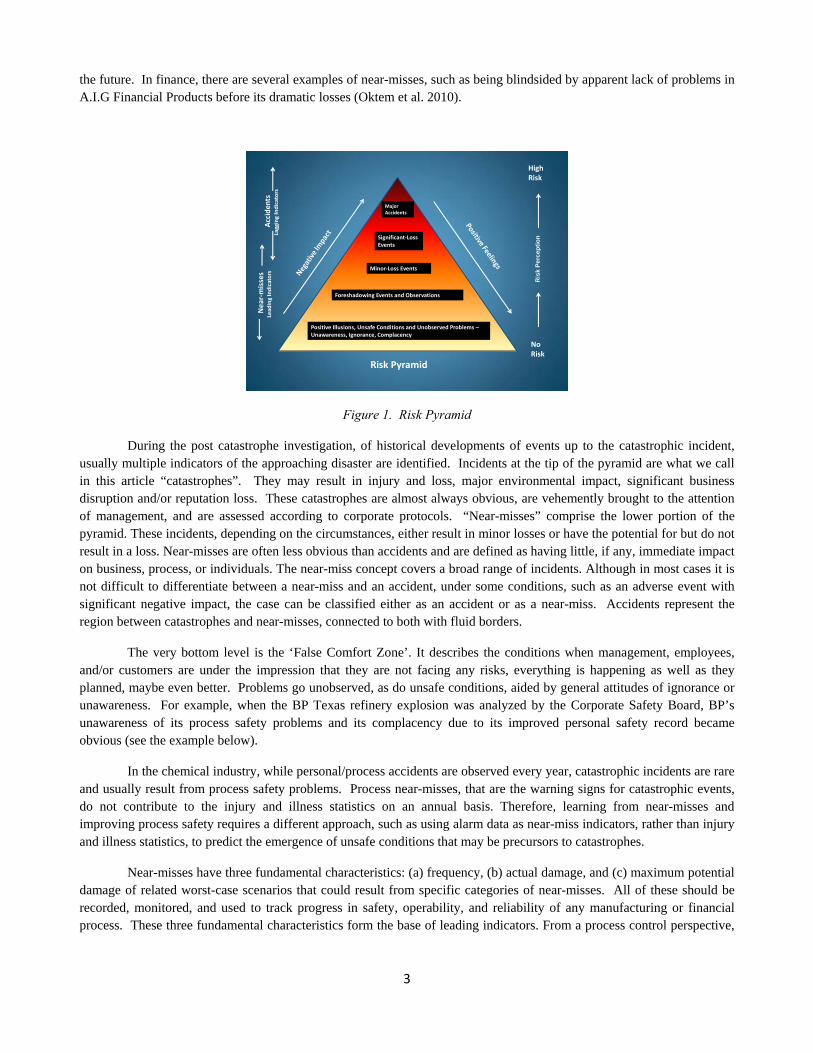
Near-Misses are probably the most important indicators of major accidents. The notion of a near-miss for industry is best explained by what is known as a “safety pyramid”, which was discussed as early as 1931 by H. W. Heinrich and was further developed by Frank E. Bird based on his 1969 study of industrial accidents (Bird and Germain, 1996).2
The characteristics of an event that qualify it as a “near-miss” depend on the organization’s definition. The Wharton study (Phimister et al., 2003) recommends using a broad definition to be able to catch a greater number of possible improvement opportunities. It defines near-miss as “an opportunity to improve environmental, health and safety practice based on a condition, or an incident with potential for more serious consequences”. Later, Muermann and Oktem (2002) discussed the near-miss concept as part of the operational risk in financial institutions and used the following definition: “near-miss is an event, a sequence of events, or an observation of unusual occurrences that posses the potential for improving a system’s operability by reducing the risk of upsets, some of which could eventually cause serious damage”. These definitions can be interpreted as “too broad” by some, such as the Department of Energy (DOE Manual 231.1-2) which considers a near-miss as a case where “no barrier or only one barrier prevented an event from having a reportable consequence.” Similarly, near-misses are also referred to as “close calls” or “near-hits”. In the Encyclopedia of Quantitative Risk Assessment and Analysis (2008), Oktem and Meel present a broad spectrum of “near-misses” from different industries. As mentioned above, in the earlier Wharton study (Phimister et al., 2003), the bottom region of the pyramid was expanded to include events with no adverse effects, such as observation of a condition that has the potential of causing an incident, and the lower portion of the pyramid was identified as the “near-miss” region. This concept has been expanded even further by Oktem et al. 2010 as shown in Fig. 1 to include: (a) another region: “Positive Illusions, Unsafe conditions and Unobserved Problems – Unawareness, Ignorance, Complacency” to the bottom of the pyramid; and (b) a new dimension called “risk perception” along the height of the pyramid, and called this new version the “Risk Pyramid”. By making these modifications they included a broad spectrum of safety and operational risks organically present in different parts of businesses that normally go unrecognized. Of course, it is worth noting that the categories in the risk pyramid represent a continuum, where there will be some overlap between the different areas as one moves up the progression. Examples that are given in the rest of this article will demonstrate the different near-miss levels and even point out situations when corporations might get into trouble even though they think they are operating in a low/no risk region.
Defining and labeling of each level of risk (or safety) pyramid has been subject to long discussions with no agreed upon resolution. Industrial near-misses are defined as events with minimal consequences. In case of major accidents from natural causes, such as seismic events, hurricanes, floods, drought, heat waves, etc., near-misses are defined as events that nearly gave rise to a major catastrophe. For example, a category 4 hurricane that missed a highly populated region and damaged the environment in a neighboring unpopulated area can be considered as a near-miss from which regional governments can learn the damage potential and take necessary precautions to minimize consequences in 2 This is later discussed in several articles related to “industrial accidents”. See e.g., Phimister et al. (2003) and Kleindorfer et al. (2007)
3
the future. In finance, there are several examples of near-misses, such as being blindsided by apparent lack of problems in A.I.G Financial Products before its dramatic losses (Oktem et al. 2010).
Ris
k P
erc
epti
on
HighRisk
NoRisk
Significant‐Loss Events
Minor‐Loss Events
Major Accidents
Foreshadowing Events and Observations
Positive Illusions, Unsafe Conditions and Unobserved Problems –Unawareness, Ignorance, Complacency
Acciden
tsLagging Indicators
Near‐m
isses
Lead
ing Indicators
Risk Pyramid
Figure 1. Risk Pyramid
During the post catastrophe investigation, of historical developments of events up to the catastrophic incident, usually multiple indicators of the approaching disaster are identified. Incidents at the tip of the pyramid are what we call in this article “catastrophes”. They may result in injury and loss, major environmental impact, significant business disruption and/or reputation loss. These catastrophes are almost always obvious, are vehemently brought to the attention of management, and are assessed according to corporate protocols. “Near-misses” comprise the lower portion of the pyramid. These incidents, depending on the circumstances, either result in minor losses or have the potential for but do not result in a loss. Near-misses are often less obvious than accidents and are defined as having little, if any, immediate impact on business, process, or individuals. The near-miss concept covers a broad range of incidents. Although in most cases it is not difficult to differentiate between a near-miss and an accident, under some conditions, such as an adverse event with significant negative impact, the case can be classified either as an accident or as a near-miss. Accidents represent the region between catastrophes and near-misses, connected to both with fluid borders.
The very bottom level is the ‘False Comfort Zone’. It describes the conditions when management, employees, and/or customers are under the impression that they are not facing any risks, everything is happening as well as they planned, maybe even better. Problems go unobserved, as do unsafe conditions, aided by general attitudes of ignorance or unawareness. For example, when the BP Texas refinery explosion was analyzed by the Corporate Safety Board, BP’s unawareness of its process safety problems and its complacency due to its improved personal safety record became obvious (see the example below).
In the chemical industry, while personal/process accidents are observed every year, catastrophic incidents are rare and usually result from process safety problems. Process near-misses, that are the warning signs for catastrophic events, do not contribute to the injury and illness statistics on an annual basis. Therefore, learning from near-misses and improving process safety requires a different approach, such as using alarm data as near-miss indicators, rather than injury and illness statistics, to predict the emergence of unsafe conditions that may be precursors to catastrophes.
Near-misses have three fundamental characteristics: (a) frequency, (b) actual damage, and (c) maximum potential damage of related worst-case scenarios that could result from specific categories of near-misses. All of these should be recorded, monitored, and used to track progress in safety, operability, and reliability of any manufacturing or financial process. These three fundamental characteristics form the base of leading indicators. From a process control perspective,

4
the use of the process performance indicators as a basis for prediction and control has been a central research area since the work of Pontryagin and Kalman in the 1950’s and 1960’s, leading to the revolution in real-time control.3
Near-miss management applies to almost all facets of an operation and it can play a critical role in the survival of a business. For example, before the 1984 Bhopal incident of Union Carbide, which caused the collapse of the company, numerous near-misses were ignored by management. Similarly, in 1999, the Concept Sciences, Inc., catastrophe killed five people, injured many more and destroyed several buildings, but it also brought the end of the company before it even started to grow its business. Here again, if near-misses observed during laboratory development had been taken seriously, the facility and the operating conditions would have been designed differently to prevent the formation of explosive conditions, a matter which had been well studied in the literature. With an explosion during its first production batch, Concept Sciences, Inc., did not even get a chance to have a single large-scale operation, losing its survival opportunity.
Although most reported near-misses are associated with safety and health issues in manufacturing, there are numerous other examples where near-misses signaled the potential for a catastrophe. For example, in their book, “Wharton on Making Decisions”, Stephen J. Hoch, Howard C. Kunreuther, and Robert E. Gunther (2001) describe in detail how Nick Leeson’s bad decisions, which led to the spectacular failure of Barings Bank, started with his attempt to cover the mistakes of a new employee (whom he had hired). The loss caused by the employee’s error was on the order of £20,000, which can be considered as a near-miss compared to the final outcome.
The decision to hide such a small failure, perhaps to avoid the risk of being perceived as someone who made a bad hiring decision, set off a chain of further, even bigger problems. Barings’ managers, including the one auditor who noticed a £50M problem, overlooked any “questionable outcome – losses” associated with Leeson’s operations due to their admiration of his fast conduct of business and apparent success in earnings. So, Leeson, who actually started to gain people’s trust by fixing other people’s problems (a highly admirable situation), enjoyed the popularity he gained by accomplishing results that were almost too good to be true. In this “Positive Illusions (ignorance, complacency)” region of the pyramid, the perspective of many individual managers seems to be biased towards seeing only “positives”, such as unprecedented success, and avoiding consideration of possible “negatives”, that is, potential problems. The lesson of Barings Bank, and many similar events in the financial industry, is that effective near-miss management systems can both lead to reliable predictions of developing catastrophic problems as well as improving the monitoring and decision processes of the company.
Lessons can be learned from every near-miss regardless of where and how it happened. The main cause of the 1999 Paddington train crash in the UK – where a passenger train crashed with a freight train killing 31 people and injuring over 500 – was one of the trains not stopping at the red stop sign. In fact in the previous six years, this (SPAD – Signal Passed At Danger – when it is red) had actually happened eight times without any accident. So there were eight near-misses as opportunities to take precaution to prevent such a catastrophe. This is a good example of addressing the root-causes of problems even when no adverse consequence has happened. In this case, every time a train operator crossed at a red light, the event was reported by the operator shortly after he crossed the red light informing his missing the signal. But, despite the fact that this was one of the most missed signals in the train system, no effort was made to determine the root-cause of this repeated event and prevent its recurrence. Reporting of such near-misses, especially if this is done by the responsible operator, requires a change in the culture of the company, in which employees understand that they are the ultimate risk managers in the company. On the other hand, management must have equal ownership in analyzing near-misses and preventing accidents since most often they have the resources to make necessary changes. The use of near-miss management to effect the necessary cultural change is discussed further below.
The above discussion has focused on near-miss management for internal operations. An increasingly important application of near-miss management is its extension to external sources of disruption, such as disruptions in the company’s supply chain (Kleindorfer and Saad, 2005). Given the globalization of economic activity in the last three
3 For a concise summary of the history of optimal control theory and its applications to business problems, see Sethi and Thomson (2000).

5
decades, it's not surprising that learning from near-misses, or even the catastrophes of others, and developing alternatives for more robust supply chains has become a central tenet of business sustainability.
Natural disasters have become an increasingly important source of supply chain disruptions. This is the result of the rapid increase in the global spread of customers and suppliers in the last decade. This may also be the result of demographic movements to coastal areas and climate change (Kunreuther and Michel-Kerjan, 2009). Natural disasters have proven to be especially critical sources of supply chain disruptions for supply chains originating in emerging economies. These economies provide benefits of low-cost labor and cheaper availability of certain critical inputs. However, they also suffer from poor infrastructure as well as emergency response and recovery systems, so it may take several months before disrupted supply lines return to normal. As a result, global companies have set up company-wide crisis management centers to manage major supply chain disruptions4. These centers also act as central gathering points for near-misses associated with the company’s supply chains. Simulation and other modeling approaches are used to examine the consequences of potential disruptions and to rehearse crisis management response to such events. Companies learn not only through events that directly affect their own supply chain; they also learn from events that affect other companies. A major flood in India or an earthquake in Turkey may not affect a given company’s operations, but the observation of the resulting chaos and interruptions can be considered as a near-miss, providing an opportunity for the focal company to improve its own risk mitigation and response strategies.
Examples of Various Near-Misses in Different Business Environments
A. BP Refinery Case:
The findings of the BP Independent Safety Review Panel (2007) formed to study the March 2005 explosion at BP’s Texas refinery, which killed 15 people, indicates that “BP has emphasized personal safety in recent years and has achieved significant improvement in personal safety performance, but BP did not emphasize process safety. BP mistakenly interpreted improving personal injury rates as an indication of acceptable process safety performance at its U.S. refineries. BP’s reliance on this data, combined with an inadequate process safety understanding created a false sense of confidence that BP was properly addressing process safety risks.”
That is, there were series of near-misses leading up to this 2005 BP incident, but the main reason for failure to learn from these near-misses was the way safety was managed in the Texas refinery. Safety efforts were driven by workforce injury statistics, which are mainly dictated by workforce injuries that are the result of slips, trips, and falls.
B. Sony Battery Case:
A recent example that demonstrates how identification and management of near-misses could have saved significant business losses is the Sony battery recall case. Although Sony was made aware that there were some overheating issues in laptop computers as early as October 2005 and February 2006, they did not order a recall and continued using previously stocked batteries. This was clearly a near-miss, which was ignored by Sony. Later, Sony batteries were identified for potential incidents in Dell laptops, which then led to battery recalls, causing a 96% decrease in Sony’s reported quarterly net profit. Even at this point, they could have treated the Dell incident as a near-miss (although clearly with more significant impact) and recalled the batteries from other companies like Fajitsu, Toshiba, Gateway, Dell, and Apple, all of whom were users of Sony batteries. However, the company continued to miss the signals from these early near-miss incidents, and, ultimately, the problems were revealed in other companies as well. Estimates indicate that this problem will cost Sony at least $429 million before it is resolved, and possibly twice as much when the results of legal actions are considered. Sony could have avoided much of this expense and business risk had they addressed the problem and recalled the batteries when they originally observed the overheating issues (near-misses).
4 See, for example, the excellent description of the crisis management operations at Cisco Systems in Harrington and O’Connor (2009).

6
According to the U.S. Consumer Product Safety Commission (CPSC), at least 124.7 million products were recalled in 2010 and overall, recalled products were associated with 26 deaths. (Ref: http://pressroom. consumerreports.org)
C. Environmental Sustainability:
Environmental sustainability is gaining increasing importance and the attendant risks associated with this field indicate a further important area of application for near-miss management. Rising awareness among consumers, growing pressure on regulators, and searching for new technologies can present unexpected challenges for many traditional lines of business. These challenges arise in part because they often come from non-market sources such as regulators and legislators. Near-miss management, therefore, is useful in drawing attention to these non-market drivers, which might otherwise be overlooked or neglected entirely as potential sources of significant gain and loss for a company. For example, regulatory and legislative incentives promoting the sudden increase in production of biodiesel from vegetable oil in 2007 and 2008 caused major increases in food prices, especially oils (Mitchell, 2008). These changes caught some companies off guard and put significant strains on their businesses. Near-miss management, focused on regulatory drivers of market supply and demand, have since become important elements of companies like Kraft, Nestle, and Unilever in predicting future prices of key inputs like vegetable oil based on broader monitoring of their environment. This practice enables these companies to understand their environment better through gathering and processing of near-misses stemming from environmental sustainability and to modify their products and operations to minimize the impact of similar situations on their business.
D. Fannie Mae Case:
One can make the argument that ‘failure to notice’ the weak signals around subprime lending and to act led to the recent case of Fannie Mae’s ‘accident’, where they lost $59bil in 2008, leading to a $15bil cash injection from the government (ref: Washington Post, Feb 27, 2009, p.D1). Leading up to this ‘accident’ was a series of visible events, arguably ranging back to the change in their subprime underwriting policy in 1999, that were not acted upon by firm management or public policymakers. Putting aside the longer history, just in the past few years, the near-miss signals were growing in volume and strength. Subprime loans were at historically high levels in the early 2000s, but did not prove problematic because rising home prices meant that debts could be settled. However, this should have been a signal that if home prices were to fall, the risk models would prove inadequate. Another near-miss signal was the rise in loans without documentation (low- or no-doc loans), which in 2006 made up 50% of subprime and 81% of near-prime mortgages (Federal Reserve Bank of Dallas, 2007). At the end of June 2007, “Fannie Mae held $47.2 billion of securities backed by subprime mortgages…[and] all but $300 million of Fannie Mae’s subprime bonds as of June were rated AAA”, even though 5% of subprime mortgages in bonds were at least 90 days late on payments and 7.4% were in foreclosure or seizure (Bloomberg News, July 30, 2007). Given the deteriorating situation in the subprime market and the clear signals that risk models were being invalidated, nonetheless, the near-misses accelerated up the risk pyramid until the well-publicized accidents of 2008 occurred.
Ultimately, the crisis at Fannie Mae has had much more widespread repercussions, as has been well documented.
Power of Near-Miss Management in Prevention of Catastrophes
Near-Miss Management - a way of eliminating catastrophes or mitigating damage when it happens.
Identification of early stress signals and taking the proper action to eliminate the stressor forms the core of the “Near-Miss Management” concept. There are numerous examples of major accidents in both manufacturing and financial industries whose earlier signals were ignored. This oversight exists in other industries as well, such as the airline industry. In this section, we will present a methodology for integration of near-miss management into the culture and day-to-day operations in a manner that underlines the critical connections between near-misses (both personal and process related) and behavior (both employees and management). This methodology, which resulted from observations of successful near-miss management in various industries and research on the principles of risk management, is built on three fundamental

7
pillars, all of which are equally essential for successful reduction in accidents and significant improvements in operational reliability:
a. Organic integration of near-miss management into the operational fabric
Effective utilization of near-misses requires its components to be organically integrated into the operational fabric. That is, every employee and manager has an active role and participates fully in the near-miss management process (such as the eight-step process described in the next section).
b. Categorization of near-misses
To be able to track and monitor in a manner that helps with decision making, the overall risk has to be divided into meaningful, track able categories. For example, in the chemical industry, these categories would include, but are not limited to, the following main- and sub-categories:
Technology: 1. Process, 2. Procedures
Facility: 1. Mechanical Integrity, 2. Quality Assurance, 3. Process Hazard Analysis
Personnel: 1. Training, 2. Contractor Safety, 3. Management Leadership, 4, Operational Discipline, 5. Auditing, 4. Incident Investigation, 5. Emergency Planning
Similarly, in the financial industry, the following are examples of categories to be used:
Retail Banks: 1. Check Processing, 2. Branch Network, 3. Credit Servicing and Processing, 4. Printing and Statementing,
Investment Banks: 1. Trade Processing, 2. Report Production, 3. Corporate Action Processing, 3. Trading P&L Generation
Insurance Companies: 1. Underwriting, 2. Claims Processing, 3. Field and Client Servicing
c. Tracking and monitoring of near-misses in each category
As mentioned above, the tracking of near-misses in each of the categories should be done based on their three characteristics:
a) Frequency refers to the number of events per unit period. Depending on the operation, this can be monthly or quarterly.
b) Actual damage is the observed damage and applies only to those cases where an incident has occurred. If a near-miss is only an observation of a potential problem, this characteristic does not apply.
c) Potential damage is associated with each and every near-miss regardless of the presence of actual damage. Usually, in personal near-misses, the person who actually experienced the near-miss is the most informed individual about the experienced near-miss’ potential.
For example, a type of incident that happens occasionally with no significant actual damage should be gaining importance when its frequency or the potential damage associated with such incidents rises.
Finally, the above categorization, combined with the track able characterization of near-misses, would make a powerful tool to manage near-misses so as to reduce accidents.
To measure and monitor the overall performance, one can assign different weights to various categories and calculate their weighted sums. It's most important that the underlying details of the summed value be transparent, that is, directly addressable, since they point to the key problem areas.
The most accurate near-miss information is available at the basic worker level. Employees who are responsible for day-to-day operations of a corporation – such as plant operators who are responsible for the production; purchasing

8
personnel who are responsible for managing suppliers and providing the raw materials; and sales and customer support personnel who are responsible for timely delivery of quality material – usually know best the business disturbances, causal factors of these disturbances, and the difficulties in overcoming such disruptions.
An eight-step near-miss management process was developed as part of the Wharton Risk Center study (Phimister et al., 2003, Oktem, U. 2003, Muerman and Oktem, 2002), which included over 100 interviews at 20 industrial locations of Fortune 100 companies. The eight steps to address near-misses in a facility to reduce accidents and catastrophes are briefly explained below:
1. Identification Identification is the first step of the process where an individual recognizes an incident or a condition as a “near-
miss”. To execute this step successfully there must be: (a) a clear definition of a near-miss, and (b) the means to ensure that every employee across a facility knows this definition at all times.
2. Disclosure (Reporting)
Once a near-miss is identified it must be disclosed, preferably in a written form. This can be done either by the person who identified the near-miss or by a supervisor to whom a near-miss is reported verbally. Having a clear, simple, and possibly multi-channel, procedure for reporting would encourage this process and would increase the probability of reporting most near-miss observations.
3. Prioritization Once an incident is reported, it needs to be prioritized. This very critical step determines the path to be followed
in the subsequent steps; the level of attention that will be given to the incident, the depth of analysis that will be performed in finding causes, the resources that will be dedicated to finding and implementing solutions, and the extent to which the information about this incident will be disseminated. It is important for each corporation to set their own criteria for prioritization, which include the above mentioned three factors: (a) frequency, (b) actual damage, and (c) maximum potential damage of related worst-case scenarios.
4. Distribution
Based on the priority and the nature of a near-miss, the information is distributed to the people who would be analyzing the causes of the incidents. The distribution mechanism for various priority levels must be determined during system development by the management team.
5. Identification of Causes (Causal Analysis)
This step includes identification of both direct- and root-causes of a near-miss. The implementation of this step can be as simple as the reporter inputting his/her ideas to identify the causes. On the other hand, for the highest priority near-misses, a committee may be formed to undergo an extensive root-cause analysis. Similarly, the extent of this step is determined by the prioritization step.
6. Solution Identification
The most important feature of this step is looking for a solution for each identified cause. Sometimes, several causes can be corrected with a single solution. In other cases, there may not be a feasible, effective solution, and hence, a less than ideal corrective action may be taken. All solution decisions, even “no solution for the time being”, should be noted. In the end, each cause must have been addressed.

9
7. Dissemination
Once solutions are identified, they should be communicated to the people who will execute these solutions, assuming they have not participated in the solution identification process. This step also includes an important intermediate function, which, if overlooked, can stall the system; i.e., obtaining permission from the manager with resources to implement the solutions. Another function of the dissemination step is to inform all possible interested parties of the particular near-miss. This may extend well beyond the site or corporate functions and may include customers, contractors, suppliers, etc.
8. Resolution (Tracking)
Once solutions are identified and implementers are informed, it is important to track all suggested changes to ensure they are properly executed. Also, when all of the changes are completed, to encourage future participation, the reporters of near-misses should be informed of the results from their identifications of near-misses.
Two important factors should be noted about the above process:
1) To get the full benefit (lessons and corrective actions) from a near-miss system, all of the eight steps must be performed fully and completely; that is, each step must be carried out as completely as possible. For example, it's important to find all possible causes, not just those immediately evident, as well as possible solutions to each cause – not just one or two.
2) Although this process is derived from a study focused on large chemical corporations, the logic flow represented by these steps applies to any size or sector organization. Even a single-person enterprise can follow the above steps to learn from near-misses and to prevent more serious consequences.
The resulting system from implementing this eight-step process would address the causal factors of potential catastrophes, thus either eliminate them or reduce their impact when they happen.
The main thrust of the Wharton Risk Center study is on near-misses related to personal safety, which depend on people recognizing and reporting near-misses. Therefore, in this case, the building of institutional memories of near-misses totally depends on workers’ observations and their initiatives in reporting them.
Profit Losses
Over the last decade, at the University of Pennsylvania, the near-miss concept was extended to apply to process safety (Pariyani et al., Part I, 2012; Pariyani et al., Part II, 2012; Pariyani et al., 2010; Pariyani et al., ESCAPE, 2010; Meel et al., Part I, 2008; Meel et al., Part II, 2008; Meel et al., 2007; Meel et al., 2006). These papers demonstrated the utility of: (a) treating alarms as near-misses, and (b) exploiting the large collection of alarm data to indicate process risk levels in operation. For example, when a high alarm associated with a process variable, such as temperature, is activated, it is recorded as a near-miss. The patterns, such as increases in the number of alarm near-misses, indicate when the process may be heading towards a shut-down or an accident. This patent-pending technology utilizes automatically registered near-misses from the alarm data to provide just-in-time estimates of failure probabilities and leading indicators of high-risk events.
In this section, a new technique for using near-misses to estimate the risk of profit losses is presented.
1. Assessing the Impact of Process Variables on Lost Profit Opportunity
Consider the control chart in Fig. 2 for a typical process variable, Pi, in a chemical plant, which shows the target value, quality limits, and safety limits, associated with Pi. The quality limits are thresholds, which when crossed reduce the quality performance of the process and can trigger quality defects when appropriate corrective actions are not taken within a time period. The safety limits refer to thresholds, which when crossed reduce the safety performance by

10
increasing the risk of a potential incident, for example, an unplanned shut down or accident, when appropriate corrective actions are not taken. The quality and safety limits are determined during the commissioning of the plant or using statistical methods. Processes are typically equipped with alarms (high and low) at the safety limits, to alert the human operators to take corrective actions and return the variables close to their target values.
Figure 2. Control chart of process variable, Pi
When key process variables move away from their quality limits, they are likely to cause some quality variables to move beyond their quality limits – resulting in quality-related profit losses referred to herein as quality profit losses (QPLs). For example, when a reactor temperature exceeds its quality limit, it may increase the formation of a by-product, resulting in a QPL. Consider n key process variables, Pi, i = 1, ..., n, whose variations result in a total QPL (e.g., in dollars) over time period, t. Here, departure of process variable Pi from its quality limits leads to a quality profit loss
QPLi. Also, assume QPLi is related to the total time the process variable lies outside of its quality limits during t, q
iT .
Furthermore, let
i)( q
iii TQPL (1)
where i and i are proportionality and exponential parameters. Then, the total quality profit loss during t, QPL, is:
n
i
qii TQPL
1
i)( (2)

11
To obtain i and i , three steps are followed:
(a) First, over a select time period, t, the lost profit opportunity, LPOt (e.g., in dollars) associated with quality defects is obtained by measuring the times spent by the quality variables outside of their specified quality limits and estimating the actual profit lost by the plant due to these departures, LPOt. The latter is taken as equivalent to the total of the process variable QPLs; that is, returning to Eqn. (2):
t
n
i
qiit LPOTQPL
1
i)( (3)
(b) Next, theq
iT , i = 1,…, n, are calculated as the sum of the recorded times each process variable, Pi, resides beyond its
quality limits during the select time period, t (which can be selected arbitrarily; e.g., one week or one month, provided the profit losses during that time period are assessed reasonably accurately).
(c) Finally, i and i are computed using nonlinear regression. With these values, both the absolute and relative
impacts of the process variables on profit losses due to quality defects can be estimated. Note that when the nonlinear regressions are difficult to converge, multiple linear regression is applied.
In summary, this formulation helps the operators and management assess the sensitivity of quality performance to variations in the process variables. In turn, this helps to improve quality performance through tuning of the control loops and the corrective actions of the operators and management.
2. Potential Safety Loss (PSL)
Whenever a process variable, Pi, crosses its safety limits, the process is exposed to a safety hazard, which has the potential to result in an unplanned shutdown or accident. Stated differently, there is an active risk of the occurrence of an incident when a variable is out of its safety bounds. To quantify this risk (that the process is exposed to), a new concept of the potential safety loss (PSL) is introduced, which assigns monetary values to situations where the plant has a potential to experience a loss (e.g., in dollars) due to safety issues. Even when the corrective actions of the plant operators and controllers return the process variables to their normal operating ranges, with no incidents having occurred, once the safety of the process was jeopardized, it could have resulted in actual losses. The PSL is introduced to quantify the risk associated with such safety-related abnormal events. It helps plant management assess and quantify the safety risks in processes dynamically, using near-misses to take corrective actions to circumvent shutdowns and accidents.
In what follows, it is assumed that QPL and PSL concepts closely relate to each other. This is an important assumption that is reasonable for most processes. That is, in most operations, events that cause QPL can easily extend to cause PSL.
In Section 1, the QPL was defined to measure the impact of process variables moving across their quality limits. In this section, the PSL is introduced to provide a similar measure when process variables move across their safety limits. Clearly, depending upon the extents of departure from their target, process variables can impact both the quality and safety of the process. On this basis, it is proposed that the contribution of process variable, Pi, to its potential safety loss, PSLi, is
proportional to the time, s
iT , it spends beyond its safety limits:
i)( siii TPSL (4)
where the parameters, i and i , are determined using LPO estimates, as described in Section 1. Here, it is assumed
that process variables impact quality and safety performances similarly, depending solely on the times spent beyond their

12
quality and safety limits, respectively. For a specific process variable, Pi, when its quality and safety limits are equal, or
when s
iq
i TT , QPLi = PSLi. In the latter case, both the quality and safety performances are jeopardized equally.
Using Eqn. (4), the total potential safety loss, PSL, is:
n
i
sii TPSL
1
i)( (5)
In most cases, the quality and safety limits are unequal for Pi. But, typically, the quality limits lie within the safety limits, and consequently, when process variables move beyond their quality limits more often, the likelihood of reaching their safety limits increase; that is, they contribute more than the other variables, those that don't cross their quality limits often, to potential safety losses. For this reason, Eqn. (5) provides a good approximation for the PSL. Realistically, actual values of the PSL are probably multiples of the process-related quality losses, with the multiplication coefficients determined using historical and scenario-based studies.
3. Case Study
In this section, a case study is presented using a hybrid database, prepared by combining industrial and hypothetical data. Here, five key process variables (n = 5; Pi , i = 1, ..., 5) account for the lost profit opportunity, LPO, for
a plant operation in a time period, t = 1 week. Table 1 shows the total times spent by these variables (q
iT , i = 1, ..., 5)
beyond their quality limits in each of 24 successive weeks and their associated LPOs.

13
Table 1. Lost Profit Opportunity and Times Beyond Quality Limits for 5 Process Variables
Time Period qT1
(seconds)
qT2 (seconds)
qT3 (seconds)
qT4 (seconds)
qT5 (seconds)
Lost Profit Opportunity
Week 1 218.07 50.90 1526.63 42.66 112.39 $130,000
Week 2 296.29 82.73 264.62 15.25 93.15 $70,000
Week 3 496.30 112.88 511.34 13.79 105.27 $160,000
Week 4 245.97 3.65 547.64 92.58 113.54 $70,000
Week 5 471.75 41.51 1307.26 12.42 91.45 $160,000
Week 6 381.99 26.42 750.64 67.56 90.22 $70,000
Week 7 305.55 44.28 338.08 56.49 95.85 $130,000
Week 8 264.68 68.47 777.11 55.09 109.76 $190,000
Week 9 469.31 19.06 821.22 16.91 102.86 $110,000
Week 10 371.10 90.01 591.31 8.922 98.39 $290,000
Week 11 236.72 71.33 513.73 17.1532 111.01 $210,000
Week 12 339.27 26.38 1011.54 90.25 30.05 $110,000
Week 13 212.20 63.79 1245.77 77.45 10.10 $170,000
Week 14 314.89 99.21 554.74 12.42 100.19 $330,000
Week 15 453.18 99.65 275.66 18.42 103.73 $350,000
Week 16 353.18 83.41 322.44 46.02 103.13 $260,000
Week 17 224.03 46.75 1199.27 30.03 90.55 $120,000
Week 18 334.79 18.99 243.26 46.95 95.91 $95,000
Week 19 230.22 61.20 1458.59 55.00 97.45 $170,000
Week 20 501.93 26.69 889.20 66.56 101.89 $135,000
Week 21 120.63 33.39 376.77 35.23 101.52 $80,000
Week 22 234.05 96.24 48.23 33.21 102.20 $290,000
Week 23 377.15 122.35 252.05 8.83 92.54 $460,000
Week 24 217.97 79.79 687.25 49.40 105.62 $230,000
14
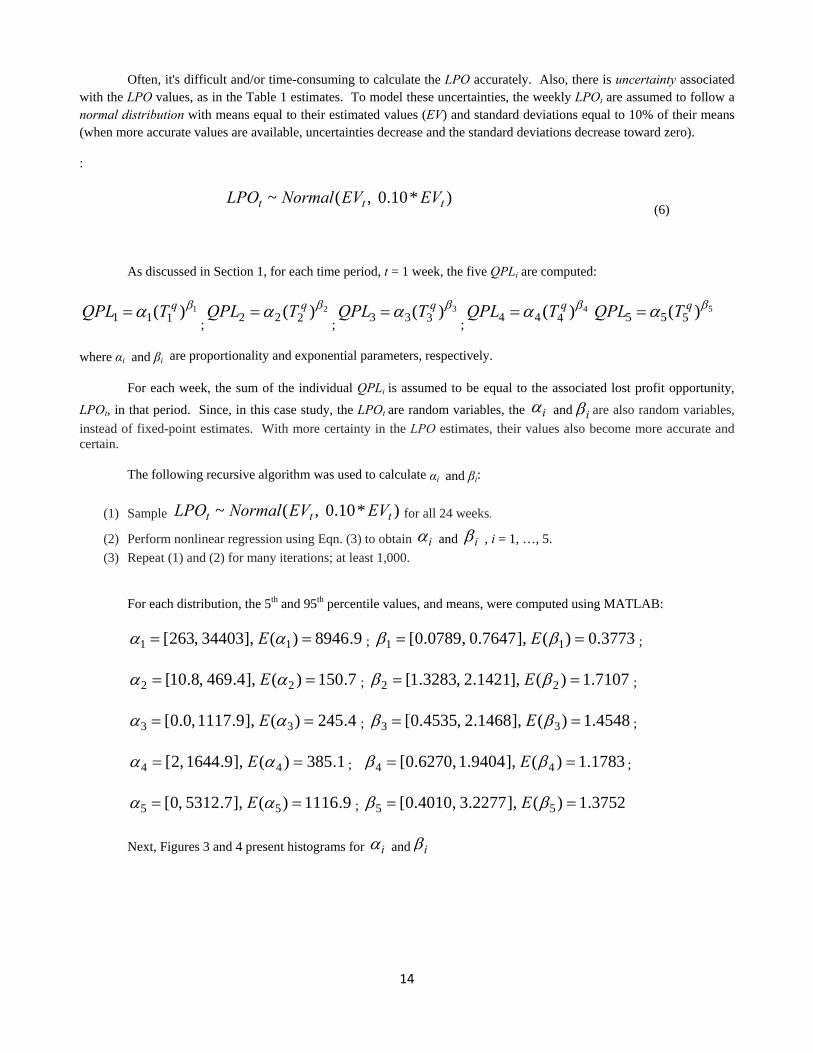
Often, it's difficult and/or time-consuming to calculate the LPO accurately. Also, there is uncertainty associated with the LPO values, as in the Table 1 estimates. To model these uncertainties, the weekly LPOt are assumed to follow a normal distribution with means equal to their estimated values (EV) and standard deviations equal to 10% of their means (when more accurate values are available, uncertainties decrease and the standard deviations decrease toward zero).
:
)*10.0,(~ ttt EVEVNormalLPO
(6)
As discussed in Section 1, for each time period, t = 1 week, the five QPLi are computed:
1)( 111 qTQPL
;2)( 222
qTQPL ;
3)( 333 qTQPL
;4)( 444
qTQPL 5)( 555 qTQPL
where αi and βi are proportionality and exponential parameters, respectively.
For each week, the sum of the individual QPLi is assumed to be equal to the associated lost profit opportunity,
LPOt, in that period. Since, in this case study, the LPOt are random variables, the i and i are also random variables,
instead of fixed-point estimates. With more certainty in the LPO estimates, their values also become more accurate and certain. The following recursive algorithm was used to calculate αi and βi:
(1) Sample )*10.0,(~ ttt EVEVNormalLPO for all 24 weeks.
(2) Perform nonlinear regression using Eqn. (3) to obtain i and i , i = 1, …, 5.
(3) Repeat (1) and (2) for many iterations; at least 1,000.
For each distribution, the 5th and 95th percentile values, and means, were computed using MATLAB:
9.8946)(],34403,263[ 11 E ; 3773.0)(],7647.0,0789.0[ 11 E ;
7.150)(],4.469,8.10[ 22 E ; 7107.1)(],1421.2,3283.1[ 22 E ;
4.245)(],9.1117,0.0[ 33 E ; 4548.1)(],1468.2,4535.0[ 33 E ;
1.385)(],9.1644,2[ 44 E ; 1783.1)(],9404.1,6270.0[ 44 E ;
9.1116)(],7.5312,0[ 55 E ; 3752.1)(],2277.3,4010.0[ 55 E
Next, Figures 3 and 4 present histograms for i and i

15
Figure 3. Histograms for proportionality parameters, i , i = 1, …, 5
Figure 4. Histograms for exponential parameters, i , i=1,2,…,5
0 2 4 6 8
x 104
0
100
200
300
400
500
600
700
Alpha1
Fre
quen
cy
Proportionality Parameter for Variable#1
0 500 1000 1500 20000
100
200
300
400
500
600
700
800
Alpha2
Fre
quen
cy
Proportionality Parameter for Variable#2
0 0.5 1 1.5 2
x 104
0
200
400
600
800
1000
Alpha3
Fre
quen
cy
Proportionality Parameter for Variable#3
0 2000 4000 6000 8000 100000
200
400
600
800
1000
Alpha4
Fre
quen
cy
Proportionality Parameter for Variable#4
0 5000 10000 150000
100
200
300
400
500
600
700
800
Alpha5
Fre
quen
cy
Proportionality Parameter for Variable#5
0 0.5 1 1.50
50
100
150
200
250
300
Beta1
Fre
quen
cy
Exponential Parameter for Variable#1
1 1.5 2 2.5 30
50
100
150
200
250
300
Beta2
Fre
quen
cy
Exponential Parameter for Variable#2
0 1 2 30
50
100
150
200
Beta3
Fre
quen
cy
Exponential Parameter for Variable#3
0 1 2 3 40
50
100
150
200
250
300
350
Beta4
Fre
quen
cy
Exponential Parameter for Variable#4
0 1 2 3 40
50
100
150
200
250
300
350
Beta5
Fre
quen
cy
Exponential Parameter for Variable#5

16
As discussed in Section 2, the mean values of αi and βi are used to calculate individual potential safety losses, PSLi, and the total potential safety loss (PSL):
1)( 111 sTPSL
; 2)( 222
sTPSL ;
3)( 333 sTPSL
;
4)( 444
sTPSL ;
5)( 555 sTPSL
54321 PSLPSLPSLPSLPSLPSL
Here,
siT
denote the time spent by Pi out of its safety limits. The individual PSLs are tabulated in Table 2 which shows
the relative contributions of the process variables to the total potential safety losses as
siT
increases. Observe that PSL2 increases at the fastest rate, reaching $8.5MM when P2 spends 10 minutes outside of its safety limits. Also, PSL3 and PSL5 increase rapidly with the time spent outside of their process variable safety limits. Finally, Figure 5 shows these variations graphically.
Table 2. Potential Safety Loss Variations with s
iT
siT PSL1 PSL2 PSL3 PSL4 PSL5 PSL
1 sec $8,946.9 $150.7 $245.4 $385.1 $1116.9 $10,845
30 sec $32,283.51 $50,701.94 $34,577.26 $21,186.81 $120,047 $258,796.5
120 sec $54,467.56 $5,43,211.1 $259,816.9 $108,510.8 $807,800.9 $1,773,807
600 sec $99,967.62 $8,525,043 $2,701,027 $722,884.9 $7,388,017 $19,436,940

17
Figure 5. Potential safety loss variations with s
iT
In summary, the PSLs indicate the extent of the potential losses that might have been experienced by the plant due to poor safety systems (including the basic process control system, operator corrective actions, etc.). Their relative magnitudes help to identify the most sensitive process variables with respect to safety. These values provide quantitative insights to the plant management in prioritizing and addressing different operational issues.
Do We Learn From Past Catastrophic Events?
Examples abound of catastrophic events that could have been avoided or mitigated. To be able to manage extreme risks effectively, organizations need to learn from past disasters, whether they have natural or unnatural causes.
BP’s Deepwater Horizon explosion might have been avoided, or at least there would have been fewer casualties, if numerous cost cutting measures that compromised safety were not made and vital warning systems were not disabled (so as to awaken workers in the middle of the night).
If BP’s Texas City Refinery had not placed contractor Senko’s workers in a trailer parked close to the manufacturing facilities (which violated regulations), 15 people would not have perished in its 2005 explosion.
If levees and evacuation plans were well managed, building codes well enforced, and insurance premiums reflected the actual risk from risk reduction measures, the damage from Hurricane Katrina would have been much less.
0 100 200 300 400 500 6000
1
2
3
4
5
6
7
8
9x 10
6
Time spent out of safety limits (in seconds)
Pot
entia
l saf
ety
loss
(in
$)
PSL1
PSL2
PSL3
PSL5
PSL2
18
In their book, “Learning from Catastrophes”, Kunreuther and Useem (2009) present seven principles for characterizing and developing strategies and leadership for perceiving, assessing, and managing risks associated with extreme events. These are summarized below:
Principle 1: Appreciate the importance of estimating risks and characterizing uncertainties surrounding such estimates.
Principle 2: Recognize the interdependencies associated with risks and the dynamic uncertainties associated with the interdependencies.
Principle 3: Understand people’s behavioral biases when developing risk management strategies.
Principle 4: Recognize the long-term impact of disasters on a region’s or nation’s politics, culture, and society.
Principle 5: Recognize transboundary risks by developing strategies that are global in nature.
Principle 6: Overcome inequalities with respect to the distribution and effects of catastrophes.
Principle 7: Build leadership for averting and responding to disasters before it is needed.
These risk-management strategies and guiding principles are designed to reduce and even prevent losses from low-probability, high-consequence events.
One of the methods to understand how people learn from catastrophes is to look into the mitigating measures they take after they have been exposed to or learned about a catastrophe. The recent Wharton study by Michel-Kerjan et al. (2011) on the National Flood Insurance Program shows that in 2006, after the 2005 Katrina disaster 1,299,000 new flood insurance policies were issued (compared to the average of 850,000 per year) under this national program. But just three years later only 43% of the households still had insurance. In general, people as well as companies do not invest in protection against low-probability, high-consequence events until after the disaster has occurred because they tend to ignore risks and are highly myopic. When investment for protection from catastrophe is considered, people tend to focus on the short-term benefits of these measures in relation to the upfront costs, and hence, the measure is often viewed as infeasible or economically attractive.
Near-misses can help corporations refresh their institutional memories and provide repeated justification for taking corrective actions. Above, we shared examples of how people/institutions have short-term memory and vision regarding low-probability, high-consequence events. “Low” probability does not mean “zero” probability. When near-miss analyses are embedded in an organization, they serve as reminders of potential low-probability events. For example, at the World Trade Center, had events like the 1993 terrorist attack and similar terrorist threats been recognized as near-misses, the resident companies might have been impelled to take measures to minimize the business damage of the 2001 extreme event.
A well-established eight-step near-miss management program mentioned above confronts the “five neglects” identified by Berger et al. (Kunreuther and Useem, 2009) as critical elements for rational decision making. These shortcomings of individuals in making risk-related decisions are:
1. Probability neglect – people sometimes don't consider the probability of the occurrence of an outcome, but focus on the consequences only.
2. Consequence neglect – just like probability neglect, sometimes individuals neglect the magnitude of outcomes. 3. Statistical neglect – instead of subjectively assessing small probabilities and continuously updating them, people
choose to use rules-of-thumb (if any heuristics), which can introduce systematic biases in their decisions. 4. Solution neglect – choosing an optimal solution is not possible when one fails to consider all of the solutions. 5. External risk neglect – in making decisions, individuals or groups often consider the cost/benefits of decisions
only for themselves, without including externalities, sometimes leading to significant negative outcomes for others.

19
In our views near-miss management helps to correct such biases, essentially by improving institutional memory and by focusing attention on emerging hazardous conditions. Conclusions and Implications for Management Action Industrial catastrophes are primarily, but not exclusively, driven by safety issues. A comprehensive near-miss management system, designed and implemented in a company’s operational structure can reduce significantly the occurrence, as well as impact, of catastrophes. In this paper, we highlighted the important components of an effective near-miss management system that apply to different business risks regardless of their sources. For example, safety and product-quality issues can be addressed similarly.
Near-misses are “leading indicators” for catastrophic events. Therefore, the establishment of new metrics to account more accurately for various near-misses is imperative to learning from high-frequency, low-consequence events to prevent low-frequency, high-impact occurrences (catastrophes).
Since most industrial catastrophes are the result of process safety issues, companies need to recognize the significance of differences between metrics to be used to assess personal safety and process safety. Currently, personal safety metrics are better defined than process safety metrics due to safety and health regulations (e.g., as promulgated by OSHA in the U. S.) Hence, it is important for corporations to develop comprehensive process near-miss metrics as leading indicators of potential problems in their processes. Finally, the new concept of “Potential Safety Loss” which is introduced in this article is an initial attempt to create methods to help management assess the potential of business losses based on experienced near-misses. Although this concept is demonstrated using process near-misses as examples, it equally applies to near-misses in other operational issues as well, including supply-chain near-misses. References
An Analysis of Urbanization and Hazard Mitigation Practices near Hazardous Liquid Transmission Pipelines.
http://cfpub.epa.gov/ncer_abstracts/index.cfm/fuseaction/display.abstractDetail/abstract/7599 (print)
Bird, F. E., and G. L. Germain, (1996). Practical Loss Control Leadership (Revised Edition), Det Norske Veritas, Loganville, GA.
Bloomberg News, July 30, 2007
DiMartino, D., J. V. Duca, The Rise and Fall of Subprime Mortgages, Economic Letter, V2. No 11, November 2007, Federal Reserve Bank of Dallas.
Goldfarb, Z. A., Washington Post, Friday, February 27, 2009, pD1 “After Big Loss, Fannie Mae Gets $15 Billion in Federal Aid”
Harrington, K., and J. O’Connor (2009). “How Cisco Succeeds”, Supply Chain Management Review. July/August, pp. 10-17.
Hoch, S. J., H. C. Kunreuther, R. E. Gunther (2001). Wharton on Making Decisions, John Wiley & Sons.
Kleindorfer, P. R., R. A. Lowe, I. Rosenthal, R. Fu, and J. C. Belke (2007). “Accident Epidemiology and the RMP Rule: Learning from a Decade of Accident History Data for the U.S. Chemical Industry”. Emergency Management, U. S. Environmental Protection Agency, http://www.epa.gov/oem/accident_epidemiology.htm

20
Kleindorfer P. R., and G. H. Saad, (2005). “Managing Disruption Risks in Supply Chains”, Production and Operations Management, 14 (1), March, pp. 53-68.
Kunreuther, H., and E. O. Michel-Kerjan, "Assessing, Managing and Benefiting from Global Interdependent Risks," The Wharton School, University of Pennsylvania, http://opim.wharton.upenn.edu/risk/library/AssessingRisks-2007.pdf
Kunreuther, H., and M. Useem (2009). Learning from Catastrophes, Wharton School Publishing, University of Pennsylvania. Kunreuther, H., and E Michel-Kerjan (2009). “At War with the Weather”, The MIT Press.
Meel, A, W. D. Seider, and U. G. Oktem, "Analysis of Management Actions, Human Behavior, and Process Reliability in Chemical Plants. I. Near-Miss Management System Selection," Proc. Safety Prog., 27, 2, 139-144, 2008.
Meel, A., W. D. Seider, and U. G. Oktem, "Analysis of Management Actions, Human Behavior, and Process Reliability in Chemical Plants. II. Impact of Management Actions," Proc. Safety Prog., 27, 1, 7-14, 2008.
Meel, A., L. M. ONeill, W. D. Seider, U. G. Oktem, and N. Keren, “Operational Risk Assessment of Chemical Industries by Exploiting Accident Databases,” J. Loss Preven. Proc. Indust., 20, 113-127, 2007.
Meel, A., L. M. ONeill, W.D. Seider, U. G. Oktem, N. Keren, “Frequency and Consequence Modeling of Rare Events Using Accident Databases”, AIChE National Symposium, 2006.
Michel‐Kerjan, E. O., C. Kousky, H. Kunreuther, and S. Lemoyne de Forges, Issue Brief “How long do homeowners keep their flood insurance coverage?” Summer 2011, Wharton Risk Management Center, University of Pennsylvania.
Mitchell, D. “A Note on Rising Food Prices” The World Bank Development Prospects Group, Policy Research Working Paper 4682. 2008
Muermann A., U. G. Oktem, (2002). “The Near-Miss Management of Operational Risk”, Journal of Risk Finance, Fall, 25-36.
Oktem, U. G. (2003). "Near-miss: a tool for integrated safety, health, environmental and security management". 37th Annual AIChE Loss Prevention Symposium. March 30–April 3.
Oktem, U. G., and A. Meel (2008). "Near-miss management: A participative approach to improving system reliability." Encyclopedia of Quantitative Risk Assessment and Analysis, John Wiley & Sons, Ltd., Chichester, UK, 1154-1163.
Oktem, U. G., R. Wong, and C. Oktem (2010). “Risk & Regulation,” Special Issue on Close Calls, Near-Misses and Early Warnings, LSE Publication, July, 12-13.
Pariyani, A., W. D. Seider, U. G. Oktem, and M. Soroush, “Dynamic Risk Analysis using Alarm Databases to Improve Safety and Quality: Part II – Bayesian Analysis,” AIChE J., 58, 3, 826-841 (2012).
Pariyani, A., W. D. Seider, U. G. Oktem, and M. Soroush, “Dynamic Risk Analysis using Alarm Databases to Improve Safety and Quality: Part I – Data Compaction,” AIChE J., 58, 3, 812-825 (2012).
Pariyani, A., W. D. Seider, U. G. Oktem, and M. Soroush, “Incidents Investigation and Dynamic Analysis of Large Alarm Databases in Chemical Plants: A Fluidized-Catalytic-Cracking Unit Case Study,” Ind. Eng. Chem. Res., 49, 8062-8079, 2010.
Pariyani, A., W. D. Seider, U. G. Oktem, and M. Soroush, “Improving process safety and product quality using large databases,” 20th European Symposium on Computer Aided Process Engineering (ESCAPE), 28, 175-180, 2010.

21
Phimister J. R., U. G. Oktem, P. Kleindorfer, and H. Kunrether (2003). “Near-Miss Incident Management in the Chemical Process Industry”, Risk Analysis, 23 (3), 445-459.
Sethi, S. P. and G. L. Thompson (2000). Optimal Control Theory: Applications to Management Science and Economics, Second Edition, Kluwer Academic Publishers, Boston. “The Report of the B.P. U.S. Refineries Independent Safety Review Panel”, January 2007
The U.S. Consumer Product Safety Commission (CPSC). (http://pressroom.consumerreports.org/pressroom/2011/01/only-one-fifth-of-americans-are-aware-they-purchased-a-recalled-product.html read on November 6, 2011).