assessment of corporate innovation capability with a data ... · assessment of corporate innovation...
TRANSCRIPT

Computers & Industrial Engineering 102 (2016) 58–68
Contents lists available at ScienceDirect
Computers & Industrial Engineering
journal homepage: www.elsevier .com/ locate/caie
Assessment of corporate innovation capability with a data-miningapproach: industrial case studies
http://dx.doi.org/10.1016/j.cie.2016.10.0180360-8352/� 2016 Elsevier Ltd. All rights reserved.
⇑ Corresponding author.E-mail addresses: [email protected], [email protected] (S. Altuntas),
[email protected], [email protected] (T. Dereli), [email protected] (A. Kusiak).
Serkan Altuntas a,⇑, Turkay Dereli b,c, Andrew Kusiak d
aYildiz Technical University, Department of Industrial Engineering, 34349 Istanbul, Turkeyb Iskenderun Technical University, Office of the President, 31200 Iskenderun, Hatay, TurkeycGaziantep University, Department of Industrial Engineering, 27310 Gaziantep, Turkeyd The University of Iowa, Department of Mechanical and Industrial Engineering, Iowa City, USA
a r t i c l e i n f o a b s t r a c t
Article history:Received 27 May 2016Received in revised form 10 September2016Accepted 23 October 2016Available online 24 October 2016
Keywords:Innovation capabilityData miningFuzzy association rulesCase studies
The interest in assessment of innovation capability of manufacturing systems is fueled by the growingcompetition. At this time, there is no generally accepted model to evaluate innovation capability ofmanufacturing systems. In this paper, a fuzzy-logic based data-mining approach is proposed to assessinnovation capability of manufacturing systems. The proposed algorithm is illustrated with two indus-trial case studies representing two different industry sectors. The results derived from these case studiesdemonstrate advantages of the proposed algorithm in assessing corporate innovation capability.
� 2016 Elsevier Ltd. All rights reserved.
1. Introduction
Assessing innovation capability of a corporation is important toremain competitive. Although the interest in assessment of inno-vation capability of organizations is growing, the literature oninnovation capability is not extensive. This could be due to the lackof understanding of innovation. The need to create innovationscience was outlined in Kusiak (2007a). The research related toinnovation is interdisciplinary and has attracted numerous scienceand practice communities (Kusiak, 2007e). Due to its interdisci-plinary nature, numerous definitions of innovation have appearedin the literature (e.g., see Martínez-Román, Gamero, & Tamayo,2011). According to Kusiak (2009), innovation aims at the creationof new products, processes, services by the use of new and existingknowledge. Productivity and efficiency can be improved by appli-cation of methods and tools, such as: trial and error approach, leaduser study, and innovation networks cited in Kusiak (2007c).
The literature offers different definitions of innovation capabil-ity. In this paper, innovation capability is defined as the ability tosupport and sustain innovation by using resources from diversebusiness areas ranging from marketing, research and development
(R&D) and manufacturing to logistics, and human factors. An orga-nization’s capability is vital for sustaining its competitive advan-tage and implementation of new strategies (Guan & Ma, 2003).The innovation capability of an organization indicates its innova-tion potential and future technological power. Higher innovationcapability implies stronger competitive power and long-term sur-vival in a competitive environment. There is no widely agreedupon model for comprehensive assessment of innovation capabil-ity. The reason behind the latter is that the factors impacting inno-vation capability change from sector to sector and technology totechnology. In addition, measuring such factors is difficult due totheir imprecision and vagueness. However, assessing innovationcapability of any organization is important.
Assessing innovation capability of any organization requires theconsiderations of multiple capabilities, such as organizationinnovation capability, process innovation capability, productinnovation capability, marketing innovation capability etc. Consid-erations and evaluation of such capabilities needs the usage ofdata-mining driven methods to find out unknown pattern andmeaningful results. Previous studies do not focus on associationsamong corporate innovation capabilities. No previous work alsoapplies a fuzzy-logic based data-mining approach to assessmentof innovation capability of corporations.
In this paper, a fuzzy-logic based data-mining approach isapplied to assess innovation capability of organizations and toaddress imprecision and vagueness. The classic association rules

S. Altuntas et al. / Computers & Industrial Engineering 102 (2016) 58–68 59
cannot capture meaningful relationships among different types ofinnovation capabilities. To address this limitation, fuzzy associa-tion rules are used. The fuzzy rules are derived with data-miningalgorithms, and they constitute a fuzzy-rule algorithm proposedin this paper. The fuzzy rules capture perceptions for decision mak-ers. Knowing associations among different innovation capabilitiesoffers great value to any organization in two ways: (1) makinginnovation capability of the competitive environment transparentand (2) organization’s priorities become apparent. The major con-tribution of this paper is threefold. First, it proposes a fuzzy-logicbased data-mining approach to assess corporate innovation capa-bility in practice. Second, the study demonstrates a successfulapplication of FGBRMA with industrial case studies. Third, afuzzy-logic based data-mining approach is applied in this studyto overcome the limitation of the classic association rule-baseddata mining algorithms and to address imprecision and vaguenessin practice.
The remainder of this paper is organized as follows. The litera-ture on innovation capability is presented in Section 2. The pro-posed approach for assessment of innovation capability isintroduced in Section 3. To validate the proposed approach, appli-cations in two different sectors are provided in Section 4. The finalsection offers future research directions and conclusions.
2. Literature review
The number of applications of formal methods in innovationscience is rather limited. Engler and Kusiak (2010) proposed anovel text-mining approach to determine the authoritative entitiesinvolved in collaborative innovation. Engler and Kusiak (2008) pro-posed web mining for innovation. In addition, Kusiak (2007b) andKusiak (2007d) discussed data mining in industrial applicationsand innovation. Guan and Ma (2003) conducted an empirical studyto explore the relationship between innovation capability andexport performance of Chinese exporting firms. The results demon-strated a relationship between the total improvement of innova-tion capability and export growth. It was determined thatlearning orientation impacts innovation capability of a corporation.In addition, organization’s innovation capability and learning ori-entation affect firm performance (Calantone, Cavusgil, & Zhao,2002). A range of internal and external factors may impact innova-tive performance of corporations. Details on these factors analyzedfor electronics and software development firms are presented inRomijn and Albaladejo (2002). R&D positively affects innovationpotential of a company. Higher R&D intensity and higher R&Dmanpower are important predictors of corporate performance(Sher & Yang, 2005). In addition, different types of technology sour-cing impact innovative capability of corporations (Zhao, Tong,Wong, & Zhu, 2005). Koc and Ceylan (2007) documented factorsimpacting innovative capacity of large corporations.
Lawson and Samson (2001) proposed an innovation capabilitybased model to achieve effective performance of organizations.Koc (2007) determined organizational factors of innovation capac-ity in software development companies. Yang, Zhang, and Ding(2015) proposed a method based on uncertain linguistic variablesand analytical hierarchy process to study innovation capability.In addition, the impact of intellectual capital on radical and incre-mental innovative capability (Subramaniam & Youndt, 2005),national innovation capability (Sun, 2009), R&D project assessmentwith respect to innovation capability (Elmquist & Masson, 2009)has been reported in the literature. Martínez-Román et al. (2011)discussed innovation in small and medium enterprises, whileForsman (2011) analyzed innovation capacity and developmentof small enterprises. In addition, the impact of customer relation-ship management (Lin, Chen, & Chiu, 2010), tacit knowledge
transfer (Cavusgil, Calantone, & Zhao, 2003), knowledge manage-ment (Yang, Rui, & Wang, 2006), knowledge sharing (Lin, 2007)of innovation capability have been researched in the literature.Ahmed and Abdalla (1999) discussed the role of innovation processin crafting the vision of the future.
The relationship between innovation capability and corporateknowledge management (Tasmin & Woods, 2007), and the knowl-edge creation process (Numprasertchai, Kanchanasanpetch, &Numprasertchai, 2009) have been studied.
Fuzzy logic based studies have been conducted to analyze inno-vation capability (see Dereli, Durmusoglu, & Daim, 2011; Lin,Tseng, Chen, & Chiu, 2011; Lu, Chen, & Wang, 2007; Wang, Lu, &Chen, 2008).
Although data mining algorithms usually call for large data sets,fuzzy association rules can be derived based on small data sets, e.g.,provided by a few decision makers. For example, Vinodh, Prakash,and Selvan (2011) used data from five different decision makers toevaluate leanness in manufacturing with fuzzy association rules.Similarly, Hu, Chen, and Tzeng (2003) used data from ten differentresources, which can be considered decision makers, to utilizefuzzy association rules. Although a few decision makers are enoughto employ fuzzy association rules, the number of rules derived byfuzzy association rules is generally high. Fuzzy association rulesprovides only meaningful results among these rules derived.
Fuzzy association rules express relationships among items underfuzziness. In this paper, the items are referred to as factors. The rela-tionship among factors is expressedwith association rules. The rulesindicate that if condition ‘‘A” occurs, then condition ‘‘B” may alsooccur. Details on the association rules are provided in Hipp,Güntzer, and Nakhaeizadeh (2000), Zhao and Bhowmick (2003),Kotsiantis and Kanellopoulos (2006), Sowan, Dahal, Hossain,Zhang, and Spencer (2013), and Altuntas, Dereli, and Kusiak (2015).
Association rules are widely used tools in data mining. Jain,Benyoucef, and Deshmukh (2008) applied association rules to evalu-ate agility of supply chains. Vinodh et al. (2011) used fuzzy associa-tion rules based approach to evaluate leanness. We are not aware ofany study using association rules to evaluate innovation capability.
Most publications related to the innovation capability reportempirical research based on surveyed data. They focus on identifi-cation of factors impacting innovation capability, relationshipbetween innovation capability and these factors, and validationof various hypothesis. This paper presents application of thefuzzy-grids based rule-mining algorithm (FGBRMA) to assess inno-vation capability of organizations. Details of the proposedapproach introduced in the next section.
3. Fuzzy-grid based rule-mining algorithm (FGBRMA)
Hu et al. (2003) proposed fuzzy-grid based rule-mining algo-rithm (FGBRMA) to find associations in a relational database. Thealgorithm proposed in this paper is based on data mining. Itincludes two stages, generation of the large fuzzy grids and gener-ation of fuzzy association rules (Hu et al., 2003).
Overview of the proposed methodology is illustrated in Fig. 1.The steps of the FGBRM algorithm (Hu et al., 2003) applied to
assess corporate innovation capability are presented next. The pro-posed FGBRMA application is new.
Step 1:
Determine factors impacting innovation capability. Step 2: Determine fuzzy partitioning of factors and fuzzysets with membership functions.
Step 3: Specify the minimum support value. Step 4: Specify decision makers.(continued on next page)
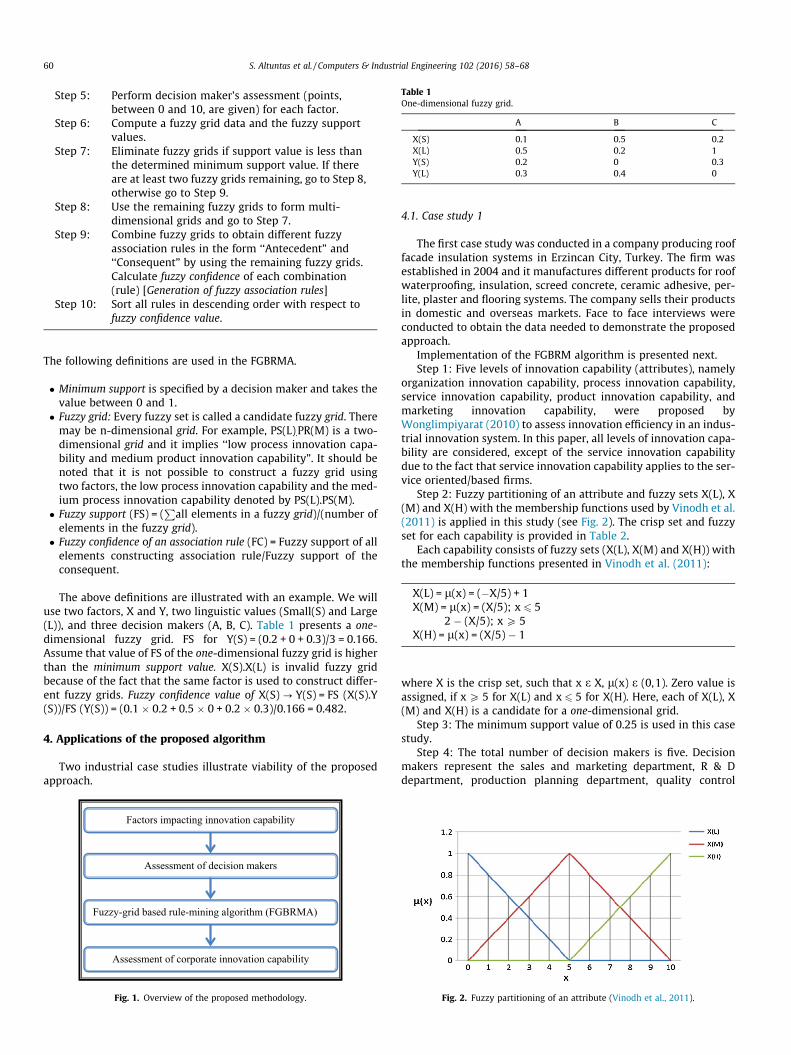
Table 1One-dimensional fuzzy grid.
60 S. Altuntas et al. / Computers & Industrial Engineering 102 (2016) 58–68
Step 5:
Fuz
Perform decision maker’s assessment (points,between 0 and 10, are given) for each factor.
A B C
Step 6: X(S) 0.1 0.5 0.2Compute a fuzzy grid data and the fuzzy supportvalues.
X(L) 0.5 0.2 1
Step 7: Y(S) 0.2 0 0.3Y(L) 0.3 0.4 0Eliminate fuzzy grids if support value is less thanthe determined minimum support value. If thereare at least two fuzzy grids remaining, go to Step 8,otherwise go to Step 9.
Step 8:
Use the remaining fuzzy grids to form multi-dimensional grids and go to Step 7.Step 9:
Combine fuzzy grids to obtain different fuzzyassociation rules in the form ‘‘Antecedent” and‘‘Consequent” by using the remaining fuzzy grids.Calculate fuzzy confidence of each combination(rule) [Generation of fuzzy association rules]Step 10:
Sort all rules in descending order with respect tofuzzy confidence value.The following definitions are used in the FGBRMA.
� Minimum support is specified by a decision maker and takes thevalue between 0 and 1.
� Fuzzy grid: Every fuzzy set is called a candidate fuzzy grid. Theremay be n-dimensional grid. For example, PS(L).PR(M) is a two-dimensional grid and it implies ‘‘low process innovation capa-bility and medium product innovation capability”. It should benoted that it is not possible to construct a fuzzy grid usingtwo factors, the low process innovation capability and the med-ium process innovation capability denoted by PS(L).PS(M).
� Fuzzy support (FS) = (P
all elements in a fuzzy grid)/(number ofelements in the fuzzy grid).
� Fuzzy confidence of an association rule (FC) = Fuzzy support of allelements constructing association rule/Fuzzy support of theconsequent.
The above definitions are illustrated with an example. We willuse two factors, X and Y, two linguistic values (Small(S) and Large(L)), and three decision makers (A, B, C). Table 1 presents a one-dimensional fuzzy grid. FS for Y(S) = (0.2 + 0 + 0.3)/3 = 0.166.Assume that value of FS of the one-dimensional fuzzy grid is higherthan the minimum support value. X(S).X(L) is invalid fuzzy gridbecause of the fact that the same factor is used to construct differ-ent fuzzy grids. Fuzzy confidence value of X(S)? Y(S) = FS (X(S).Y(S))/FS (Y(S)) = (0.1 � 0.2 + 0.5 � 0 + 0.2 � 0.3)/0.166 = 0.482.
4. Applications of the proposed algorithm
Two industrial case studies illustrate viability of the proposedapproach.
Factors impacting innovation capability
zy-grid based rule-mining algorithm (FGBRMA)
Assessment of decision makers
Assessment of corporate innovation capability
Fig. 1. Overview of the proposed methodology.
4.1. Case study 1
The first case study was conducted in a company producing rooffacade insulation systems in Erzincan City, Turkey. The firm wasestablished in 2004 and it manufactures different products for roofwaterproofing, insulation, screed concrete, ceramic adhesive, per-lite, plaster and flooring systems. The company sells their productsin domestic and overseas markets. Face to face interviews wereconducted to obtain the data needed to demonstrate the proposedapproach.
Implementation of the FGBRM algorithm is presented next.Step 1: Five levels of innovation capability (attributes), namely
organization innovation capability, process innovation capability,service innovation capability, product innovation capability, andmarketing innovation capability, were proposed byWonglimpiyarat (2010) to assess innovation efficiency in an indus-trial innovation system. In this paper, all levels of innovation capa-bility are considered, except of the service innovation capabilitydue to the fact that service innovation capability applies to the ser-vice oriented/based firms.
Step 2: Fuzzy partitioning of an attribute and fuzzy sets X(L), X(M) and X(H) with the membership functions used by Vinodh et al.(2011) is applied in this study (see Fig. 2). The crisp set and fuzzyset for each capability is provided in Table 2.
Each capability consists of fuzzy sets (X(L), X(M) and X(H)) withthe membership functions presented in Vinodh et al. (2011):
X(L) = l(x) = (�X/5) + 1X(M) = l(x) = (X/5); x 6 5
2 � (X/5); xP 5X(H) = l(x) = (X/5) � 1
where X is the crisp set, such that x e X, l(x) e (0,1). Zero value isassigned, if xP 5 for X(L) and x 6 5 for X(H). Here, each of X(L), X(M) and X(H) is a candidate for a one-dimensional grid.
Step 3: The minimum support value of 0.25 is used in this casestudy.
Step 4: The total number of decision makers is five. Decisionmakers represent the sales and marketing department, R & Ddepartment, production planning department, quality control
Fig. 2. Fuzzy partitioning of an attribute (Vinodh et al., 2011).

Table 3The scores provided by five decision makers in case study 1.
Capability Decision maker
1 2 3 4 5
1. Organization innovation capability (0 �1 0) 7 8 6 7 82. Process innovation capability (0 �1 0) 8 8 5 8 93. Product innovation capability (0 �1 0) 6 7 9 8 84. Marketing innovation capability (0 �1 0) 6 8 4 8 9
Table 4One-dimensional fuzzy operation support data in case study 1.
No. 1DFW 1 2 3 4 5 Support
1 O(L) 0 0 0 0 0 02 O(M) 0.6 0.4 0.8 0.6 0.4 0.56a
3 O(H) 0.4 0.6 0.2 0.4 0.6 0.44a
4 PS(L) 0 0 0 0 0 05 PS(M) 0.4 0.4 1 0.4 0.2 0.48a
6 PS(H) 0.6 0.6 0 0.6 0.8 0.52a
7 PR(L) 0 0 0 0 0 08 PR(M) 0.8 0.6 0.2 0.4 0.4 0.48a
9 PR(H) 0.2 0.4 0.8 0.6 0.6 0.52a
10 M(L) 0 0 0.2 0 0 0.0411 M(M) 0.8 0.4 0.8 0.4 0.2 0.52a
12 M(H) 0.2 0.6 0 0.6 0.8 0.44a
1DFW: one dimensional grid.a indicates value that is not less than the minimum support value of 0.25.
Table 5The eliminated one-dimensional fuzzy grids in case study 1.
No. 1DFW 1 2 3 4 5 Support
1 O(M) 0.6 0.4 0.8 0.6 0.4 0.562 O(H) 0.4 0.6 0.2 0.4 0.6 0.443 PS(M) 0.4 0.4 1 0.4 0.2 0.484 PS(H) 0.6 0.6 0 0.6 0.8 0.525 PR(M) 0.8 0.6 0.2 0.4 0.4 0.486 PR(H) 0.2 0.4 0.8 0.6 0.6 0.527 M(M) 0.8 0.4 0.8 0.4 0.2 0.528 M(H) 0.2 0.6 0 0.6 0.8 0.44
Table 2Crisp and fuzzy sets.
Capability Crisp set Fuzzy set
1. Organization innovation capability O O(L), O(M), O(H)2. Process innovation capability PS PS(L), PS(M), PS(H)3. Product innovation capability PR PR(L), PR(M), PR(H)4. Marketing innovation capability M M(L), M(M), M(H)
S. Altuntas et al. / Computers & Industrial Engineering 102 (2016) 58–68 61
department, and an administrative office. The average employ-ment time of the decision makers in the company is about 3 years.
Step 5: Decision maker assessments are provided (scoresbetween 0 and 10) in Table 3.
Step 6: The computed fuzzy operation support is provided inTable 4.
Step 7: The eliminated one-dimensional fuzzy grids are shownin Table 5. There are six fuzzy grids remaining. Therefore, go to Step8.
Step 8: The computed two-dimensional fuzzy operation supportdata is provided in Table 6. Go to Step 7.
Step 7: The eliminated two-dimensional fuzzy grids are shownin Table 7. There are twelve fuzzy grids remaining. Therefore, goto Step 8.
Step 8: The computed three-dimensional fuzzy operation sup-port data is provided in Table 8 which is given in Appendix A. All
of the three-dimensional fuzzy grids are eliminated due to the factthat their support value is less than 0.25.
Steps 9 and 10: The generated fuzzy association rules and theirfuzzy confidence values are listed in the descending order inTable 9. The minimum confidence value is 0.55. In total, 177 asso-ciation rules have been generated in case study 1. Of those, 27association rules listed in Table 9 are important due to the fact thatthe remaining rules are trivial, i.e., have low fuzzy confidencevalue. The most important association rules from based on Table 9are illustrated in Fig. 3. A circle and a square indicates one or two-dimensional fuzzy grid, respectively. The link between two fuzzygrids shows points to an association. Interestingly, there are noassociations among two-dimensional fuzzy grids in Fig. 3. As canbe seen from Table 9, the most important rule is PS(M).M(M)?O(M). This rule states that If the firm has ‘‘Medium process innova-tion capability” AND ‘‘Medium marketing innovation capability”,THEN it will have ‘‘Medium organization innovation capability”in near future. Therefore, to improve the corporate innovationcapability potential, the managers should pay attention to these27 associations as have the relatively high fuzzy confidence.
4.2. Case study 2
The second case study was conducted in a company operatingin defense industry in Trabzon city, Turkey. The firm was estab-lished in 1993 and it manufactures 30 different products fordefense industry. Most of these products are related to weaponsystems. The firm manufactures 45,000 products a year solddomestically and in 30 different countries. Face to face interviewswere conducted to obtain the data needed to demonstrate the pro-posed approach. One decision maker provided data by email. Inthis case study, the first three steps of the algorithm are the sameas in case study 1. Hence, application of the proposed approach incase study 2 begins at Step 4 as presented next.
Step 4: The total number of decision makers in case study 2 iseight. Decision makers work mostly in the production department.The average employment time of the decision makers in the com-pany is about 6 years.
Step 5: The assessment values of the decision makers are pro-vided (scores, between 0 and 10, are given) in Table 10.
Step 6: The computed fuzzy operation support values are pro-vided in Table 11.
Step 7: The eliminated one-dimensional fuzzy grid are shown inTable 12. There are six fuzzy grids remaining. Therefore, go to Step8.
Step 8: The computed two-dimensional fuzzy operation supportdata is provided in Table 13. Therefore, go to Step 7.
Step 7: The eliminated two-dimensional fuzzy grids are shownin Table 14. There are six fuzzy grids again remaining. Therefore,go to Step 8.
Step 8: The computed three-dimensional fuzzy operation sup-port data in this case study is provided in Table 15. The eliminatedthree-dimensional fuzzy grids and the computed four-dimensionalfuzzy operation support data are given in Tables 16 and 17, respec-tively. As can be seen from Table 17, there is only one associationrule remaining with 0.352 support value in the four-dimensionalfuzzy operation support case.
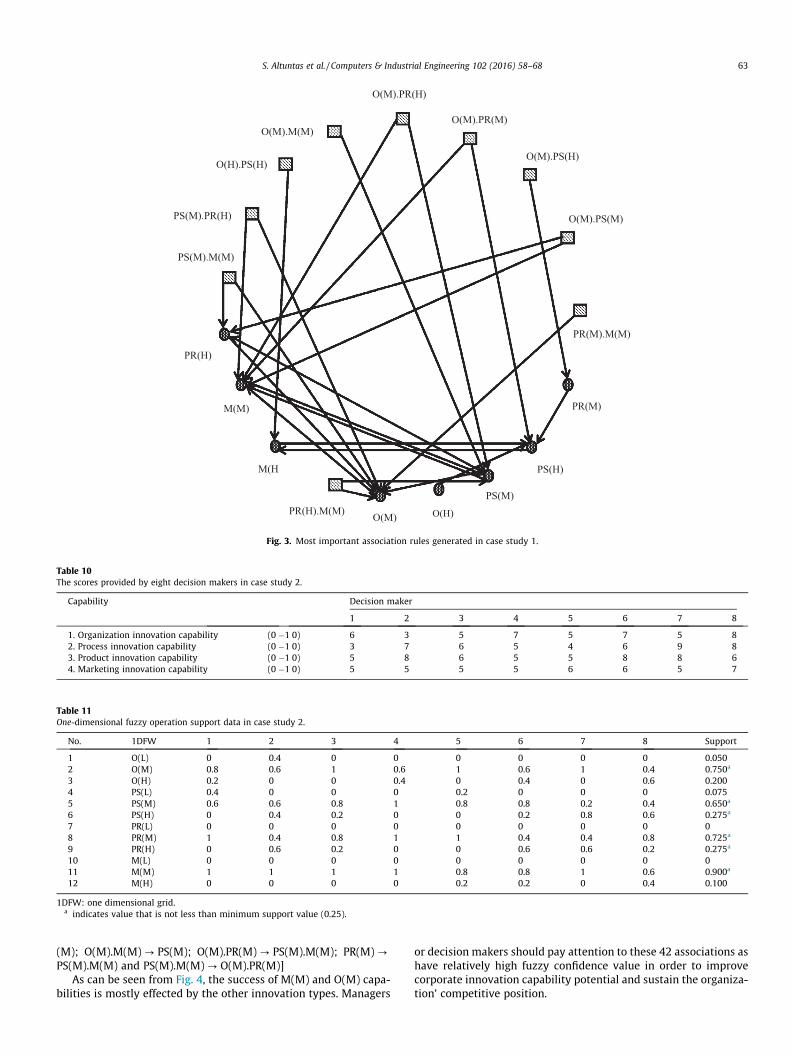
Steps 9 and 10: The generated fuzzy association rules and theircalculated fuzzy confidence values are listed in descending order inTable 18. The minimum confidence value is 0.55. In total, 42 asso-ciation rules have been generated in case study 2. As can be seenfrom Table 18, there are one, two and three-dimensional associa-tion rules in this case study. The most important association rulesfrom Table 18 are illustrated in Fig. 4. A circle, a square, and a tri-angle indicates one, two or three-dimensional fuzzy grid, respec-tively. The link between two fuzzy grids shows points to an

Table 6Two-dimensional fuzzy operation support data in case study 1.
No. 2DFW 1 2 3 4 5 Support
1 O(M).PS(M) 0.24 0.16 0.8 0.24 0.08 0.304a
2 O(M).PS(H) 0.36 0.24 0 0.36 0.32 0.256a
3 O(M).PR(M) 0.48 0.24 0.16 0.24 0.16 0.256a
4 O(M).PR(H) 0.12 0.16 0.64 0.36 0.24 0.304a
5 O(M).M(M) 0.48 0.16 0.64 0.24 0.08 0.320a
6 O(M).M(H) 0.12 0.24 0 0.36 0.32 0.2087 O(H).PS(M) 0.16 0.24 0.2 0.16 0.12 0.1768 O(H).PS(H) 0.24 0.36 0 0.24 0.48 0.264a
9 O(H).PR(M) 0.32 0.36 0.04 0.16 0.24 0.22410 O(H).PR(H) 0.08 0.24 0.16 0.24 0.36 0.21611 O(H).M(M) 0.32 0.24 0.16 0.16 0.12 0.20012 O(H).M(H) 0.08 0.36 0 0.24 0.48 0.23213 PS(M).PR(M) 0.32 0.24 0.2 0.16 0.08 0.20014 PS(M).PR(H) 0.08 0.16 0.8 0.24 0.12 0.280a
15 PS(M).M(M) 0.32 0.16 0.8 0.16 0.04 0.296a
16 PS(M).M(H) 0.08 0.24 0 0.24 0.16 0.14417 PS(H).PR(M) 0.48 0.36 0 0.24 0.32 0.280a
18 PS(H).PR(H) 0.12 0.24 0 0.36 0.48 0.24019 PS(H).M(M) 0.48 0.24 0 0.24 0.16 0.22420 PS(H).M(H) 0.12 0.36 0 0.36 0.64 0.296a
21 PR(M).M(M) 0.64 0.24 0.16 0.16 0.08 0.256a
22 PR(M).M(H) 0.16 0.36 0 0.24 0.32 0.21623 PR(H).M(M) 0.16 0.16 0.64 0.24 0.12 0.264a
24 PR(H).M(H) 0.04 0.24 0 0.36 0.48 0.224
2DFW: two dimensional grid.a indicates value that is not less than minimum support value (0.25).
Table 9Fuzzy association rules generated in case study 1.
No. Fuzzy association rules FC No. Fuzzy association rules FC
1 PS(M).M(M)? O(M) 0.6811 15 O(H).PS(H)?M(H) 0.60002 PS(M).PR(H)? O(M) 0.6743 16 O(H)? PS(H) 0.60003 PR(H).M(M)? PS(M) 0.6727 17 PR(H)? O(M) 0.58464 M(H)? PS(H) 0.6727 18 PR(M)? PS(H) 0.58335 O(M).PS(M)?M(M) 0.6632 19 PS(M)? PR(H) 0.58336 PR(H).M(M)? O(M) 0.6545 20 O(M).PR(M)?M(M) 0.57507 PS(M).PR(H)?M(M) 0.6343 21 PR(M).M(M)? O(M) 0.57508 PS(M)? O(M) 0.6333 22 O(M)?M(M) 0.57149 O(M).M(M)? PS(M) 0.6300 23 M(M)? PS(M) 0.569210 O(M).PS(M)? PR(H) 0.6211 24 PS(H)?M(H) 0.569211 O(M).PR(H)? PS(M) 0.6211 25 O(M).PR(H)?M(M) 0.568412 PS(M)?M(M) 0.6167 26 O(M).PS(H)? PR(M) 0.550013 M(M)? O(M) 0.6154 27 O(M).PR(M)? PS(H) 0.550014 PS(M).M(M)? PR(H) 0.6000
Table 7The eliminated two-dimensional fuzzy operation support data in case study 1.
No. 2DFW 1 2 3 4 5 Support
1 O(M).PS(M) 0.24 0.16 0.8 0.24 0.08 0.3042 O(M).PS(H) 0.36 0.24 0 0.36 0.32 0.2563 O(M).PR(M) 0.48 0.24 0.16 0.24 0.16 0.2564 O(M).PR(H) 0.12 0.16 0.64 0.36 0.24 0.3045 O(M).M(M) 0.48 0.16 0.64 0.24 0.08 0.3206 O(H).PS(H) 0.24 0.36 0 0.24 0.48 0.2647 PS(M).PR(H) 0.08 0.16 0.8 0.24 0.12 0.2808 PS(M).M(M) 0.32 0.16 0.8 0.16 0.04 0.2969 PS(H).PR(M) 0.48 0.36 0 0.24 0.32 0.28010 PS(H).M(H) 0.12 0.36 0 0.36 0.64 0.29611 PR(M).M(M) 0.64 0.24 0.16 0.16 0.08 0.25612 PR(H).M(M) 0.16 0.16 0.64 0.24 0.12 0.264
62 S. Altuntas et al. / Computers & Industrial Engineering 102 (2016) 58–68
association. Interestingly, most of the associations are between oneand two-dimensional fuzzy grids in the Figure. Unlike in case study1, there are associations among both one and two-dimensionalfuzzy grids in Fig. 4. However, no association exists among three-dimensional fuzzy grids. Three-dimensional fuzzy grids impactonly one-dimensional fuzzy grids but not the other way around.Furthermore, four-dimensional fuzzy operation support data is
constructed, but there is no four-dimensional fuzzy grid in the gen-erated fuzzy association rules.
As can be seen from Table 18, the most important rule is O(M)?M(M). This rule states that If the firm has ‘‘Medium organi-zation innovation capability”, THEN it will also has ‘‘Medium mar-keting innovation capability” in near future. Association rules thathave the lowest fuzzy confidence value in Table 18 are: [O(M)? PS
O(M) O(H)
PS(M)
PS(H)
PR(M)
PR(M).M(M)
O(M).PS(M)
O(M).PS(H)
O(M).PR(M)
O(M).PR(H)
O(M).M(M)
O(H).PS(H)
PS(M).PR(H)
PS(M).M(M)
PR(H).M(M)
M(H
M(M)
PR(H)
Fig. 3. Most important association rules generated in case study 1.
Table 11One-dimensional fuzzy operation support data in case study 2.
No. 1DFW 1 2 3 4 5 6 7 8 Support
1 O(L) 0 0.4 0 0 0 0 0 0 0.0502 O(M) 0.8 0.6 1 0.6 1 0.6 1 0.4 0.750a
3 O(H) 0.2 0 0 0.4 0 0.4 0 0.6 0.2004 PS(L) 0.4 0 0 0 0.2 0 0 0 0.0755 PS(M) 0.6 0.6 0.8 1 0.8 0.8 0.2 0.4 0.650a
6 PS(H) 0 0.4 0.2 0 0 0.2 0.8 0.6 0.275a
7 PR(L) 0 0 0 0 0 0 0 0 08 PR(M) 1 0.4 0.8 1 1 0.4 0.4 0.8 0.725a
9 PR(H) 0 0.6 0.2 0 0 0.6 0.6 0.2 0.275a
10 M(L) 0 0 0 0 0 0 0 0 011 M(M) 1 1 1 1 0.8 0.8 1 0.6 0.900a
12 M(H) 0 0 0 0 0.2 0.2 0 0.4 0.100
1DFW: one dimensional grid.a indicates value that is not less than minimum support value (0.25).
Table 10The scores provided by eight decision makers in case study 2.
Capability Decision maker
1 2 3 4 5 6 7 8
1. Organization innovation capability (0 �1 0) 6 3 5 7 5 7 5 82. Process innovation capability (0 �1 0) 3 7 6 5 4 6 9 83. Product innovation capability (0 �1 0) 5 8 6 5 5 8 8 64. Marketing innovation capability (0 �1 0) 5 5 5 5 6 6 5 7
S. Altuntas et al. / Computers & Industrial Engineering 102 (2016) 58–68 63
(M); O(M).M(M)? PS(M); O(M).PR(M)? PS(M).M(M); PR(M)?PS(M).M(M) and PS(M).M(M)? O(M).PR(M)]
As can be seen from Fig. 4, the success of M(M) and O(M) capa-bilities is mostly effected by the other innovation types. Managers
or decision makers should pay attention to these 42 associations ashave relatively high fuzzy confidence value in order to improvecorporate innovation capability potential and sustain the organiza-tion’ competitive position.

Table 12The eliminated one-dimensional fuzzy grids in case study 2.
No. 1DFW 1 2 3 4 5 6 7 8 Support
1 O(M) 0.8 0.6 1 0.6 1 0.6 1 0.4 0.7502 PS(M) 0.6 0.6 0.8 1 0.8 0.8 0.2 0.4 0.6503 PS(H) 0 0.4 0.2 0 0 0.2 0.8 0.6 0.2754 PR(M) 1 0.4 0.8 1 1 0.4 0.4 0.8 0.7255 PR(H) 0 0.6 0.2 0 0 0.6 0.6 0.2 0.2756 M(M) 1 1 1 1 0.8 0.8 1 0.6 0.900
Table 13Two-dimensional fuzzy operation support data in case study 2.
No. 2DFW 1 2 3 4 5 6 7 8 Support
1 O(M).PS(M) 0.48 0.36 0.8 0.6 0.8 0.48 0.2 0.16 0.485a
2 O(M).PS(H) 0 0.24 0.2 0 0 0.12 0.8 0.24 0.2003 O(M).PR(M) 0.8 0.24 0.8 0.6 1 0.24 0.4 0.32 0.550a
4 O(M).PR(H) 0 0.36 0.2 0 0 0.36 0.6 0.08 0.2005 O(M).M(M) 0.8 0.6 1 0.6 0.8 0.48 1 0.24 0.690a
6 PS(M).PR(M) 0.6 0.24 0.64 1 0.8 0.32 0.08 0.32 0.1907 PS(M).PR(H) 0 0.36 0.16 0 0 0.48 0.12 0.08 0.1508 PS(M).M(M) 0.6 0.6 0.8 1 0.64 0.64 0.2 0.24 0.590a
9 PS(H).PR(M) 0 0.16 0.16 0 0 0.08 0.32 0.48 0.15010 PS(H).PR(H) 0 0.24 0.04 0 0 0.12 0.48 0.12 0.12511 PS(H).M(M) 0 0.4 0.2 0 0 0.16 0.8 0.36 0.24012 PR(M).M(M) 1 0.4 0.8 1 0.8 0.32 0.4 0.48 0.650a
13 PR(H).M(M) 0 0.6 0.2 0 0 0.48 0.6 0.12 0.250a
2DFW: two dimensional grid.a indicates value that is not less than the minimum support value of 0.25.
Table 15Three-dimensional fuzzy operation support data in case study 2.
No. 3DFW 1 2 3 4 5 6 7 8 Support
1 O(M).PS(M).PR(M) 0.480 0.144 0.640 0.600 0.800 0.192 0.080 0.128 0.383a
2 O(M).PS(M).M(M) 0.480 0.360 0.800 0.600 0.640 0.384 0.200 0.096 0.445a
3 O(M).PS(M).PR(H) 0.000 0.216 0.160 0.000 0.000 0.288 0.120 0.032 0.1024 O(M).PR(M).PS(M) 0.480 0.144 0.640 0.600 0.800 0.192 0.080 0.128 0.383a
5 O(M).M(M).PR(M) 0.800 0.240 0.800 0.600 0.800 0.192 0.400 0.192 0.503a
6 O(M).M(M).PR(H) 0.000 0.360 0.200 0.000 0.000 0.288 0.600 0.048 0.1877 PS(M).M(M).PR(M) 0.600 0.240 0.640 1.000 0.640 0.256 0.080 0.192 0.456a
8 PS(M).M(M).PR(H) 0.000 0.360 0.160 0.000 0.000 0.384 0.120 0.048 0.134
3DFW: three-dimensional grid.a indicates value that is not less than the minimum support value of 0.25.
Table 14The eliminated two-dimensional fuzzy operation support data in case study 2.
No. 2DFW 1 2 3 4 5 6 7 8 Support
1 O(M).PS(M) 0.48 0.36 0.8 0.6 0.8 0.48 0.2 0.16 0.4852 O(M).PR(M) 0.8 0.24 0.8 0.6 1 0.24 0.4 0.32 0.5503 O(M).M(M) 0.8 0.6 1 0.6 0.8 0.48 1 0.24 0.6904 PS(M).M(M) 0.6 0.6 0.8 1 0.64 0.64 0.2 0.24 0.5905 PR(M).M(M) 1 0.4 0.8 1 0.8 0.32 0.4 0.48 0.6506 PR(H).M(M) 0 0.6 0.2 0 0 0.48 0.6 0.12 0.250
Table 16The eliminated three-dimensional fuzzy operation support data in case study 2.
No. 3DFW 1 2 3 4 5 6 7 8 Support
1 O(M).PS(M).PR(M) 0.480 0.144 0.640 0.600 0.800 0.192 0.080 0.128 0.3832 O(M).PS(M).M(M) 0.480 0.360 0.800 0.600 0.640 0.384 0.200 0.096 0.4453 O(M).PR(M).PS(M) 0.480 0.144 0.640 0.600 0.800 0.192 0.080 0.128 0.3834 O(M).M(M).PR(M) 0.800 0.240 0.800 0.600 0.800 0.192 0.400 0.192 0.5035 PS(M).M(M).PR(M) 0.600 0.240 0.640 1.000 0.640 0.256 0.080 0.192 0.456
64 S. Altuntas et al. / Computers & Industrial Engineering 102 (2016) 58–68

Table 17Four-dimensional fuzzy operation support data in case study 2.
No. 4DFW 1 2 3 4 5 6 7 8 Support
1 O(M).PS(M).PR(M).M(M) 0.480 0.144 0.640 0.600 0.640 0.154 0.080 0.077 0.352a
4DFW: four-dimensional grid.a indicates value that is not less than minimum support value (0.25).
PS(H)PS(M)
M(M)
O(M)
PS(M).M(M).PR(M)
O(M).PS(M).M(M)
O(M).M(M).PR(M)
O(M).PS(M).PR(M)
PR(H).M(M)O(M).PS(M)
O(M).M(M)
O(M).PR(M)
PS(M).M(M)
PR(M).M(M)
PR(H)
PR(M)
Fig. 4. Most important association rules generated in case study 2.
Table 18Fuzzy association rules generated in case study 2.
No. Fuzzy association rule FC No. Fuzzy association rule FC
1 O(M)?M(M) 0.9200 22 PR(H)? O(M) 0.72732 O(M).PS(M).PR(M)?M(M) 0.9191 23 O(M).PS(M)? PR(M).M(M) 0.72583 O(M).PS(M)?M(M) 0.9175 24 M(M)? PR(M) 0.72224 O(M).PR(M)?M(M) 0.9145 25 PS(M)? PR(M).M(M) 0.70155 PR(H)?M(M) 0.9091 26 PR(M).M(M)? PS(M) 0.70156 PS(M)?M(M) 0.9077 27 O(M).M(M).PR(M)? PS(M) 0.69987 PR(M)?M(M) 0.8966 28 O(M).PR(M)? PS(M) 0.69648 PS(H)?M(M) 0.8727 29 PR(M)? O(M).M(M) 0.69389 O(M).PS(M).M(M)? PR(M) 0.7910 30 PS(M)? O(M).M(M) 0.684610 O(M).PS(M)? PR(M) 0.7897 31 PR(H)? O(M).M(M) 0.680011 PR(M).M(M)? O(M) 0.7738 32 PS(H)? O(M).M(M) 0.672712 PS(M).M(M)? PR(M) 0.7729 33 O(M)? PR(M).M(M) 0.670713 PS(M).M(M).PR(M)? O(M) 0.7719 34 M(M)? PS(M) 0.655614 M(M)? O(M) 0.7667 35 O(M)? PS(M) 0.646715 PR(M)? O(M) 0.7586 36 O(M).M(M)? PS(M) 0.644916 PS(M).M(M)? O(M) 0.7542 37 O(M).PR(M)? PS(M).M(M) 0.640017 PR(H).M(M)? O(M) 0.7480 38 PR(M)? PS(M).M(M) 0.629018 PS(M)? O(M) 0.7462 39 PS(M).M(M)? O(M).PR(M) 0.596619 O(M)? PR(M) 0.7333 40 O(M)? PS(M).M(M) 0.593320 O(M).M(M)? PR(M) 0.7290 41 PS(M)? O(M).PR(M) 0.589221 PS(H)? O(M) 0.7273 42 M(M)? O(M).PR(M) 0.5589
S. Altuntas et al. / Computers & Industrial Engineering 102 (2016) 58–68 65

Table 19A comparison of case studies.
a b c d e f g
Case study 1 5 8 12 NA NA 27 16.4698Case study 2 8 6 6 5 1 42 31.0503
NA: Not Assigned. a: The number of decision makers. b: The number of eliminated one-dimensional grid. c: The number of eliminated two-dimensional grid. d: The number ofeliminated three-dimensional grid. e: The number of eliminated four-dimensional grid. f. Total number of fuzzy association rules generated. g. Sum of FC values.
66 S. Altuntas et al. / Computers & Industrial Engineering 102 (2016) 58–68
4.3. A comparison of case studies
The proposed approach and case studies show that the assess-ment of corporate innovation capability of any organization isbased on subjectivity and decision makers’ perception due touncertainties. Different approaches may results different outcomesfrom each other based on decision makers’ assessment because ofvagueness. Experiences, background and departments where deci-sion makers work affect the assessment. Therefore, we could notcompare the results of proposed approach to the ones of othermethod in this study. However, a comparison of case studies isgiven in Table 19. It should be noted that we set minimum supportto 0.25 and minimum confidence to 0.55 in case studies to gener-ate fuzzy association rules. It also should be highlighted that deci-sion makers work in different departments ranging from R & Ddepartment to quality control department and average employ-ment time is 3 years in Case study 1 although decision makerswork mostly in the production department and the averageemployment time of the decision makers in the company is about6 years in case study 2. As can be seen from Table 19, the numberof decision makers and total number of fuzzy association rulesgenerated in Case study 2 are higher than those of Case study 1.Therefore, the sum of fuzzy confidence values in Case study 2(31.0503), is higher than that of Case study 1(16.4698) and thereis no three and four-dimensional in Case study 1. The results revealthat the proposed approach can be effectively and straightfor-wardly applied in practice under uncertainty.
5. Conclusion
Assessing corporate innovation capability is complex and themeasuring factors impacting innovation capability is difficult dueto its inherent vagueness. There is no widely agreed upon modelfor comprehensive assessment of innovation capability in the liter-ature. Fuzzy association-rules are applicable in decision-makinginvolving vagueness which makes them suitable for assessmentof corporate innovation capability discussed in this paper. The stud-ies related to innovation capability presented in the literature areusually conducted using data from large sample sizes. The fuzzy-grid based rule-mining algorithm (FGBRMA) applied to assess cor-porate innovation capability of organizations allows any numberof samples or decision makers. The research reported in the paperwas demonstrated with industrial case studies involving successfulapplication of FGBRMA to assess corporate innovation capability.
The proposed approach offers insights into decision making ofinterest to managers, practitioners, and decision makers. For exam-ple, low level of innovation can be improved by focusing on theinnovation capability derived by the proposed research approach.The proposed method provides answers to questions such as: (i)which innovation capabilities should be improved? (ii) whichinnovation capabilities are associated with other capabilities?and (iii) which innovation capabilities have strong associations?The results support decisions related to the distributions ofresources with respect to innovation.
The results of the industrial case studies show that the mostimportant rules for Case study 1 and Case study 2 are PS(M).M(M)? O(M) and O(M)?M(M), respectively. The first rule states
that If the firm has ‘‘Medium process innovation capability” AND‘‘Medium marketing innovation capability”, THEN it will have‘‘Medium organization innovation capability” in near future. Thesecond rule states that If the firm has ‘‘Medium organization inno-vation capability”, THEN it will also have ‘‘Medium marketinginnovation capability” in near future. These rules show direct asso-ciation. In Case study 1, antecedent part (the left part of the rule),composed of two dimensional grid and consequent part (the rightpart of the rule) has one dimensional grid. In Case study 2, bothantecedent and consequent parts have one dimensional grid inthe rule. As can be seen from the results of the industrial case stud-ies, it is clear that there may be different combination of thesegrids in practice. Indirect relations among the levels of innovationcapability can be also easily assessed based on the results of fuzzyassociation rules generated. To improve the corporate innovationcapability potential in Case study 1, the managers should consider27 associations. In Case study 2, the managers should pay attentionto 42 associations in order to improve corporate innovation capa-bility potential and sustain organization’s competitive position.The sum of fuzzy confidence values for Case study 2 (31.0503), ishigher than that of Case study 1 (16.4698). The success of M(M),O(M) and PS(M) capabilities is mostly effected by the other innova-tion types in Case 1. In addition, the success of M(M) and O(M)capabilities is also mostly effected by the other innovation typesin Case 2. It is important for decision makers to assess innovationactivities and identify gaps in innovation.
In this study, a methodology to assess corporate innovationcapability is presented. The methodology uses data provided bythe decision makers. The fuzzy association rules are highly depen-dent on the decision maker assessments. Therefore, the assessmentis organization specific. Assessment of corporate innovation capa-bility with the proposed methodology provides great value to thedecision makers or engineers in manufacturing systems. For exam-ple, the proposed methodology offers great value to any organiza-tion in two ways: (1) making innovation capability of thecompetitive environment transparent and (2) organization’s prior-ities become apparent.
There are some limitations of the proposed approach. First, itwasassumed that the capabilities related to innovation were of equalimportance. The differences among types of innovation capabilitiescould be taken into account using fuzzy-weighted association-rulesin the future research. Aweight couldbe assigned to each innovationcapability for deriving fuzzy-weighted association-rules. Second,sensitivity analysis could be conducted with respect to differentminimum support and minimum confidence values. Decision makersfromdifferent departments evaluated innovation capabilities in thisstudy. Hence, decision makers could evaluate only the innovationcapability of interest to them in the future research. For example,the process innovation capability could be evaluated by a processengineer. Similarly, marketing innovation capability and productinnovation capability could be evaluated by a marketing managerand a production engineer, respectively.
Acknowledgements
The authors would like to thank the two anonymous reviewersfor their insightful comments and suggestions.

S. Altuntas et al. / Computers & Industrial Engineering 102 (2016) 58–68 67
Appendix A
Table 8
Table 8Three-dimensional fuzzy operation support data of case study 1.
No 3DFW 1 2 3 4 5 Support
1 O(M).PS(M).PR(M) 0.192 0.096 0.160 0.096 0.032 0.1152 O(M).PS(M).PR(H) 0.048 0.064 0.640 0.144 0.048 0.1893 O(M).PS(M).M(M) 0.192 0.064 0.640 0.096 0.016 0.2024 O(M).PS(M).M(H) 0.048 0.096 0.000 0.144 0.064 0.0705 O(M).PS(H).PR(M) 0.288 0.144 0.000 0.144 0.128 0.1416 O(M).PS(H).PR(H) 0.072 0.096 0.000 0.216 0.192 0.1157 O(M).PS(H).M(M) 0.288 0.096 0.000 0.144 0.064 0.1188 O(M).PS(H).M(H) 0.072 0.144 0.000 0.216 0.256 0.1389 O(M).PR(M).M(M) 0.384 0.096 0.128 0.096 0.032 0.14710 O(M).PR(M).PS(H) 0.288 0.144 0.000 0.144 0.128 0.14111 O(M).PR(M).PS(M) 0.192 0.096 0.160 0.096 0.032 0.11512 O(M).PR(M).M(H) 0.096 0.144 0.000 0.144 0.128 0.10213 O(M).PR(H).M(M) 0.096 0.064 0.512 0.144 0.048 0.17314 O(M).PR(H).PS(H) 0.072 0.096 0.000 0.216 0.192 0.11515 O(M).PR(H).PS(M) 0.048 0.064 0.640 0.144 0.048 0.18916 O(M).PR(H).M(H) 0.024 0.096 0.000 0.216 0.192 0.10617 O(M).M(M).PS(H) 0.288 0.096 0.000 0.144 0.064 0.11818 O(M).M(M).PS(M) 0.192 0.064 0.640 0.096 0.016 0.20219 O(M).M(M).PR(H) 0.096 0.064 0.512 0.144 0.048 0.17320 O(M).M(M).PR(M) 0.384 0.096 0.128 0.096 0.032 0.14721 O(H).PS(H).PR(H) 0.048 0.144 0.000 0.144 0.288 0.12522 O(H).PS(H).M(M) 0.192 0.144 0.000 0.096 0.096 0.10623 O(H).PS(H).PR(M) 0.192 0.216 0.000 0.096 0.192 0.13924 O(H).PS(H).M(H) 0.048 0.216 0.000 0.144 0.384 0.15825 PS(M).PR(H).M(M) 0.064 0.064 0.640 0.096 0.024 0.17826 PS(M).PR(H).M(H) 0.016 0.096 0.000 0.144 0.096 0.07027 PS(M).M(M).PR(M) 0.256 0.096 0.160 0.064 0.016 0.11828 PS(M).M(M).PR(H) 0.064 0.064 0.640 0.096 0.024 0.17829 PS(H).PR(M).M(H) 0.096 0.216 0.000 0.144 0.256 0.14230 PS(H).PR(M).M(M) 0.384 0.144 0.000 0.096 0.064 0.13831 PS(H).M(H).PR(H) 0.024 0.144 0.000 0.216 0.384 0.154
References
Ahmed, A. M., & Abdalla, H. S. (1999). The role of innovation process in crafting thevision of the future. Computers & Industrial Engineering, 37, 421–424.
Altuntas, S., Dereli, T., & Kusiak, A. (2015). Analysis of patent documents withweighted association rules. Technological Forecasting and Social Change, 92,249–262.
Calantone, R. J., Cavusgil, S. T., & Zhao, Y. (2002). Learning orientation, firminnovation capability, and firm performance. Industrial Marketing Management,31, 515–524.
Cavusgil, S. T., Calantone, R. J., & Zhao, Y. (2003). Tacit knowledge transfer and firminnovation capability. Journal of Business & Industrial Marketing, 18, 6–21.
Dereli, T., Durmusoglu, A., & Daim, T. U. (2011). Buyer/seller collaboration throughmeasurement of beliefs on innovativeness of products. Computers in Industry,62, 205–212.
Elmquist, M., & Masson, P. L. (2009). The value of a ‘failed’ R&D project: An emergingevaluation framework for building innovative capabilities. R&D Management,39, 136–152.
Engler, J., & Kusiak, A. (2008). Web mining for innovation. ASME MechanicalEngineering, 130, 38–40.
Engler, J., & Kusiak, A. (2010). Mining authoritativeness of collaborative innovationpartners. International Journal of Computers, Communications & Control, 5, 42–51.
Forsman, H. (2011). Innovation capacity and innovation development in smallenterprises. A comparison between the manufacturing and service sectors.Research Policy, 40, 739–750.
Guan, J., & Ma, N. (2003). Innovative capability and export performance of Chinesefirms. Technovation, 23, 737–747.
Hipp, J., Güntzer, U., & Nakhaeizadeh, G. (2000). Algorithms for association rulemining-A general survey and comparison. ACM SIG KDD Explorations, 2, 58–64.
Hu, Y. C., Chen, R. S., & Tzeng, G. H. (2003). Discovering fuzzy association rules usingfuzzy partition methods. Knowledge-Based Systems, 16, 137–147.
Jain, V., Benyoucef, L., & Deshmukh, S. G. (2008). A new approach for evaluatingagility in supply chains using fuzzy association rules mining. EngineeringApplications of Artificial Intelligence, 21, 367–385.
Koc, Y. (2007). Organizational determinants of innovation capacity in softwarecompanies. Computers & Industrial Engineering, 53, 373–385.
Koc, T., & Ceylan, C. (2007). Factors impacting the innovative capacity in large-scalecompanies. Technovation, 27, 105–114.
Kotsiantis, S., & Kanellopoulos, D. (2006). Association rules mining: A recentoverview. GESTS International Transactions on Computer Science and Engineering,32, 71–82.
Kusiak, A. (2007a). Innovation science: a primer. International Journal of ComputerApplications in Technology, 28, 140–149.
Kusiak, A. (2007b). Innovation: From data and knowledge. BONEZone, 6, 24–26.Kusiak, A. (2007c). Innovation of products and services: Bridging world’s
economies. In 19th International conference on production research, ICPR 19,Valparaiso Chile, 1–6 August. .
Kusiak, A. (2007d). Data mining in industrial applications and innovation. ICS News,17–21. INFORMS Computing Society.
Kusiak, A. (2007e). Innovation: The living laboratory perspective. Computer-AidedDesign & Applications, 4, 863–876.
Kusiak, A. (2009). Innovation: A data-driven approach. International Journal ofProduction Economics, 122, 440–448.
Lawson, B., & Samson, D. (2001). Developing innovation capability in organizations:A dynamic capabilities approach. International Journal of InnovationManagement, 5, 377–400.
Lin, H. F. (2007). Knowledge sharing and firm innovation capability: An empiricalstudy. International Journal of Manpower, 28, 315–332.
Lin, R. J., Chen, R. H., & Chiu, K. K. S. (2010). Customer relationship management andinnovation capability: An empirical study. Industrial Management & DataSystems, 110, 111–133.
Lin, Y., Tseng, M. L., Chen, C. C., & Chiu, A. S. F. (2011). Positioning strategiccompetitiveness of green business innovation capabilities using hybrid method.Expert Systems with Applications, 38, 1839–1849.
Lu, L. Y., Chen, C. B., & Wang, C. H. (2007). Fuzzy multi attribute analysis forevaluating firm technological innovation capability. International Journal ofTechnology Management, 40, 114–130.
Martínez-Román, J. A., Gamero, J., & Tamayo, J. A. (2011). Analysis of innovation inSMEs using an innovative capability-based non-linear model: A study in theprovince of Seville (Spain). Technovation, 31, 459–475.
Numprasertchai, S., Kanchanasanpetch, P., & Numprasertchai, H. (2009). Knowledgecreation and innovation capability in the public university. International Journalof Innovation and Learning, 6, 568–580.
Romijn, H., & Albaladejo, M. (2002). Determinants of innovation capability in smallelectronics and software firms in southeast England. Research Policy, 31,1053–1067.

68 S. Altuntas et al. / Computers & Industrial Engineering 102 (2016) 58–68
Sher, P. J., & Yang, P. Y. (2005). The effects of innovative capabilities and R&Dclustering on firm performance: The evidence of Taiwan’s semiconductorindustry. Technovation, 25, 33–43.
Sowan, B., Dahal, K., Hossain, M. A., Zhang, L., & Spencer, L. (2013). Fuzzy associationrule mining approaches for enhancing prediction performance. Expert Systemswith Applications, 40, 6928–6937.
Subramaniam, M., & Youndt, M. A. (2005). The influence of intellectual capital onthe types of innovative capabilities. Academy of Management Journal, 48,450–463.
Sun, H. (2009). A meta-analysis on the influence of national culture on innovationcapability. International Journal of Entrepreneurship and Innovation Management,10, 353–360.
Tasmin, R., & Woods, P. (2007). Relationship between corporate knowledgemanagement and the firm’s innovation capability. International Journal ofServices Technology and Management, 8, 62–79.
Vinodh, S., Prakash, N. H., & Selvan, K. E. (2011). Evaluation of leanness using fuzzyassociation rules mining. The International Journal of Advanced ManufacturingTechnology, 57, 343–352.
Wang, C. H., Lu, I. Y., & Chen, C. B. (2008). Evaluating firm technological innovationcapability under uncertainty. Technovation, 28, 349–363.
Wonglimpiyarat, J. (2010). Innovation index and the innovative capacity of nations.Futures, 42, 247–253.
Yang, J., Rui, M., & Wang, J. (2006). Enhancing the firm’s innovation capabilitythrough knowledge management: A study of high technology firms in China.International Journal of Technology Management, 36, 305–317.
Yang, C., Zhang, Q., & Ding, S. (2015). An evaluation method for innovationcapability based on uncertain linguistic variable. Applied Mathematics andComputation, 256, 160–174.
Zhao, Q. & Bhowmick, S. S. (2003). Association rule mining: A survey. TechnicalReport, CAIS, Nanyang Technological University, Singapore, No. 2003116.
Zhao, H., Tong, X., Wong, P. K., & Zhu, J. (2005). Types of technology sourcing andinnovative capability: An exploratory study of Singapore manufacturing firms.Journal of High Technology Management Research, 16, 209–224.