assessment of e. coli and microcystins in cladophora … of e. coli and microcystins in cladophora...
TRANSCRIPT

Assessment of E coli and Microcystins in Cladophora Mats in the Nearshore Waters of Grand Traverse Bay Little Traverse Bay and
Saginaw Bay
Prepared By
Richard R Rediske PhD James OrsquoKeefe Kate Rieger and Jeremy D Rediske
Annis Water Resources Institute Grand Valley State University
740 West Shoreline Drive Muskegon Michigan 49441
Prepared For
Michigan Department of Environmental Quality 481062-07
May 2010
i
TABLE OF CONTENTS TABLE OF CONTENTS i LIST OF TABLES ii LIST OF FIGURES iii Acknowledgements iv Executive Summary v 10 Introduction 1 20 Methods 2
21 Sampling methods 2 211 Sampling Design 2 212 Sampling Methods 2
22 Analytical Methods 5 221 Hydrolab Methods 5 222 E coli Analysis 5 223 Sample Preparation for Microcystin Analysis 6 244 Microcystin LR and RR by LCMS 6
30 Results 6 31 Saginaw Bay E coli Microcystin and Water Chemistry Results 6 311 Wenona Beach 6 312 Bay City Recreation Area 9 313 Brissette Beach 11 314 South Linwood Beach 14 315 Pinconning Park 16 316 Whitersquos Beach 18 317 Arenac County Park 21 318 Foster Road Beach 23
32 Grand Traverse Bay and Little Traverse Bay E coli Microcystin and Water Chemistry Results 25
321 Petoskey State Park 25 322 Magnus Park 28 323 Elk Rapids Park 30 324 Antrim County Day Park 32 325 East Bay Park 34 326 Traverse City State Park 36 327 Bryant Park 39 328 Clinch Park 41 329 West End Beach 43
33 Saginaw Bay and Grand Traverse BayLittle Traverse Bay Comparisons 46 40 Discussion 46 50 Conclusions 47 60 References 49
ii
LIST OF TABLES
Table 2 1 Laboratory Analytical Methods 5 Table 311 Wenona Beach Water Quality Data 2008 8 Table 312 Wenona Beach Cladophora Data 2008 8 Table 313 Bay City Recreation Area Water Quality Data 2008 10 Table 314 Bay City Recreation Area Cladophora Data 2008 11 Table 315 Brissette Beach Water Quality Data 2008 13 Table 316 Brissette Beach Cladophora Data 2008 13 Table 317 South Linwood Beach Water Quality Data 2008 15 Table 318 South Linwood Beach Cladophora Data 2008 15 Table 319 Pinconning Park Water Quality Data 2008 17 Table 3110 Pinconning Park Cladophora Data 2008 18 Table 3111 Whitersquos Beach Water Quality Data 2008 20 Table 3112 Whitersquos Beach Cladophora Data 2008 20 Table 3113 Arenac County Park Water Quality Data 2008 22 Table 3114 Arenac County Park Cladophora Data 2008 22 Table 3115 Foster Road Beach Water Quality Data 2008 24 Table 3116 Foster Road Beach Cladophora Data 2008 25 Table 321 Petoskey State Park Water Quality Data 2008 27 Table 322 Petoskey State Park Cladophora Data 2008 27 Table 323 Magnus Park Water Quality Data 2008 29 Table 324 Magnus Park Cladophora Data 2008 29 Table 325 Elk Rapids Park Water Quality Data 2008 31 Table 326 Elk Rapids Park Cladophora Data 2008 31 Table 327 Antrim County Day Park Water Quality Data 2008 33 Table 328 Antrim County Day Park Cladophora Data 2008 33 Table 329 East Bay Park Water Quality Data 2008 35 Table 3210 East Bay Park Cladophora Data 2008 36 Table 3211 Traverse City State Park Water Quality Data 2008 38 Table 3212 Traverse City State Park Cladophora Data 2008 38 Table 3213 Bryant Park Water Quality Data 2008 40 Table 3214 Bryant Park Cladophora Data 2008 40 Table 3215 Clinch Park Water Quality Data 2008 42 Table 3216 Clinch Park Cladophora Data 2008 43 Table 3217 West End Beach Water Quality Data 2008 45 Table 3218 West End Beach Cladophora Data 2008 45 Table 331 Summary of Water Quality and Cladophora Data for Grand Traverse BayLittle
Traverse Bay and Saginaw Bay 2008 46
iii
LIST OF FIGURES Figure 21 Grand Traverse BayLittle Traverse Bay Sampling Locations 3 Figure 22 Saginaw Bay Sampling Locations 4 Figure 311 Wenona Beach Sampling Locations 2008 (L= Left C=Center R=Right) 7 Figure 312 E coli in Detached Cladophora and Water at Wenona Beach 2008 9 Figure 313 Bay City Recreation Area Sampling Locations 2008 (L= Left C=Center
R=Right) 10 Figure 314 E coli in Detached Cladophora and Water at the Bay City Recreation Area
2008 11 Figure 315 Brissette Beach Sampling Locations 2008 (L= Left C=Center R=Right) 12 Figure 316 E coli in Detached Cladophora and Water at Brissette Beach 2008 13 Figure 317 South Linwood Beach Sampling Locations 2008 (L= Left C=Center
R=Right) 14 Figure 318 E coli in Detached Cladophora and Water at South Linwood Beach 2008 16 Figure 319 Pinconning Park Sampling Locations 2008 (L= Left C=Center R=Right) 17 Figure 3110 E coli in Detached Cladophora and Water at Pinconning Park 2008 18 Figure 3111 Whites Beach Sampling Locations 2008 (L= Left C=Center R=Right) 19 Figure 3112 E coli in Detached Cladophora and Water at Whitersquos Beach 2008 20 Figure 3113 Arenac County Park Sampling Locations 2008 (L= Left C=Center
R=Right) 21 Figure 3114 E coli in Detached Cladophora and Water at Arenac County Park 2008 23 Figure 3115 Foster Road Beach Sampling Locations 2008 (L= Left C=Center R=Right) 24 Figure 3116 E coli in Detached Cladophora and Water at Foster Road Beach 2008 25 Figure 321 Petoskey State Park Sampling Locations 2008 (L= Left C=Center R=
Right) 26 Figure 322 E coli in Detached Cladophora and Water at Petoskey State Park 2008 27 Figure 323 Magnus Park Sampling Locations 2008 (L= Left C=Center R=Right) 28 Figure 324 E coli in Detached Cladophora and Water at Magnus Park 2008 29 Figure 325 Elk Rapids Park Sampling Locations 2008 (L= Left C=Center R=Right) 30 Figure 326 E coli in Detached Cladophora and Water at the Elk Rapids Park 2008 31 Figure 327 Antrim County Day Park Sampling Locations 2008 (L= Left C=Center
R=Right) 32 Figure 328 E coli in Detached Cladophora and Water at the Antrim County Day Park
2008 34 Figure 329 East Bay Park Sampling Locations 2008 (L= Left C=Center R=Right) 35 Figure 3210 E coli in Detached Cladophora and Water at East Bay Park 2008 36 Figure 3211 Grand Traverse State Park Sampling Locations 2008 (L= Left C=Center
R=Right) 37 Figure 3212 E coli in Detached Cladophora and Water at Grand Traverse State Park
2008 38 Figure 3213 Bryant Park Sampling Locations 2008 (L= Left C=Center R=Right) 39 Figure 3214 E coli in Detached Cladophora and Water at Bryant Park 2008 41 Figure 3215 Clinch Park Sampling Locations 2008 (L= Left C=Center R=Right) 42
iv
Figure 3216 E coli in Detached Cladophora and Water at Clinch Park 2008 43 Figure 3217 West End Beach Sampling Locations 2008 (L= Left C=Center R=Right) 44 Figure 3218 E coli in Detached Cladophora and Water at West End Beach 2008 45 Acknowledgements We thank the Michigan Department of Natural Resources and Environment for awarding AWRI a Clean Michigan Initiative - Clean Water Fund grant (TC 481062-07) which funded this research and for the contributions of Tamara Lipsey as project Administrator We thank the AWRI staff that assisted with this project Brian Scull assisted with the water chemistry analyses and Jen Gradisher and Anthony Straley were involved with the preparation of cyanobacteria samples For the work in the Grand Traverse Bay area we thank Hans VanSummeren and the Water Studies Institute at Northwestern Michigan College for providing laboratory space for the analysis of Cladophora and E coli samples and for coordinating outreach activities We also thank Sara Uren of the Watershed Center Grand Traverse Bay for her assistance in the coordination of the area beach sampling program and the Inland Seas Education Association and the Tip of the Mitt Watershed Association for assistance with outreach activities For the work conducted in Saginaw Bay we thank Robert Hill of the Bay County Health Department for his assistance in site location and the coordination of the area beach monitoring program We also thank Charlie Bauer of the MDNRE and the Bay City State Recreation Area for coordinating and hosting outreach activities
v
Executive Summary An assessment of the ability of Cladophora mats to sequester E coli and microcystin LR and RR was conducted in the near-shore waters of Grand Traverse Bay (7 sites) Little Traverse Bay (2 sites) and Saginaw Bay (8 sites) The sampling locations were at public beach access points where Cladophora mats were previously observed The goals of this research were to determine the spatial and temporal variability of E coli populations in Cladophora mats in these recreational waters and if cyanotoxins (microcystin LR and RR) are sequestered in the detached algae The collection of Cladophora samples was coordinated with local beach monitoring programs to facilitate the comparison with ambient water bacteria concentrations This project provided important data for the assessment of public health impacts and the development of beach management programs to address the problems associated with Cladophora accumulations Based on the results from this investigation Saginaw Bay appears to be more heavily impacted by detached Cladophora than Grand TraverseLittle Traverse Bays Mean E coli concentrations in detached Cladophora were higher in Saginaw Bay (2796 cfug dwt) than Grand Traverse BayLittle Traverse Bay (1775cfug dwt) however the difference was not statistically significant (Mann-Whitney ρ=040) Cladophora deposits exhibited spatial and temporal variability in both systems At most beaches in Grand Traverse Bay Cladophora deposits were limited to small pockets at 1 location Clinch Park had only one site with Cladophora on the last sampling event and two locations at the Traverse City State Park were free of detached algal accumulations In contrast Cladophora deposits in Saginaw Bay covered approximately 1 meter (m) of the shoreline at most beaches Two locations in Saginaw Bay also had no accumulations of Cladophora during the study period (Whitersquos Beach and Pinconning Park) Differences in Cladophora accumulation between Saginaw Bay and Grand Traverse BayLittle Traverse Bay may be attributed to higher total phosphorus levels in Saginaw Bay Levels of E coli in detached Cladophora in both systems were similar to concentrations previously reported in the Great Lakes (1000 cfug dwt ndash 60000 cfug dwt) In Saginaw Bay the highest levels of E coli in detached Cladophora were consistently found at beaches near the Saginaw River E ven within individual sites locations near tributaries and drains at Wenona Beach and South Linwood Beach were significantly higher than locations farther away from a point source This relationship also was noted in Grand Traverse Bay where the location near Mitchell Creek at the Traverse City State Park had elevated E coli concentrations in detached Cladophora compared to the other beach locations These results suggest that Cladophora can trap bacteria from point sources and also be stimulated by nutrient discharges T wo locations Pinconning Park and Whitersquos Beach had very limited Cladophora growth Both locations had Chara growing on the lake bottom Chara is known to exhibit allelopathic activity that can limit the growth of other aquatic plants N o correlation was found between E coli levels in the open water (designated beach monitoring locations) and the near-shore zone where the detached Cladophora samples were taken As noted in previous studies Cladophora appears to hold trapped E coli and does not release the entrained bacteria into the offshore water This investigation was the first to document the accumulation of microcystins in the detached Cladophora of Saginaw Bay Total microcystins in detached Cladophora had a grand mean of 57 microgg dwt for the study period Saginaw Bay has a history of Microcystis blooms in the late
vi
summer months that produce both microcystin LR and RR Since Microcystis has a h igh requirement for sunlight cyanobacteria may become stressed when they are trapped in the detached algae mats W hile accidental ingestion by humans of microcystins trapped in Cladophora is unlikely these compounds can act as skin irritants Walking through Cladophora accumulations to get to deeper water may provide sufficient exposure to cause irritation in sensitive individuals if microcystins are present Although the data suggest that swimming areas (1 m depth) are not impacted by the E coli accumulations in detached Cladophora entrained bacteria and cyanotoxins may pose a hazard to children playing in the nearshore water and beach sand Current regulations discourage beach grooming and altering the nearshore zone The presence of elevated bacteria and microcystin levels in the nearshore environment of Saginaw Bay suggests that the current policy should be reevaluated to balance potential impacts to public health with the ecosystem services provided by coastal wetlands
1
10 Introduction Cladophora is a filamentous green alga that commonly grows attached to hard substrates in the littoral zone of freshwater environments and is widely distributed throughout the Laurentian Great Lakes (Graham 1982 Dodds and Gudder 1992) This macroalga is considered a public nuisance causing shoreline fouling and clogging of water intake pipes (Joska and Bolton 1996) When mats of Cladophora detach and wash onshore their subsequent decay is associated with notoriously foul odors (Higgins et al 2005 Wilson et al 2006) nearshore oxygen depletion (Whitman et al 2003) and elevated bacterial loads (Byappanahalli 2003) In the Laurentian Great Lakes Cladophora is a nuisance throughout Lakes Ontario Erie Huron and Michigan where hard substrates are available (Higgins et al 2005) P ublic concern over detached and decaying Cladophora along beaches in the lower Great Lakes began as early as the 1950s-1960s and peaked in the 1970s (Bartsch 1968 Taft 1975) Shoreline fouling by decaying macroalgae was a significant factor for limiting nutrient loading to the Great Lakes as identified in the amended Great Lakes Water Quality Agreement (GLWQA) of 1978 Subsequent phosphorus management programs led to a decrease in Cladophora biomass in the early 1980s (Painter and Kamaitis 1987) Beginning in the late 1990s the dominance of invasive dreissenid mussels (ie the zebra mussel Dreissena polymorpha and the quagga mussel D bugensis) in the Laurentian Great Lakes has reengineered nutrient distributions by removing suspended particulate matter through filter feeding and generating heavier particulate matter as feces and pseudofeces in the benthos (Hecky et al 2004) This process has been implicated in shifting pools of organic matter and nutrients from the pelagic zone to the benthos and increasing the solar radiant flux to the benthos (Zhu et al 2006) Since the invasion of dreissenids Cladophora biomass has dramatically increased in the lower Great Lakes (Mills et al 2003 Bootsma et al 2005 Hecky et al 2004) The occurrence of Cladophora in near-shore Lake Michigan habitats may have significant public health and ecological importance (Whitman et al 2003) and could potentially lead to a decrease in recreational activities on beaches The presence of Cladophora has been associated with high levels of E coli and other species of enteric bacteria in the beach sand and swimming waters of the Great Lakes (Whitman et al 2003 Olapade et al 2006) These bacteria may even grow on Cladophora under certain conditions (Byappanahalli et al 2003) and the alga can potentially harbor and enhance the survival of pathogenic bacteria released into the environment through point and non-point sources Cladophora has been reported to provide nutrients and protect attached bacteria from environmental stresses such as desiccation predation and harmful radiation (Byappanahalli et al 2003 Englebert et al 2008) Ishii et al (2006) found several enteric bacterial pathogens including Campylobacter shiga toxin-producing E coli (STEC) Shigella and Salmonella from Cladophora at a southern Lake Michigan beach In addition to pathogens sulfate-reducing bacteria and other phylogenetically diverse groups of microorganisms also have been detected in Cladophora mats (Olapade et al 2006) Recently Clostridium botulinum and Clostridium perfringens were found to grow in Cladophora mats (Byappanahalli and Whitman 2009) In this manner Cladophora mats may play a significant role as a source and sink for pathogens in the near-shore environment C oncerns related to Cladophora mats and their ability to sequester pathogens have been raised in Michigan as part of watershed plans for Grand Traverse Bay Little Traverse Bay and Saginaw Bay In addition the Saginaw Bay Area of Concern has Beach Closings listed as a Beneficial Use Impairment due to elevated E coli levels
2
Although the public health and ecological importance of microbial communities associated with Cladophora mats in freshwater environments have been previously studied their role in sequestering potentially toxic cyanobacteria is poorly understood Nuisance blooms of Microcystis have been reported in Saginaw Bay (Vanderploeg et al 2001 Fahnensteil et al 2008) and several of the large inland lakes near Grand Traverse Bay (Keilty and Woller 2004) Since cyanobacteria blooms also can accumulate on beaches and cause fouling of the shoreline (Codd 1995 L a n d s b e r g 2 0 0 2 ) the presence of cyanotoxins in detached Cladophora mats should be investigated We conducted an assessment of the ability of Cladophora mats to sequester E coli and microcystin LR and RR in the near-shore waters of Grand Traverse Bay (7 sites) Little Traverse Bay (2 sites) and Saginaw Bay (8 sites) The sampling locations were at public beach access points where Cladophora mats have been previously observed The goals of this research were to determine the spatial and temporal variability of E coli populations in Cladophora mats in these recreational waters and if cyanotoxins (microcystin LR and RR) are sequestered in the detached algae The collection of Cladophora samples was coordinated with local beach monitoring programs to facilitate the comparison with ambient water bacteria concentrations This project provided important data for the assessment of public health impacts and the development of beach management programs to address the problems associated with Cladophora accumulations
20 Methods
21 Sampling methods
211 Sampling Design
Eight locations in Saginaw Bay seven locations in Grand Traverse Bay and two locations in Little Traverse Bay were sampled in triplicate for E coli and microcystin LR and RR during the summer of 2008 T he locations were sampled weekly for 8 weeks in June-August Gr ab samples of floating Cladophora mats were collected at each location and analyzed individually for E coli and as a composite for microcystin LR and RR Sampling dates and times were coordinated with local beach monitoring programs to facilitate the use of ambient water bacteria concentrations collected close to the time of Cladophora sampling Cladophora was collected and prepared as described by Whitman et al (2003) The use of standardized collection protocols and triplicate samples provided a high level of quality assurance and resulted in data that were appropriate for decision making and environmental assessment
212 Sampling Methods Triplicate Cladophora samples were collected at each site with an integrated collection device at 025-05 m depth (Sutherland et al 1992) The sampling locations for Grand Traverse BayLittle Traverse Bay and Saginaw Bay are shown in Figures 1 and 2 respectively Each location was marked with GPS coordinates and sampled at weekly intervals during June - August 2008 (8
3
sampling events) E coli samples were placed in sterile whirl pack bags and stored in the dark at 4ordmC A composite of the triplicate samples was placed in an amber glass jar and stored at 4ordmC for microcystin-LR and RR analysis A ll samples were returned to the laboratory and on a daily basis for further processing and storage E coli samples were analyzed within 6 hour s of collection Microcystin ndashLR and RR samples were lyophilized and stored at -30ordmC Chemical and physical parameters were monitored at each location using a Hydrolab DataSonde 4a We measured pH dissolved oxygen (DO) DO saturation temperature and specific conductance at each station
Figure 21 Grand Traverse BayLittle Traverse Bay Sampling Locations
4
Figure 22 Saginaw Bay Sampling Locations The extent of Cladophora accumulation was determined at each sampling location according to the ranking
bull 0 = No visible Cladophora bull 1 = Cladophora present in isolated pockets at one location bull 2 = Cladophora present in isolated pockets at all locations bull 3 = Cladophora residue 1 m2 in area bull 4 = Cladophora residue 1-5 m2 in area bull 5 = Cladophora gt 5 m2 in area
5
22 Analytical Methods
Laboratory procedures have been selected based on previous use for water quality investigations established ranges for accuracyprecision and limited problems related to matrix interferences A summary of analytical methods is given in Table 21 Method summaries are provided in the following sections 221 Hydrolab Methods Hydrolab measurements of pH temperature dissolved oxygen and specific conductance were conducted according to the methods in the instrument users manual (Hydrolab 1998) T he Hydrolab Datasonde 4a was calibrated in the lab prior to use in the field The instrument was placed in the water at each site and the technician waited for a s table reading of the sensors Measurements were recorded at 05 m depth at each station P recision was assessed by the measurement of field duplicates at 10 of the stations
Table 21 Laboratory Analytical Methods
222 E coli Analysis Samples of E coli were prepared by elutriation with phosphate buffer (Whitman et al 2003) One gram portions of homogenized algal samples were weighed and placed in sterile 15- milliliter (mL) centrifuge tubes Nine mL of sterile phosphate-buffered diluent water (pH 68) was added and the mixture was vigorously shaken for 2 min and then centrifuged briefly (45 s) at 2000 rpm to allow the large particles to settle The diluted sample then was analyzed by the Colilert-18 (IDEXX) using the Quanti-Tray 2000 (APHA 1998) A 1 mL aliquot was removed from the centrifuge tube and transferred to 99 mL of sterile phosphate buffer in a sterile water sampling vial The Colilert reagent then was then added to the vial and shaken until dissolved The sample and reagents were then added to the Quanti-Tray 2000 and sealed with the Quanti-Tray sealer T he tray was incubated for 18 ho urs at 35degC plusmn 05degC and read under UV light Fluorescent colonies were counted and the number of colony forming units (cfu)100 mL was calculated according to the manufacturerrsquos instructions
Parameter Preparation Preservation Holding Time Methods Reference
pH Hydrolab 1998 Dissolved Oxygen Hydrolab 1998
Temperature Hydrolab 1998 Specific conductance Hydrolab 1998
Microcystin LR and RR by LCMS
Filtration methanol extraction C-18
cartridge Freeze -30degC 6 mo Lawerence et al 2001
Boyer et al 2004
E coli Phosphate buffer extraction Cool 4degC 6 hrs
Whitman et al 2003 Colilert-18
APHA 1998
6
223 Sample Preparation for Microcystin Analysis
Water samples for the analyses of microcystin were prepared according to methods outlined by Lawerence et al (2001) A 100-500 mL aliquot was filtered through a Whatman GFC glass fiber filter The filter then was placed in a 5 mL centrifuge tube and lyophilized for 8 hours The filter residue was extracted with three successive aliquots of methanol followed by sonication The methanol extract was evaporated to dryness under nitrogen and re-dissolved in 1 mL of 50 methanol in water This mixture was passed through a 1 gram (g) SPE C-18 cartridge (Baker) that had been preconditioned with 10 mL of methanol followed by 10 mL of water The cartridge then was washed with 5 mL of 25 methanol in water and the eluted fraction was discarded The microcystins then were eluted with 4 mL of 100 methanol in water This fraction was collected and the volume reduced to 2 mL The volume was adjusted back to 3 mL with methanol and split into three 1 mL aliquots for HPLCMS analysis
244 Microcystin LR and RR by LCMS Samples for Liquid ChromatographyMass Spectrometry (LCMS) analysis were filtered using Gelman AE binderless glass fiber filters The cells were lysed by freezing and then vortexed for 5 minutes in centrifuge tubes containing 10 mL of aqueous (5050) methanol to extract toxins Suspensions were centrifuged and the supernatant was filtered through 045 micron nylon filters The concentrations of microcystin LR and RR were determined by liquid chromatography-tandem mass spectrometry using a Finnigan Surveyor MSQ LCMS Nodularin was added to the extracts and used as an internal standard Compounds were separated on a Phenomenex Luna C18 column at 50oC The mobile phase was a binary gradient of water and methanol both containing 01 formic acid T he initial gradient started with 95 water and 5 methanol followed by a step change to 50 water and 50 methanol at 3 minutes with a linear gradient from 5 t o 20 m inutes to 5 water and 95 methanol Instrument detection limits for these toxins were determined to be 1 microgramliter (microgl) For calibration a series of 5 solutions were prepared with the internal standard at 1000 microgl and the analytes in the range of 1 to 500 microgl in final volumes of 1 mL of 9010 watermethanol 30 Results The results of E coli water chemistry and microcystins data from each location are presented for Saginaw Bay and Grand Traverse BayLittle Traverse Bay in Sections 31 and 32 respectively A comparison of the two basins is provided in Section 33
31 Saginaw Bay E coli Microcystin and Water Chemistry Results
311 Wenona Beach The sampling locations for Wenona Beach are provided in Figure 311 Near-shore locations were sampled at a depth of 03 m The beach area was covered with reed canary grass sedges and cattails Cattails and detached Cladophora were common in the shallow littoral zone and the samples were collected approximately 1 meter outside of the macrophyte zone The detached
7
Cladophora also was common at the sampling locations with some areas of fresh Cladophora growing on submerged rocks and woody debris
Figure 311 Wenona Beach Sampling Locations 2008 (L= Left C=Center R=Right) The results of water and detached Cladophora analyses are summarized in Tables 311 and 312 respectively The mean E coli concentration for the study period was 14 cfu100 mL with no single beach samples exceeding 100 cfu100 mL (Table 311) Water temperatures ranged from 21degC to 25degC The mean E coli concentration for detached Cladophora was 9775 cfug dwt (Table 312) Microcystins were detected in the detached Cladophora beginning in July with mean concentrations of 47 microgg dwt 47 microgg dwt and 103 microgg dwt for microcystin RR microcystin LR and total microcystins respectively Detached Cladophora was present in
8
Table 311 Wenona Beach Water Quality Data 2008
ConductanceL C R Mean microScm
062308 10 8 18 12 792 77 21 440070108 78 44 82 68 810 78 22 470070808 3 4 2 3 814 74 23 451071508 2 1 1 1 817 75 24 450072208 5 6 1 4 816 73 24 456072908 33 8 7 16 810 72 25 453080508 4 7 4 5 813 76 24 461081208 4 2 3 3 811 79 24 467
Mean 17 10 15 14 81 76 23 456
cfu100 mlDateE coli in Water Water Chemistry
pH DO (mgl) Temp OC
Table 312 Wenona Beach Cladophora Data 2008
CladophoraL C R Mean Extent RR LR Total
062308 448 733 22507 7896 5 lt 01 lt 01 lt 01070108 800 2331 25432 9521 5 lt 01 1 lt 01070808 1279 3561 31566 12135 5 12 11 23071508 610 500 1678 929 3 15 23 38072208 1892 2000 3578 2490 5 27 34 61072908 5631 5633 64132 25132 5 68 80 148080508 6322 4531 25346 12066 5 80 80 161081208 3313 2311 18462 8029 5 82 102 184
Mean 2537 2700 24088 9775 5 47 47 103
Microcystins in Cladophora microgg dwtDate E coli in Cladophora cfug dwt
(Cladophora Extent 0 = None Present 1 = Present in isolated pockets at one location 2 = Present in isolated pockets at all locations 3 = Deposits 1 m2 in area 4= Deposits 1-5 m2 in area 5 = Deposits gt 5 m2 in area)
deposits of gt5 m2 at all locations during the sampling period (Table 312) E coli concentrations in water and detached Cladophora are displayed in Figure 312 No correlation was observed between bacterial levels in water and detached algae (Spearmanrsquos RO ρ=014) The drop in E coli levels observed on July 15 was after a storm that had occurred on July 12 A statistically significant difference was observed between beach locations for E coli concentrations in detached Cladophora (Kruskal-Wallis ρ=00004) Station R was significantly different from C and L (Mann-Whitney ρ=0012 and 0010 respectively) S tation R was the closest sampling location to the Saginaw River Station R had the highest concentration of E coli in detached Cladophora (64132 cfug dwt) This bacterial concentration was the highest level observed during the study period
9
0
1
2
3
4
5
62508 7208 7908 71608 72308 73008 8608 81308
Log
E c
oli
Con
cent
ratio
n
Water (cfu100mL)Cladophora cfug dwt
Figure 312 E coli in Detached Cladophora and Water at Wenona Beach 2008 312 Bay City Recreation Area The sampling locations for the Bay City Recreation Area are provided in Figure 313 Three near-shore locations were sampled at a depth of 03 m The beach area was sandy and appeared to be groomed Detached Cladophora was common in the shallow littoral zone and the samples were collected approximately 1 meter from shore The results of water and detached Cladophora analyses are summarized in Tables 313 and 314 respectively The mean E coli concentration for the study period was 6 cfu100 mL with no single beach sample exceeding 100 cfu100 mL (Table 313) Water temperatures ranged from 21degC to 24degC The mean E coli concentration in detached Cladophora was 3216 cfug dwt (Table 314) Microcystins were detected in the detached Cladophora beginning in June with mean concentrations of 96 microgg dwt 129 microgg dwt and 225 microgg dwt for microcystin RR microcystin LR and total microcystins respectively The highest concentrations of microcystins were found on August 12 at the Bay City Recreation area (microcystin RR 364 microgg dwt microcystin LR 349 microgg dwt and total microcystins 714 microgg dwt) Detached Cladophora covered the entire beach for all but one of the sampling events E coli concentrations in water and detached Cladophora are displayed in Figure 314 No correlation was observed between bacterial levels in the water and the detached algae (Spearmanrsquos RO ρ=008) The drop in E coli levels observed on July 15 was after a storm that had occurred on July 12 A statistically significant difference was not observed between beach locations for E coli concentrations in detached Cladophora (Kruskal-Wallis ρ=00073) Station R had the highest concentration of E coli in detached Cladophora (8923 cfug dwt)
10
Figure 313 Bay City Recreation Area Sampling Locations 2008 (L= Left C=Center R=Right)
Table 313 Bay City Recreation Area Water Quality Data 2008
ConductanceL C R Mean microScm
062308 10 8 24 14 792 77 21 420070108 1 2 6 3 811 78 22 437070808 3 4 47 18 816 75 23 445071508 2 1 1 1 816 74 23 436072208 1 1 1 1 816 73 24 436072908 4 8 1 4 812 77 24 446080508 4 7 4 5 817 78 24 448081208 1 2 1 1 811 81 24 449
Mean 3 4 11 6 811 77 23 440
E coli in Water Water Chemistry cfu100 ml pH DO (mgl) Temp OC
Date
11
Table 314 Bay City Recreation Area Cladophora Data 2008
CladophoraL C R Mean Extent RR LR Total
062308 1432 856 3456 1915 5 1 1 2070108 1333 963 2564 1620 5 2 7 9070808 4222 4563 8923 5903 5 14 33 47071508 1100 1245 1344 1230 3 32 49 81072208 1632 2000 7843 3825 5 65 99 164072908 998 5633 8564 5065 5 56 219 275080508 2331 4531 3564 3475 5 231 275 505081208 3223 2311 2564 2699 5 364 349 714
Mean 2034 2763 4853 3216 5 96 129 225
Date E coli in Cladophora cfug dwt Microcystins in Cladophora microgg dwt
(Cladophora Extent 0 = None Present 1 = Present in isolated pockets at one location 2 = Present in isolated pockets at all locations 3 = Deposits 1 m2 in area 4= Deposits 1-5 m2 in area 5 = Deposits gt 5 m2 in area)
0
1
2
3
4
5
62508 7208 7908 71608 72308 73008 8608 81308
Log
E c
oli
Con
cent
ratio
n
Water (cfu100mL)Cladophora cfug dwt
Figure 314 E coli in Detached Cladophora and Water at the Bay City Recreation Area 2008
313 Brissette Beach The sampling locations for Brissette Beach are provided in Figure 315 T hree near-shore locations were sampled at a depth of 03 m T he beach area was sandy and appeared to be groomed Detached Cladophora was common in the shallow littoral zone and the samples were collected approximately 1-2 m from shore
12
Figure 315 Brissette Beach Sampling Locations 2008 (L= Left C=Center R=Right)
The results of water and detached Cladophora analyses are summarized in Tables 315 and 316 respectively The mean E coli concentration for the study period was 7 cfu100 mL with no single beach sample exceeding 100 cfu100 mL (Table 315) Water temperatures ranged from 21degC to 24degC The mean E coli concentration in detached Cladophora was 768 cfug dwt (Table 316) Microcystins were detected in the detached Cladophora beginning in June with mean concentrations of 9 microgg dwt 15 microgg dwt and 23 microgg dwt for microcystin RR microcystin LR and total microcystins respectively Detached Cladophora was present in deposits of 1-5 m2 at all locations during the sampling period except after the storm event on July 12 (Table 316) E coli concentrations in the water and detached Cladophora are displayed in Figure 316 No correlation was observed between bacterial levels in water and detached algae (Spearmanrsquos RO ρ=083) A statistically significant difference was not observed between beach locations for E coli concentrations in detached Cladophora (Kruskal-Wallis ρ=0053) Station R had the highest concentration of E coli in detached Cladophora (1848 cfug dwt)
13
Table 315 Brissette Beach Water Quality Data 2008
ConductanceL C R Mean microScm
062308 3 2 1 2 789 77 21 400070108 15 22 35 24 812 78 22 440070808 1 1 1 1 819 75 23 433071508 2 1 3 2 812 74 23 434072208 1 1 7 3 812 73 24 444072908 16 37 16 23 818 77 24 439080508 1 2 1 1 819 78 24 445081208 1 2 6 3 813 81 24 447
Mean 5 9 9 7 812 77 23 435
E coli in Water Water Chemistry cfu100 ml pH DO (mgl) Temp OC
Date
Table 316 Brissette Beach Cladophora Data 2008
CladophoraL C R Mean Extent RR LR Total
062308 618 1045 1848 1170 4 05 07 1070108 450 533 460 481 4 01 07 1070808 655 784 989 809 4 23 37 6071508 411 333 450 398 2 09 77 9072208 644 755 877 759 4 35 131 17072908 755 766 864 795 4 18 142 16080508 644 532 436 537 4 213 285 50081208 1033 1200 1344 1192 4 388 494 88
Mean 651 744 908 768 4 9 15 23
Date E coli in Cladophora cfug dwt Microcystins in Cladophora microgg dwt
(Cladophora Extent 0 = None Present 1 = Present in isolated pockets at one location 2 = Present in isolated pockets at all locations 3 = Deposits 1 m2 in area 4= Deposits 1-5 m2 in area 5 = Deposits gt 5 m2 in area)
0
1
2
3
4
5
62508 7208 7908 71608 72308 73008 8608 81308
Log
E c
oli
Conc
entra
tion Water (cfu100mL)
Cladophora cfug dwt
Figure 316 E coli in Detached Cladophora and Water at Brissette Beach 2008
14
314 South Linwood Beach The sampling locations for South Linwood Beach are provided in Figure 317 Three near-shore locations were sampled at a depth of 03 m T he beach area was sandy and appeared to be groomed Detached Cladophora was common in the shallow littoral zone and the samples were collected approximately 1-2 m from shore
Figure 317 South Linwood Beach Sampling Locations 2008 (L= Left C=Center R=Right)
15
The results of water and detached Cladophora analyses are summarized in Tables 317 and 318 respectively The mean E coli concentration for the study period was 9 cfu100 mL with no single beach sample exceeding 100 cfu100 mL (Table 317) Water temperatures ranged from 21degC to 24degC The mean E coli concentration in detached Cladophora was 1191 cfug dwt (Table 318) Microcystins were detected in the detached Cladophora beginning in July with mean concentrations of 12 microgg dwt 15 microgg dwt and 27 micro gg dwt for microcystin RR microcystin LR and total microcystins respectively D etached Cladophora was present in deposits of 1-5 m2 at all locations during the sampling period except after the storm event on July 12 (Table 318) E coli concentrations in water and detached Cladophora are displayed in Figure 318 No correlation was observed between bacterial levels in water and detached algae (Spearmanrsquos RO ρ=0061) E coli levels in detached Cladophora were significantly higher than water concentrations (Mann-Whitney ρlt0001) A statistically significant difference was not observed between beach locations for E coli concentrations in detached Cladophora (Kruskal-Wallis ρ=00046) Station L was significantly different from C and R (Mann-Whitney ρ=00002 and 0038 respectively) Station L was the closest sampling location to a drainage ditch that enters South Linwood Beach This station had the highest concentration of E coli in detached Cladophora (4888 cfug dwt)
Table 317 South Linwood Beach Water Quality Data 2008
ConductanceL C R Mean microScm
062308 1 lt 1 1 1 792 77 21 420070108 1 2 15 6 816 77 22 433070808 1 2 2 1 815 76 23 439071508 2 1 1 1 816 76 23 448072208 1 1 10 4 819 76 24 439072908 35 66 76 59 811 76 24 446080508 1 1 1 1 811 76 24 431081208 1 2 3 2 814 77 24 431
Mean 5 11 14 9 812 76 23 436
E coli in Water Water Chemistry cfu100 ml pH DO (mgl) Temp OC
Date
Table 318 South Linwood Beach Cladophora Data 2008
CladophoraL C R Mean Extent RR LR Total
062308 1412 390 716 839 4 lt01 lt01 lt01070108 2452 60 190 901 4 lt01 lt01 lt01070808 655 784 989 809 4 15 21 4071508 150 76 89 105 2 10 25 3072208 3324 2314 1964 2534 4 13 27 4072908 2353 756 812 1307 4 164 140 30080508 1325 533 834 897 4 170 240 41081208 4888 845 674 2136 4 350 430 78
Mean 2070 720 784 1191 4 12 15 27
Date E coli in Cladophora cfug dwt Microcystins in Cladophora microgg dwt
(Cladophora Extent 0 = None Present 1 = Present in isolated pockets at one location 2 = Present in isolated pockets at all locations 3 = Deposits 1 m2 in area 4= Deposits 1-5 m2 in area 5 = Deposits gt 5 m2 in area)
16
0
1
2
3
4
5
62508 7208 7908 71608 72308 73008 8608 81308
Log
E c
oli
Con
cent
ratio
n Water (cfu100mL)Cladophora cfug dwt
Figure 318 E coli in Detached Cladophora and Water at South Linwood Beach 2008 315 Pinconning Park The sampling locations for Pinconning Park are provided in Figure 319 T hree near-shore locations were sampled at depths of 03-05 m The beach area was sandy and appeared to be groomed Station L contained open water while Stations R and L contained Typha and Scirpus Chara also was present along the lake bottom suggesting groundwater influx Detached Cladophora was found only in isolated areas of the shallow littoral zone and the samples were collected approximately 1 meter from shore The results of water and detached Cladophora analyses are summarized in Tables 319 and 3110 respectively The mean E coli concentration for the study period was 3 cfu100 mL with no single beach sample exceeding 100 cfu100 mL (Table 313) Water temperatures ranged from 21degC to 24degC The mean E coli concentration in detached Cladophora was 299 cfug dwt (Table 314) Microcystins were detected in the detached Cladophora beginning in July with mean concentrations of 07 microgg dwt 3 microgg dwt and 4 microgg dwt for microcystin RR microcystin LR and total microcystins respectively Detached Cladophora was present in isolated pockets at all locations for only 3 of the 8 s ampling periods (Table 3110) E coli concentrations in water and detached Cladophora are displayed in Figure 314 No correlation was observed between bacterial levels in water and detached algae (Spearmanrsquos RO ρ=011) The drop in E coli levels observed on July 15 was after a storm that had occurred on July 12 A statistically significant difference was not observed between beach locations for E coli concentrations in detached Cladophora (Kruskal-Wallis ρ=0073) S tation C had the highest concentration of E coli in detached Cladophora (1454 cfug dwt)
17
Figure 319 Pinconning Park Sampling Locations 2008 (L= Left C=Center R=Right)
Table 319 Pinconning Park Water Quality Data 2008
ConductanceL C R Mean microScm
062308 1 2 1 1 756 77 21 460070108 1 2 1 1 816 76 22 464070808 2 1 3 2 817 77 23 463071508 2 1 3 2 810 76 23 475072208 1 1 1 1 815 77 24 474072908 4 8 9 7 812 76 24 466080508 4 2 lt 1 2 811 76 24 470081208 1 2 9 4 815 77 24 470
Mean 2 2 3 3 806 77 23 468
E coli in Water Water Chemistry cfu100 ml pH DO (mgl) Temp OC
Date
18
Table 3110 Pinconning Park Cladophora Data 2008 (NC=No Cladophora Present NA=Not Analyzed)
Cladophora
L C R Mean Extent RR LR Total062308 NC NC NC NC 0 NA NA NA070108 NC NC NC NC 0 NA NA NA070808 NC NC NC NC 0 NA NA NA071508 NC NC NC NC 0 NA NA NA072208 NC NC NC NC 0 NA NA NA072908 50 64 40 51 2 08 12 2080508 634 1454 188 759 2 09 18 3081208 184 18 56 86 2 07 98 10
Mean 289 512 95 299 1 07 3 4
Date E coli in Cladophora cfug dwt Microcystins in Cladophora microgg dwt
(Cladophora Extent 0 = None Present 1 = Present in isolated pockets at one location 2 = Present in isolated pockets at all locations 3 = Deposits 1 m2 in area 4= Deposits 1-5 m2 in area 5 = Deposits gt 5 m2 in area)
0
1
2
3
4
5
62508 7208 7908 71608 72308 73008 8608 81308
Log
E c
oli
Con
cent
ratio
n Water (cfu100mL)Cladophora cfug dwt
Figure 3110 E coli in Detached Cladophora and Water at Pinconning Park 2008 316 Whitersquos Beach The sampling locations for Whitersquos Beach are provided in Figure 3111 Three near-shore locations were sampled at depths of 03-05 m The beach area was sandy and appeared to be groomed Station L contained open water while Stations R and C contained Scirpus Chara also was present along the lake bottom suggesting groundwater influx Detached Cladophora was only found in isolated areas of the shallow littoral zone and the samples were collected approximately 1 meter from shore The results of water and detached Cladophora analyses are summarized in Tables 3111 and 3112 respectively The mean E coli concentration for the study period was 16 cfu100 mL with no single beach sample exceeding 100 cfu100 mL (Table 3111) Water temperatures
19
Figure 3111 Whitersquos Beach Sampling Locations 2008 (L= Left C=Center R=Right) ranged from 21degC to 24degC Detached Cladophora was present in only one sample and the concentration of E coli in the algae was 130 cfug dwt (Table 3112) Microcystin LR was detected in the detached Cladophora in only one sample in August (13 microgg dwt) Detached Cladophora was present only in the August 5 s ample at Station L (Table 3110) E coli concentrations in water and detached Cladophora are displayed in Figure 3112 No correlation was observed between bacterial levels in water and detached algae (Spearmanrsquos RO ρ=0007)
20
Table 3111 Whitersquos Beach Water Quality Data 2008
ConductanceL C R Mean microScm
062308 3 8 3 5 759 77 21 430070108 4 6 5 5 815 77 22 442070808 3 4 8 5 816 76 23 435071508 2 1 2 2 816 76 23 432072208 22 16 13 17 817 77 24 440072908 4 8 6 6 814 77 24 431080508 41 73 60 58 816 77 24 449081208 32 28 42 34 810 77 24 447
Mean 14 18 17 16 808 77 23 438
E coli in Water Water Chemistry cfu100 ml pH DO (mgl) Temp OC
Date
Table 3112 Whitersquos Beach Cladophora Data 2008 (NC=No Cladophora Present NA=Not
Analyzed)
CladophoraL C R Mean Extent RR LR Total
062308 NC NC NC NC 0 NA NA NA070108 NC NC NC NC 0 NA NA NA070808 NC NC NC NC 0 NA NA NA071508 NC NC NC NC 0 NA NA NA072208 NC NC NC NC 0 NA NA NA072908 NC NC NC NC 0 NA NA NA080508 130 NC NC mdash 1 NA 13 13081208 NC NC NC NC 0 NA NA NA
Mean 130 NC NC mdash 0 NA mdash mdash
Date E coli in Cladophora cfug dwt Microcystins in Cladophora microgg dwt
(Cladophora Extent 0 = None Present 1 = Present in isolated pockets at one location 2 = Present in isolated pockets at all locations 3 = Deposits 1 m2 in area 4= Deposits 1-5 m2 in area 5 = Deposits gt 5 m2 in area)
0
1
2
3
4
5
62508 7208 7908 71608 72308 73008 8608 81308
Water (cfu100mL)Cladophora cfug dwt
Figure 3112 E coli in Detached Cladophora and Water at Whitersquos Beach 2008
Log
E c
oli C
once
ntra
tion
21
317 Arenac County Park The sampling locations for Arenac County Park are provided in Figure 3113 Three near-shore locations were sampled at a depth of 03 m T he beach area was sandy and appeared to be groomed Detached Cladophora was common in the shallow littoral zone and the samples were collected approximately 1 meter from shore
Figure 3113 Arenac County Park Sampling Locations 2008 (L= Left C=Center R=Right)
The results of water and detached Cladophora analyses are summarized in Tables 3113 and 3114 respectively The mean E coli concentration for the study period was 25 cfu100 mL with only one beach sample exceeding 100 c fu100 mL (Station L 111 cfu100 mL Table 313) Water temperatures ranged from 21degC to 25degC The mean E coli concentration in
22
Table 3113 Arenac County Park Water Quality Data 2008
ConductanceL C R Mean microScm
062308 5 2 2 3 813 115 19 310070108 45 31 94 57 817 100 19 300070808 55 42 29 42 820 106 20 284071508 2 1 9 4 815 100 20 296072208 1 3 lt1 1 812 80 21 315072908 111 87 16 71 814 112 21 280080508 3 1 NC 1 811 114 21 292081208 1 2 60 21 817 113 21 296
Mean 28 21 26 25 815 11 20 297
E coli in Water Water Chemistry cfu100 ml pH DO (mgl) Temp OC
Date
Table 3114 Arenac County Park Cladophora Data 2008
CladophoraL C R Mean Extent RR LR Total
062308 1811 1144 2699 1885 4 lt01 lt01 lt01070108 1801 1327 3258 2129 4 3 2 5070808 38 175 290 168 2 1 3 4071508 56 87 84 76 2 4 9 13072208 130 223 433 262 3 3 13 16072908 56 88 53 66 4 9 19 27080508 240 670 810 573 3 28 43 70081208 1300 1670 1890 1620 4 90 158 248
Mean 679 673 1190 847 3 20 35 55
Date E coli in Cladophora cfug dwt Microcystins in Cladophora microgg dwt
(Cladophora Extent 0 = None Present 1 = Present in isolated pockets at one location 2 = Present in isolated pockets at all locations 3 = Deposits 1 m2 in area 4= Deposits 1-5 m2 in area 5 = Deposits gt 5 m2 in area)
detached Cladophora was 847 cfug dwt (Table 3114) M icrocystins were detected in the detached Cladophora beginning in July with mean concentrations of 20 microgg dwt 35 microgg dwt and 55 microgg dwt for microcystin RR microcystin LR and total microcystins respectively Detached Cladophora was present in 1-5 m p ockets at all locations for 6 of the 8 s ampling periods (Table 3114) The beach was groomed for the July 4th holiday and the Cladophora extent decreased to being present in isolated areas for two weeks E coli concentrations in water and detached Cladophora are displayed in Figure 3114 No correlation was observed between bacterial levels in water and detached algae (Spearmanrsquos RO ρ=061) A statistically significant difference was not observed between beach locations for E coli concentrations in detached Cladophora (Kruskal-Wallis ρ=057) S tation R had the highest concentration of E coli in detached Cladophora (3258 cfug dwt)
23
0
1
2
3
4
5
62508 7208 7908 71608 72308 73008 8608 81308
Log
E c
oli
Con
cent
ratio
n Water (cfu100mL)Cladophora cfug dwt
Figure 3114 E coli in Detached Cladophora and Water at Arenac County Park 2008 318 Foster Road Beach The sampling locations for Foster Road Beach are provided in Figure 3115 Three near-shore locations were sampled at a depth of 05 m T he beach area was sandy and appeared to be groomed Detached Cladophora was common in the shallow littoral zone and the samples were collected approximately 1 meter from shore Strong wave action was observed at this location which kept the detached Cladophora suspended in the water column This was the only Saginaw Bay location where suspended Cladophora was observed The results of water and detached Cladophora analyses are summarized in Tables 3115 and 3116 respectively The mean E coli concentration for the study period was 73 cfu100 mL with only one set of beach samples averaging 315 c fu100mL (July 15 Table 3117) This sample was taken after the storm event which occurred on July 12 Water temperatures ranged from 21degC to 25degC The mean E coli concentration in detached Cladophora was 2169 cfug dwt (Table 3116) Microcystins were detected in the detached Cladophora beginning in July with mean concentrations of 36 microgg dwt 41 microgg dwt and 77 microgg dwt for microcystin RR microcystin LR and total microcystins respectively D etached Cladophora was present throughout the water column during the first three weeks not present on July 15 (after the storm) and present only in isolated pockets during the remainder of the sampling period (Table 3116) E coli concentrations in water and detached Cladophora are displayed in Figure 3118 N o correlation was observed between bacterial levels in water and detached algae (Spearmanrsquos RO ρ=078) A statistically significant difference was not observed between beach locations for E coli concentrations in detached Cladophora (Kruskal-Wallis ρ=090) Station L had the highest concentration of E coli in detached Cladophora (7332 cfug dwt)
24
Figure 3115 Foster Road Beach Sampling Locations 2008 (L= Left C=Center R=Right)
Table 3115 Foster Road Beach Water Quality Data 2008
ConductanceL C R Mean microScm
062308 1 2 5 3 792 77 21 376070108 60 21 23 35 818 76 22 382070808 55 140 181 125 815 75 23 442071508 320 400 225 315 815 74 23 436072208 1 2 3 2 812 73 24 447072908 25 31 50 35 820 77 24 436080508 22 21 7 17 814 78 24 447081208 46 51 71 56 811 81 24 450
Mean 66 84 71 73 812 76 23 427
E coli in Water Water Chemistry cfu100 ml pH DO (mgl) Temp OC
Date
25
Table 3116 Foster Road Beach Cladophora Data 2008 (NC=No Cladophora Present NA=Not Analyzed)
Cladophora
L C R Mean Extent RR LR Total062308 1380 2760 1515 1885 5 lt01 lt01 lt01070108 4554 7010 5346 5637 5 lt01 1 1070808 6731 5893 7332 6652 5 12 11 23071508 NC NC NC NC 0 NA NA NA072208 150 230 320 233 2 27 34 61072908 230 156 240 209 2 68 80 148080508 213 270 189 224 2 80 80 161081208 332 380 320 344 2 82 102 184
Mean 1941 2386 2180 2169 3 36 41 77
Date E coli in Cladophora cfug dwt Microcystins in Cladophora microgg dwt
(Cladophora Extent 0 = None Present 1 = Present in isolated pockets at one location 2 = Present in isolated pockets at all locations 3 = Deposits 1 m2 in area 4= Deposits 1-5 m2 in area 5 = Deposits gt 5 m2 in area)
0
1
2
3
4
5
62508 7208 7908 71608 72308 73008 8608 81308
Log
E c
oli
Con
cent
ratio
n Water (cfu100mL)Cladophora cfug dwt
Figure 3116 E coli in Detached Cladophora and Water at Foster Road Beach 2008
32 Grand Traverse Bay and Little Traverse Bay E coli Microcystin and Water Chemistry Results
321 Petoskey State Park The sampling locations for Petoskey State Park are provided in Figure 321 Three near-shore locations were sampled at a depth of 03 m T he beach area was sandy and appeared to be natural Detached Cladophora was present in isolated pockets in the shallow littoral zone and the samples were collected approximately 1 meter from shore
26
Figure 321 Petoskey State Park Sampling Locations 2008 (L= Left C=Center R=Right) The results of water and detached Cladophora analyses are summarized in Tables 321 and 322 respectively The mean E coli concentration for the study period was 13 cfu100 mL with no single beach sample exceeding 100 cfu100 mL (Table 321) Water temperatures ranged from 19degC to 21degC The mean E coli concentration in detached Cladophora was 1117 cfug dwt (Table 322) M icrocystins were not detected in the detached Cladophora Detached Cladophora was present in isolated pockets at all locations for only 2 of the 8 sampling periods (Table 322) E coli concentrations in water and detached Cladophora are displayed in Figure 322 N o correlation was observed between bacterial levels in water and detached algae (Spearmanrsquos RO ρ=059) A statistically significant difference was not observed between beach locations for E coli concentrations in detached Cladophora (Kruskal-Wallis ρ=0058) Station R had the highest concentration of E coli in detached Cladophora (1600 cfug dwt)
27
Table 321 Petoskey State Park Water Quality Data 2008
ConductanceL C R Mean microScm
062308 6 3 2 4 800 105 19 303070108 89 55 73 72 823 109 19 296070808 2 3 3 3 813 110 19 300071508 3 6 6 5 815 105 20 295072208 4 7 5 5 824 104 21 300072908 16 12 5 11 818 108 21 298080508 1 1 1 1 814 104 21 300081208 6 3 1 4 807 107 21 297
Mean 16 11 12 13 814 106 20 299
E coli in Water Water Chemistry cfu100 ml pH DO (mgl) Temp OC
Date
Table 322 Petoskey State Park Cladophora Data 2008 (NC=No Cladophora Present NA=Not Analyzed)
Cladophora
L C R Mean Extent RR LR Total062308 990 1200 1100 1097 2 lt01 lt01 lt01070108 1455 1390 1543 1463 2 lt01 lt01 lt01070808 NC NC 1200 1200 1 lt01 lt01 lt01071508 NC 1423 NC 1423 1 lt01 lt01 lt01072208 NC 556 NC 556 1 lt01 lt01 lt01072908 NC NC 1600 1600 1 lt01 lt01 lt01080508 1200 NC NC 1200 1 lt01 lt01 lt01081208 NC NC 400 400 1 lt01 lt01 lt01
Mean 1215 1142 1169 1117 1 lt01 lt01 lt01
Date E coli in Cladophora cfug dwt Microcystins in Cladophora microgg dwt
(Cladophora Extent 0 = None Present 1 = Present in isolated pockets at one location 2 = Present in isolated pockets at all locations 3 = Deposits 1 m2 in area 4= Deposits 1-5 m2 in area 5 = Deposits gt 5 m2 in area)
0
1
2
3
4
5
62508 7208 7908 71608 72308 73008 8608 81308
Water (cfu100mL)Cladophora cfug dwt
Figure 322 E coli in Detached Cladophora and Water at Petoskey State Park 2008
Log
E c
oli C
once
ntra
tion
28
322 Magnus Park The sampling locations for Magnus Park are provided in Figure 323 The beach area was sandy and appeared to be natural Detached Cladophora was present in isolated pockets in the shallow littoral zone and the samples were collected approximately 1 meter from shore
Figure 323 Magnus Park Sampling Locations 2008 (L= Left C=Center R=Right) The results of water and detached Cladophora analyses are summarized in Tables 323 and 324 respectively The mean E coli concentration for the study period was 17 cfu100 mL with one beach sample exceeding 100 c fu100 mL (120 cfu100 mL Table 323) W ater temperatures ranged from 19degC to 21degC T he mean E coli concentration in detached Cladophora was 1554 cfug dwt (Table 324) Microcystins were not detected in the detached Cladophora Detached Cladophora was present in isolated pockets at one location for 4 of the 8 sampling periods (Table 324) E coli concentrations in water and detached Cladophora are displayed in Figure 324 N o correlation was observed between bacterial levels in water and detached algae (Spearmanrsquos RO ρ=059) A statistically significant difference was not observed between beach locations for E coli concentrations in detached Cladophora (Kruskal-Wallis ρ=0054) Station R had the highest concentration of E coli in detached Cladophora (2368 cfug dwt)
29
Table 323 Magnus Park Water Quality Data 2008
ConductanceL C R Mean microScm
062308 5 3 2 3 803 108 19 295070108 2 3 2 2 813 105 19 297070808 77 120 76 91 817 110 19 305071508 1 3 6 3 804 106 20 301072208 6 3 2 4 813 110 21 299072908 9 3 11 8 821 108 21 295080508 4 16 15 12 824 110 21 297081208 18 10 15 14 810 102 21 300
Mean 15 20 16 17 813 107 20 299
E coli in Water Water Chemistry cfu100 ml pH DO (mgl) Temp OC
Date
Table 324 Magnus Park Cladophora Data 2008 (NC=No Cladophora Present NA=Not
Analyzed)
CladophoraL C R Mean Extent RR LR Total
062308 2368 NC 3321 2845 1 lt01 lt01 lt01070108 NC NC NC NC 0 NC NC NC070808 NC NC 1200 1200 1 lt01 lt01 lt01071508 NC NC NC NC 0 NC NC NC072208 NC NC NC NC 0 NC NC NC072908 NC NC 1300 1300 1 lt01 lt01 lt01080508 NC NC NC NC 0 NC NC NC081208 NC NC 870 870 1 lt01 lt01 lt01
Mean 2368 NC 1673 1554 1 lt01 lt01 lt01
Date E coli in Cladophora cfug dwt Microcystins in Cladophora microgg dwt
(Cladophora Extent 0 = None Present 1 = Present in isolated pockets at one location 2 = Present in isolated pockets at all locations 3 = Deposits 1 m2 in area 4= Deposits 1-5 m2 in area 5 = Deposits gt 5 m2 in area)
0
1
2
3
4
5
62508 7208 7908 71608 72308 73008 8608 81308
Water (cfu100mL)Cladophora cfug dwt
Figure 324 E coli in Detached Cladophora and Water at Magnus Park 2008
Log
E c
oli C
once
ntra
tion
30
323 Elk Rapids Park The sampling locations for Elk Rapids Park are provided in Figure 325 The beach area was sandy and appeared to be natural Detached Cladophora was present in isolated pockets in the shallow littoral zone and the samples were collected approximately 1 meter from shore
Figure 325 Elk Rapids Park Sampling Locations 2008 (L= Left C=Center R=Right)
The results of water and detached Cladophora analyses are summarized in Tables 325 and 326 respectively The mean E coli concentration for the study period was 74 cfu100 mL with two sets of beach samples exceeding 100 c fu100 mL (134 cfu100 mL and 292 c fu100 mL Table 325) Water temperatures ranged from 19degC to 21degC The mean E coli concentration in detached Cladophora was 1225 cfug dwt (Table 326) Microcystins were not detected in the detached Cladophora Detached Cladophora was present in isolated pockets at more than one location for 6 of the 8 sampling periods (Table 316) E coli concentrations in water and detached Cladophora are displayed in Figure 314 N o correlation was observed between bacterial levels in water and detached algae (Spearmanrsquos RO ρ=018) A statistically significant difference was observed between beach locations for E coli concentrations in detached Cladophora (Kruskal-Wallis ρ=0030) Station R was significantly different from C and L (Mann-Whitney ρ=0005 and 0003 respectively) Station R was the closest sampling location
31
Table 325 Elk Rapids Park Water Quality Data 2008
ConductanceL C R Mean microScm
062308 155 390 330 292 827 100 19 297070108 23 16 54 31 814 109 19 301070808 44 13 27 28 811 108 19 297071508 22 56 70 49 813 109 20 301072208 57 25 22 35 812 101 21 275072908 90 145 166 134 805 109 21 297080508 4 1 21 9 801 107 21 281081208 25 19 7 17 810 102 21 302
Mean 53 83 87 74 812 11 20 294
E coli in Water Water Chemistry cfu100 ml pH DO (mgl) Temp OC
Date
Table 326 Elk Rapids Park Cladophora Data 2008 (NC=No Cladophora Present NA=Not Analyzed)
Cladophora
L C R Mean Extent RR LR Total062308 724 4111 6900 3912 2 lt01 lt01 lt01070108 322 858 3754 1645 2 lt01 lt01 lt01070808 NC NC 770 770 1 lt01 lt01 lt01071508 NC NC 840 840 1 lt01 lt01 lt01072208 569 670 440 560 2 lt01 lt01 lt01072908 430 1100 1600 1043 2 lt01 lt01 lt01080508 500 700 344 515 2 lt01 lt01 lt01081208 330 448 780 519 2 lt01 lt01 lt01
Mean 479 1314 1928 1225 2 lt01 lt01 lt01
Date E coli in Cladophora cfug dwt Microcystins in Cladophora microgg dwt
(Cladophora Extent 0 = None Present 1 = Present in isolated pockets at one location 2 = Present in isolated pockets at all locations 3 = Deposits 1 m2 in area 4= Deposits 1-5 m2 in area 5 = Deposits gt 5 m2 in area)
0
1
2
3
4
5
62508 7208 7908 71608 72308 73008 8608 81308
Water (cfu100mL)Cladophora cfug dwt
Figure 326 E coli in Detached Cladophora and Water at the Elk Rapids Park 2008
Log
E c
oli C
once
ntra
tion
32
location to the creek which drains a duck pond ne ar the city S tation R had the highest concentration of E coli in detached Cladophora (6900 cfug dwt) 324 Antrim County Day Park The sampling locations for Antrim County Day Park are provided in Figure 327 Three near-shore locations were sampled at a depth of 03 m The beach area was sandy and appeared to be natural Detached Cladophora was common in the shallow littoral zone and the samples were collected approximately 1 meter from shore
Figure 327 Antrim County Day Park Sampling Locations 2008 (L= Left C=Center R=Right)
The results of water and detached Cladophora analyses are summarized in Tables 327 and 328 respectively The mean E coli concentration for the study period was 25 cfu100 mL with one beach sample exceeding 100 c fu100 mL (111 cfu100 mL Table 327) W ater
33
temperatures ranged from 19degC to 21degC T he mean E coli concentration in detached Cladophora was 350 cfug dwt (Table 328) Microcystins were not detected in the detached Cladophora Detached Cladophora was either absent or present in isolated pockets at one location for 7 of the 8 sampling periods and at 2 l ocations during 1 sampling period (Table 318) E coli concentrations in water and detached Cladophora are displayed in Figure 328 No correlation was observed between bacterial levels in water and detached algae (Spearmanrsquos RO ρ=068) A statistically significant difference was not observed between beach locations for E coli concentrations in detached Cladophora (Kruskal-Wallis ρ=027) S tation R had the highest concentration of E coli in detached Cladophora (660 cfug dwt)
Table 327 Antrim County Day Park Water Quality Data 2008
ConductanceL C R Mean microScm
062308 5 2 2 3 813 115 19 310070108 45 31 94 57 817 100 19 300070808 55 42 29 42 820 106 20 284071508 2 1 9 4 815 100 20 296072208 1 3 lt1 1 812 80 21 315072908 111 87 16 71 814 112 21 280080508 3 1 NC 1 811 114 21 292081208 1 2 60 21 817 113 21 296
Mean 28 21 26 25 815 11 20 297
E coli in Water Water Chemistry cfu100 ml pH DO (mgl) Temp OC
Date
Table 328 Antrim County Day Park Cladophora Data 2008 (NC=No Cladophora Present NA=Not Analyzed)
Cladophora
L C R Mean Extent RR LR Total062308 79 61 660 267 2 lt01 lt01 lt01070108 NC NC NC NC 0 NA NA NA070808 NC NC NC NC 0 NA NA NA071508 NC NC NC NC 0 NA NA NA072208 NC NC 440 440 1 NA lt01 NA072908 NC NC NC NC 0 NA NA NA080508 NC NC 344 344 1 NA lt01 NA081208 NC NC NC NC 0 NA NA NA
Mean mdash mdash 481 350 1 mdash lt01 mdash
Date E coli in Cladophora cfug dwt Microcystins in Cladophora microgg dwt
(Cladophora Extent 0 = None Present 1 = Present in isolated pockets at one location 2 = Present in isolated pockets at all locations 3 = Deposits 1 m2 in area 4= Deposits 1-5 m2 in area 5 = Deposits gt 5 m2 in area)
34
0
1
2
3
4
5
62508 7208 7908 71608 72308 73008 8608 81308
Water (cfu100mL)Cladophora cfug dwt
Figure 328 E coli in Detached Cladophora and Water at the Antrim County Day Park 2008
325 East Bay Park The sampling locations for East Bay Park are provided in Figure 329 Three near-shore locations were sampled at depths of 03-05 m The beach area was sandy and appeared to be natural S tation L contained open water while Stations R and C contained Scirpus Detached Cladophora was found at all of the shallow littoral zone locations and the samples were collected approximately 1 meter from shore The results of water and detached Cladophora analyses are summarized in Tables 329 and 3210 respectively The mean E coli concentration for the study period was 25 cfu100 mL with one sample exceeding 100 cfu100 mL (103 cfu100 mL Table 329) Water temperatures ranged from 19degC to 21degC The mean E coli concentration in detached Cladophora was 969 cfug dwt (Table 3210) M icrocystins were not detected in the detached Cladophora Detached Cladophora was present in isolated pockets at more than one location for all of the 8 sampling periods (Table 3210) E coli concentrations in water and detached Cladophora are displayed in Figure 3210 No correlation was observed between bacterial levels in water and detached algae (Spearmanrsquos RO ρ=012) A statistically significant difference was not observed between beach locations for E coli concentrations in detached Cladophora (Kruskal-Wallis ρ=041) Station L had the highest E coli concentration in detached Cladophora (5000 cfug dwt) Station L was the closest sampling location to a storm-water outlet entering Grand Traverse Bay
Log
E c
oli C
once
ntra
tion
35
Figure 329 East Bay Park Sampling Locations 2008 (L= Left C=Center R=Right)
Table 329 East Bay Park Water Quality Data 2008
ConductanceL C R Mean microScm
062308 2 1 3 2 821 106 19 299070108 5 3 NC 3 821 104 19 300070808 4 7 14 8 807 105 19 320071508 17 41 21 26 807 103 20 310072208 41 91 103 78 804 101 21 330072908 51 92 61 68 819 102 21 324080508 8 4 11 8 805 103 21 309081208 7 2 1 8 809 108 21 317
Mean 17 30 27 25 812 10 20 314
E coli in Water Water Chemistry cfu100 ml pH DO (mgl) Temp OC
Date
36
Table 3210 East Bay Park Cladophora Data 2008 (NC=No Cladophora Present NA=Not Analyzed)
Cladophora
L C R Mean Extent RR LR Total062308 5000 2000 1000 2667 3 lt01 lt01 lt01070108 3300 1500 900 1900 3 lt01 lt01 lt01070808 660 500 460 540 3 lt01 lt01 lt01071508 546 600 NC 573 2 lt01 lt01 lt01072208 340 500 600 480 3 lt01 lt01 lt01072908 700 630 NC 665 2 lt01 lt01 lt01080508 935 500 700 712 3 lt01 lt01 lt01081208 325 330 NC 218 2 lt01 lt01 lt01
Mean 1476 820 732 969 3 lt01 lt01 lt01
Date E coli in Cladophora cfug dwt Microcystins in Cladophora microgg dwt
(Cladophora Extent 0 = None Present 1 = Present in isolated pockets at one location 2 = Present in isolated pockets at all locations 3 = Deposits 1 m2 in area 4= Deposits 1-5 m2 in area 5 = Deposits gt 5 m2 in area)
0
1
2
3
4
5
62508 7208 7908 71608 72308 73008 8608 81308
Log
E c
oli C
once
ntra
tion
Water (cfu100mL)Cladophora cfug dwt
Figure 3210 E coli in Detached Cladophora and Water at East Bay Park 2008 326 Traverse City State Park The sampling locations for Traverse City State Park are provided in Figure 3211 Three near-shore locations were sampled at a depth of 03 m The beach area was sandy and appeared to be natural Detached Cladophora was present in isolated pockets in the shallow littoral zone near Mitchell Creek and the samples were collected approximately 1 meter from shore
37
Figure 3211 Traverse City State Park Sampling Locations 2008 (L= Left C=Center R=Right)
The results of water and detached Cladophora analyses are summarized in Tables 3211 and 3212 respectively The mean E coli concentration for the study period was 33 cfu100 mL with one sample exceeding 100 cfu100 mL (195 cfu100 mL Table 3211) W ater temperatures ranged from 19degC to 21degC Station L was the only location at this beach with detached Cladophora and the associated E coli concentrations averaged 1630 cfug dwt The highest concentration E coli in detached Cladophora was 3300 cfug dwt This station was the closest sampling location to Mitchell Creek which has a history of bacterial contamination problems (The Watershed Center 2006) Microcystins were not detected in the detached Cladophora Detached Cladophora was present in isolated pockets at one location for all of the 8 sampling periods (Table 3212) E coli concentrations in water and detached Cladophora are displayed in Figure 3212 No correlation was observed between bacterial levels in water and detached algae (Spearmanrsquos RO ρ=015) A statistically significant difference was observed between beach locations for E coli concentrations in detached Cladophora (Kruskal-Wallis ρ=0001)
38
Table 3211 Traverse City State Park Water Quality Data 2008
ConductanceL C R Mean microScm
062308 1 4 NC 2 816 107 19 301070108 3 5 10 6 815 101 19 305070808 195 37 66 99 815 105 19 296071508 22 48 63 44 820 104 20 297072208 95 88 57 80 801 108 21 299072908 19 10 5 11 802 102 21 300080508 18 14 11 14 825 108 21 294081208 8 6 5 6 805 106 21 294
Mean 45 27 31 33 812 105 20 298
DateE coli in Water Water Chemistry
cfu100 ml pH DO (mgl) Temp OC
Table 3212 Traverse City State Park Cladophora Data 2008 (NC=No Cladophora Present NA=Not Analyzed)
Cladophora
L C R Mean Extent RR LR Total062308 2000 NC NC mdash 1 lt01 lt01 lt01070108 3300 NC NC mdash 1 lt01 lt01 lt01070808 900 NC NC mdash 1 lt01 lt01 lt01071508 750 NC NC mdash 1 lt01 lt01 lt01072208 1200 NC NC mdash 1 lt01 lt01 lt01072908 700 NC NC mdash 1 lt01 lt01 lt01080508 990 NC NC mdash 1 lt01 lt01 lt01081208 3200 NC NC mdash 1 lt01 lt01 lt01
Mean 1630 NC NC mdash 1 lt01 lt01 lt01
Date E coli in Cladophora cfug dwt Microcystins in Cladophora microgg dwt
(Cladophora Extent 0 = None Present 1 = Present in isolated pockets at one location 2 = Present in isolated pockets at all locations 3 = Deposits 1 m2 in area 4= Deposits 1-5 m2 in area 5 = Deposits gt 5 m2 in area)
0
1
2
3
4
5
62508 7208 7908 71608 72308 73008 8608 81308
Water (cfu100mL)Cladophora cfug dwt
Figure 3212 E coli in Detached Cladophora and Water at Traverse City State Park 2008
Log
E c
oli C
once
ntra
tion
39
327 Bryant Park The sampling locations for Bryant Park are provided in Figure 3213 T hree near-shore locations were sampled at a depth of 03 m T he beach area was sandy and appeared to be natural Detached Cladophora was common in the shallow littoral zone and the samples were collected approximately 1 meter from shore
Figure 3213 Bryant Park Sampling Locations 2008 (L= Left C=Center R=Right)
40
The results of water and detached Cladophora analyses are summarized in Tables 3213 and 3214 respectively The mean E coli concentration for the study period was 46 cfu100 mL with one set of samples exceeding 100 cfu100 mL (281 cfu100 mL Table 3213) W ater temperatures ranged from 19degC to 21degC T he mean E coli concentration in detached Cladophora was 1873 cfug dwt (Table 3214) Microcystins were not detected in the detached Cladophora Detached Cladophora was present in isolated pockets at one location for all of the 8 sampling periods (Table 3214) E coli concentrations in water and detached Cladophora are displayed in Figure 3214 No correlation was observed between bacterial levels in water and detached algae (Spearmanrsquos RO ρ=082) A statistically significant difference was not observed between beach locations for E coli concentrations in detached Cladophora (Kruskal-Wallis ρ=048) Station C had the highest concentration of E coli in detached Cladophora (9460 cfug dwt)
Table 3213 Bryant Park Water Quality Data 2008
ConductanceL C R Mean microScm
062308 3 4 11 6 825 105 19 296070108 6 8 5 6 800 102 19 301070808 290 310 243 281 824 100 19 300071508 8 9 4 7 819 106 20 298072208 6 8 3 6 813 103 21 300072908 11 13 22 15 811 104 21 297080508 12 18 15 15 815 107 21 317081208 33 29 1 28 805 101 21 299
Mean 46 50 38 46 814 103 20 301
E coli in Water Water Chemistry cfu100 ml pH DO (mgl) Temp OC
Date
Table 3214 Bryant Park Cladophora Data 2008 (NC=No Cladophora Present NA=Not Analyzed)
Cladophora
L C R Mean Extent RR LR Total062308 980 9460 680 3707 2 lt01 lt01 lt01070108 977 7690 490 3052 2 lt01 lt01 lt01070808 3443 1462 2741 2549 2 lt01 lt01 lt01071508 1300 1800 1567 1556 2 lt01 lt01 lt01072208 990 832 751 858 2 lt01 lt01 lt01072908 111 1643 1565 1106 2 lt01 lt01 lt01080508 1245 890 1443 1193 2 lt01 lt01 lt01081208 1122 844 922 963 2 lt01 lt01 lt01
Mean 1271 3078 1270 1873 2 lt01 lt01 lt01
Date E coli in Cladophora cfug dwt Microcystins in Cladophora microgg dwt
(Cladophora Extent 0 = None Present 1 = Present in isolated pockets at one location 2 = Present in isolated pockets at all locations 3 = Deposits 1 m2 in area 4= Deposits 1-5 m2 in area 5 = Deposits gt 5 m2 in area)
41
0
1
2
3
4
5
62508 7208 7908 71608 72308 73008 8608 81308
Water (cfu100mL)Cladophora cfug dwt
Figure 3214 E coli in Detached Cladophora and Water at Bryant Park 2008 328 Clinch Park The sampling locations for Clinch Park are provided in Figure 3215 T hree near-shore locations were sampled at a depth of 03 m T he beach area was sandy and appeared to be natural Detached Cladophora was present at one location during the last sampling event The sample was collected approximately 05 m from shore The results of water and detached Cladophora analyses are summarized in Tables 3215 and 3216 respectively The mean E coli concentration for the study period was 35 cfu100 mL with one set of samples exceeding 100 cfu100 mL (164 cfu100 mL Table 3215) W ater temperatures ranged from 19degC to 21degC D etached Cladophora was present in an isolated pocket at one location during the August 12 sampling event (Table 3216) E coli was present in detached Cladophora in this sample at a concentration of 680 c fug dwt (Table 3216) Microcystins were not detected in the detached Cladophora E coli concentrations in water and detached Cladophora are displayed in Figure 3216 N o correlation was observed between bacterial levels in water and detached algae (Spearmanrsquos RO ρ=099)
Log
E c
oli C
once
ntra
tion
42
Figure 3215 Clinch Park Sampling Locations 2008 (L= Left C=Center R=Right)
Table 3215 Clinch Park Water Quality Data 2008
ConductanceL C R Mean microScm
062308 22 14 11 16 828 105 19 296070108 1 3 NC 1 801 109 19 300070808 33 19 30 27 805 101 19 310071508 21 18 32 24 816 107 20 302072208 155 170 167 164 802 103 21 302072908 43 21 37 34 801 104 21 307080508 11 7 18 12 830 102 21 299081208 4 2 1 3 822 104 21 298
Mean 36 32 37 35 813 104 20 302
E coli in Water Water Chemistry cfu100 ml pH DO (mgl) Temp OC
Date
43
Table 3216 Clinch Park Cladophora Data 2008 (NC=No Cladophora Present NA=Not Analyzed)
Cladophora
L C R Mean Extent RR LR Total062308 NC NC NC NC 0 lt01 lt01 lt01070108 NC NC NC NC 0 lt01 lt01 lt01070808 NC NC NC NC 0 lt01 lt01 lt01071508 NC NC NC NC 0 lt01 lt01 lt01072208 NC NC NC NC 0 lt01 lt01 lt01072908 NC NC NC NC 0 lt01 lt01 lt01080508 NC NC NC NC 0 lt01 lt01 lt01081208 NC NC 680 680 1 lt01 lt01 lt01
Mean NC NC 680 680 0 lt01 lt01 lt01
Date E coli in Cladophora cfug dwt Microcystins in Cladophora microgg dwt
(Cladophora Extent 0 = None Present 1 = Present in isolated pockets at one location 2 = Present in isolated pockets at all locations 3 = Deposits 1 m2 in area 4= Deposits 1-5 m2 in area 5 = Deposits gt 5 m2 in area)
0
1
2
3
4
5
62508 7208 7908 71608 72308 73008 8608 81308
Water (cfu100mL)Cladophora cfug dwt
Figure 3216 E coli in Detached Cladophora and Water at Clinch Park 2008 329 West End Beach The sampling locations for West End Beach are provided in Figure 3217 T hree near-shore locations were sampled at a depth of 03 m T he beach area was sandy and appeared to be natural Detached Cladophora was common in the shallow littoral zone and the samples were collected approximately 1 meter from shore This beach appeared to be used by pet owners as dogs were frequently present during sampling
Log
E c
oli C
once
ntra
tion
44
Figure 3217 West End Beach Sampling Locations 2008 (L= Left C=Center R=Right)
The results of water and detached Cladophora analyses are summarized in Tables 3217 and 3218 respectively The mean E coli concentration for the study period was 35 cfu100 mL with no samples exceeding 100 c fu100 mL (Table 3217) W ater temperatures ranged from 19degC to 21degC T he mean E coli concentration in detached Cladophora was 2976 cfug dwt (Table 3218) M icrocystins were not detected in the detached Cladophora Detached Cladophora was present in isolated pockets at all locations for 4 of the 8 sampling periods (Table 3218) E coli concentrations in water and detached Cladophora are displayed in Figure 3218 N o correlation was observed between bacterial levels in water and detached algae (Spearmanrsquos RO ρ=028) A statistically significant difference was not observed between beach locations for E coli concentrations in detached Cladophora (Kruskal-Wallis ρ=079) Station C was higher than the other stations with respect to mean E coli concentrations in detached Cladophora (3078 cfug dwt) The highest concentration of E coli in detached Cladophora measured during the study period in Grand Traverse Bay was at West End Beach (22874 cfug dwt at Station C) Dogs frequently were present on this beach at the time of sampling which may be the source of the high bacteria concentrations
45
Table 3217 West End Beach Water Quality Data 2008
ConductanceL C R Mean microScm
062308 5 3 4 4 821 103 19 302070108 3 1 2 2 829 110 19 297070808 34 55 48 46 807 100 19 303071508 46 33 25 35 803 108 20 301072208 66 86 126 93 804 105 21 297072908 6 14 5 8 825 106 21 294080508 100 94 49 81 827 107 21 306081208 22 10 1 14 827 107 21 297
Mean 35 37 33 35 818 106 20 300
E coli in Water Water Chemistry cfu100 ml pH DO (mgl) Temp OC
Date
Table 3218 West End Beach Cladophora Data 2008 (NC=No Cladophora Present NA=Not Analyzed)
Cladophora
L C R Mean Extent RR LR Total062308 1509 76 289 625 2 lt01 lt01 lt01070108 1721 22874 13337 12644 2 lt01 lt01 lt01070808 1016 NC NC 1016 1 lt01 lt01 lt01071508 NC NC 1644 1644 1 lt01 lt01 lt01072208 NC NC NC NC 0 NA NA NA072908 NC NC NC NC 0 NA NA NA080508 1300 1233 1567 1367 2 lt01 lt01 lt01081208 678 444 567 563 2 lt01 lt01 lt01
Mean 1245 6157 3481 2976 1 lt01 lt01 lt01
Date E coli in Cladophora cfug dwt Microcystins in Cladophora microgg dwt
(Cladophora Extent 0 = None Present 1 = Present in isolated pockets at one location 2 = Present in isolated pockets at all locations 3 = Deposits 1 m2 in area 4= Deposits 1-5 m2 in area 5 = Deposits gt 5 m2 in area)
0
1
2
3
4
5
62508 7208 7908 71608 72308 73008 8608 81308
Water (cfu100mL)Cladophora cfug dwt
Figure 3218 E coli in Detached Cladophora and Water at West End Beach 2008
Log
E c
oli C
once
ntra
tion
46
33 Saginaw Bay and Grand Traverse BayLittle Traverse Bay Comparisons
A summary of the project data is presented in Table 331 Mean temperatures for Saginaw Bay were higher than in Grand Traverse BayLittle Traverse Bay (23degC and 20degC respectively) Microcystins in detached Cladophora were absent in Grand Traverse BayLittle Traverse Bay In Saginaw Bay the grand mean of all locations with detached Cladophora was 57 microgg dwt for the study period M ean concentrations of E coli in water were significantly higher (Mann-Whitney ρ=0003) in Grand Traverse BayLittle Traverse Bay (34 cfu100 mL) than in Saginaw Bay (18 cfu100 mL) In contrast mean E coli concentrations in detached Cladophora were higher in Saginaw Bay (2796 cfug dwt) than Grand Traverse BayLittle Traverse Bay (1775 cfug dwt) however the difference was not statistically significant (Mann-Whitney ρ=040) The mean Cladophora extent score for Grand Traverse BayLittle Traverse Bay was 1 indicating that detached algae were found in small pockets T he mean Cladophora extent score for Saginaw Bay was 3 indicating that detached algae were found in 1 m2 deposits
Table 331 Summary of Water Quality and Cladophora Data for Grand Traverse BayLittle Traverse Bay and Saginaw Bay 2008
Parameter Saginaw Bay Grand TraverseLittle Traverse Bay
Mean Temperature 23degC 20degC Mean Total Microcystins 57 microgg dwt lt01 microgg dwt Cladophora Extent Score 3 1 Mean E coli in Water 18 cfu100 mL 34 cfu100 mL Mean E coli in Cladophora 2796 cfug dwt 1775 cfug dwt
(Cladophora Extent 0 = None Present 1 = Present in isolated pockets at one location 2 = Present in isolated pockets at all locations 3 = Deposits 1 m2 in area 4= Deposits 1-5 m2 in area 5 = Deposits gt 5 m2 in area)
40 Discussion The presence of Cladophora has been associated with high levels of E coli and species of potentially pathogenic enteric bacteria in beach sand and swimming waters of the Great Lakes (Whitman et al 2003 Ishii et al 2006 Olapade et al 2006) Enteric bacteria can grow within detached Cladophora under certain conditions (Byappanahalli et al 2005) In addition detached Cladophora deposits can potentially harbor and enhance the survival of pathogenic bacteria released into the environment through point and non-point sources (Byappanahalli et al 2005) Recently Clostridium was found to grow in detached Cladophora in the Great Lakes (Byappanahalli and Whitman 2009) Algal species including Cladophora have been reported to provide nutrients and to protect attached bacteria from environmental stresses desiccation predation and harmful UV radiation (Byappanahalli et al 2005) In this manner Cladophora mats may play a significant role as a source and sink for pathogens in the near-shore environment Based on the results from this investigation Saginaw Bay appears to be more heavily impacted by detached Cladophora than Grand Traverse BayLittle Traverse Bay Eutrophication of lakes has been associated with increases in Cladophora mat production and accumulation (Stevenson et al 2006 Herbst 1969) but water transparency also has been suggested as an important causative factor (Barbiero et al 2006 Bootsma 2007) Elevated levels of nutrients in Saginaw Bay have been reported to stimulate blooms of cyanobacteria in Saginaw Bay and also influence the near-shore environment (Fahnenstiel et al 2008 Millie et al
47
2008) Differences in Cladophora accumulation between the Lake Huron and Lake Michigan sites may be attributed to higher total phosphorus levels (18 microgl vs 5 microgl MDNRE 2006) Levels of E coli in detached Cladophora in both systems were similar to concentrations previously reported in the Great Lakes (3 log10 - 5 log10 Engelbert et al 2008) In Saginaw Bay the highest levels of E coli in detached Cladophora were consistently found at locations near the Saginaw River (Wenona Beach and the Bay City Recreation Area) E ven within individual sites locations near tributaries and drains at Wenona Beach and South Linwood Beach were significantly higher than locations farther away form a point source This relationship also was noted in Grand Traverse Bay where the location near Mitchell Creek at the Traverse City State Park had elevated E coli concentrations in detached Cladophora compared to the other two beach stations At Traverse City State Park Cladophora deposits were present only at the location near Mitchell Creek These results suggest that Cladophora can trap bacteria from point sources and also be stimulated by nutrient discharges Two locations Pinconning Park and Whitersquos Beach had very limited Cladophora growth Both locations had Chara growing on the lake bottom Chara is known to exhibit allelopathic activity that can limit the growth of other aquatic plants (Berger and Schagerl 2004) No correlation was found between E coli levels in the open water (designated beach monitoring locations) and the near-shore zone where the detached Cladophora samples were taken As noted in previous studies Cladophora appears to hold trapped E coli and not release the entrained bacteria into the offshore water (Byappanahalli et al 2003 Engelbert et al 2008) This investigation was the first to document the accumulation of microcystins in the detached Cladophora of Saginaw Bay S aginaw Bay has a history of Microcystis blooms in the late summer months that produce both microcystin LR and RR (Fahnenstiel et al 2008 Millie et al 2008) S ince Microcystis has a high requirement for sunlight cyanobacteria may become stressed when they become trapped in the detached algae deposits Stress has been implicated in initiating cyanotoxin production (Codd 1995) While accidental ingestion by humans of microcystins trapped in Cladophora is unlikely these compounds can act as skin irritants (Bell and Codd 1994) W alking through Cladophora accumulations to get to deeper water may provide sufficient exposure to cause irritation in sensitive individuals if microcystins are present While all of the data suggest that swimming areas (1 m depth) are not impacted by E coli accumulations in detached Cladophora entrained bacteria and cyanotoxins may pose a hazard to children playing in the near-shore water and beach sand While current regulations discourage beach grooming the presence of elevated bacteria and microcystin levels in the near-shore environment of Saginaw Bay suggests that the current policy should balance potential impacts to public health with the ecosystem services provided by coastal wetlands 50 Conclusions An assessment of the ability of Cladophora mats to sequester E coli and microcystin LR and RR was conducted in near-shore waters of Grand Traverse Bay (7 sites) Little Traverse Bay (2 sites) and Saginaw Bay (8 sites) The sampling locations were at public beach access points where Cladophora mats previously have been observed The goals of this research were to determine the spatial and temporal variability of E coli populations in Cladophora mats in these
48
recreational waters and if cyanotoxins (microcystin LR and RR) were sequestered in the detached algae T he collection of Cladophora samples was coordinated with local beach monitoring programs to facilitate the comparison with ambient water bacteria concentrations This project provided important data for the assessment of public health impacts and the development of beach management programs to address the problems associated with Cladophora accumulations Based on the results from this investigation Saginaw Bay appears to be more heavily impacted by detached Cladophora than Grand Traverse BayLittle Traverse Bay Mean E coli concentrations in detached Cladophora were higher in Saginaw Bay (2796 cfug dwt) than Grand Traverse BayLittle Traverse Bay (1775cfug dwt) however the difference was not statistically significant (Mann-Whitney ρ=040) The mean Cladophora extent score for Grand Traverse BayLittle Traverse Bay was 1 indicating that detached alga was consistently found in small pockets at a single location The mean Cladophora extent score for Saginaw Bay was 3 indicating that detached alga was found in 1 m2 deposits at all locations D ifferences in Cladophora accumulation between Saginaw Bay and Grand Traverse BayLittle Traverse Bay may be attributed to higher total phosphorus levels in Saginaw Bay Levels of E coli in detached Cladophora in both systems were similar to concentrations previously reported in the Great Lakes (1000 cfug dwt ndash 60000 cfug dwt) In Saginaw Bay the highest levels of E coli in detached Cladophora were consistently found at locations near the Saginaw River (Wenona Beach and the Bay City Recreation Area) Even within individual sites locations near tributaries and drains at Wenona Beach and South Linwood Beach were significantly higher than locations farther away form a point source This relationship also was noted in Grand Traverse Bay where the location near Mitchell Creek at the Traverse City State Park had elevated E coli concentrations in detached Cladophora compared to the other two beach stations where no detached algae was found These results suggest that Cladophora can trap bacteria from point sources and also be stimulated by nutrient discharges T wo locations Pinconning Park and Whitersquos Beach had very limited Cladophora growth Both locations had Chara growing on the lake bottom Chara is known to exhibit allelopathic activity that can limit the growth of other aquatic plants N o correlation was found between E coli levels in the open water (designated beach monitoring locations) and the near-shore zone where the detached Cladophora samples were taken As noted in previous studies Cladophora appears to hold trapped E coli and does not release the entrained bacteria into the offshore water This investigation was the first to document the accumulation of microcystins in the detached Cladophora of Saginaw Bay Total microcystins in detached Cladophora had a grand mean of 57 microgg dwt for the study period Saginaw Bay has a history of Microcystis blooms in the late summer months that produce both microcystin LR and RR S ince Microcystis has a h igh requirement for sunlight cyanobacteria may become stressed when they become trapped in the detached algae mats W hile accidental ingestion by humans of microcystins trapped in Cladophora is unlikely these compounds can act as skin irritants Walking through Cladophora accumulations to get to deeper water may provide sufficient exposure to cause irritation in sensitive individuals if microcystins are present While all of the data suggest that swimming areas (1 m depth) are not impacted by E coli accumulations in detached Cladophora entrained bacteria and cyanotoxins may pose a hazard to children playing in the near-shore water and beach sand Current regulations discourage beach grooming and altering the near-shore zone The presence of elevated bacteria and microcystin levels in the near-shore environment of
49
Saginaw Bay suggest that the current policy should be reevaluated to balance potential impacts to public health with the ecosystem services provided by coastal wetlands 60 References APHA (American Public Health Association) 1998 Standard Methods for the Evaluation of
Water and Wastewater 20th edition APHA Washington DC Barbiero RP MC Tuchman and ES Millard 2006 Post-dreissenid increases in transparency
during summer stratification in the offshore waters of Lake Ontario Is a reduction in whiting events the cause J Great Lakes Res 32131ndash141
Bartsch A F 1968 Eutrophication is beginning in Lake Michigan 1968 Water Waste Eng 5
84-87 Bell SG and Codd G A 1994 Cyanobacterial toxins and human health Rev Med Microbiol
5256ndash264 Berger J and Schagerl M 2004 Allelopathic activity of Characeae Biologia 599ndash15 Bootsma HA EB Young and JA Berges (eds) 2005 Cladophora research and
management in the Great Lakes Proceedings of workshop December 2004 Special Report No 2005-01 UWM Great Lakes WATER Institute
Boyer G M C Watzin A D Shambaugh M F Satchwell B R Rosen and T Mihuc 2004
The occurrence of cyanobacterial toxins in Lake Champlain In Lake Champlain partnerships and Research in the New Millennium (Proceedings of the Lake Champlain Research Consortium May 20th 2002 Saint-Jean-sur-Richelieu Quebec T Manley Ed p 241-257
Byappanahalli M N D A Shively M B Nevers M J Sadowsky and R L Whitman 2003
Growth and survival of Escherichia coli and enterococci populations in the macro-alga Cladophora (Chlorophyta) FEMS Microbiol Ecol 46203-211
Byappanahalli M N and R L Whitman 2009 Clostridium botulinum type E occurs and grows
in the alga Cladophora glomerata Can J Fish Aquat Sci 66 879ndash882 Codd GA 1995 Cyanobacterial toxins occurrence properties and biological significance
Water Sci Technol 32 149^156 Dodds W K and D A Gudder 1992 The ecology of Cladophora J Phycol 28415-427 Englebert ET McDermott C and GT Kleinheinz 2008 Effects of the nuisance algae
Cladophora on Escherichia coli at recreational beaches in Wisconsin The Science of the Total Environment 404(1)10-17
50
Fahnenstiel G L Millie D F Dyble J Litaker R W Tester P A McCormick M J Rediske R and D Klarer 2008 Microcystin concentrations and cell quotas in Saginaw Bay Lake Huron Aquatic Ecosystems Health and Management 11(2)190 ndash 195
Graham L E 1982 Cytology ultrastructure taxonomy and phylogenetic relationships of Great
Lakes filamentous algae J Great Lakes Res 854-60 Hecky R E R E H Smith D R Barton S J Guildford W D Taylor M N Charlton and
T Howell 2004 The nearshore phosphorus shunt a consequence of ecosystem engineering by dreissenids in the Laurentia Great Lakes Can J Fish Aquat Sci 611285-1293
Herbst RP 1969 Ecological factors and the distribution of Cladophora glomerata in the Great
Lakes Am Midl Nat 8290ndash98 Higgins S N E T Howell R E Hecky S J Guildford and REH Smith 2005 The wall of
green The status of Cladophora glomerata on the northern shores of Lake Eries eastern basin 1995-2002 J Gt Lakes Res 31 547-563
Hydrolab 1998 DataSonde 4a Userrsquos Manual Hydrolab Corporation Austin TX Ishii S T Yan DA Shively MN Byappanahalli RL Whitman and MJ Sadowsky 2006
Cladophora (Chlorophyta) spp harbor human bacterial pathogens in nearshore water of Lake Michigan Appl Environ Microbiol 72 (7)4545ndash4553
Joska A M and J J Bolton 1996 Filamentous freshwater macroalgae in South Africa ndash a
literature review and perspective on the development and control of weed problems Hydrobiologia 340 295-300
Keilty T and Woller M 2004 Final Report prepared for the USEPA-GLNPO by the Leelanau
Watershed Council Leelanau Conservancy L a n d s b e r g J H 2 0 0 2 T h e e f f e c t s o f h a r m f u l
a l g a l b l o o m s o n a q u a t i c o r g a n i s m s R e v F i s h S c i 1 0 1 1 3 ndash 3 9 0
Lawrence JF Niedzwiadek B Menard C Lau BP-Y Kuiper-Goodman T Carbone S
Holmes C 2001 Comparison of HPLC-mass spectrometry ELISA and phosphatase assay for the determination of microcystins in blue-green algae products J AOAC Int 841035-1044
MDNRE 2006 Water Quality Monitoring of Saginaw and Grand Traverse Bays Michigan
Department of Natural Resources and Environment Lansing MI MIDEQWB-06096 Millie D G Fahnenstiel J Dyble R Litaker P Tester M McCormick R Rediske and D
Klarer 2008 Influence of environmental conditions on summer cyanobacterial abundance in Saginaw Bay Lake Huron Aquatic Ecosystems Health and Management 11(2)196ndash205
51
Mills E L J M Casselman R Dermott J D Fitzsimons G Gal K T Holeck J A Hoyle OE Johannsson B F Lantry J C Makarewicz E S Millard I F Munawar M Munawar R OGorman R W Owens L G Rudstam T Schaner and T J Stewart 2003 Lake Ontario Food web dynamics in a changing ecosystem (1970-2000) Can J Fish Aquat Sci 60 471ndash490
Neil J H and M B Jackson 1982 Monitoring Cladophora growth conditions and the effect of
phosphorus additions at a shoreline site in northeastern Lake Erie J Great Lakes Res 830-34
Olapade O A M M Depas E T Jensen and S L McLellan 2006 Microbial communities
and fecal indicator bacteria associated with Cladophora mats on beach sites along Lake Michigan shores Appl Environ Microbiol 721932-1938
Painter D S and G Kamaitis 1987 Reduction of Cladophora biomass and tissue phosphorus
in Lake Ontario 1972-1983 Can J Fish Aquat Sci 44 2212-2215 Stevenson RJ ST Rier CM Riseng RE Shultz and MJ Wiley 2006 Comparing effects
of nutrients on algal blooms in streams in two regions with different disturbance regimes and with application for developing nutrient criteria Hydrobiologia 561149ndash165
Taft C E 1975 History of Cladophora in the Great Lakes In H Shear and D E Konasewich
[eds] Cladophora in the Great Lakes International Joint Commission The Watershed Center 2006 Tributary Monitoring Data The Watershed Center Traverse City
MI Vanderploeg HA Liebig JR Carmichael WW Agy MA Johengen TH Fahnenstiel GL
amp Nalepa TF 2001 Zebra mussel (Dreissena polymorpha) selective filtration promoted toxic Microcystis blooms in Saginaw Bay (Lake Huron) and Lake Erie Can J Fish Aquat Sci 58 1208ndash1221
Whitman R L D A Shively H Pawlik M B Nevers and M N Byappanahalli 2003
Occurrence of Escherichia coli and enterococci in Cladophora (Chlorophyta) in nearshore water and beach sand of Lake Michigan Appl Environ Microbiol 694714-4719
Wilson K A E T Howell and D A Jackson 2006 Replacement of Zebra Mussels by
Quagga Mussels in the Canadian nearshore of Lake Ontario Distribution and correlations with substrate Round Goby abundance and upwelling frequency J Gt Lakes Res 3211-28
Zhu B D G Fitzgerald C M Mayer L G Rudstam and E L Mills 2006 Alteration of
ecosystem function by Zebra Mussels in Oneida Lake Impacts on submerged macrophytes Ecosystems 9 1017-1028
- Assessment of E coli and Microcystins in Cladophora Mats in the Nearshore Waters of Grand Traverse Bay Little Traverse Bay and Saginaw Bay
- May 2010
- TABLE OF CONTENTS
- LIST OF TABLES
- LIST OF FIGURES
- Acknowledgements
- Executive Summary
- 10 Introduction
- 20 Methods
-
- 21 Sampling methods
-
- 211 Sampling Design
- 212 Sampling Methods
-
- 22 Analytical Methods
-
- 221 Hydrolab Methods
- 222 E coli Analysis
- 223 Sample Preparation for Microcystin Analysis
- 244 Microcystin LR and RR by LCMS
-
- 30 Results
-
- 31 Saginaw Bay E coli Microcystin and Water Chemistry Results
-
- 311 Wenona Beach
- 312 Bay City Recreation Area
- 313 Brissette Beach
- 314 South Linwood Beach
- 315 Pinconning Park
- 316 Whitersquos Beach
- 317 Arenac County Park
- 318 Foster Road Beach
-
- 32 Grand Traverse Bay and Little Traverse Bay E coli Microcystin and Water Chemistry Results
-
- 321 Petoskey State Park
- 322 Magnus Park
- 323 Elk Rapids Park
- 324 Antrim County Day Park
- 325 East Bay Park
- 326 Traverse City State Park
- 327 Bryant Park
- 328 Clinch Park
- 329 West End Beach
-
- 33 Saginaw Bay and Grand Traverse BayLittle Traverse Bay Comparisons
-
- 40 Discussion
- 50 Conclusions
- 60 References
-

1
10 Introduction Cladophora is a filamentous green alga that commonly grows attached to hard substrates in the littoral zone of freshwater environments and is widely distributed throughout the Laurentian Great Lakes (Graham 1982 Dodds and Gudder 1992) This macroalga is considered a public nuisance causing shoreline fouling and clogging of water intake pipes (Joska and Bolton 1996) When mats of Cladophora detach and wash onshore their subsequent decay is associated with notoriously foul odors (Higgins et al 2005 Wilson et al 2006) nearshore oxygen depletion (Whitman et al 2003) and elevated bacterial loads (Byappanahalli 2003) In the Laurentian Great Lakes Cladophora is a nuisance throughout Lakes Ontario Erie Huron and Michigan where hard substrates are available (Higgins et al 2005) P ublic concern over detached and decaying Cladophora along beaches in the lower Great Lakes began as early as the 1950s-1960s and peaked in the 1970s (Bartsch 1968 Taft 1975) Shoreline fouling by decaying macroalgae was a significant factor for limiting nutrient loading to the Great Lakes as identified in the amended Great Lakes Water Quality Agreement (GLWQA) of 1978 Subsequent phosphorus management programs led to a decrease in Cladophora biomass in the early 1980s (Painter and Kamaitis 1987) Beginning in the late 1990s the dominance of invasive dreissenid mussels (ie the zebra mussel Dreissena polymorpha and the quagga mussel D bugensis) in the Laurentian Great Lakes has reengineered nutrient distributions by removing suspended particulate matter through filter feeding and generating heavier particulate matter as feces and pseudofeces in the benthos (Hecky et al 2004) This process has been implicated in shifting pools of organic matter and nutrients from the pelagic zone to the benthos and increasing the solar radiant flux to the benthos (Zhu et al 2006) Since the invasion of dreissenids Cladophora biomass has dramatically increased in the lower Great Lakes (Mills et al 2003 Bootsma et al 2005 Hecky et al 2004) The occurrence of Cladophora in near-shore Lake Michigan habitats may have significant public health and ecological importance (Whitman et al 2003) and could potentially lead to a decrease in recreational activities on beaches The presence of Cladophora has been associated with high levels of E coli and other species of enteric bacteria in the beach sand and swimming waters of the Great Lakes (Whitman et al 2003 Olapade et al 2006) These bacteria may even grow on Cladophora under certain conditions (Byappanahalli et al 2003) and the alga can potentially harbor and enhance the survival of pathogenic bacteria released into the environment through point and non-point sources Cladophora has been reported to provide nutrients and protect attached bacteria from environmental stresses such as desiccation predation and harmful radiation (Byappanahalli et al 2003 Englebert et al 2008) Ishii et al (2006) found several enteric bacterial pathogens including Campylobacter shiga toxin-producing E coli (STEC) Shigella and Salmonella from Cladophora at a southern Lake Michigan beach In addition to pathogens sulfate-reducing bacteria and other phylogenetically diverse groups of microorganisms also have been detected in Cladophora mats (Olapade et al 2006) Recently Clostridium botulinum and Clostridium perfringens were found to grow in Cladophora mats (Byappanahalli and Whitman 2009) In this manner Cladophora mats may play a significant role as a source and sink for pathogens in the near-shore environment C oncerns related to Cladophora mats and their ability to sequester pathogens have been raised in Michigan as part of watershed plans for Grand Traverse Bay Little Traverse Bay and Saginaw Bay In addition the Saginaw Bay Area of Concern has Beach Closings listed as a Beneficial Use Impairment due to elevated E coli levels
2
Although the public health and ecological importance of microbial communities associated with Cladophora mats in freshwater environments have been previously studied their role in sequestering potentially toxic cyanobacteria is poorly understood Nuisance blooms of Microcystis have been reported in Saginaw Bay (Vanderploeg et al 2001 Fahnensteil et al 2008) and several of the large inland lakes near Grand Traverse Bay (Keilty and Woller 2004) Since cyanobacteria blooms also can accumulate on beaches and cause fouling of the shoreline (Codd 1995 L a n d s b e r g 2 0 0 2 ) the presence of cyanotoxins in detached Cladophora mats should be investigated We conducted an assessment of the ability of Cladophora mats to sequester E coli and microcystin LR and RR in the near-shore waters of Grand Traverse Bay (7 sites) Little Traverse Bay (2 sites) and Saginaw Bay (8 sites) The sampling locations were at public beach access points where Cladophora mats have been previously observed The goals of this research were to determine the spatial and temporal variability of E coli populations in Cladophora mats in these recreational waters and if cyanotoxins (microcystin LR and RR) are sequestered in the detached algae The collection of Cladophora samples was coordinated with local beach monitoring programs to facilitate the comparison with ambient water bacteria concentrations This project provided important data for the assessment of public health impacts and the development of beach management programs to address the problems associated with Cladophora accumulations
20 Methods
21 Sampling methods
211 Sampling Design
Eight locations in Saginaw Bay seven locations in Grand Traverse Bay and two locations in Little Traverse Bay were sampled in triplicate for E coli and microcystin LR and RR during the summer of 2008 T he locations were sampled weekly for 8 weeks in June-August Gr ab samples of floating Cladophora mats were collected at each location and analyzed individually for E coli and as a composite for microcystin LR and RR Sampling dates and times were coordinated with local beach monitoring programs to facilitate the use of ambient water bacteria concentrations collected close to the time of Cladophora sampling Cladophora was collected and prepared as described by Whitman et al (2003) The use of standardized collection protocols and triplicate samples provided a high level of quality assurance and resulted in data that were appropriate for decision making and environmental assessment
212 Sampling Methods Triplicate Cladophora samples were collected at each site with an integrated collection device at 025-05 m depth (Sutherland et al 1992) The sampling locations for Grand Traverse BayLittle Traverse Bay and Saginaw Bay are shown in Figures 1 and 2 respectively Each location was marked with GPS coordinates and sampled at weekly intervals during June - August 2008 (8
3
sampling events) E coli samples were placed in sterile whirl pack bags and stored in the dark at 4ordmC A composite of the triplicate samples was placed in an amber glass jar and stored at 4ordmC for microcystin-LR and RR analysis A ll samples were returned to the laboratory and on a daily basis for further processing and storage E coli samples were analyzed within 6 hour s of collection Microcystin ndashLR and RR samples were lyophilized and stored at -30ordmC Chemical and physical parameters were monitored at each location using a Hydrolab DataSonde 4a We measured pH dissolved oxygen (DO) DO saturation temperature and specific conductance at each station
Figure 21 Grand Traverse BayLittle Traverse Bay Sampling Locations
4
Figure 22 Saginaw Bay Sampling Locations The extent of Cladophora accumulation was determined at each sampling location according to the ranking
bull 0 = No visible Cladophora bull 1 = Cladophora present in isolated pockets at one location bull 2 = Cladophora present in isolated pockets at all locations bull 3 = Cladophora residue 1 m2 in area bull 4 = Cladophora residue 1-5 m2 in area bull 5 = Cladophora gt 5 m2 in area
5
22 Analytical Methods
Laboratory procedures have been selected based on previous use for water quality investigations established ranges for accuracyprecision and limited problems related to matrix interferences A summary of analytical methods is given in Table 21 Method summaries are provided in the following sections 221 Hydrolab Methods Hydrolab measurements of pH temperature dissolved oxygen and specific conductance were conducted according to the methods in the instrument users manual (Hydrolab 1998) T he Hydrolab Datasonde 4a was calibrated in the lab prior to use in the field The instrument was placed in the water at each site and the technician waited for a s table reading of the sensors Measurements were recorded at 05 m depth at each station P recision was assessed by the measurement of field duplicates at 10 of the stations
Table 21 Laboratory Analytical Methods
222 E coli Analysis Samples of E coli were prepared by elutriation with phosphate buffer (Whitman et al 2003) One gram portions of homogenized algal samples were weighed and placed in sterile 15- milliliter (mL) centrifuge tubes Nine mL of sterile phosphate-buffered diluent water (pH 68) was added and the mixture was vigorously shaken for 2 min and then centrifuged briefly (45 s) at 2000 rpm to allow the large particles to settle The diluted sample then was analyzed by the Colilert-18 (IDEXX) using the Quanti-Tray 2000 (APHA 1998) A 1 mL aliquot was removed from the centrifuge tube and transferred to 99 mL of sterile phosphate buffer in a sterile water sampling vial The Colilert reagent then was then added to the vial and shaken until dissolved The sample and reagents were then added to the Quanti-Tray 2000 and sealed with the Quanti-Tray sealer T he tray was incubated for 18 ho urs at 35degC plusmn 05degC and read under UV light Fluorescent colonies were counted and the number of colony forming units (cfu)100 mL was calculated according to the manufacturerrsquos instructions
Parameter Preparation Preservation Holding Time Methods Reference
pH Hydrolab 1998 Dissolved Oxygen Hydrolab 1998
Temperature Hydrolab 1998 Specific conductance Hydrolab 1998
Microcystin LR and RR by LCMS
Filtration methanol extraction C-18
cartridge Freeze -30degC 6 mo Lawerence et al 2001
Boyer et al 2004
E coli Phosphate buffer extraction Cool 4degC 6 hrs
Whitman et al 2003 Colilert-18
APHA 1998
6
223 Sample Preparation for Microcystin Analysis
Water samples for the analyses of microcystin were prepared according to methods outlined by Lawerence et al (2001) A 100-500 mL aliquot was filtered through a Whatman GFC glass fiber filter The filter then was placed in a 5 mL centrifuge tube and lyophilized for 8 hours The filter residue was extracted with three successive aliquots of methanol followed by sonication The methanol extract was evaporated to dryness under nitrogen and re-dissolved in 1 mL of 50 methanol in water This mixture was passed through a 1 gram (g) SPE C-18 cartridge (Baker) that had been preconditioned with 10 mL of methanol followed by 10 mL of water The cartridge then was washed with 5 mL of 25 methanol in water and the eluted fraction was discarded The microcystins then were eluted with 4 mL of 100 methanol in water This fraction was collected and the volume reduced to 2 mL The volume was adjusted back to 3 mL with methanol and split into three 1 mL aliquots for HPLCMS analysis
244 Microcystin LR and RR by LCMS Samples for Liquid ChromatographyMass Spectrometry (LCMS) analysis were filtered using Gelman AE binderless glass fiber filters The cells were lysed by freezing and then vortexed for 5 minutes in centrifuge tubes containing 10 mL of aqueous (5050) methanol to extract toxins Suspensions were centrifuged and the supernatant was filtered through 045 micron nylon filters The concentrations of microcystin LR and RR were determined by liquid chromatography-tandem mass spectrometry using a Finnigan Surveyor MSQ LCMS Nodularin was added to the extracts and used as an internal standard Compounds were separated on a Phenomenex Luna C18 column at 50oC The mobile phase was a binary gradient of water and methanol both containing 01 formic acid T he initial gradient started with 95 water and 5 methanol followed by a step change to 50 water and 50 methanol at 3 minutes with a linear gradient from 5 t o 20 m inutes to 5 water and 95 methanol Instrument detection limits for these toxins were determined to be 1 microgramliter (microgl) For calibration a series of 5 solutions were prepared with the internal standard at 1000 microgl and the analytes in the range of 1 to 500 microgl in final volumes of 1 mL of 9010 watermethanol 30 Results The results of E coli water chemistry and microcystins data from each location are presented for Saginaw Bay and Grand Traverse BayLittle Traverse Bay in Sections 31 and 32 respectively A comparison of the two basins is provided in Section 33
31 Saginaw Bay E coli Microcystin and Water Chemistry Results
311 Wenona Beach The sampling locations for Wenona Beach are provided in Figure 311 Near-shore locations were sampled at a depth of 03 m The beach area was covered with reed canary grass sedges and cattails Cattails and detached Cladophora were common in the shallow littoral zone and the samples were collected approximately 1 meter outside of the macrophyte zone The detached
7
Cladophora also was common at the sampling locations with some areas of fresh Cladophora growing on submerged rocks and woody debris
Figure 311 Wenona Beach Sampling Locations 2008 (L= Left C=Center R=Right) The results of water and detached Cladophora analyses are summarized in Tables 311 and 312 respectively The mean E coli concentration for the study period was 14 cfu100 mL with no single beach samples exceeding 100 cfu100 mL (Table 311) Water temperatures ranged from 21degC to 25degC The mean E coli concentration for detached Cladophora was 9775 cfug dwt (Table 312) Microcystins were detected in the detached Cladophora beginning in July with mean concentrations of 47 microgg dwt 47 microgg dwt and 103 microgg dwt for microcystin RR microcystin LR and total microcystins respectively Detached Cladophora was present in
8
Table 311 Wenona Beach Water Quality Data 2008
ConductanceL C R Mean microScm
062308 10 8 18 12 792 77 21 440070108 78 44 82 68 810 78 22 470070808 3 4 2 3 814 74 23 451071508 2 1 1 1 817 75 24 450072208 5 6 1 4 816 73 24 456072908 33 8 7 16 810 72 25 453080508 4 7 4 5 813 76 24 461081208 4 2 3 3 811 79 24 467
Mean 17 10 15 14 81 76 23 456
cfu100 mlDateE coli in Water Water Chemistry
pH DO (mgl) Temp OC
Table 312 Wenona Beach Cladophora Data 2008
CladophoraL C R Mean Extent RR LR Total
062308 448 733 22507 7896 5 lt 01 lt 01 lt 01070108 800 2331 25432 9521 5 lt 01 1 lt 01070808 1279 3561 31566 12135 5 12 11 23071508 610 500 1678 929 3 15 23 38072208 1892 2000 3578 2490 5 27 34 61072908 5631 5633 64132 25132 5 68 80 148080508 6322 4531 25346 12066 5 80 80 161081208 3313 2311 18462 8029 5 82 102 184
Mean 2537 2700 24088 9775 5 47 47 103
Microcystins in Cladophora microgg dwtDate E coli in Cladophora cfug dwt
(Cladophora Extent 0 = None Present 1 = Present in isolated pockets at one location 2 = Present in isolated pockets at all locations 3 = Deposits 1 m2 in area 4= Deposits 1-5 m2 in area 5 = Deposits gt 5 m2 in area)
deposits of gt5 m2 at all locations during the sampling period (Table 312) E coli concentrations in water and detached Cladophora are displayed in Figure 312 No correlation was observed between bacterial levels in water and detached algae (Spearmanrsquos RO ρ=014) The drop in E coli levels observed on July 15 was after a storm that had occurred on July 12 A statistically significant difference was observed between beach locations for E coli concentrations in detached Cladophora (Kruskal-Wallis ρ=00004) Station R was significantly different from C and L (Mann-Whitney ρ=0012 and 0010 respectively) S tation R was the closest sampling location to the Saginaw River Station R had the highest concentration of E coli in detached Cladophora (64132 cfug dwt) This bacterial concentration was the highest level observed during the study period
9
0
1
2
3
4
5
62508 7208 7908 71608 72308 73008 8608 81308
Log
E c
oli
Con
cent
ratio
n
Water (cfu100mL)Cladophora cfug dwt
Figure 312 E coli in Detached Cladophora and Water at Wenona Beach 2008 312 Bay City Recreation Area The sampling locations for the Bay City Recreation Area are provided in Figure 313 Three near-shore locations were sampled at a depth of 03 m The beach area was sandy and appeared to be groomed Detached Cladophora was common in the shallow littoral zone and the samples were collected approximately 1 meter from shore The results of water and detached Cladophora analyses are summarized in Tables 313 and 314 respectively The mean E coli concentration for the study period was 6 cfu100 mL with no single beach sample exceeding 100 cfu100 mL (Table 313) Water temperatures ranged from 21degC to 24degC The mean E coli concentration in detached Cladophora was 3216 cfug dwt (Table 314) Microcystins were detected in the detached Cladophora beginning in June with mean concentrations of 96 microgg dwt 129 microgg dwt and 225 microgg dwt for microcystin RR microcystin LR and total microcystins respectively The highest concentrations of microcystins were found on August 12 at the Bay City Recreation area (microcystin RR 364 microgg dwt microcystin LR 349 microgg dwt and total microcystins 714 microgg dwt) Detached Cladophora covered the entire beach for all but one of the sampling events E coli concentrations in water and detached Cladophora are displayed in Figure 314 No correlation was observed between bacterial levels in the water and the detached algae (Spearmanrsquos RO ρ=008) The drop in E coli levels observed on July 15 was after a storm that had occurred on July 12 A statistically significant difference was not observed between beach locations for E coli concentrations in detached Cladophora (Kruskal-Wallis ρ=00073) Station R had the highest concentration of E coli in detached Cladophora (8923 cfug dwt)
10
Figure 313 Bay City Recreation Area Sampling Locations 2008 (L= Left C=Center R=Right)
Table 313 Bay City Recreation Area Water Quality Data 2008
ConductanceL C R Mean microScm
062308 10 8 24 14 792 77 21 420070108 1 2 6 3 811 78 22 437070808 3 4 47 18 816 75 23 445071508 2 1 1 1 816 74 23 436072208 1 1 1 1 816 73 24 436072908 4 8 1 4 812 77 24 446080508 4 7 4 5 817 78 24 448081208 1 2 1 1 811 81 24 449
Mean 3 4 11 6 811 77 23 440
E coli in Water Water Chemistry cfu100 ml pH DO (mgl) Temp OC
Date
11
Table 314 Bay City Recreation Area Cladophora Data 2008
CladophoraL C R Mean Extent RR LR Total
062308 1432 856 3456 1915 5 1 1 2070108 1333 963 2564 1620 5 2 7 9070808 4222 4563 8923 5903 5 14 33 47071508 1100 1245 1344 1230 3 32 49 81072208 1632 2000 7843 3825 5 65 99 164072908 998 5633 8564 5065 5 56 219 275080508 2331 4531 3564 3475 5 231 275 505081208 3223 2311 2564 2699 5 364 349 714
Mean 2034 2763 4853 3216 5 96 129 225
Date E coli in Cladophora cfug dwt Microcystins in Cladophora microgg dwt
(Cladophora Extent 0 = None Present 1 = Present in isolated pockets at one location 2 = Present in isolated pockets at all locations 3 = Deposits 1 m2 in area 4= Deposits 1-5 m2 in area 5 = Deposits gt 5 m2 in area)
0
1
2
3
4
5
62508 7208 7908 71608 72308 73008 8608 81308
Log
E c
oli
Con
cent
ratio
n
Water (cfu100mL)Cladophora cfug dwt
Figure 314 E coli in Detached Cladophora and Water at the Bay City Recreation Area 2008
313 Brissette Beach The sampling locations for Brissette Beach are provided in Figure 315 T hree near-shore locations were sampled at a depth of 03 m T he beach area was sandy and appeared to be groomed Detached Cladophora was common in the shallow littoral zone and the samples were collected approximately 1-2 m from shore
12
Figure 315 Brissette Beach Sampling Locations 2008 (L= Left C=Center R=Right)
The results of water and detached Cladophora analyses are summarized in Tables 315 and 316 respectively The mean E coli concentration for the study period was 7 cfu100 mL with no single beach sample exceeding 100 cfu100 mL (Table 315) Water temperatures ranged from 21degC to 24degC The mean E coli concentration in detached Cladophora was 768 cfug dwt (Table 316) Microcystins were detected in the detached Cladophora beginning in June with mean concentrations of 9 microgg dwt 15 microgg dwt and 23 microgg dwt for microcystin RR microcystin LR and total microcystins respectively Detached Cladophora was present in deposits of 1-5 m2 at all locations during the sampling period except after the storm event on July 12 (Table 316) E coli concentrations in the water and detached Cladophora are displayed in Figure 316 No correlation was observed between bacterial levels in water and detached algae (Spearmanrsquos RO ρ=083) A statistically significant difference was not observed between beach locations for E coli concentrations in detached Cladophora (Kruskal-Wallis ρ=0053) Station R had the highest concentration of E coli in detached Cladophora (1848 cfug dwt)
13
Table 315 Brissette Beach Water Quality Data 2008
ConductanceL C R Mean microScm
062308 3 2 1 2 789 77 21 400070108 15 22 35 24 812 78 22 440070808 1 1 1 1 819 75 23 433071508 2 1 3 2 812 74 23 434072208 1 1 7 3 812 73 24 444072908 16 37 16 23 818 77 24 439080508 1 2 1 1 819 78 24 445081208 1 2 6 3 813 81 24 447
Mean 5 9 9 7 812 77 23 435
E coli in Water Water Chemistry cfu100 ml pH DO (mgl) Temp OC
Date
Table 316 Brissette Beach Cladophora Data 2008
CladophoraL C R Mean Extent RR LR Total
062308 618 1045 1848 1170 4 05 07 1070108 450 533 460 481 4 01 07 1070808 655 784 989 809 4 23 37 6071508 411 333 450 398 2 09 77 9072208 644 755 877 759 4 35 131 17072908 755 766 864 795 4 18 142 16080508 644 532 436 537 4 213 285 50081208 1033 1200 1344 1192 4 388 494 88
Mean 651 744 908 768 4 9 15 23
Date E coli in Cladophora cfug dwt Microcystins in Cladophora microgg dwt
(Cladophora Extent 0 = None Present 1 = Present in isolated pockets at one location 2 = Present in isolated pockets at all locations 3 = Deposits 1 m2 in area 4= Deposits 1-5 m2 in area 5 = Deposits gt 5 m2 in area)
0
1
2
3
4
5
62508 7208 7908 71608 72308 73008 8608 81308
Log
E c
oli
Conc
entra
tion Water (cfu100mL)
Cladophora cfug dwt
Figure 316 E coli in Detached Cladophora and Water at Brissette Beach 2008
14
314 South Linwood Beach The sampling locations for South Linwood Beach are provided in Figure 317 Three near-shore locations were sampled at a depth of 03 m T he beach area was sandy and appeared to be groomed Detached Cladophora was common in the shallow littoral zone and the samples were collected approximately 1-2 m from shore
Figure 317 South Linwood Beach Sampling Locations 2008 (L= Left C=Center R=Right)
15
The results of water and detached Cladophora analyses are summarized in Tables 317 and 318 respectively The mean E coli concentration for the study period was 9 cfu100 mL with no single beach sample exceeding 100 cfu100 mL (Table 317) Water temperatures ranged from 21degC to 24degC The mean E coli concentration in detached Cladophora was 1191 cfug dwt (Table 318) Microcystins were detected in the detached Cladophora beginning in July with mean concentrations of 12 microgg dwt 15 microgg dwt and 27 micro gg dwt for microcystin RR microcystin LR and total microcystins respectively D etached Cladophora was present in deposits of 1-5 m2 at all locations during the sampling period except after the storm event on July 12 (Table 318) E coli concentrations in water and detached Cladophora are displayed in Figure 318 No correlation was observed between bacterial levels in water and detached algae (Spearmanrsquos RO ρ=0061) E coli levels in detached Cladophora were significantly higher than water concentrations (Mann-Whitney ρlt0001) A statistically significant difference was not observed between beach locations for E coli concentrations in detached Cladophora (Kruskal-Wallis ρ=00046) Station L was significantly different from C and R (Mann-Whitney ρ=00002 and 0038 respectively) Station L was the closest sampling location to a drainage ditch that enters South Linwood Beach This station had the highest concentration of E coli in detached Cladophora (4888 cfug dwt)
Table 317 South Linwood Beach Water Quality Data 2008
ConductanceL C R Mean microScm
062308 1 lt 1 1 1 792 77 21 420070108 1 2 15 6 816 77 22 433070808 1 2 2 1 815 76 23 439071508 2 1 1 1 816 76 23 448072208 1 1 10 4 819 76 24 439072908 35 66 76 59 811 76 24 446080508 1 1 1 1 811 76 24 431081208 1 2 3 2 814 77 24 431
Mean 5 11 14 9 812 76 23 436
E coli in Water Water Chemistry cfu100 ml pH DO (mgl) Temp OC
Date
Table 318 South Linwood Beach Cladophora Data 2008
CladophoraL C R Mean Extent RR LR Total
062308 1412 390 716 839 4 lt01 lt01 lt01070108 2452 60 190 901 4 lt01 lt01 lt01070808 655 784 989 809 4 15 21 4071508 150 76 89 105 2 10 25 3072208 3324 2314 1964 2534 4 13 27 4072908 2353 756 812 1307 4 164 140 30080508 1325 533 834 897 4 170 240 41081208 4888 845 674 2136 4 350 430 78
Mean 2070 720 784 1191 4 12 15 27
Date E coli in Cladophora cfug dwt Microcystins in Cladophora microgg dwt
(Cladophora Extent 0 = None Present 1 = Present in isolated pockets at one location 2 = Present in isolated pockets at all locations 3 = Deposits 1 m2 in area 4= Deposits 1-5 m2 in area 5 = Deposits gt 5 m2 in area)
16
0
1
2
3
4
5
62508 7208 7908 71608 72308 73008 8608 81308
Log
E c
oli
Con
cent
ratio
n Water (cfu100mL)Cladophora cfug dwt
Figure 318 E coli in Detached Cladophora and Water at South Linwood Beach 2008 315 Pinconning Park The sampling locations for Pinconning Park are provided in Figure 319 T hree near-shore locations were sampled at depths of 03-05 m The beach area was sandy and appeared to be groomed Station L contained open water while Stations R and L contained Typha and Scirpus Chara also was present along the lake bottom suggesting groundwater influx Detached Cladophora was found only in isolated areas of the shallow littoral zone and the samples were collected approximately 1 meter from shore The results of water and detached Cladophora analyses are summarized in Tables 319 and 3110 respectively The mean E coli concentration for the study period was 3 cfu100 mL with no single beach sample exceeding 100 cfu100 mL (Table 313) Water temperatures ranged from 21degC to 24degC The mean E coli concentration in detached Cladophora was 299 cfug dwt (Table 314) Microcystins were detected in the detached Cladophora beginning in July with mean concentrations of 07 microgg dwt 3 microgg dwt and 4 microgg dwt for microcystin RR microcystin LR and total microcystins respectively Detached Cladophora was present in isolated pockets at all locations for only 3 of the 8 s ampling periods (Table 3110) E coli concentrations in water and detached Cladophora are displayed in Figure 314 No correlation was observed between bacterial levels in water and detached algae (Spearmanrsquos RO ρ=011) The drop in E coli levels observed on July 15 was after a storm that had occurred on July 12 A statistically significant difference was not observed between beach locations for E coli concentrations in detached Cladophora (Kruskal-Wallis ρ=0073) S tation C had the highest concentration of E coli in detached Cladophora (1454 cfug dwt)
17
Figure 319 Pinconning Park Sampling Locations 2008 (L= Left C=Center R=Right)
Table 319 Pinconning Park Water Quality Data 2008
ConductanceL C R Mean microScm
062308 1 2 1 1 756 77 21 460070108 1 2 1 1 816 76 22 464070808 2 1 3 2 817 77 23 463071508 2 1 3 2 810 76 23 475072208 1 1 1 1 815 77 24 474072908 4 8 9 7 812 76 24 466080508 4 2 lt 1 2 811 76 24 470081208 1 2 9 4 815 77 24 470
Mean 2 2 3 3 806 77 23 468
E coli in Water Water Chemistry cfu100 ml pH DO (mgl) Temp OC
Date
18
Table 3110 Pinconning Park Cladophora Data 2008 (NC=No Cladophora Present NA=Not Analyzed)
Cladophora
L C R Mean Extent RR LR Total062308 NC NC NC NC 0 NA NA NA070108 NC NC NC NC 0 NA NA NA070808 NC NC NC NC 0 NA NA NA071508 NC NC NC NC 0 NA NA NA072208 NC NC NC NC 0 NA NA NA072908 50 64 40 51 2 08 12 2080508 634 1454 188 759 2 09 18 3081208 184 18 56 86 2 07 98 10
Mean 289 512 95 299 1 07 3 4
Date E coli in Cladophora cfug dwt Microcystins in Cladophora microgg dwt
(Cladophora Extent 0 = None Present 1 = Present in isolated pockets at one location 2 = Present in isolated pockets at all locations 3 = Deposits 1 m2 in area 4= Deposits 1-5 m2 in area 5 = Deposits gt 5 m2 in area)
0
1
2
3
4
5
62508 7208 7908 71608 72308 73008 8608 81308
Log
E c
oli
Con
cent
ratio
n Water (cfu100mL)Cladophora cfug dwt
Figure 3110 E coli in Detached Cladophora and Water at Pinconning Park 2008 316 Whitersquos Beach The sampling locations for Whitersquos Beach are provided in Figure 3111 Three near-shore locations were sampled at depths of 03-05 m The beach area was sandy and appeared to be groomed Station L contained open water while Stations R and C contained Scirpus Chara also was present along the lake bottom suggesting groundwater influx Detached Cladophora was only found in isolated areas of the shallow littoral zone and the samples were collected approximately 1 meter from shore The results of water and detached Cladophora analyses are summarized in Tables 3111 and 3112 respectively The mean E coli concentration for the study period was 16 cfu100 mL with no single beach sample exceeding 100 cfu100 mL (Table 3111) Water temperatures
19
Figure 3111 Whitersquos Beach Sampling Locations 2008 (L= Left C=Center R=Right) ranged from 21degC to 24degC Detached Cladophora was present in only one sample and the concentration of E coli in the algae was 130 cfug dwt (Table 3112) Microcystin LR was detected in the detached Cladophora in only one sample in August (13 microgg dwt) Detached Cladophora was present only in the August 5 s ample at Station L (Table 3110) E coli concentrations in water and detached Cladophora are displayed in Figure 3112 No correlation was observed between bacterial levels in water and detached algae (Spearmanrsquos RO ρ=0007)
20
Table 3111 Whitersquos Beach Water Quality Data 2008
ConductanceL C R Mean microScm
062308 3 8 3 5 759 77 21 430070108 4 6 5 5 815 77 22 442070808 3 4 8 5 816 76 23 435071508 2 1 2 2 816 76 23 432072208 22 16 13 17 817 77 24 440072908 4 8 6 6 814 77 24 431080508 41 73 60 58 816 77 24 449081208 32 28 42 34 810 77 24 447
Mean 14 18 17 16 808 77 23 438
E coli in Water Water Chemistry cfu100 ml pH DO (mgl) Temp OC
Date
Table 3112 Whitersquos Beach Cladophora Data 2008 (NC=No Cladophora Present NA=Not
Analyzed)
CladophoraL C R Mean Extent RR LR Total
062308 NC NC NC NC 0 NA NA NA070108 NC NC NC NC 0 NA NA NA070808 NC NC NC NC 0 NA NA NA071508 NC NC NC NC 0 NA NA NA072208 NC NC NC NC 0 NA NA NA072908 NC NC NC NC 0 NA NA NA080508 130 NC NC mdash 1 NA 13 13081208 NC NC NC NC 0 NA NA NA
Mean 130 NC NC mdash 0 NA mdash mdash
Date E coli in Cladophora cfug dwt Microcystins in Cladophora microgg dwt
(Cladophora Extent 0 = None Present 1 = Present in isolated pockets at one location 2 = Present in isolated pockets at all locations 3 = Deposits 1 m2 in area 4= Deposits 1-5 m2 in area 5 = Deposits gt 5 m2 in area)
0
1
2
3
4
5
62508 7208 7908 71608 72308 73008 8608 81308
Water (cfu100mL)Cladophora cfug dwt
Figure 3112 E coli in Detached Cladophora and Water at Whitersquos Beach 2008
Log
E c
oli C
once
ntra
tion
21
317 Arenac County Park The sampling locations for Arenac County Park are provided in Figure 3113 Three near-shore locations were sampled at a depth of 03 m T he beach area was sandy and appeared to be groomed Detached Cladophora was common in the shallow littoral zone and the samples were collected approximately 1 meter from shore
Figure 3113 Arenac County Park Sampling Locations 2008 (L= Left C=Center R=Right)
The results of water and detached Cladophora analyses are summarized in Tables 3113 and 3114 respectively The mean E coli concentration for the study period was 25 cfu100 mL with only one beach sample exceeding 100 c fu100 mL (Station L 111 cfu100 mL Table 313) Water temperatures ranged from 21degC to 25degC The mean E coli concentration in
22
Table 3113 Arenac County Park Water Quality Data 2008
ConductanceL C R Mean microScm
062308 5 2 2 3 813 115 19 310070108 45 31 94 57 817 100 19 300070808 55 42 29 42 820 106 20 284071508 2 1 9 4 815 100 20 296072208 1 3 lt1 1 812 80 21 315072908 111 87 16 71 814 112 21 280080508 3 1 NC 1 811 114 21 292081208 1 2 60 21 817 113 21 296
Mean 28 21 26 25 815 11 20 297
E coli in Water Water Chemistry cfu100 ml pH DO (mgl) Temp OC
Date
Table 3114 Arenac County Park Cladophora Data 2008
CladophoraL C R Mean Extent RR LR Total
062308 1811 1144 2699 1885 4 lt01 lt01 lt01070108 1801 1327 3258 2129 4 3 2 5070808 38 175 290 168 2 1 3 4071508 56 87 84 76 2 4 9 13072208 130 223 433 262 3 3 13 16072908 56 88 53 66 4 9 19 27080508 240 670 810 573 3 28 43 70081208 1300 1670 1890 1620 4 90 158 248
Mean 679 673 1190 847 3 20 35 55
Date E coli in Cladophora cfug dwt Microcystins in Cladophora microgg dwt
(Cladophora Extent 0 = None Present 1 = Present in isolated pockets at one location 2 = Present in isolated pockets at all locations 3 = Deposits 1 m2 in area 4= Deposits 1-5 m2 in area 5 = Deposits gt 5 m2 in area)
detached Cladophora was 847 cfug dwt (Table 3114) M icrocystins were detected in the detached Cladophora beginning in July with mean concentrations of 20 microgg dwt 35 microgg dwt and 55 microgg dwt for microcystin RR microcystin LR and total microcystins respectively Detached Cladophora was present in 1-5 m p ockets at all locations for 6 of the 8 s ampling periods (Table 3114) The beach was groomed for the July 4th holiday and the Cladophora extent decreased to being present in isolated areas for two weeks E coli concentrations in water and detached Cladophora are displayed in Figure 3114 No correlation was observed between bacterial levels in water and detached algae (Spearmanrsquos RO ρ=061) A statistically significant difference was not observed between beach locations for E coli concentrations in detached Cladophora (Kruskal-Wallis ρ=057) S tation R had the highest concentration of E coli in detached Cladophora (3258 cfug dwt)
23
0
1
2
3
4
5
62508 7208 7908 71608 72308 73008 8608 81308
Log
E c
oli
Con
cent
ratio
n Water (cfu100mL)Cladophora cfug dwt
Figure 3114 E coli in Detached Cladophora and Water at Arenac County Park 2008 318 Foster Road Beach The sampling locations for Foster Road Beach are provided in Figure 3115 Three near-shore locations were sampled at a depth of 05 m T he beach area was sandy and appeared to be groomed Detached Cladophora was common in the shallow littoral zone and the samples were collected approximately 1 meter from shore Strong wave action was observed at this location which kept the detached Cladophora suspended in the water column This was the only Saginaw Bay location where suspended Cladophora was observed The results of water and detached Cladophora analyses are summarized in Tables 3115 and 3116 respectively The mean E coli concentration for the study period was 73 cfu100 mL with only one set of beach samples averaging 315 c fu100mL (July 15 Table 3117) This sample was taken after the storm event which occurred on July 12 Water temperatures ranged from 21degC to 25degC The mean E coli concentration in detached Cladophora was 2169 cfug dwt (Table 3116) Microcystins were detected in the detached Cladophora beginning in July with mean concentrations of 36 microgg dwt 41 microgg dwt and 77 microgg dwt for microcystin RR microcystin LR and total microcystins respectively D etached Cladophora was present throughout the water column during the first three weeks not present on July 15 (after the storm) and present only in isolated pockets during the remainder of the sampling period (Table 3116) E coli concentrations in water and detached Cladophora are displayed in Figure 3118 N o correlation was observed between bacterial levels in water and detached algae (Spearmanrsquos RO ρ=078) A statistically significant difference was not observed between beach locations for E coli concentrations in detached Cladophora (Kruskal-Wallis ρ=090) Station L had the highest concentration of E coli in detached Cladophora (7332 cfug dwt)
24
Figure 3115 Foster Road Beach Sampling Locations 2008 (L= Left C=Center R=Right)
Table 3115 Foster Road Beach Water Quality Data 2008
ConductanceL C R Mean microScm
062308 1 2 5 3 792 77 21 376070108 60 21 23 35 818 76 22 382070808 55 140 181 125 815 75 23 442071508 320 400 225 315 815 74 23 436072208 1 2 3 2 812 73 24 447072908 25 31 50 35 820 77 24 436080508 22 21 7 17 814 78 24 447081208 46 51 71 56 811 81 24 450
Mean 66 84 71 73 812 76 23 427
E coli in Water Water Chemistry cfu100 ml pH DO (mgl) Temp OC
Date
25
Table 3116 Foster Road Beach Cladophora Data 2008 (NC=No Cladophora Present NA=Not Analyzed)
Cladophora
L C R Mean Extent RR LR Total062308 1380 2760 1515 1885 5 lt01 lt01 lt01070108 4554 7010 5346 5637 5 lt01 1 1070808 6731 5893 7332 6652 5 12 11 23071508 NC NC NC NC 0 NA NA NA072208 150 230 320 233 2 27 34 61072908 230 156 240 209 2 68 80 148080508 213 270 189 224 2 80 80 161081208 332 380 320 344 2 82 102 184
Mean 1941 2386 2180 2169 3 36 41 77
Date E coli in Cladophora cfug dwt Microcystins in Cladophora microgg dwt
(Cladophora Extent 0 = None Present 1 = Present in isolated pockets at one location 2 = Present in isolated pockets at all locations 3 = Deposits 1 m2 in area 4= Deposits 1-5 m2 in area 5 = Deposits gt 5 m2 in area)
0
1
2
3
4
5
62508 7208 7908 71608 72308 73008 8608 81308
Log
E c
oli
Con
cent
ratio
n Water (cfu100mL)Cladophora cfug dwt
Figure 3116 E coli in Detached Cladophora and Water at Foster Road Beach 2008
32 Grand Traverse Bay and Little Traverse Bay E coli Microcystin and Water Chemistry Results
321 Petoskey State Park The sampling locations for Petoskey State Park are provided in Figure 321 Three near-shore locations were sampled at a depth of 03 m T he beach area was sandy and appeared to be natural Detached Cladophora was present in isolated pockets in the shallow littoral zone and the samples were collected approximately 1 meter from shore
26
Figure 321 Petoskey State Park Sampling Locations 2008 (L= Left C=Center R=Right) The results of water and detached Cladophora analyses are summarized in Tables 321 and 322 respectively The mean E coli concentration for the study period was 13 cfu100 mL with no single beach sample exceeding 100 cfu100 mL (Table 321) Water temperatures ranged from 19degC to 21degC The mean E coli concentration in detached Cladophora was 1117 cfug dwt (Table 322) M icrocystins were not detected in the detached Cladophora Detached Cladophora was present in isolated pockets at all locations for only 2 of the 8 sampling periods (Table 322) E coli concentrations in water and detached Cladophora are displayed in Figure 322 N o correlation was observed between bacterial levels in water and detached algae (Spearmanrsquos RO ρ=059) A statistically significant difference was not observed between beach locations for E coli concentrations in detached Cladophora (Kruskal-Wallis ρ=0058) Station R had the highest concentration of E coli in detached Cladophora (1600 cfug dwt)
27
Table 321 Petoskey State Park Water Quality Data 2008
ConductanceL C R Mean microScm
062308 6 3 2 4 800 105 19 303070108 89 55 73 72 823 109 19 296070808 2 3 3 3 813 110 19 300071508 3 6 6 5 815 105 20 295072208 4 7 5 5 824 104 21 300072908 16 12 5 11 818 108 21 298080508 1 1 1 1 814 104 21 300081208 6 3 1 4 807 107 21 297
Mean 16 11 12 13 814 106 20 299
E coli in Water Water Chemistry cfu100 ml pH DO (mgl) Temp OC
Date
Table 322 Petoskey State Park Cladophora Data 2008 (NC=No Cladophora Present NA=Not Analyzed)
Cladophora
L C R Mean Extent RR LR Total062308 990 1200 1100 1097 2 lt01 lt01 lt01070108 1455 1390 1543 1463 2 lt01 lt01 lt01070808 NC NC 1200 1200 1 lt01 lt01 lt01071508 NC 1423 NC 1423 1 lt01 lt01 lt01072208 NC 556 NC 556 1 lt01 lt01 lt01072908 NC NC 1600 1600 1 lt01 lt01 lt01080508 1200 NC NC 1200 1 lt01 lt01 lt01081208 NC NC 400 400 1 lt01 lt01 lt01
Mean 1215 1142 1169 1117 1 lt01 lt01 lt01
Date E coli in Cladophora cfug dwt Microcystins in Cladophora microgg dwt
(Cladophora Extent 0 = None Present 1 = Present in isolated pockets at one location 2 = Present in isolated pockets at all locations 3 = Deposits 1 m2 in area 4= Deposits 1-5 m2 in area 5 = Deposits gt 5 m2 in area)
0
1
2
3
4
5
62508 7208 7908 71608 72308 73008 8608 81308
Water (cfu100mL)Cladophora cfug dwt
Figure 322 E coli in Detached Cladophora and Water at Petoskey State Park 2008
Log
E c
oli C
once
ntra
tion
28
322 Magnus Park The sampling locations for Magnus Park are provided in Figure 323 The beach area was sandy and appeared to be natural Detached Cladophora was present in isolated pockets in the shallow littoral zone and the samples were collected approximately 1 meter from shore
Figure 323 Magnus Park Sampling Locations 2008 (L= Left C=Center R=Right) The results of water and detached Cladophora analyses are summarized in Tables 323 and 324 respectively The mean E coli concentration for the study period was 17 cfu100 mL with one beach sample exceeding 100 c fu100 mL (120 cfu100 mL Table 323) W ater temperatures ranged from 19degC to 21degC T he mean E coli concentration in detached Cladophora was 1554 cfug dwt (Table 324) Microcystins were not detected in the detached Cladophora Detached Cladophora was present in isolated pockets at one location for 4 of the 8 sampling periods (Table 324) E coli concentrations in water and detached Cladophora are displayed in Figure 324 N o correlation was observed between bacterial levels in water and detached algae (Spearmanrsquos RO ρ=059) A statistically significant difference was not observed between beach locations for E coli concentrations in detached Cladophora (Kruskal-Wallis ρ=0054) Station R had the highest concentration of E coli in detached Cladophora (2368 cfug dwt)
29
Table 323 Magnus Park Water Quality Data 2008
ConductanceL C R Mean microScm
062308 5 3 2 3 803 108 19 295070108 2 3 2 2 813 105 19 297070808 77 120 76 91 817 110 19 305071508 1 3 6 3 804 106 20 301072208 6 3 2 4 813 110 21 299072908 9 3 11 8 821 108 21 295080508 4 16 15 12 824 110 21 297081208 18 10 15 14 810 102 21 300
Mean 15 20 16 17 813 107 20 299
E coli in Water Water Chemistry cfu100 ml pH DO (mgl) Temp OC
Date
Table 324 Magnus Park Cladophora Data 2008 (NC=No Cladophora Present NA=Not
Analyzed)
CladophoraL C R Mean Extent RR LR Total
062308 2368 NC 3321 2845 1 lt01 lt01 lt01070108 NC NC NC NC 0 NC NC NC070808 NC NC 1200 1200 1 lt01 lt01 lt01071508 NC NC NC NC 0 NC NC NC072208 NC NC NC NC 0 NC NC NC072908 NC NC 1300 1300 1 lt01 lt01 lt01080508 NC NC NC NC 0 NC NC NC081208 NC NC 870 870 1 lt01 lt01 lt01
Mean 2368 NC 1673 1554 1 lt01 lt01 lt01
Date E coli in Cladophora cfug dwt Microcystins in Cladophora microgg dwt
(Cladophora Extent 0 = None Present 1 = Present in isolated pockets at one location 2 = Present in isolated pockets at all locations 3 = Deposits 1 m2 in area 4= Deposits 1-5 m2 in area 5 = Deposits gt 5 m2 in area)
0
1
2
3
4
5
62508 7208 7908 71608 72308 73008 8608 81308
Water (cfu100mL)Cladophora cfug dwt
Figure 324 E coli in Detached Cladophora and Water at Magnus Park 2008
Log
E c
oli C
once
ntra
tion
30
323 Elk Rapids Park The sampling locations for Elk Rapids Park are provided in Figure 325 The beach area was sandy and appeared to be natural Detached Cladophora was present in isolated pockets in the shallow littoral zone and the samples were collected approximately 1 meter from shore
Figure 325 Elk Rapids Park Sampling Locations 2008 (L= Left C=Center R=Right)
The results of water and detached Cladophora analyses are summarized in Tables 325 and 326 respectively The mean E coli concentration for the study period was 74 cfu100 mL with two sets of beach samples exceeding 100 c fu100 mL (134 cfu100 mL and 292 c fu100 mL Table 325) Water temperatures ranged from 19degC to 21degC The mean E coli concentration in detached Cladophora was 1225 cfug dwt (Table 326) Microcystins were not detected in the detached Cladophora Detached Cladophora was present in isolated pockets at more than one location for 6 of the 8 sampling periods (Table 316) E coli concentrations in water and detached Cladophora are displayed in Figure 314 N o correlation was observed between bacterial levels in water and detached algae (Spearmanrsquos RO ρ=018) A statistically significant difference was observed between beach locations for E coli concentrations in detached Cladophora (Kruskal-Wallis ρ=0030) Station R was significantly different from C and L (Mann-Whitney ρ=0005 and 0003 respectively) Station R was the closest sampling location
31
Table 325 Elk Rapids Park Water Quality Data 2008
ConductanceL C R Mean microScm
062308 155 390 330 292 827 100 19 297070108 23 16 54 31 814 109 19 301070808 44 13 27 28 811 108 19 297071508 22 56 70 49 813 109 20 301072208 57 25 22 35 812 101 21 275072908 90 145 166 134 805 109 21 297080508 4 1 21 9 801 107 21 281081208 25 19 7 17 810 102 21 302
Mean 53 83 87 74 812 11 20 294
E coli in Water Water Chemistry cfu100 ml pH DO (mgl) Temp OC
Date
Table 326 Elk Rapids Park Cladophora Data 2008 (NC=No Cladophora Present NA=Not Analyzed)
Cladophora
L C R Mean Extent RR LR Total062308 724 4111 6900 3912 2 lt01 lt01 lt01070108 322 858 3754 1645 2 lt01 lt01 lt01070808 NC NC 770 770 1 lt01 lt01 lt01071508 NC NC 840 840 1 lt01 lt01 lt01072208 569 670 440 560 2 lt01 lt01 lt01072908 430 1100 1600 1043 2 lt01 lt01 lt01080508 500 700 344 515 2 lt01 lt01 lt01081208 330 448 780 519 2 lt01 lt01 lt01
Mean 479 1314 1928 1225 2 lt01 lt01 lt01
Date E coli in Cladophora cfug dwt Microcystins in Cladophora microgg dwt
(Cladophora Extent 0 = None Present 1 = Present in isolated pockets at one location 2 = Present in isolated pockets at all locations 3 = Deposits 1 m2 in area 4= Deposits 1-5 m2 in area 5 = Deposits gt 5 m2 in area)
0
1
2
3
4
5
62508 7208 7908 71608 72308 73008 8608 81308
Water (cfu100mL)Cladophora cfug dwt
Figure 326 E coli in Detached Cladophora and Water at the Elk Rapids Park 2008
Log
E c
oli C
once
ntra
tion
32
location to the creek which drains a duck pond ne ar the city S tation R had the highest concentration of E coli in detached Cladophora (6900 cfug dwt) 324 Antrim County Day Park The sampling locations for Antrim County Day Park are provided in Figure 327 Three near-shore locations were sampled at a depth of 03 m The beach area was sandy and appeared to be natural Detached Cladophora was common in the shallow littoral zone and the samples were collected approximately 1 meter from shore
Figure 327 Antrim County Day Park Sampling Locations 2008 (L= Left C=Center R=Right)
The results of water and detached Cladophora analyses are summarized in Tables 327 and 328 respectively The mean E coli concentration for the study period was 25 cfu100 mL with one beach sample exceeding 100 c fu100 mL (111 cfu100 mL Table 327) W ater
33
temperatures ranged from 19degC to 21degC T he mean E coli concentration in detached Cladophora was 350 cfug dwt (Table 328) Microcystins were not detected in the detached Cladophora Detached Cladophora was either absent or present in isolated pockets at one location for 7 of the 8 sampling periods and at 2 l ocations during 1 sampling period (Table 318) E coli concentrations in water and detached Cladophora are displayed in Figure 328 No correlation was observed between bacterial levels in water and detached algae (Spearmanrsquos RO ρ=068) A statistically significant difference was not observed between beach locations for E coli concentrations in detached Cladophora (Kruskal-Wallis ρ=027) S tation R had the highest concentration of E coli in detached Cladophora (660 cfug dwt)
Table 327 Antrim County Day Park Water Quality Data 2008
ConductanceL C R Mean microScm
062308 5 2 2 3 813 115 19 310070108 45 31 94 57 817 100 19 300070808 55 42 29 42 820 106 20 284071508 2 1 9 4 815 100 20 296072208 1 3 lt1 1 812 80 21 315072908 111 87 16 71 814 112 21 280080508 3 1 NC 1 811 114 21 292081208 1 2 60 21 817 113 21 296
Mean 28 21 26 25 815 11 20 297
E coli in Water Water Chemistry cfu100 ml pH DO (mgl) Temp OC
Date
Table 328 Antrim County Day Park Cladophora Data 2008 (NC=No Cladophora Present NA=Not Analyzed)
Cladophora
L C R Mean Extent RR LR Total062308 79 61 660 267 2 lt01 lt01 lt01070108 NC NC NC NC 0 NA NA NA070808 NC NC NC NC 0 NA NA NA071508 NC NC NC NC 0 NA NA NA072208 NC NC 440 440 1 NA lt01 NA072908 NC NC NC NC 0 NA NA NA080508 NC NC 344 344 1 NA lt01 NA081208 NC NC NC NC 0 NA NA NA
Mean mdash mdash 481 350 1 mdash lt01 mdash
Date E coli in Cladophora cfug dwt Microcystins in Cladophora microgg dwt
(Cladophora Extent 0 = None Present 1 = Present in isolated pockets at one location 2 = Present in isolated pockets at all locations 3 = Deposits 1 m2 in area 4= Deposits 1-5 m2 in area 5 = Deposits gt 5 m2 in area)
34
0
1
2
3
4
5
62508 7208 7908 71608 72308 73008 8608 81308
Water (cfu100mL)Cladophora cfug dwt
Figure 328 E coli in Detached Cladophora and Water at the Antrim County Day Park 2008
325 East Bay Park The sampling locations for East Bay Park are provided in Figure 329 Three near-shore locations were sampled at depths of 03-05 m The beach area was sandy and appeared to be natural S tation L contained open water while Stations R and C contained Scirpus Detached Cladophora was found at all of the shallow littoral zone locations and the samples were collected approximately 1 meter from shore The results of water and detached Cladophora analyses are summarized in Tables 329 and 3210 respectively The mean E coli concentration for the study period was 25 cfu100 mL with one sample exceeding 100 cfu100 mL (103 cfu100 mL Table 329) Water temperatures ranged from 19degC to 21degC The mean E coli concentration in detached Cladophora was 969 cfug dwt (Table 3210) M icrocystins were not detected in the detached Cladophora Detached Cladophora was present in isolated pockets at more than one location for all of the 8 sampling periods (Table 3210) E coli concentrations in water and detached Cladophora are displayed in Figure 3210 No correlation was observed between bacterial levels in water and detached algae (Spearmanrsquos RO ρ=012) A statistically significant difference was not observed between beach locations for E coli concentrations in detached Cladophora (Kruskal-Wallis ρ=041) Station L had the highest E coli concentration in detached Cladophora (5000 cfug dwt) Station L was the closest sampling location to a storm-water outlet entering Grand Traverse Bay
Log
E c
oli C
once
ntra
tion
35
Figure 329 East Bay Park Sampling Locations 2008 (L= Left C=Center R=Right)
Table 329 East Bay Park Water Quality Data 2008
ConductanceL C R Mean microScm
062308 2 1 3 2 821 106 19 299070108 5 3 NC 3 821 104 19 300070808 4 7 14 8 807 105 19 320071508 17 41 21 26 807 103 20 310072208 41 91 103 78 804 101 21 330072908 51 92 61 68 819 102 21 324080508 8 4 11 8 805 103 21 309081208 7 2 1 8 809 108 21 317
Mean 17 30 27 25 812 10 20 314
E coli in Water Water Chemistry cfu100 ml pH DO (mgl) Temp OC
Date
36
Table 3210 East Bay Park Cladophora Data 2008 (NC=No Cladophora Present NA=Not Analyzed)
Cladophora
L C R Mean Extent RR LR Total062308 5000 2000 1000 2667 3 lt01 lt01 lt01070108 3300 1500 900 1900 3 lt01 lt01 lt01070808 660 500 460 540 3 lt01 lt01 lt01071508 546 600 NC 573 2 lt01 lt01 lt01072208 340 500 600 480 3 lt01 lt01 lt01072908 700 630 NC 665 2 lt01 lt01 lt01080508 935 500 700 712 3 lt01 lt01 lt01081208 325 330 NC 218 2 lt01 lt01 lt01
Mean 1476 820 732 969 3 lt01 lt01 lt01
Date E coli in Cladophora cfug dwt Microcystins in Cladophora microgg dwt
(Cladophora Extent 0 = None Present 1 = Present in isolated pockets at one location 2 = Present in isolated pockets at all locations 3 = Deposits 1 m2 in area 4= Deposits 1-5 m2 in area 5 = Deposits gt 5 m2 in area)
0
1
2
3
4
5
62508 7208 7908 71608 72308 73008 8608 81308
Log
E c
oli C
once
ntra
tion
Water (cfu100mL)Cladophora cfug dwt
Figure 3210 E coli in Detached Cladophora and Water at East Bay Park 2008 326 Traverse City State Park The sampling locations for Traverse City State Park are provided in Figure 3211 Three near-shore locations were sampled at a depth of 03 m The beach area was sandy and appeared to be natural Detached Cladophora was present in isolated pockets in the shallow littoral zone near Mitchell Creek and the samples were collected approximately 1 meter from shore
37
Figure 3211 Traverse City State Park Sampling Locations 2008 (L= Left C=Center R=Right)
The results of water and detached Cladophora analyses are summarized in Tables 3211 and 3212 respectively The mean E coli concentration for the study period was 33 cfu100 mL with one sample exceeding 100 cfu100 mL (195 cfu100 mL Table 3211) W ater temperatures ranged from 19degC to 21degC Station L was the only location at this beach with detached Cladophora and the associated E coli concentrations averaged 1630 cfug dwt The highest concentration E coli in detached Cladophora was 3300 cfug dwt This station was the closest sampling location to Mitchell Creek which has a history of bacterial contamination problems (The Watershed Center 2006) Microcystins were not detected in the detached Cladophora Detached Cladophora was present in isolated pockets at one location for all of the 8 sampling periods (Table 3212) E coli concentrations in water and detached Cladophora are displayed in Figure 3212 No correlation was observed between bacterial levels in water and detached algae (Spearmanrsquos RO ρ=015) A statistically significant difference was observed between beach locations for E coli concentrations in detached Cladophora (Kruskal-Wallis ρ=0001)
38
Table 3211 Traverse City State Park Water Quality Data 2008
ConductanceL C R Mean microScm
062308 1 4 NC 2 816 107 19 301070108 3 5 10 6 815 101 19 305070808 195 37 66 99 815 105 19 296071508 22 48 63 44 820 104 20 297072208 95 88 57 80 801 108 21 299072908 19 10 5 11 802 102 21 300080508 18 14 11 14 825 108 21 294081208 8 6 5 6 805 106 21 294
Mean 45 27 31 33 812 105 20 298
DateE coli in Water Water Chemistry
cfu100 ml pH DO (mgl) Temp OC
Table 3212 Traverse City State Park Cladophora Data 2008 (NC=No Cladophora Present NA=Not Analyzed)
Cladophora
L C R Mean Extent RR LR Total062308 2000 NC NC mdash 1 lt01 lt01 lt01070108 3300 NC NC mdash 1 lt01 lt01 lt01070808 900 NC NC mdash 1 lt01 lt01 lt01071508 750 NC NC mdash 1 lt01 lt01 lt01072208 1200 NC NC mdash 1 lt01 lt01 lt01072908 700 NC NC mdash 1 lt01 lt01 lt01080508 990 NC NC mdash 1 lt01 lt01 lt01081208 3200 NC NC mdash 1 lt01 lt01 lt01
Mean 1630 NC NC mdash 1 lt01 lt01 lt01
Date E coli in Cladophora cfug dwt Microcystins in Cladophora microgg dwt
(Cladophora Extent 0 = None Present 1 = Present in isolated pockets at one location 2 = Present in isolated pockets at all locations 3 = Deposits 1 m2 in area 4= Deposits 1-5 m2 in area 5 = Deposits gt 5 m2 in area)
0
1
2
3
4
5
62508 7208 7908 71608 72308 73008 8608 81308
Water (cfu100mL)Cladophora cfug dwt
Figure 3212 E coli in Detached Cladophora and Water at Traverse City State Park 2008
Log
E c
oli C
once
ntra
tion
39
327 Bryant Park The sampling locations for Bryant Park are provided in Figure 3213 T hree near-shore locations were sampled at a depth of 03 m T he beach area was sandy and appeared to be natural Detached Cladophora was common in the shallow littoral zone and the samples were collected approximately 1 meter from shore
Figure 3213 Bryant Park Sampling Locations 2008 (L= Left C=Center R=Right)
40
The results of water and detached Cladophora analyses are summarized in Tables 3213 and 3214 respectively The mean E coli concentration for the study period was 46 cfu100 mL with one set of samples exceeding 100 cfu100 mL (281 cfu100 mL Table 3213) W ater temperatures ranged from 19degC to 21degC T he mean E coli concentration in detached Cladophora was 1873 cfug dwt (Table 3214) Microcystins were not detected in the detached Cladophora Detached Cladophora was present in isolated pockets at one location for all of the 8 sampling periods (Table 3214) E coli concentrations in water and detached Cladophora are displayed in Figure 3214 No correlation was observed between bacterial levels in water and detached algae (Spearmanrsquos RO ρ=082) A statistically significant difference was not observed between beach locations for E coli concentrations in detached Cladophora (Kruskal-Wallis ρ=048) Station C had the highest concentration of E coli in detached Cladophora (9460 cfug dwt)
Table 3213 Bryant Park Water Quality Data 2008
ConductanceL C R Mean microScm
062308 3 4 11 6 825 105 19 296070108 6 8 5 6 800 102 19 301070808 290 310 243 281 824 100 19 300071508 8 9 4 7 819 106 20 298072208 6 8 3 6 813 103 21 300072908 11 13 22 15 811 104 21 297080508 12 18 15 15 815 107 21 317081208 33 29 1 28 805 101 21 299
Mean 46 50 38 46 814 103 20 301
E coli in Water Water Chemistry cfu100 ml pH DO (mgl) Temp OC
Date
Table 3214 Bryant Park Cladophora Data 2008 (NC=No Cladophora Present NA=Not Analyzed)
Cladophora
L C R Mean Extent RR LR Total062308 980 9460 680 3707 2 lt01 lt01 lt01070108 977 7690 490 3052 2 lt01 lt01 lt01070808 3443 1462 2741 2549 2 lt01 lt01 lt01071508 1300 1800 1567 1556 2 lt01 lt01 lt01072208 990 832 751 858 2 lt01 lt01 lt01072908 111 1643 1565 1106 2 lt01 lt01 lt01080508 1245 890 1443 1193 2 lt01 lt01 lt01081208 1122 844 922 963 2 lt01 lt01 lt01
Mean 1271 3078 1270 1873 2 lt01 lt01 lt01
Date E coli in Cladophora cfug dwt Microcystins in Cladophora microgg dwt
(Cladophora Extent 0 = None Present 1 = Present in isolated pockets at one location 2 = Present in isolated pockets at all locations 3 = Deposits 1 m2 in area 4= Deposits 1-5 m2 in area 5 = Deposits gt 5 m2 in area)
41
0
1
2
3
4
5
62508 7208 7908 71608 72308 73008 8608 81308
Water (cfu100mL)Cladophora cfug dwt
Figure 3214 E coli in Detached Cladophora and Water at Bryant Park 2008 328 Clinch Park The sampling locations for Clinch Park are provided in Figure 3215 T hree near-shore locations were sampled at a depth of 03 m T he beach area was sandy and appeared to be natural Detached Cladophora was present at one location during the last sampling event The sample was collected approximately 05 m from shore The results of water and detached Cladophora analyses are summarized in Tables 3215 and 3216 respectively The mean E coli concentration for the study period was 35 cfu100 mL with one set of samples exceeding 100 cfu100 mL (164 cfu100 mL Table 3215) W ater temperatures ranged from 19degC to 21degC D etached Cladophora was present in an isolated pocket at one location during the August 12 sampling event (Table 3216) E coli was present in detached Cladophora in this sample at a concentration of 680 c fug dwt (Table 3216) Microcystins were not detected in the detached Cladophora E coli concentrations in water and detached Cladophora are displayed in Figure 3216 N o correlation was observed between bacterial levels in water and detached algae (Spearmanrsquos RO ρ=099)
Log
E c
oli C
once
ntra
tion
42
Figure 3215 Clinch Park Sampling Locations 2008 (L= Left C=Center R=Right)
Table 3215 Clinch Park Water Quality Data 2008
ConductanceL C R Mean microScm
062308 22 14 11 16 828 105 19 296070108 1 3 NC 1 801 109 19 300070808 33 19 30 27 805 101 19 310071508 21 18 32 24 816 107 20 302072208 155 170 167 164 802 103 21 302072908 43 21 37 34 801 104 21 307080508 11 7 18 12 830 102 21 299081208 4 2 1 3 822 104 21 298
Mean 36 32 37 35 813 104 20 302
E coli in Water Water Chemistry cfu100 ml pH DO (mgl) Temp OC
Date
43
Table 3216 Clinch Park Cladophora Data 2008 (NC=No Cladophora Present NA=Not Analyzed)
Cladophora
L C R Mean Extent RR LR Total062308 NC NC NC NC 0 lt01 lt01 lt01070108 NC NC NC NC 0 lt01 lt01 lt01070808 NC NC NC NC 0 lt01 lt01 lt01071508 NC NC NC NC 0 lt01 lt01 lt01072208 NC NC NC NC 0 lt01 lt01 lt01072908 NC NC NC NC 0 lt01 lt01 lt01080508 NC NC NC NC 0 lt01 lt01 lt01081208 NC NC 680 680 1 lt01 lt01 lt01
Mean NC NC 680 680 0 lt01 lt01 lt01
Date E coli in Cladophora cfug dwt Microcystins in Cladophora microgg dwt
(Cladophora Extent 0 = None Present 1 = Present in isolated pockets at one location 2 = Present in isolated pockets at all locations 3 = Deposits 1 m2 in area 4= Deposits 1-5 m2 in area 5 = Deposits gt 5 m2 in area)
0
1
2
3
4
5
62508 7208 7908 71608 72308 73008 8608 81308
Water (cfu100mL)Cladophora cfug dwt
Figure 3216 E coli in Detached Cladophora and Water at Clinch Park 2008 329 West End Beach The sampling locations for West End Beach are provided in Figure 3217 T hree near-shore locations were sampled at a depth of 03 m T he beach area was sandy and appeared to be natural Detached Cladophora was common in the shallow littoral zone and the samples were collected approximately 1 meter from shore This beach appeared to be used by pet owners as dogs were frequently present during sampling
Log
E c
oli C
once
ntra
tion
44
Figure 3217 West End Beach Sampling Locations 2008 (L= Left C=Center R=Right)
The results of water and detached Cladophora analyses are summarized in Tables 3217 and 3218 respectively The mean E coli concentration for the study period was 35 cfu100 mL with no samples exceeding 100 c fu100 mL (Table 3217) W ater temperatures ranged from 19degC to 21degC T he mean E coli concentration in detached Cladophora was 2976 cfug dwt (Table 3218) M icrocystins were not detected in the detached Cladophora Detached Cladophora was present in isolated pockets at all locations for 4 of the 8 sampling periods (Table 3218) E coli concentrations in water and detached Cladophora are displayed in Figure 3218 N o correlation was observed between bacterial levels in water and detached algae (Spearmanrsquos RO ρ=028) A statistically significant difference was not observed between beach locations for E coli concentrations in detached Cladophora (Kruskal-Wallis ρ=079) Station C was higher than the other stations with respect to mean E coli concentrations in detached Cladophora (3078 cfug dwt) The highest concentration of E coli in detached Cladophora measured during the study period in Grand Traverse Bay was at West End Beach (22874 cfug dwt at Station C) Dogs frequently were present on this beach at the time of sampling which may be the source of the high bacteria concentrations
45
Table 3217 West End Beach Water Quality Data 2008
ConductanceL C R Mean microScm
062308 5 3 4 4 821 103 19 302070108 3 1 2 2 829 110 19 297070808 34 55 48 46 807 100 19 303071508 46 33 25 35 803 108 20 301072208 66 86 126 93 804 105 21 297072908 6 14 5 8 825 106 21 294080508 100 94 49 81 827 107 21 306081208 22 10 1 14 827 107 21 297
Mean 35 37 33 35 818 106 20 300
E coli in Water Water Chemistry cfu100 ml pH DO (mgl) Temp OC
Date
Table 3218 West End Beach Cladophora Data 2008 (NC=No Cladophora Present NA=Not Analyzed)
Cladophora
L C R Mean Extent RR LR Total062308 1509 76 289 625 2 lt01 lt01 lt01070108 1721 22874 13337 12644 2 lt01 lt01 lt01070808 1016 NC NC 1016 1 lt01 lt01 lt01071508 NC NC 1644 1644 1 lt01 lt01 lt01072208 NC NC NC NC 0 NA NA NA072908 NC NC NC NC 0 NA NA NA080508 1300 1233 1567 1367 2 lt01 lt01 lt01081208 678 444 567 563 2 lt01 lt01 lt01
Mean 1245 6157 3481 2976 1 lt01 lt01 lt01
Date E coli in Cladophora cfug dwt Microcystins in Cladophora microgg dwt
(Cladophora Extent 0 = None Present 1 = Present in isolated pockets at one location 2 = Present in isolated pockets at all locations 3 = Deposits 1 m2 in area 4= Deposits 1-5 m2 in area 5 = Deposits gt 5 m2 in area)
0
1
2
3
4
5
62508 7208 7908 71608 72308 73008 8608 81308
Water (cfu100mL)Cladophora cfug dwt
Figure 3218 E coli in Detached Cladophora and Water at West End Beach 2008
Log
E c
oli C
once
ntra
tion
46
33 Saginaw Bay and Grand Traverse BayLittle Traverse Bay Comparisons
A summary of the project data is presented in Table 331 Mean temperatures for Saginaw Bay were higher than in Grand Traverse BayLittle Traverse Bay (23degC and 20degC respectively) Microcystins in detached Cladophora were absent in Grand Traverse BayLittle Traverse Bay In Saginaw Bay the grand mean of all locations with detached Cladophora was 57 microgg dwt for the study period M ean concentrations of E coli in water were significantly higher (Mann-Whitney ρ=0003) in Grand Traverse BayLittle Traverse Bay (34 cfu100 mL) than in Saginaw Bay (18 cfu100 mL) In contrast mean E coli concentrations in detached Cladophora were higher in Saginaw Bay (2796 cfug dwt) than Grand Traverse BayLittle Traverse Bay (1775 cfug dwt) however the difference was not statistically significant (Mann-Whitney ρ=040) The mean Cladophora extent score for Grand Traverse BayLittle Traverse Bay was 1 indicating that detached algae were found in small pockets T he mean Cladophora extent score for Saginaw Bay was 3 indicating that detached algae were found in 1 m2 deposits
Table 331 Summary of Water Quality and Cladophora Data for Grand Traverse BayLittle Traverse Bay and Saginaw Bay 2008
Parameter Saginaw Bay Grand TraverseLittle Traverse Bay
Mean Temperature 23degC 20degC Mean Total Microcystins 57 microgg dwt lt01 microgg dwt Cladophora Extent Score 3 1 Mean E coli in Water 18 cfu100 mL 34 cfu100 mL Mean E coli in Cladophora 2796 cfug dwt 1775 cfug dwt
(Cladophora Extent 0 = None Present 1 = Present in isolated pockets at one location 2 = Present in isolated pockets at all locations 3 = Deposits 1 m2 in area 4= Deposits 1-5 m2 in area 5 = Deposits gt 5 m2 in area)
40 Discussion The presence of Cladophora has been associated with high levels of E coli and species of potentially pathogenic enteric bacteria in beach sand and swimming waters of the Great Lakes (Whitman et al 2003 Ishii et al 2006 Olapade et al 2006) Enteric bacteria can grow within detached Cladophora under certain conditions (Byappanahalli et al 2005) In addition detached Cladophora deposits can potentially harbor and enhance the survival of pathogenic bacteria released into the environment through point and non-point sources (Byappanahalli et al 2005) Recently Clostridium was found to grow in detached Cladophora in the Great Lakes (Byappanahalli and Whitman 2009) Algal species including Cladophora have been reported to provide nutrients and to protect attached bacteria from environmental stresses desiccation predation and harmful UV radiation (Byappanahalli et al 2005) In this manner Cladophora mats may play a significant role as a source and sink for pathogens in the near-shore environment Based on the results from this investigation Saginaw Bay appears to be more heavily impacted by detached Cladophora than Grand Traverse BayLittle Traverse Bay Eutrophication of lakes has been associated with increases in Cladophora mat production and accumulation (Stevenson et al 2006 Herbst 1969) but water transparency also has been suggested as an important causative factor (Barbiero et al 2006 Bootsma 2007) Elevated levels of nutrients in Saginaw Bay have been reported to stimulate blooms of cyanobacteria in Saginaw Bay and also influence the near-shore environment (Fahnenstiel et al 2008 Millie et al
47
2008) Differences in Cladophora accumulation between the Lake Huron and Lake Michigan sites may be attributed to higher total phosphorus levels (18 microgl vs 5 microgl MDNRE 2006) Levels of E coli in detached Cladophora in both systems were similar to concentrations previously reported in the Great Lakes (3 log10 - 5 log10 Engelbert et al 2008) In Saginaw Bay the highest levels of E coli in detached Cladophora were consistently found at locations near the Saginaw River (Wenona Beach and the Bay City Recreation Area) E ven within individual sites locations near tributaries and drains at Wenona Beach and South Linwood Beach were significantly higher than locations farther away form a point source This relationship also was noted in Grand Traverse Bay where the location near Mitchell Creek at the Traverse City State Park had elevated E coli concentrations in detached Cladophora compared to the other two beach stations At Traverse City State Park Cladophora deposits were present only at the location near Mitchell Creek These results suggest that Cladophora can trap bacteria from point sources and also be stimulated by nutrient discharges Two locations Pinconning Park and Whitersquos Beach had very limited Cladophora growth Both locations had Chara growing on the lake bottom Chara is known to exhibit allelopathic activity that can limit the growth of other aquatic plants (Berger and Schagerl 2004) No correlation was found between E coli levels in the open water (designated beach monitoring locations) and the near-shore zone where the detached Cladophora samples were taken As noted in previous studies Cladophora appears to hold trapped E coli and not release the entrained bacteria into the offshore water (Byappanahalli et al 2003 Engelbert et al 2008) This investigation was the first to document the accumulation of microcystins in the detached Cladophora of Saginaw Bay S aginaw Bay has a history of Microcystis blooms in the late summer months that produce both microcystin LR and RR (Fahnenstiel et al 2008 Millie et al 2008) S ince Microcystis has a high requirement for sunlight cyanobacteria may become stressed when they become trapped in the detached algae deposits Stress has been implicated in initiating cyanotoxin production (Codd 1995) While accidental ingestion by humans of microcystins trapped in Cladophora is unlikely these compounds can act as skin irritants (Bell and Codd 1994) W alking through Cladophora accumulations to get to deeper water may provide sufficient exposure to cause irritation in sensitive individuals if microcystins are present While all of the data suggest that swimming areas (1 m depth) are not impacted by E coli accumulations in detached Cladophora entrained bacteria and cyanotoxins may pose a hazard to children playing in the near-shore water and beach sand While current regulations discourage beach grooming the presence of elevated bacteria and microcystin levels in the near-shore environment of Saginaw Bay suggests that the current policy should balance potential impacts to public health with the ecosystem services provided by coastal wetlands 50 Conclusions An assessment of the ability of Cladophora mats to sequester E coli and microcystin LR and RR was conducted in near-shore waters of Grand Traverse Bay (7 sites) Little Traverse Bay (2 sites) and Saginaw Bay (8 sites) The sampling locations were at public beach access points where Cladophora mats previously have been observed The goals of this research were to determine the spatial and temporal variability of E coli populations in Cladophora mats in these
48
recreational waters and if cyanotoxins (microcystin LR and RR) were sequestered in the detached algae T he collection of Cladophora samples was coordinated with local beach monitoring programs to facilitate the comparison with ambient water bacteria concentrations This project provided important data for the assessment of public health impacts and the development of beach management programs to address the problems associated with Cladophora accumulations Based on the results from this investigation Saginaw Bay appears to be more heavily impacted by detached Cladophora than Grand Traverse BayLittle Traverse Bay Mean E coli concentrations in detached Cladophora were higher in Saginaw Bay (2796 cfug dwt) than Grand Traverse BayLittle Traverse Bay (1775cfug dwt) however the difference was not statistically significant (Mann-Whitney ρ=040) The mean Cladophora extent score for Grand Traverse BayLittle Traverse Bay was 1 indicating that detached alga was consistently found in small pockets at a single location The mean Cladophora extent score for Saginaw Bay was 3 indicating that detached alga was found in 1 m2 deposits at all locations D ifferences in Cladophora accumulation between Saginaw Bay and Grand Traverse BayLittle Traverse Bay may be attributed to higher total phosphorus levels in Saginaw Bay Levels of E coli in detached Cladophora in both systems were similar to concentrations previously reported in the Great Lakes (1000 cfug dwt ndash 60000 cfug dwt) In Saginaw Bay the highest levels of E coli in detached Cladophora were consistently found at locations near the Saginaw River (Wenona Beach and the Bay City Recreation Area) Even within individual sites locations near tributaries and drains at Wenona Beach and South Linwood Beach were significantly higher than locations farther away form a point source This relationship also was noted in Grand Traverse Bay where the location near Mitchell Creek at the Traverse City State Park had elevated E coli concentrations in detached Cladophora compared to the other two beach stations where no detached algae was found These results suggest that Cladophora can trap bacteria from point sources and also be stimulated by nutrient discharges T wo locations Pinconning Park and Whitersquos Beach had very limited Cladophora growth Both locations had Chara growing on the lake bottom Chara is known to exhibit allelopathic activity that can limit the growth of other aquatic plants N o correlation was found between E coli levels in the open water (designated beach monitoring locations) and the near-shore zone where the detached Cladophora samples were taken As noted in previous studies Cladophora appears to hold trapped E coli and does not release the entrained bacteria into the offshore water This investigation was the first to document the accumulation of microcystins in the detached Cladophora of Saginaw Bay Total microcystins in detached Cladophora had a grand mean of 57 microgg dwt for the study period Saginaw Bay has a history of Microcystis blooms in the late summer months that produce both microcystin LR and RR S ince Microcystis has a h igh requirement for sunlight cyanobacteria may become stressed when they become trapped in the detached algae mats W hile accidental ingestion by humans of microcystins trapped in Cladophora is unlikely these compounds can act as skin irritants Walking through Cladophora accumulations to get to deeper water may provide sufficient exposure to cause irritation in sensitive individuals if microcystins are present While all of the data suggest that swimming areas (1 m depth) are not impacted by E coli accumulations in detached Cladophora entrained bacteria and cyanotoxins may pose a hazard to children playing in the near-shore water and beach sand Current regulations discourage beach grooming and altering the near-shore zone The presence of elevated bacteria and microcystin levels in the near-shore environment of
49
Saginaw Bay suggest that the current policy should be reevaluated to balance potential impacts to public health with the ecosystem services provided by coastal wetlands 60 References APHA (American Public Health Association) 1998 Standard Methods for the Evaluation of
Water and Wastewater 20th edition APHA Washington DC Barbiero RP MC Tuchman and ES Millard 2006 Post-dreissenid increases in transparency
during summer stratification in the offshore waters of Lake Ontario Is a reduction in whiting events the cause J Great Lakes Res 32131ndash141
Bartsch A F 1968 Eutrophication is beginning in Lake Michigan 1968 Water Waste Eng 5
84-87 Bell SG and Codd G A 1994 Cyanobacterial toxins and human health Rev Med Microbiol
5256ndash264 Berger J and Schagerl M 2004 Allelopathic activity of Characeae Biologia 599ndash15 Bootsma HA EB Young and JA Berges (eds) 2005 Cladophora research and
management in the Great Lakes Proceedings of workshop December 2004 Special Report No 2005-01 UWM Great Lakes WATER Institute
Boyer G M C Watzin A D Shambaugh M F Satchwell B R Rosen and T Mihuc 2004
The occurrence of cyanobacterial toxins in Lake Champlain In Lake Champlain partnerships and Research in the New Millennium (Proceedings of the Lake Champlain Research Consortium May 20th 2002 Saint-Jean-sur-Richelieu Quebec T Manley Ed p 241-257
Byappanahalli M N D A Shively M B Nevers M J Sadowsky and R L Whitman 2003
Growth and survival of Escherichia coli and enterococci populations in the macro-alga Cladophora (Chlorophyta) FEMS Microbiol Ecol 46203-211
Byappanahalli M N and R L Whitman 2009 Clostridium botulinum type E occurs and grows
in the alga Cladophora glomerata Can J Fish Aquat Sci 66 879ndash882 Codd GA 1995 Cyanobacterial toxins occurrence properties and biological significance
Water Sci Technol 32 149^156 Dodds W K and D A Gudder 1992 The ecology of Cladophora J Phycol 28415-427 Englebert ET McDermott C and GT Kleinheinz 2008 Effects of the nuisance algae
Cladophora on Escherichia coli at recreational beaches in Wisconsin The Science of the Total Environment 404(1)10-17
50
Fahnenstiel G L Millie D F Dyble J Litaker R W Tester P A McCormick M J Rediske R and D Klarer 2008 Microcystin concentrations and cell quotas in Saginaw Bay Lake Huron Aquatic Ecosystems Health and Management 11(2)190 ndash 195
Graham L E 1982 Cytology ultrastructure taxonomy and phylogenetic relationships of Great
Lakes filamentous algae J Great Lakes Res 854-60 Hecky R E R E H Smith D R Barton S J Guildford W D Taylor M N Charlton and
T Howell 2004 The nearshore phosphorus shunt a consequence of ecosystem engineering by dreissenids in the Laurentia Great Lakes Can J Fish Aquat Sci 611285-1293
Herbst RP 1969 Ecological factors and the distribution of Cladophora glomerata in the Great
Lakes Am Midl Nat 8290ndash98 Higgins S N E T Howell R E Hecky S J Guildford and REH Smith 2005 The wall of
green The status of Cladophora glomerata on the northern shores of Lake Eries eastern basin 1995-2002 J Gt Lakes Res 31 547-563
Hydrolab 1998 DataSonde 4a Userrsquos Manual Hydrolab Corporation Austin TX Ishii S T Yan DA Shively MN Byappanahalli RL Whitman and MJ Sadowsky 2006
Cladophora (Chlorophyta) spp harbor human bacterial pathogens in nearshore water of Lake Michigan Appl Environ Microbiol 72 (7)4545ndash4553
Joska A M and J J Bolton 1996 Filamentous freshwater macroalgae in South Africa ndash a
literature review and perspective on the development and control of weed problems Hydrobiologia 340 295-300
Keilty T and Woller M 2004 Final Report prepared for the USEPA-GLNPO by the Leelanau
Watershed Council Leelanau Conservancy L a n d s b e r g J H 2 0 0 2 T h e e f f e c t s o f h a r m f u l
a l g a l b l o o m s o n a q u a t i c o r g a n i s m s R e v F i s h S c i 1 0 1 1 3 ndash 3 9 0
Lawrence JF Niedzwiadek B Menard C Lau BP-Y Kuiper-Goodman T Carbone S
Holmes C 2001 Comparison of HPLC-mass spectrometry ELISA and phosphatase assay for the determination of microcystins in blue-green algae products J AOAC Int 841035-1044
MDNRE 2006 Water Quality Monitoring of Saginaw and Grand Traverse Bays Michigan
Department of Natural Resources and Environment Lansing MI MIDEQWB-06096 Millie D G Fahnenstiel J Dyble R Litaker P Tester M McCormick R Rediske and D
Klarer 2008 Influence of environmental conditions on summer cyanobacterial abundance in Saginaw Bay Lake Huron Aquatic Ecosystems Health and Management 11(2)196ndash205
51
Mills E L J M Casselman R Dermott J D Fitzsimons G Gal K T Holeck J A Hoyle OE Johannsson B F Lantry J C Makarewicz E S Millard I F Munawar M Munawar R OGorman R W Owens L G Rudstam T Schaner and T J Stewart 2003 Lake Ontario Food web dynamics in a changing ecosystem (1970-2000) Can J Fish Aquat Sci 60 471ndash490
Neil J H and M B Jackson 1982 Monitoring Cladophora growth conditions and the effect of
phosphorus additions at a shoreline site in northeastern Lake Erie J Great Lakes Res 830-34
Olapade O A M M Depas E T Jensen and S L McLellan 2006 Microbial communities
and fecal indicator bacteria associated with Cladophora mats on beach sites along Lake Michigan shores Appl Environ Microbiol 721932-1938
Painter D S and G Kamaitis 1987 Reduction of Cladophora biomass and tissue phosphorus
in Lake Ontario 1972-1983 Can J Fish Aquat Sci 44 2212-2215 Stevenson RJ ST Rier CM Riseng RE Shultz and MJ Wiley 2006 Comparing effects
of nutrients on algal blooms in streams in two regions with different disturbance regimes and with application for developing nutrient criteria Hydrobiologia 561149ndash165
Taft C E 1975 History of Cladophora in the Great Lakes In H Shear and D E Konasewich
[eds] Cladophora in the Great Lakes International Joint Commission The Watershed Center 2006 Tributary Monitoring Data The Watershed Center Traverse City
MI Vanderploeg HA Liebig JR Carmichael WW Agy MA Johengen TH Fahnenstiel GL
amp Nalepa TF 2001 Zebra mussel (Dreissena polymorpha) selective filtration promoted toxic Microcystis blooms in Saginaw Bay (Lake Huron) and Lake Erie Can J Fish Aquat Sci 58 1208ndash1221
Whitman R L D A Shively H Pawlik M B Nevers and M N Byappanahalli 2003
Occurrence of Escherichia coli and enterococci in Cladophora (Chlorophyta) in nearshore water and beach sand of Lake Michigan Appl Environ Microbiol 694714-4719
Wilson K A E T Howell and D A Jackson 2006 Replacement of Zebra Mussels by
Quagga Mussels in the Canadian nearshore of Lake Ontario Distribution and correlations with substrate Round Goby abundance and upwelling frequency J Gt Lakes Res 3211-28
Zhu B D G Fitzgerald C M Mayer L G Rudstam and E L Mills 2006 Alteration of
ecosystem function by Zebra Mussels in Oneida Lake Impacts on submerged macrophytes Ecosystems 9 1017-1028
- Assessment of E coli and Microcystins in Cladophora Mats in the Nearshore Waters of Grand Traverse Bay Little Traverse Bay and Saginaw Bay
- May 2010
- TABLE OF CONTENTS
- LIST OF TABLES
- LIST OF FIGURES
- Acknowledgements
- Executive Summary
- 10 Introduction
- 20 Methods
-
- 21 Sampling methods
-
- 211 Sampling Design
- 212 Sampling Methods
-
- 22 Analytical Methods
-
- 221 Hydrolab Methods
- 222 E coli Analysis
- 223 Sample Preparation for Microcystin Analysis
- 244 Microcystin LR and RR by LCMS
-
- 30 Results
-
- 31 Saginaw Bay E coli Microcystin and Water Chemistry Results
-
- 311 Wenona Beach
- 312 Bay City Recreation Area
- 313 Brissette Beach
- 314 South Linwood Beach
- 315 Pinconning Park
- 316 Whitersquos Beach
- 317 Arenac County Park
- 318 Foster Road Beach
-
- 32 Grand Traverse Bay and Little Traverse Bay E coli Microcystin and Water Chemistry Results
-
- 321 Petoskey State Park
- 322 Magnus Park
- 323 Elk Rapids Park
- 324 Antrim County Day Park
- 325 East Bay Park
- 326 Traverse City State Park
- 327 Bryant Park
- 328 Clinch Park
- 329 West End Beach
-
- 33 Saginaw Bay and Grand Traverse BayLittle Traverse Bay Comparisons
-
- 40 Discussion
- 50 Conclusions
- 60 References
-

2
Although the public health and ecological importance of microbial communities associated with Cladophora mats in freshwater environments have been previously studied their role in sequestering potentially toxic cyanobacteria is poorly understood Nuisance blooms of Microcystis have been reported in Saginaw Bay (Vanderploeg et al 2001 Fahnensteil et al 2008) and several of the large inland lakes near Grand Traverse Bay (Keilty and Woller 2004) Since cyanobacteria blooms also can accumulate on beaches and cause fouling of the shoreline (Codd 1995 L a n d s b e r g 2 0 0 2 ) the presence of cyanotoxins in detached Cladophora mats should be investigated We conducted an assessment of the ability of Cladophora mats to sequester E coli and microcystin LR and RR in the near-shore waters of Grand Traverse Bay (7 sites) Little Traverse Bay (2 sites) and Saginaw Bay (8 sites) The sampling locations were at public beach access points where Cladophora mats have been previously observed The goals of this research were to determine the spatial and temporal variability of E coli populations in Cladophora mats in these recreational waters and if cyanotoxins (microcystin LR and RR) are sequestered in the detached algae The collection of Cladophora samples was coordinated with local beach monitoring programs to facilitate the comparison with ambient water bacteria concentrations This project provided important data for the assessment of public health impacts and the development of beach management programs to address the problems associated with Cladophora accumulations
20 Methods
21 Sampling methods
211 Sampling Design
Eight locations in Saginaw Bay seven locations in Grand Traverse Bay and two locations in Little Traverse Bay were sampled in triplicate for E coli and microcystin LR and RR during the summer of 2008 T he locations were sampled weekly for 8 weeks in June-August Gr ab samples of floating Cladophora mats were collected at each location and analyzed individually for E coli and as a composite for microcystin LR and RR Sampling dates and times were coordinated with local beach monitoring programs to facilitate the use of ambient water bacteria concentrations collected close to the time of Cladophora sampling Cladophora was collected and prepared as described by Whitman et al (2003) The use of standardized collection protocols and triplicate samples provided a high level of quality assurance and resulted in data that were appropriate for decision making and environmental assessment
212 Sampling Methods Triplicate Cladophora samples were collected at each site with an integrated collection device at 025-05 m depth (Sutherland et al 1992) The sampling locations for Grand Traverse BayLittle Traverse Bay and Saginaw Bay are shown in Figures 1 and 2 respectively Each location was marked with GPS coordinates and sampled at weekly intervals during June - August 2008 (8
3
sampling events) E coli samples were placed in sterile whirl pack bags and stored in the dark at 4ordmC A composite of the triplicate samples was placed in an amber glass jar and stored at 4ordmC for microcystin-LR and RR analysis A ll samples were returned to the laboratory and on a daily basis for further processing and storage E coli samples were analyzed within 6 hour s of collection Microcystin ndashLR and RR samples were lyophilized and stored at -30ordmC Chemical and physical parameters were monitored at each location using a Hydrolab DataSonde 4a We measured pH dissolved oxygen (DO) DO saturation temperature and specific conductance at each station
Figure 21 Grand Traverse BayLittle Traverse Bay Sampling Locations
4
Figure 22 Saginaw Bay Sampling Locations The extent of Cladophora accumulation was determined at each sampling location according to the ranking
bull 0 = No visible Cladophora bull 1 = Cladophora present in isolated pockets at one location bull 2 = Cladophora present in isolated pockets at all locations bull 3 = Cladophora residue 1 m2 in area bull 4 = Cladophora residue 1-5 m2 in area bull 5 = Cladophora gt 5 m2 in area
5
22 Analytical Methods
Laboratory procedures have been selected based on previous use for water quality investigations established ranges for accuracyprecision and limited problems related to matrix interferences A summary of analytical methods is given in Table 21 Method summaries are provided in the following sections 221 Hydrolab Methods Hydrolab measurements of pH temperature dissolved oxygen and specific conductance were conducted according to the methods in the instrument users manual (Hydrolab 1998) T he Hydrolab Datasonde 4a was calibrated in the lab prior to use in the field The instrument was placed in the water at each site and the technician waited for a s table reading of the sensors Measurements were recorded at 05 m depth at each station P recision was assessed by the measurement of field duplicates at 10 of the stations
Table 21 Laboratory Analytical Methods
222 E coli Analysis Samples of E coli were prepared by elutriation with phosphate buffer (Whitman et al 2003) One gram portions of homogenized algal samples were weighed and placed in sterile 15- milliliter (mL) centrifuge tubes Nine mL of sterile phosphate-buffered diluent water (pH 68) was added and the mixture was vigorously shaken for 2 min and then centrifuged briefly (45 s) at 2000 rpm to allow the large particles to settle The diluted sample then was analyzed by the Colilert-18 (IDEXX) using the Quanti-Tray 2000 (APHA 1998) A 1 mL aliquot was removed from the centrifuge tube and transferred to 99 mL of sterile phosphate buffer in a sterile water sampling vial The Colilert reagent then was then added to the vial and shaken until dissolved The sample and reagents were then added to the Quanti-Tray 2000 and sealed with the Quanti-Tray sealer T he tray was incubated for 18 ho urs at 35degC plusmn 05degC and read under UV light Fluorescent colonies were counted and the number of colony forming units (cfu)100 mL was calculated according to the manufacturerrsquos instructions
Parameter Preparation Preservation Holding Time Methods Reference
pH Hydrolab 1998 Dissolved Oxygen Hydrolab 1998
Temperature Hydrolab 1998 Specific conductance Hydrolab 1998
Microcystin LR and RR by LCMS
Filtration methanol extraction C-18
cartridge Freeze -30degC 6 mo Lawerence et al 2001
Boyer et al 2004
E coli Phosphate buffer extraction Cool 4degC 6 hrs
Whitman et al 2003 Colilert-18
APHA 1998
6
223 Sample Preparation for Microcystin Analysis
Water samples for the analyses of microcystin were prepared according to methods outlined by Lawerence et al (2001) A 100-500 mL aliquot was filtered through a Whatman GFC glass fiber filter The filter then was placed in a 5 mL centrifuge tube and lyophilized for 8 hours The filter residue was extracted with three successive aliquots of methanol followed by sonication The methanol extract was evaporated to dryness under nitrogen and re-dissolved in 1 mL of 50 methanol in water This mixture was passed through a 1 gram (g) SPE C-18 cartridge (Baker) that had been preconditioned with 10 mL of methanol followed by 10 mL of water The cartridge then was washed with 5 mL of 25 methanol in water and the eluted fraction was discarded The microcystins then were eluted with 4 mL of 100 methanol in water This fraction was collected and the volume reduced to 2 mL The volume was adjusted back to 3 mL with methanol and split into three 1 mL aliquots for HPLCMS analysis
244 Microcystin LR and RR by LCMS Samples for Liquid ChromatographyMass Spectrometry (LCMS) analysis were filtered using Gelman AE binderless glass fiber filters The cells were lysed by freezing and then vortexed for 5 minutes in centrifuge tubes containing 10 mL of aqueous (5050) methanol to extract toxins Suspensions were centrifuged and the supernatant was filtered through 045 micron nylon filters The concentrations of microcystin LR and RR were determined by liquid chromatography-tandem mass spectrometry using a Finnigan Surveyor MSQ LCMS Nodularin was added to the extracts and used as an internal standard Compounds were separated on a Phenomenex Luna C18 column at 50oC The mobile phase was a binary gradient of water and methanol both containing 01 formic acid T he initial gradient started with 95 water and 5 methanol followed by a step change to 50 water and 50 methanol at 3 minutes with a linear gradient from 5 t o 20 m inutes to 5 water and 95 methanol Instrument detection limits for these toxins were determined to be 1 microgramliter (microgl) For calibration a series of 5 solutions were prepared with the internal standard at 1000 microgl and the analytes in the range of 1 to 500 microgl in final volumes of 1 mL of 9010 watermethanol 30 Results The results of E coli water chemistry and microcystins data from each location are presented for Saginaw Bay and Grand Traverse BayLittle Traverse Bay in Sections 31 and 32 respectively A comparison of the two basins is provided in Section 33
31 Saginaw Bay E coli Microcystin and Water Chemistry Results
311 Wenona Beach The sampling locations for Wenona Beach are provided in Figure 311 Near-shore locations were sampled at a depth of 03 m The beach area was covered with reed canary grass sedges and cattails Cattails and detached Cladophora were common in the shallow littoral zone and the samples were collected approximately 1 meter outside of the macrophyte zone The detached
7
Cladophora also was common at the sampling locations with some areas of fresh Cladophora growing on submerged rocks and woody debris
Figure 311 Wenona Beach Sampling Locations 2008 (L= Left C=Center R=Right) The results of water and detached Cladophora analyses are summarized in Tables 311 and 312 respectively The mean E coli concentration for the study period was 14 cfu100 mL with no single beach samples exceeding 100 cfu100 mL (Table 311) Water temperatures ranged from 21degC to 25degC The mean E coli concentration for detached Cladophora was 9775 cfug dwt (Table 312) Microcystins were detected in the detached Cladophora beginning in July with mean concentrations of 47 microgg dwt 47 microgg dwt and 103 microgg dwt for microcystin RR microcystin LR and total microcystins respectively Detached Cladophora was present in
8
Table 311 Wenona Beach Water Quality Data 2008
ConductanceL C R Mean microScm
062308 10 8 18 12 792 77 21 440070108 78 44 82 68 810 78 22 470070808 3 4 2 3 814 74 23 451071508 2 1 1 1 817 75 24 450072208 5 6 1 4 816 73 24 456072908 33 8 7 16 810 72 25 453080508 4 7 4 5 813 76 24 461081208 4 2 3 3 811 79 24 467
Mean 17 10 15 14 81 76 23 456
cfu100 mlDateE coli in Water Water Chemistry
pH DO (mgl) Temp OC
Table 312 Wenona Beach Cladophora Data 2008
CladophoraL C R Mean Extent RR LR Total
062308 448 733 22507 7896 5 lt 01 lt 01 lt 01070108 800 2331 25432 9521 5 lt 01 1 lt 01070808 1279 3561 31566 12135 5 12 11 23071508 610 500 1678 929 3 15 23 38072208 1892 2000 3578 2490 5 27 34 61072908 5631 5633 64132 25132 5 68 80 148080508 6322 4531 25346 12066 5 80 80 161081208 3313 2311 18462 8029 5 82 102 184
Mean 2537 2700 24088 9775 5 47 47 103
Microcystins in Cladophora microgg dwtDate E coli in Cladophora cfug dwt
(Cladophora Extent 0 = None Present 1 = Present in isolated pockets at one location 2 = Present in isolated pockets at all locations 3 = Deposits 1 m2 in area 4= Deposits 1-5 m2 in area 5 = Deposits gt 5 m2 in area)
deposits of gt5 m2 at all locations during the sampling period (Table 312) E coli concentrations in water and detached Cladophora are displayed in Figure 312 No correlation was observed between bacterial levels in water and detached algae (Spearmanrsquos RO ρ=014) The drop in E coli levels observed on July 15 was after a storm that had occurred on July 12 A statistically significant difference was observed between beach locations for E coli concentrations in detached Cladophora (Kruskal-Wallis ρ=00004) Station R was significantly different from C and L (Mann-Whitney ρ=0012 and 0010 respectively) S tation R was the closest sampling location to the Saginaw River Station R had the highest concentration of E coli in detached Cladophora (64132 cfug dwt) This bacterial concentration was the highest level observed during the study period
9
0
1
2
3
4
5
62508 7208 7908 71608 72308 73008 8608 81308
Log
E c
oli
Con
cent
ratio
n
Water (cfu100mL)Cladophora cfug dwt
Figure 312 E coli in Detached Cladophora and Water at Wenona Beach 2008 312 Bay City Recreation Area The sampling locations for the Bay City Recreation Area are provided in Figure 313 Three near-shore locations were sampled at a depth of 03 m The beach area was sandy and appeared to be groomed Detached Cladophora was common in the shallow littoral zone and the samples were collected approximately 1 meter from shore The results of water and detached Cladophora analyses are summarized in Tables 313 and 314 respectively The mean E coli concentration for the study period was 6 cfu100 mL with no single beach sample exceeding 100 cfu100 mL (Table 313) Water temperatures ranged from 21degC to 24degC The mean E coli concentration in detached Cladophora was 3216 cfug dwt (Table 314) Microcystins were detected in the detached Cladophora beginning in June with mean concentrations of 96 microgg dwt 129 microgg dwt and 225 microgg dwt for microcystin RR microcystin LR and total microcystins respectively The highest concentrations of microcystins were found on August 12 at the Bay City Recreation area (microcystin RR 364 microgg dwt microcystin LR 349 microgg dwt and total microcystins 714 microgg dwt) Detached Cladophora covered the entire beach for all but one of the sampling events E coli concentrations in water and detached Cladophora are displayed in Figure 314 No correlation was observed between bacterial levels in the water and the detached algae (Spearmanrsquos RO ρ=008) The drop in E coli levels observed on July 15 was after a storm that had occurred on July 12 A statistically significant difference was not observed between beach locations for E coli concentrations in detached Cladophora (Kruskal-Wallis ρ=00073) Station R had the highest concentration of E coli in detached Cladophora (8923 cfug dwt)
10
Figure 313 Bay City Recreation Area Sampling Locations 2008 (L= Left C=Center R=Right)
Table 313 Bay City Recreation Area Water Quality Data 2008
ConductanceL C R Mean microScm
062308 10 8 24 14 792 77 21 420070108 1 2 6 3 811 78 22 437070808 3 4 47 18 816 75 23 445071508 2 1 1 1 816 74 23 436072208 1 1 1 1 816 73 24 436072908 4 8 1 4 812 77 24 446080508 4 7 4 5 817 78 24 448081208 1 2 1 1 811 81 24 449
Mean 3 4 11 6 811 77 23 440
E coli in Water Water Chemistry cfu100 ml pH DO (mgl) Temp OC
Date
11
Table 314 Bay City Recreation Area Cladophora Data 2008
CladophoraL C R Mean Extent RR LR Total
062308 1432 856 3456 1915 5 1 1 2070108 1333 963 2564 1620 5 2 7 9070808 4222 4563 8923 5903 5 14 33 47071508 1100 1245 1344 1230 3 32 49 81072208 1632 2000 7843 3825 5 65 99 164072908 998 5633 8564 5065 5 56 219 275080508 2331 4531 3564 3475 5 231 275 505081208 3223 2311 2564 2699 5 364 349 714
Mean 2034 2763 4853 3216 5 96 129 225
Date E coli in Cladophora cfug dwt Microcystins in Cladophora microgg dwt
(Cladophora Extent 0 = None Present 1 = Present in isolated pockets at one location 2 = Present in isolated pockets at all locations 3 = Deposits 1 m2 in area 4= Deposits 1-5 m2 in area 5 = Deposits gt 5 m2 in area)
0
1
2
3
4
5
62508 7208 7908 71608 72308 73008 8608 81308
Log
E c
oli
Con
cent
ratio
n
Water (cfu100mL)Cladophora cfug dwt
Figure 314 E coli in Detached Cladophora and Water at the Bay City Recreation Area 2008
313 Brissette Beach The sampling locations for Brissette Beach are provided in Figure 315 T hree near-shore locations were sampled at a depth of 03 m T he beach area was sandy and appeared to be groomed Detached Cladophora was common in the shallow littoral zone and the samples were collected approximately 1-2 m from shore
12
Figure 315 Brissette Beach Sampling Locations 2008 (L= Left C=Center R=Right)
The results of water and detached Cladophora analyses are summarized in Tables 315 and 316 respectively The mean E coli concentration for the study period was 7 cfu100 mL with no single beach sample exceeding 100 cfu100 mL (Table 315) Water temperatures ranged from 21degC to 24degC The mean E coli concentration in detached Cladophora was 768 cfug dwt (Table 316) Microcystins were detected in the detached Cladophora beginning in June with mean concentrations of 9 microgg dwt 15 microgg dwt and 23 microgg dwt for microcystin RR microcystin LR and total microcystins respectively Detached Cladophora was present in deposits of 1-5 m2 at all locations during the sampling period except after the storm event on July 12 (Table 316) E coli concentrations in the water and detached Cladophora are displayed in Figure 316 No correlation was observed between bacterial levels in water and detached algae (Spearmanrsquos RO ρ=083) A statistically significant difference was not observed between beach locations for E coli concentrations in detached Cladophora (Kruskal-Wallis ρ=0053) Station R had the highest concentration of E coli in detached Cladophora (1848 cfug dwt)
13
Table 315 Brissette Beach Water Quality Data 2008
ConductanceL C R Mean microScm
062308 3 2 1 2 789 77 21 400070108 15 22 35 24 812 78 22 440070808 1 1 1 1 819 75 23 433071508 2 1 3 2 812 74 23 434072208 1 1 7 3 812 73 24 444072908 16 37 16 23 818 77 24 439080508 1 2 1 1 819 78 24 445081208 1 2 6 3 813 81 24 447
Mean 5 9 9 7 812 77 23 435
E coli in Water Water Chemistry cfu100 ml pH DO (mgl) Temp OC
Date
Table 316 Brissette Beach Cladophora Data 2008
CladophoraL C R Mean Extent RR LR Total
062308 618 1045 1848 1170 4 05 07 1070108 450 533 460 481 4 01 07 1070808 655 784 989 809 4 23 37 6071508 411 333 450 398 2 09 77 9072208 644 755 877 759 4 35 131 17072908 755 766 864 795 4 18 142 16080508 644 532 436 537 4 213 285 50081208 1033 1200 1344 1192 4 388 494 88
Mean 651 744 908 768 4 9 15 23
Date E coli in Cladophora cfug dwt Microcystins in Cladophora microgg dwt
(Cladophora Extent 0 = None Present 1 = Present in isolated pockets at one location 2 = Present in isolated pockets at all locations 3 = Deposits 1 m2 in area 4= Deposits 1-5 m2 in area 5 = Deposits gt 5 m2 in area)
0
1
2
3
4
5
62508 7208 7908 71608 72308 73008 8608 81308
Log
E c
oli
Conc
entra
tion Water (cfu100mL)
Cladophora cfug dwt
Figure 316 E coli in Detached Cladophora and Water at Brissette Beach 2008
14
314 South Linwood Beach The sampling locations for South Linwood Beach are provided in Figure 317 Three near-shore locations were sampled at a depth of 03 m T he beach area was sandy and appeared to be groomed Detached Cladophora was common in the shallow littoral zone and the samples were collected approximately 1-2 m from shore
Figure 317 South Linwood Beach Sampling Locations 2008 (L= Left C=Center R=Right)
15
The results of water and detached Cladophora analyses are summarized in Tables 317 and 318 respectively The mean E coli concentration for the study period was 9 cfu100 mL with no single beach sample exceeding 100 cfu100 mL (Table 317) Water temperatures ranged from 21degC to 24degC The mean E coli concentration in detached Cladophora was 1191 cfug dwt (Table 318) Microcystins were detected in the detached Cladophora beginning in July with mean concentrations of 12 microgg dwt 15 microgg dwt and 27 micro gg dwt for microcystin RR microcystin LR and total microcystins respectively D etached Cladophora was present in deposits of 1-5 m2 at all locations during the sampling period except after the storm event on July 12 (Table 318) E coli concentrations in water and detached Cladophora are displayed in Figure 318 No correlation was observed between bacterial levels in water and detached algae (Spearmanrsquos RO ρ=0061) E coli levels in detached Cladophora were significantly higher than water concentrations (Mann-Whitney ρlt0001) A statistically significant difference was not observed between beach locations for E coli concentrations in detached Cladophora (Kruskal-Wallis ρ=00046) Station L was significantly different from C and R (Mann-Whitney ρ=00002 and 0038 respectively) Station L was the closest sampling location to a drainage ditch that enters South Linwood Beach This station had the highest concentration of E coli in detached Cladophora (4888 cfug dwt)
Table 317 South Linwood Beach Water Quality Data 2008
ConductanceL C R Mean microScm
062308 1 lt 1 1 1 792 77 21 420070108 1 2 15 6 816 77 22 433070808 1 2 2 1 815 76 23 439071508 2 1 1 1 816 76 23 448072208 1 1 10 4 819 76 24 439072908 35 66 76 59 811 76 24 446080508 1 1 1 1 811 76 24 431081208 1 2 3 2 814 77 24 431
Mean 5 11 14 9 812 76 23 436
E coli in Water Water Chemistry cfu100 ml pH DO (mgl) Temp OC
Date
Table 318 South Linwood Beach Cladophora Data 2008
CladophoraL C R Mean Extent RR LR Total
062308 1412 390 716 839 4 lt01 lt01 lt01070108 2452 60 190 901 4 lt01 lt01 lt01070808 655 784 989 809 4 15 21 4071508 150 76 89 105 2 10 25 3072208 3324 2314 1964 2534 4 13 27 4072908 2353 756 812 1307 4 164 140 30080508 1325 533 834 897 4 170 240 41081208 4888 845 674 2136 4 350 430 78
Mean 2070 720 784 1191 4 12 15 27
Date E coli in Cladophora cfug dwt Microcystins in Cladophora microgg dwt
(Cladophora Extent 0 = None Present 1 = Present in isolated pockets at one location 2 = Present in isolated pockets at all locations 3 = Deposits 1 m2 in area 4= Deposits 1-5 m2 in area 5 = Deposits gt 5 m2 in area)
16
0
1
2
3
4
5
62508 7208 7908 71608 72308 73008 8608 81308
Log
E c
oli
Con
cent
ratio
n Water (cfu100mL)Cladophora cfug dwt
Figure 318 E coli in Detached Cladophora and Water at South Linwood Beach 2008 315 Pinconning Park The sampling locations for Pinconning Park are provided in Figure 319 T hree near-shore locations were sampled at depths of 03-05 m The beach area was sandy and appeared to be groomed Station L contained open water while Stations R and L contained Typha and Scirpus Chara also was present along the lake bottom suggesting groundwater influx Detached Cladophora was found only in isolated areas of the shallow littoral zone and the samples were collected approximately 1 meter from shore The results of water and detached Cladophora analyses are summarized in Tables 319 and 3110 respectively The mean E coli concentration for the study period was 3 cfu100 mL with no single beach sample exceeding 100 cfu100 mL (Table 313) Water temperatures ranged from 21degC to 24degC The mean E coli concentration in detached Cladophora was 299 cfug dwt (Table 314) Microcystins were detected in the detached Cladophora beginning in July with mean concentrations of 07 microgg dwt 3 microgg dwt and 4 microgg dwt for microcystin RR microcystin LR and total microcystins respectively Detached Cladophora was present in isolated pockets at all locations for only 3 of the 8 s ampling periods (Table 3110) E coli concentrations in water and detached Cladophora are displayed in Figure 314 No correlation was observed between bacterial levels in water and detached algae (Spearmanrsquos RO ρ=011) The drop in E coli levels observed on July 15 was after a storm that had occurred on July 12 A statistically significant difference was not observed between beach locations for E coli concentrations in detached Cladophora (Kruskal-Wallis ρ=0073) S tation C had the highest concentration of E coli in detached Cladophora (1454 cfug dwt)
17
Figure 319 Pinconning Park Sampling Locations 2008 (L= Left C=Center R=Right)
Table 319 Pinconning Park Water Quality Data 2008
ConductanceL C R Mean microScm
062308 1 2 1 1 756 77 21 460070108 1 2 1 1 816 76 22 464070808 2 1 3 2 817 77 23 463071508 2 1 3 2 810 76 23 475072208 1 1 1 1 815 77 24 474072908 4 8 9 7 812 76 24 466080508 4 2 lt 1 2 811 76 24 470081208 1 2 9 4 815 77 24 470
Mean 2 2 3 3 806 77 23 468
E coli in Water Water Chemistry cfu100 ml pH DO (mgl) Temp OC
Date
18
Table 3110 Pinconning Park Cladophora Data 2008 (NC=No Cladophora Present NA=Not Analyzed)
Cladophora
L C R Mean Extent RR LR Total062308 NC NC NC NC 0 NA NA NA070108 NC NC NC NC 0 NA NA NA070808 NC NC NC NC 0 NA NA NA071508 NC NC NC NC 0 NA NA NA072208 NC NC NC NC 0 NA NA NA072908 50 64 40 51 2 08 12 2080508 634 1454 188 759 2 09 18 3081208 184 18 56 86 2 07 98 10
Mean 289 512 95 299 1 07 3 4
Date E coli in Cladophora cfug dwt Microcystins in Cladophora microgg dwt
(Cladophora Extent 0 = None Present 1 = Present in isolated pockets at one location 2 = Present in isolated pockets at all locations 3 = Deposits 1 m2 in area 4= Deposits 1-5 m2 in area 5 = Deposits gt 5 m2 in area)
0
1
2
3
4
5
62508 7208 7908 71608 72308 73008 8608 81308
Log
E c
oli
Con
cent
ratio
n Water (cfu100mL)Cladophora cfug dwt
Figure 3110 E coli in Detached Cladophora and Water at Pinconning Park 2008 316 Whitersquos Beach The sampling locations for Whitersquos Beach are provided in Figure 3111 Three near-shore locations were sampled at depths of 03-05 m The beach area was sandy and appeared to be groomed Station L contained open water while Stations R and C contained Scirpus Chara also was present along the lake bottom suggesting groundwater influx Detached Cladophora was only found in isolated areas of the shallow littoral zone and the samples were collected approximately 1 meter from shore The results of water and detached Cladophora analyses are summarized in Tables 3111 and 3112 respectively The mean E coli concentration for the study period was 16 cfu100 mL with no single beach sample exceeding 100 cfu100 mL (Table 3111) Water temperatures
19
Figure 3111 Whitersquos Beach Sampling Locations 2008 (L= Left C=Center R=Right) ranged from 21degC to 24degC Detached Cladophora was present in only one sample and the concentration of E coli in the algae was 130 cfug dwt (Table 3112) Microcystin LR was detected in the detached Cladophora in only one sample in August (13 microgg dwt) Detached Cladophora was present only in the August 5 s ample at Station L (Table 3110) E coli concentrations in water and detached Cladophora are displayed in Figure 3112 No correlation was observed between bacterial levels in water and detached algae (Spearmanrsquos RO ρ=0007)
20
Table 3111 Whitersquos Beach Water Quality Data 2008
ConductanceL C R Mean microScm
062308 3 8 3 5 759 77 21 430070108 4 6 5 5 815 77 22 442070808 3 4 8 5 816 76 23 435071508 2 1 2 2 816 76 23 432072208 22 16 13 17 817 77 24 440072908 4 8 6 6 814 77 24 431080508 41 73 60 58 816 77 24 449081208 32 28 42 34 810 77 24 447
Mean 14 18 17 16 808 77 23 438
E coli in Water Water Chemistry cfu100 ml pH DO (mgl) Temp OC
Date
Table 3112 Whitersquos Beach Cladophora Data 2008 (NC=No Cladophora Present NA=Not
Analyzed)
CladophoraL C R Mean Extent RR LR Total
062308 NC NC NC NC 0 NA NA NA070108 NC NC NC NC 0 NA NA NA070808 NC NC NC NC 0 NA NA NA071508 NC NC NC NC 0 NA NA NA072208 NC NC NC NC 0 NA NA NA072908 NC NC NC NC 0 NA NA NA080508 130 NC NC mdash 1 NA 13 13081208 NC NC NC NC 0 NA NA NA
Mean 130 NC NC mdash 0 NA mdash mdash
Date E coli in Cladophora cfug dwt Microcystins in Cladophora microgg dwt
(Cladophora Extent 0 = None Present 1 = Present in isolated pockets at one location 2 = Present in isolated pockets at all locations 3 = Deposits 1 m2 in area 4= Deposits 1-5 m2 in area 5 = Deposits gt 5 m2 in area)
0
1
2
3
4
5
62508 7208 7908 71608 72308 73008 8608 81308
Water (cfu100mL)Cladophora cfug dwt
Figure 3112 E coli in Detached Cladophora and Water at Whitersquos Beach 2008
Log
E c
oli C
once
ntra
tion
21
317 Arenac County Park The sampling locations for Arenac County Park are provided in Figure 3113 Three near-shore locations were sampled at a depth of 03 m T he beach area was sandy and appeared to be groomed Detached Cladophora was common in the shallow littoral zone and the samples were collected approximately 1 meter from shore
Figure 3113 Arenac County Park Sampling Locations 2008 (L= Left C=Center R=Right)
The results of water and detached Cladophora analyses are summarized in Tables 3113 and 3114 respectively The mean E coli concentration for the study period was 25 cfu100 mL with only one beach sample exceeding 100 c fu100 mL (Station L 111 cfu100 mL Table 313) Water temperatures ranged from 21degC to 25degC The mean E coli concentration in
22
Table 3113 Arenac County Park Water Quality Data 2008
ConductanceL C R Mean microScm
062308 5 2 2 3 813 115 19 310070108 45 31 94 57 817 100 19 300070808 55 42 29 42 820 106 20 284071508 2 1 9 4 815 100 20 296072208 1 3 lt1 1 812 80 21 315072908 111 87 16 71 814 112 21 280080508 3 1 NC 1 811 114 21 292081208 1 2 60 21 817 113 21 296
Mean 28 21 26 25 815 11 20 297
E coli in Water Water Chemistry cfu100 ml pH DO (mgl) Temp OC
Date
Table 3114 Arenac County Park Cladophora Data 2008
CladophoraL C R Mean Extent RR LR Total
062308 1811 1144 2699 1885 4 lt01 lt01 lt01070108 1801 1327 3258 2129 4 3 2 5070808 38 175 290 168 2 1 3 4071508 56 87 84 76 2 4 9 13072208 130 223 433 262 3 3 13 16072908 56 88 53 66 4 9 19 27080508 240 670 810 573 3 28 43 70081208 1300 1670 1890 1620 4 90 158 248
Mean 679 673 1190 847 3 20 35 55
Date E coli in Cladophora cfug dwt Microcystins in Cladophora microgg dwt
(Cladophora Extent 0 = None Present 1 = Present in isolated pockets at one location 2 = Present in isolated pockets at all locations 3 = Deposits 1 m2 in area 4= Deposits 1-5 m2 in area 5 = Deposits gt 5 m2 in area)
detached Cladophora was 847 cfug dwt (Table 3114) M icrocystins were detected in the detached Cladophora beginning in July with mean concentrations of 20 microgg dwt 35 microgg dwt and 55 microgg dwt for microcystin RR microcystin LR and total microcystins respectively Detached Cladophora was present in 1-5 m p ockets at all locations for 6 of the 8 s ampling periods (Table 3114) The beach was groomed for the July 4th holiday and the Cladophora extent decreased to being present in isolated areas for two weeks E coli concentrations in water and detached Cladophora are displayed in Figure 3114 No correlation was observed between bacterial levels in water and detached algae (Spearmanrsquos RO ρ=061) A statistically significant difference was not observed between beach locations for E coli concentrations in detached Cladophora (Kruskal-Wallis ρ=057) S tation R had the highest concentration of E coli in detached Cladophora (3258 cfug dwt)
23
0
1
2
3
4
5
62508 7208 7908 71608 72308 73008 8608 81308
Log
E c
oli
Con
cent
ratio
n Water (cfu100mL)Cladophora cfug dwt
Figure 3114 E coli in Detached Cladophora and Water at Arenac County Park 2008 318 Foster Road Beach The sampling locations for Foster Road Beach are provided in Figure 3115 Three near-shore locations were sampled at a depth of 05 m T he beach area was sandy and appeared to be groomed Detached Cladophora was common in the shallow littoral zone and the samples were collected approximately 1 meter from shore Strong wave action was observed at this location which kept the detached Cladophora suspended in the water column This was the only Saginaw Bay location where suspended Cladophora was observed The results of water and detached Cladophora analyses are summarized in Tables 3115 and 3116 respectively The mean E coli concentration for the study period was 73 cfu100 mL with only one set of beach samples averaging 315 c fu100mL (July 15 Table 3117) This sample was taken after the storm event which occurred on July 12 Water temperatures ranged from 21degC to 25degC The mean E coli concentration in detached Cladophora was 2169 cfug dwt (Table 3116) Microcystins were detected in the detached Cladophora beginning in July with mean concentrations of 36 microgg dwt 41 microgg dwt and 77 microgg dwt for microcystin RR microcystin LR and total microcystins respectively D etached Cladophora was present throughout the water column during the first three weeks not present on July 15 (after the storm) and present only in isolated pockets during the remainder of the sampling period (Table 3116) E coli concentrations in water and detached Cladophora are displayed in Figure 3118 N o correlation was observed between bacterial levels in water and detached algae (Spearmanrsquos RO ρ=078) A statistically significant difference was not observed between beach locations for E coli concentrations in detached Cladophora (Kruskal-Wallis ρ=090) Station L had the highest concentration of E coli in detached Cladophora (7332 cfug dwt)
24
Figure 3115 Foster Road Beach Sampling Locations 2008 (L= Left C=Center R=Right)
Table 3115 Foster Road Beach Water Quality Data 2008
ConductanceL C R Mean microScm
062308 1 2 5 3 792 77 21 376070108 60 21 23 35 818 76 22 382070808 55 140 181 125 815 75 23 442071508 320 400 225 315 815 74 23 436072208 1 2 3 2 812 73 24 447072908 25 31 50 35 820 77 24 436080508 22 21 7 17 814 78 24 447081208 46 51 71 56 811 81 24 450
Mean 66 84 71 73 812 76 23 427
E coli in Water Water Chemistry cfu100 ml pH DO (mgl) Temp OC
Date
25
Table 3116 Foster Road Beach Cladophora Data 2008 (NC=No Cladophora Present NA=Not Analyzed)
Cladophora
L C R Mean Extent RR LR Total062308 1380 2760 1515 1885 5 lt01 lt01 lt01070108 4554 7010 5346 5637 5 lt01 1 1070808 6731 5893 7332 6652 5 12 11 23071508 NC NC NC NC 0 NA NA NA072208 150 230 320 233 2 27 34 61072908 230 156 240 209 2 68 80 148080508 213 270 189 224 2 80 80 161081208 332 380 320 344 2 82 102 184
Mean 1941 2386 2180 2169 3 36 41 77
Date E coli in Cladophora cfug dwt Microcystins in Cladophora microgg dwt
(Cladophora Extent 0 = None Present 1 = Present in isolated pockets at one location 2 = Present in isolated pockets at all locations 3 = Deposits 1 m2 in area 4= Deposits 1-5 m2 in area 5 = Deposits gt 5 m2 in area)
0
1
2
3
4
5
62508 7208 7908 71608 72308 73008 8608 81308
Log
E c
oli
Con
cent
ratio
n Water (cfu100mL)Cladophora cfug dwt
Figure 3116 E coli in Detached Cladophora and Water at Foster Road Beach 2008
32 Grand Traverse Bay and Little Traverse Bay E coli Microcystin and Water Chemistry Results
321 Petoskey State Park The sampling locations for Petoskey State Park are provided in Figure 321 Three near-shore locations were sampled at a depth of 03 m T he beach area was sandy and appeared to be natural Detached Cladophora was present in isolated pockets in the shallow littoral zone and the samples were collected approximately 1 meter from shore
26
Figure 321 Petoskey State Park Sampling Locations 2008 (L= Left C=Center R=Right) The results of water and detached Cladophora analyses are summarized in Tables 321 and 322 respectively The mean E coli concentration for the study period was 13 cfu100 mL with no single beach sample exceeding 100 cfu100 mL (Table 321) Water temperatures ranged from 19degC to 21degC The mean E coli concentration in detached Cladophora was 1117 cfug dwt (Table 322) M icrocystins were not detected in the detached Cladophora Detached Cladophora was present in isolated pockets at all locations for only 2 of the 8 sampling periods (Table 322) E coli concentrations in water and detached Cladophora are displayed in Figure 322 N o correlation was observed between bacterial levels in water and detached algae (Spearmanrsquos RO ρ=059) A statistically significant difference was not observed between beach locations for E coli concentrations in detached Cladophora (Kruskal-Wallis ρ=0058) Station R had the highest concentration of E coli in detached Cladophora (1600 cfug dwt)
27
Table 321 Petoskey State Park Water Quality Data 2008
ConductanceL C R Mean microScm
062308 6 3 2 4 800 105 19 303070108 89 55 73 72 823 109 19 296070808 2 3 3 3 813 110 19 300071508 3 6 6 5 815 105 20 295072208 4 7 5 5 824 104 21 300072908 16 12 5 11 818 108 21 298080508 1 1 1 1 814 104 21 300081208 6 3 1 4 807 107 21 297
Mean 16 11 12 13 814 106 20 299
E coli in Water Water Chemistry cfu100 ml pH DO (mgl) Temp OC
Date
Table 322 Petoskey State Park Cladophora Data 2008 (NC=No Cladophora Present NA=Not Analyzed)
Cladophora
L C R Mean Extent RR LR Total062308 990 1200 1100 1097 2 lt01 lt01 lt01070108 1455 1390 1543 1463 2 lt01 lt01 lt01070808 NC NC 1200 1200 1 lt01 lt01 lt01071508 NC 1423 NC 1423 1 lt01 lt01 lt01072208 NC 556 NC 556 1 lt01 lt01 lt01072908 NC NC 1600 1600 1 lt01 lt01 lt01080508 1200 NC NC 1200 1 lt01 lt01 lt01081208 NC NC 400 400 1 lt01 lt01 lt01
Mean 1215 1142 1169 1117 1 lt01 lt01 lt01
Date E coli in Cladophora cfug dwt Microcystins in Cladophora microgg dwt
(Cladophora Extent 0 = None Present 1 = Present in isolated pockets at one location 2 = Present in isolated pockets at all locations 3 = Deposits 1 m2 in area 4= Deposits 1-5 m2 in area 5 = Deposits gt 5 m2 in area)
0
1
2
3
4
5
62508 7208 7908 71608 72308 73008 8608 81308
Water (cfu100mL)Cladophora cfug dwt
Figure 322 E coli in Detached Cladophora and Water at Petoskey State Park 2008
Log
E c
oli C
once
ntra
tion
28
322 Magnus Park The sampling locations for Magnus Park are provided in Figure 323 The beach area was sandy and appeared to be natural Detached Cladophora was present in isolated pockets in the shallow littoral zone and the samples were collected approximately 1 meter from shore
Figure 323 Magnus Park Sampling Locations 2008 (L= Left C=Center R=Right) The results of water and detached Cladophora analyses are summarized in Tables 323 and 324 respectively The mean E coli concentration for the study period was 17 cfu100 mL with one beach sample exceeding 100 c fu100 mL (120 cfu100 mL Table 323) W ater temperatures ranged from 19degC to 21degC T he mean E coli concentration in detached Cladophora was 1554 cfug dwt (Table 324) Microcystins were not detected in the detached Cladophora Detached Cladophora was present in isolated pockets at one location for 4 of the 8 sampling periods (Table 324) E coli concentrations in water and detached Cladophora are displayed in Figure 324 N o correlation was observed between bacterial levels in water and detached algae (Spearmanrsquos RO ρ=059) A statistically significant difference was not observed between beach locations for E coli concentrations in detached Cladophora (Kruskal-Wallis ρ=0054) Station R had the highest concentration of E coli in detached Cladophora (2368 cfug dwt)
29
Table 323 Magnus Park Water Quality Data 2008
ConductanceL C R Mean microScm
062308 5 3 2 3 803 108 19 295070108 2 3 2 2 813 105 19 297070808 77 120 76 91 817 110 19 305071508 1 3 6 3 804 106 20 301072208 6 3 2 4 813 110 21 299072908 9 3 11 8 821 108 21 295080508 4 16 15 12 824 110 21 297081208 18 10 15 14 810 102 21 300
Mean 15 20 16 17 813 107 20 299
E coli in Water Water Chemistry cfu100 ml pH DO (mgl) Temp OC
Date
Table 324 Magnus Park Cladophora Data 2008 (NC=No Cladophora Present NA=Not
Analyzed)
CladophoraL C R Mean Extent RR LR Total
062308 2368 NC 3321 2845 1 lt01 lt01 lt01070108 NC NC NC NC 0 NC NC NC070808 NC NC 1200 1200 1 lt01 lt01 lt01071508 NC NC NC NC 0 NC NC NC072208 NC NC NC NC 0 NC NC NC072908 NC NC 1300 1300 1 lt01 lt01 lt01080508 NC NC NC NC 0 NC NC NC081208 NC NC 870 870 1 lt01 lt01 lt01
Mean 2368 NC 1673 1554 1 lt01 lt01 lt01
Date E coli in Cladophora cfug dwt Microcystins in Cladophora microgg dwt
(Cladophora Extent 0 = None Present 1 = Present in isolated pockets at one location 2 = Present in isolated pockets at all locations 3 = Deposits 1 m2 in area 4= Deposits 1-5 m2 in area 5 = Deposits gt 5 m2 in area)
0
1
2
3
4
5
62508 7208 7908 71608 72308 73008 8608 81308
Water (cfu100mL)Cladophora cfug dwt
Figure 324 E coli in Detached Cladophora and Water at Magnus Park 2008
Log
E c
oli C
once
ntra
tion
30
323 Elk Rapids Park The sampling locations for Elk Rapids Park are provided in Figure 325 The beach area was sandy and appeared to be natural Detached Cladophora was present in isolated pockets in the shallow littoral zone and the samples were collected approximately 1 meter from shore
Figure 325 Elk Rapids Park Sampling Locations 2008 (L= Left C=Center R=Right)
The results of water and detached Cladophora analyses are summarized in Tables 325 and 326 respectively The mean E coli concentration for the study period was 74 cfu100 mL with two sets of beach samples exceeding 100 c fu100 mL (134 cfu100 mL and 292 c fu100 mL Table 325) Water temperatures ranged from 19degC to 21degC The mean E coli concentration in detached Cladophora was 1225 cfug dwt (Table 326) Microcystins were not detected in the detached Cladophora Detached Cladophora was present in isolated pockets at more than one location for 6 of the 8 sampling periods (Table 316) E coli concentrations in water and detached Cladophora are displayed in Figure 314 N o correlation was observed between bacterial levels in water and detached algae (Spearmanrsquos RO ρ=018) A statistically significant difference was observed between beach locations for E coli concentrations in detached Cladophora (Kruskal-Wallis ρ=0030) Station R was significantly different from C and L (Mann-Whitney ρ=0005 and 0003 respectively) Station R was the closest sampling location
31
Table 325 Elk Rapids Park Water Quality Data 2008
ConductanceL C R Mean microScm
062308 155 390 330 292 827 100 19 297070108 23 16 54 31 814 109 19 301070808 44 13 27 28 811 108 19 297071508 22 56 70 49 813 109 20 301072208 57 25 22 35 812 101 21 275072908 90 145 166 134 805 109 21 297080508 4 1 21 9 801 107 21 281081208 25 19 7 17 810 102 21 302
Mean 53 83 87 74 812 11 20 294
E coli in Water Water Chemistry cfu100 ml pH DO (mgl) Temp OC
Date
Table 326 Elk Rapids Park Cladophora Data 2008 (NC=No Cladophora Present NA=Not Analyzed)
Cladophora
L C R Mean Extent RR LR Total062308 724 4111 6900 3912 2 lt01 lt01 lt01070108 322 858 3754 1645 2 lt01 lt01 lt01070808 NC NC 770 770 1 lt01 lt01 lt01071508 NC NC 840 840 1 lt01 lt01 lt01072208 569 670 440 560 2 lt01 lt01 lt01072908 430 1100 1600 1043 2 lt01 lt01 lt01080508 500 700 344 515 2 lt01 lt01 lt01081208 330 448 780 519 2 lt01 lt01 lt01
Mean 479 1314 1928 1225 2 lt01 lt01 lt01
Date E coli in Cladophora cfug dwt Microcystins in Cladophora microgg dwt
(Cladophora Extent 0 = None Present 1 = Present in isolated pockets at one location 2 = Present in isolated pockets at all locations 3 = Deposits 1 m2 in area 4= Deposits 1-5 m2 in area 5 = Deposits gt 5 m2 in area)
0
1
2
3
4
5
62508 7208 7908 71608 72308 73008 8608 81308
Water (cfu100mL)Cladophora cfug dwt
Figure 326 E coli in Detached Cladophora and Water at the Elk Rapids Park 2008
Log
E c
oli C
once
ntra
tion
32
location to the creek which drains a duck pond ne ar the city S tation R had the highest concentration of E coli in detached Cladophora (6900 cfug dwt) 324 Antrim County Day Park The sampling locations for Antrim County Day Park are provided in Figure 327 Three near-shore locations were sampled at a depth of 03 m The beach area was sandy and appeared to be natural Detached Cladophora was common in the shallow littoral zone and the samples were collected approximately 1 meter from shore
Figure 327 Antrim County Day Park Sampling Locations 2008 (L= Left C=Center R=Right)
The results of water and detached Cladophora analyses are summarized in Tables 327 and 328 respectively The mean E coli concentration for the study period was 25 cfu100 mL with one beach sample exceeding 100 c fu100 mL (111 cfu100 mL Table 327) W ater
33
temperatures ranged from 19degC to 21degC T he mean E coli concentration in detached Cladophora was 350 cfug dwt (Table 328) Microcystins were not detected in the detached Cladophora Detached Cladophora was either absent or present in isolated pockets at one location for 7 of the 8 sampling periods and at 2 l ocations during 1 sampling period (Table 318) E coli concentrations in water and detached Cladophora are displayed in Figure 328 No correlation was observed between bacterial levels in water and detached algae (Spearmanrsquos RO ρ=068) A statistically significant difference was not observed between beach locations for E coli concentrations in detached Cladophora (Kruskal-Wallis ρ=027) S tation R had the highest concentration of E coli in detached Cladophora (660 cfug dwt)
Table 327 Antrim County Day Park Water Quality Data 2008
ConductanceL C R Mean microScm
062308 5 2 2 3 813 115 19 310070108 45 31 94 57 817 100 19 300070808 55 42 29 42 820 106 20 284071508 2 1 9 4 815 100 20 296072208 1 3 lt1 1 812 80 21 315072908 111 87 16 71 814 112 21 280080508 3 1 NC 1 811 114 21 292081208 1 2 60 21 817 113 21 296
Mean 28 21 26 25 815 11 20 297
E coli in Water Water Chemistry cfu100 ml pH DO (mgl) Temp OC
Date
Table 328 Antrim County Day Park Cladophora Data 2008 (NC=No Cladophora Present NA=Not Analyzed)
Cladophora
L C R Mean Extent RR LR Total062308 79 61 660 267 2 lt01 lt01 lt01070108 NC NC NC NC 0 NA NA NA070808 NC NC NC NC 0 NA NA NA071508 NC NC NC NC 0 NA NA NA072208 NC NC 440 440 1 NA lt01 NA072908 NC NC NC NC 0 NA NA NA080508 NC NC 344 344 1 NA lt01 NA081208 NC NC NC NC 0 NA NA NA
Mean mdash mdash 481 350 1 mdash lt01 mdash
Date E coli in Cladophora cfug dwt Microcystins in Cladophora microgg dwt
(Cladophora Extent 0 = None Present 1 = Present in isolated pockets at one location 2 = Present in isolated pockets at all locations 3 = Deposits 1 m2 in area 4= Deposits 1-5 m2 in area 5 = Deposits gt 5 m2 in area)
34
0
1
2
3
4
5
62508 7208 7908 71608 72308 73008 8608 81308
Water (cfu100mL)Cladophora cfug dwt
Figure 328 E coli in Detached Cladophora and Water at the Antrim County Day Park 2008
325 East Bay Park The sampling locations for East Bay Park are provided in Figure 329 Three near-shore locations were sampled at depths of 03-05 m The beach area was sandy and appeared to be natural S tation L contained open water while Stations R and C contained Scirpus Detached Cladophora was found at all of the shallow littoral zone locations and the samples were collected approximately 1 meter from shore The results of water and detached Cladophora analyses are summarized in Tables 329 and 3210 respectively The mean E coli concentration for the study period was 25 cfu100 mL with one sample exceeding 100 cfu100 mL (103 cfu100 mL Table 329) Water temperatures ranged from 19degC to 21degC The mean E coli concentration in detached Cladophora was 969 cfug dwt (Table 3210) M icrocystins were not detected in the detached Cladophora Detached Cladophora was present in isolated pockets at more than one location for all of the 8 sampling periods (Table 3210) E coli concentrations in water and detached Cladophora are displayed in Figure 3210 No correlation was observed between bacterial levels in water and detached algae (Spearmanrsquos RO ρ=012) A statistically significant difference was not observed between beach locations for E coli concentrations in detached Cladophora (Kruskal-Wallis ρ=041) Station L had the highest E coli concentration in detached Cladophora (5000 cfug dwt) Station L was the closest sampling location to a storm-water outlet entering Grand Traverse Bay
Log
E c
oli C
once
ntra
tion
35
Figure 329 East Bay Park Sampling Locations 2008 (L= Left C=Center R=Right)
Table 329 East Bay Park Water Quality Data 2008
ConductanceL C R Mean microScm
062308 2 1 3 2 821 106 19 299070108 5 3 NC 3 821 104 19 300070808 4 7 14 8 807 105 19 320071508 17 41 21 26 807 103 20 310072208 41 91 103 78 804 101 21 330072908 51 92 61 68 819 102 21 324080508 8 4 11 8 805 103 21 309081208 7 2 1 8 809 108 21 317
Mean 17 30 27 25 812 10 20 314
E coli in Water Water Chemistry cfu100 ml pH DO (mgl) Temp OC
Date
36
Table 3210 East Bay Park Cladophora Data 2008 (NC=No Cladophora Present NA=Not Analyzed)
Cladophora
L C R Mean Extent RR LR Total062308 5000 2000 1000 2667 3 lt01 lt01 lt01070108 3300 1500 900 1900 3 lt01 lt01 lt01070808 660 500 460 540 3 lt01 lt01 lt01071508 546 600 NC 573 2 lt01 lt01 lt01072208 340 500 600 480 3 lt01 lt01 lt01072908 700 630 NC 665 2 lt01 lt01 lt01080508 935 500 700 712 3 lt01 lt01 lt01081208 325 330 NC 218 2 lt01 lt01 lt01
Mean 1476 820 732 969 3 lt01 lt01 lt01
Date E coli in Cladophora cfug dwt Microcystins in Cladophora microgg dwt
(Cladophora Extent 0 = None Present 1 = Present in isolated pockets at one location 2 = Present in isolated pockets at all locations 3 = Deposits 1 m2 in area 4= Deposits 1-5 m2 in area 5 = Deposits gt 5 m2 in area)
0
1
2
3
4
5
62508 7208 7908 71608 72308 73008 8608 81308
Log
E c
oli C
once
ntra
tion
Water (cfu100mL)Cladophora cfug dwt
Figure 3210 E coli in Detached Cladophora and Water at East Bay Park 2008 326 Traverse City State Park The sampling locations for Traverse City State Park are provided in Figure 3211 Three near-shore locations were sampled at a depth of 03 m The beach area was sandy and appeared to be natural Detached Cladophora was present in isolated pockets in the shallow littoral zone near Mitchell Creek and the samples were collected approximately 1 meter from shore
37
Figure 3211 Traverse City State Park Sampling Locations 2008 (L= Left C=Center R=Right)
The results of water and detached Cladophora analyses are summarized in Tables 3211 and 3212 respectively The mean E coli concentration for the study period was 33 cfu100 mL with one sample exceeding 100 cfu100 mL (195 cfu100 mL Table 3211) W ater temperatures ranged from 19degC to 21degC Station L was the only location at this beach with detached Cladophora and the associated E coli concentrations averaged 1630 cfug dwt The highest concentration E coli in detached Cladophora was 3300 cfug dwt This station was the closest sampling location to Mitchell Creek which has a history of bacterial contamination problems (The Watershed Center 2006) Microcystins were not detected in the detached Cladophora Detached Cladophora was present in isolated pockets at one location for all of the 8 sampling periods (Table 3212) E coli concentrations in water and detached Cladophora are displayed in Figure 3212 No correlation was observed between bacterial levels in water and detached algae (Spearmanrsquos RO ρ=015) A statistically significant difference was observed between beach locations for E coli concentrations in detached Cladophora (Kruskal-Wallis ρ=0001)
38
Table 3211 Traverse City State Park Water Quality Data 2008
ConductanceL C R Mean microScm
062308 1 4 NC 2 816 107 19 301070108 3 5 10 6 815 101 19 305070808 195 37 66 99 815 105 19 296071508 22 48 63 44 820 104 20 297072208 95 88 57 80 801 108 21 299072908 19 10 5 11 802 102 21 300080508 18 14 11 14 825 108 21 294081208 8 6 5 6 805 106 21 294
Mean 45 27 31 33 812 105 20 298
DateE coli in Water Water Chemistry
cfu100 ml pH DO (mgl) Temp OC
Table 3212 Traverse City State Park Cladophora Data 2008 (NC=No Cladophora Present NA=Not Analyzed)
Cladophora
L C R Mean Extent RR LR Total062308 2000 NC NC mdash 1 lt01 lt01 lt01070108 3300 NC NC mdash 1 lt01 lt01 lt01070808 900 NC NC mdash 1 lt01 lt01 lt01071508 750 NC NC mdash 1 lt01 lt01 lt01072208 1200 NC NC mdash 1 lt01 lt01 lt01072908 700 NC NC mdash 1 lt01 lt01 lt01080508 990 NC NC mdash 1 lt01 lt01 lt01081208 3200 NC NC mdash 1 lt01 lt01 lt01
Mean 1630 NC NC mdash 1 lt01 lt01 lt01
Date E coli in Cladophora cfug dwt Microcystins in Cladophora microgg dwt
(Cladophora Extent 0 = None Present 1 = Present in isolated pockets at one location 2 = Present in isolated pockets at all locations 3 = Deposits 1 m2 in area 4= Deposits 1-5 m2 in area 5 = Deposits gt 5 m2 in area)
0
1
2
3
4
5
62508 7208 7908 71608 72308 73008 8608 81308
Water (cfu100mL)Cladophora cfug dwt
Figure 3212 E coli in Detached Cladophora and Water at Traverse City State Park 2008
Log
E c
oli C
once
ntra
tion
39
327 Bryant Park The sampling locations for Bryant Park are provided in Figure 3213 T hree near-shore locations were sampled at a depth of 03 m T he beach area was sandy and appeared to be natural Detached Cladophora was common in the shallow littoral zone and the samples were collected approximately 1 meter from shore
Figure 3213 Bryant Park Sampling Locations 2008 (L= Left C=Center R=Right)
40
The results of water and detached Cladophora analyses are summarized in Tables 3213 and 3214 respectively The mean E coli concentration for the study period was 46 cfu100 mL with one set of samples exceeding 100 cfu100 mL (281 cfu100 mL Table 3213) W ater temperatures ranged from 19degC to 21degC T he mean E coli concentration in detached Cladophora was 1873 cfug dwt (Table 3214) Microcystins were not detected in the detached Cladophora Detached Cladophora was present in isolated pockets at one location for all of the 8 sampling periods (Table 3214) E coli concentrations in water and detached Cladophora are displayed in Figure 3214 No correlation was observed between bacterial levels in water and detached algae (Spearmanrsquos RO ρ=082) A statistically significant difference was not observed between beach locations for E coli concentrations in detached Cladophora (Kruskal-Wallis ρ=048) Station C had the highest concentration of E coli in detached Cladophora (9460 cfug dwt)
Table 3213 Bryant Park Water Quality Data 2008
ConductanceL C R Mean microScm
062308 3 4 11 6 825 105 19 296070108 6 8 5 6 800 102 19 301070808 290 310 243 281 824 100 19 300071508 8 9 4 7 819 106 20 298072208 6 8 3 6 813 103 21 300072908 11 13 22 15 811 104 21 297080508 12 18 15 15 815 107 21 317081208 33 29 1 28 805 101 21 299
Mean 46 50 38 46 814 103 20 301
E coli in Water Water Chemistry cfu100 ml pH DO (mgl) Temp OC
Date
Table 3214 Bryant Park Cladophora Data 2008 (NC=No Cladophora Present NA=Not Analyzed)
Cladophora
L C R Mean Extent RR LR Total062308 980 9460 680 3707 2 lt01 lt01 lt01070108 977 7690 490 3052 2 lt01 lt01 lt01070808 3443 1462 2741 2549 2 lt01 lt01 lt01071508 1300 1800 1567 1556 2 lt01 lt01 lt01072208 990 832 751 858 2 lt01 lt01 lt01072908 111 1643 1565 1106 2 lt01 lt01 lt01080508 1245 890 1443 1193 2 lt01 lt01 lt01081208 1122 844 922 963 2 lt01 lt01 lt01
Mean 1271 3078 1270 1873 2 lt01 lt01 lt01
Date E coli in Cladophora cfug dwt Microcystins in Cladophora microgg dwt
(Cladophora Extent 0 = None Present 1 = Present in isolated pockets at one location 2 = Present in isolated pockets at all locations 3 = Deposits 1 m2 in area 4= Deposits 1-5 m2 in area 5 = Deposits gt 5 m2 in area)
41
0
1
2
3
4
5
62508 7208 7908 71608 72308 73008 8608 81308
Water (cfu100mL)Cladophora cfug dwt
Figure 3214 E coli in Detached Cladophora and Water at Bryant Park 2008 328 Clinch Park The sampling locations for Clinch Park are provided in Figure 3215 T hree near-shore locations were sampled at a depth of 03 m T he beach area was sandy and appeared to be natural Detached Cladophora was present at one location during the last sampling event The sample was collected approximately 05 m from shore The results of water and detached Cladophora analyses are summarized in Tables 3215 and 3216 respectively The mean E coli concentration for the study period was 35 cfu100 mL with one set of samples exceeding 100 cfu100 mL (164 cfu100 mL Table 3215) W ater temperatures ranged from 19degC to 21degC D etached Cladophora was present in an isolated pocket at one location during the August 12 sampling event (Table 3216) E coli was present in detached Cladophora in this sample at a concentration of 680 c fug dwt (Table 3216) Microcystins were not detected in the detached Cladophora E coli concentrations in water and detached Cladophora are displayed in Figure 3216 N o correlation was observed between bacterial levels in water and detached algae (Spearmanrsquos RO ρ=099)
Log
E c
oli C
once
ntra
tion
42
Figure 3215 Clinch Park Sampling Locations 2008 (L= Left C=Center R=Right)
Table 3215 Clinch Park Water Quality Data 2008
ConductanceL C R Mean microScm
062308 22 14 11 16 828 105 19 296070108 1 3 NC 1 801 109 19 300070808 33 19 30 27 805 101 19 310071508 21 18 32 24 816 107 20 302072208 155 170 167 164 802 103 21 302072908 43 21 37 34 801 104 21 307080508 11 7 18 12 830 102 21 299081208 4 2 1 3 822 104 21 298
Mean 36 32 37 35 813 104 20 302
E coli in Water Water Chemistry cfu100 ml pH DO (mgl) Temp OC
Date
43
Table 3216 Clinch Park Cladophora Data 2008 (NC=No Cladophora Present NA=Not Analyzed)
Cladophora
L C R Mean Extent RR LR Total062308 NC NC NC NC 0 lt01 lt01 lt01070108 NC NC NC NC 0 lt01 lt01 lt01070808 NC NC NC NC 0 lt01 lt01 lt01071508 NC NC NC NC 0 lt01 lt01 lt01072208 NC NC NC NC 0 lt01 lt01 lt01072908 NC NC NC NC 0 lt01 lt01 lt01080508 NC NC NC NC 0 lt01 lt01 lt01081208 NC NC 680 680 1 lt01 lt01 lt01
Mean NC NC 680 680 0 lt01 lt01 lt01
Date E coli in Cladophora cfug dwt Microcystins in Cladophora microgg dwt
(Cladophora Extent 0 = None Present 1 = Present in isolated pockets at one location 2 = Present in isolated pockets at all locations 3 = Deposits 1 m2 in area 4= Deposits 1-5 m2 in area 5 = Deposits gt 5 m2 in area)
0
1
2
3
4
5
62508 7208 7908 71608 72308 73008 8608 81308
Water (cfu100mL)Cladophora cfug dwt
Figure 3216 E coli in Detached Cladophora and Water at Clinch Park 2008 329 West End Beach The sampling locations for West End Beach are provided in Figure 3217 T hree near-shore locations were sampled at a depth of 03 m T he beach area was sandy and appeared to be natural Detached Cladophora was common in the shallow littoral zone and the samples were collected approximately 1 meter from shore This beach appeared to be used by pet owners as dogs were frequently present during sampling
Log
E c
oli C
once
ntra
tion
44
Figure 3217 West End Beach Sampling Locations 2008 (L= Left C=Center R=Right)
The results of water and detached Cladophora analyses are summarized in Tables 3217 and 3218 respectively The mean E coli concentration for the study period was 35 cfu100 mL with no samples exceeding 100 c fu100 mL (Table 3217) W ater temperatures ranged from 19degC to 21degC T he mean E coli concentration in detached Cladophora was 2976 cfug dwt (Table 3218) M icrocystins were not detected in the detached Cladophora Detached Cladophora was present in isolated pockets at all locations for 4 of the 8 sampling periods (Table 3218) E coli concentrations in water and detached Cladophora are displayed in Figure 3218 N o correlation was observed between bacterial levels in water and detached algae (Spearmanrsquos RO ρ=028) A statistically significant difference was not observed between beach locations for E coli concentrations in detached Cladophora (Kruskal-Wallis ρ=079) Station C was higher than the other stations with respect to mean E coli concentrations in detached Cladophora (3078 cfug dwt) The highest concentration of E coli in detached Cladophora measured during the study period in Grand Traverse Bay was at West End Beach (22874 cfug dwt at Station C) Dogs frequently were present on this beach at the time of sampling which may be the source of the high bacteria concentrations
45
Table 3217 West End Beach Water Quality Data 2008
ConductanceL C R Mean microScm
062308 5 3 4 4 821 103 19 302070108 3 1 2 2 829 110 19 297070808 34 55 48 46 807 100 19 303071508 46 33 25 35 803 108 20 301072208 66 86 126 93 804 105 21 297072908 6 14 5 8 825 106 21 294080508 100 94 49 81 827 107 21 306081208 22 10 1 14 827 107 21 297
Mean 35 37 33 35 818 106 20 300
E coli in Water Water Chemistry cfu100 ml pH DO (mgl) Temp OC
Date
Table 3218 West End Beach Cladophora Data 2008 (NC=No Cladophora Present NA=Not Analyzed)
Cladophora
L C R Mean Extent RR LR Total062308 1509 76 289 625 2 lt01 lt01 lt01070108 1721 22874 13337 12644 2 lt01 lt01 lt01070808 1016 NC NC 1016 1 lt01 lt01 lt01071508 NC NC 1644 1644 1 lt01 lt01 lt01072208 NC NC NC NC 0 NA NA NA072908 NC NC NC NC 0 NA NA NA080508 1300 1233 1567 1367 2 lt01 lt01 lt01081208 678 444 567 563 2 lt01 lt01 lt01
Mean 1245 6157 3481 2976 1 lt01 lt01 lt01
Date E coli in Cladophora cfug dwt Microcystins in Cladophora microgg dwt
(Cladophora Extent 0 = None Present 1 = Present in isolated pockets at one location 2 = Present in isolated pockets at all locations 3 = Deposits 1 m2 in area 4= Deposits 1-5 m2 in area 5 = Deposits gt 5 m2 in area)
0
1
2
3
4
5
62508 7208 7908 71608 72308 73008 8608 81308
Water (cfu100mL)Cladophora cfug dwt
Figure 3218 E coli in Detached Cladophora and Water at West End Beach 2008
Log
E c
oli C
once
ntra
tion
46
33 Saginaw Bay and Grand Traverse BayLittle Traverse Bay Comparisons
A summary of the project data is presented in Table 331 Mean temperatures for Saginaw Bay were higher than in Grand Traverse BayLittle Traverse Bay (23degC and 20degC respectively) Microcystins in detached Cladophora were absent in Grand Traverse BayLittle Traverse Bay In Saginaw Bay the grand mean of all locations with detached Cladophora was 57 microgg dwt for the study period M ean concentrations of E coli in water were significantly higher (Mann-Whitney ρ=0003) in Grand Traverse BayLittle Traverse Bay (34 cfu100 mL) than in Saginaw Bay (18 cfu100 mL) In contrast mean E coli concentrations in detached Cladophora were higher in Saginaw Bay (2796 cfug dwt) than Grand Traverse BayLittle Traverse Bay (1775 cfug dwt) however the difference was not statistically significant (Mann-Whitney ρ=040) The mean Cladophora extent score for Grand Traverse BayLittle Traverse Bay was 1 indicating that detached algae were found in small pockets T he mean Cladophora extent score for Saginaw Bay was 3 indicating that detached algae were found in 1 m2 deposits
Table 331 Summary of Water Quality and Cladophora Data for Grand Traverse BayLittle Traverse Bay and Saginaw Bay 2008
Parameter Saginaw Bay Grand TraverseLittle Traverse Bay
Mean Temperature 23degC 20degC Mean Total Microcystins 57 microgg dwt lt01 microgg dwt Cladophora Extent Score 3 1 Mean E coli in Water 18 cfu100 mL 34 cfu100 mL Mean E coli in Cladophora 2796 cfug dwt 1775 cfug dwt
(Cladophora Extent 0 = None Present 1 = Present in isolated pockets at one location 2 = Present in isolated pockets at all locations 3 = Deposits 1 m2 in area 4= Deposits 1-5 m2 in area 5 = Deposits gt 5 m2 in area)
40 Discussion The presence of Cladophora has been associated with high levels of E coli and species of potentially pathogenic enteric bacteria in beach sand and swimming waters of the Great Lakes (Whitman et al 2003 Ishii et al 2006 Olapade et al 2006) Enteric bacteria can grow within detached Cladophora under certain conditions (Byappanahalli et al 2005) In addition detached Cladophora deposits can potentially harbor and enhance the survival of pathogenic bacteria released into the environment through point and non-point sources (Byappanahalli et al 2005) Recently Clostridium was found to grow in detached Cladophora in the Great Lakes (Byappanahalli and Whitman 2009) Algal species including Cladophora have been reported to provide nutrients and to protect attached bacteria from environmental stresses desiccation predation and harmful UV radiation (Byappanahalli et al 2005) In this manner Cladophora mats may play a significant role as a source and sink for pathogens in the near-shore environment Based on the results from this investigation Saginaw Bay appears to be more heavily impacted by detached Cladophora than Grand Traverse BayLittle Traverse Bay Eutrophication of lakes has been associated with increases in Cladophora mat production and accumulation (Stevenson et al 2006 Herbst 1969) but water transparency also has been suggested as an important causative factor (Barbiero et al 2006 Bootsma 2007) Elevated levels of nutrients in Saginaw Bay have been reported to stimulate blooms of cyanobacteria in Saginaw Bay and also influence the near-shore environment (Fahnenstiel et al 2008 Millie et al
47
2008) Differences in Cladophora accumulation between the Lake Huron and Lake Michigan sites may be attributed to higher total phosphorus levels (18 microgl vs 5 microgl MDNRE 2006) Levels of E coli in detached Cladophora in both systems were similar to concentrations previously reported in the Great Lakes (3 log10 - 5 log10 Engelbert et al 2008) In Saginaw Bay the highest levels of E coli in detached Cladophora were consistently found at locations near the Saginaw River (Wenona Beach and the Bay City Recreation Area) E ven within individual sites locations near tributaries and drains at Wenona Beach and South Linwood Beach were significantly higher than locations farther away form a point source This relationship also was noted in Grand Traverse Bay where the location near Mitchell Creek at the Traverse City State Park had elevated E coli concentrations in detached Cladophora compared to the other two beach stations At Traverse City State Park Cladophora deposits were present only at the location near Mitchell Creek These results suggest that Cladophora can trap bacteria from point sources and also be stimulated by nutrient discharges Two locations Pinconning Park and Whitersquos Beach had very limited Cladophora growth Both locations had Chara growing on the lake bottom Chara is known to exhibit allelopathic activity that can limit the growth of other aquatic plants (Berger and Schagerl 2004) No correlation was found between E coli levels in the open water (designated beach monitoring locations) and the near-shore zone where the detached Cladophora samples were taken As noted in previous studies Cladophora appears to hold trapped E coli and not release the entrained bacteria into the offshore water (Byappanahalli et al 2003 Engelbert et al 2008) This investigation was the first to document the accumulation of microcystins in the detached Cladophora of Saginaw Bay S aginaw Bay has a history of Microcystis blooms in the late summer months that produce both microcystin LR and RR (Fahnenstiel et al 2008 Millie et al 2008) S ince Microcystis has a high requirement for sunlight cyanobacteria may become stressed when they become trapped in the detached algae deposits Stress has been implicated in initiating cyanotoxin production (Codd 1995) While accidental ingestion by humans of microcystins trapped in Cladophora is unlikely these compounds can act as skin irritants (Bell and Codd 1994) W alking through Cladophora accumulations to get to deeper water may provide sufficient exposure to cause irritation in sensitive individuals if microcystins are present While all of the data suggest that swimming areas (1 m depth) are not impacted by E coli accumulations in detached Cladophora entrained bacteria and cyanotoxins may pose a hazard to children playing in the near-shore water and beach sand While current regulations discourage beach grooming the presence of elevated bacteria and microcystin levels in the near-shore environment of Saginaw Bay suggests that the current policy should balance potential impacts to public health with the ecosystem services provided by coastal wetlands 50 Conclusions An assessment of the ability of Cladophora mats to sequester E coli and microcystin LR and RR was conducted in near-shore waters of Grand Traverse Bay (7 sites) Little Traverse Bay (2 sites) and Saginaw Bay (8 sites) The sampling locations were at public beach access points where Cladophora mats previously have been observed The goals of this research were to determine the spatial and temporal variability of E coli populations in Cladophora mats in these
48
recreational waters and if cyanotoxins (microcystin LR and RR) were sequestered in the detached algae T he collection of Cladophora samples was coordinated with local beach monitoring programs to facilitate the comparison with ambient water bacteria concentrations This project provided important data for the assessment of public health impacts and the development of beach management programs to address the problems associated with Cladophora accumulations Based on the results from this investigation Saginaw Bay appears to be more heavily impacted by detached Cladophora than Grand Traverse BayLittle Traverse Bay Mean E coli concentrations in detached Cladophora were higher in Saginaw Bay (2796 cfug dwt) than Grand Traverse BayLittle Traverse Bay (1775cfug dwt) however the difference was not statistically significant (Mann-Whitney ρ=040) The mean Cladophora extent score for Grand Traverse BayLittle Traverse Bay was 1 indicating that detached alga was consistently found in small pockets at a single location The mean Cladophora extent score for Saginaw Bay was 3 indicating that detached alga was found in 1 m2 deposits at all locations D ifferences in Cladophora accumulation between Saginaw Bay and Grand Traverse BayLittle Traverse Bay may be attributed to higher total phosphorus levels in Saginaw Bay Levels of E coli in detached Cladophora in both systems were similar to concentrations previously reported in the Great Lakes (1000 cfug dwt ndash 60000 cfug dwt) In Saginaw Bay the highest levels of E coli in detached Cladophora were consistently found at locations near the Saginaw River (Wenona Beach and the Bay City Recreation Area) Even within individual sites locations near tributaries and drains at Wenona Beach and South Linwood Beach were significantly higher than locations farther away form a point source This relationship also was noted in Grand Traverse Bay where the location near Mitchell Creek at the Traverse City State Park had elevated E coli concentrations in detached Cladophora compared to the other two beach stations where no detached algae was found These results suggest that Cladophora can trap bacteria from point sources and also be stimulated by nutrient discharges T wo locations Pinconning Park and Whitersquos Beach had very limited Cladophora growth Both locations had Chara growing on the lake bottom Chara is known to exhibit allelopathic activity that can limit the growth of other aquatic plants N o correlation was found between E coli levels in the open water (designated beach monitoring locations) and the near-shore zone where the detached Cladophora samples were taken As noted in previous studies Cladophora appears to hold trapped E coli and does not release the entrained bacteria into the offshore water This investigation was the first to document the accumulation of microcystins in the detached Cladophora of Saginaw Bay Total microcystins in detached Cladophora had a grand mean of 57 microgg dwt for the study period Saginaw Bay has a history of Microcystis blooms in the late summer months that produce both microcystin LR and RR S ince Microcystis has a h igh requirement for sunlight cyanobacteria may become stressed when they become trapped in the detached algae mats W hile accidental ingestion by humans of microcystins trapped in Cladophora is unlikely these compounds can act as skin irritants Walking through Cladophora accumulations to get to deeper water may provide sufficient exposure to cause irritation in sensitive individuals if microcystins are present While all of the data suggest that swimming areas (1 m depth) are not impacted by E coli accumulations in detached Cladophora entrained bacteria and cyanotoxins may pose a hazard to children playing in the near-shore water and beach sand Current regulations discourage beach grooming and altering the near-shore zone The presence of elevated bacteria and microcystin levels in the near-shore environment of
49
Saginaw Bay suggest that the current policy should be reevaluated to balance potential impacts to public health with the ecosystem services provided by coastal wetlands 60 References APHA (American Public Health Association) 1998 Standard Methods for the Evaluation of
Water and Wastewater 20th edition APHA Washington DC Barbiero RP MC Tuchman and ES Millard 2006 Post-dreissenid increases in transparency
during summer stratification in the offshore waters of Lake Ontario Is a reduction in whiting events the cause J Great Lakes Res 32131ndash141
Bartsch A F 1968 Eutrophication is beginning in Lake Michigan 1968 Water Waste Eng 5
84-87 Bell SG and Codd G A 1994 Cyanobacterial toxins and human health Rev Med Microbiol
5256ndash264 Berger J and Schagerl M 2004 Allelopathic activity of Characeae Biologia 599ndash15 Bootsma HA EB Young and JA Berges (eds) 2005 Cladophora research and
management in the Great Lakes Proceedings of workshop December 2004 Special Report No 2005-01 UWM Great Lakes WATER Institute
Boyer G M C Watzin A D Shambaugh M F Satchwell B R Rosen and T Mihuc 2004
The occurrence of cyanobacterial toxins in Lake Champlain In Lake Champlain partnerships and Research in the New Millennium (Proceedings of the Lake Champlain Research Consortium May 20th 2002 Saint-Jean-sur-Richelieu Quebec T Manley Ed p 241-257
Byappanahalli M N D A Shively M B Nevers M J Sadowsky and R L Whitman 2003
Growth and survival of Escherichia coli and enterococci populations in the macro-alga Cladophora (Chlorophyta) FEMS Microbiol Ecol 46203-211
Byappanahalli M N and R L Whitman 2009 Clostridium botulinum type E occurs and grows
in the alga Cladophora glomerata Can J Fish Aquat Sci 66 879ndash882 Codd GA 1995 Cyanobacterial toxins occurrence properties and biological significance
Water Sci Technol 32 149^156 Dodds W K and D A Gudder 1992 The ecology of Cladophora J Phycol 28415-427 Englebert ET McDermott C and GT Kleinheinz 2008 Effects of the nuisance algae
Cladophora on Escherichia coli at recreational beaches in Wisconsin The Science of the Total Environment 404(1)10-17
50
Fahnenstiel G L Millie D F Dyble J Litaker R W Tester P A McCormick M J Rediske R and D Klarer 2008 Microcystin concentrations and cell quotas in Saginaw Bay Lake Huron Aquatic Ecosystems Health and Management 11(2)190 ndash 195
Graham L E 1982 Cytology ultrastructure taxonomy and phylogenetic relationships of Great
Lakes filamentous algae J Great Lakes Res 854-60 Hecky R E R E H Smith D R Barton S J Guildford W D Taylor M N Charlton and
T Howell 2004 The nearshore phosphorus shunt a consequence of ecosystem engineering by dreissenids in the Laurentia Great Lakes Can J Fish Aquat Sci 611285-1293
Herbst RP 1969 Ecological factors and the distribution of Cladophora glomerata in the Great
Lakes Am Midl Nat 8290ndash98 Higgins S N E T Howell R E Hecky S J Guildford and REH Smith 2005 The wall of
green The status of Cladophora glomerata on the northern shores of Lake Eries eastern basin 1995-2002 J Gt Lakes Res 31 547-563
Hydrolab 1998 DataSonde 4a Userrsquos Manual Hydrolab Corporation Austin TX Ishii S T Yan DA Shively MN Byappanahalli RL Whitman and MJ Sadowsky 2006
Cladophora (Chlorophyta) spp harbor human bacterial pathogens in nearshore water of Lake Michigan Appl Environ Microbiol 72 (7)4545ndash4553
Joska A M and J J Bolton 1996 Filamentous freshwater macroalgae in South Africa ndash a
literature review and perspective on the development and control of weed problems Hydrobiologia 340 295-300
Keilty T and Woller M 2004 Final Report prepared for the USEPA-GLNPO by the Leelanau
Watershed Council Leelanau Conservancy L a n d s b e r g J H 2 0 0 2 T h e e f f e c t s o f h a r m f u l
a l g a l b l o o m s o n a q u a t i c o r g a n i s m s R e v F i s h S c i 1 0 1 1 3 ndash 3 9 0
Lawrence JF Niedzwiadek B Menard C Lau BP-Y Kuiper-Goodman T Carbone S
Holmes C 2001 Comparison of HPLC-mass spectrometry ELISA and phosphatase assay for the determination of microcystins in blue-green algae products J AOAC Int 841035-1044
MDNRE 2006 Water Quality Monitoring of Saginaw and Grand Traverse Bays Michigan
Department of Natural Resources and Environment Lansing MI MIDEQWB-06096 Millie D G Fahnenstiel J Dyble R Litaker P Tester M McCormick R Rediske and D
Klarer 2008 Influence of environmental conditions on summer cyanobacterial abundance in Saginaw Bay Lake Huron Aquatic Ecosystems Health and Management 11(2)196ndash205
51
Mills E L J M Casselman R Dermott J D Fitzsimons G Gal K T Holeck J A Hoyle OE Johannsson B F Lantry J C Makarewicz E S Millard I F Munawar M Munawar R OGorman R W Owens L G Rudstam T Schaner and T J Stewart 2003 Lake Ontario Food web dynamics in a changing ecosystem (1970-2000) Can J Fish Aquat Sci 60 471ndash490
Neil J H and M B Jackson 1982 Monitoring Cladophora growth conditions and the effect of
phosphorus additions at a shoreline site in northeastern Lake Erie J Great Lakes Res 830-34
Olapade O A M M Depas E T Jensen and S L McLellan 2006 Microbial communities
and fecal indicator bacteria associated with Cladophora mats on beach sites along Lake Michigan shores Appl Environ Microbiol 721932-1938
Painter D S and G Kamaitis 1987 Reduction of Cladophora biomass and tissue phosphorus
in Lake Ontario 1972-1983 Can J Fish Aquat Sci 44 2212-2215 Stevenson RJ ST Rier CM Riseng RE Shultz and MJ Wiley 2006 Comparing effects
of nutrients on algal blooms in streams in two regions with different disturbance regimes and with application for developing nutrient criteria Hydrobiologia 561149ndash165
Taft C E 1975 History of Cladophora in the Great Lakes In H Shear and D E Konasewich
[eds] Cladophora in the Great Lakes International Joint Commission The Watershed Center 2006 Tributary Monitoring Data The Watershed Center Traverse City
MI Vanderploeg HA Liebig JR Carmichael WW Agy MA Johengen TH Fahnenstiel GL
amp Nalepa TF 2001 Zebra mussel (Dreissena polymorpha) selective filtration promoted toxic Microcystis blooms in Saginaw Bay (Lake Huron) and Lake Erie Can J Fish Aquat Sci 58 1208ndash1221
Whitman R L D A Shively H Pawlik M B Nevers and M N Byappanahalli 2003
Occurrence of Escherichia coli and enterococci in Cladophora (Chlorophyta) in nearshore water and beach sand of Lake Michigan Appl Environ Microbiol 694714-4719
Wilson K A E T Howell and D A Jackson 2006 Replacement of Zebra Mussels by
Quagga Mussels in the Canadian nearshore of Lake Ontario Distribution and correlations with substrate Round Goby abundance and upwelling frequency J Gt Lakes Res 3211-28
Zhu B D G Fitzgerald C M Mayer L G Rudstam and E L Mills 2006 Alteration of
ecosystem function by Zebra Mussels in Oneida Lake Impacts on submerged macrophytes Ecosystems 9 1017-1028
- Assessment of E coli and Microcystins in Cladophora Mats in the Nearshore Waters of Grand Traverse Bay Little Traverse Bay and Saginaw Bay
- May 2010
- TABLE OF CONTENTS
- LIST OF TABLES
- LIST OF FIGURES
- Acknowledgements
- Executive Summary
- 10 Introduction
- 20 Methods
-
- 21 Sampling methods
-
- 211 Sampling Design
- 212 Sampling Methods
-
- 22 Analytical Methods
-
- 221 Hydrolab Methods
- 222 E coli Analysis
- 223 Sample Preparation for Microcystin Analysis
- 244 Microcystin LR and RR by LCMS
-
- 30 Results
-
- 31 Saginaw Bay E coli Microcystin and Water Chemistry Results
-
- 311 Wenona Beach
- 312 Bay City Recreation Area
- 313 Brissette Beach
- 314 South Linwood Beach
- 315 Pinconning Park
- 316 Whitersquos Beach
- 317 Arenac County Park
- 318 Foster Road Beach
-
- 32 Grand Traverse Bay and Little Traverse Bay E coli Microcystin and Water Chemistry Results
-
- 321 Petoskey State Park
- 322 Magnus Park
- 323 Elk Rapids Park
- 324 Antrim County Day Park
- 325 East Bay Park
- 326 Traverse City State Park
- 327 Bryant Park
- 328 Clinch Park
- 329 West End Beach
-
- 33 Saginaw Bay and Grand Traverse BayLittle Traverse Bay Comparisons
-
- 40 Discussion
- 50 Conclusions
- 60 References
-

3
sampling events) E coli samples were placed in sterile whirl pack bags and stored in the dark at 4ordmC A composite of the triplicate samples was placed in an amber glass jar and stored at 4ordmC for microcystin-LR and RR analysis A ll samples were returned to the laboratory and on a daily basis for further processing and storage E coli samples were analyzed within 6 hour s of collection Microcystin ndashLR and RR samples were lyophilized and stored at -30ordmC Chemical and physical parameters were monitored at each location using a Hydrolab DataSonde 4a We measured pH dissolved oxygen (DO) DO saturation temperature and specific conductance at each station
Figure 21 Grand Traverse BayLittle Traverse Bay Sampling Locations
4
Figure 22 Saginaw Bay Sampling Locations The extent of Cladophora accumulation was determined at each sampling location according to the ranking
bull 0 = No visible Cladophora bull 1 = Cladophora present in isolated pockets at one location bull 2 = Cladophora present in isolated pockets at all locations bull 3 = Cladophora residue 1 m2 in area bull 4 = Cladophora residue 1-5 m2 in area bull 5 = Cladophora gt 5 m2 in area
5
22 Analytical Methods
Laboratory procedures have been selected based on previous use for water quality investigations established ranges for accuracyprecision and limited problems related to matrix interferences A summary of analytical methods is given in Table 21 Method summaries are provided in the following sections 221 Hydrolab Methods Hydrolab measurements of pH temperature dissolved oxygen and specific conductance were conducted according to the methods in the instrument users manual (Hydrolab 1998) T he Hydrolab Datasonde 4a was calibrated in the lab prior to use in the field The instrument was placed in the water at each site and the technician waited for a s table reading of the sensors Measurements were recorded at 05 m depth at each station P recision was assessed by the measurement of field duplicates at 10 of the stations
Table 21 Laboratory Analytical Methods
222 E coli Analysis Samples of E coli were prepared by elutriation with phosphate buffer (Whitman et al 2003) One gram portions of homogenized algal samples were weighed and placed in sterile 15- milliliter (mL) centrifuge tubes Nine mL of sterile phosphate-buffered diluent water (pH 68) was added and the mixture was vigorously shaken for 2 min and then centrifuged briefly (45 s) at 2000 rpm to allow the large particles to settle The diluted sample then was analyzed by the Colilert-18 (IDEXX) using the Quanti-Tray 2000 (APHA 1998) A 1 mL aliquot was removed from the centrifuge tube and transferred to 99 mL of sterile phosphate buffer in a sterile water sampling vial The Colilert reagent then was then added to the vial and shaken until dissolved The sample and reagents were then added to the Quanti-Tray 2000 and sealed with the Quanti-Tray sealer T he tray was incubated for 18 ho urs at 35degC plusmn 05degC and read under UV light Fluorescent colonies were counted and the number of colony forming units (cfu)100 mL was calculated according to the manufacturerrsquos instructions
Parameter Preparation Preservation Holding Time Methods Reference
pH Hydrolab 1998 Dissolved Oxygen Hydrolab 1998
Temperature Hydrolab 1998 Specific conductance Hydrolab 1998
Microcystin LR and RR by LCMS
Filtration methanol extraction C-18
cartridge Freeze -30degC 6 mo Lawerence et al 2001
Boyer et al 2004
E coli Phosphate buffer extraction Cool 4degC 6 hrs
Whitman et al 2003 Colilert-18
APHA 1998
6
223 Sample Preparation for Microcystin Analysis
Water samples for the analyses of microcystin were prepared according to methods outlined by Lawerence et al (2001) A 100-500 mL aliquot was filtered through a Whatman GFC glass fiber filter The filter then was placed in a 5 mL centrifuge tube and lyophilized for 8 hours The filter residue was extracted with three successive aliquots of methanol followed by sonication The methanol extract was evaporated to dryness under nitrogen and re-dissolved in 1 mL of 50 methanol in water This mixture was passed through a 1 gram (g) SPE C-18 cartridge (Baker) that had been preconditioned with 10 mL of methanol followed by 10 mL of water The cartridge then was washed with 5 mL of 25 methanol in water and the eluted fraction was discarded The microcystins then were eluted with 4 mL of 100 methanol in water This fraction was collected and the volume reduced to 2 mL The volume was adjusted back to 3 mL with methanol and split into three 1 mL aliquots for HPLCMS analysis
244 Microcystin LR and RR by LCMS Samples for Liquid ChromatographyMass Spectrometry (LCMS) analysis were filtered using Gelman AE binderless glass fiber filters The cells were lysed by freezing and then vortexed for 5 minutes in centrifuge tubes containing 10 mL of aqueous (5050) methanol to extract toxins Suspensions were centrifuged and the supernatant was filtered through 045 micron nylon filters The concentrations of microcystin LR and RR were determined by liquid chromatography-tandem mass spectrometry using a Finnigan Surveyor MSQ LCMS Nodularin was added to the extracts and used as an internal standard Compounds were separated on a Phenomenex Luna C18 column at 50oC The mobile phase was a binary gradient of water and methanol both containing 01 formic acid T he initial gradient started with 95 water and 5 methanol followed by a step change to 50 water and 50 methanol at 3 minutes with a linear gradient from 5 t o 20 m inutes to 5 water and 95 methanol Instrument detection limits for these toxins were determined to be 1 microgramliter (microgl) For calibration a series of 5 solutions were prepared with the internal standard at 1000 microgl and the analytes in the range of 1 to 500 microgl in final volumes of 1 mL of 9010 watermethanol 30 Results The results of E coli water chemistry and microcystins data from each location are presented for Saginaw Bay and Grand Traverse BayLittle Traverse Bay in Sections 31 and 32 respectively A comparison of the two basins is provided in Section 33
31 Saginaw Bay E coli Microcystin and Water Chemistry Results
311 Wenona Beach The sampling locations for Wenona Beach are provided in Figure 311 Near-shore locations were sampled at a depth of 03 m The beach area was covered with reed canary grass sedges and cattails Cattails and detached Cladophora were common in the shallow littoral zone and the samples were collected approximately 1 meter outside of the macrophyte zone The detached
7
Cladophora also was common at the sampling locations with some areas of fresh Cladophora growing on submerged rocks and woody debris
Figure 311 Wenona Beach Sampling Locations 2008 (L= Left C=Center R=Right) The results of water and detached Cladophora analyses are summarized in Tables 311 and 312 respectively The mean E coli concentration for the study period was 14 cfu100 mL with no single beach samples exceeding 100 cfu100 mL (Table 311) Water temperatures ranged from 21degC to 25degC The mean E coli concentration for detached Cladophora was 9775 cfug dwt (Table 312) Microcystins were detected in the detached Cladophora beginning in July with mean concentrations of 47 microgg dwt 47 microgg dwt and 103 microgg dwt for microcystin RR microcystin LR and total microcystins respectively Detached Cladophora was present in
8
Table 311 Wenona Beach Water Quality Data 2008
ConductanceL C R Mean microScm
062308 10 8 18 12 792 77 21 440070108 78 44 82 68 810 78 22 470070808 3 4 2 3 814 74 23 451071508 2 1 1 1 817 75 24 450072208 5 6 1 4 816 73 24 456072908 33 8 7 16 810 72 25 453080508 4 7 4 5 813 76 24 461081208 4 2 3 3 811 79 24 467
Mean 17 10 15 14 81 76 23 456
cfu100 mlDateE coli in Water Water Chemistry
pH DO (mgl) Temp OC
Table 312 Wenona Beach Cladophora Data 2008
CladophoraL C R Mean Extent RR LR Total
062308 448 733 22507 7896 5 lt 01 lt 01 lt 01070108 800 2331 25432 9521 5 lt 01 1 lt 01070808 1279 3561 31566 12135 5 12 11 23071508 610 500 1678 929 3 15 23 38072208 1892 2000 3578 2490 5 27 34 61072908 5631 5633 64132 25132 5 68 80 148080508 6322 4531 25346 12066 5 80 80 161081208 3313 2311 18462 8029 5 82 102 184
Mean 2537 2700 24088 9775 5 47 47 103
Microcystins in Cladophora microgg dwtDate E coli in Cladophora cfug dwt
(Cladophora Extent 0 = None Present 1 = Present in isolated pockets at one location 2 = Present in isolated pockets at all locations 3 = Deposits 1 m2 in area 4= Deposits 1-5 m2 in area 5 = Deposits gt 5 m2 in area)
deposits of gt5 m2 at all locations during the sampling period (Table 312) E coli concentrations in water and detached Cladophora are displayed in Figure 312 No correlation was observed between bacterial levels in water and detached algae (Spearmanrsquos RO ρ=014) The drop in E coli levels observed on July 15 was after a storm that had occurred on July 12 A statistically significant difference was observed between beach locations for E coli concentrations in detached Cladophora (Kruskal-Wallis ρ=00004) Station R was significantly different from C and L (Mann-Whitney ρ=0012 and 0010 respectively) S tation R was the closest sampling location to the Saginaw River Station R had the highest concentration of E coli in detached Cladophora (64132 cfug dwt) This bacterial concentration was the highest level observed during the study period
9
0
1
2
3
4
5
62508 7208 7908 71608 72308 73008 8608 81308
Log
E c
oli
Con
cent
ratio
n
Water (cfu100mL)Cladophora cfug dwt
Figure 312 E coli in Detached Cladophora and Water at Wenona Beach 2008 312 Bay City Recreation Area The sampling locations for the Bay City Recreation Area are provided in Figure 313 Three near-shore locations were sampled at a depth of 03 m The beach area was sandy and appeared to be groomed Detached Cladophora was common in the shallow littoral zone and the samples were collected approximately 1 meter from shore The results of water and detached Cladophora analyses are summarized in Tables 313 and 314 respectively The mean E coli concentration for the study period was 6 cfu100 mL with no single beach sample exceeding 100 cfu100 mL (Table 313) Water temperatures ranged from 21degC to 24degC The mean E coli concentration in detached Cladophora was 3216 cfug dwt (Table 314) Microcystins were detected in the detached Cladophora beginning in June with mean concentrations of 96 microgg dwt 129 microgg dwt and 225 microgg dwt for microcystin RR microcystin LR and total microcystins respectively The highest concentrations of microcystins were found on August 12 at the Bay City Recreation area (microcystin RR 364 microgg dwt microcystin LR 349 microgg dwt and total microcystins 714 microgg dwt) Detached Cladophora covered the entire beach for all but one of the sampling events E coli concentrations in water and detached Cladophora are displayed in Figure 314 No correlation was observed between bacterial levels in the water and the detached algae (Spearmanrsquos RO ρ=008) The drop in E coli levels observed on July 15 was after a storm that had occurred on July 12 A statistically significant difference was not observed between beach locations for E coli concentrations in detached Cladophora (Kruskal-Wallis ρ=00073) Station R had the highest concentration of E coli in detached Cladophora (8923 cfug dwt)
10
Figure 313 Bay City Recreation Area Sampling Locations 2008 (L= Left C=Center R=Right)
Table 313 Bay City Recreation Area Water Quality Data 2008
ConductanceL C R Mean microScm
062308 10 8 24 14 792 77 21 420070108 1 2 6 3 811 78 22 437070808 3 4 47 18 816 75 23 445071508 2 1 1 1 816 74 23 436072208 1 1 1 1 816 73 24 436072908 4 8 1 4 812 77 24 446080508 4 7 4 5 817 78 24 448081208 1 2 1 1 811 81 24 449
Mean 3 4 11 6 811 77 23 440
E coli in Water Water Chemistry cfu100 ml pH DO (mgl) Temp OC
Date
11
Table 314 Bay City Recreation Area Cladophora Data 2008
CladophoraL C R Mean Extent RR LR Total
062308 1432 856 3456 1915 5 1 1 2070108 1333 963 2564 1620 5 2 7 9070808 4222 4563 8923 5903 5 14 33 47071508 1100 1245 1344 1230 3 32 49 81072208 1632 2000 7843 3825 5 65 99 164072908 998 5633 8564 5065 5 56 219 275080508 2331 4531 3564 3475 5 231 275 505081208 3223 2311 2564 2699 5 364 349 714
Mean 2034 2763 4853 3216 5 96 129 225
Date E coli in Cladophora cfug dwt Microcystins in Cladophora microgg dwt
(Cladophora Extent 0 = None Present 1 = Present in isolated pockets at one location 2 = Present in isolated pockets at all locations 3 = Deposits 1 m2 in area 4= Deposits 1-5 m2 in area 5 = Deposits gt 5 m2 in area)
0
1
2
3
4
5
62508 7208 7908 71608 72308 73008 8608 81308
Log
E c
oli
Con
cent
ratio
n
Water (cfu100mL)Cladophora cfug dwt
Figure 314 E coli in Detached Cladophora and Water at the Bay City Recreation Area 2008
313 Brissette Beach The sampling locations for Brissette Beach are provided in Figure 315 T hree near-shore locations were sampled at a depth of 03 m T he beach area was sandy and appeared to be groomed Detached Cladophora was common in the shallow littoral zone and the samples were collected approximately 1-2 m from shore
12
Figure 315 Brissette Beach Sampling Locations 2008 (L= Left C=Center R=Right)
The results of water and detached Cladophora analyses are summarized in Tables 315 and 316 respectively The mean E coli concentration for the study period was 7 cfu100 mL with no single beach sample exceeding 100 cfu100 mL (Table 315) Water temperatures ranged from 21degC to 24degC The mean E coli concentration in detached Cladophora was 768 cfug dwt (Table 316) Microcystins were detected in the detached Cladophora beginning in June with mean concentrations of 9 microgg dwt 15 microgg dwt and 23 microgg dwt for microcystin RR microcystin LR and total microcystins respectively Detached Cladophora was present in deposits of 1-5 m2 at all locations during the sampling period except after the storm event on July 12 (Table 316) E coli concentrations in the water and detached Cladophora are displayed in Figure 316 No correlation was observed between bacterial levels in water and detached algae (Spearmanrsquos RO ρ=083) A statistically significant difference was not observed between beach locations for E coli concentrations in detached Cladophora (Kruskal-Wallis ρ=0053) Station R had the highest concentration of E coli in detached Cladophora (1848 cfug dwt)
13
Table 315 Brissette Beach Water Quality Data 2008
ConductanceL C R Mean microScm
062308 3 2 1 2 789 77 21 400070108 15 22 35 24 812 78 22 440070808 1 1 1 1 819 75 23 433071508 2 1 3 2 812 74 23 434072208 1 1 7 3 812 73 24 444072908 16 37 16 23 818 77 24 439080508 1 2 1 1 819 78 24 445081208 1 2 6 3 813 81 24 447
Mean 5 9 9 7 812 77 23 435
E coli in Water Water Chemistry cfu100 ml pH DO (mgl) Temp OC
Date
Table 316 Brissette Beach Cladophora Data 2008
CladophoraL C R Mean Extent RR LR Total
062308 618 1045 1848 1170 4 05 07 1070108 450 533 460 481 4 01 07 1070808 655 784 989 809 4 23 37 6071508 411 333 450 398 2 09 77 9072208 644 755 877 759 4 35 131 17072908 755 766 864 795 4 18 142 16080508 644 532 436 537 4 213 285 50081208 1033 1200 1344 1192 4 388 494 88
Mean 651 744 908 768 4 9 15 23
Date E coli in Cladophora cfug dwt Microcystins in Cladophora microgg dwt
(Cladophora Extent 0 = None Present 1 = Present in isolated pockets at one location 2 = Present in isolated pockets at all locations 3 = Deposits 1 m2 in area 4= Deposits 1-5 m2 in area 5 = Deposits gt 5 m2 in area)
0
1
2
3
4
5
62508 7208 7908 71608 72308 73008 8608 81308
Log
E c
oli
Conc
entra
tion Water (cfu100mL)
Cladophora cfug dwt
Figure 316 E coli in Detached Cladophora and Water at Brissette Beach 2008
14
314 South Linwood Beach The sampling locations for South Linwood Beach are provided in Figure 317 Three near-shore locations were sampled at a depth of 03 m T he beach area was sandy and appeared to be groomed Detached Cladophora was common in the shallow littoral zone and the samples were collected approximately 1-2 m from shore
Figure 317 South Linwood Beach Sampling Locations 2008 (L= Left C=Center R=Right)
15
The results of water and detached Cladophora analyses are summarized in Tables 317 and 318 respectively The mean E coli concentration for the study period was 9 cfu100 mL with no single beach sample exceeding 100 cfu100 mL (Table 317) Water temperatures ranged from 21degC to 24degC The mean E coli concentration in detached Cladophora was 1191 cfug dwt (Table 318) Microcystins were detected in the detached Cladophora beginning in July with mean concentrations of 12 microgg dwt 15 microgg dwt and 27 micro gg dwt for microcystin RR microcystin LR and total microcystins respectively D etached Cladophora was present in deposits of 1-5 m2 at all locations during the sampling period except after the storm event on July 12 (Table 318) E coli concentrations in water and detached Cladophora are displayed in Figure 318 No correlation was observed between bacterial levels in water and detached algae (Spearmanrsquos RO ρ=0061) E coli levels in detached Cladophora were significantly higher than water concentrations (Mann-Whitney ρlt0001) A statistically significant difference was not observed between beach locations for E coli concentrations in detached Cladophora (Kruskal-Wallis ρ=00046) Station L was significantly different from C and R (Mann-Whitney ρ=00002 and 0038 respectively) Station L was the closest sampling location to a drainage ditch that enters South Linwood Beach This station had the highest concentration of E coli in detached Cladophora (4888 cfug dwt)
Table 317 South Linwood Beach Water Quality Data 2008
ConductanceL C R Mean microScm
062308 1 lt 1 1 1 792 77 21 420070108 1 2 15 6 816 77 22 433070808 1 2 2 1 815 76 23 439071508 2 1 1 1 816 76 23 448072208 1 1 10 4 819 76 24 439072908 35 66 76 59 811 76 24 446080508 1 1 1 1 811 76 24 431081208 1 2 3 2 814 77 24 431
Mean 5 11 14 9 812 76 23 436
E coli in Water Water Chemistry cfu100 ml pH DO (mgl) Temp OC
Date
Table 318 South Linwood Beach Cladophora Data 2008
CladophoraL C R Mean Extent RR LR Total
062308 1412 390 716 839 4 lt01 lt01 lt01070108 2452 60 190 901 4 lt01 lt01 lt01070808 655 784 989 809 4 15 21 4071508 150 76 89 105 2 10 25 3072208 3324 2314 1964 2534 4 13 27 4072908 2353 756 812 1307 4 164 140 30080508 1325 533 834 897 4 170 240 41081208 4888 845 674 2136 4 350 430 78
Mean 2070 720 784 1191 4 12 15 27
Date E coli in Cladophora cfug dwt Microcystins in Cladophora microgg dwt
(Cladophora Extent 0 = None Present 1 = Present in isolated pockets at one location 2 = Present in isolated pockets at all locations 3 = Deposits 1 m2 in area 4= Deposits 1-5 m2 in area 5 = Deposits gt 5 m2 in area)
16
0
1
2
3
4
5
62508 7208 7908 71608 72308 73008 8608 81308
Log
E c
oli
Con
cent
ratio
n Water (cfu100mL)Cladophora cfug dwt
Figure 318 E coli in Detached Cladophora and Water at South Linwood Beach 2008 315 Pinconning Park The sampling locations for Pinconning Park are provided in Figure 319 T hree near-shore locations were sampled at depths of 03-05 m The beach area was sandy and appeared to be groomed Station L contained open water while Stations R and L contained Typha and Scirpus Chara also was present along the lake bottom suggesting groundwater influx Detached Cladophora was found only in isolated areas of the shallow littoral zone and the samples were collected approximately 1 meter from shore The results of water and detached Cladophora analyses are summarized in Tables 319 and 3110 respectively The mean E coli concentration for the study period was 3 cfu100 mL with no single beach sample exceeding 100 cfu100 mL (Table 313) Water temperatures ranged from 21degC to 24degC The mean E coli concentration in detached Cladophora was 299 cfug dwt (Table 314) Microcystins were detected in the detached Cladophora beginning in July with mean concentrations of 07 microgg dwt 3 microgg dwt and 4 microgg dwt for microcystin RR microcystin LR and total microcystins respectively Detached Cladophora was present in isolated pockets at all locations for only 3 of the 8 s ampling periods (Table 3110) E coli concentrations in water and detached Cladophora are displayed in Figure 314 No correlation was observed between bacterial levels in water and detached algae (Spearmanrsquos RO ρ=011) The drop in E coli levels observed on July 15 was after a storm that had occurred on July 12 A statistically significant difference was not observed between beach locations for E coli concentrations in detached Cladophora (Kruskal-Wallis ρ=0073) S tation C had the highest concentration of E coli in detached Cladophora (1454 cfug dwt)
17
Figure 319 Pinconning Park Sampling Locations 2008 (L= Left C=Center R=Right)
Table 319 Pinconning Park Water Quality Data 2008
ConductanceL C R Mean microScm
062308 1 2 1 1 756 77 21 460070108 1 2 1 1 816 76 22 464070808 2 1 3 2 817 77 23 463071508 2 1 3 2 810 76 23 475072208 1 1 1 1 815 77 24 474072908 4 8 9 7 812 76 24 466080508 4 2 lt 1 2 811 76 24 470081208 1 2 9 4 815 77 24 470
Mean 2 2 3 3 806 77 23 468
E coli in Water Water Chemistry cfu100 ml pH DO (mgl) Temp OC
Date
18
Table 3110 Pinconning Park Cladophora Data 2008 (NC=No Cladophora Present NA=Not Analyzed)
Cladophora
L C R Mean Extent RR LR Total062308 NC NC NC NC 0 NA NA NA070108 NC NC NC NC 0 NA NA NA070808 NC NC NC NC 0 NA NA NA071508 NC NC NC NC 0 NA NA NA072208 NC NC NC NC 0 NA NA NA072908 50 64 40 51 2 08 12 2080508 634 1454 188 759 2 09 18 3081208 184 18 56 86 2 07 98 10
Mean 289 512 95 299 1 07 3 4
Date E coli in Cladophora cfug dwt Microcystins in Cladophora microgg dwt
(Cladophora Extent 0 = None Present 1 = Present in isolated pockets at one location 2 = Present in isolated pockets at all locations 3 = Deposits 1 m2 in area 4= Deposits 1-5 m2 in area 5 = Deposits gt 5 m2 in area)
0
1
2
3
4
5
62508 7208 7908 71608 72308 73008 8608 81308
Log
E c
oli
Con
cent
ratio
n Water (cfu100mL)Cladophora cfug dwt
Figure 3110 E coli in Detached Cladophora and Water at Pinconning Park 2008 316 Whitersquos Beach The sampling locations for Whitersquos Beach are provided in Figure 3111 Three near-shore locations were sampled at depths of 03-05 m The beach area was sandy and appeared to be groomed Station L contained open water while Stations R and C contained Scirpus Chara also was present along the lake bottom suggesting groundwater influx Detached Cladophora was only found in isolated areas of the shallow littoral zone and the samples were collected approximately 1 meter from shore The results of water and detached Cladophora analyses are summarized in Tables 3111 and 3112 respectively The mean E coli concentration for the study period was 16 cfu100 mL with no single beach sample exceeding 100 cfu100 mL (Table 3111) Water temperatures
19
Figure 3111 Whitersquos Beach Sampling Locations 2008 (L= Left C=Center R=Right) ranged from 21degC to 24degC Detached Cladophora was present in only one sample and the concentration of E coli in the algae was 130 cfug dwt (Table 3112) Microcystin LR was detected in the detached Cladophora in only one sample in August (13 microgg dwt) Detached Cladophora was present only in the August 5 s ample at Station L (Table 3110) E coli concentrations in water and detached Cladophora are displayed in Figure 3112 No correlation was observed between bacterial levels in water and detached algae (Spearmanrsquos RO ρ=0007)
20
Table 3111 Whitersquos Beach Water Quality Data 2008
ConductanceL C R Mean microScm
062308 3 8 3 5 759 77 21 430070108 4 6 5 5 815 77 22 442070808 3 4 8 5 816 76 23 435071508 2 1 2 2 816 76 23 432072208 22 16 13 17 817 77 24 440072908 4 8 6 6 814 77 24 431080508 41 73 60 58 816 77 24 449081208 32 28 42 34 810 77 24 447
Mean 14 18 17 16 808 77 23 438
E coli in Water Water Chemistry cfu100 ml pH DO (mgl) Temp OC
Date
Table 3112 Whitersquos Beach Cladophora Data 2008 (NC=No Cladophora Present NA=Not
Analyzed)
CladophoraL C R Mean Extent RR LR Total
062308 NC NC NC NC 0 NA NA NA070108 NC NC NC NC 0 NA NA NA070808 NC NC NC NC 0 NA NA NA071508 NC NC NC NC 0 NA NA NA072208 NC NC NC NC 0 NA NA NA072908 NC NC NC NC 0 NA NA NA080508 130 NC NC mdash 1 NA 13 13081208 NC NC NC NC 0 NA NA NA
Mean 130 NC NC mdash 0 NA mdash mdash
Date E coli in Cladophora cfug dwt Microcystins in Cladophora microgg dwt
(Cladophora Extent 0 = None Present 1 = Present in isolated pockets at one location 2 = Present in isolated pockets at all locations 3 = Deposits 1 m2 in area 4= Deposits 1-5 m2 in area 5 = Deposits gt 5 m2 in area)
0
1
2
3
4
5
62508 7208 7908 71608 72308 73008 8608 81308
Water (cfu100mL)Cladophora cfug dwt
Figure 3112 E coli in Detached Cladophora and Water at Whitersquos Beach 2008
Log
E c
oli C
once
ntra
tion
21
317 Arenac County Park The sampling locations for Arenac County Park are provided in Figure 3113 Three near-shore locations were sampled at a depth of 03 m T he beach area was sandy and appeared to be groomed Detached Cladophora was common in the shallow littoral zone and the samples were collected approximately 1 meter from shore
Figure 3113 Arenac County Park Sampling Locations 2008 (L= Left C=Center R=Right)
The results of water and detached Cladophora analyses are summarized in Tables 3113 and 3114 respectively The mean E coli concentration for the study period was 25 cfu100 mL with only one beach sample exceeding 100 c fu100 mL (Station L 111 cfu100 mL Table 313) Water temperatures ranged from 21degC to 25degC The mean E coli concentration in
22
Table 3113 Arenac County Park Water Quality Data 2008
ConductanceL C R Mean microScm
062308 5 2 2 3 813 115 19 310070108 45 31 94 57 817 100 19 300070808 55 42 29 42 820 106 20 284071508 2 1 9 4 815 100 20 296072208 1 3 lt1 1 812 80 21 315072908 111 87 16 71 814 112 21 280080508 3 1 NC 1 811 114 21 292081208 1 2 60 21 817 113 21 296
Mean 28 21 26 25 815 11 20 297
E coli in Water Water Chemistry cfu100 ml pH DO (mgl) Temp OC
Date
Table 3114 Arenac County Park Cladophora Data 2008
CladophoraL C R Mean Extent RR LR Total
062308 1811 1144 2699 1885 4 lt01 lt01 lt01070108 1801 1327 3258 2129 4 3 2 5070808 38 175 290 168 2 1 3 4071508 56 87 84 76 2 4 9 13072208 130 223 433 262 3 3 13 16072908 56 88 53 66 4 9 19 27080508 240 670 810 573 3 28 43 70081208 1300 1670 1890 1620 4 90 158 248
Mean 679 673 1190 847 3 20 35 55
Date E coli in Cladophora cfug dwt Microcystins in Cladophora microgg dwt
(Cladophora Extent 0 = None Present 1 = Present in isolated pockets at one location 2 = Present in isolated pockets at all locations 3 = Deposits 1 m2 in area 4= Deposits 1-5 m2 in area 5 = Deposits gt 5 m2 in area)
detached Cladophora was 847 cfug dwt (Table 3114) M icrocystins were detected in the detached Cladophora beginning in July with mean concentrations of 20 microgg dwt 35 microgg dwt and 55 microgg dwt for microcystin RR microcystin LR and total microcystins respectively Detached Cladophora was present in 1-5 m p ockets at all locations for 6 of the 8 s ampling periods (Table 3114) The beach was groomed for the July 4th holiday and the Cladophora extent decreased to being present in isolated areas for two weeks E coli concentrations in water and detached Cladophora are displayed in Figure 3114 No correlation was observed between bacterial levels in water and detached algae (Spearmanrsquos RO ρ=061) A statistically significant difference was not observed between beach locations for E coli concentrations in detached Cladophora (Kruskal-Wallis ρ=057) S tation R had the highest concentration of E coli in detached Cladophora (3258 cfug dwt)
23
0
1
2
3
4
5
62508 7208 7908 71608 72308 73008 8608 81308
Log
E c
oli
Con
cent
ratio
n Water (cfu100mL)Cladophora cfug dwt
Figure 3114 E coli in Detached Cladophora and Water at Arenac County Park 2008 318 Foster Road Beach The sampling locations for Foster Road Beach are provided in Figure 3115 Three near-shore locations were sampled at a depth of 05 m T he beach area was sandy and appeared to be groomed Detached Cladophora was common in the shallow littoral zone and the samples were collected approximately 1 meter from shore Strong wave action was observed at this location which kept the detached Cladophora suspended in the water column This was the only Saginaw Bay location where suspended Cladophora was observed The results of water and detached Cladophora analyses are summarized in Tables 3115 and 3116 respectively The mean E coli concentration for the study period was 73 cfu100 mL with only one set of beach samples averaging 315 c fu100mL (July 15 Table 3117) This sample was taken after the storm event which occurred on July 12 Water temperatures ranged from 21degC to 25degC The mean E coli concentration in detached Cladophora was 2169 cfug dwt (Table 3116) Microcystins were detected in the detached Cladophora beginning in July with mean concentrations of 36 microgg dwt 41 microgg dwt and 77 microgg dwt for microcystin RR microcystin LR and total microcystins respectively D etached Cladophora was present throughout the water column during the first three weeks not present on July 15 (after the storm) and present only in isolated pockets during the remainder of the sampling period (Table 3116) E coli concentrations in water and detached Cladophora are displayed in Figure 3118 N o correlation was observed between bacterial levels in water and detached algae (Spearmanrsquos RO ρ=078) A statistically significant difference was not observed between beach locations for E coli concentrations in detached Cladophora (Kruskal-Wallis ρ=090) Station L had the highest concentration of E coli in detached Cladophora (7332 cfug dwt)
24
Figure 3115 Foster Road Beach Sampling Locations 2008 (L= Left C=Center R=Right)
Table 3115 Foster Road Beach Water Quality Data 2008
ConductanceL C R Mean microScm
062308 1 2 5 3 792 77 21 376070108 60 21 23 35 818 76 22 382070808 55 140 181 125 815 75 23 442071508 320 400 225 315 815 74 23 436072208 1 2 3 2 812 73 24 447072908 25 31 50 35 820 77 24 436080508 22 21 7 17 814 78 24 447081208 46 51 71 56 811 81 24 450
Mean 66 84 71 73 812 76 23 427
E coli in Water Water Chemistry cfu100 ml pH DO (mgl) Temp OC
Date
25
Table 3116 Foster Road Beach Cladophora Data 2008 (NC=No Cladophora Present NA=Not Analyzed)
Cladophora
L C R Mean Extent RR LR Total062308 1380 2760 1515 1885 5 lt01 lt01 lt01070108 4554 7010 5346 5637 5 lt01 1 1070808 6731 5893 7332 6652 5 12 11 23071508 NC NC NC NC 0 NA NA NA072208 150 230 320 233 2 27 34 61072908 230 156 240 209 2 68 80 148080508 213 270 189 224 2 80 80 161081208 332 380 320 344 2 82 102 184
Mean 1941 2386 2180 2169 3 36 41 77
Date E coli in Cladophora cfug dwt Microcystins in Cladophora microgg dwt
(Cladophora Extent 0 = None Present 1 = Present in isolated pockets at one location 2 = Present in isolated pockets at all locations 3 = Deposits 1 m2 in area 4= Deposits 1-5 m2 in area 5 = Deposits gt 5 m2 in area)
0
1
2
3
4
5
62508 7208 7908 71608 72308 73008 8608 81308
Log
E c
oli
Con
cent
ratio
n Water (cfu100mL)Cladophora cfug dwt
Figure 3116 E coli in Detached Cladophora and Water at Foster Road Beach 2008
32 Grand Traverse Bay and Little Traverse Bay E coli Microcystin and Water Chemistry Results
321 Petoskey State Park The sampling locations for Petoskey State Park are provided in Figure 321 Three near-shore locations were sampled at a depth of 03 m T he beach area was sandy and appeared to be natural Detached Cladophora was present in isolated pockets in the shallow littoral zone and the samples were collected approximately 1 meter from shore
26
Figure 321 Petoskey State Park Sampling Locations 2008 (L= Left C=Center R=Right) The results of water and detached Cladophora analyses are summarized in Tables 321 and 322 respectively The mean E coli concentration for the study period was 13 cfu100 mL with no single beach sample exceeding 100 cfu100 mL (Table 321) Water temperatures ranged from 19degC to 21degC The mean E coli concentration in detached Cladophora was 1117 cfug dwt (Table 322) M icrocystins were not detected in the detached Cladophora Detached Cladophora was present in isolated pockets at all locations for only 2 of the 8 sampling periods (Table 322) E coli concentrations in water and detached Cladophora are displayed in Figure 322 N o correlation was observed between bacterial levels in water and detached algae (Spearmanrsquos RO ρ=059) A statistically significant difference was not observed between beach locations for E coli concentrations in detached Cladophora (Kruskal-Wallis ρ=0058) Station R had the highest concentration of E coli in detached Cladophora (1600 cfug dwt)
27
Table 321 Petoskey State Park Water Quality Data 2008
ConductanceL C R Mean microScm
062308 6 3 2 4 800 105 19 303070108 89 55 73 72 823 109 19 296070808 2 3 3 3 813 110 19 300071508 3 6 6 5 815 105 20 295072208 4 7 5 5 824 104 21 300072908 16 12 5 11 818 108 21 298080508 1 1 1 1 814 104 21 300081208 6 3 1 4 807 107 21 297
Mean 16 11 12 13 814 106 20 299
E coli in Water Water Chemistry cfu100 ml pH DO (mgl) Temp OC
Date
Table 322 Petoskey State Park Cladophora Data 2008 (NC=No Cladophora Present NA=Not Analyzed)
Cladophora
L C R Mean Extent RR LR Total062308 990 1200 1100 1097 2 lt01 lt01 lt01070108 1455 1390 1543 1463 2 lt01 lt01 lt01070808 NC NC 1200 1200 1 lt01 lt01 lt01071508 NC 1423 NC 1423 1 lt01 lt01 lt01072208 NC 556 NC 556 1 lt01 lt01 lt01072908 NC NC 1600 1600 1 lt01 lt01 lt01080508 1200 NC NC 1200 1 lt01 lt01 lt01081208 NC NC 400 400 1 lt01 lt01 lt01
Mean 1215 1142 1169 1117 1 lt01 lt01 lt01
Date E coli in Cladophora cfug dwt Microcystins in Cladophora microgg dwt
(Cladophora Extent 0 = None Present 1 = Present in isolated pockets at one location 2 = Present in isolated pockets at all locations 3 = Deposits 1 m2 in area 4= Deposits 1-5 m2 in area 5 = Deposits gt 5 m2 in area)
0
1
2
3
4
5
62508 7208 7908 71608 72308 73008 8608 81308
Water (cfu100mL)Cladophora cfug dwt
Figure 322 E coli in Detached Cladophora and Water at Petoskey State Park 2008
Log
E c
oli C
once
ntra
tion
28
322 Magnus Park The sampling locations for Magnus Park are provided in Figure 323 The beach area was sandy and appeared to be natural Detached Cladophora was present in isolated pockets in the shallow littoral zone and the samples were collected approximately 1 meter from shore
Figure 323 Magnus Park Sampling Locations 2008 (L= Left C=Center R=Right) The results of water and detached Cladophora analyses are summarized in Tables 323 and 324 respectively The mean E coli concentration for the study period was 17 cfu100 mL with one beach sample exceeding 100 c fu100 mL (120 cfu100 mL Table 323) W ater temperatures ranged from 19degC to 21degC T he mean E coli concentration in detached Cladophora was 1554 cfug dwt (Table 324) Microcystins were not detected in the detached Cladophora Detached Cladophora was present in isolated pockets at one location for 4 of the 8 sampling periods (Table 324) E coli concentrations in water and detached Cladophora are displayed in Figure 324 N o correlation was observed between bacterial levels in water and detached algae (Spearmanrsquos RO ρ=059) A statistically significant difference was not observed between beach locations for E coli concentrations in detached Cladophora (Kruskal-Wallis ρ=0054) Station R had the highest concentration of E coli in detached Cladophora (2368 cfug dwt)
29
Table 323 Magnus Park Water Quality Data 2008
ConductanceL C R Mean microScm
062308 5 3 2 3 803 108 19 295070108 2 3 2 2 813 105 19 297070808 77 120 76 91 817 110 19 305071508 1 3 6 3 804 106 20 301072208 6 3 2 4 813 110 21 299072908 9 3 11 8 821 108 21 295080508 4 16 15 12 824 110 21 297081208 18 10 15 14 810 102 21 300
Mean 15 20 16 17 813 107 20 299
E coli in Water Water Chemistry cfu100 ml pH DO (mgl) Temp OC
Date
Table 324 Magnus Park Cladophora Data 2008 (NC=No Cladophora Present NA=Not
Analyzed)
CladophoraL C R Mean Extent RR LR Total
062308 2368 NC 3321 2845 1 lt01 lt01 lt01070108 NC NC NC NC 0 NC NC NC070808 NC NC 1200 1200 1 lt01 lt01 lt01071508 NC NC NC NC 0 NC NC NC072208 NC NC NC NC 0 NC NC NC072908 NC NC 1300 1300 1 lt01 lt01 lt01080508 NC NC NC NC 0 NC NC NC081208 NC NC 870 870 1 lt01 lt01 lt01
Mean 2368 NC 1673 1554 1 lt01 lt01 lt01
Date E coli in Cladophora cfug dwt Microcystins in Cladophora microgg dwt
(Cladophora Extent 0 = None Present 1 = Present in isolated pockets at one location 2 = Present in isolated pockets at all locations 3 = Deposits 1 m2 in area 4= Deposits 1-5 m2 in area 5 = Deposits gt 5 m2 in area)
0
1
2
3
4
5
62508 7208 7908 71608 72308 73008 8608 81308
Water (cfu100mL)Cladophora cfug dwt
Figure 324 E coli in Detached Cladophora and Water at Magnus Park 2008
Log
E c
oli C
once
ntra
tion
30
323 Elk Rapids Park The sampling locations for Elk Rapids Park are provided in Figure 325 The beach area was sandy and appeared to be natural Detached Cladophora was present in isolated pockets in the shallow littoral zone and the samples were collected approximately 1 meter from shore
Figure 325 Elk Rapids Park Sampling Locations 2008 (L= Left C=Center R=Right)
The results of water and detached Cladophora analyses are summarized in Tables 325 and 326 respectively The mean E coli concentration for the study period was 74 cfu100 mL with two sets of beach samples exceeding 100 c fu100 mL (134 cfu100 mL and 292 c fu100 mL Table 325) Water temperatures ranged from 19degC to 21degC The mean E coli concentration in detached Cladophora was 1225 cfug dwt (Table 326) Microcystins were not detected in the detached Cladophora Detached Cladophora was present in isolated pockets at more than one location for 6 of the 8 sampling periods (Table 316) E coli concentrations in water and detached Cladophora are displayed in Figure 314 N o correlation was observed between bacterial levels in water and detached algae (Spearmanrsquos RO ρ=018) A statistically significant difference was observed between beach locations for E coli concentrations in detached Cladophora (Kruskal-Wallis ρ=0030) Station R was significantly different from C and L (Mann-Whitney ρ=0005 and 0003 respectively) Station R was the closest sampling location
31
Table 325 Elk Rapids Park Water Quality Data 2008
ConductanceL C R Mean microScm
062308 155 390 330 292 827 100 19 297070108 23 16 54 31 814 109 19 301070808 44 13 27 28 811 108 19 297071508 22 56 70 49 813 109 20 301072208 57 25 22 35 812 101 21 275072908 90 145 166 134 805 109 21 297080508 4 1 21 9 801 107 21 281081208 25 19 7 17 810 102 21 302
Mean 53 83 87 74 812 11 20 294
E coli in Water Water Chemistry cfu100 ml pH DO (mgl) Temp OC
Date
Table 326 Elk Rapids Park Cladophora Data 2008 (NC=No Cladophora Present NA=Not Analyzed)
Cladophora
L C R Mean Extent RR LR Total062308 724 4111 6900 3912 2 lt01 lt01 lt01070108 322 858 3754 1645 2 lt01 lt01 lt01070808 NC NC 770 770 1 lt01 lt01 lt01071508 NC NC 840 840 1 lt01 lt01 lt01072208 569 670 440 560 2 lt01 lt01 lt01072908 430 1100 1600 1043 2 lt01 lt01 lt01080508 500 700 344 515 2 lt01 lt01 lt01081208 330 448 780 519 2 lt01 lt01 lt01
Mean 479 1314 1928 1225 2 lt01 lt01 lt01
Date E coli in Cladophora cfug dwt Microcystins in Cladophora microgg dwt
(Cladophora Extent 0 = None Present 1 = Present in isolated pockets at one location 2 = Present in isolated pockets at all locations 3 = Deposits 1 m2 in area 4= Deposits 1-5 m2 in area 5 = Deposits gt 5 m2 in area)
0
1
2
3
4
5
62508 7208 7908 71608 72308 73008 8608 81308
Water (cfu100mL)Cladophora cfug dwt
Figure 326 E coli in Detached Cladophora and Water at the Elk Rapids Park 2008
Log
E c
oli C
once
ntra
tion
32
location to the creek which drains a duck pond ne ar the city S tation R had the highest concentration of E coli in detached Cladophora (6900 cfug dwt) 324 Antrim County Day Park The sampling locations for Antrim County Day Park are provided in Figure 327 Three near-shore locations were sampled at a depth of 03 m The beach area was sandy and appeared to be natural Detached Cladophora was common in the shallow littoral zone and the samples were collected approximately 1 meter from shore
Figure 327 Antrim County Day Park Sampling Locations 2008 (L= Left C=Center R=Right)
The results of water and detached Cladophora analyses are summarized in Tables 327 and 328 respectively The mean E coli concentration for the study period was 25 cfu100 mL with one beach sample exceeding 100 c fu100 mL (111 cfu100 mL Table 327) W ater
33
temperatures ranged from 19degC to 21degC T he mean E coli concentration in detached Cladophora was 350 cfug dwt (Table 328) Microcystins were not detected in the detached Cladophora Detached Cladophora was either absent or present in isolated pockets at one location for 7 of the 8 sampling periods and at 2 l ocations during 1 sampling period (Table 318) E coli concentrations in water and detached Cladophora are displayed in Figure 328 No correlation was observed between bacterial levels in water and detached algae (Spearmanrsquos RO ρ=068) A statistically significant difference was not observed between beach locations for E coli concentrations in detached Cladophora (Kruskal-Wallis ρ=027) S tation R had the highest concentration of E coli in detached Cladophora (660 cfug dwt)
Table 327 Antrim County Day Park Water Quality Data 2008
ConductanceL C R Mean microScm
062308 5 2 2 3 813 115 19 310070108 45 31 94 57 817 100 19 300070808 55 42 29 42 820 106 20 284071508 2 1 9 4 815 100 20 296072208 1 3 lt1 1 812 80 21 315072908 111 87 16 71 814 112 21 280080508 3 1 NC 1 811 114 21 292081208 1 2 60 21 817 113 21 296
Mean 28 21 26 25 815 11 20 297
E coli in Water Water Chemistry cfu100 ml pH DO (mgl) Temp OC
Date
Table 328 Antrim County Day Park Cladophora Data 2008 (NC=No Cladophora Present NA=Not Analyzed)
Cladophora
L C R Mean Extent RR LR Total062308 79 61 660 267 2 lt01 lt01 lt01070108 NC NC NC NC 0 NA NA NA070808 NC NC NC NC 0 NA NA NA071508 NC NC NC NC 0 NA NA NA072208 NC NC 440 440 1 NA lt01 NA072908 NC NC NC NC 0 NA NA NA080508 NC NC 344 344 1 NA lt01 NA081208 NC NC NC NC 0 NA NA NA
Mean mdash mdash 481 350 1 mdash lt01 mdash
Date E coli in Cladophora cfug dwt Microcystins in Cladophora microgg dwt
(Cladophora Extent 0 = None Present 1 = Present in isolated pockets at one location 2 = Present in isolated pockets at all locations 3 = Deposits 1 m2 in area 4= Deposits 1-5 m2 in area 5 = Deposits gt 5 m2 in area)
34
0
1
2
3
4
5
62508 7208 7908 71608 72308 73008 8608 81308
Water (cfu100mL)Cladophora cfug dwt
Figure 328 E coli in Detached Cladophora and Water at the Antrim County Day Park 2008
325 East Bay Park The sampling locations for East Bay Park are provided in Figure 329 Three near-shore locations were sampled at depths of 03-05 m The beach area was sandy and appeared to be natural S tation L contained open water while Stations R and C contained Scirpus Detached Cladophora was found at all of the shallow littoral zone locations and the samples were collected approximately 1 meter from shore The results of water and detached Cladophora analyses are summarized in Tables 329 and 3210 respectively The mean E coli concentration for the study period was 25 cfu100 mL with one sample exceeding 100 cfu100 mL (103 cfu100 mL Table 329) Water temperatures ranged from 19degC to 21degC The mean E coli concentration in detached Cladophora was 969 cfug dwt (Table 3210) M icrocystins were not detected in the detached Cladophora Detached Cladophora was present in isolated pockets at more than one location for all of the 8 sampling periods (Table 3210) E coli concentrations in water and detached Cladophora are displayed in Figure 3210 No correlation was observed between bacterial levels in water and detached algae (Spearmanrsquos RO ρ=012) A statistically significant difference was not observed between beach locations for E coli concentrations in detached Cladophora (Kruskal-Wallis ρ=041) Station L had the highest E coli concentration in detached Cladophora (5000 cfug dwt) Station L was the closest sampling location to a storm-water outlet entering Grand Traverse Bay
Log
E c
oli C
once
ntra
tion
35
Figure 329 East Bay Park Sampling Locations 2008 (L= Left C=Center R=Right)
Table 329 East Bay Park Water Quality Data 2008
ConductanceL C R Mean microScm
062308 2 1 3 2 821 106 19 299070108 5 3 NC 3 821 104 19 300070808 4 7 14 8 807 105 19 320071508 17 41 21 26 807 103 20 310072208 41 91 103 78 804 101 21 330072908 51 92 61 68 819 102 21 324080508 8 4 11 8 805 103 21 309081208 7 2 1 8 809 108 21 317
Mean 17 30 27 25 812 10 20 314
E coli in Water Water Chemistry cfu100 ml pH DO (mgl) Temp OC
Date
36
Table 3210 East Bay Park Cladophora Data 2008 (NC=No Cladophora Present NA=Not Analyzed)
Cladophora
L C R Mean Extent RR LR Total062308 5000 2000 1000 2667 3 lt01 lt01 lt01070108 3300 1500 900 1900 3 lt01 lt01 lt01070808 660 500 460 540 3 lt01 lt01 lt01071508 546 600 NC 573 2 lt01 lt01 lt01072208 340 500 600 480 3 lt01 lt01 lt01072908 700 630 NC 665 2 lt01 lt01 lt01080508 935 500 700 712 3 lt01 lt01 lt01081208 325 330 NC 218 2 lt01 lt01 lt01
Mean 1476 820 732 969 3 lt01 lt01 lt01
Date E coli in Cladophora cfug dwt Microcystins in Cladophora microgg dwt
(Cladophora Extent 0 = None Present 1 = Present in isolated pockets at one location 2 = Present in isolated pockets at all locations 3 = Deposits 1 m2 in area 4= Deposits 1-5 m2 in area 5 = Deposits gt 5 m2 in area)
0
1
2
3
4
5
62508 7208 7908 71608 72308 73008 8608 81308
Log
E c
oli C
once
ntra
tion
Water (cfu100mL)Cladophora cfug dwt
Figure 3210 E coli in Detached Cladophora and Water at East Bay Park 2008 326 Traverse City State Park The sampling locations for Traverse City State Park are provided in Figure 3211 Three near-shore locations were sampled at a depth of 03 m The beach area was sandy and appeared to be natural Detached Cladophora was present in isolated pockets in the shallow littoral zone near Mitchell Creek and the samples were collected approximately 1 meter from shore
37
Figure 3211 Traverse City State Park Sampling Locations 2008 (L= Left C=Center R=Right)
The results of water and detached Cladophora analyses are summarized in Tables 3211 and 3212 respectively The mean E coli concentration for the study period was 33 cfu100 mL with one sample exceeding 100 cfu100 mL (195 cfu100 mL Table 3211) W ater temperatures ranged from 19degC to 21degC Station L was the only location at this beach with detached Cladophora and the associated E coli concentrations averaged 1630 cfug dwt The highest concentration E coli in detached Cladophora was 3300 cfug dwt This station was the closest sampling location to Mitchell Creek which has a history of bacterial contamination problems (The Watershed Center 2006) Microcystins were not detected in the detached Cladophora Detached Cladophora was present in isolated pockets at one location for all of the 8 sampling periods (Table 3212) E coli concentrations in water and detached Cladophora are displayed in Figure 3212 No correlation was observed between bacterial levels in water and detached algae (Spearmanrsquos RO ρ=015) A statistically significant difference was observed between beach locations for E coli concentrations in detached Cladophora (Kruskal-Wallis ρ=0001)
38
Table 3211 Traverse City State Park Water Quality Data 2008
ConductanceL C R Mean microScm
062308 1 4 NC 2 816 107 19 301070108 3 5 10 6 815 101 19 305070808 195 37 66 99 815 105 19 296071508 22 48 63 44 820 104 20 297072208 95 88 57 80 801 108 21 299072908 19 10 5 11 802 102 21 300080508 18 14 11 14 825 108 21 294081208 8 6 5 6 805 106 21 294
Mean 45 27 31 33 812 105 20 298
DateE coli in Water Water Chemistry
cfu100 ml pH DO (mgl) Temp OC
Table 3212 Traverse City State Park Cladophora Data 2008 (NC=No Cladophora Present NA=Not Analyzed)
Cladophora
L C R Mean Extent RR LR Total062308 2000 NC NC mdash 1 lt01 lt01 lt01070108 3300 NC NC mdash 1 lt01 lt01 lt01070808 900 NC NC mdash 1 lt01 lt01 lt01071508 750 NC NC mdash 1 lt01 lt01 lt01072208 1200 NC NC mdash 1 lt01 lt01 lt01072908 700 NC NC mdash 1 lt01 lt01 lt01080508 990 NC NC mdash 1 lt01 lt01 lt01081208 3200 NC NC mdash 1 lt01 lt01 lt01
Mean 1630 NC NC mdash 1 lt01 lt01 lt01
Date E coli in Cladophora cfug dwt Microcystins in Cladophora microgg dwt
(Cladophora Extent 0 = None Present 1 = Present in isolated pockets at one location 2 = Present in isolated pockets at all locations 3 = Deposits 1 m2 in area 4= Deposits 1-5 m2 in area 5 = Deposits gt 5 m2 in area)
0
1
2
3
4
5
62508 7208 7908 71608 72308 73008 8608 81308
Water (cfu100mL)Cladophora cfug dwt
Figure 3212 E coli in Detached Cladophora and Water at Traverse City State Park 2008
Log
E c
oli C
once
ntra
tion
39
327 Bryant Park The sampling locations for Bryant Park are provided in Figure 3213 T hree near-shore locations were sampled at a depth of 03 m T he beach area was sandy and appeared to be natural Detached Cladophora was common in the shallow littoral zone and the samples were collected approximately 1 meter from shore
Figure 3213 Bryant Park Sampling Locations 2008 (L= Left C=Center R=Right)
40
The results of water and detached Cladophora analyses are summarized in Tables 3213 and 3214 respectively The mean E coli concentration for the study period was 46 cfu100 mL with one set of samples exceeding 100 cfu100 mL (281 cfu100 mL Table 3213) W ater temperatures ranged from 19degC to 21degC T he mean E coli concentration in detached Cladophora was 1873 cfug dwt (Table 3214) Microcystins were not detected in the detached Cladophora Detached Cladophora was present in isolated pockets at one location for all of the 8 sampling periods (Table 3214) E coli concentrations in water and detached Cladophora are displayed in Figure 3214 No correlation was observed between bacterial levels in water and detached algae (Spearmanrsquos RO ρ=082) A statistically significant difference was not observed between beach locations for E coli concentrations in detached Cladophora (Kruskal-Wallis ρ=048) Station C had the highest concentration of E coli in detached Cladophora (9460 cfug dwt)
Table 3213 Bryant Park Water Quality Data 2008
ConductanceL C R Mean microScm
062308 3 4 11 6 825 105 19 296070108 6 8 5 6 800 102 19 301070808 290 310 243 281 824 100 19 300071508 8 9 4 7 819 106 20 298072208 6 8 3 6 813 103 21 300072908 11 13 22 15 811 104 21 297080508 12 18 15 15 815 107 21 317081208 33 29 1 28 805 101 21 299
Mean 46 50 38 46 814 103 20 301
E coli in Water Water Chemistry cfu100 ml pH DO (mgl) Temp OC
Date
Table 3214 Bryant Park Cladophora Data 2008 (NC=No Cladophora Present NA=Not Analyzed)
Cladophora
L C R Mean Extent RR LR Total062308 980 9460 680 3707 2 lt01 lt01 lt01070108 977 7690 490 3052 2 lt01 lt01 lt01070808 3443 1462 2741 2549 2 lt01 lt01 lt01071508 1300 1800 1567 1556 2 lt01 lt01 lt01072208 990 832 751 858 2 lt01 lt01 lt01072908 111 1643 1565 1106 2 lt01 lt01 lt01080508 1245 890 1443 1193 2 lt01 lt01 lt01081208 1122 844 922 963 2 lt01 lt01 lt01
Mean 1271 3078 1270 1873 2 lt01 lt01 lt01
Date E coli in Cladophora cfug dwt Microcystins in Cladophora microgg dwt
(Cladophora Extent 0 = None Present 1 = Present in isolated pockets at one location 2 = Present in isolated pockets at all locations 3 = Deposits 1 m2 in area 4= Deposits 1-5 m2 in area 5 = Deposits gt 5 m2 in area)
41
0
1
2
3
4
5
62508 7208 7908 71608 72308 73008 8608 81308
Water (cfu100mL)Cladophora cfug dwt
Figure 3214 E coli in Detached Cladophora and Water at Bryant Park 2008 328 Clinch Park The sampling locations for Clinch Park are provided in Figure 3215 T hree near-shore locations were sampled at a depth of 03 m T he beach area was sandy and appeared to be natural Detached Cladophora was present at one location during the last sampling event The sample was collected approximately 05 m from shore The results of water and detached Cladophora analyses are summarized in Tables 3215 and 3216 respectively The mean E coli concentration for the study period was 35 cfu100 mL with one set of samples exceeding 100 cfu100 mL (164 cfu100 mL Table 3215) W ater temperatures ranged from 19degC to 21degC D etached Cladophora was present in an isolated pocket at one location during the August 12 sampling event (Table 3216) E coli was present in detached Cladophora in this sample at a concentration of 680 c fug dwt (Table 3216) Microcystins were not detected in the detached Cladophora E coli concentrations in water and detached Cladophora are displayed in Figure 3216 N o correlation was observed between bacterial levels in water and detached algae (Spearmanrsquos RO ρ=099)
Log
E c
oli C
once
ntra
tion
42
Figure 3215 Clinch Park Sampling Locations 2008 (L= Left C=Center R=Right)
Table 3215 Clinch Park Water Quality Data 2008
ConductanceL C R Mean microScm
062308 22 14 11 16 828 105 19 296070108 1 3 NC 1 801 109 19 300070808 33 19 30 27 805 101 19 310071508 21 18 32 24 816 107 20 302072208 155 170 167 164 802 103 21 302072908 43 21 37 34 801 104 21 307080508 11 7 18 12 830 102 21 299081208 4 2 1 3 822 104 21 298
Mean 36 32 37 35 813 104 20 302
E coli in Water Water Chemistry cfu100 ml pH DO (mgl) Temp OC
Date
43
Table 3216 Clinch Park Cladophora Data 2008 (NC=No Cladophora Present NA=Not Analyzed)
Cladophora
L C R Mean Extent RR LR Total062308 NC NC NC NC 0 lt01 lt01 lt01070108 NC NC NC NC 0 lt01 lt01 lt01070808 NC NC NC NC 0 lt01 lt01 lt01071508 NC NC NC NC 0 lt01 lt01 lt01072208 NC NC NC NC 0 lt01 lt01 lt01072908 NC NC NC NC 0 lt01 lt01 lt01080508 NC NC NC NC 0 lt01 lt01 lt01081208 NC NC 680 680 1 lt01 lt01 lt01
Mean NC NC 680 680 0 lt01 lt01 lt01
Date E coli in Cladophora cfug dwt Microcystins in Cladophora microgg dwt
(Cladophora Extent 0 = None Present 1 = Present in isolated pockets at one location 2 = Present in isolated pockets at all locations 3 = Deposits 1 m2 in area 4= Deposits 1-5 m2 in area 5 = Deposits gt 5 m2 in area)
0
1
2
3
4
5
62508 7208 7908 71608 72308 73008 8608 81308
Water (cfu100mL)Cladophora cfug dwt
Figure 3216 E coli in Detached Cladophora and Water at Clinch Park 2008 329 West End Beach The sampling locations for West End Beach are provided in Figure 3217 T hree near-shore locations were sampled at a depth of 03 m T he beach area was sandy and appeared to be natural Detached Cladophora was common in the shallow littoral zone and the samples were collected approximately 1 meter from shore This beach appeared to be used by pet owners as dogs were frequently present during sampling
Log
E c
oli C
once
ntra
tion
44
Figure 3217 West End Beach Sampling Locations 2008 (L= Left C=Center R=Right)
The results of water and detached Cladophora analyses are summarized in Tables 3217 and 3218 respectively The mean E coli concentration for the study period was 35 cfu100 mL with no samples exceeding 100 c fu100 mL (Table 3217) W ater temperatures ranged from 19degC to 21degC T he mean E coli concentration in detached Cladophora was 2976 cfug dwt (Table 3218) M icrocystins were not detected in the detached Cladophora Detached Cladophora was present in isolated pockets at all locations for 4 of the 8 sampling periods (Table 3218) E coli concentrations in water and detached Cladophora are displayed in Figure 3218 N o correlation was observed between bacterial levels in water and detached algae (Spearmanrsquos RO ρ=028) A statistically significant difference was not observed between beach locations for E coli concentrations in detached Cladophora (Kruskal-Wallis ρ=079) Station C was higher than the other stations with respect to mean E coli concentrations in detached Cladophora (3078 cfug dwt) The highest concentration of E coli in detached Cladophora measured during the study period in Grand Traverse Bay was at West End Beach (22874 cfug dwt at Station C) Dogs frequently were present on this beach at the time of sampling which may be the source of the high bacteria concentrations
45
Table 3217 West End Beach Water Quality Data 2008
ConductanceL C R Mean microScm
062308 5 3 4 4 821 103 19 302070108 3 1 2 2 829 110 19 297070808 34 55 48 46 807 100 19 303071508 46 33 25 35 803 108 20 301072208 66 86 126 93 804 105 21 297072908 6 14 5 8 825 106 21 294080508 100 94 49 81 827 107 21 306081208 22 10 1 14 827 107 21 297
Mean 35 37 33 35 818 106 20 300
E coli in Water Water Chemistry cfu100 ml pH DO (mgl) Temp OC
Date
Table 3218 West End Beach Cladophora Data 2008 (NC=No Cladophora Present NA=Not Analyzed)
Cladophora
L C R Mean Extent RR LR Total062308 1509 76 289 625 2 lt01 lt01 lt01070108 1721 22874 13337 12644 2 lt01 lt01 lt01070808 1016 NC NC 1016 1 lt01 lt01 lt01071508 NC NC 1644 1644 1 lt01 lt01 lt01072208 NC NC NC NC 0 NA NA NA072908 NC NC NC NC 0 NA NA NA080508 1300 1233 1567 1367 2 lt01 lt01 lt01081208 678 444 567 563 2 lt01 lt01 lt01
Mean 1245 6157 3481 2976 1 lt01 lt01 lt01
Date E coli in Cladophora cfug dwt Microcystins in Cladophora microgg dwt
(Cladophora Extent 0 = None Present 1 = Present in isolated pockets at one location 2 = Present in isolated pockets at all locations 3 = Deposits 1 m2 in area 4= Deposits 1-5 m2 in area 5 = Deposits gt 5 m2 in area)
0
1
2
3
4
5
62508 7208 7908 71608 72308 73008 8608 81308
Water (cfu100mL)Cladophora cfug dwt
Figure 3218 E coli in Detached Cladophora and Water at West End Beach 2008
Log
E c
oli C
once
ntra
tion
46
33 Saginaw Bay and Grand Traverse BayLittle Traverse Bay Comparisons
A summary of the project data is presented in Table 331 Mean temperatures for Saginaw Bay were higher than in Grand Traverse BayLittle Traverse Bay (23degC and 20degC respectively) Microcystins in detached Cladophora were absent in Grand Traverse BayLittle Traverse Bay In Saginaw Bay the grand mean of all locations with detached Cladophora was 57 microgg dwt for the study period M ean concentrations of E coli in water were significantly higher (Mann-Whitney ρ=0003) in Grand Traverse BayLittle Traverse Bay (34 cfu100 mL) than in Saginaw Bay (18 cfu100 mL) In contrast mean E coli concentrations in detached Cladophora were higher in Saginaw Bay (2796 cfug dwt) than Grand Traverse BayLittle Traverse Bay (1775 cfug dwt) however the difference was not statistically significant (Mann-Whitney ρ=040) The mean Cladophora extent score for Grand Traverse BayLittle Traverse Bay was 1 indicating that detached algae were found in small pockets T he mean Cladophora extent score for Saginaw Bay was 3 indicating that detached algae were found in 1 m2 deposits
Table 331 Summary of Water Quality and Cladophora Data for Grand Traverse BayLittle Traverse Bay and Saginaw Bay 2008
Parameter Saginaw Bay Grand TraverseLittle Traverse Bay
Mean Temperature 23degC 20degC Mean Total Microcystins 57 microgg dwt lt01 microgg dwt Cladophora Extent Score 3 1 Mean E coli in Water 18 cfu100 mL 34 cfu100 mL Mean E coli in Cladophora 2796 cfug dwt 1775 cfug dwt
(Cladophora Extent 0 = None Present 1 = Present in isolated pockets at one location 2 = Present in isolated pockets at all locations 3 = Deposits 1 m2 in area 4= Deposits 1-5 m2 in area 5 = Deposits gt 5 m2 in area)
40 Discussion The presence of Cladophora has been associated with high levels of E coli and species of potentially pathogenic enteric bacteria in beach sand and swimming waters of the Great Lakes (Whitman et al 2003 Ishii et al 2006 Olapade et al 2006) Enteric bacteria can grow within detached Cladophora under certain conditions (Byappanahalli et al 2005) In addition detached Cladophora deposits can potentially harbor and enhance the survival of pathogenic bacteria released into the environment through point and non-point sources (Byappanahalli et al 2005) Recently Clostridium was found to grow in detached Cladophora in the Great Lakes (Byappanahalli and Whitman 2009) Algal species including Cladophora have been reported to provide nutrients and to protect attached bacteria from environmental stresses desiccation predation and harmful UV radiation (Byappanahalli et al 2005) In this manner Cladophora mats may play a significant role as a source and sink for pathogens in the near-shore environment Based on the results from this investigation Saginaw Bay appears to be more heavily impacted by detached Cladophora than Grand Traverse BayLittle Traverse Bay Eutrophication of lakes has been associated with increases in Cladophora mat production and accumulation (Stevenson et al 2006 Herbst 1969) but water transparency also has been suggested as an important causative factor (Barbiero et al 2006 Bootsma 2007) Elevated levels of nutrients in Saginaw Bay have been reported to stimulate blooms of cyanobacteria in Saginaw Bay and also influence the near-shore environment (Fahnenstiel et al 2008 Millie et al
47
2008) Differences in Cladophora accumulation between the Lake Huron and Lake Michigan sites may be attributed to higher total phosphorus levels (18 microgl vs 5 microgl MDNRE 2006) Levels of E coli in detached Cladophora in both systems were similar to concentrations previously reported in the Great Lakes (3 log10 - 5 log10 Engelbert et al 2008) In Saginaw Bay the highest levels of E coli in detached Cladophora were consistently found at locations near the Saginaw River (Wenona Beach and the Bay City Recreation Area) E ven within individual sites locations near tributaries and drains at Wenona Beach and South Linwood Beach were significantly higher than locations farther away form a point source This relationship also was noted in Grand Traverse Bay where the location near Mitchell Creek at the Traverse City State Park had elevated E coli concentrations in detached Cladophora compared to the other two beach stations At Traverse City State Park Cladophora deposits were present only at the location near Mitchell Creek These results suggest that Cladophora can trap bacteria from point sources and also be stimulated by nutrient discharges Two locations Pinconning Park and Whitersquos Beach had very limited Cladophora growth Both locations had Chara growing on the lake bottom Chara is known to exhibit allelopathic activity that can limit the growth of other aquatic plants (Berger and Schagerl 2004) No correlation was found between E coli levels in the open water (designated beach monitoring locations) and the near-shore zone where the detached Cladophora samples were taken As noted in previous studies Cladophora appears to hold trapped E coli and not release the entrained bacteria into the offshore water (Byappanahalli et al 2003 Engelbert et al 2008) This investigation was the first to document the accumulation of microcystins in the detached Cladophora of Saginaw Bay S aginaw Bay has a history of Microcystis blooms in the late summer months that produce both microcystin LR and RR (Fahnenstiel et al 2008 Millie et al 2008) S ince Microcystis has a high requirement for sunlight cyanobacteria may become stressed when they become trapped in the detached algae deposits Stress has been implicated in initiating cyanotoxin production (Codd 1995) While accidental ingestion by humans of microcystins trapped in Cladophora is unlikely these compounds can act as skin irritants (Bell and Codd 1994) W alking through Cladophora accumulations to get to deeper water may provide sufficient exposure to cause irritation in sensitive individuals if microcystins are present While all of the data suggest that swimming areas (1 m depth) are not impacted by E coli accumulations in detached Cladophora entrained bacteria and cyanotoxins may pose a hazard to children playing in the near-shore water and beach sand While current regulations discourage beach grooming the presence of elevated bacteria and microcystin levels in the near-shore environment of Saginaw Bay suggests that the current policy should balance potential impacts to public health with the ecosystem services provided by coastal wetlands 50 Conclusions An assessment of the ability of Cladophora mats to sequester E coli and microcystin LR and RR was conducted in near-shore waters of Grand Traverse Bay (7 sites) Little Traverse Bay (2 sites) and Saginaw Bay (8 sites) The sampling locations were at public beach access points where Cladophora mats previously have been observed The goals of this research were to determine the spatial and temporal variability of E coli populations in Cladophora mats in these
48
recreational waters and if cyanotoxins (microcystin LR and RR) were sequestered in the detached algae T he collection of Cladophora samples was coordinated with local beach monitoring programs to facilitate the comparison with ambient water bacteria concentrations This project provided important data for the assessment of public health impacts and the development of beach management programs to address the problems associated with Cladophora accumulations Based on the results from this investigation Saginaw Bay appears to be more heavily impacted by detached Cladophora than Grand Traverse BayLittle Traverse Bay Mean E coli concentrations in detached Cladophora were higher in Saginaw Bay (2796 cfug dwt) than Grand Traverse BayLittle Traverse Bay (1775cfug dwt) however the difference was not statistically significant (Mann-Whitney ρ=040) The mean Cladophora extent score for Grand Traverse BayLittle Traverse Bay was 1 indicating that detached alga was consistently found in small pockets at a single location The mean Cladophora extent score for Saginaw Bay was 3 indicating that detached alga was found in 1 m2 deposits at all locations D ifferences in Cladophora accumulation between Saginaw Bay and Grand Traverse BayLittle Traverse Bay may be attributed to higher total phosphorus levels in Saginaw Bay Levels of E coli in detached Cladophora in both systems were similar to concentrations previously reported in the Great Lakes (1000 cfug dwt ndash 60000 cfug dwt) In Saginaw Bay the highest levels of E coli in detached Cladophora were consistently found at locations near the Saginaw River (Wenona Beach and the Bay City Recreation Area) Even within individual sites locations near tributaries and drains at Wenona Beach and South Linwood Beach were significantly higher than locations farther away form a point source This relationship also was noted in Grand Traverse Bay where the location near Mitchell Creek at the Traverse City State Park had elevated E coli concentrations in detached Cladophora compared to the other two beach stations where no detached algae was found These results suggest that Cladophora can trap bacteria from point sources and also be stimulated by nutrient discharges T wo locations Pinconning Park and Whitersquos Beach had very limited Cladophora growth Both locations had Chara growing on the lake bottom Chara is known to exhibit allelopathic activity that can limit the growth of other aquatic plants N o correlation was found between E coli levels in the open water (designated beach monitoring locations) and the near-shore zone where the detached Cladophora samples were taken As noted in previous studies Cladophora appears to hold trapped E coli and does not release the entrained bacteria into the offshore water This investigation was the first to document the accumulation of microcystins in the detached Cladophora of Saginaw Bay Total microcystins in detached Cladophora had a grand mean of 57 microgg dwt for the study period Saginaw Bay has a history of Microcystis blooms in the late summer months that produce both microcystin LR and RR S ince Microcystis has a h igh requirement for sunlight cyanobacteria may become stressed when they become trapped in the detached algae mats W hile accidental ingestion by humans of microcystins trapped in Cladophora is unlikely these compounds can act as skin irritants Walking through Cladophora accumulations to get to deeper water may provide sufficient exposure to cause irritation in sensitive individuals if microcystins are present While all of the data suggest that swimming areas (1 m depth) are not impacted by E coli accumulations in detached Cladophora entrained bacteria and cyanotoxins may pose a hazard to children playing in the near-shore water and beach sand Current regulations discourage beach grooming and altering the near-shore zone The presence of elevated bacteria and microcystin levels in the near-shore environment of
49
Saginaw Bay suggest that the current policy should be reevaluated to balance potential impacts to public health with the ecosystem services provided by coastal wetlands 60 References APHA (American Public Health Association) 1998 Standard Methods for the Evaluation of
Water and Wastewater 20th edition APHA Washington DC Barbiero RP MC Tuchman and ES Millard 2006 Post-dreissenid increases in transparency
during summer stratification in the offshore waters of Lake Ontario Is a reduction in whiting events the cause J Great Lakes Res 32131ndash141
Bartsch A F 1968 Eutrophication is beginning in Lake Michigan 1968 Water Waste Eng 5
84-87 Bell SG and Codd G A 1994 Cyanobacterial toxins and human health Rev Med Microbiol
5256ndash264 Berger J and Schagerl M 2004 Allelopathic activity of Characeae Biologia 599ndash15 Bootsma HA EB Young and JA Berges (eds) 2005 Cladophora research and
management in the Great Lakes Proceedings of workshop December 2004 Special Report No 2005-01 UWM Great Lakes WATER Institute
Boyer G M C Watzin A D Shambaugh M F Satchwell B R Rosen and T Mihuc 2004
The occurrence of cyanobacterial toxins in Lake Champlain In Lake Champlain partnerships and Research in the New Millennium (Proceedings of the Lake Champlain Research Consortium May 20th 2002 Saint-Jean-sur-Richelieu Quebec T Manley Ed p 241-257
Byappanahalli M N D A Shively M B Nevers M J Sadowsky and R L Whitman 2003
Growth and survival of Escherichia coli and enterococci populations in the macro-alga Cladophora (Chlorophyta) FEMS Microbiol Ecol 46203-211
Byappanahalli M N and R L Whitman 2009 Clostridium botulinum type E occurs and grows
in the alga Cladophora glomerata Can J Fish Aquat Sci 66 879ndash882 Codd GA 1995 Cyanobacterial toxins occurrence properties and biological significance
Water Sci Technol 32 149^156 Dodds W K and D A Gudder 1992 The ecology of Cladophora J Phycol 28415-427 Englebert ET McDermott C and GT Kleinheinz 2008 Effects of the nuisance algae
Cladophora on Escherichia coli at recreational beaches in Wisconsin The Science of the Total Environment 404(1)10-17
50
Fahnenstiel G L Millie D F Dyble J Litaker R W Tester P A McCormick M J Rediske R and D Klarer 2008 Microcystin concentrations and cell quotas in Saginaw Bay Lake Huron Aquatic Ecosystems Health and Management 11(2)190 ndash 195
Graham L E 1982 Cytology ultrastructure taxonomy and phylogenetic relationships of Great
Lakes filamentous algae J Great Lakes Res 854-60 Hecky R E R E H Smith D R Barton S J Guildford W D Taylor M N Charlton and
T Howell 2004 The nearshore phosphorus shunt a consequence of ecosystem engineering by dreissenids in the Laurentia Great Lakes Can J Fish Aquat Sci 611285-1293
Herbst RP 1969 Ecological factors and the distribution of Cladophora glomerata in the Great
Lakes Am Midl Nat 8290ndash98 Higgins S N E T Howell R E Hecky S J Guildford and REH Smith 2005 The wall of
green The status of Cladophora glomerata on the northern shores of Lake Eries eastern basin 1995-2002 J Gt Lakes Res 31 547-563
Hydrolab 1998 DataSonde 4a Userrsquos Manual Hydrolab Corporation Austin TX Ishii S T Yan DA Shively MN Byappanahalli RL Whitman and MJ Sadowsky 2006
Cladophora (Chlorophyta) spp harbor human bacterial pathogens in nearshore water of Lake Michigan Appl Environ Microbiol 72 (7)4545ndash4553
Joska A M and J J Bolton 1996 Filamentous freshwater macroalgae in South Africa ndash a
literature review and perspective on the development and control of weed problems Hydrobiologia 340 295-300
Keilty T and Woller M 2004 Final Report prepared for the USEPA-GLNPO by the Leelanau
Watershed Council Leelanau Conservancy L a n d s b e r g J H 2 0 0 2 T h e e f f e c t s o f h a r m f u l
a l g a l b l o o m s o n a q u a t i c o r g a n i s m s R e v F i s h S c i 1 0 1 1 3 ndash 3 9 0
Lawrence JF Niedzwiadek B Menard C Lau BP-Y Kuiper-Goodman T Carbone S
Holmes C 2001 Comparison of HPLC-mass spectrometry ELISA and phosphatase assay for the determination of microcystins in blue-green algae products J AOAC Int 841035-1044
MDNRE 2006 Water Quality Monitoring of Saginaw and Grand Traverse Bays Michigan
Department of Natural Resources and Environment Lansing MI MIDEQWB-06096 Millie D G Fahnenstiel J Dyble R Litaker P Tester M McCormick R Rediske and D
Klarer 2008 Influence of environmental conditions on summer cyanobacterial abundance in Saginaw Bay Lake Huron Aquatic Ecosystems Health and Management 11(2)196ndash205
51
Mills E L J M Casselman R Dermott J D Fitzsimons G Gal K T Holeck J A Hoyle OE Johannsson B F Lantry J C Makarewicz E S Millard I F Munawar M Munawar R OGorman R W Owens L G Rudstam T Schaner and T J Stewart 2003 Lake Ontario Food web dynamics in a changing ecosystem (1970-2000) Can J Fish Aquat Sci 60 471ndash490
Neil J H and M B Jackson 1982 Monitoring Cladophora growth conditions and the effect of
phosphorus additions at a shoreline site in northeastern Lake Erie J Great Lakes Res 830-34
Olapade O A M M Depas E T Jensen and S L McLellan 2006 Microbial communities
and fecal indicator bacteria associated with Cladophora mats on beach sites along Lake Michigan shores Appl Environ Microbiol 721932-1938
Painter D S and G Kamaitis 1987 Reduction of Cladophora biomass and tissue phosphorus
in Lake Ontario 1972-1983 Can J Fish Aquat Sci 44 2212-2215 Stevenson RJ ST Rier CM Riseng RE Shultz and MJ Wiley 2006 Comparing effects
of nutrients on algal blooms in streams in two regions with different disturbance regimes and with application for developing nutrient criteria Hydrobiologia 561149ndash165
Taft C E 1975 History of Cladophora in the Great Lakes In H Shear and D E Konasewich
[eds] Cladophora in the Great Lakes International Joint Commission The Watershed Center 2006 Tributary Monitoring Data The Watershed Center Traverse City
MI Vanderploeg HA Liebig JR Carmichael WW Agy MA Johengen TH Fahnenstiel GL
amp Nalepa TF 2001 Zebra mussel (Dreissena polymorpha) selective filtration promoted toxic Microcystis blooms in Saginaw Bay (Lake Huron) and Lake Erie Can J Fish Aquat Sci 58 1208ndash1221
Whitman R L D A Shively H Pawlik M B Nevers and M N Byappanahalli 2003
Occurrence of Escherichia coli and enterococci in Cladophora (Chlorophyta) in nearshore water and beach sand of Lake Michigan Appl Environ Microbiol 694714-4719
Wilson K A E T Howell and D A Jackson 2006 Replacement of Zebra Mussels by
Quagga Mussels in the Canadian nearshore of Lake Ontario Distribution and correlations with substrate Round Goby abundance and upwelling frequency J Gt Lakes Res 3211-28
Zhu B D G Fitzgerald C M Mayer L G Rudstam and E L Mills 2006 Alteration of
ecosystem function by Zebra Mussels in Oneida Lake Impacts on submerged macrophytes Ecosystems 9 1017-1028
- Assessment of E coli and Microcystins in Cladophora Mats in the Nearshore Waters of Grand Traverse Bay Little Traverse Bay and Saginaw Bay
- May 2010
- TABLE OF CONTENTS
- LIST OF TABLES
- LIST OF FIGURES
- Acknowledgements
- Executive Summary
- 10 Introduction
- 20 Methods
-
- 21 Sampling methods
-
- 211 Sampling Design
- 212 Sampling Methods
-
- 22 Analytical Methods
-
- 221 Hydrolab Methods
- 222 E coli Analysis
- 223 Sample Preparation for Microcystin Analysis
- 244 Microcystin LR and RR by LCMS
-
- 30 Results
-
- 31 Saginaw Bay E coli Microcystin and Water Chemistry Results
-
- 311 Wenona Beach
- 312 Bay City Recreation Area
- 313 Brissette Beach
- 314 South Linwood Beach
- 315 Pinconning Park
- 316 Whitersquos Beach
- 317 Arenac County Park
- 318 Foster Road Beach
-
- 32 Grand Traverse Bay and Little Traverse Bay E coli Microcystin and Water Chemistry Results
-
- 321 Petoskey State Park
- 322 Magnus Park
- 323 Elk Rapids Park
- 324 Antrim County Day Park
- 325 East Bay Park
- 326 Traverse City State Park
- 327 Bryant Park
- 328 Clinch Park
- 329 West End Beach
-
- 33 Saginaw Bay and Grand Traverse BayLittle Traverse Bay Comparisons
-
- 40 Discussion
- 50 Conclusions
- 60 References
-

4
Figure 22 Saginaw Bay Sampling Locations The extent of Cladophora accumulation was determined at each sampling location according to the ranking
bull 0 = No visible Cladophora bull 1 = Cladophora present in isolated pockets at one location bull 2 = Cladophora present in isolated pockets at all locations bull 3 = Cladophora residue 1 m2 in area bull 4 = Cladophora residue 1-5 m2 in area bull 5 = Cladophora gt 5 m2 in area
5
22 Analytical Methods
Laboratory procedures have been selected based on previous use for water quality investigations established ranges for accuracyprecision and limited problems related to matrix interferences A summary of analytical methods is given in Table 21 Method summaries are provided in the following sections 221 Hydrolab Methods Hydrolab measurements of pH temperature dissolved oxygen and specific conductance were conducted according to the methods in the instrument users manual (Hydrolab 1998) T he Hydrolab Datasonde 4a was calibrated in the lab prior to use in the field The instrument was placed in the water at each site and the technician waited for a s table reading of the sensors Measurements were recorded at 05 m depth at each station P recision was assessed by the measurement of field duplicates at 10 of the stations
Table 21 Laboratory Analytical Methods
222 E coli Analysis Samples of E coli were prepared by elutriation with phosphate buffer (Whitman et al 2003) One gram portions of homogenized algal samples were weighed and placed in sterile 15- milliliter (mL) centrifuge tubes Nine mL of sterile phosphate-buffered diluent water (pH 68) was added and the mixture was vigorously shaken for 2 min and then centrifuged briefly (45 s) at 2000 rpm to allow the large particles to settle The diluted sample then was analyzed by the Colilert-18 (IDEXX) using the Quanti-Tray 2000 (APHA 1998) A 1 mL aliquot was removed from the centrifuge tube and transferred to 99 mL of sterile phosphate buffer in a sterile water sampling vial The Colilert reagent then was then added to the vial and shaken until dissolved The sample and reagents were then added to the Quanti-Tray 2000 and sealed with the Quanti-Tray sealer T he tray was incubated for 18 ho urs at 35degC plusmn 05degC and read under UV light Fluorescent colonies were counted and the number of colony forming units (cfu)100 mL was calculated according to the manufacturerrsquos instructions
Parameter Preparation Preservation Holding Time Methods Reference
pH Hydrolab 1998 Dissolved Oxygen Hydrolab 1998
Temperature Hydrolab 1998 Specific conductance Hydrolab 1998
Microcystin LR and RR by LCMS
Filtration methanol extraction C-18
cartridge Freeze -30degC 6 mo Lawerence et al 2001
Boyer et al 2004
E coli Phosphate buffer extraction Cool 4degC 6 hrs
Whitman et al 2003 Colilert-18
APHA 1998
6
223 Sample Preparation for Microcystin Analysis
Water samples for the analyses of microcystin were prepared according to methods outlined by Lawerence et al (2001) A 100-500 mL aliquot was filtered through a Whatman GFC glass fiber filter The filter then was placed in a 5 mL centrifuge tube and lyophilized for 8 hours The filter residue was extracted with three successive aliquots of methanol followed by sonication The methanol extract was evaporated to dryness under nitrogen and re-dissolved in 1 mL of 50 methanol in water This mixture was passed through a 1 gram (g) SPE C-18 cartridge (Baker) that had been preconditioned with 10 mL of methanol followed by 10 mL of water The cartridge then was washed with 5 mL of 25 methanol in water and the eluted fraction was discarded The microcystins then were eluted with 4 mL of 100 methanol in water This fraction was collected and the volume reduced to 2 mL The volume was adjusted back to 3 mL with methanol and split into three 1 mL aliquots for HPLCMS analysis
244 Microcystin LR and RR by LCMS Samples for Liquid ChromatographyMass Spectrometry (LCMS) analysis were filtered using Gelman AE binderless glass fiber filters The cells were lysed by freezing and then vortexed for 5 minutes in centrifuge tubes containing 10 mL of aqueous (5050) methanol to extract toxins Suspensions were centrifuged and the supernatant was filtered through 045 micron nylon filters The concentrations of microcystin LR and RR were determined by liquid chromatography-tandem mass spectrometry using a Finnigan Surveyor MSQ LCMS Nodularin was added to the extracts and used as an internal standard Compounds were separated on a Phenomenex Luna C18 column at 50oC The mobile phase was a binary gradient of water and methanol both containing 01 formic acid T he initial gradient started with 95 water and 5 methanol followed by a step change to 50 water and 50 methanol at 3 minutes with a linear gradient from 5 t o 20 m inutes to 5 water and 95 methanol Instrument detection limits for these toxins were determined to be 1 microgramliter (microgl) For calibration a series of 5 solutions were prepared with the internal standard at 1000 microgl and the analytes in the range of 1 to 500 microgl in final volumes of 1 mL of 9010 watermethanol 30 Results The results of E coli water chemistry and microcystins data from each location are presented for Saginaw Bay and Grand Traverse BayLittle Traverse Bay in Sections 31 and 32 respectively A comparison of the two basins is provided in Section 33
31 Saginaw Bay E coli Microcystin and Water Chemistry Results
311 Wenona Beach The sampling locations for Wenona Beach are provided in Figure 311 Near-shore locations were sampled at a depth of 03 m The beach area was covered with reed canary grass sedges and cattails Cattails and detached Cladophora were common in the shallow littoral zone and the samples were collected approximately 1 meter outside of the macrophyte zone The detached
7
Cladophora also was common at the sampling locations with some areas of fresh Cladophora growing on submerged rocks and woody debris
Figure 311 Wenona Beach Sampling Locations 2008 (L= Left C=Center R=Right) The results of water and detached Cladophora analyses are summarized in Tables 311 and 312 respectively The mean E coli concentration for the study period was 14 cfu100 mL with no single beach samples exceeding 100 cfu100 mL (Table 311) Water temperatures ranged from 21degC to 25degC The mean E coli concentration for detached Cladophora was 9775 cfug dwt (Table 312) Microcystins were detected in the detached Cladophora beginning in July with mean concentrations of 47 microgg dwt 47 microgg dwt and 103 microgg dwt for microcystin RR microcystin LR and total microcystins respectively Detached Cladophora was present in
8
Table 311 Wenona Beach Water Quality Data 2008
ConductanceL C R Mean microScm
062308 10 8 18 12 792 77 21 440070108 78 44 82 68 810 78 22 470070808 3 4 2 3 814 74 23 451071508 2 1 1 1 817 75 24 450072208 5 6 1 4 816 73 24 456072908 33 8 7 16 810 72 25 453080508 4 7 4 5 813 76 24 461081208 4 2 3 3 811 79 24 467
Mean 17 10 15 14 81 76 23 456
cfu100 mlDateE coli in Water Water Chemistry
pH DO (mgl) Temp OC
Table 312 Wenona Beach Cladophora Data 2008
CladophoraL C R Mean Extent RR LR Total
062308 448 733 22507 7896 5 lt 01 lt 01 lt 01070108 800 2331 25432 9521 5 lt 01 1 lt 01070808 1279 3561 31566 12135 5 12 11 23071508 610 500 1678 929 3 15 23 38072208 1892 2000 3578 2490 5 27 34 61072908 5631 5633 64132 25132 5 68 80 148080508 6322 4531 25346 12066 5 80 80 161081208 3313 2311 18462 8029 5 82 102 184
Mean 2537 2700 24088 9775 5 47 47 103
Microcystins in Cladophora microgg dwtDate E coli in Cladophora cfug dwt
(Cladophora Extent 0 = None Present 1 = Present in isolated pockets at one location 2 = Present in isolated pockets at all locations 3 = Deposits 1 m2 in area 4= Deposits 1-5 m2 in area 5 = Deposits gt 5 m2 in area)
deposits of gt5 m2 at all locations during the sampling period (Table 312) E coli concentrations in water and detached Cladophora are displayed in Figure 312 No correlation was observed between bacterial levels in water and detached algae (Spearmanrsquos RO ρ=014) The drop in E coli levels observed on July 15 was after a storm that had occurred on July 12 A statistically significant difference was observed between beach locations for E coli concentrations in detached Cladophora (Kruskal-Wallis ρ=00004) Station R was significantly different from C and L (Mann-Whitney ρ=0012 and 0010 respectively) S tation R was the closest sampling location to the Saginaw River Station R had the highest concentration of E coli in detached Cladophora (64132 cfug dwt) This bacterial concentration was the highest level observed during the study period
9
0
1
2
3
4
5
62508 7208 7908 71608 72308 73008 8608 81308
Log
E c
oli
Con
cent
ratio
n
Water (cfu100mL)Cladophora cfug dwt
Figure 312 E coli in Detached Cladophora and Water at Wenona Beach 2008 312 Bay City Recreation Area The sampling locations for the Bay City Recreation Area are provided in Figure 313 Three near-shore locations were sampled at a depth of 03 m The beach area was sandy and appeared to be groomed Detached Cladophora was common in the shallow littoral zone and the samples were collected approximately 1 meter from shore The results of water and detached Cladophora analyses are summarized in Tables 313 and 314 respectively The mean E coli concentration for the study period was 6 cfu100 mL with no single beach sample exceeding 100 cfu100 mL (Table 313) Water temperatures ranged from 21degC to 24degC The mean E coli concentration in detached Cladophora was 3216 cfug dwt (Table 314) Microcystins were detected in the detached Cladophora beginning in June with mean concentrations of 96 microgg dwt 129 microgg dwt and 225 microgg dwt for microcystin RR microcystin LR and total microcystins respectively The highest concentrations of microcystins were found on August 12 at the Bay City Recreation area (microcystin RR 364 microgg dwt microcystin LR 349 microgg dwt and total microcystins 714 microgg dwt) Detached Cladophora covered the entire beach for all but one of the sampling events E coli concentrations in water and detached Cladophora are displayed in Figure 314 No correlation was observed between bacterial levels in the water and the detached algae (Spearmanrsquos RO ρ=008) The drop in E coli levels observed on July 15 was after a storm that had occurred on July 12 A statistically significant difference was not observed between beach locations for E coli concentrations in detached Cladophora (Kruskal-Wallis ρ=00073) Station R had the highest concentration of E coli in detached Cladophora (8923 cfug dwt)
10
Figure 313 Bay City Recreation Area Sampling Locations 2008 (L= Left C=Center R=Right)
Table 313 Bay City Recreation Area Water Quality Data 2008
ConductanceL C R Mean microScm
062308 10 8 24 14 792 77 21 420070108 1 2 6 3 811 78 22 437070808 3 4 47 18 816 75 23 445071508 2 1 1 1 816 74 23 436072208 1 1 1 1 816 73 24 436072908 4 8 1 4 812 77 24 446080508 4 7 4 5 817 78 24 448081208 1 2 1 1 811 81 24 449
Mean 3 4 11 6 811 77 23 440
E coli in Water Water Chemistry cfu100 ml pH DO (mgl) Temp OC
Date
11
Table 314 Bay City Recreation Area Cladophora Data 2008
CladophoraL C R Mean Extent RR LR Total
062308 1432 856 3456 1915 5 1 1 2070108 1333 963 2564 1620 5 2 7 9070808 4222 4563 8923 5903 5 14 33 47071508 1100 1245 1344 1230 3 32 49 81072208 1632 2000 7843 3825 5 65 99 164072908 998 5633 8564 5065 5 56 219 275080508 2331 4531 3564 3475 5 231 275 505081208 3223 2311 2564 2699 5 364 349 714
Mean 2034 2763 4853 3216 5 96 129 225
Date E coli in Cladophora cfug dwt Microcystins in Cladophora microgg dwt
(Cladophora Extent 0 = None Present 1 = Present in isolated pockets at one location 2 = Present in isolated pockets at all locations 3 = Deposits 1 m2 in area 4= Deposits 1-5 m2 in area 5 = Deposits gt 5 m2 in area)
0
1
2
3
4
5
62508 7208 7908 71608 72308 73008 8608 81308
Log
E c
oli
Con
cent
ratio
n
Water (cfu100mL)Cladophora cfug dwt
Figure 314 E coli in Detached Cladophora and Water at the Bay City Recreation Area 2008
313 Brissette Beach The sampling locations for Brissette Beach are provided in Figure 315 T hree near-shore locations were sampled at a depth of 03 m T he beach area was sandy and appeared to be groomed Detached Cladophora was common in the shallow littoral zone and the samples were collected approximately 1-2 m from shore
12
Figure 315 Brissette Beach Sampling Locations 2008 (L= Left C=Center R=Right)
The results of water and detached Cladophora analyses are summarized in Tables 315 and 316 respectively The mean E coli concentration for the study period was 7 cfu100 mL with no single beach sample exceeding 100 cfu100 mL (Table 315) Water temperatures ranged from 21degC to 24degC The mean E coli concentration in detached Cladophora was 768 cfug dwt (Table 316) Microcystins were detected in the detached Cladophora beginning in June with mean concentrations of 9 microgg dwt 15 microgg dwt and 23 microgg dwt for microcystin RR microcystin LR and total microcystins respectively Detached Cladophora was present in deposits of 1-5 m2 at all locations during the sampling period except after the storm event on July 12 (Table 316) E coli concentrations in the water and detached Cladophora are displayed in Figure 316 No correlation was observed between bacterial levels in water and detached algae (Spearmanrsquos RO ρ=083) A statistically significant difference was not observed between beach locations for E coli concentrations in detached Cladophora (Kruskal-Wallis ρ=0053) Station R had the highest concentration of E coli in detached Cladophora (1848 cfug dwt)
13
Table 315 Brissette Beach Water Quality Data 2008
ConductanceL C R Mean microScm
062308 3 2 1 2 789 77 21 400070108 15 22 35 24 812 78 22 440070808 1 1 1 1 819 75 23 433071508 2 1 3 2 812 74 23 434072208 1 1 7 3 812 73 24 444072908 16 37 16 23 818 77 24 439080508 1 2 1 1 819 78 24 445081208 1 2 6 3 813 81 24 447
Mean 5 9 9 7 812 77 23 435
E coli in Water Water Chemistry cfu100 ml pH DO (mgl) Temp OC
Date
Table 316 Brissette Beach Cladophora Data 2008
CladophoraL C R Mean Extent RR LR Total
062308 618 1045 1848 1170 4 05 07 1070108 450 533 460 481 4 01 07 1070808 655 784 989 809 4 23 37 6071508 411 333 450 398 2 09 77 9072208 644 755 877 759 4 35 131 17072908 755 766 864 795 4 18 142 16080508 644 532 436 537 4 213 285 50081208 1033 1200 1344 1192 4 388 494 88
Mean 651 744 908 768 4 9 15 23
Date E coli in Cladophora cfug dwt Microcystins in Cladophora microgg dwt
(Cladophora Extent 0 = None Present 1 = Present in isolated pockets at one location 2 = Present in isolated pockets at all locations 3 = Deposits 1 m2 in area 4= Deposits 1-5 m2 in area 5 = Deposits gt 5 m2 in area)
0
1
2
3
4
5
62508 7208 7908 71608 72308 73008 8608 81308
Log
E c
oli
Conc
entra
tion Water (cfu100mL)
Cladophora cfug dwt
Figure 316 E coli in Detached Cladophora and Water at Brissette Beach 2008
14
314 South Linwood Beach The sampling locations for South Linwood Beach are provided in Figure 317 Three near-shore locations were sampled at a depth of 03 m T he beach area was sandy and appeared to be groomed Detached Cladophora was common in the shallow littoral zone and the samples were collected approximately 1-2 m from shore
Figure 317 South Linwood Beach Sampling Locations 2008 (L= Left C=Center R=Right)
15
The results of water and detached Cladophora analyses are summarized in Tables 317 and 318 respectively The mean E coli concentration for the study period was 9 cfu100 mL with no single beach sample exceeding 100 cfu100 mL (Table 317) Water temperatures ranged from 21degC to 24degC The mean E coli concentration in detached Cladophora was 1191 cfug dwt (Table 318) Microcystins were detected in the detached Cladophora beginning in July with mean concentrations of 12 microgg dwt 15 microgg dwt and 27 micro gg dwt for microcystin RR microcystin LR and total microcystins respectively D etached Cladophora was present in deposits of 1-5 m2 at all locations during the sampling period except after the storm event on July 12 (Table 318) E coli concentrations in water and detached Cladophora are displayed in Figure 318 No correlation was observed between bacterial levels in water and detached algae (Spearmanrsquos RO ρ=0061) E coli levels in detached Cladophora were significantly higher than water concentrations (Mann-Whitney ρlt0001) A statistically significant difference was not observed between beach locations for E coli concentrations in detached Cladophora (Kruskal-Wallis ρ=00046) Station L was significantly different from C and R (Mann-Whitney ρ=00002 and 0038 respectively) Station L was the closest sampling location to a drainage ditch that enters South Linwood Beach This station had the highest concentration of E coli in detached Cladophora (4888 cfug dwt)
Table 317 South Linwood Beach Water Quality Data 2008
ConductanceL C R Mean microScm
062308 1 lt 1 1 1 792 77 21 420070108 1 2 15 6 816 77 22 433070808 1 2 2 1 815 76 23 439071508 2 1 1 1 816 76 23 448072208 1 1 10 4 819 76 24 439072908 35 66 76 59 811 76 24 446080508 1 1 1 1 811 76 24 431081208 1 2 3 2 814 77 24 431
Mean 5 11 14 9 812 76 23 436
E coli in Water Water Chemistry cfu100 ml pH DO (mgl) Temp OC
Date
Table 318 South Linwood Beach Cladophora Data 2008
CladophoraL C R Mean Extent RR LR Total
062308 1412 390 716 839 4 lt01 lt01 lt01070108 2452 60 190 901 4 lt01 lt01 lt01070808 655 784 989 809 4 15 21 4071508 150 76 89 105 2 10 25 3072208 3324 2314 1964 2534 4 13 27 4072908 2353 756 812 1307 4 164 140 30080508 1325 533 834 897 4 170 240 41081208 4888 845 674 2136 4 350 430 78
Mean 2070 720 784 1191 4 12 15 27
Date E coli in Cladophora cfug dwt Microcystins in Cladophora microgg dwt
(Cladophora Extent 0 = None Present 1 = Present in isolated pockets at one location 2 = Present in isolated pockets at all locations 3 = Deposits 1 m2 in area 4= Deposits 1-5 m2 in area 5 = Deposits gt 5 m2 in area)
16
0
1
2
3
4
5
62508 7208 7908 71608 72308 73008 8608 81308
Log
E c
oli
Con
cent
ratio
n Water (cfu100mL)Cladophora cfug dwt
Figure 318 E coli in Detached Cladophora and Water at South Linwood Beach 2008 315 Pinconning Park The sampling locations for Pinconning Park are provided in Figure 319 T hree near-shore locations were sampled at depths of 03-05 m The beach area was sandy and appeared to be groomed Station L contained open water while Stations R and L contained Typha and Scirpus Chara also was present along the lake bottom suggesting groundwater influx Detached Cladophora was found only in isolated areas of the shallow littoral zone and the samples were collected approximately 1 meter from shore The results of water and detached Cladophora analyses are summarized in Tables 319 and 3110 respectively The mean E coli concentration for the study period was 3 cfu100 mL with no single beach sample exceeding 100 cfu100 mL (Table 313) Water temperatures ranged from 21degC to 24degC The mean E coli concentration in detached Cladophora was 299 cfug dwt (Table 314) Microcystins were detected in the detached Cladophora beginning in July with mean concentrations of 07 microgg dwt 3 microgg dwt and 4 microgg dwt for microcystin RR microcystin LR and total microcystins respectively Detached Cladophora was present in isolated pockets at all locations for only 3 of the 8 s ampling periods (Table 3110) E coli concentrations in water and detached Cladophora are displayed in Figure 314 No correlation was observed between bacterial levels in water and detached algae (Spearmanrsquos RO ρ=011) The drop in E coli levels observed on July 15 was after a storm that had occurred on July 12 A statistically significant difference was not observed between beach locations for E coli concentrations in detached Cladophora (Kruskal-Wallis ρ=0073) S tation C had the highest concentration of E coli in detached Cladophora (1454 cfug dwt)
17
Figure 319 Pinconning Park Sampling Locations 2008 (L= Left C=Center R=Right)
Table 319 Pinconning Park Water Quality Data 2008
ConductanceL C R Mean microScm
062308 1 2 1 1 756 77 21 460070108 1 2 1 1 816 76 22 464070808 2 1 3 2 817 77 23 463071508 2 1 3 2 810 76 23 475072208 1 1 1 1 815 77 24 474072908 4 8 9 7 812 76 24 466080508 4 2 lt 1 2 811 76 24 470081208 1 2 9 4 815 77 24 470
Mean 2 2 3 3 806 77 23 468
E coli in Water Water Chemistry cfu100 ml pH DO (mgl) Temp OC
Date
18
Table 3110 Pinconning Park Cladophora Data 2008 (NC=No Cladophora Present NA=Not Analyzed)
Cladophora
L C R Mean Extent RR LR Total062308 NC NC NC NC 0 NA NA NA070108 NC NC NC NC 0 NA NA NA070808 NC NC NC NC 0 NA NA NA071508 NC NC NC NC 0 NA NA NA072208 NC NC NC NC 0 NA NA NA072908 50 64 40 51 2 08 12 2080508 634 1454 188 759 2 09 18 3081208 184 18 56 86 2 07 98 10
Mean 289 512 95 299 1 07 3 4
Date E coli in Cladophora cfug dwt Microcystins in Cladophora microgg dwt
(Cladophora Extent 0 = None Present 1 = Present in isolated pockets at one location 2 = Present in isolated pockets at all locations 3 = Deposits 1 m2 in area 4= Deposits 1-5 m2 in area 5 = Deposits gt 5 m2 in area)
0
1
2
3
4
5
62508 7208 7908 71608 72308 73008 8608 81308
Log
E c
oli
Con
cent
ratio
n Water (cfu100mL)Cladophora cfug dwt
Figure 3110 E coli in Detached Cladophora and Water at Pinconning Park 2008 316 Whitersquos Beach The sampling locations for Whitersquos Beach are provided in Figure 3111 Three near-shore locations were sampled at depths of 03-05 m The beach area was sandy and appeared to be groomed Station L contained open water while Stations R and C contained Scirpus Chara also was present along the lake bottom suggesting groundwater influx Detached Cladophora was only found in isolated areas of the shallow littoral zone and the samples were collected approximately 1 meter from shore The results of water and detached Cladophora analyses are summarized in Tables 3111 and 3112 respectively The mean E coli concentration for the study period was 16 cfu100 mL with no single beach sample exceeding 100 cfu100 mL (Table 3111) Water temperatures
19
Figure 3111 Whitersquos Beach Sampling Locations 2008 (L= Left C=Center R=Right) ranged from 21degC to 24degC Detached Cladophora was present in only one sample and the concentration of E coli in the algae was 130 cfug dwt (Table 3112) Microcystin LR was detected in the detached Cladophora in only one sample in August (13 microgg dwt) Detached Cladophora was present only in the August 5 s ample at Station L (Table 3110) E coli concentrations in water and detached Cladophora are displayed in Figure 3112 No correlation was observed between bacterial levels in water and detached algae (Spearmanrsquos RO ρ=0007)
20
Table 3111 Whitersquos Beach Water Quality Data 2008
ConductanceL C R Mean microScm
062308 3 8 3 5 759 77 21 430070108 4 6 5 5 815 77 22 442070808 3 4 8 5 816 76 23 435071508 2 1 2 2 816 76 23 432072208 22 16 13 17 817 77 24 440072908 4 8 6 6 814 77 24 431080508 41 73 60 58 816 77 24 449081208 32 28 42 34 810 77 24 447
Mean 14 18 17 16 808 77 23 438
E coli in Water Water Chemistry cfu100 ml pH DO (mgl) Temp OC
Date
Table 3112 Whitersquos Beach Cladophora Data 2008 (NC=No Cladophora Present NA=Not
Analyzed)
CladophoraL C R Mean Extent RR LR Total
062308 NC NC NC NC 0 NA NA NA070108 NC NC NC NC 0 NA NA NA070808 NC NC NC NC 0 NA NA NA071508 NC NC NC NC 0 NA NA NA072208 NC NC NC NC 0 NA NA NA072908 NC NC NC NC 0 NA NA NA080508 130 NC NC mdash 1 NA 13 13081208 NC NC NC NC 0 NA NA NA
Mean 130 NC NC mdash 0 NA mdash mdash
Date E coli in Cladophora cfug dwt Microcystins in Cladophora microgg dwt
(Cladophora Extent 0 = None Present 1 = Present in isolated pockets at one location 2 = Present in isolated pockets at all locations 3 = Deposits 1 m2 in area 4= Deposits 1-5 m2 in area 5 = Deposits gt 5 m2 in area)
0
1
2
3
4
5
62508 7208 7908 71608 72308 73008 8608 81308
Water (cfu100mL)Cladophora cfug dwt
Figure 3112 E coli in Detached Cladophora and Water at Whitersquos Beach 2008
Log
E c
oli C
once
ntra
tion
21
317 Arenac County Park The sampling locations for Arenac County Park are provided in Figure 3113 Three near-shore locations were sampled at a depth of 03 m T he beach area was sandy and appeared to be groomed Detached Cladophora was common in the shallow littoral zone and the samples were collected approximately 1 meter from shore
Figure 3113 Arenac County Park Sampling Locations 2008 (L= Left C=Center R=Right)
The results of water and detached Cladophora analyses are summarized in Tables 3113 and 3114 respectively The mean E coli concentration for the study period was 25 cfu100 mL with only one beach sample exceeding 100 c fu100 mL (Station L 111 cfu100 mL Table 313) Water temperatures ranged from 21degC to 25degC The mean E coli concentration in
22
Table 3113 Arenac County Park Water Quality Data 2008
ConductanceL C R Mean microScm
062308 5 2 2 3 813 115 19 310070108 45 31 94 57 817 100 19 300070808 55 42 29 42 820 106 20 284071508 2 1 9 4 815 100 20 296072208 1 3 lt1 1 812 80 21 315072908 111 87 16 71 814 112 21 280080508 3 1 NC 1 811 114 21 292081208 1 2 60 21 817 113 21 296
Mean 28 21 26 25 815 11 20 297
E coli in Water Water Chemistry cfu100 ml pH DO (mgl) Temp OC
Date
Table 3114 Arenac County Park Cladophora Data 2008
CladophoraL C R Mean Extent RR LR Total
062308 1811 1144 2699 1885 4 lt01 lt01 lt01070108 1801 1327 3258 2129 4 3 2 5070808 38 175 290 168 2 1 3 4071508 56 87 84 76 2 4 9 13072208 130 223 433 262 3 3 13 16072908 56 88 53 66 4 9 19 27080508 240 670 810 573 3 28 43 70081208 1300 1670 1890 1620 4 90 158 248
Mean 679 673 1190 847 3 20 35 55
Date E coli in Cladophora cfug dwt Microcystins in Cladophora microgg dwt
(Cladophora Extent 0 = None Present 1 = Present in isolated pockets at one location 2 = Present in isolated pockets at all locations 3 = Deposits 1 m2 in area 4= Deposits 1-5 m2 in area 5 = Deposits gt 5 m2 in area)
detached Cladophora was 847 cfug dwt (Table 3114) M icrocystins were detected in the detached Cladophora beginning in July with mean concentrations of 20 microgg dwt 35 microgg dwt and 55 microgg dwt for microcystin RR microcystin LR and total microcystins respectively Detached Cladophora was present in 1-5 m p ockets at all locations for 6 of the 8 s ampling periods (Table 3114) The beach was groomed for the July 4th holiday and the Cladophora extent decreased to being present in isolated areas for two weeks E coli concentrations in water and detached Cladophora are displayed in Figure 3114 No correlation was observed between bacterial levels in water and detached algae (Spearmanrsquos RO ρ=061) A statistically significant difference was not observed between beach locations for E coli concentrations in detached Cladophora (Kruskal-Wallis ρ=057) S tation R had the highest concentration of E coli in detached Cladophora (3258 cfug dwt)
23
0
1
2
3
4
5
62508 7208 7908 71608 72308 73008 8608 81308
Log
E c
oli
Con
cent
ratio
n Water (cfu100mL)Cladophora cfug dwt
Figure 3114 E coli in Detached Cladophora and Water at Arenac County Park 2008 318 Foster Road Beach The sampling locations for Foster Road Beach are provided in Figure 3115 Three near-shore locations were sampled at a depth of 05 m T he beach area was sandy and appeared to be groomed Detached Cladophora was common in the shallow littoral zone and the samples were collected approximately 1 meter from shore Strong wave action was observed at this location which kept the detached Cladophora suspended in the water column This was the only Saginaw Bay location where suspended Cladophora was observed The results of water and detached Cladophora analyses are summarized in Tables 3115 and 3116 respectively The mean E coli concentration for the study period was 73 cfu100 mL with only one set of beach samples averaging 315 c fu100mL (July 15 Table 3117) This sample was taken after the storm event which occurred on July 12 Water temperatures ranged from 21degC to 25degC The mean E coli concentration in detached Cladophora was 2169 cfug dwt (Table 3116) Microcystins were detected in the detached Cladophora beginning in July with mean concentrations of 36 microgg dwt 41 microgg dwt and 77 microgg dwt for microcystin RR microcystin LR and total microcystins respectively D etached Cladophora was present throughout the water column during the first three weeks not present on July 15 (after the storm) and present only in isolated pockets during the remainder of the sampling period (Table 3116) E coli concentrations in water and detached Cladophora are displayed in Figure 3118 N o correlation was observed between bacterial levels in water and detached algae (Spearmanrsquos RO ρ=078) A statistically significant difference was not observed between beach locations for E coli concentrations in detached Cladophora (Kruskal-Wallis ρ=090) Station L had the highest concentration of E coli in detached Cladophora (7332 cfug dwt)
24
Figure 3115 Foster Road Beach Sampling Locations 2008 (L= Left C=Center R=Right)
Table 3115 Foster Road Beach Water Quality Data 2008
ConductanceL C R Mean microScm
062308 1 2 5 3 792 77 21 376070108 60 21 23 35 818 76 22 382070808 55 140 181 125 815 75 23 442071508 320 400 225 315 815 74 23 436072208 1 2 3 2 812 73 24 447072908 25 31 50 35 820 77 24 436080508 22 21 7 17 814 78 24 447081208 46 51 71 56 811 81 24 450
Mean 66 84 71 73 812 76 23 427
E coli in Water Water Chemistry cfu100 ml pH DO (mgl) Temp OC
Date
25
Table 3116 Foster Road Beach Cladophora Data 2008 (NC=No Cladophora Present NA=Not Analyzed)
Cladophora
L C R Mean Extent RR LR Total062308 1380 2760 1515 1885 5 lt01 lt01 lt01070108 4554 7010 5346 5637 5 lt01 1 1070808 6731 5893 7332 6652 5 12 11 23071508 NC NC NC NC 0 NA NA NA072208 150 230 320 233 2 27 34 61072908 230 156 240 209 2 68 80 148080508 213 270 189 224 2 80 80 161081208 332 380 320 344 2 82 102 184
Mean 1941 2386 2180 2169 3 36 41 77
Date E coli in Cladophora cfug dwt Microcystins in Cladophora microgg dwt
(Cladophora Extent 0 = None Present 1 = Present in isolated pockets at one location 2 = Present in isolated pockets at all locations 3 = Deposits 1 m2 in area 4= Deposits 1-5 m2 in area 5 = Deposits gt 5 m2 in area)
0
1
2
3
4
5
62508 7208 7908 71608 72308 73008 8608 81308
Log
E c
oli
Con
cent
ratio
n Water (cfu100mL)Cladophora cfug dwt
Figure 3116 E coli in Detached Cladophora and Water at Foster Road Beach 2008
32 Grand Traverse Bay and Little Traverse Bay E coli Microcystin and Water Chemistry Results
321 Petoskey State Park The sampling locations for Petoskey State Park are provided in Figure 321 Three near-shore locations were sampled at a depth of 03 m T he beach area was sandy and appeared to be natural Detached Cladophora was present in isolated pockets in the shallow littoral zone and the samples were collected approximately 1 meter from shore
26
Figure 321 Petoskey State Park Sampling Locations 2008 (L= Left C=Center R=Right) The results of water and detached Cladophora analyses are summarized in Tables 321 and 322 respectively The mean E coli concentration for the study period was 13 cfu100 mL with no single beach sample exceeding 100 cfu100 mL (Table 321) Water temperatures ranged from 19degC to 21degC The mean E coli concentration in detached Cladophora was 1117 cfug dwt (Table 322) M icrocystins were not detected in the detached Cladophora Detached Cladophora was present in isolated pockets at all locations for only 2 of the 8 sampling periods (Table 322) E coli concentrations in water and detached Cladophora are displayed in Figure 322 N o correlation was observed between bacterial levels in water and detached algae (Spearmanrsquos RO ρ=059) A statistically significant difference was not observed between beach locations for E coli concentrations in detached Cladophora (Kruskal-Wallis ρ=0058) Station R had the highest concentration of E coli in detached Cladophora (1600 cfug dwt)
27
Table 321 Petoskey State Park Water Quality Data 2008
ConductanceL C R Mean microScm
062308 6 3 2 4 800 105 19 303070108 89 55 73 72 823 109 19 296070808 2 3 3 3 813 110 19 300071508 3 6 6 5 815 105 20 295072208 4 7 5 5 824 104 21 300072908 16 12 5 11 818 108 21 298080508 1 1 1 1 814 104 21 300081208 6 3 1 4 807 107 21 297
Mean 16 11 12 13 814 106 20 299
E coli in Water Water Chemistry cfu100 ml pH DO (mgl) Temp OC
Date
Table 322 Petoskey State Park Cladophora Data 2008 (NC=No Cladophora Present NA=Not Analyzed)
Cladophora
L C R Mean Extent RR LR Total062308 990 1200 1100 1097 2 lt01 lt01 lt01070108 1455 1390 1543 1463 2 lt01 lt01 lt01070808 NC NC 1200 1200 1 lt01 lt01 lt01071508 NC 1423 NC 1423 1 lt01 lt01 lt01072208 NC 556 NC 556 1 lt01 lt01 lt01072908 NC NC 1600 1600 1 lt01 lt01 lt01080508 1200 NC NC 1200 1 lt01 lt01 lt01081208 NC NC 400 400 1 lt01 lt01 lt01
Mean 1215 1142 1169 1117 1 lt01 lt01 lt01
Date E coli in Cladophora cfug dwt Microcystins in Cladophora microgg dwt
(Cladophora Extent 0 = None Present 1 = Present in isolated pockets at one location 2 = Present in isolated pockets at all locations 3 = Deposits 1 m2 in area 4= Deposits 1-5 m2 in area 5 = Deposits gt 5 m2 in area)
0
1
2
3
4
5
62508 7208 7908 71608 72308 73008 8608 81308
Water (cfu100mL)Cladophora cfug dwt
Figure 322 E coli in Detached Cladophora and Water at Petoskey State Park 2008
Log
E c
oli C
once
ntra
tion
28
322 Magnus Park The sampling locations for Magnus Park are provided in Figure 323 The beach area was sandy and appeared to be natural Detached Cladophora was present in isolated pockets in the shallow littoral zone and the samples were collected approximately 1 meter from shore
Figure 323 Magnus Park Sampling Locations 2008 (L= Left C=Center R=Right) The results of water and detached Cladophora analyses are summarized in Tables 323 and 324 respectively The mean E coli concentration for the study period was 17 cfu100 mL with one beach sample exceeding 100 c fu100 mL (120 cfu100 mL Table 323) W ater temperatures ranged from 19degC to 21degC T he mean E coli concentration in detached Cladophora was 1554 cfug dwt (Table 324) Microcystins were not detected in the detached Cladophora Detached Cladophora was present in isolated pockets at one location for 4 of the 8 sampling periods (Table 324) E coli concentrations in water and detached Cladophora are displayed in Figure 324 N o correlation was observed between bacterial levels in water and detached algae (Spearmanrsquos RO ρ=059) A statistically significant difference was not observed between beach locations for E coli concentrations in detached Cladophora (Kruskal-Wallis ρ=0054) Station R had the highest concentration of E coli in detached Cladophora (2368 cfug dwt)
29
Table 323 Magnus Park Water Quality Data 2008
ConductanceL C R Mean microScm
062308 5 3 2 3 803 108 19 295070108 2 3 2 2 813 105 19 297070808 77 120 76 91 817 110 19 305071508 1 3 6 3 804 106 20 301072208 6 3 2 4 813 110 21 299072908 9 3 11 8 821 108 21 295080508 4 16 15 12 824 110 21 297081208 18 10 15 14 810 102 21 300
Mean 15 20 16 17 813 107 20 299
E coli in Water Water Chemistry cfu100 ml pH DO (mgl) Temp OC
Date
Table 324 Magnus Park Cladophora Data 2008 (NC=No Cladophora Present NA=Not
Analyzed)
CladophoraL C R Mean Extent RR LR Total
062308 2368 NC 3321 2845 1 lt01 lt01 lt01070108 NC NC NC NC 0 NC NC NC070808 NC NC 1200 1200 1 lt01 lt01 lt01071508 NC NC NC NC 0 NC NC NC072208 NC NC NC NC 0 NC NC NC072908 NC NC 1300 1300 1 lt01 lt01 lt01080508 NC NC NC NC 0 NC NC NC081208 NC NC 870 870 1 lt01 lt01 lt01
Mean 2368 NC 1673 1554 1 lt01 lt01 lt01
Date E coli in Cladophora cfug dwt Microcystins in Cladophora microgg dwt
(Cladophora Extent 0 = None Present 1 = Present in isolated pockets at one location 2 = Present in isolated pockets at all locations 3 = Deposits 1 m2 in area 4= Deposits 1-5 m2 in area 5 = Deposits gt 5 m2 in area)
0
1
2
3
4
5
62508 7208 7908 71608 72308 73008 8608 81308
Water (cfu100mL)Cladophora cfug dwt
Figure 324 E coli in Detached Cladophora and Water at Magnus Park 2008
Log
E c
oli C
once
ntra
tion
30
323 Elk Rapids Park The sampling locations for Elk Rapids Park are provided in Figure 325 The beach area was sandy and appeared to be natural Detached Cladophora was present in isolated pockets in the shallow littoral zone and the samples were collected approximately 1 meter from shore
Figure 325 Elk Rapids Park Sampling Locations 2008 (L= Left C=Center R=Right)
The results of water and detached Cladophora analyses are summarized in Tables 325 and 326 respectively The mean E coli concentration for the study period was 74 cfu100 mL with two sets of beach samples exceeding 100 c fu100 mL (134 cfu100 mL and 292 c fu100 mL Table 325) Water temperatures ranged from 19degC to 21degC The mean E coli concentration in detached Cladophora was 1225 cfug dwt (Table 326) Microcystins were not detected in the detached Cladophora Detached Cladophora was present in isolated pockets at more than one location for 6 of the 8 sampling periods (Table 316) E coli concentrations in water and detached Cladophora are displayed in Figure 314 N o correlation was observed between bacterial levels in water and detached algae (Spearmanrsquos RO ρ=018) A statistically significant difference was observed between beach locations for E coli concentrations in detached Cladophora (Kruskal-Wallis ρ=0030) Station R was significantly different from C and L (Mann-Whitney ρ=0005 and 0003 respectively) Station R was the closest sampling location
31
Table 325 Elk Rapids Park Water Quality Data 2008
ConductanceL C R Mean microScm
062308 155 390 330 292 827 100 19 297070108 23 16 54 31 814 109 19 301070808 44 13 27 28 811 108 19 297071508 22 56 70 49 813 109 20 301072208 57 25 22 35 812 101 21 275072908 90 145 166 134 805 109 21 297080508 4 1 21 9 801 107 21 281081208 25 19 7 17 810 102 21 302
Mean 53 83 87 74 812 11 20 294
E coli in Water Water Chemistry cfu100 ml pH DO (mgl) Temp OC
Date
Table 326 Elk Rapids Park Cladophora Data 2008 (NC=No Cladophora Present NA=Not Analyzed)
Cladophora
L C R Mean Extent RR LR Total062308 724 4111 6900 3912 2 lt01 lt01 lt01070108 322 858 3754 1645 2 lt01 lt01 lt01070808 NC NC 770 770 1 lt01 lt01 lt01071508 NC NC 840 840 1 lt01 lt01 lt01072208 569 670 440 560 2 lt01 lt01 lt01072908 430 1100 1600 1043 2 lt01 lt01 lt01080508 500 700 344 515 2 lt01 lt01 lt01081208 330 448 780 519 2 lt01 lt01 lt01
Mean 479 1314 1928 1225 2 lt01 lt01 lt01
Date E coli in Cladophora cfug dwt Microcystins in Cladophora microgg dwt
(Cladophora Extent 0 = None Present 1 = Present in isolated pockets at one location 2 = Present in isolated pockets at all locations 3 = Deposits 1 m2 in area 4= Deposits 1-5 m2 in area 5 = Deposits gt 5 m2 in area)
0
1
2
3
4
5
62508 7208 7908 71608 72308 73008 8608 81308
Water (cfu100mL)Cladophora cfug dwt
Figure 326 E coli in Detached Cladophora and Water at the Elk Rapids Park 2008
Log
E c
oli C
once
ntra
tion
32
location to the creek which drains a duck pond ne ar the city S tation R had the highest concentration of E coli in detached Cladophora (6900 cfug dwt) 324 Antrim County Day Park The sampling locations for Antrim County Day Park are provided in Figure 327 Three near-shore locations were sampled at a depth of 03 m The beach area was sandy and appeared to be natural Detached Cladophora was common in the shallow littoral zone and the samples were collected approximately 1 meter from shore
Figure 327 Antrim County Day Park Sampling Locations 2008 (L= Left C=Center R=Right)
The results of water and detached Cladophora analyses are summarized in Tables 327 and 328 respectively The mean E coli concentration for the study period was 25 cfu100 mL with one beach sample exceeding 100 c fu100 mL (111 cfu100 mL Table 327) W ater
33
temperatures ranged from 19degC to 21degC T he mean E coli concentration in detached Cladophora was 350 cfug dwt (Table 328) Microcystins were not detected in the detached Cladophora Detached Cladophora was either absent or present in isolated pockets at one location for 7 of the 8 sampling periods and at 2 l ocations during 1 sampling period (Table 318) E coli concentrations in water and detached Cladophora are displayed in Figure 328 No correlation was observed between bacterial levels in water and detached algae (Spearmanrsquos RO ρ=068) A statistically significant difference was not observed between beach locations for E coli concentrations in detached Cladophora (Kruskal-Wallis ρ=027) S tation R had the highest concentration of E coli in detached Cladophora (660 cfug dwt)
Table 327 Antrim County Day Park Water Quality Data 2008
ConductanceL C R Mean microScm
062308 5 2 2 3 813 115 19 310070108 45 31 94 57 817 100 19 300070808 55 42 29 42 820 106 20 284071508 2 1 9 4 815 100 20 296072208 1 3 lt1 1 812 80 21 315072908 111 87 16 71 814 112 21 280080508 3 1 NC 1 811 114 21 292081208 1 2 60 21 817 113 21 296
Mean 28 21 26 25 815 11 20 297
E coli in Water Water Chemistry cfu100 ml pH DO (mgl) Temp OC
Date
Table 328 Antrim County Day Park Cladophora Data 2008 (NC=No Cladophora Present NA=Not Analyzed)
Cladophora
L C R Mean Extent RR LR Total062308 79 61 660 267 2 lt01 lt01 lt01070108 NC NC NC NC 0 NA NA NA070808 NC NC NC NC 0 NA NA NA071508 NC NC NC NC 0 NA NA NA072208 NC NC 440 440 1 NA lt01 NA072908 NC NC NC NC 0 NA NA NA080508 NC NC 344 344 1 NA lt01 NA081208 NC NC NC NC 0 NA NA NA
Mean mdash mdash 481 350 1 mdash lt01 mdash
Date E coli in Cladophora cfug dwt Microcystins in Cladophora microgg dwt
(Cladophora Extent 0 = None Present 1 = Present in isolated pockets at one location 2 = Present in isolated pockets at all locations 3 = Deposits 1 m2 in area 4= Deposits 1-5 m2 in area 5 = Deposits gt 5 m2 in area)
34
0
1
2
3
4
5
62508 7208 7908 71608 72308 73008 8608 81308
Water (cfu100mL)Cladophora cfug dwt
Figure 328 E coli in Detached Cladophora and Water at the Antrim County Day Park 2008
325 East Bay Park The sampling locations for East Bay Park are provided in Figure 329 Three near-shore locations were sampled at depths of 03-05 m The beach area was sandy and appeared to be natural S tation L contained open water while Stations R and C contained Scirpus Detached Cladophora was found at all of the shallow littoral zone locations and the samples were collected approximately 1 meter from shore The results of water and detached Cladophora analyses are summarized in Tables 329 and 3210 respectively The mean E coli concentration for the study period was 25 cfu100 mL with one sample exceeding 100 cfu100 mL (103 cfu100 mL Table 329) Water temperatures ranged from 19degC to 21degC The mean E coli concentration in detached Cladophora was 969 cfug dwt (Table 3210) M icrocystins were not detected in the detached Cladophora Detached Cladophora was present in isolated pockets at more than one location for all of the 8 sampling periods (Table 3210) E coli concentrations in water and detached Cladophora are displayed in Figure 3210 No correlation was observed between bacterial levels in water and detached algae (Spearmanrsquos RO ρ=012) A statistically significant difference was not observed between beach locations for E coli concentrations in detached Cladophora (Kruskal-Wallis ρ=041) Station L had the highest E coli concentration in detached Cladophora (5000 cfug dwt) Station L was the closest sampling location to a storm-water outlet entering Grand Traverse Bay
Log
E c
oli C
once
ntra
tion
35
Figure 329 East Bay Park Sampling Locations 2008 (L= Left C=Center R=Right)
Table 329 East Bay Park Water Quality Data 2008
ConductanceL C R Mean microScm
062308 2 1 3 2 821 106 19 299070108 5 3 NC 3 821 104 19 300070808 4 7 14 8 807 105 19 320071508 17 41 21 26 807 103 20 310072208 41 91 103 78 804 101 21 330072908 51 92 61 68 819 102 21 324080508 8 4 11 8 805 103 21 309081208 7 2 1 8 809 108 21 317
Mean 17 30 27 25 812 10 20 314
E coli in Water Water Chemistry cfu100 ml pH DO (mgl) Temp OC
Date
36
Table 3210 East Bay Park Cladophora Data 2008 (NC=No Cladophora Present NA=Not Analyzed)
Cladophora
L C R Mean Extent RR LR Total062308 5000 2000 1000 2667 3 lt01 lt01 lt01070108 3300 1500 900 1900 3 lt01 lt01 lt01070808 660 500 460 540 3 lt01 lt01 lt01071508 546 600 NC 573 2 lt01 lt01 lt01072208 340 500 600 480 3 lt01 lt01 lt01072908 700 630 NC 665 2 lt01 lt01 lt01080508 935 500 700 712 3 lt01 lt01 lt01081208 325 330 NC 218 2 lt01 lt01 lt01
Mean 1476 820 732 969 3 lt01 lt01 lt01
Date E coli in Cladophora cfug dwt Microcystins in Cladophora microgg dwt
(Cladophora Extent 0 = None Present 1 = Present in isolated pockets at one location 2 = Present in isolated pockets at all locations 3 = Deposits 1 m2 in area 4= Deposits 1-5 m2 in area 5 = Deposits gt 5 m2 in area)
0
1
2
3
4
5
62508 7208 7908 71608 72308 73008 8608 81308
Log
E c
oli C
once
ntra
tion
Water (cfu100mL)Cladophora cfug dwt
Figure 3210 E coli in Detached Cladophora and Water at East Bay Park 2008 326 Traverse City State Park The sampling locations for Traverse City State Park are provided in Figure 3211 Three near-shore locations were sampled at a depth of 03 m The beach area was sandy and appeared to be natural Detached Cladophora was present in isolated pockets in the shallow littoral zone near Mitchell Creek and the samples were collected approximately 1 meter from shore
37
Figure 3211 Traverse City State Park Sampling Locations 2008 (L= Left C=Center R=Right)
The results of water and detached Cladophora analyses are summarized in Tables 3211 and 3212 respectively The mean E coli concentration for the study period was 33 cfu100 mL with one sample exceeding 100 cfu100 mL (195 cfu100 mL Table 3211) W ater temperatures ranged from 19degC to 21degC Station L was the only location at this beach with detached Cladophora and the associated E coli concentrations averaged 1630 cfug dwt The highest concentration E coli in detached Cladophora was 3300 cfug dwt This station was the closest sampling location to Mitchell Creek which has a history of bacterial contamination problems (The Watershed Center 2006) Microcystins were not detected in the detached Cladophora Detached Cladophora was present in isolated pockets at one location for all of the 8 sampling periods (Table 3212) E coli concentrations in water and detached Cladophora are displayed in Figure 3212 No correlation was observed between bacterial levels in water and detached algae (Spearmanrsquos RO ρ=015) A statistically significant difference was observed between beach locations for E coli concentrations in detached Cladophora (Kruskal-Wallis ρ=0001)
38
Table 3211 Traverse City State Park Water Quality Data 2008
ConductanceL C R Mean microScm
062308 1 4 NC 2 816 107 19 301070108 3 5 10 6 815 101 19 305070808 195 37 66 99 815 105 19 296071508 22 48 63 44 820 104 20 297072208 95 88 57 80 801 108 21 299072908 19 10 5 11 802 102 21 300080508 18 14 11 14 825 108 21 294081208 8 6 5 6 805 106 21 294
Mean 45 27 31 33 812 105 20 298
DateE coli in Water Water Chemistry
cfu100 ml pH DO (mgl) Temp OC
Table 3212 Traverse City State Park Cladophora Data 2008 (NC=No Cladophora Present NA=Not Analyzed)
Cladophora
L C R Mean Extent RR LR Total062308 2000 NC NC mdash 1 lt01 lt01 lt01070108 3300 NC NC mdash 1 lt01 lt01 lt01070808 900 NC NC mdash 1 lt01 lt01 lt01071508 750 NC NC mdash 1 lt01 lt01 lt01072208 1200 NC NC mdash 1 lt01 lt01 lt01072908 700 NC NC mdash 1 lt01 lt01 lt01080508 990 NC NC mdash 1 lt01 lt01 lt01081208 3200 NC NC mdash 1 lt01 lt01 lt01
Mean 1630 NC NC mdash 1 lt01 lt01 lt01
Date E coli in Cladophora cfug dwt Microcystins in Cladophora microgg dwt
(Cladophora Extent 0 = None Present 1 = Present in isolated pockets at one location 2 = Present in isolated pockets at all locations 3 = Deposits 1 m2 in area 4= Deposits 1-5 m2 in area 5 = Deposits gt 5 m2 in area)
0
1
2
3
4
5
62508 7208 7908 71608 72308 73008 8608 81308
Water (cfu100mL)Cladophora cfug dwt
Figure 3212 E coli in Detached Cladophora and Water at Traverse City State Park 2008
Log
E c
oli C
once
ntra
tion
39
327 Bryant Park The sampling locations for Bryant Park are provided in Figure 3213 T hree near-shore locations were sampled at a depth of 03 m T he beach area was sandy and appeared to be natural Detached Cladophora was common in the shallow littoral zone and the samples were collected approximately 1 meter from shore
Figure 3213 Bryant Park Sampling Locations 2008 (L= Left C=Center R=Right)
40
The results of water and detached Cladophora analyses are summarized in Tables 3213 and 3214 respectively The mean E coli concentration for the study period was 46 cfu100 mL with one set of samples exceeding 100 cfu100 mL (281 cfu100 mL Table 3213) W ater temperatures ranged from 19degC to 21degC T he mean E coli concentration in detached Cladophora was 1873 cfug dwt (Table 3214) Microcystins were not detected in the detached Cladophora Detached Cladophora was present in isolated pockets at one location for all of the 8 sampling periods (Table 3214) E coli concentrations in water and detached Cladophora are displayed in Figure 3214 No correlation was observed between bacterial levels in water and detached algae (Spearmanrsquos RO ρ=082) A statistically significant difference was not observed between beach locations for E coli concentrations in detached Cladophora (Kruskal-Wallis ρ=048) Station C had the highest concentration of E coli in detached Cladophora (9460 cfug dwt)
Table 3213 Bryant Park Water Quality Data 2008
ConductanceL C R Mean microScm
062308 3 4 11 6 825 105 19 296070108 6 8 5 6 800 102 19 301070808 290 310 243 281 824 100 19 300071508 8 9 4 7 819 106 20 298072208 6 8 3 6 813 103 21 300072908 11 13 22 15 811 104 21 297080508 12 18 15 15 815 107 21 317081208 33 29 1 28 805 101 21 299
Mean 46 50 38 46 814 103 20 301
E coli in Water Water Chemistry cfu100 ml pH DO (mgl) Temp OC
Date
Table 3214 Bryant Park Cladophora Data 2008 (NC=No Cladophora Present NA=Not Analyzed)
Cladophora
L C R Mean Extent RR LR Total062308 980 9460 680 3707 2 lt01 lt01 lt01070108 977 7690 490 3052 2 lt01 lt01 lt01070808 3443 1462 2741 2549 2 lt01 lt01 lt01071508 1300 1800 1567 1556 2 lt01 lt01 lt01072208 990 832 751 858 2 lt01 lt01 lt01072908 111 1643 1565 1106 2 lt01 lt01 lt01080508 1245 890 1443 1193 2 lt01 lt01 lt01081208 1122 844 922 963 2 lt01 lt01 lt01
Mean 1271 3078 1270 1873 2 lt01 lt01 lt01
Date E coli in Cladophora cfug dwt Microcystins in Cladophora microgg dwt
(Cladophora Extent 0 = None Present 1 = Present in isolated pockets at one location 2 = Present in isolated pockets at all locations 3 = Deposits 1 m2 in area 4= Deposits 1-5 m2 in area 5 = Deposits gt 5 m2 in area)
41
0
1
2
3
4
5
62508 7208 7908 71608 72308 73008 8608 81308
Water (cfu100mL)Cladophora cfug dwt
Figure 3214 E coli in Detached Cladophora and Water at Bryant Park 2008 328 Clinch Park The sampling locations for Clinch Park are provided in Figure 3215 T hree near-shore locations were sampled at a depth of 03 m T he beach area was sandy and appeared to be natural Detached Cladophora was present at one location during the last sampling event The sample was collected approximately 05 m from shore The results of water and detached Cladophora analyses are summarized in Tables 3215 and 3216 respectively The mean E coli concentration for the study period was 35 cfu100 mL with one set of samples exceeding 100 cfu100 mL (164 cfu100 mL Table 3215) W ater temperatures ranged from 19degC to 21degC D etached Cladophora was present in an isolated pocket at one location during the August 12 sampling event (Table 3216) E coli was present in detached Cladophora in this sample at a concentration of 680 c fug dwt (Table 3216) Microcystins were not detected in the detached Cladophora E coli concentrations in water and detached Cladophora are displayed in Figure 3216 N o correlation was observed between bacterial levels in water and detached algae (Spearmanrsquos RO ρ=099)
Log
E c
oli C
once
ntra
tion
42
Figure 3215 Clinch Park Sampling Locations 2008 (L= Left C=Center R=Right)
Table 3215 Clinch Park Water Quality Data 2008
ConductanceL C R Mean microScm
062308 22 14 11 16 828 105 19 296070108 1 3 NC 1 801 109 19 300070808 33 19 30 27 805 101 19 310071508 21 18 32 24 816 107 20 302072208 155 170 167 164 802 103 21 302072908 43 21 37 34 801 104 21 307080508 11 7 18 12 830 102 21 299081208 4 2 1 3 822 104 21 298
Mean 36 32 37 35 813 104 20 302
E coli in Water Water Chemistry cfu100 ml pH DO (mgl) Temp OC
Date
43
Table 3216 Clinch Park Cladophora Data 2008 (NC=No Cladophora Present NA=Not Analyzed)
Cladophora
L C R Mean Extent RR LR Total062308 NC NC NC NC 0 lt01 lt01 lt01070108 NC NC NC NC 0 lt01 lt01 lt01070808 NC NC NC NC 0 lt01 lt01 lt01071508 NC NC NC NC 0 lt01 lt01 lt01072208 NC NC NC NC 0 lt01 lt01 lt01072908 NC NC NC NC 0 lt01 lt01 lt01080508 NC NC NC NC 0 lt01 lt01 lt01081208 NC NC 680 680 1 lt01 lt01 lt01
Mean NC NC 680 680 0 lt01 lt01 lt01
Date E coli in Cladophora cfug dwt Microcystins in Cladophora microgg dwt
(Cladophora Extent 0 = None Present 1 = Present in isolated pockets at one location 2 = Present in isolated pockets at all locations 3 = Deposits 1 m2 in area 4= Deposits 1-5 m2 in area 5 = Deposits gt 5 m2 in area)
0
1
2
3
4
5
62508 7208 7908 71608 72308 73008 8608 81308
Water (cfu100mL)Cladophora cfug dwt
Figure 3216 E coli in Detached Cladophora and Water at Clinch Park 2008 329 West End Beach The sampling locations for West End Beach are provided in Figure 3217 T hree near-shore locations were sampled at a depth of 03 m T he beach area was sandy and appeared to be natural Detached Cladophora was common in the shallow littoral zone and the samples were collected approximately 1 meter from shore This beach appeared to be used by pet owners as dogs were frequently present during sampling
Log
E c
oli C
once
ntra
tion
44
Figure 3217 West End Beach Sampling Locations 2008 (L= Left C=Center R=Right)
The results of water and detached Cladophora analyses are summarized in Tables 3217 and 3218 respectively The mean E coli concentration for the study period was 35 cfu100 mL with no samples exceeding 100 c fu100 mL (Table 3217) W ater temperatures ranged from 19degC to 21degC T he mean E coli concentration in detached Cladophora was 2976 cfug dwt (Table 3218) M icrocystins were not detected in the detached Cladophora Detached Cladophora was present in isolated pockets at all locations for 4 of the 8 sampling periods (Table 3218) E coli concentrations in water and detached Cladophora are displayed in Figure 3218 N o correlation was observed between bacterial levels in water and detached algae (Spearmanrsquos RO ρ=028) A statistically significant difference was not observed between beach locations for E coli concentrations in detached Cladophora (Kruskal-Wallis ρ=079) Station C was higher than the other stations with respect to mean E coli concentrations in detached Cladophora (3078 cfug dwt) The highest concentration of E coli in detached Cladophora measured during the study period in Grand Traverse Bay was at West End Beach (22874 cfug dwt at Station C) Dogs frequently were present on this beach at the time of sampling which may be the source of the high bacteria concentrations
45
Table 3217 West End Beach Water Quality Data 2008
ConductanceL C R Mean microScm
062308 5 3 4 4 821 103 19 302070108 3 1 2 2 829 110 19 297070808 34 55 48 46 807 100 19 303071508 46 33 25 35 803 108 20 301072208 66 86 126 93 804 105 21 297072908 6 14 5 8 825 106 21 294080508 100 94 49 81 827 107 21 306081208 22 10 1 14 827 107 21 297
Mean 35 37 33 35 818 106 20 300
E coli in Water Water Chemistry cfu100 ml pH DO (mgl) Temp OC
Date
Table 3218 West End Beach Cladophora Data 2008 (NC=No Cladophora Present NA=Not Analyzed)
Cladophora
L C R Mean Extent RR LR Total062308 1509 76 289 625 2 lt01 lt01 lt01070108 1721 22874 13337 12644 2 lt01 lt01 lt01070808 1016 NC NC 1016 1 lt01 lt01 lt01071508 NC NC 1644 1644 1 lt01 lt01 lt01072208 NC NC NC NC 0 NA NA NA072908 NC NC NC NC 0 NA NA NA080508 1300 1233 1567 1367 2 lt01 lt01 lt01081208 678 444 567 563 2 lt01 lt01 lt01
Mean 1245 6157 3481 2976 1 lt01 lt01 lt01
Date E coli in Cladophora cfug dwt Microcystins in Cladophora microgg dwt
(Cladophora Extent 0 = None Present 1 = Present in isolated pockets at one location 2 = Present in isolated pockets at all locations 3 = Deposits 1 m2 in area 4= Deposits 1-5 m2 in area 5 = Deposits gt 5 m2 in area)
0
1
2
3
4
5
62508 7208 7908 71608 72308 73008 8608 81308
Water (cfu100mL)Cladophora cfug dwt
Figure 3218 E coli in Detached Cladophora and Water at West End Beach 2008
Log
E c
oli C
once
ntra
tion
46
33 Saginaw Bay and Grand Traverse BayLittle Traverse Bay Comparisons
A summary of the project data is presented in Table 331 Mean temperatures for Saginaw Bay were higher than in Grand Traverse BayLittle Traverse Bay (23degC and 20degC respectively) Microcystins in detached Cladophora were absent in Grand Traverse BayLittle Traverse Bay In Saginaw Bay the grand mean of all locations with detached Cladophora was 57 microgg dwt for the study period M ean concentrations of E coli in water were significantly higher (Mann-Whitney ρ=0003) in Grand Traverse BayLittle Traverse Bay (34 cfu100 mL) than in Saginaw Bay (18 cfu100 mL) In contrast mean E coli concentrations in detached Cladophora were higher in Saginaw Bay (2796 cfug dwt) than Grand Traverse BayLittle Traverse Bay (1775 cfug dwt) however the difference was not statistically significant (Mann-Whitney ρ=040) The mean Cladophora extent score for Grand Traverse BayLittle Traverse Bay was 1 indicating that detached algae were found in small pockets T he mean Cladophora extent score for Saginaw Bay was 3 indicating that detached algae were found in 1 m2 deposits
Table 331 Summary of Water Quality and Cladophora Data for Grand Traverse BayLittle Traverse Bay and Saginaw Bay 2008
Parameter Saginaw Bay Grand TraverseLittle Traverse Bay
Mean Temperature 23degC 20degC Mean Total Microcystins 57 microgg dwt lt01 microgg dwt Cladophora Extent Score 3 1 Mean E coli in Water 18 cfu100 mL 34 cfu100 mL Mean E coli in Cladophora 2796 cfug dwt 1775 cfug dwt
(Cladophora Extent 0 = None Present 1 = Present in isolated pockets at one location 2 = Present in isolated pockets at all locations 3 = Deposits 1 m2 in area 4= Deposits 1-5 m2 in area 5 = Deposits gt 5 m2 in area)
40 Discussion The presence of Cladophora has been associated with high levels of E coli and species of potentially pathogenic enteric bacteria in beach sand and swimming waters of the Great Lakes (Whitman et al 2003 Ishii et al 2006 Olapade et al 2006) Enteric bacteria can grow within detached Cladophora under certain conditions (Byappanahalli et al 2005) In addition detached Cladophora deposits can potentially harbor and enhance the survival of pathogenic bacteria released into the environment through point and non-point sources (Byappanahalli et al 2005) Recently Clostridium was found to grow in detached Cladophora in the Great Lakes (Byappanahalli and Whitman 2009) Algal species including Cladophora have been reported to provide nutrients and to protect attached bacteria from environmental stresses desiccation predation and harmful UV radiation (Byappanahalli et al 2005) In this manner Cladophora mats may play a significant role as a source and sink for pathogens in the near-shore environment Based on the results from this investigation Saginaw Bay appears to be more heavily impacted by detached Cladophora than Grand Traverse BayLittle Traverse Bay Eutrophication of lakes has been associated with increases in Cladophora mat production and accumulation (Stevenson et al 2006 Herbst 1969) but water transparency also has been suggested as an important causative factor (Barbiero et al 2006 Bootsma 2007) Elevated levels of nutrients in Saginaw Bay have been reported to stimulate blooms of cyanobacteria in Saginaw Bay and also influence the near-shore environment (Fahnenstiel et al 2008 Millie et al
47
2008) Differences in Cladophora accumulation between the Lake Huron and Lake Michigan sites may be attributed to higher total phosphorus levels (18 microgl vs 5 microgl MDNRE 2006) Levels of E coli in detached Cladophora in both systems were similar to concentrations previously reported in the Great Lakes (3 log10 - 5 log10 Engelbert et al 2008) In Saginaw Bay the highest levels of E coli in detached Cladophora were consistently found at locations near the Saginaw River (Wenona Beach and the Bay City Recreation Area) E ven within individual sites locations near tributaries and drains at Wenona Beach and South Linwood Beach were significantly higher than locations farther away form a point source This relationship also was noted in Grand Traverse Bay where the location near Mitchell Creek at the Traverse City State Park had elevated E coli concentrations in detached Cladophora compared to the other two beach stations At Traverse City State Park Cladophora deposits were present only at the location near Mitchell Creek These results suggest that Cladophora can trap bacteria from point sources and also be stimulated by nutrient discharges Two locations Pinconning Park and Whitersquos Beach had very limited Cladophora growth Both locations had Chara growing on the lake bottom Chara is known to exhibit allelopathic activity that can limit the growth of other aquatic plants (Berger and Schagerl 2004) No correlation was found between E coli levels in the open water (designated beach monitoring locations) and the near-shore zone where the detached Cladophora samples were taken As noted in previous studies Cladophora appears to hold trapped E coli and not release the entrained bacteria into the offshore water (Byappanahalli et al 2003 Engelbert et al 2008) This investigation was the first to document the accumulation of microcystins in the detached Cladophora of Saginaw Bay S aginaw Bay has a history of Microcystis blooms in the late summer months that produce both microcystin LR and RR (Fahnenstiel et al 2008 Millie et al 2008) S ince Microcystis has a high requirement for sunlight cyanobacteria may become stressed when they become trapped in the detached algae deposits Stress has been implicated in initiating cyanotoxin production (Codd 1995) While accidental ingestion by humans of microcystins trapped in Cladophora is unlikely these compounds can act as skin irritants (Bell and Codd 1994) W alking through Cladophora accumulations to get to deeper water may provide sufficient exposure to cause irritation in sensitive individuals if microcystins are present While all of the data suggest that swimming areas (1 m depth) are not impacted by E coli accumulations in detached Cladophora entrained bacteria and cyanotoxins may pose a hazard to children playing in the near-shore water and beach sand While current regulations discourage beach grooming the presence of elevated bacteria and microcystin levels in the near-shore environment of Saginaw Bay suggests that the current policy should balance potential impacts to public health with the ecosystem services provided by coastal wetlands 50 Conclusions An assessment of the ability of Cladophora mats to sequester E coli and microcystin LR and RR was conducted in near-shore waters of Grand Traverse Bay (7 sites) Little Traverse Bay (2 sites) and Saginaw Bay (8 sites) The sampling locations were at public beach access points where Cladophora mats previously have been observed The goals of this research were to determine the spatial and temporal variability of E coli populations in Cladophora mats in these
48
recreational waters and if cyanotoxins (microcystin LR and RR) were sequestered in the detached algae T he collection of Cladophora samples was coordinated with local beach monitoring programs to facilitate the comparison with ambient water bacteria concentrations This project provided important data for the assessment of public health impacts and the development of beach management programs to address the problems associated with Cladophora accumulations Based on the results from this investigation Saginaw Bay appears to be more heavily impacted by detached Cladophora than Grand Traverse BayLittle Traverse Bay Mean E coli concentrations in detached Cladophora were higher in Saginaw Bay (2796 cfug dwt) than Grand Traverse BayLittle Traverse Bay (1775cfug dwt) however the difference was not statistically significant (Mann-Whitney ρ=040) The mean Cladophora extent score for Grand Traverse BayLittle Traverse Bay was 1 indicating that detached alga was consistently found in small pockets at a single location The mean Cladophora extent score for Saginaw Bay was 3 indicating that detached alga was found in 1 m2 deposits at all locations D ifferences in Cladophora accumulation between Saginaw Bay and Grand Traverse BayLittle Traverse Bay may be attributed to higher total phosphorus levels in Saginaw Bay Levels of E coli in detached Cladophora in both systems were similar to concentrations previously reported in the Great Lakes (1000 cfug dwt ndash 60000 cfug dwt) In Saginaw Bay the highest levels of E coli in detached Cladophora were consistently found at locations near the Saginaw River (Wenona Beach and the Bay City Recreation Area) Even within individual sites locations near tributaries and drains at Wenona Beach and South Linwood Beach were significantly higher than locations farther away form a point source This relationship also was noted in Grand Traverse Bay where the location near Mitchell Creek at the Traverse City State Park had elevated E coli concentrations in detached Cladophora compared to the other two beach stations where no detached algae was found These results suggest that Cladophora can trap bacteria from point sources and also be stimulated by nutrient discharges T wo locations Pinconning Park and Whitersquos Beach had very limited Cladophora growth Both locations had Chara growing on the lake bottom Chara is known to exhibit allelopathic activity that can limit the growth of other aquatic plants N o correlation was found between E coli levels in the open water (designated beach monitoring locations) and the near-shore zone where the detached Cladophora samples were taken As noted in previous studies Cladophora appears to hold trapped E coli and does not release the entrained bacteria into the offshore water This investigation was the first to document the accumulation of microcystins in the detached Cladophora of Saginaw Bay Total microcystins in detached Cladophora had a grand mean of 57 microgg dwt for the study period Saginaw Bay has a history of Microcystis blooms in the late summer months that produce both microcystin LR and RR S ince Microcystis has a h igh requirement for sunlight cyanobacteria may become stressed when they become trapped in the detached algae mats W hile accidental ingestion by humans of microcystins trapped in Cladophora is unlikely these compounds can act as skin irritants Walking through Cladophora accumulations to get to deeper water may provide sufficient exposure to cause irritation in sensitive individuals if microcystins are present While all of the data suggest that swimming areas (1 m depth) are not impacted by E coli accumulations in detached Cladophora entrained bacteria and cyanotoxins may pose a hazard to children playing in the near-shore water and beach sand Current regulations discourage beach grooming and altering the near-shore zone The presence of elevated bacteria and microcystin levels in the near-shore environment of
49
Saginaw Bay suggest that the current policy should be reevaluated to balance potential impacts to public health with the ecosystem services provided by coastal wetlands 60 References APHA (American Public Health Association) 1998 Standard Methods for the Evaluation of
Water and Wastewater 20th edition APHA Washington DC Barbiero RP MC Tuchman and ES Millard 2006 Post-dreissenid increases in transparency
during summer stratification in the offshore waters of Lake Ontario Is a reduction in whiting events the cause J Great Lakes Res 32131ndash141
Bartsch A F 1968 Eutrophication is beginning in Lake Michigan 1968 Water Waste Eng 5
84-87 Bell SG and Codd G A 1994 Cyanobacterial toxins and human health Rev Med Microbiol
5256ndash264 Berger J and Schagerl M 2004 Allelopathic activity of Characeae Biologia 599ndash15 Bootsma HA EB Young and JA Berges (eds) 2005 Cladophora research and
management in the Great Lakes Proceedings of workshop December 2004 Special Report No 2005-01 UWM Great Lakes WATER Institute
Boyer G M C Watzin A D Shambaugh M F Satchwell B R Rosen and T Mihuc 2004
The occurrence of cyanobacterial toxins in Lake Champlain In Lake Champlain partnerships and Research in the New Millennium (Proceedings of the Lake Champlain Research Consortium May 20th 2002 Saint-Jean-sur-Richelieu Quebec T Manley Ed p 241-257
Byappanahalli M N D A Shively M B Nevers M J Sadowsky and R L Whitman 2003
Growth and survival of Escherichia coli and enterococci populations in the macro-alga Cladophora (Chlorophyta) FEMS Microbiol Ecol 46203-211
Byappanahalli M N and R L Whitman 2009 Clostridium botulinum type E occurs and grows
in the alga Cladophora glomerata Can J Fish Aquat Sci 66 879ndash882 Codd GA 1995 Cyanobacterial toxins occurrence properties and biological significance
Water Sci Technol 32 149^156 Dodds W K and D A Gudder 1992 The ecology of Cladophora J Phycol 28415-427 Englebert ET McDermott C and GT Kleinheinz 2008 Effects of the nuisance algae
Cladophora on Escherichia coli at recreational beaches in Wisconsin The Science of the Total Environment 404(1)10-17
50
Fahnenstiel G L Millie D F Dyble J Litaker R W Tester P A McCormick M J Rediske R and D Klarer 2008 Microcystin concentrations and cell quotas in Saginaw Bay Lake Huron Aquatic Ecosystems Health and Management 11(2)190 ndash 195
Graham L E 1982 Cytology ultrastructure taxonomy and phylogenetic relationships of Great
Lakes filamentous algae J Great Lakes Res 854-60 Hecky R E R E H Smith D R Barton S J Guildford W D Taylor M N Charlton and
T Howell 2004 The nearshore phosphorus shunt a consequence of ecosystem engineering by dreissenids in the Laurentia Great Lakes Can J Fish Aquat Sci 611285-1293
Herbst RP 1969 Ecological factors and the distribution of Cladophora glomerata in the Great
Lakes Am Midl Nat 8290ndash98 Higgins S N E T Howell R E Hecky S J Guildford and REH Smith 2005 The wall of
green The status of Cladophora glomerata on the northern shores of Lake Eries eastern basin 1995-2002 J Gt Lakes Res 31 547-563
Hydrolab 1998 DataSonde 4a Userrsquos Manual Hydrolab Corporation Austin TX Ishii S T Yan DA Shively MN Byappanahalli RL Whitman and MJ Sadowsky 2006
Cladophora (Chlorophyta) spp harbor human bacterial pathogens in nearshore water of Lake Michigan Appl Environ Microbiol 72 (7)4545ndash4553
Joska A M and J J Bolton 1996 Filamentous freshwater macroalgae in South Africa ndash a
literature review and perspective on the development and control of weed problems Hydrobiologia 340 295-300
Keilty T and Woller M 2004 Final Report prepared for the USEPA-GLNPO by the Leelanau
Watershed Council Leelanau Conservancy L a n d s b e r g J H 2 0 0 2 T h e e f f e c t s o f h a r m f u l
a l g a l b l o o m s o n a q u a t i c o r g a n i s m s R e v F i s h S c i 1 0 1 1 3 ndash 3 9 0
Lawrence JF Niedzwiadek B Menard C Lau BP-Y Kuiper-Goodman T Carbone S
Holmes C 2001 Comparison of HPLC-mass spectrometry ELISA and phosphatase assay for the determination of microcystins in blue-green algae products J AOAC Int 841035-1044
MDNRE 2006 Water Quality Monitoring of Saginaw and Grand Traverse Bays Michigan
Department of Natural Resources and Environment Lansing MI MIDEQWB-06096 Millie D G Fahnenstiel J Dyble R Litaker P Tester M McCormick R Rediske and D
Klarer 2008 Influence of environmental conditions on summer cyanobacterial abundance in Saginaw Bay Lake Huron Aquatic Ecosystems Health and Management 11(2)196ndash205
51
Mills E L J M Casselman R Dermott J D Fitzsimons G Gal K T Holeck J A Hoyle OE Johannsson B F Lantry J C Makarewicz E S Millard I F Munawar M Munawar R OGorman R W Owens L G Rudstam T Schaner and T J Stewart 2003 Lake Ontario Food web dynamics in a changing ecosystem (1970-2000) Can J Fish Aquat Sci 60 471ndash490
Neil J H and M B Jackson 1982 Monitoring Cladophora growth conditions and the effect of
phosphorus additions at a shoreline site in northeastern Lake Erie J Great Lakes Res 830-34
Olapade O A M M Depas E T Jensen and S L McLellan 2006 Microbial communities
and fecal indicator bacteria associated with Cladophora mats on beach sites along Lake Michigan shores Appl Environ Microbiol 721932-1938
Painter D S and G Kamaitis 1987 Reduction of Cladophora biomass and tissue phosphorus
in Lake Ontario 1972-1983 Can J Fish Aquat Sci 44 2212-2215 Stevenson RJ ST Rier CM Riseng RE Shultz and MJ Wiley 2006 Comparing effects
of nutrients on algal blooms in streams in two regions with different disturbance regimes and with application for developing nutrient criteria Hydrobiologia 561149ndash165
Taft C E 1975 History of Cladophora in the Great Lakes In H Shear and D E Konasewich
[eds] Cladophora in the Great Lakes International Joint Commission The Watershed Center 2006 Tributary Monitoring Data The Watershed Center Traverse City
MI Vanderploeg HA Liebig JR Carmichael WW Agy MA Johengen TH Fahnenstiel GL
amp Nalepa TF 2001 Zebra mussel (Dreissena polymorpha) selective filtration promoted toxic Microcystis blooms in Saginaw Bay (Lake Huron) and Lake Erie Can J Fish Aquat Sci 58 1208ndash1221
Whitman R L D A Shively H Pawlik M B Nevers and M N Byappanahalli 2003
Occurrence of Escherichia coli and enterococci in Cladophora (Chlorophyta) in nearshore water and beach sand of Lake Michigan Appl Environ Microbiol 694714-4719
Wilson K A E T Howell and D A Jackson 2006 Replacement of Zebra Mussels by
Quagga Mussels in the Canadian nearshore of Lake Ontario Distribution and correlations with substrate Round Goby abundance and upwelling frequency J Gt Lakes Res 3211-28
Zhu B D G Fitzgerald C M Mayer L G Rudstam and E L Mills 2006 Alteration of
ecosystem function by Zebra Mussels in Oneida Lake Impacts on submerged macrophytes Ecosystems 9 1017-1028
- Assessment of E coli and Microcystins in Cladophora Mats in the Nearshore Waters of Grand Traverse Bay Little Traverse Bay and Saginaw Bay
- May 2010
- TABLE OF CONTENTS
- LIST OF TABLES
- LIST OF FIGURES
- Acknowledgements
- Executive Summary
- 10 Introduction
- 20 Methods
-
- 21 Sampling methods
-
- 211 Sampling Design
- 212 Sampling Methods
-
- 22 Analytical Methods
-
- 221 Hydrolab Methods
- 222 E coli Analysis
- 223 Sample Preparation for Microcystin Analysis
- 244 Microcystin LR and RR by LCMS
-
- 30 Results
-
- 31 Saginaw Bay E coli Microcystin and Water Chemistry Results
-
- 311 Wenona Beach
- 312 Bay City Recreation Area
- 313 Brissette Beach
- 314 South Linwood Beach
- 315 Pinconning Park
- 316 Whitersquos Beach
- 317 Arenac County Park
- 318 Foster Road Beach
-
- 32 Grand Traverse Bay and Little Traverse Bay E coli Microcystin and Water Chemistry Results
-
- 321 Petoskey State Park
- 322 Magnus Park
- 323 Elk Rapids Park
- 324 Antrim County Day Park
- 325 East Bay Park
- 326 Traverse City State Park
- 327 Bryant Park
- 328 Clinch Park
- 329 West End Beach
-
- 33 Saginaw Bay and Grand Traverse BayLittle Traverse Bay Comparisons
-
- 40 Discussion
- 50 Conclusions
- 60 References
-

5
22 Analytical Methods
Laboratory procedures have been selected based on previous use for water quality investigations established ranges for accuracyprecision and limited problems related to matrix interferences A summary of analytical methods is given in Table 21 Method summaries are provided in the following sections 221 Hydrolab Methods Hydrolab measurements of pH temperature dissolved oxygen and specific conductance were conducted according to the methods in the instrument users manual (Hydrolab 1998) T he Hydrolab Datasonde 4a was calibrated in the lab prior to use in the field The instrument was placed in the water at each site and the technician waited for a s table reading of the sensors Measurements were recorded at 05 m depth at each station P recision was assessed by the measurement of field duplicates at 10 of the stations
Table 21 Laboratory Analytical Methods
222 E coli Analysis Samples of E coli were prepared by elutriation with phosphate buffer (Whitman et al 2003) One gram portions of homogenized algal samples were weighed and placed in sterile 15- milliliter (mL) centrifuge tubes Nine mL of sterile phosphate-buffered diluent water (pH 68) was added and the mixture was vigorously shaken for 2 min and then centrifuged briefly (45 s) at 2000 rpm to allow the large particles to settle The diluted sample then was analyzed by the Colilert-18 (IDEXX) using the Quanti-Tray 2000 (APHA 1998) A 1 mL aliquot was removed from the centrifuge tube and transferred to 99 mL of sterile phosphate buffer in a sterile water sampling vial The Colilert reagent then was then added to the vial and shaken until dissolved The sample and reagents were then added to the Quanti-Tray 2000 and sealed with the Quanti-Tray sealer T he tray was incubated for 18 ho urs at 35degC plusmn 05degC and read under UV light Fluorescent colonies were counted and the number of colony forming units (cfu)100 mL was calculated according to the manufacturerrsquos instructions
Parameter Preparation Preservation Holding Time Methods Reference
pH Hydrolab 1998 Dissolved Oxygen Hydrolab 1998
Temperature Hydrolab 1998 Specific conductance Hydrolab 1998
Microcystin LR and RR by LCMS
Filtration methanol extraction C-18
cartridge Freeze -30degC 6 mo Lawerence et al 2001
Boyer et al 2004
E coli Phosphate buffer extraction Cool 4degC 6 hrs
Whitman et al 2003 Colilert-18
APHA 1998
6
223 Sample Preparation for Microcystin Analysis
Water samples for the analyses of microcystin were prepared according to methods outlined by Lawerence et al (2001) A 100-500 mL aliquot was filtered through a Whatman GFC glass fiber filter The filter then was placed in a 5 mL centrifuge tube and lyophilized for 8 hours The filter residue was extracted with three successive aliquots of methanol followed by sonication The methanol extract was evaporated to dryness under nitrogen and re-dissolved in 1 mL of 50 methanol in water This mixture was passed through a 1 gram (g) SPE C-18 cartridge (Baker) that had been preconditioned with 10 mL of methanol followed by 10 mL of water The cartridge then was washed with 5 mL of 25 methanol in water and the eluted fraction was discarded The microcystins then were eluted with 4 mL of 100 methanol in water This fraction was collected and the volume reduced to 2 mL The volume was adjusted back to 3 mL with methanol and split into three 1 mL aliquots for HPLCMS analysis
244 Microcystin LR and RR by LCMS Samples for Liquid ChromatographyMass Spectrometry (LCMS) analysis were filtered using Gelman AE binderless glass fiber filters The cells were lysed by freezing and then vortexed for 5 minutes in centrifuge tubes containing 10 mL of aqueous (5050) methanol to extract toxins Suspensions were centrifuged and the supernatant was filtered through 045 micron nylon filters The concentrations of microcystin LR and RR were determined by liquid chromatography-tandem mass spectrometry using a Finnigan Surveyor MSQ LCMS Nodularin was added to the extracts and used as an internal standard Compounds were separated on a Phenomenex Luna C18 column at 50oC The mobile phase was a binary gradient of water and methanol both containing 01 formic acid T he initial gradient started with 95 water and 5 methanol followed by a step change to 50 water and 50 methanol at 3 minutes with a linear gradient from 5 t o 20 m inutes to 5 water and 95 methanol Instrument detection limits for these toxins were determined to be 1 microgramliter (microgl) For calibration a series of 5 solutions were prepared with the internal standard at 1000 microgl and the analytes in the range of 1 to 500 microgl in final volumes of 1 mL of 9010 watermethanol 30 Results The results of E coli water chemistry and microcystins data from each location are presented for Saginaw Bay and Grand Traverse BayLittle Traverse Bay in Sections 31 and 32 respectively A comparison of the two basins is provided in Section 33
31 Saginaw Bay E coli Microcystin and Water Chemistry Results
311 Wenona Beach The sampling locations for Wenona Beach are provided in Figure 311 Near-shore locations were sampled at a depth of 03 m The beach area was covered with reed canary grass sedges and cattails Cattails and detached Cladophora were common in the shallow littoral zone and the samples were collected approximately 1 meter outside of the macrophyte zone The detached
7
Cladophora also was common at the sampling locations with some areas of fresh Cladophora growing on submerged rocks and woody debris
Figure 311 Wenona Beach Sampling Locations 2008 (L= Left C=Center R=Right) The results of water and detached Cladophora analyses are summarized in Tables 311 and 312 respectively The mean E coli concentration for the study period was 14 cfu100 mL with no single beach samples exceeding 100 cfu100 mL (Table 311) Water temperatures ranged from 21degC to 25degC The mean E coli concentration for detached Cladophora was 9775 cfug dwt (Table 312) Microcystins were detected in the detached Cladophora beginning in July with mean concentrations of 47 microgg dwt 47 microgg dwt and 103 microgg dwt for microcystin RR microcystin LR and total microcystins respectively Detached Cladophora was present in
8
Table 311 Wenona Beach Water Quality Data 2008
ConductanceL C R Mean microScm
062308 10 8 18 12 792 77 21 440070108 78 44 82 68 810 78 22 470070808 3 4 2 3 814 74 23 451071508 2 1 1 1 817 75 24 450072208 5 6 1 4 816 73 24 456072908 33 8 7 16 810 72 25 453080508 4 7 4 5 813 76 24 461081208 4 2 3 3 811 79 24 467
Mean 17 10 15 14 81 76 23 456
cfu100 mlDateE coli in Water Water Chemistry
pH DO (mgl) Temp OC
Table 312 Wenona Beach Cladophora Data 2008
CladophoraL C R Mean Extent RR LR Total
062308 448 733 22507 7896 5 lt 01 lt 01 lt 01070108 800 2331 25432 9521 5 lt 01 1 lt 01070808 1279 3561 31566 12135 5 12 11 23071508 610 500 1678 929 3 15 23 38072208 1892 2000 3578 2490 5 27 34 61072908 5631 5633 64132 25132 5 68 80 148080508 6322 4531 25346 12066 5 80 80 161081208 3313 2311 18462 8029 5 82 102 184
Mean 2537 2700 24088 9775 5 47 47 103
Microcystins in Cladophora microgg dwtDate E coli in Cladophora cfug dwt
(Cladophora Extent 0 = None Present 1 = Present in isolated pockets at one location 2 = Present in isolated pockets at all locations 3 = Deposits 1 m2 in area 4= Deposits 1-5 m2 in area 5 = Deposits gt 5 m2 in area)
deposits of gt5 m2 at all locations during the sampling period (Table 312) E coli concentrations in water and detached Cladophora are displayed in Figure 312 No correlation was observed between bacterial levels in water and detached algae (Spearmanrsquos RO ρ=014) The drop in E coli levels observed on July 15 was after a storm that had occurred on July 12 A statistically significant difference was observed between beach locations for E coli concentrations in detached Cladophora (Kruskal-Wallis ρ=00004) Station R was significantly different from C and L (Mann-Whitney ρ=0012 and 0010 respectively) S tation R was the closest sampling location to the Saginaw River Station R had the highest concentration of E coli in detached Cladophora (64132 cfug dwt) This bacterial concentration was the highest level observed during the study period
9
0
1
2
3
4
5
62508 7208 7908 71608 72308 73008 8608 81308
Log
E c
oli
Con
cent
ratio
n
Water (cfu100mL)Cladophora cfug dwt
Figure 312 E coli in Detached Cladophora and Water at Wenona Beach 2008 312 Bay City Recreation Area The sampling locations for the Bay City Recreation Area are provided in Figure 313 Three near-shore locations were sampled at a depth of 03 m The beach area was sandy and appeared to be groomed Detached Cladophora was common in the shallow littoral zone and the samples were collected approximately 1 meter from shore The results of water and detached Cladophora analyses are summarized in Tables 313 and 314 respectively The mean E coli concentration for the study period was 6 cfu100 mL with no single beach sample exceeding 100 cfu100 mL (Table 313) Water temperatures ranged from 21degC to 24degC The mean E coli concentration in detached Cladophora was 3216 cfug dwt (Table 314) Microcystins were detected in the detached Cladophora beginning in June with mean concentrations of 96 microgg dwt 129 microgg dwt and 225 microgg dwt for microcystin RR microcystin LR and total microcystins respectively The highest concentrations of microcystins were found on August 12 at the Bay City Recreation area (microcystin RR 364 microgg dwt microcystin LR 349 microgg dwt and total microcystins 714 microgg dwt) Detached Cladophora covered the entire beach for all but one of the sampling events E coli concentrations in water and detached Cladophora are displayed in Figure 314 No correlation was observed between bacterial levels in the water and the detached algae (Spearmanrsquos RO ρ=008) The drop in E coli levels observed on July 15 was after a storm that had occurred on July 12 A statistically significant difference was not observed between beach locations for E coli concentrations in detached Cladophora (Kruskal-Wallis ρ=00073) Station R had the highest concentration of E coli in detached Cladophora (8923 cfug dwt)
10
Figure 313 Bay City Recreation Area Sampling Locations 2008 (L= Left C=Center R=Right)
Table 313 Bay City Recreation Area Water Quality Data 2008
ConductanceL C R Mean microScm
062308 10 8 24 14 792 77 21 420070108 1 2 6 3 811 78 22 437070808 3 4 47 18 816 75 23 445071508 2 1 1 1 816 74 23 436072208 1 1 1 1 816 73 24 436072908 4 8 1 4 812 77 24 446080508 4 7 4 5 817 78 24 448081208 1 2 1 1 811 81 24 449
Mean 3 4 11 6 811 77 23 440
E coli in Water Water Chemistry cfu100 ml pH DO (mgl) Temp OC
Date
11
Table 314 Bay City Recreation Area Cladophora Data 2008
CladophoraL C R Mean Extent RR LR Total
062308 1432 856 3456 1915 5 1 1 2070108 1333 963 2564 1620 5 2 7 9070808 4222 4563 8923 5903 5 14 33 47071508 1100 1245 1344 1230 3 32 49 81072208 1632 2000 7843 3825 5 65 99 164072908 998 5633 8564 5065 5 56 219 275080508 2331 4531 3564 3475 5 231 275 505081208 3223 2311 2564 2699 5 364 349 714
Mean 2034 2763 4853 3216 5 96 129 225
Date E coli in Cladophora cfug dwt Microcystins in Cladophora microgg dwt
(Cladophora Extent 0 = None Present 1 = Present in isolated pockets at one location 2 = Present in isolated pockets at all locations 3 = Deposits 1 m2 in area 4= Deposits 1-5 m2 in area 5 = Deposits gt 5 m2 in area)
0
1
2
3
4
5
62508 7208 7908 71608 72308 73008 8608 81308
Log
E c
oli
Con
cent
ratio
n
Water (cfu100mL)Cladophora cfug dwt
Figure 314 E coli in Detached Cladophora and Water at the Bay City Recreation Area 2008
313 Brissette Beach The sampling locations for Brissette Beach are provided in Figure 315 T hree near-shore locations were sampled at a depth of 03 m T he beach area was sandy and appeared to be groomed Detached Cladophora was common in the shallow littoral zone and the samples were collected approximately 1-2 m from shore
12
Figure 315 Brissette Beach Sampling Locations 2008 (L= Left C=Center R=Right)
The results of water and detached Cladophora analyses are summarized in Tables 315 and 316 respectively The mean E coli concentration for the study period was 7 cfu100 mL with no single beach sample exceeding 100 cfu100 mL (Table 315) Water temperatures ranged from 21degC to 24degC The mean E coli concentration in detached Cladophora was 768 cfug dwt (Table 316) Microcystins were detected in the detached Cladophora beginning in June with mean concentrations of 9 microgg dwt 15 microgg dwt and 23 microgg dwt for microcystin RR microcystin LR and total microcystins respectively Detached Cladophora was present in deposits of 1-5 m2 at all locations during the sampling period except after the storm event on July 12 (Table 316) E coli concentrations in the water and detached Cladophora are displayed in Figure 316 No correlation was observed between bacterial levels in water and detached algae (Spearmanrsquos RO ρ=083) A statistically significant difference was not observed between beach locations for E coli concentrations in detached Cladophora (Kruskal-Wallis ρ=0053) Station R had the highest concentration of E coli in detached Cladophora (1848 cfug dwt)
13
Table 315 Brissette Beach Water Quality Data 2008
ConductanceL C R Mean microScm
062308 3 2 1 2 789 77 21 400070108 15 22 35 24 812 78 22 440070808 1 1 1 1 819 75 23 433071508 2 1 3 2 812 74 23 434072208 1 1 7 3 812 73 24 444072908 16 37 16 23 818 77 24 439080508 1 2 1 1 819 78 24 445081208 1 2 6 3 813 81 24 447
Mean 5 9 9 7 812 77 23 435
E coli in Water Water Chemistry cfu100 ml pH DO (mgl) Temp OC
Date
Table 316 Brissette Beach Cladophora Data 2008
CladophoraL C R Mean Extent RR LR Total
062308 618 1045 1848 1170 4 05 07 1070108 450 533 460 481 4 01 07 1070808 655 784 989 809 4 23 37 6071508 411 333 450 398 2 09 77 9072208 644 755 877 759 4 35 131 17072908 755 766 864 795 4 18 142 16080508 644 532 436 537 4 213 285 50081208 1033 1200 1344 1192 4 388 494 88
Mean 651 744 908 768 4 9 15 23
Date E coli in Cladophora cfug dwt Microcystins in Cladophora microgg dwt
(Cladophora Extent 0 = None Present 1 = Present in isolated pockets at one location 2 = Present in isolated pockets at all locations 3 = Deposits 1 m2 in area 4= Deposits 1-5 m2 in area 5 = Deposits gt 5 m2 in area)
0
1
2
3
4
5
62508 7208 7908 71608 72308 73008 8608 81308
Log
E c
oli
Conc
entra
tion Water (cfu100mL)
Cladophora cfug dwt
Figure 316 E coli in Detached Cladophora and Water at Brissette Beach 2008
14
314 South Linwood Beach The sampling locations for South Linwood Beach are provided in Figure 317 Three near-shore locations were sampled at a depth of 03 m T he beach area was sandy and appeared to be groomed Detached Cladophora was common in the shallow littoral zone and the samples were collected approximately 1-2 m from shore
Figure 317 South Linwood Beach Sampling Locations 2008 (L= Left C=Center R=Right)
15
The results of water and detached Cladophora analyses are summarized in Tables 317 and 318 respectively The mean E coli concentration for the study period was 9 cfu100 mL with no single beach sample exceeding 100 cfu100 mL (Table 317) Water temperatures ranged from 21degC to 24degC The mean E coli concentration in detached Cladophora was 1191 cfug dwt (Table 318) Microcystins were detected in the detached Cladophora beginning in July with mean concentrations of 12 microgg dwt 15 microgg dwt and 27 micro gg dwt for microcystin RR microcystin LR and total microcystins respectively D etached Cladophora was present in deposits of 1-5 m2 at all locations during the sampling period except after the storm event on July 12 (Table 318) E coli concentrations in water and detached Cladophora are displayed in Figure 318 No correlation was observed between bacterial levels in water and detached algae (Spearmanrsquos RO ρ=0061) E coli levels in detached Cladophora were significantly higher than water concentrations (Mann-Whitney ρlt0001) A statistically significant difference was not observed between beach locations for E coli concentrations in detached Cladophora (Kruskal-Wallis ρ=00046) Station L was significantly different from C and R (Mann-Whitney ρ=00002 and 0038 respectively) Station L was the closest sampling location to a drainage ditch that enters South Linwood Beach This station had the highest concentration of E coli in detached Cladophora (4888 cfug dwt)
Table 317 South Linwood Beach Water Quality Data 2008
ConductanceL C R Mean microScm
062308 1 lt 1 1 1 792 77 21 420070108 1 2 15 6 816 77 22 433070808 1 2 2 1 815 76 23 439071508 2 1 1 1 816 76 23 448072208 1 1 10 4 819 76 24 439072908 35 66 76 59 811 76 24 446080508 1 1 1 1 811 76 24 431081208 1 2 3 2 814 77 24 431
Mean 5 11 14 9 812 76 23 436
E coli in Water Water Chemistry cfu100 ml pH DO (mgl) Temp OC
Date
Table 318 South Linwood Beach Cladophora Data 2008
CladophoraL C R Mean Extent RR LR Total
062308 1412 390 716 839 4 lt01 lt01 lt01070108 2452 60 190 901 4 lt01 lt01 lt01070808 655 784 989 809 4 15 21 4071508 150 76 89 105 2 10 25 3072208 3324 2314 1964 2534 4 13 27 4072908 2353 756 812 1307 4 164 140 30080508 1325 533 834 897 4 170 240 41081208 4888 845 674 2136 4 350 430 78
Mean 2070 720 784 1191 4 12 15 27
Date E coli in Cladophora cfug dwt Microcystins in Cladophora microgg dwt
(Cladophora Extent 0 = None Present 1 = Present in isolated pockets at one location 2 = Present in isolated pockets at all locations 3 = Deposits 1 m2 in area 4= Deposits 1-5 m2 in area 5 = Deposits gt 5 m2 in area)
16
0
1
2
3
4
5
62508 7208 7908 71608 72308 73008 8608 81308
Log
E c
oli
Con
cent
ratio
n Water (cfu100mL)Cladophora cfug dwt
Figure 318 E coli in Detached Cladophora and Water at South Linwood Beach 2008 315 Pinconning Park The sampling locations for Pinconning Park are provided in Figure 319 T hree near-shore locations were sampled at depths of 03-05 m The beach area was sandy and appeared to be groomed Station L contained open water while Stations R and L contained Typha and Scirpus Chara also was present along the lake bottom suggesting groundwater influx Detached Cladophora was found only in isolated areas of the shallow littoral zone and the samples were collected approximately 1 meter from shore The results of water and detached Cladophora analyses are summarized in Tables 319 and 3110 respectively The mean E coli concentration for the study period was 3 cfu100 mL with no single beach sample exceeding 100 cfu100 mL (Table 313) Water temperatures ranged from 21degC to 24degC The mean E coli concentration in detached Cladophora was 299 cfug dwt (Table 314) Microcystins were detected in the detached Cladophora beginning in July with mean concentrations of 07 microgg dwt 3 microgg dwt and 4 microgg dwt for microcystin RR microcystin LR and total microcystins respectively Detached Cladophora was present in isolated pockets at all locations for only 3 of the 8 s ampling periods (Table 3110) E coli concentrations in water and detached Cladophora are displayed in Figure 314 No correlation was observed between bacterial levels in water and detached algae (Spearmanrsquos RO ρ=011) The drop in E coli levels observed on July 15 was after a storm that had occurred on July 12 A statistically significant difference was not observed between beach locations for E coli concentrations in detached Cladophora (Kruskal-Wallis ρ=0073) S tation C had the highest concentration of E coli in detached Cladophora (1454 cfug dwt)
17
Figure 319 Pinconning Park Sampling Locations 2008 (L= Left C=Center R=Right)
Table 319 Pinconning Park Water Quality Data 2008
ConductanceL C R Mean microScm
062308 1 2 1 1 756 77 21 460070108 1 2 1 1 816 76 22 464070808 2 1 3 2 817 77 23 463071508 2 1 3 2 810 76 23 475072208 1 1 1 1 815 77 24 474072908 4 8 9 7 812 76 24 466080508 4 2 lt 1 2 811 76 24 470081208 1 2 9 4 815 77 24 470
Mean 2 2 3 3 806 77 23 468
E coli in Water Water Chemistry cfu100 ml pH DO (mgl) Temp OC
Date
18
Table 3110 Pinconning Park Cladophora Data 2008 (NC=No Cladophora Present NA=Not Analyzed)
Cladophora
L C R Mean Extent RR LR Total062308 NC NC NC NC 0 NA NA NA070108 NC NC NC NC 0 NA NA NA070808 NC NC NC NC 0 NA NA NA071508 NC NC NC NC 0 NA NA NA072208 NC NC NC NC 0 NA NA NA072908 50 64 40 51 2 08 12 2080508 634 1454 188 759 2 09 18 3081208 184 18 56 86 2 07 98 10
Mean 289 512 95 299 1 07 3 4
Date E coli in Cladophora cfug dwt Microcystins in Cladophora microgg dwt
(Cladophora Extent 0 = None Present 1 = Present in isolated pockets at one location 2 = Present in isolated pockets at all locations 3 = Deposits 1 m2 in area 4= Deposits 1-5 m2 in area 5 = Deposits gt 5 m2 in area)
0
1
2
3
4
5
62508 7208 7908 71608 72308 73008 8608 81308
Log
E c
oli
Con
cent
ratio
n Water (cfu100mL)Cladophora cfug dwt
Figure 3110 E coli in Detached Cladophora and Water at Pinconning Park 2008 316 Whitersquos Beach The sampling locations for Whitersquos Beach are provided in Figure 3111 Three near-shore locations were sampled at depths of 03-05 m The beach area was sandy and appeared to be groomed Station L contained open water while Stations R and C contained Scirpus Chara also was present along the lake bottom suggesting groundwater influx Detached Cladophora was only found in isolated areas of the shallow littoral zone and the samples were collected approximately 1 meter from shore The results of water and detached Cladophora analyses are summarized in Tables 3111 and 3112 respectively The mean E coli concentration for the study period was 16 cfu100 mL with no single beach sample exceeding 100 cfu100 mL (Table 3111) Water temperatures
19
Figure 3111 Whitersquos Beach Sampling Locations 2008 (L= Left C=Center R=Right) ranged from 21degC to 24degC Detached Cladophora was present in only one sample and the concentration of E coli in the algae was 130 cfug dwt (Table 3112) Microcystin LR was detected in the detached Cladophora in only one sample in August (13 microgg dwt) Detached Cladophora was present only in the August 5 s ample at Station L (Table 3110) E coli concentrations in water and detached Cladophora are displayed in Figure 3112 No correlation was observed between bacterial levels in water and detached algae (Spearmanrsquos RO ρ=0007)
20
Table 3111 Whitersquos Beach Water Quality Data 2008
ConductanceL C R Mean microScm
062308 3 8 3 5 759 77 21 430070108 4 6 5 5 815 77 22 442070808 3 4 8 5 816 76 23 435071508 2 1 2 2 816 76 23 432072208 22 16 13 17 817 77 24 440072908 4 8 6 6 814 77 24 431080508 41 73 60 58 816 77 24 449081208 32 28 42 34 810 77 24 447
Mean 14 18 17 16 808 77 23 438
E coli in Water Water Chemistry cfu100 ml pH DO (mgl) Temp OC
Date
Table 3112 Whitersquos Beach Cladophora Data 2008 (NC=No Cladophora Present NA=Not
Analyzed)
CladophoraL C R Mean Extent RR LR Total
062308 NC NC NC NC 0 NA NA NA070108 NC NC NC NC 0 NA NA NA070808 NC NC NC NC 0 NA NA NA071508 NC NC NC NC 0 NA NA NA072208 NC NC NC NC 0 NA NA NA072908 NC NC NC NC 0 NA NA NA080508 130 NC NC mdash 1 NA 13 13081208 NC NC NC NC 0 NA NA NA
Mean 130 NC NC mdash 0 NA mdash mdash
Date E coli in Cladophora cfug dwt Microcystins in Cladophora microgg dwt
(Cladophora Extent 0 = None Present 1 = Present in isolated pockets at one location 2 = Present in isolated pockets at all locations 3 = Deposits 1 m2 in area 4= Deposits 1-5 m2 in area 5 = Deposits gt 5 m2 in area)
0
1
2
3
4
5
62508 7208 7908 71608 72308 73008 8608 81308
Water (cfu100mL)Cladophora cfug dwt
Figure 3112 E coli in Detached Cladophora and Water at Whitersquos Beach 2008
Log
E c
oli C
once
ntra
tion
21
317 Arenac County Park The sampling locations for Arenac County Park are provided in Figure 3113 Three near-shore locations were sampled at a depth of 03 m T he beach area was sandy and appeared to be groomed Detached Cladophora was common in the shallow littoral zone and the samples were collected approximately 1 meter from shore
Figure 3113 Arenac County Park Sampling Locations 2008 (L= Left C=Center R=Right)
The results of water and detached Cladophora analyses are summarized in Tables 3113 and 3114 respectively The mean E coli concentration for the study period was 25 cfu100 mL with only one beach sample exceeding 100 c fu100 mL (Station L 111 cfu100 mL Table 313) Water temperatures ranged from 21degC to 25degC The mean E coli concentration in
22
Table 3113 Arenac County Park Water Quality Data 2008
ConductanceL C R Mean microScm
062308 5 2 2 3 813 115 19 310070108 45 31 94 57 817 100 19 300070808 55 42 29 42 820 106 20 284071508 2 1 9 4 815 100 20 296072208 1 3 lt1 1 812 80 21 315072908 111 87 16 71 814 112 21 280080508 3 1 NC 1 811 114 21 292081208 1 2 60 21 817 113 21 296
Mean 28 21 26 25 815 11 20 297
E coli in Water Water Chemistry cfu100 ml pH DO (mgl) Temp OC
Date
Table 3114 Arenac County Park Cladophora Data 2008
CladophoraL C R Mean Extent RR LR Total
062308 1811 1144 2699 1885 4 lt01 lt01 lt01070108 1801 1327 3258 2129 4 3 2 5070808 38 175 290 168 2 1 3 4071508 56 87 84 76 2 4 9 13072208 130 223 433 262 3 3 13 16072908 56 88 53 66 4 9 19 27080508 240 670 810 573 3 28 43 70081208 1300 1670 1890 1620 4 90 158 248
Mean 679 673 1190 847 3 20 35 55
Date E coli in Cladophora cfug dwt Microcystins in Cladophora microgg dwt
(Cladophora Extent 0 = None Present 1 = Present in isolated pockets at one location 2 = Present in isolated pockets at all locations 3 = Deposits 1 m2 in area 4= Deposits 1-5 m2 in area 5 = Deposits gt 5 m2 in area)
detached Cladophora was 847 cfug dwt (Table 3114) M icrocystins were detected in the detached Cladophora beginning in July with mean concentrations of 20 microgg dwt 35 microgg dwt and 55 microgg dwt for microcystin RR microcystin LR and total microcystins respectively Detached Cladophora was present in 1-5 m p ockets at all locations for 6 of the 8 s ampling periods (Table 3114) The beach was groomed for the July 4th holiday and the Cladophora extent decreased to being present in isolated areas for two weeks E coli concentrations in water and detached Cladophora are displayed in Figure 3114 No correlation was observed between bacterial levels in water and detached algae (Spearmanrsquos RO ρ=061) A statistically significant difference was not observed between beach locations for E coli concentrations in detached Cladophora (Kruskal-Wallis ρ=057) S tation R had the highest concentration of E coli in detached Cladophora (3258 cfug dwt)
23
0
1
2
3
4
5
62508 7208 7908 71608 72308 73008 8608 81308
Log
E c
oli
Con
cent
ratio
n Water (cfu100mL)Cladophora cfug dwt
Figure 3114 E coli in Detached Cladophora and Water at Arenac County Park 2008 318 Foster Road Beach The sampling locations for Foster Road Beach are provided in Figure 3115 Three near-shore locations were sampled at a depth of 05 m T he beach area was sandy and appeared to be groomed Detached Cladophora was common in the shallow littoral zone and the samples were collected approximately 1 meter from shore Strong wave action was observed at this location which kept the detached Cladophora suspended in the water column This was the only Saginaw Bay location where suspended Cladophora was observed The results of water and detached Cladophora analyses are summarized in Tables 3115 and 3116 respectively The mean E coli concentration for the study period was 73 cfu100 mL with only one set of beach samples averaging 315 c fu100mL (July 15 Table 3117) This sample was taken after the storm event which occurred on July 12 Water temperatures ranged from 21degC to 25degC The mean E coli concentration in detached Cladophora was 2169 cfug dwt (Table 3116) Microcystins were detected in the detached Cladophora beginning in July with mean concentrations of 36 microgg dwt 41 microgg dwt and 77 microgg dwt for microcystin RR microcystin LR and total microcystins respectively D etached Cladophora was present throughout the water column during the first three weeks not present on July 15 (after the storm) and present only in isolated pockets during the remainder of the sampling period (Table 3116) E coli concentrations in water and detached Cladophora are displayed in Figure 3118 N o correlation was observed between bacterial levels in water and detached algae (Spearmanrsquos RO ρ=078) A statistically significant difference was not observed between beach locations for E coli concentrations in detached Cladophora (Kruskal-Wallis ρ=090) Station L had the highest concentration of E coli in detached Cladophora (7332 cfug dwt)
24
Figure 3115 Foster Road Beach Sampling Locations 2008 (L= Left C=Center R=Right)
Table 3115 Foster Road Beach Water Quality Data 2008
ConductanceL C R Mean microScm
062308 1 2 5 3 792 77 21 376070108 60 21 23 35 818 76 22 382070808 55 140 181 125 815 75 23 442071508 320 400 225 315 815 74 23 436072208 1 2 3 2 812 73 24 447072908 25 31 50 35 820 77 24 436080508 22 21 7 17 814 78 24 447081208 46 51 71 56 811 81 24 450
Mean 66 84 71 73 812 76 23 427
E coli in Water Water Chemistry cfu100 ml pH DO (mgl) Temp OC
Date
25
Table 3116 Foster Road Beach Cladophora Data 2008 (NC=No Cladophora Present NA=Not Analyzed)
Cladophora
L C R Mean Extent RR LR Total062308 1380 2760 1515 1885 5 lt01 lt01 lt01070108 4554 7010 5346 5637 5 lt01 1 1070808 6731 5893 7332 6652 5 12 11 23071508 NC NC NC NC 0 NA NA NA072208 150 230 320 233 2 27 34 61072908 230 156 240 209 2 68 80 148080508 213 270 189 224 2 80 80 161081208 332 380 320 344 2 82 102 184
Mean 1941 2386 2180 2169 3 36 41 77
Date E coli in Cladophora cfug dwt Microcystins in Cladophora microgg dwt
(Cladophora Extent 0 = None Present 1 = Present in isolated pockets at one location 2 = Present in isolated pockets at all locations 3 = Deposits 1 m2 in area 4= Deposits 1-5 m2 in area 5 = Deposits gt 5 m2 in area)
0
1
2
3
4
5
62508 7208 7908 71608 72308 73008 8608 81308
Log
E c
oli
Con
cent
ratio
n Water (cfu100mL)Cladophora cfug dwt
Figure 3116 E coli in Detached Cladophora and Water at Foster Road Beach 2008
32 Grand Traverse Bay and Little Traverse Bay E coli Microcystin and Water Chemistry Results
321 Petoskey State Park The sampling locations for Petoskey State Park are provided in Figure 321 Three near-shore locations were sampled at a depth of 03 m T he beach area was sandy and appeared to be natural Detached Cladophora was present in isolated pockets in the shallow littoral zone and the samples were collected approximately 1 meter from shore
26
Figure 321 Petoskey State Park Sampling Locations 2008 (L= Left C=Center R=Right) The results of water and detached Cladophora analyses are summarized in Tables 321 and 322 respectively The mean E coli concentration for the study period was 13 cfu100 mL with no single beach sample exceeding 100 cfu100 mL (Table 321) Water temperatures ranged from 19degC to 21degC The mean E coli concentration in detached Cladophora was 1117 cfug dwt (Table 322) M icrocystins were not detected in the detached Cladophora Detached Cladophora was present in isolated pockets at all locations for only 2 of the 8 sampling periods (Table 322) E coli concentrations in water and detached Cladophora are displayed in Figure 322 N o correlation was observed between bacterial levels in water and detached algae (Spearmanrsquos RO ρ=059) A statistically significant difference was not observed between beach locations for E coli concentrations in detached Cladophora (Kruskal-Wallis ρ=0058) Station R had the highest concentration of E coli in detached Cladophora (1600 cfug dwt)
27
Table 321 Petoskey State Park Water Quality Data 2008
ConductanceL C R Mean microScm
062308 6 3 2 4 800 105 19 303070108 89 55 73 72 823 109 19 296070808 2 3 3 3 813 110 19 300071508 3 6 6 5 815 105 20 295072208 4 7 5 5 824 104 21 300072908 16 12 5 11 818 108 21 298080508 1 1 1 1 814 104 21 300081208 6 3 1 4 807 107 21 297
Mean 16 11 12 13 814 106 20 299
E coli in Water Water Chemistry cfu100 ml pH DO (mgl) Temp OC
Date
Table 322 Petoskey State Park Cladophora Data 2008 (NC=No Cladophora Present NA=Not Analyzed)
Cladophora
L C R Mean Extent RR LR Total062308 990 1200 1100 1097 2 lt01 lt01 lt01070108 1455 1390 1543 1463 2 lt01 lt01 lt01070808 NC NC 1200 1200 1 lt01 lt01 lt01071508 NC 1423 NC 1423 1 lt01 lt01 lt01072208 NC 556 NC 556 1 lt01 lt01 lt01072908 NC NC 1600 1600 1 lt01 lt01 lt01080508 1200 NC NC 1200 1 lt01 lt01 lt01081208 NC NC 400 400 1 lt01 lt01 lt01
Mean 1215 1142 1169 1117 1 lt01 lt01 lt01
Date E coli in Cladophora cfug dwt Microcystins in Cladophora microgg dwt
(Cladophora Extent 0 = None Present 1 = Present in isolated pockets at one location 2 = Present in isolated pockets at all locations 3 = Deposits 1 m2 in area 4= Deposits 1-5 m2 in area 5 = Deposits gt 5 m2 in area)
0
1
2
3
4
5
62508 7208 7908 71608 72308 73008 8608 81308
Water (cfu100mL)Cladophora cfug dwt
Figure 322 E coli in Detached Cladophora and Water at Petoskey State Park 2008
Log
E c
oli C
once
ntra
tion
28
322 Magnus Park The sampling locations for Magnus Park are provided in Figure 323 The beach area was sandy and appeared to be natural Detached Cladophora was present in isolated pockets in the shallow littoral zone and the samples were collected approximately 1 meter from shore
Figure 323 Magnus Park Sampling Locations 2008 (L= Left C=Center R=Right) The results of water and detached Cladophora analyses are summarized in Tables 323 and 324 respectively The mean E coli concentration for the study period was 17 cfu100 mL with one beach sample exceeding 100 c fu100 mL (120 cfu100 mL Table 323) W ater temperatures ranged from 19degC to 21degC T he mean E coli concentration in detached Cladophora was 1554 cfug dwt (Table 324) Microcystins were not detected in the detached Cladophora Detached Cladophora was present in isolated pockets at one location for 4 of the 8 sampling periods (Table 324) E coli concentrations in water and detached Cladophora are displayed in Figure 324 N o correlation was observed between bacterial levels in water and detached algae (Spearmanrsquos RO ρ=059) A statistically significant difference was not observed between beach locations for E coli concentrations in detached Cladophora (Kruskal-Wallis ρ=0054) Station R had the highest concentration of E coli in detached Cladophora (2368 cfug dwt)
29
Table 323 Magnus Park Water Quality Data 2008
ConductanceL C R Mean microScm
062308 5 3 2 3 803 108 19 295070108 2 3 2 2 813 105 19 297070808 77 120 76 91 817 110 19 305071508 1 3 6 3 804 106 20 301072208 6 3 2 4 813 110 21 299072908 9 3 11 8 821 108 21 295080508 4 16 15 12 824 110 21 297081208 18 10 15 14 810 102 21 300
Mean 15 20 16 17 813 107 20 299
E coli in Water Water Chemistry cfu100 ml pH DO (mgl) Temp OC
Date
Table 324 Magnus Park Cladophora Data 2008 (NC=No Cladophora Present NA=Not
Analyzed)
CladophoraL C R Mean Extent RR LR Total
062308 2368 NC 3321 2845 1 lt01 lt01 lt01070108 NC NC NC NC 0 NC NC NC070808 NC NC 1200 1200 1 lt01 lt01 lt01071508 NC NC NC NC 0 NC NC NC072208 NC NC NC NC 0 NC NC NC072908 NC NC 1300 1300 1 lt01 lt01 lt01080508 NC NC NC NC 0 NC NC NC081208 NC NC 870 870 1 lt01 lt01 lt01
Mean 2368 NC 1673 1554 1 lt01 lt01 lt01
Date E coli in Cladophora cfug dwt Microcystins in Cladophora microgg dwt
(Cladophora Extent 0 = None Present 1 = Present in isolated pockets at one location 2 = Present in isolated pockets at all locations 3 = Deposits 1 m2 in area 4= Deposits 1-5 m2 in area 5 = Deposits gt 5 m2 in area)
0
1
2
3
4
5
62508 7208 7908 71608 72308 73008 8608 81308
Water (cfu100mL)Cladophora cfug dwt
Figure 324 E coli in Detached Cladophora and Water at Magnus Park 2008
Log
E c
oli C
once
ntra
tion
30
323 Elk Rapids Park The sampling locations for Elk Rapids Park are provided in Figure 325 The beach area was sandy and appeared to be natural Detached Cladophora was present in isolated pockets in the shallow littoral zone and the samples were collected approximately 1 meter from shore
Figure 325 Elk Rapids Park Sampling Locations 2008 (L= Left C=Center R=Right)
The results of water and detached Cladophora analyses are summarized in Tables 325 and 326 respectively The mean E coli concentration for the study period was 74 cfu100 mL with two sets of beach samples exceeding 100 c fu100 mL (134 cfu100 mL and 292 c fu100 mL Table 325) Water temperatures ranged from 19degC to 21degC The mean E coli concentration in detached Cladophora was 1225 cfug dwt (Table 326) Microcystins were not detected in the detached Cladophora Detached Cladophora was present in isolated pockets at more than one location for 6 of the 8 sampling periods (Table 316) E coli concentrations in water and detached Cladophora are displayed in Figure 314 N o correlation was observed between bacterial levels in water and detached algae (Spearmanrsquos RO ρ=018) A statistically significant difference was observed between beach locations for E coli concentrations in detached Cladophora (Kruskal-Wallis ρ=0030) Station R was significantly different from C and L (Mann-Whitney ρ=0005 and 0003 respectively) Station R was the closest sampling location
31
Table 325 Elk Rapids Park Water Quality Data 2008
ConductanceL C R Mean microScm
062308 155 390 330 292 827 100 19 297070108 23 16 54 31 814 109 19 301070808 44 13 27 28 811 108 19 297071508 22 56 70 49 813 109 20 301072208 57 25 22 35 812 101 21 275072908 90 145 166 134 805 109 21 297080508 4 1 21 9 801 107 21 281081208 25 19 7 17 810 102 21 302
Mean 53 83 87 74 812 11 20 294
E coli in Water Water Chemistry cfu100 ml pH DO (mgl) Temp OC
Date
Table 326 Elk Rapids Park Cladophora Data 2008 (NC=No Cladophora Present NA=Not Analyzed)
Cladophora
L C R Mean Extent RR LR Total062308 724 4111 6900 3912 2 lt01 lt01 lt01070108 322 858 3754 1645 2 lt01 lt01 lt01070808 NC NC 770 770 1 lt01 lt01 lt01071508 NC NC 840 840 1 lt01 lt01 lt01072208 569 670 440 560 2 lt01 lt01 lt01072908 430 1100 1600 1043 2 lt01 lt01 lt01080508 500 700 344 515 2 lt01 lt01 lt01081208 330 448 780 519 2 lt01 lt01 lt01
Mean 479 1314 1928 1225 2 lt01 lt01 lt01
Date E coli in Cladophora cfug dwt Microcystins in Cladophora microgg dwt
(Cladophora Extent 0 = None Present 1 = Present in isolated pockets at one location 2 = Present in isolated pockets at all locations 3 = Deposits 1 m2 in area 4= Deposits 1-5 m2 in area 5 = Deposits gt 5 m2 in area)
0
1
2
3
4
5
62508 7208 7908 71608 72308 73008 8608 81308
Water (cfu100mL)Cladophora cfug dwt
Figure 326 E coli in Detached Cladophora and Water at the Elk Rapids Park 2008
Log
E c
oli C
once
ntra
tion
32
location to the creek which drains a duck pond ne ar the city S tation R had the highest concentration of E coli in detached Cladophora (6900 cfug dwt) 324 Antrim County Day Park The sampling locations for Antrim County Day Park are provided in Figure 327 Three near-shore locations were sampled at a depth of 03 m The beach area was sandy and appeared to be natural Detached Cladophora was common in the shallow littoral zone and the samples were collected approximately 1 meter from shore
Figure 327 Antrim County Day Park Sampling Locations 2008 (L= Left C=Center R=Right)
The results of water and detached Cladophora analyses are summarized in Tables 327 and 328 respectively The mean E coli concentration for the study period was 25 cfu100 mL with one beach sample exceeding 100 c fu100 mL (111 cfu100 mL Table 327) W ater
33
temperatures ranged from 19degC to 21degC T he mean E coli concentration in detached Cladophora was 350 cfug dwt (Table 328) Microcystins were not detected in the detached Cladophora Detached Cladophora was either absent or present in isolated pockets at one location for 7 of the 8 sampling periods and at 2 l ocations during 1 sampling period (Table 318) E coli concentrations in water and detached Cladophora are displayed in Figure 328 No correlation was observed between bacterial levels in water and detached algae (Spearmanrsquos RO ρ=068) A statistically significant difference was not observed between beach locations for E coli concentrations in detached Cladophora (Kruskal-Wallis ρ=027) S tation R had the highest concentration of E coli in detached Cladophora (660 cfug dwt)
Table 327 Antrim County Day Park Water Quality Data 2008
ConductanceL C R Mean microScm
062308 5 2 2 3 813 115 19 310070108 45 31 94 57 817 100 19 300070808 55 42 29 42 820 106 20 284071508 2 1 9 4 815 100 20 296072208 1 3 lt1 1 812 80 21 315072908 111 87 16 71 814 112 21 280080508 3 1 NC 1 811 114 21 292081208 1 2 60 21 817 113 21 296
Mean 28 21 26 25 815 11 20 297
E coli in Water Water Chemistry cfu100 ml pH DO (mgl) Temp OC
Date
Table 328 Antrim County Day Park Cladophora Data 2008 (NC=No Cladophora Present NA=Not Analyzed)
Cladophora
L C R Mean Extent RR LR Total062308 79 61 660 267 2 lt01 lt01 lt01070108 NC NC NC NC 0 NA NA NA070808 NC NC NC NC 0 NA NA NA071508 NC NC NC NC 0 NA NA NA072208 NC NC 440 440 1 NA lt01 NA072908 NC NC NC NC 0 NA NA NA080508 NC NC 344 344 1 NA lt01 NA081208 NC NC NC NC 0 NA NA NA
Mean mdash mdash 481 350 1 mdash lt01 mdash
Date E coli in Cladophora cfug dwt Microcystins in Cladophora microgg dwt
(Cladophora Extent 0 = None Present 1 = Present in isolated pockets at one location 2 = Present in isolated pockets at all locations 3 = Deposits 1 m2 in area 4= Deposits 1-5 m2 in area 5 = Deposits gt 5 m2 in area)
34
0
1
2
3
4
5
62508 7208 7908 71608 72308 73008 8608 81308
Water (cfu100mL)Cladophora cfug dwt
Figure 328 E coli in Detached Cladophora and Water at the Antrim County Day Park 2008
325 East Bay Park The sampling locations for East Bay Park are provided in Figure 329 Three near-shore locations were sampled at depths of 03-05 m The beach area was sandy and appeared to be natural S tation L contained open water while Stations R and C contained Scirpus Detached Cladophora was found at all of the shallow littoral zone locations and the samples were collected approximately 1 meter from shore The results of water and detached Cladophora analyses are summarized in Tables 329 and 3210 respectively The mean E coli concentration for the study period was 25 cfu100 mL with one sample exceeding 100 cfu100 mL (103 cfu100 mL Table 329) Water temperatures ranged from 19degC to 21degC The mean E coli concentration in detached Cladophora was 969 cfug dwt (Table 3210) M icrocystins were not detected in the detached Cladophora Detached Cladophora was present in isolated pockets at more than one location for all of the 8 sampling periods (Table 3210) E coli concentrations in water and detached Cladophora are displayed in Figure 3210 No correlation was observed between bacterial levels in water and detached algae (Spearmanrsquos RO ρ=012) A statistically significant difference was not observed between beach locations for E coli concentrations in detached Cladophora (Kruskal-Wallis ρ=041) Station L had the highest E coli concentration in detached Cladophora (5000 cfug dwt) Station L was the closest sampling location to a storm-water outlet entering Grand Traverse Bay
Log
E c
oli C
once
ntra
tion
35
Figure 329 East Bay Park Sampling Locations 2008 (L= Left C=Center R=Right)
Table 329 East Bay Park Water Quality Data 2008
ConductanceL C R Mean microScm
062308 2 1 3 2 821 106 19 299070108 5 3 NC 3 821 104 19 300070808 4 7 14 8 807 105 19 320071508 17 41 21 26 807 103 20 310072208 41 91 103 78 804 101 21 330072908 51 92 61 68 819 102 21 324080508 8 4 11 8 805 103 21 309081208 7 2 1 8 809 108 21 317
Mean 17 30 27 25 812 10 20 314
E coli in Water Water Chemistry cfu100 ml pH DO (mgl) Temp OC
Date
36
Table 3210 East Bay Park Cladophora Data 2008 (NC=No Cladophora Present NA=Not Analyzed)
Cladophora
L C R Mean Extent RR LR Total062308 5000 2000 1000 2667 3 lt01 lt01 lt01070108 3300 1500 900 1900 3 lt01 lt01 lt01070808 660 500 460 540 3 lt01 lt01 lt01071508 546 600 NC 573 2 lt01 lt01 lt01072208 340 500 600 480 3 lt01 lt01 lt01072908 700 630 NC 665 2 lt01 lt01 lt01080508 935 500 700 712 3 lt01 lt01 lt01081208 325 330 NC 218 2 lt01 lt01 lt01
Mean 1476 820 732 969 3 lt01 lt01 lt01
Date E coli in Cladophora cfug dwt Microcystins in Cladophora microgg dwt
(Cladophora Extent 0 = None Present 1 = Present in isolated pockets at one location 2 = Present in isolated pockets at all locations 3 = Deposits 1 m2 in area 4= Deposits 1-5 m2 in area 5 = Deposits gt 5 m2 in area)
0
1
2
3
4
5
62508 7208 7908 71608 72308 73008 8608 81308
Log
E c
oli C
once
ntra
tion
Water (cfu100mL)Cladophora cfug dwt
Figure 3210 E coli in Detached Cladophora and Water at East Bay Park 2008 326 Traverse City State Park The sampling locations for Traverse City State Park are provided in Figure 3211 Three near-shore locations were sampled at a depth of 03 m The beach area was sandy and appeared to be natural Detached Cladophora was present in isolated pockets in the shallow littoral zone near Mitchell Creek and the samples were collected approximately 1 meter from shore
37
Figure 3211 Traverse City State Park Sampling Locations 2008 (L= Left C=Center R=Right)
The results of water and detached Cladophora analyses are summarized in Tables 3211 and 3212 respectively The mean E coli concentration for the study period was 33 cfu100 mL with one sample exceeding 100 cfu100 mL (195 cfu100 mL Table 3211) W ater temperatures ranged from 19degC to 21degC Station L was the only location at this beach with detached Cladophora and the associated E coli concentrations averaged 1630 cfug dwt The highest concentration E coli in detached Cladophora was 3300 cfug dwt This station was the closest sampling location to Mitchell Creek which has a history of bacterial contamination problems (The Watershed Center 2006) Microcystins were not detected in the detached Cladophora Detached Cladophora was present in isolated pockets at one location for all of the 8 sampling periods (Table 3212) E coli concentrations in water and detached Cladophora are displayed in Figure 3212 No correlation was observed between bacterial levels in water and detached algae (Spearmanrsquos RO ρ=015) A statistically significant difference was observed between beach locations for E coli concentrations in detached Cladophora (Kruskal-Wallis ρ=0001)
38
Table 3211 Traverse City State Park Water Quality Data 2008
ConductanceL C R Mean microScm
062308 1 4 NC 2 816 107 19 301070108 3 5 10 6 815 101 19 305070808 195 37 66 99 815 105 19 296071508 22 48 63 44 820 104 20 297072208 95 88 57 80 801 108 21 299072908 19 10 5 11 802 102 21 300080508 18 14 11 14 825 108 21 294081208 8 6 5 6 805 106 21 294
Mean 45 27 31 33 812 105 20 298
DateE coli in Water Water Chemistry
cfu100 ml pH DO (mgl) Temp OC
Table 3212 Traverse City State Park Cladophora Data 2008 (NC=No Cladophora Present NA=Not Analyzed)
Cladophora
L C R Mean Extent RR LR Total062308 2000 NC NC mdash 1 lt01 lt01 lt01070108 3300 NC NC mdash 1 lt01 lt01 lt01070808 900 NC NC mdash 1 lt01 lt01 lt01071508 750 NC NC mdash 1 lt01 lt01 lt01072208 1200 NC NC mdash 1 lt01 lt01 lt01072908 700 NC NC mdash 1 lt01 lt01 lt01080508 990 NC NC mdash 1 lt01 lt01 lt01081208 3200 NC NC mdash 1 lt01 lt01 lt01
Mean 1630 NC NC mdash 1 lt01 lt01 lt01
Date E coli in Cladophora cfug dwt Microcystins in Cladophora microgg dwt
(Cladophora Extent 0 = None Present 1 = Present in isolated pockets at one location 2 = Present in isolated pockets at all locations 3 = Deposits 1 m2 in area 4= Deposits 1-5 m2 in area 5 = Deposits gt 5 m2 in area)
0
1
2
3
4
5
62508 7208 7908 71608 72308 73008 8608 81308
Water (cfu100mL)Cladophora cfug dwt
Figure 3212 E coli in Detached Cladophora and Water at Traverse City State Park 2008
Log
E c
oli C
once
ntra
tion
39
327 Bryant Park The sampling locations for Bryant Park are provided in Figure 3213 T hree near-shore locations were sampled at a depth of 03 m T he beach area was sandy and appeared to be natural Detached Cladophora was common in the shallow littoral zone and the samples were collected approximately 1 meter from shore
Figure 3213 Bryant Park Sampling Locations 2008 (L= Left C=Center R=Right)
40
The results of water and detached Cladophora analyses are summarized in Tables 3213 and 3214 respectively The mean E coli concentration for the study period was 46 cfu100 mL with one set of samples exceeding 100 cfu100 mL (281 cfu100 mL Table 3213) W ater temperatures ranged from 19degC to 21degC T he mean E coli concentration in detached Cladophora was 1873 cfug dwt (Table 3214) Microcystins were not detected in the detached Cladophora Detached Cladophora was present in isolated pockets at one location for all of the 8 sampling periods (Table 3214) E coli concentrations in water and detached Cladophora are displayed in Figure 3214 No correlation was observed between bacterial levels in water and detached algae (Spearmanrsquos RO ρ=082) A statistically significant difference was not observed between beach locations for E coli concentrations in detached Cladophora (Kruskal-Wallis ρ=048) Station C had the highest concentration of E coli in detached Cladophora (9460 cfug dwt)
Table 3213 Bryant Park Water Quality Data 2008
ConductanceL C R Mean microScm
062308 3 4 11 6 825 105 19 296070108 6 8 5 6 800 102 19 301070808 290 310 243 281 824 100 19 300071508 8 9 4 7 819 106 20 298072208 6 8 3 6 813 103 21 300072908 11 13 22 15 811 104 21 297080508 12 18 15 15 815 107 21 317081208 33 29 1 28 805 101 21 299
Mean 46 50 38 46 814 103 20 301
E coli in Water Water Chemistry cfu100 ml pH DO (mgl) Temp OC
Date
Table 3214 Bryant Park Cladophora Data 2008 (NC=No Cladophora Present NA=Not Analyzed)
Cladophora
L C R Mean Extent RR LR Total062308 980 9460 680 3707 2 lt01 lt01 lt01070108 977 7690 490 3052 2 lt01 lt01 lt01070808 3443 1462 2741 2549 2 lt01 lt01 lt01071508 1300 1800 1567 1556 2 lt01 lt01 lt01072208 990 832 751 858 2 lt01 lt01 lt01072908 111 1643 1565 1106 2 lt01 lt01 lt01080508 1245 890 1443 1193 2 lt01 lt01 lt01081208 1122 844 922 963 2 lt01 lt01 lt01
Mean 1271 3078 1270 1873 2 lt01 lt01 lt01
Date E coli in Cladophora cfug dwt Microcystins in Cladophora microgg dwt
(Cladophora Extent 0 = None Present 1 = Present in isolated pockets at one location 2 = Present in isolated pockets at all locations 3 = Deposits 1 m2 in area 4= Deposits 1-5 m2 in area 5 = Deposits gt 5 m2 in area)
41
0
1
2
3
4
5
62508 7208 7908 71608 72308 73008 8608 81308
Water (cfu100mL)Cladophora cfug dwt
Figure 3214 E coli in Detached Cladophora and Water at Bryant Park 2008 328 Clinch Park The sampling locations for Clinch Park are provided in Figure 3215 T hree near-shore locations were sampled at a depth of 03 m T he beach area was sandy and appeared to be natural Detached Cladophora was present at one location during the last sampling event The sample was collected approximately 05 m from shore The results of water and detached Cladophora analyses are summarized in Tables 3215 and 3216 respectively The mean E coli concentration for the study period was 35 cfu100 mL with one set of samples exceeding 100 cfu100 mL (164 cfu100 mL Table 3215) W ater temperatures ranged from 19degC to 21degC D etached Cladophora was present in an isolated pocket at one location during the August 12 sampling event (Table 3216) E coli was present in detached Cladophora in this sample at a concentration of 680 c fug dwt (Table 3216) Microcystins were not detected in the detached Cladophora E coli concentrations in water and detached Cladophora are displayed in Figure 3216 N o correlation was observed between bacterial levels in water and detached algae (Spearmanrsquos RO ρ=099)
Log
E c
oli C
once
ntra
tion
42
Figure 3215 Clinch Park Sampling Locations 2008 (L= Left C=Center R=Right)
Table 3215 Clinch Park Water Quality Data 2008
ConductanceL C R Mean microScm
062308 22 14 11 16 828 105 19 296070108 1 3 NC 1 801 109 19 300070808 33 19 30 27 805 101 19 310071508 21 18 32 24 816 107 20 302072208 155 170 167 164 802 103 21 302072908 43 21 37 34 801 104 21 307080508 11 7 18 12 830 102 21 299081208 4 2 1 3 822 104 21 298
Mean 36 32 37 35 813 104 20 302
E coli in Water Water Chemistry cfu100 ml pH DO (mgl) Temp OC
Date
43
Table 3216 Clinch Park Cladophora Data 2008 (NC=No Cladophora Present NA=Not Analyzed)
Cladophora
L C R Mean Extent RR LR Total062308 NC NC NC NC 0 lt01 lt01 lt01070108 NC NC NC NC 0 lt01 lt01 lt01070808 NC NC NC NC 0 lt01 lt01 lt01071508 NC NC NC NC 0 lt01 lt01 lt01072208 NC NC NC NC 0 lt01 lt01 lt01072908 NC NC NC NC 0 lt01 lt01 lt01080508 NC NC NC NC 0 lt01 lt01 lt01081208 NC NC 680 680 1 lt01 lt01 lt01
Mean NC NC 680 680 0 lt01 lt01 lt01
Date E coli in Cladophora cfug dwt Microcystins in Cladophora microgg dwt
(Cladophora Extent 0 = None Present 1 = Present in isolated pockets at one location 2 = Present in isolated pockets at all locations 3 = Deposits 1 m2 in area 4= Deposits 1-5 m2 in area 5 = Deposits gt 5 m2 in area)
0
1
2
3
4
5
62508 7208 7908 71608 72308 73008 8608 81308
Water (cfu100mL)Cladophora cfug dwt
Figure 3216 E coli in Detached Cladophora and Water at Clinch Park 2008 329 West End Beach The sampling locations for West End Beach are provided in Figure 3217 T hree near-shore locations were sampled at a depth of 03 m T he beach area was sandy and appeared to be natural Detached Cladophora was common in the shallow littoral zone and the samples were collected approximately 1 meter from shore This beach appeared to be used by pet owners as dogs were frequently present during sampling
Log
E c
oli C
once
ntra
tion
44
Figure 3217 West End Beach Sampling Locations 2008 (L= Left C=Center R=Right)
The results of water and detached Cladophora analyses are summarized in Tables 3217 and 3218 respectively The mean E coli concentration for the study period was 35 cfu100 mL with no samples exceeding 100 c fu100 mL (Table 3217) W ater temperatures ranged from 19degC to 21degC T he mean E coli concentration in detached Cladophora was 2976 cfug dwt (Table 3218) M icrocystins were not detected in the detached Cladophora Detached Cladophora was present in isolated pockets at all locations for 4 of the 8 sampling periods (Table 3218) E coli concentrations in water and detached Cladophora are displayed in Figure 3218 N o correlation was observed between bacterial levels in water and detached algae (Spearmanrsquos RO ρ=028) A statistically significant difference was not observed between beach locations for E coli concentrations in detached Cladophora (Kruskal-Wallis ρ=079) Station C was higher than the other stations with respect to mean E coli concentrations in detached Cladophora (3078 cfug dwt) The highest concentration of E coli in detached Cladophora measured during the study period in Grand Traverse Bay was at West End Beach (22874 cfug dwt at Station C) Dogs frequently were present on this beach at the time of sampling which may be the source of the high bacteria concentrations
45
Table 3217 West End Beach Water Quality Data 2008
ConductanceL C R Mean microScm
062308 5 3 4 4 821 103 19 302070108 3 1 2 2 829 110 19 297070808 34 55 48 46 807 100 19 303071508 46 33 25 35 803 108 20 301072208 66 86 126 93 804 105 21 297072908 6 14 5 8 825 106 21 294080508 100 94 49 81 827 107 21 306081208 22 10 1 14 827 107 21 297
Mean 35 37 33 35 818 106 20 300
E coli in Water Water Chemistry cfu100 ml pH DO (mgl) Temp OC
Date
Table 3218 West End Beach Cladophora Data 2008 (NC=No Cladophora Present NA=Not Analyzed)
Cladophora
L C R Mean Extent RR LR Total062308 1509 76 289 625 2 lt01 lt01 lt01070108 1721 22874 13337 12644 2 lt01 lt01 lt01070808 1016 NC NC 1016 1 lt01 lt01 lt01071508 NC NC 1644 1644 1 lt01 lt01 lt01072208 NC NC NC NC 0 NA NA NA072908 NC NC NC NC 0 NA NA NA080508 1300 1233 1567 1367 2 lt01 lt01 lt01081208 678 444 567 563 2 lt01 lt01 lt01
Mean 1245 6157 3481 2976 1 lt01 lt01 lt01
Date E coli in Cladophora cfug dwt Microcystins in Cladophora microgg dwt
(Cladophora Extent 0 = None Present 1 = Present in isolated pockets at one location 2 = Present in isolated pockets at all locations 3 = Deposits 1 m2 in area 4= Deposits 1-5 m2 in area 5 = Deposits gt 5 m2 in area)
0
1
2
3
4
5
62508 7208 7908 71608 72308 73008 8608 81308
Water (cfu100mL)Cladophora cfug dwt
Figure 3218 E coli in Detached Cladophora and Water at West End Beach 2008
Log
E c
oli C
once
ntra
tion
46
33 Saginaw Bay and Grand Traverse BayLittle Traverse Bay Comparisons
A summary of the project data is presented in Table 331 Mean temperatures for Saginaw Bay were higher than in Grand Traverse BayLittle Traverse Bay (23degC and 20degC respectively) Microcystins in detached Cladophora were absent in Grand Traverse BayLittle Traverse Bay In Saginaw Bay the grand mean of all locations with detached Cladophora was 57 microgg dwt for the study period M ean concentrations of E coli in water were significantly higher (Mann-Whitney ρ=0003) in Grand Traverse BayLittle Traverse Bay (34 cfu100 mL) than in Saginaw Bay (18 cfu100 mL) In contrast mean E coli concentrations in detached Cladophora were higher in Saginaw Bay (2796 cfug dwt) than Grand Traverse BayLittle Traverse Bay (1775 cfug dwt) however the difference was not statistically significant (Mann-Whitney ρ=040) The mean Cladophora extent score for Grand Traverse BayLittle Traverse Bay was 1 indicating that detached algae were found in small pockets T he mean Cladophora extent score for Saginaw Bay was 3 indicating that detached algae were found in 1 m2 deposits
Table 331 Summary of Water Quality and Cladophora Data for Grand Traverse BayLittle Traverse Bay and Saginaw Bay 2008
Parameter Saginaw Bay Grand TraverseLittle Traverse Bay
Mean Temperature 23degC 20degC Mean Total Microcystins 57 microgg dwt lt01 microgg dwt Cladophora Extent Score 3 1 Mean E coli in Water 18 cfu100 mL 34 cfu100 mL Mean E coli in Cladophora 2796 cfug dwt 1775 cfug dwt
(Cladophora Extent 0 = None Present 1 = Present in isolated pockets at one location 2 = Present in isolated pockets at all locations 3 = Deposits 1 m2 in area 4= Deposits 1-5 m2 in area 5 = Deposits gt 5 m2 in area)
40 Discussion The presence of Cladophora has been associated with high levels of E coli and species of potentially pathogenic enteric bacteria in beach sand and swimming waters of the Great Lakes (Whitman et al 2003 Ishii et al 2006 Olapade et al 2006) Enteric bacteria can grow within detached Cladophora under certain conditions (Byappanahalli et al 2005) In addition detached Cladophora deposits can potentially harbor and enhance the survival of pathogenic bacteria released into the environment through point and non-point sources (Byappanahalli et al 2005) Recently Clostridium was found to grow in detached Cladophora in the Great Lakes (Byappanahalli and Whitman 2009) Algal species including Cladophora have been reported to provide nutrients and to protect attached bacteria from environmental stresses desiccation predation and harmful UV radiation (Byappanahalli et al 2005) In this manner Cladophora mats may play a significant role as a source and sink for pathogens in the near-shore environment Based on the results from this investigation Saginaw Bay appears to be more heavily impacted by detached Cladophora than Grand Traverse BayLittle Traverse Bay Eutrophication of lakes has been associated with increases in Cladophora mat production and accumulation (Stevenson et al 2006 Herbst 1969) but water transparency also has been suggested as an important causative factor (Barbiero et al 2006 Bootsma 2007) Elevated levels of nutrients in Saginaw Bay have been reported to stimulate blooms of cyanobacteria in Saginaw Bay and also influence the near-shore environment (Fahnenstiel et al 2008 Millie et al
47
2008) Differences in Cladophora accumulation between the Lake Huron and Lake Michigan sites may be attributed to higher total phosphorus levels (18 microgl vs 5 microgl MDNRE 2006) Levels of E coli in detached Cladophora in both systems were similar to concentrations previously reported in the Great Lakes (3 log10 - 5 log10 Engelbert et al 2008) In Saginaw Bay the highest levels of E coli in detached Cladophora were consistently found at locations near the Saginaw River (Wenona Beach and the Bay City Recreation Area) E ven within individual sites locations near tributaries and drains at Wenona Beach and South Linwood Beach were significantly higher than locations farther away form a point source This relationship also was noted in Grand Traverse Bay where the location near Mitchell Creek at the Traverse City State Park had elevated E coli concentrations in detached Cladophora compared to the other two beach stations At Traverse City State Park Cladophora deposits were present only at the location near Mitchell Creek These results suggest that Cladophora can trap bacteria from point sources and also be stimulated by nutrient discharges Two locations Pinconning Park and Whitersquos Beach had very limited Cladophora growth Both locations had Chara growing on the lake bottom Chara is known to exhibit allelopathic activity that can limit the growth of other aquatic plants (Berger and Schagerl 2004) No correlation was found between E coli levels in the open water (designated beach monitoring locations) and the near-shore zone where the detached Cladophora samples were taken As noted in previous studies Cladophora appears to hold trapped E coli and not release the entrained bacteria into the offshore water (Byappanahalli et al 2003 Engelbert et al 2008) This investigation was the first to document the accumulation of microcystins in the detached Cladophora of Saginaw Bay S aginaw Bay has a history of Microcystis blooms in the late summer months that produce both microcystin LR and RR (Fahnenstiel et al 2008 Millie et al 2008) S ince Microcystis has a high requirement for sunlight cyanobacteria may become stressed when they become trapped in the detached algae deposits Stress has been implicated in initiating cyanotoxin production (Codd 1995) While accidental ingestion by humans of microcystins trapped in Cladophora is unlikely these compounds can act as skin irritants (Bell and Codd 1994) W alking through Cladophora accumulations to get to deeper water may provide sufficient exposure to cause irritation in sensitive individuals if microcystins are present While all of the data suggest that swimming areas (1 m depth) are not impacted by E coli accumulations in detached Cladophora entrained bacteria and cyanotoxins may pose a hazard to children playing in the near-shore water and beach sand While current regulations discourage beach grooming the presence of elevated bacteria and microcystin levels in the near-shore environment of Saginaw Bay suggests that the current policy should balance potential impacts to public health with the ecosystem services provided by coastal wetlands 50 Conclusions An assessment of the ability of Cladophora mats to sequester E coli and microcystin LR and RR was conducted in near-shore waters of Grand Traverse Bay (7 sites) Little Traverse Bay (2 sites) and Saginaw Bay (8 sites) The sampling locations were at public beach access points where Cladophora mats previously have been observed The goals of this research were to determine the spatial and temporal variability of E coli populations in Cladophora mats in these
48
recreational waters and if cyanotoxins (microcystin LR and RR) were sequestered in the detached algae T he collection of Cladophora samples was coordinated with local beach monitoring programs to facilitate the comparison with ambient water bacteria concentrations This project provided important data for the assessment of public health impacts and the development of beach management programs to address the problems associated with Cladophora accumulations Based on the results from this investigation Saginaw Bay appears to be more heavily impacted by detached Cladophora than Grand Traverse BayLittle Traverse Bay Mean E coli concentrations in detached Cladophora were higher in Saginaw Bay (2796 cfug dwt) than Grand Traverse BayLittle Traverse Bay (1775cfug dwt) however the difference was not statistically significant (Mann-Whitney ρ=040) The mean Cladophora extent score for Grand Traverse BayLittle Traverse Bay was 1 indicating that detached alga was consistently found in small pockets at a single location The mean Cladophora extent score for Saginaw Bay was 3 indicating that detached alga was found in 1 m2 deposits at all locations D ifferences in Cladophora accumulation between Saginaw Bay and Grand Traverse BayLittle Traverse Bay may be attributed to higher total phosphorus levels in Saginaw Bay Levels of E coli in detached Cladophora in both systems were similar to concentrations previously reported in the Great Lakes (1000 cfug dwt ndash 60000 cfug dwt) In Saginaw Bay the highest levels of E coli in detached Cladophora were consistently found at locations near the Saginaw River (Wenona Beach and the Bay City Recreation Area) Even within individual sites locations near tributaries and drains at Wenona Beach and South Linwood Beach were significantly higher than locations farther away form a point source This relationship also was noted in Grand Traverse Bay where the location near Mitchell Creek at the Traverse City State Park had elevated E coli concentrations in detached Cladophora compared to the other two beach stations where no detached algae was found These results suggest that Cladophora can trap bacteria from point sources and also be stimulated by nutrient discharges T wo locations Pinconning Park and Whitersquos Beach had very limited Cladophora growth Both locations had Chara growing on the lake bottom Chara is known to exhibit allelopathic activity that can limit the growth of other aquatic plants N o correlation was found between E coli levels in the open water (designated beach monitoring locations) and the near-shore zone where the detached Cladophora samples were taken As noted in previous studies Cladophora appears to hold trapped E coli and does not release the entrained bacteria into the offshore water This investigation was the first to document the accumulation of microcystins in the detached Cladophora of Saginaw Bay Total microcystins in detached Cladophora had a grand mean of 57 microgg dwt for the study period Saginaw Bay has a history of Microcystis blooms in the late summer months that produce both microcystin LR and RR S ince Microcystis has a h igh requirement for sunlight cyanobacteria may become stressed when they become trapped in the detached algae mats W hile accidental ingestion by humans of microcystins trapped in Cladophora is unlikely these compounds can act as skin irritants Walking through Cladophora accumulations to get to deeper water may provide sufficient exposure to cause irritation in sensitive individuals if microcystins are present While all of the data suggest that swimming areas (1 m depth) are not impacted by E coli accumulations in detached Cladophora entrained bacteria and cyanotoxins may pose a hazard to children playing in the near-shore water and beach sand Current regulations discourage beach grooming and altering the near-shore zone The presence of elevated bacteria and microcystin levels in the near-shore environment of
49
Saginaw Bay suggest that the current policy should be reevaluated to balance potential impacts to public health with the ecosystem services provided by coastal wetlands 60 References APHA (American Public Health Association) 1998 Standard Methods for the Evaluation of
Water and Wastewater 20th edition APHA Washington DC Barbiero RP MC Tuchman and ES Millard 2006 Post-dreissenid increases in transparency
during summer stratification in the offshore waters of Lake Ontario Is a reduction in whiting events the cause J Great Lakes Res 32131ndash141
Bartsch A F 1968 Eutrophication is beginning in Lake Michigan 1968 Water Waste Eng 5
84-87 Bell SG and Codd G A 1994 Cyanobacterial toxins and human health Rev Med Microbiol
5256ndash264 Berger J and Schagerl M 2004 Allelopathic activity of Characeae Biologia 599ndash15 Bootsma HA EB Young and JA Berges (eds) 2005 Cladophora research and
management in the Great Lakes Proceedings of workshop December 2004 Special Report No 2005-01 UWM Great Lakes WATER Institute
Boyer G M C Watzin A D Shambaugh M F Satchwell B R Rosen and T Mihuc 2004
The occurrence of cyanobacterial toxins in Lake Champlain In Lake Champlain partnerships and Research in the New Millennium (Proceedings of the Lake Champlain Research Consortium May 20th 2002 Saint-Jean-sur-Richelieu Quebec T Manley Ed p 241-257
Byappanahalli M N D A Shively M B Nevers M J Sadowsky and R L Whitman 2003
Growth and survival of Escherichia coli and enterococci populations in the macro-alga Cladophora (Chlorophyta) FEMS Microbiol Ecol 46203-211
Byappanahalli M N and R L Whitman 2009 Clostridium botulinum type E occurs and grows
in the alga Cladophora glomerata Can J Fish Aquat Sci 66 879ndash882 Codd GA 1995 Cyanobacterial toxins occurrence properties and biological significance
Water Sci Technol 32 149^156 Dodds W K and D A Gudder 1992 The ecology of Cladophora J Phycol 28415-427 Englebert ET McDermott C and GT Kleinheinz 2008 Effects of the nuisance algae
Cladophora on Escherichia coli at recreational beaches in Wisconsin The Science of the Total Environment 404(1)10-17
50
Fahnenstiel G L Millie D F Dyble J Litaker R W Tester P A McCormick M J Rediske R and D Klarer 2008 Microcystin concentrations and cell quotas in Saginaw Bay Lake Huron Aquatic Ecosystems Health and Management 11(2)190 ndash 195
Graham L E 1982 Cytology ultrastructure taxonomy and phylogenetic relationships of Great
Lakes filamentous algae J Great Lakes Res 854-60 Hecky R E R E H Smith D R Barton S J Guildford W D Taylor M N Charlton and
T Howell 2004 The nearshore phosphorus shunt a consequence of ecosystem engineering by dreissenids in the Laurentia Great Lakes Can J Fish Aquat Sci 611285-1293
Herbst RP 1969 Ecological factors and the distribution of Cladophora glomerata in the Great
Lakes Am Midl Nat 8290ndash98 Higgins S N E T Howell R E Hecky S J Guildford and REH Smith 2005 The wall of
green The status of Cladophora glomerata on the northern shores of Lake Eries eastern basin 1995-2002 J Gt Lakes Res 31 547-563
Hydrolab 1998 DataSonde 4a Userrsquos Manual Hydrolab Corporation Austin TX Ishii S T Yan DA Shively MN Byappanahalli RL Whitman and MJ Sadowsky 2006
Cladophora (Chlorophyta) spp harbor human bacterial pathogens in nearshore water of Lake Michigan Appl Environ Microbiol 72 (7)4545ndash4553
Joska A M and J J Bolton 1996 Filamentous freshwater macroalgae in South Africa ndash a
literature review and perspective on the development and control of weed problems Hydrobiologia 340 295-300
Keilty T and Woller M 2004 Final Report prepared for the USEPA-GLNPO by the Leelanau
Watershed Council Leelanau Conservancy L a n d s b e r g J H 2 0 0 2 T h e e f f e c t s o f h a r m f u l
a l g a l b l o o m s o n a q u a t i c o r g a n i s m s R e v F i s h S c i 1 0 1 1 3 ndash 3 9 0
Lawrence JF Niedzwiadek B Menard C Lau BP-Y Kuiper-Goodman T Carbone S
Holmes C 2001 Comparison of HPLC-mass spectrometry ELISA and phosphatase assay for the determination of microcystins in blue-green algae products J AOAC Int 841035-1044
MDNRE 2006 Water Quality Monitoring of Saginaw and Grand Traverse Bays Michigan
Department of Natural Resources and Environment Lansing MI MIDEQWB-06096 Millie D G Fahnenstiel J Dyble R Litaker P Tester M McCormick R Rediske and D
Klarer 2008 Influence of environmental conditions on summer cyanobacterial abundance in Saginaw Bay Lake Huron Aquatic Ecosystems Health and Management 11(2)196ndash205
51
Mills E L J M Casselman R Dermott J D Fitzsimons G Gal K T Holeck J A Hoyle OE Johannsson B F Lantry J C Makarewicz E S Millard I F Munawar M Munawar R OGorman R W Owens L G Rudstam T Schaner and T J Stewart 2003 Lake Ontario Food web dynamics in a changing ecosystem (1970-2000) Can J Fish Aquat Sci 60 471ndash490
Neil J H and M B Jackson 1982 Monitoring Cladophora growth conditions and the effect of
phosphorus additions at a shoreline site in northeastern Lake Erie J Great Lakes Res 830-34
Olapade O A M M Depas E T Jensen and S L McLellan 2006 Microbial communities
and fecal indicator bacteria associated with Cladophora mats on beach sites along Lake Michigan shores Appl Environ Microbiol 721932-1938
Painter D S and G Kamaitis 1987 Reduction of Cladophora biomass and tissue phosphorus
in Lake Ontario 1972-1983 Can J Fish Aquat Sci 44 2212-2215 Stevenson RJ ST Rier CM Riseng RE Shultz and MJ Wiley 2006 Comparing effects
of nutrients on algal blooms in streams in two regions with different disturbance regimes and with application for developing nutrient criteria Hydrobiologia 561149ndash165
Taft C E 1975 History of Cladophora in the Great Lakes In H Shear and D E Konasewich
[eds] Cladophora in the Great Lakes International Joint Commission The Watershed Center 2006 Tributary Monitoring Data The Watershed Center Traverse City
MI Vanderploeg HA Liebig JR Carmichael WW Agy MA Johengen TH Fahnenstiel GL
amp Nalepa TF 2001 Zebra mussel (Dreissena polymorpha) selective filtration promoted toxic Microcystis blooms in Saginaw Bay (Lake Huron) and Lake Erie Can J Fish Aquat Sci 58 1208ndash1221
Whitman R L D A Shively H Pawlik M B Nevers and M N Byappanahalli 2003
Occurrence of Escherichia coli and enterococci in Cladophora (Chlorophyta) in nearshore water and beach sand of Lake Michigan Appl Environ Microbiol 694714-4719
Wilson K A E T Howell and D A Jackson 2006 Replacement of Zebra Mussels by
Quagga Mussels in the Canadian nearshore of Lake Ontario Distribution and correlations with substrate Round Goby abundance and upwelling frequency J Gt Lakes Res 3211-28
Zhu B D G Fitzgerald C M Mayer L G Rudstam and E L Mills 2006 Alteration of
ecosystem function by Zebra Mussels in Oneida Lake Impacts on submerged macrophytes Ecosystems 9 1017-1028
- Assessment of E coli and Microcystins in Cladophora Mats in the Nearshore Waters of Grand Traverse Bay Little Traverse Bay and Saginaw Bay
- May 2010
- TABLE OF CONTENTS
- LIST OF TABLES
- LIST OF FIGURES
- Acknowledgements
- Executive Summary
- 10 Introduction
- 20 Methods
-
- 21 Sampling methods
-
- 211 Sampling Design
- 212 Sampling Methods
-
- 22 Analytical Methods
-
- 221 Hydrolab Methods
- 222 E coli Analysis
- 223 Sample Preparation for Microcystin Analysis
- 244 Microcystin LR and RR by LCMS
-
- 30 Results
-
- 31 Saginaw Bay E coli Microcystin and Water Chemistry Results
-
- 311 Wenona Beach
- 312 Bay City Recreation Area
- 313 Brissette Beach
- 314 South Linwood Beach
- 315 Pinconning Park
- 316 Whitersquos Beach
- 317 Arenac County Park
- 318 Foster Road Beach
-
- 32 Grand Traverse Bay and Little Traverse Bay E coli Microcystin and Water Chemistry Results
-
- 321 Petoskey State Park
- 322 Magnus Park
- 323 Elk Rapids Park
- 324 Antrim County Day Park
- 325 East Bay Park
- 326 Traverse City State Park
- 327 Bryant Park
- 328 Clinch Park
- 329 West End Beach
-
- 33 Saginaw Bay and Grand Traverse BayLittle Traverse Bay Comparisons
-
- 40 Discussion
- 50 Conclusions
- 60 References
-
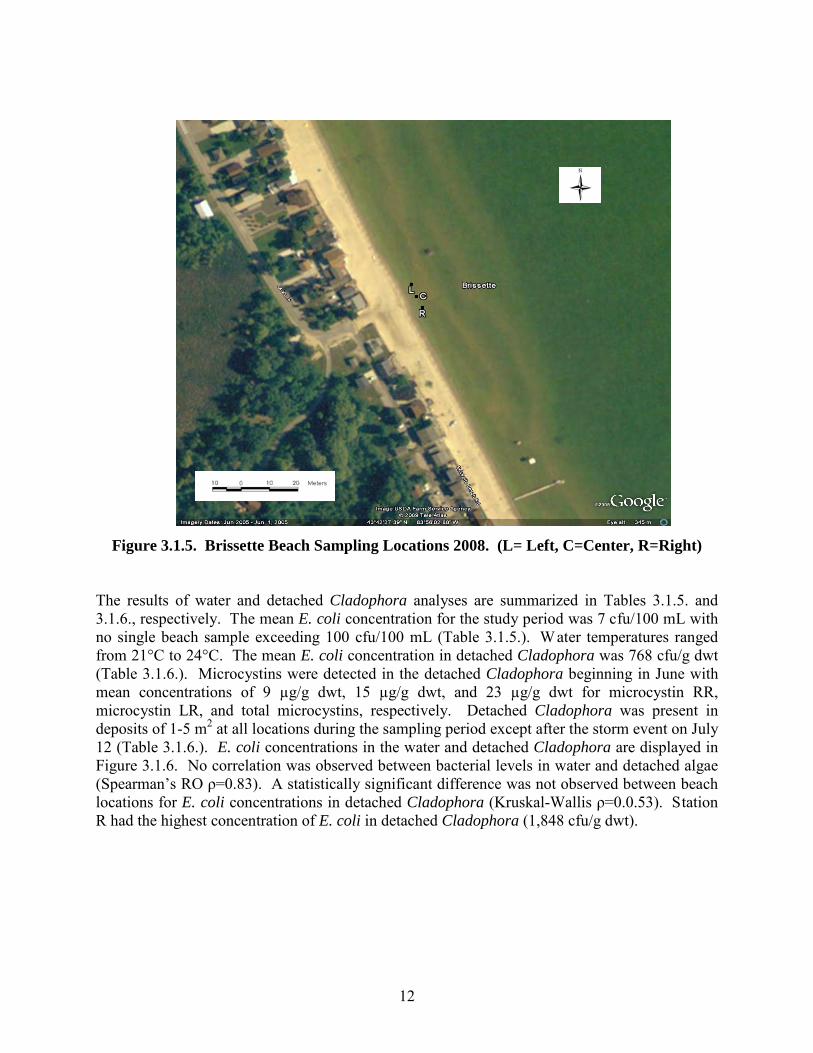
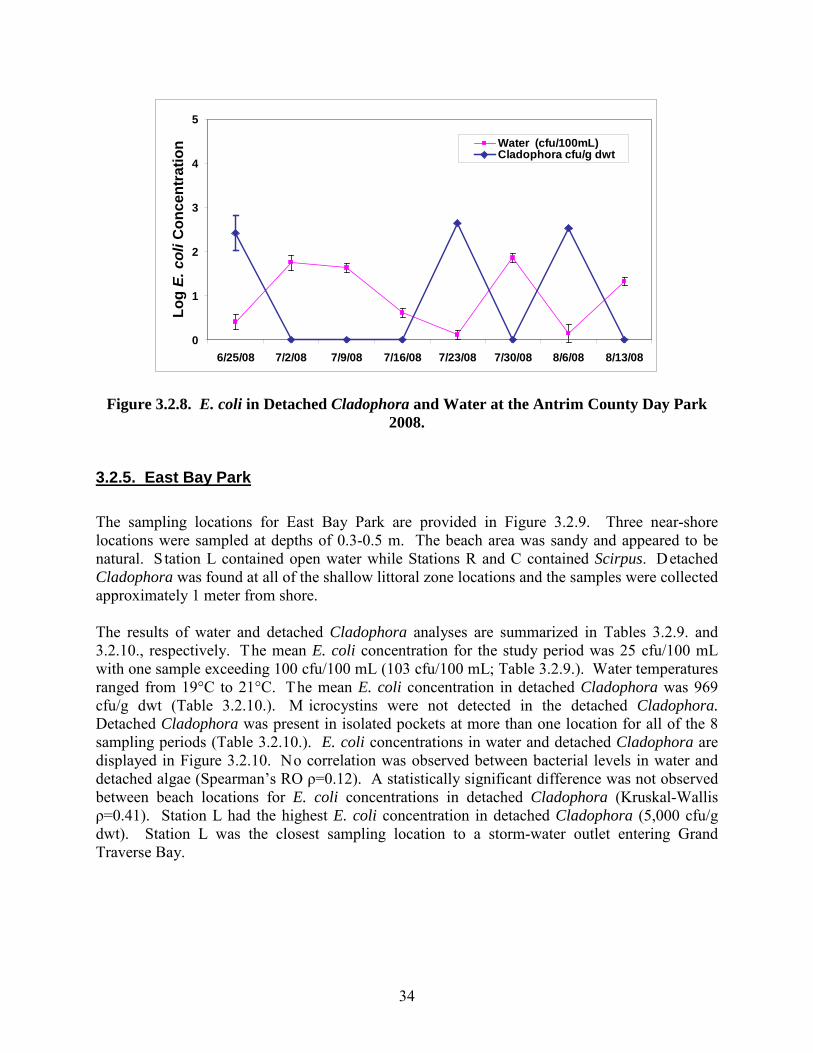
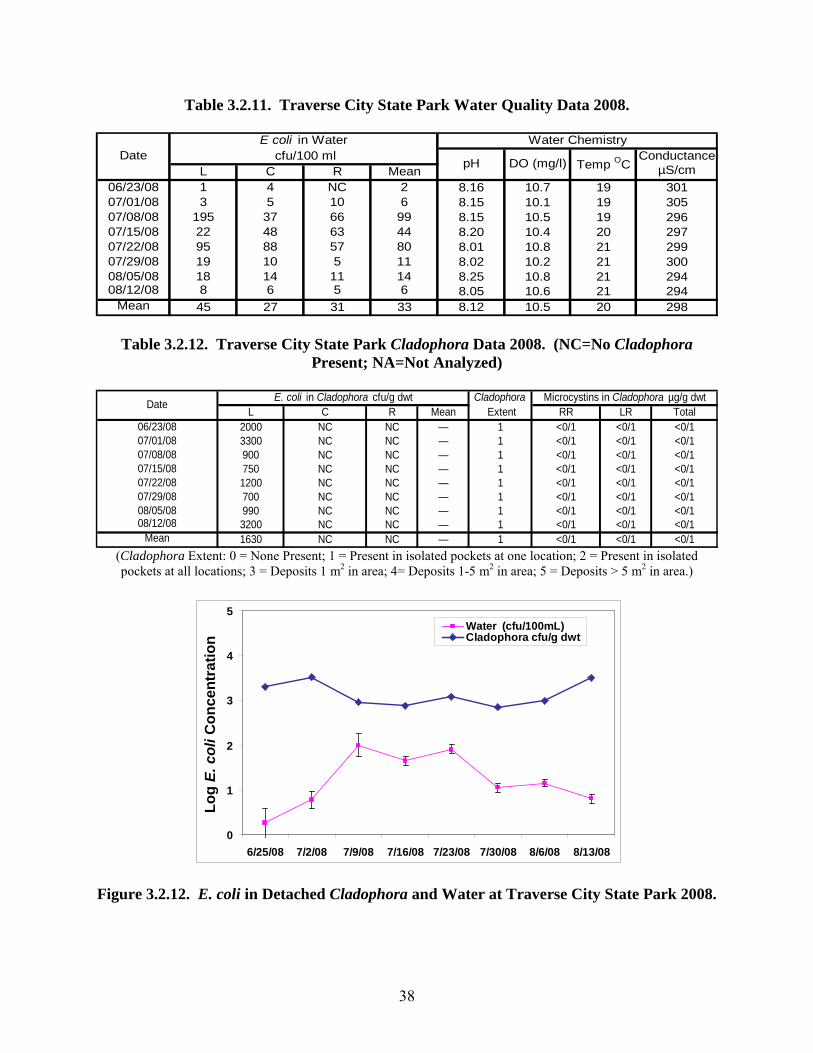
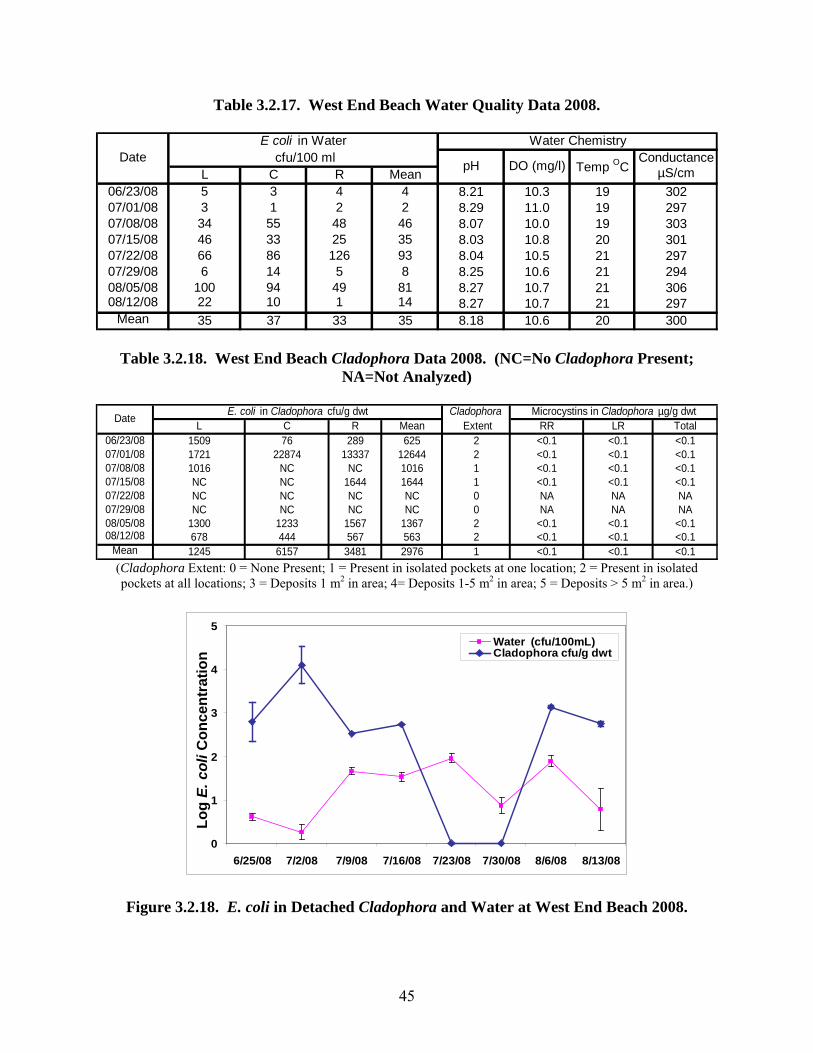