evaluation of field test kits to detect … of field test kits to detect microcystins: 2010 study...
TRANSCRIPT

EVALUATION OF FIELD TEST KITS TO DETECT MICROCYSTINS:
2010 STUDY
FINAL REPORT
PREPARED BY
ROCIO ARANDA-RODRIGUEZ ZHIYUN JIN
EXPOSURE AND BIOMONITORING DIVISION HEALTH CANADA
May 2011

2
Introduction
Cyanobacteria blooms may present a public health concern in sources of drinking
water and recreational water, as certain cyanobacteria species can produce toxins. These
cyanotoxins fall in the categories of hepatotoxic (microcystins, cylindrospermopsin),
neurotoxic (anatoxin-a, saxitoxin) or cytotoxic (cylindrospermopsin) based on the target
tissues. Within the hepatotoxins, microcystins are the most commonly produced toxin by
cyanobacteria worldwide. Over 90 different variants have been identified, but the predominant
variant found is microcystin-LR. Not all cyanobacteria blooms produce toxins, and there is no
visual indication of toxin presence so accurate, rapid methods to determine or estimate
microcystin levels in a water source are necessary to facilitate quick risk assessment
decisions during cyanobacteria bloom events. In Canada, the drinking water quality guideline
for microcystin-LR (MC-LR) is 1.5 µg/L (or ppb) [1]. The guideline for microcystin-LR is
considered protective of other microcystin variants (total microcystins) which may be present
in the water. The new Canadian recreational water quality guidelines are 100,000 cells/mL for
cyanobacteria and 20 µg/L of total microcystin [2]. The World Health Organization established
a drinking water guideline of 1 µg/L of total microcystin. Due to a lack of toxicological and
occurrence data on which to assess potential health risks, there are currently no guidelines for
any other cyanotoxins including cylindrospermopsin and anatoxin-a.
In Canada, detection of cyanobacteria blooms in water bodies has been steadily
increasing. Some provinces have established monitoring programs whereas others deal with
them on a case by case basis. Although laboratory techniques to detect microcystins are
available, the analysis per sample is costly and in places with high demand, the time for
analysis and reporting is lengthy (days). However, authorities must respond quickly when a
cyanobacteria bloom appears, in either a drinking water source or in recreational water
bodies.
For water sources affected by cyanobacteria blooms, the following flowchart (Figure 1)
is suggested for monitoring purposes [1] in water bodies used for human consumption. When
a bloom event is observed, where possible, raw water (collected at the water intake) and
treated water are collected simultaneously (step 2). Raw water is analyzed either by sending
samples to a laboratory for testing or using a field test kit on site. If the results show
microcystin levels of more than 1 µg/L (step 4), treated water is then analyzed (step 5). If the
results show microcystin levels of more than 1.5 µg/L in the treated water, appropriated
agencies and communities are notified, in addition to continuing sampling of treated water
(step 7 and 9).

3
10
9
8
5
3
2
1
Sample raw* and treated supplies for toxin(algal identification)
Visually monitor for bloom formation
Cyanobacterial Toxins -- Microcystin-LRFlow Chart
- Water Supplies for Human Consumption -
Perform toxin analysis oftreated water supplies
7
Send both raw and treated samples formicrocystin-LR analysis
Treated Water
Alternativesupply ortreatment
adjustment
Resampletreatedsupply
Notify communityand agencies
Consultation anddecision-making
April, 2002
NOTE: For recreationalwater supplies, followthe raw water protocol(steps 1-4)
6 (treated) 11 (treated)12 (treated)
M-LR>1.5 µg/L
M-LR<1.5 µg/L
Sendresults
toagencies
Raw Water
4 (raw) 11 (raw)
M-LR>1.0 µg/L
M-LR<1.0 µg/L
12 (raw)
Sendresults
toagencies
* A field kit could be used for screening. A validationsample should be send to a laboratory for confirmationof actual levels following a positive field test.
Figure 1. Flow chart from the Guidelines for Canadian Drinking Water Quality: Supporting
Documentation. Cyanobacterial Toxins-Microcystin-LR. Annex A. Water Supplies for Human
Consumption [1]
4
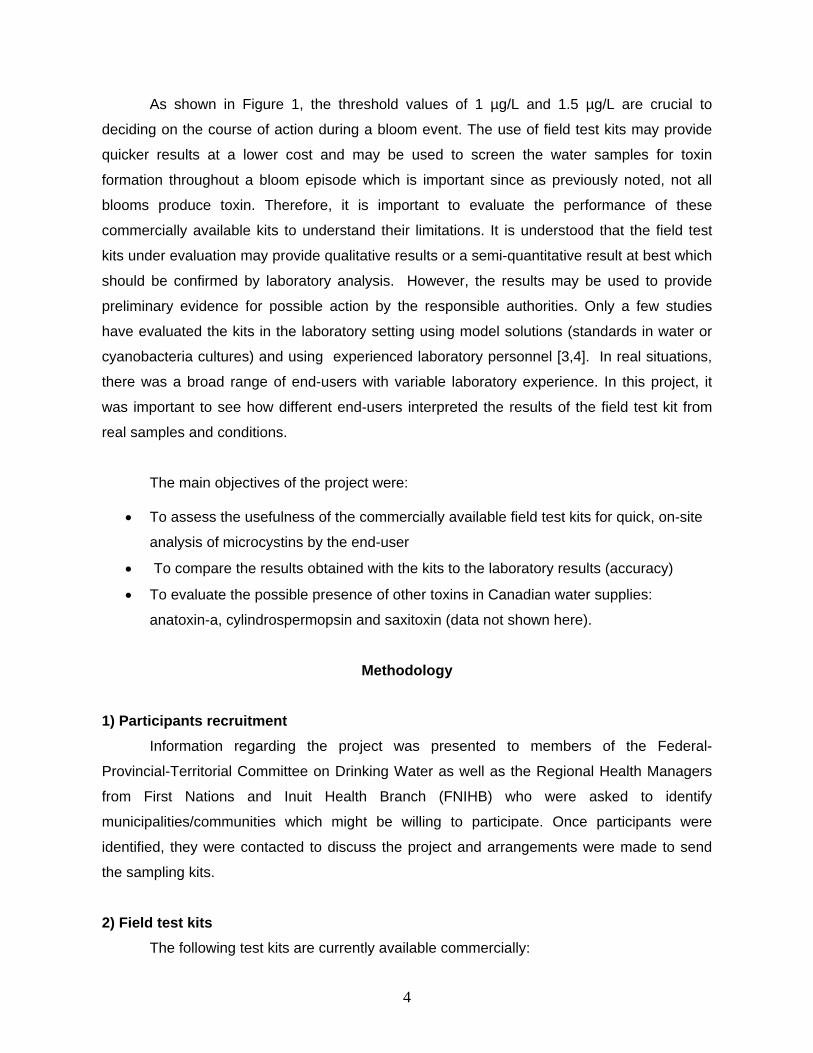
As shown in Figure 1, the threshold values of 1 µg/L and 1.5 µg/L are crucial to
deciding on the course of action during a bloom event. The use of field test kits may provide
quicker results at a lower cost and may be used to screen the water samples for toxin
formation throughout a bloom episode which is important since as previously noted, not all
blooms produce toxin. Therefore, it is important to evaluate the performance of these
commercially available kits to understand their limitations. It is understood that the field test
kits under evaluation may provide qualitative results or a semi-quantitative result at best which
should be confirmed by laboratory analysis. However, the results may be used to provide
preliminary evidence for possible action by the responsible authorities. Only a few studies
have evaluated the kits in the laboratory setting using model solutions (standards in water or
cyanobacteria cultures) and using experienced laboratory personnel [3,4]. In real situations,
there was a broad range of end-users with variable laboratory experience. In this project, it
was important to see how different end-users interpreted the results of the field test kit from
real samples and conditions.
The main objectives of the project were:
To assess the usefulness of the commercially available field test kits for quick, on-site
analysis of microcystins by the end-user
To compare the results obtained with the kits to the laboratory results (accuracy)
To evaluate the possible presence of other toxins in Canadian water supplies:
anatoxin-a, cylindrospermopsin and saxitoxin (data not shown here).
Methodology
1) Participants recruitment
Information regarding the project was presented to members of the Federal-
Provincial-Territorial Committee on Drinking Water as well as the Regional Health Managers
from First Nations and Inuit Health Branch (FNIHB) who were asked to identify
municipalities/communities which might be willing to participate. Once participants were
identified, they were contacted to discuss the project and arrangements were made to send
the sampling kits.
2) Field test kits
The following test kits are currently available commercially:

5
a) Abraxis LLC. This company offers two products for testing drinking water sources.
a.1) Immunochromatographic Strip Test for the Detection of Microcystins and
Nodularins in Source Drinking Water at 1 ppb (PN 520019) (herein named as strip
test) [5].
a.2) Microcystin Tube kit. (PN 520012) (herein named as Abraxis tube) [6].
b) Envirologix Qualitube Kit for Microcystin (#ET022) (herein named as Envirologix)
[7]. The test does not contain the lysing agent, therefore only detects free, not total,
toxin.,
c) Zeu-Inmunotec S.L. MicroCystest tube kit (ZE/CCT32) (herein named as Zeu) [8].
This kit is a protein phosphatase inhibition assay. The test does not contain the
lysing agent, therefore only detects free, not total, toxin. The manufacturer
provides a protocol to lyse the cell consisting of filtration, extraction and dilution
steps.
The Abraxis and Envirologix kits are based on the recognition of microcystins by
specific antibodies (immunoassay), therefore the results of these tests is the sum of all
microcystins that cross react with the antibodies. The Zeu-Inmunotec kit is based on the
inhibition of protein phosphatase 2A and the results represent the presence of all compounds
that inhibit the enzyme.
Table 1. List of field test kits available in the market
Manufacturer Format Principle Standards InterpretationTime of analysis
Abraxis LLC Strip Test Inmunochromatography
None (graph for 0.5 to 5 ppb)
Visual interpretation
~ 40 min
Abraxis LLC Tube ELISA 0.15, 0.4, 1.0, 2.0, 5 ppb
Visual or photometer
~ 50 min
Envirologix Tube ELISA 0.5 and 3 ppb Visual or photometer
~ 50 min
Zeu-Inmunotec S.L.
Tube Phosphatase inhibition 0.5, 1.0 and 2.5 Photometer (405nm)
~ 65 min

6
As the Canadian Drinking water guideline for microcystin-LR is based on the total
microcystin (dissolved/free and cell bound) a step to lyse the cyanobacterial cells is
necessary. Abraxis LLC manufactures a lysing product named QuikLyse™ [9] which can be
purchased individually and is part of the strip kit. In order to compare the results obtained by
all the kits and because all participants received the strip test kit containing the QuikLyse™,
each participant was asked to follow the methodology depicted in Figure 2. The amount of
sample obtained after using the reagents in the QuikLyse™ protocol was enough to perform
the strip test kit and one additional kit.
All the participants received the strip test kit plus an additional kit (either Abraxis Tube,
Envirologix or Zeu).
Figure 2. Flow chart of the procedure followed in the field.
3) Sample collection and use of the field test kits
Sampling kits and protocols were provided to participants in advance. Each sampling
kit (cooler) included: Abraxis strip test kit which included the lysing reagent, one of the other
field test kits, sampling bottles, questionnaires related to sample collection/site
identification/the treatment process, a field test kit data report form and an evaluation form on
the use of the kits.
Mix the bottle well and take a subsample (2 mL) and use the QuikLyse reagent found in the
Abraxis box
Sample raw and treated water in the bottles provided
Withdraw sample using the syringe, place the filter on the
syringe, push the syringe plunger, collect the filtrate in the
4 mL vial provided
Proceed to perform the two field test kits provided

7
Water samples were collected in duplicate. Participants were asked to take an aliquot
of one of the collection bottles and proceed with the flowchart as described in Figure 2.
End-users tested the samples using the field test kits according to the manufacturer’s
instructions and the results were recorded on the forms provided. In order to assist in the
interpretation of the results, a negative (deionized water) and positive control (1.5 µg/L
microcystin-LR) were also sent to each participant. The duplicate collection bottle(s) were
sent to the Exposure and Biomonitoring Division (EBD) laboratory in Health Canada for further
confirmation with instrument analysis (LC-MS/MS and ELISA).
4) Laboratory Analysis
Sample preparation
Samples were received in 120 mL sampling bottles within two days of collection. Upon
arrival to the EBD laboratory, samples were tested using a randomly selected field test kit
following the same protocol as shown in Figure 2. A small aliquot (~4 mL) was taken from
each bottle for analysis of saxitoxin and cylindrospermopsin.
Once the field test in the lab was completed, the contents of each bottle were filtered
with a 47 mm Whatman GF/C glass microfiber filter under vacuum. The volume of filtrate
(water) was recorded and the samples were stored at 4C until analysis. The filters were
wrapped with aluminum foil and stored at -20C until analysis.
The filters underwent three freeze-thawing cycles prior to extraction. They were
extracted with 75% methanol [10]. The extracts were evaporated, reconstituted with 50%
methanol and analysed as described below.
Analysis
The filtrates (water) were analyzed using Envirologix ELISA quantitative plate without further
concentration or clean up. The extracts obtained from the extraction of the filters were
analyzed following the protocol described below.
Calibration standard mixtures containing anatoxin-a and microcystin variants (MC-RR,
MC-LR, MC-LF, MC-LW, MC-LA and Mc-YR) were prepared by diluting secondary stock
solution (1ppm in 50% methanol /water) to construct a calibration curve with concentrations of
500 ppb, 100 ppb, 50 ppb, 10 ppb, 5 ppb, 1 ppb and 0.5 ppb.
Standards and extracts (10µL) were injected onto a Liquid Chromatograph (Thermo
Accela) coupled to a Mass Spectrometer (Thermo TSQ Quantum). The analytical column was

8
the Hypersil Gold 50mm x 2.1 mm, 1.9 µm from Thermo Scientific. The mobile phase was A:
H2O with 0.1% formic acid and 0.5% methanol; B: acetonitrile with 0.1% formic acid. Flow rate
was 0.2 mL/min. The gradient method started with 95%A and held for 1min. It changed to
70%A at 2min, then changed to 10% A at 4min and held at 10%A until 5min. Then it changed
back to 95%A at 5.2 min until 7 min for column equilibration. The switching valve switched
from detector to waste at 5.5 min of the run.
There were two segments with the duration time of 2.48 min and 4.52 min in the MS
method. For both segments the Q2 Gas Pressure was 1.5, scan width 0.01, scan time 0.1s
and peak width for both Q1 and Q3 were 0.7. Table 2 shows all microcystins included in the
analysis and their transitions.
Table 2. MS/MS transitions of anatoxin-a and microcystins
Name Parent m/z
Product m/z
CE Tube Lens
MC-RR 520.040 135.177 26 130
910.400 135.114 52 172 MC-LA
910.400 776.600 20 172
986.360 375.297 36 190 MC-LF
986.360 478.400 26 190
995.600 134.953 63 189 MC-LR
995.600 213.096 59 189
1025.390 288.151 42 169 MC-LW
1025.390 375.114 36 169
1045.460 134.973 61 199 MC-YR
1045.460 212.947 58 199
Quality Control

9
For each batch, one filter was spiked with 100 uL of 10 ppm working standard mixture
of anatoxin-a, MC-LR, MC-YR, MC-RR and MC-LA. Because of the limited amount of MC-LF
and MC-LW available, they were not included in this step. In addition, three blanks (filters free
of analyte placed in the extraction cell) were included in the batch to evaluate the potential for
carry-over in the ASE system during the run: pre-run blank, mid-run blank and post-run blank.
All controls were processed in the same way as the samples. During the LC-MS/MS run, the
calibration curve standards were run at the beginning and at the end of the batch to monitor
the deviation of the instrument system. QC low (1 ppb) and QC high (100 ppb) were injected
with every batch. All the samples in the batch were injected in triplicate.
Results
During this study, samples were collected in four provinces in Canada at 20 sites; the
description of the participants per province and the field test kit used are found in Table 3.
The samples were collected between July and October 2010 from surface water with a history
of cyanobacteria blooms. The water bodies selected were categorized as source drinking
water, drinking/recreational or recreational waters. In some of the source drinking water,
samples were collected at the intake of the water treatment plant (raw) and at the treatment
plant (treated). A total of 153 samples (including duplicates) were received.

10
Table 3. Description of the participants, test used and site type.
Site/Surface water
Use Sample type
Test used
P 1 End-user 1* Site 1/Lake Drinking/recreational Raw Strip Site 2/Lake Recreational Raw Strip Site 3/Reservoir Drinking/recreational Raw Strip End-User 2 Site 1/Lake Drinking/recreational Raw &
Treated Strip & Envirologix
Site 2/Lake Recreational Raw & Treated
Strip & Envirologix
Site 3/Reservoir Drinking/recreational Raw & Treated
Strip & Envirologix
Site 4/Lake Drinking Raw & Treated
Strip & Envirologix
Site 5/Lake Drinking Raw & Treated
Strip & Envirologix
P2 Site 1/Lake Drinking/recreational Raw & Treated
End-user 3 - Sampling 1 Envirologix End-user 4 - Sampling 2 Abraxis End-user 5 Strip End-user 4 - Sampling 3 Strip P3 End-user 6 Site 1/Lake Recreational Raw Strip & Abraxis 10 locations in
the lake
6 of them were sampled three times in the summer.
P4 End-user 7 Site 1/ Lake- (11 sampling/times)
Recreational Raw Strip
Site 3/Lake Recreational Raw Strip Site 4 /lake Drinking Raw &
Treated Strip
End-user 8 Site 1/lake Recreational Raw Strip Site 2/ Lake- (2
times) Recreational Raw Strip
Site 2 /lake Recreational Raw Strip Site 3/lake (8
times) Recreational Raw Strip
End-user 9 Site 1/river (3 times)
Drinking/recreational Raw Strip
Site 2/reservoir (7 times)
Drinking Raw Strip
Site 3 Lake (2 times)
Recreational Raw Strip
* Results from 2009
P2 received all the field test kits
P4 received strip and Zeu

11
Analysis of microcystins
Analysis of free microcystins was performed using the Envirologix Plate ELISA kit.
The kit provides the sum of all microcystins that cross react with the antibody. The detection
limit of the Envirologix plate is 0.147 ppb (provided by manufacturer). Water samples were
analyzed without further concentration because it was expected that in most cases, the
majority of microcystins would have been present inside the cyanobacteria cells (cell bound).
Figure 3 shows all microcystins included in the LC-MS/MS method: MC-LR, MC-RR,
MC-YR, MC-LA, MC-LW and MC-LF. It is important to remember that although more than 90
microcystin variants have been identified, including a number of MC-LR homologues, only six
of them are commercially available and are included in our LC-MS/MS method. From
previous studies, where all the extracts were analyzed by LC-MS/MS and ELISA, ELISA
results were generally higher as some samples contained additional microcystins that were
not accounted for in the LC-MS/MS method. In this study, the majority of the cyanobacteria
cell extracts were only analyzed by LC-MS/MS. Overall, MC-LR was detected in 95% of the
cyanobacteria cells and accounted for 10% to 100 % of total microcystin. In addition to MC-
LR some samples contained MC-RR and/or MC-LA. In few samples, the predominant variant
was MC-LA, accounting for almost 100% of total microcystin in the cyanobacterial cell.
Microcystins were not detected in 16% of the samples analyzed (neither in
cyanobacteria cells nor water). In samples with very low levels of microcystins, they were
detected in the cyanobacteria cells but not the sample filtrate (as free microcystin).
Approximately 68% of the samples contained total microcystins at a concentration below 1
ppb.

12
Figure 3. MRM chromatograms of the cyanotoxins (anatoxin-a and microcystins) analyzed in
this study (100 ppb).
Field test kits
In this study, three Canadian provinces and 2 First Nations regions participated in the
study. As part of the letter of agreement, on-site training on the use of all the kits was
provided to First Nations personnel only; attendees included drinking water treatment plant
operators, Circuit riders, Environmental Health Officers and managers. Because of travel and
budget restrictions, training could not be provided to the other participants.
Table 3 shows the description of which kits were used by the end-users.
The results of the field test kits will be discussed below and are compared with the
total amount of microcystins present in the sample sent to EBD corresponding to the bound
(amount of microcystins found in the extracts (LC-MS/MS)) plus free (the amount of
microcystins found in water (ELISA)). The field test results obtained by the EBD staff (2
chemists) are also included in the overall results.
RT: 0.00 - 7.01
0.0 0.5 1.0 1.5 2.0 2.5 3.0 3.5 4.0 4.5 5.0 5.5 6.0 6.5 7.0Time (min)
0
50
1000
50
1000
50
1000
50
100
Rela
tive A
bund
ance
0
50
1000
50
1000
50
100
RT: 0.00 - 7.01
0.0 0.5 1.0 1.5 2.0 2.5 3.0 3.5 4.0 4.5 5.0 5.5 6.0 6.5 7.0Time (min)
0
50
1000
50
1000
50
1000
50
100
Rela
tive A
bund
ance
0
50
1000
50
1000
50
RT: 0.00 - 7.01
0.0 0.5 1.0 1.5 2.0 2.5 3.0 3.5 4.0 4.5 5.0 5.5 6.0 6.5 7.0Time (min)
0
50
1000
50
1000
50
1000
50
100
Rela
tive A
bund
ance
0
50
1000
50
1000
50
100
RT: 1.12
RT: 4.06
RT: 4.25
RT: 4.28
RT: 4.71
RT: 4.94
RT: 5.01
NL: 1.55E6TIC F: + c ESI SRM ms2 165.940 [131.159-131.169]
NL: 8.60E4TIC F: + c ESI SRM ms2 520.040 [135.172-135.182]
NL: 9.20E4TIC F: + c ESI SRM ms2 1045.460 [134.968-134.978, 212.942-212.952] MS
NL: 7.74E4TIC F: + c ESI SRM ms2 995.600 [134.948-134.958, 213.091-213.101] MS
NL: 1.52E5TIC F: + c ESI SRM ms2 910.400 [135.109-135.119, 776.595-776.605] MS
NL: 1.02E5TIC F: + c ESI SRM ms2 1025.390 [288.146-288.156, 375.109-375.119] MS
NL: 6.30E4TIC F: + c ESI SRM ms2 986.360 [375.292-375.302, 478.395-478.405] MS
Anatoxin-a
MC-RR
MC-YR
MC-LR
MC-LA
MC-LF
MC-LW

13
Strip test kit
The Abraxis strip test kit is described by the manufacturer as “a rapid
immunochromatographic test, designed solely for the use in the qualitative screening of
Microcystins and nodularis in source water”. The strip kit does not include microcystin
standards, only a picture for comparison depicting the estimated concentration present based
on the colour of the test line. A control line on the strip test also develops and indicates the kit
is working. According to the manufacturer, a noticeable change in the test line will begin at
0.5 ppb and it will fade completely at 5 ppb. If the colour on the test line is similar to the
control line, microcystins are either not present or at a level not detected by the kit (i.e., <0.5
ppb). The test line colour will fade with increasing amounts of microcystin present in the
sample (no colour on the test line at >5ppb).
All the participants received the strip test kits. A total of 110 samples were tested by 10
end-users (EBD staff included). Eighty percent of the samples contained microcystin levels
below 5 ppb (range of the kit) and 20 % contained high levels of microcystins which were
beyond the working range of the kit (6-2000 ppb). Three respondents did not provide an
interpretation of the kit, only the description of the test line results/colour.
Figure 4 shows the overall results of the strip test kits and the corresponding result
obtained by in the EBD laboratory and Figure 5 shows the results with the X-axis
corresponding to the working range of the kit (0-5 ppb). The results were grouped according to
the results reported by the users: as 0 or less than 0.5 ppb (n=54); between 0.5-1 and ~1 ppb
(n=16); between 1 to 2.5 ppb (n=17), between 2.5 and 5 ppb (n=7) and finally higher than 5
ppb (n=13).
0
500
1000
1500
2000
Reported results (ppb)
To
tal M
C (
pp
b)
EB
D la
b
0 0.5 -1 ppb 2.5-5 ppb >5 ppb1-2.5 ppb
n=54 n=16
n=17 n=13
n=7
Figure 4. Overall results of the strip test kit compared to LC-MS/MS.

14
0
1
2
3
4
5
Reported results (ppb)
To
tal M
C (
pp
b)
EB
D L
ab
0 0.5 -1 ppb 2.5-5 ppb >5 ppb1-2.5 ppb
Canadian DW guideline
Figure 5. Results of the strip test kit compared to the LC-MS/MS. The Y axis only shows the
range of the strip test kit (0-5 ppb)
Table 4 summarizes the agreement between the strip test and the LC-MS/MS results.
The false negative rate is low as 11 % of the samples contained microcystins between 0.5 and
0.8 ppb. The false positive rate was high in all the ranges of the kit; results in the laboratory
showed that microcystins were not detected in 94% of samples where the end-users reported
levels between 0.5-1, 41% were below 1 ppb when end users reported between 1-2.5 ppb,
and MCs were not detected in 29% of the samples when end-users reported between 2.5-5
ppb. In all cases, the reported results would have triggered further testing. For samples
containing more than 5 ppb total microcystins, 84% of kit results were in agreement with
laboratory results.
Table 4. Agreement between the strip test kits reported result and the range of concentration
Results obtained in the laboratory 0 0.5-1 1-2.5 2.5-5 >5
0.00 89% 11% 0.5-1 94% 6% 1-2.5 41% 12% 47%
2.5-5 29% 71%
Str
ip t
est
resu
lts
(pp
b)
>5 8% 8% 84%

15
Each user was asked to fill out a questionnaire regarding the use of the kits. Seven
out of 9 users responded to the questionnaire. Those who used the kit more than once only
responded once. The responses are summarized in Table 5.
Table 5. Users’ responses to the use of the strip test kit
Very
easy/fast
Somewhat
easy/fast
Difficult/
slow
Very difficult/
slow
The instructions were___ to follow 6 1
The kit was___ to use 4 2 1
The results were ___ to interpret 1 2 4
The time to get the result was__ 5 2
These results suggest that
1) The percentage of false negative is very low 11% (reported 0 when there is more than
0). However, microcystin levels in the samples were below 0.8 ppb.
2) Interpretation of the results is challenging in the lower level of the kit (0-1 ppb); all the
samples reported to have microcystin levels ~1ppb, had microcystin less than 0.5 ppb.
However, at these levels, the concentration of microcystins is not of concern and the
course of action would still have been to continue monitoring the water intake.
3) At levels between 1-2.5 ppb (when action is required), the interpretation is also
challenging. However, according to the results reported by the users, the course of
action would be to send the samples to the laboratory for confirmation and to test the
treated water, which still protects the public.
4) At levels above 2.5 ppb, interpretation varies, however a “presence” interpretation can
be given with certain confidence resulting in further monitoring.
5) The result of the kits is very obvious when the amount of microcystins is above the 5
ppb upper limit of the kit.
6) The strip kits are useful when microcystins are in the range where decisions should be
made.
7) As specified by the manufacturer, the test provides preliminary qualitative results, and
another quantitative analytical method should be utilized to confirm the results.

16
Envirologix
The Envirologix QualiTube kit is an enzyme immuno-sorbent assay without a lysing
agent designed for semiquantitative field screening. Similar to the Envirologix ELISA
quantiplate, the results represent all the microcystins that can cross react with the antibody
used. Aliquots from the filtrate obtained using the QuikLyseTM reagent found in the Abraxis
box (Figure 2) were used to perform the test as per manufacturer’s instructions. In this kit, two
standards are included (0.5 and 3 ppb) and the interpretation is done by comparing the colour
of the samples to the two standards either visually or with the aid of a spectrophotometer.
Three interpretations are possible: less than 0.5 ppb MC, between 0.5 and 3.0 ppb, and more
than 3 ppb microcystin. According to the manufacturer, the limit of detection of the kit is 0.3
ppb, although it was calculated with the aid of a spectrometer. Therefore, it is expected that
this limit may not be visually achievable in the field.
During this study, the Envirologix QualiTube was used to test a total of 50 samples by
4 end-users (including EBD staff). In all cases, a photometer was not used and all the results
were interpreteted by visual comparison of the samples with the standards.
Figure 6 shows the results as reported by the participants and the results obtained in
the EBD laboratory. Ranges are divided according to the possible interpretation and the
standards included in the kit described above.
0
100
200
300
400
500
Reported results (ppb)
To
tal M
C (
pp
b)
EB
D L
ab
<0.5 0.5-3 >3
n=29
n=13
n=8
Figure 6. Overall results of the Envirologix kit compared to LC-MS/MS.

17
0
1
2
3
4
Reported results (ppb)
To
tal M
C (
pp
b)
EB
D L
ab
<0.5 0.5-3 >3
n=29
n=13
n=8
Figure 7. Results of the Envirologix kit compared to the results obtained in the laboratory. The
Y axis only shows the range of kit (0-3 ppb)
Only 3 % of the samples were reported as less than or equal to 0.5 ppb when the
laboratory results showed total microcystin of 1 ppb which suggests a very low false negative
rate. Whereas end-users reported concentrations between 0.5-3 ppb in 69% of the samples
when laboratory results indicated these samples actually contained less than 0.5 pbb or no
microcystin (false positive rate). End-users accurately reported levels in 31% of the samples.
All the samples containing microcystins above the range of the kit were reported as >3 ppb.
Below are the replies to the questionnaire from 2 of 3 users who used the Envirologix
kit.
Table 6. Users’ responses to the use of the Envirologix kit
Very
easy/fast
Somewhat
easy/fast
Difficult
slow
Very
difficult/slow
The instruction were___ to follow 2
The kit was___ to use 2
The results were ___ to interpret 1 1
The time to get the result was__ 2

18
The limited results suggest (visual comparison only)
1) The use of QuikLyse™ reagents does not appear to interfere with the Envirologix test
kits.
2) The false negative rate is very low. Samples that contain microcystin levels less than
0.5 ppb were verified by LC-MS/MS to contain less than 0.5 ppb.
3) In the range between 0.5 and 3 ppb, the visual comparison between the sample and
the standards is not clear, resulting in a false positive rate of 69%. However, the
interpretation is still protecting the public as, given this result, additional samples would
have been sent to an accredited laboratory for confirmation and treated water would
have been tested.
4) At concentrations above the upper limit of the kit (3 ppb) the interpretation is accurate.
5) Comparison of the results of the samples with the standards contained in the
Envirologix kit allows better interpretation of the result, but this is limited if solely using
visual comparison.
Abraxis tube
Similar to Envirologix ELISA kits, the Abraxis tube kit uses polyclonal antibodies that
bind to all microcystins that cross react with the antibody. This kit contains a wider range of
standards: 0.15, 0.4, 1.0, 2.0, and 5 ppb. Interpretation was done with the aid of a
spectrophotometer or tube reader at 450 nm as described by the manufacturer. Once the
optical density (OD) is obtained, the results are calculated by plotting %Bo against the
standards (semi-exponential plot).
Two participants used this kit. One used it on three on occasions for a total of 22
samples tested. The other participant used it only once and according to the reported results,
the results were not considered (the OD reported for the standards and samples were similar).
Following the procedure described in Figure 2, an aliquot was taken after using the
QuikLyseTM reagent found in the Abraxis box and the Abraxis tube test was performed
according to the manufacturer’s instructions. In most of the cases, the OD values were
reported in the field and calculations were done using Excel in the EBD laboratory.
Depicted in Figure 8 are the results reported using the Abraxis tube and the results
obtained in the laboratory. By LC-MS/MS all samples had concentrations of microcystin

19
below 1ppb. The Abraxis tube agreed with the laboratory results for all but three samples. One
sample was reported to contain 3.2 ppb of microcystin using the Abraxis tube kit, but
laboratory results showed that it was below 1 ppb. For the second sample the field test kit
showed total microcystin as 0.3 ppb as opposed to the laboratory result of 0.7 ppb and the
third sample was reported to have 0.9 ppb with the field test kit while the laboratory result
showed 0.1 ppb.
y = 0.2169x + 0.0813
R2 = 0.5659
0.0
0.5
1.0
1.5
2.0
2.5
3.0
0 0.5 1 1.5 2 2.5 3 3.5
Results reported (ppb)
To
tal
MC
(u
g/L
) E
BD
lab
Figure 8. Comparison of the results obtained by LC-MS/MS and the results reported using the Abraxis Tube kit.
Table 7. Users’ responses related to the use of the Abraxis kit
Very
easy/fast
Somewhat
easy/fast
Difficult/
slow
Very
difficult/slow
The instruction were___ to follow 2
The kit was___ to use 2
The results were ___ to interpret 1 1
The time to get the result was__ fast Fast
2
slow Very slow
Zeu-Inmunotec S.L.
The MicroCystest tube kit is described as a “test for the detection of microcystins and
nodularins in water. A simple and rapid method that allows end-users to determine whether
the toxin concentration is over the maximum allowed levels (1 µg/L)”.

20
The test is based on phosphatase activity inhibition. Under normal conditions the
phosphatase is able to hydrolyze a specific substrate that can be detected at 505 nm.
Samples containing microcystins will inhibit the enzyme activity proportionally to the amount of
toxin contained in the sample. The kit contains 3 standards at 0.5, 1 and 2.5 µg/L and the
protocol is simple although it requires an incubation period at 37C as well as the use of a
spectrometer with a 405 nm filter. The absorbance of standards and samples are recorded in
duplicate and absorbance of the sample can be compared with the standards. The
manufacturer also provides an Excel worksheet to aid in the calculation.
The kit was sent to one participant. However, during the course of the study it was
found that the QuikLyse™ lysing reagent interfered with the assay. The interferences were
not resolved on time and additional testing of the kit was not possible. Further testing is
required to compare the results of this kit with laboratory methods.
Conclusions
In general, commercially available field test kits appear to be a simple and inexpensive
way to screen water samples, both raw and treated, for the presence of microcystin toxins.
However, it is important that the end-user understands the scope of each kit; free toxin vs.
bound, qualitative vs. semiquantitative, concentration range of the various kits, concentration
at which a response is observable and more importantly the interpretation of the kit.
All of the kits are able to detect free microcystins; total microcystins can be detected by
adding a lysing agent (QuikLyse™), although the effect of the reagent with kits produced by
other manufacturers must be evaluated. Semi-quantitative results can only be obtained when
MC-LR standards are used and samples compared to those standards.
The concentration ranges for the majority of the kits are relevant for use in surface
drinking water (0-5 or 0-3 ppb). For recreational uses the Abraxis strip test kit can be used (0-
10 ppb) however, samples above the range of the kit must be diluted as the guideline is 20
µg/L.
Interpretation of results will be fundamental during decision making processes in
drinking water monitoring policies. Overall the kits can provide presence/absence response
with a certain confidence. In cases where false positives are observed, the interpretation still
protects the public as the results trigger additional testing/monitoring in an accredited
laboratory.

21
Acknowledgements
This project was funded by First Nations and Inuit Health Branch through a LOA with Environmental Health Research Division (FNIHB) and Environmental Health Science Research Bureau (HECS).
We would like to thank the following participants for collaborating in this project:
Sam Ferris and Enisa Zanacic from Saskatchewan Minister of Environment Simon Sihota, Jon Elliot, FNIHB-Alberta Region. Loyd Alexis, Ed Alexis and George Johnson from Alexis treatment plant. Isabelle Dorion, Patrick Chevrette, Maud Bélisle, Marc Sinotte and Anouka Bolduc, Direction des politiques de l'eau, Ministère du Développement durable, de l'Environnement et des Parcs du Québec Linda Pillsworth, FNIHB-BC region. Satish Deshpande, Albert Simhon from Ontario Minister of Environment and Nicole Irvine from Quinte Conservation Jeromy Harvie and Ashley Cabecinha for assisting in the analysis.
References
1. Cyanobacterial Toxins- Microcystin-LR. Guidelines for Canadian Drinking Water Quality:
Supporting Documentation, October 1999 ().
2. Guidelines for Canadian Recreational Water Quality, 3rd Edition - document for public
comment, 2009, Health Canada
3 Lawton L.A., Chambers H., Edwards C. Nwaopara A.A., Healy M. Rapid detection of
microcystins in cells and water. Toxicon (210) 55, 973-978.
4 http://www.epa.gov/etv/pubs/600r10158/600r10158_Stripvs.pdf
5 http://www.abraxiskits.com/uploads/products/docfiles/39_PN520016USER.pdf (accessed
May 18, 2011)
6 http://www.abraxiskits.com/uploads/products/docfiles/24_PN520012USER.pdf (accessed
May 18, 2011)
7 http://www.envirologix.com/artman/publish/article_67.shtml
8 http://www.zeulab.com/
9 http://www.abraxiskits.com/uploads/products/docfiles/34_PN529911USER.pdf
10 Aranda-Rodriguez R., Tillmanns A., Benoit F.M., Pick F.P., Harvie J. and Solenaia L. Pressurized liquid extraction of toxins from cyanobacterial cells. Environmental Toxicology (2005) 20, 390-396.