assessment of ecological effects – freshwater …assessment of ecological effects – freshwater...
TRANSCRIPT
Assessment of Ecological Effects – Freshwater Ecology December 2017
River Lake Limited
Technical Report 7b

Assessment of Ecological Effects – Freshwater Ecology | Technical Report 7b
Quality Assurance Statement
Prepared by: Keith Hamill River Lake Limited
Reviewed by: Brett Ogilvie Tonkin & Taylor Limited
Approved for release: Duncan Kenderdine Mt Messenger Alliance
Revision schedule
Rev. Number Date Description
0 December 2017 Final for lodgement
ISBN: 978-1-98-851272-3
Disclaimer
This report has been prepared by the Mt Messenger Alliance for the benefit of the NZ Transport Agency. No liability is accepted by the Alliance Partners or any employee of or sub-consultant to the Alliance Partners companies with respect to its use by any other person. This disclaimer shall apply notwithstanding that the report may be made available to other persons for an application for permission or approval or to fulfil a legal requirement.

Assessment of Ecological Effects – Freshwater Ecology | Technical Report 7b
Contents 1 Introduction 1
1.1 Background 1
1.2 Project description 1
2 Method 3
2.1 Introduction 3
2.2 Sample locations 3
2.3 Timing of survey work 8
2.4 Habitat measurement 10
2.5 Fish surveys 10
2.5.1 Fish Index of Biological Integrity (Fish IBI) 10
2.6 Aquatic macroinvertebrates 11
2.7 Stream Ecological Valuation (SEV) 12
2.7.1 Environmental Compensation Ratio (ECR) 13
2.8 Assessment of effects scoring method 15
2.8.1 Step 1: Assess ecological values 16
2.8.2 Step 2: Assess magnitude of effect 16
2.8.3 Step 3: Level of effects assessment 17
3 Existing environment / survey results 19
3.1 Overview of existing environment 19
3.1.1 Mangapepeke Stream 19
3.1.2 Mimi River 20
3.2 Habitat 20
3.3 Fish 23
3.4 Aquatic macroinvertebrates 28
3.5 Stream Ecological Valuation (SEV) 29
4 Assessment of effects on freshwater ecology 32
4.1 Overview of effects 32
4.2 Short term construction effects 35
4.2.1 Direct effects on fish and Fish Recovery Protocols 35

Assessment of Ecological Effects – Freshwater Ecology | Technical Report 7b
4.2.2 Potential sedimentation from earthworks and construction 36
4.2.3 Potential water quality effects from vegetation clearance 40
4.2.4 Potential water quality effects from concrete 41
4.2.5 Short term fish passage 41
4.2.6 Short term loss of stream habitat 42
4.2.7 Water takes for dust suppression 43
4.3 Long term / permanent effects 44
4.3.1 Fish passage 44
4.3.2 Loss of stream habitat and functions 50
4.3.3 Potential effects of stormwater runoff 51
4.4 Mitigation and monitoring 53
4.4.1 Summary of mitigation 53
4.4.2 Biodiversity Offset 54
4.4.3 Further investigations 55
5 Conclusions 57
6 References 58
Appendix A: National rapid habitat assessment protocol 62
Appendix B: Macroinvertebrate results 63
Appendix C: SEV calculations 65
Appendix D: Site Photos 68
Assessment of Ecological Effects – Freshwater Ecology | Technical Report 7b
Glossary
Term Meaning
AEE Assessment of Effects on the Environment Report
AWA Additional (Ancillary) works area
DOC Department of Conservation
DOC Assessment Guidelines
DOC’s Guidelines for Assessing Ecological Values, developed by Davis et al. in 2016
DTM Digital Terrain Model
Eastern Ngāti Tama forest block
The area of land largely owned by Ngāti Tama located east of existing SH3, including the Project footprint, approximately 3,098ha in size
EcIA guidelines Ecological Impact Assessment guidelines
ECR Environmental Compensation Ratio
EIANZ Environment Institute of Australia and New Zealand
ELMP Ecology and Landscape Management Plan
EPT Ephemeroptera-Plecoptera-Trichoptera taxa
MCI Macroinvertebrate Community Index
North Taranaki Ecological District
Part of the Taranaki Ecological Region, encompasses approximately 259,750 ha, including the Project footprint
NZFFD New Zealand Freshwater Fish Database
Parininihi The area spanning the Waipingao Stream catchment located to the west of existing SH3, approximately 1,332ha in size
Pest Management Area
Area of land proposed to be actively managed for pests, across a number of parcels of land
Project The Mt Messenger Bypass project

Assessment of Ecological Effects – Freshwater Ecology | Technical Report 7b
Term Meaning
Project footprint The Project footprint includes the road footprint (i.e. the road and its anticipated batters and cuts, spoil disposal sites, haul roads and stormwater ponds), and includes the Additional Works Area (AWA) and 5m edge effects parcel.
QMCI Quantitative Macroinvertebrate Community Index
RMA Resource Management Act 1991
RTC Residual trap catch
SEV Stream Ecological Valuation
SH3 State Highway 3
Transport Agency New Zealand Transport Agency
TRC Taranaki Regional Council
Wider Project area An area approximately 4,430ha in size which encompasses Parininihi and the Ngāti Tama Eastern forest block, and includes the Project footprint.
Assessment of Ecological Effects – Freshwater Ecology | Technical Report 7b
Executive Summary The NZ Transport Agency is to develop a new section of SH3, north of New Plymouth, to bypass the existing steep, narrow and winding section of highway at Mt Messenger. The Project comprises a new section of two lane highway, some 6km in length, located to the east of the existing SH3 alignment.
The overarching ecological aim for the project is to ensure no net loss of biodiversity values, or to achieve a net benefit of biodiversity values, within the short- to medium-term.
This report assesses the effects of construction and operation of the Project on the aquatic ecology of streams. The Project traverses two river catchments; the Mangapepeke Stream, which flows north to the Tongaporutu River, and the Mimi River, which flows south.
Field surveys were undertaken in early June and August 2017. These surveys visited all affected sites where access was possible. Detailed survey methods were undertaken at representative sites; this included a habitat survey at 15 sites, Stream Ecological Valuation survey at 11 sites, collection of aquatic macroinvertebrate samples at the same 11 sites and fish surveys at six sites.
The Mt Messenger area consists of high quality habitat for indigenous terrestrial and aquatic flora and fauna. The geology is dominated by papa mudstone; this has a considerable influence on stream substrate and sediment. Both catchments are predominantly covered in indigenous forest but the valleys through which the streams meander is mainly pasture and grazed wetland. The aquatic macroinvertebrate community indicated ‘excellent’ water quality/habitat near the headwaters. In the Mangapepeke Stream MCI scores reduced downstream to values indicative of ‘fair’ to ‘good’ conditions, but in the main stem of the Mimi River the scores remained high.
Both streams had a high diversity of fish, with Fish IBI scores indicating ‘excellent’ diversity in lowland sections and ‘good’ diversity in steeper sections. Fish caught included: inanga, longfin eel, giant kōkopu, banded kōkopu, redfin bully, common bully, kōura and kākahi.
The potential effects of the Project on streams include short term effects related to the construction phase and long term effects that continue well after the construction phase. Potential short term effects include sedimentation, direct removal of fish from the stream, short-term loss of fish passage in some areas and short-term loss of stream habitat from temporary culverts. Potential long-term effects include reduced fish passage, loss of stream ecological functions and habitat, and potential effects of road stormwater on stream hydrology and water quality.
The potential effects on streams during the construction period can be minimised and mitigated by implementing good practice with respect to erosion and sediment control, fish recovery, vegetation clearance, water takes and undertaking monitoring during the construction period. Similarly, many of the long-term effects from the road footprint can be minimised and mitigated by good culvert design to ensure fish passage, stormwater management, and design of stream diversions.

Assessment of Ecological Effects – Freshwater Ecology | Technical Report 7b
Nevertheless, the piping and diversion of streams required by the Project will affect 3,470m of stream and cause, after mitigation, considerable loss of stream values; this residual effect will be addressed by implementing offset compensation.
The Stream Ecological Valuation (SEV) method was used calculate the amount of offset required for the loss of stream habitat. To achieve ‘no net loss’ restoration work will be required along 8,724m2 of stream habitat.
Overall, the effects of the Project on freshwater ecology can be appropriately managed and mitigated, and the residual loss of habitat can be adequately offset to result in ‘no net loss’ of stream values

Assessment of Ecological Effects – Freshwater Ecology | Technical Report 7b Page 1
1 Introduction 1.1 Background This report forms part of a suite of technical reports prepared for the NZ Transport Agency's Mt Messenger bypass Project (the Project). Its purpose is to inform the Assessment of Effects on the Environment Report (AEE) and to support the resource consent applications and a Notices of Requirement to alter the existing State Highway designation, which are required to enable the Project to proceed.
This report assesses the effects of construction and operation of the Project on aquatic ecology. The purpose of this report is to:
a Identify and describe the existing freshwater environment and ecology; b Describe the potential effects on freshwater ecology arising from construction and
operation of the Project; c Recommend measures as appropriate to avoid or mitigate potential effects on
freshwater ecology (eg management plans); and d Present an overall conclusion of the level of potential effects of the Project on
freshwater ecology after recommended measures are implemented.
1.2 Project description The Project involves the construction and ongoing operation of a new section of State Highway 3 (SH3), generally between Uruti and Ahititi to the north of New Plymouth. This new section of SH3 will bypass the existing steep, narrow and winding section of highway at Mt Messenger. The Project comprises a new section of two lane highway, approximately 6 km in length, located to the east of the existing SH3 alignment.
The Project is intended to enhance the safety, resilience and journey time reliability of travel on SH3 and contribute to enhanced local and regional economic growth and productivity for people and freight.
A full description of the Project including its design, construction and operation is provided in the Assessment of Effects on the Environment Report, contained in Volume 1: AEE, and is shown on the Drawings in Volume 2: Drawing Set.
The overarching ecological aim for the project is to ensure no net loss of biodiversity values, or to achieve a net benefit of biodiversity values, within the short- to medium-term.
The Project design includes many features to avoid, mitigate and offset effects on the environment. At a high level, this includes bridging some areas of high value swamp forest, choosing alignments that minimise impacts on the valley floor, and choosing a route that avoids impacts on the near pristine Waipingao Valley (west of the current SH3) and minimises risks to the Parininihi Marine Reserve.
Some other design options were reject because of practical constraints and the need to minimise multiple effects. For example, multi-barrel piped culverts are used at site Ea10

Assessment of Ecological Effects – Freshwater Ecology | Technical Report 7b Page 2
rather than an arch culvert because the height of the road does not allow sufficient fill to cover an arch culvert, and lifting the road at this point would increase its footprint.

Assessment of Ecological Effects – Freshwater Ecology | Technical Report 7b Page 3
2 Method 2.1 Introduction A desktop assessment was undertaken to review available information and data relating to the freshwater ecology of the Project footprint and the surrounding area. This included:
• Review of NZ Freshwater Fish Database (NZFFD); • Discussions with Department of Conservation (DoC) about unpublished biological
data; and • Discussions with Taranaki Regional Council regarding water quality or biological data.
In addition to the desktop assessment, field surveys of waterways impacted by the Project were undertaken in early June 2017 and early August 2017.
Previous field surveys were also carried out in February 2017 to the west of the existing SH3, to assess the effects of different route options (e.g. MC23) (Hamill 2017). The survey used the same field method as those in June and August 2017. The streams surveyed in February will not be affected by the Project but the survey nonetheless provides useful contextual information on streams in the wider area, some of which may be suitable for restoration as part of the Project’s offset package (described in further detail in the Assessment of Ecological Effect – Ecological Mitigation and Offset (Technical Report 7h, Volume 3 of the AEE).
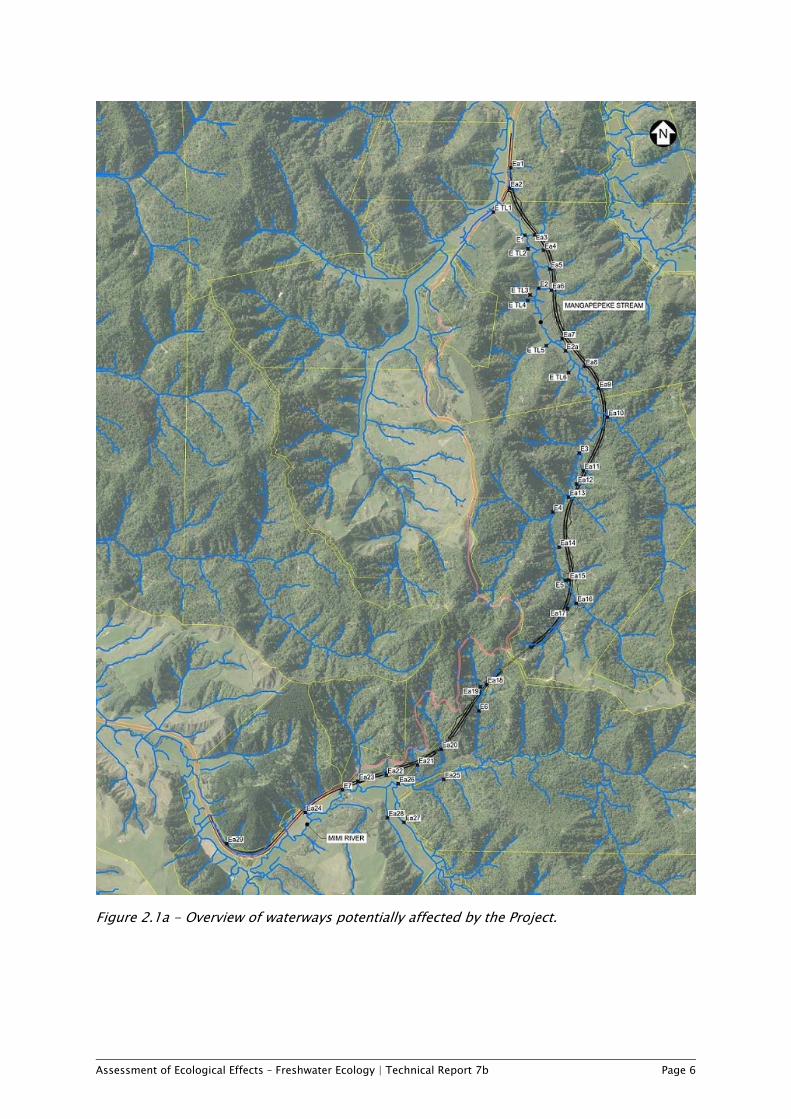
2.2 Sample locations The proposed route is located to the east of the existing SH3 and traverses two river catchments. On the north side of Mt Messenger, the waterways drain to the Mangapepeke Stream, itself a tributary to the Mangaongaonga Stream and the Tongaporutu River which enters the coast at Tongaporutu. On the south side of Mt Messenger, the waterways drain to the Mimi River, which flows south-west to enter the coast between Waiiti and Urenui (Figure 2.1).
All waterways potentially affected by the alignment were identified using aerial photographs and a 3D Digital Terrain Model of the rivers. All sites were visited and measurements made except for some tributaries entering the lower Mangapepeke Stream where access was not granted by the land owner (ie sites Ea3, Ea4, Ea5, Ea6, Ea7, Ea8 and Ea9). In some cases, the rugged terrain and waterfalls restricted access to stream sections downstream of the actual alignment (ie site Ea14 and Ea15).
A habitat survey was undertaken at 15 sites, and Stream Ecological Valuation (SEV) method was applied at 11 sites, aquatic macroinvertebrate samples collected at the same 11 sites and a fish survey was done at six sites (see Table 2.1). The SEV surveys occurred at representative sites with a partial bias towards larger waterways. Where a full SEV survey was not undertaken a SEV score was assigned based on the results from other sites with similar stream habitat.

Assessment of Ecological Effects – Freshwater Ecology | Technical Report 7b Page 4
Some of the sites surveyed were downstream of the actual alignment but potentially affected by sedimentation (eg site Ea25 in the kahikatea (Dacrycarpus dacrydioides) swamp forest); other sites surveyed were on sections of stream with potential for restoration as part of a compensation package (eg sites Ea26, Ea27 and Ea28 in the Mimi catchment, sites E2 and E4 in the Mangapepeke catchment). There are many potential stream sections that could be restored as part of an offset compensation package, but the necessary property access rights would need to be obtained. 1
The location of sites surveyed along the proposed route are shown in Figure 3.1a to 3.1c and described in Table 2.1.
1 In this report the term ‘offset compensation’ is used interchangeably with the term ‘biodiversity offset’. The term ‘compensation’ is included to reflect the language used in the SEV method.

Assessment of Ecological Effects – Freshwater Ecology | Technical Report 7b Page 5
Table 2.1- Location of waterways potentially affected by the Project (culverts, swales, stream diversion) and stream surveys. Sorted north to south. Shaded sites were not visited.
Note: Survey method: SEV = SEV + macroinvertebrate samples, H = habitat assessment, F = fish survey.
Assessment of Ecological Effects – Freshwater Ecology | Technical Report 7b Page 6
Figure 2.1a - Overview of waterways potentially affected by the Project.

Assessment of Ecological Effects – Freshwater Ecology | Technical Report 7b Page 7
Figure 2.1b - Location of waterways potentially affected by the Project and stream surveys in Mangapepeke Stream catchment.
Assessment of Ecological Effects – Freshwater Ecology | Technical Report 7b Page 8
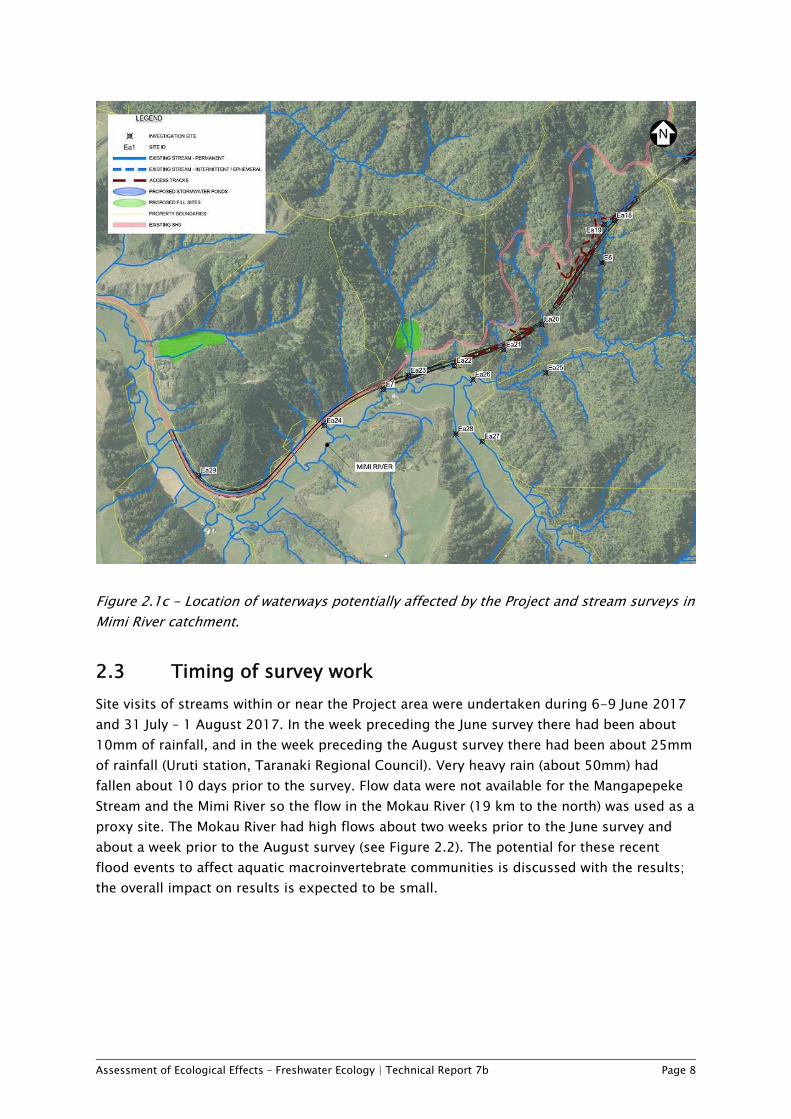
Figure 2.1c - Location of waterways potentially affected by the Project and stream surveys in Mimi River catchment.
2.3 Timing of survey work Site visits of streams within or near the Project area were undertaken during 6-9 June 2017 and 31 July – 1 August 2017. In the week preceding the June survey there had been about 10mm of rainfall, and in the week preceding the August survey there had been about 25mm of rainfall (Uruti station, Taranaki Regional Council). Very heavy rain (about 50mm) had fallen about 10 days prior to the survey. Flow data were not available for the Mangapepeke Stream and the Mimi River so the flow in the Mokau River (19 km to the north) was used as a proxy site. The Mokau River had high flows about two weeks prior to the June survey and about a week prior to the August survey (see Figure 2.2). The potential for these recent flood events to affect aquatic macroinvertebrate communities is discussed with the results; the overall impact on results is expected to be small.

Assessment of Ecological Effects – Freshwater Ecology | Technical Report 7b Page 9
Figure 2.2 - Flow in the Mokau River prior to the surveys in June and August (source Waikato Regional Council)

Assessment of Ecological Effects – Freshwater Ecology | Technical Report 7b Page 10
2.4 Habitat measurement At all sites measurements were made of stream width, water depth (mid-channel), water velocity, macrophyte cover and riparian vegetation type. The habitat was assessed and scored using the national rapid habitat assessment protocol (Clapcott 2015) (Appendix 1). Other habitat variables were assessed as part of the SEV method.
2.5 Fish surveys Fish abundance and diversity were surveyed at six sites along the route. The electro-fishing method was used at three sites (E4, E5, and E6); these sites were suitable for electro-fishing because they were relatively shallow and the substrate relatively firm. Fyke nets and/or traps were used at three sites in the lower section of the Mangapepeke Stream (Site E1) and the Mimi River (Sites E7 and Ea25), where the streams were sufficiently large and deep (Figure 2.1).
The electro-fishing used a Kainga BMP300 electrofishing machine with a pulse rate of 50 pps and pulse width of 2.5ms. At each site about 150m of stream length was electro-fished following the protocols described in Joy et al. (2013). The survey reach was fished from downstream to upstream in 5 to 10 sub-sections; within which about 3m lengths were fished from upstream to downstream towards a pole-netter. Captured fish were stored in a container for identification and measurement after each sub-reach was fished. Any kōura or shrimp caught in the fish survey were also recorded. Fish and kōura (Paranephrops planifrons) were released back into the stream after counting and measurement.
The netting of site E1 and E7 (undertaken in June) used six fine mesh fyke nets were set over night at each site. The traps were baited with cheese. The fyke net design followed the recommendations in Joy et al. (2013). They were fine mesh (mesh size ca. 4mm) with net dimensions of: six hoops, with 60cm wide front D-mouth, and 3m long trap and 5m long leader. Each net had an exclusion barrier to prevent large fish entering the final chamber.
Site Ea25 is a tributary of the Mimi Stream within the Kahikatea swamp forest (sampled in early August). The stream was too deep (about 1m) to electric fish and the pools were too small or narrow to use the standard fine-mesh fyke nets. At this site, smaller fyke nets were used in addition to fine mesh Gee-minnow traps. The fyke nets had a mesh size of about 12mm with dimensions of: 5 hoops, with a 40cm wide front mouth, a 2.4m long trap and a 2.5m long leader.
Likely fish species present in the streams were also assessed by using the results of previous survey (eg Hamill 2017) and searching in the NZ Freshwater Fish database.
2.5.1 Fish Index of Biological Integrity (Fish IBI) The results of the fish survey were used to calculate an Index of Biological Integrity (IBI) using the approach and tools in Joy (2007). The Fish IBI compares the presence and absence of fish found in a particularly stream with what is expected in the stream based on the site’s elevation and distance from the coast. The Fish IBI was used in calculating the Stream Ecological Valuation (SEV).

Assessment of Ecological Effects – Freshwater Ecology | Technical Report 7b Page 11
2.6 Aquatic macroinvertebrates The use of macroinvertebrates for assessing the condition of streams is widespread in New Zealand and overseas. The structure and composition of macroinvertebrate communities is a good indicator of stream condition as they are found in almost all freshwater environments, are relatively easy to sample and identify, and different taxa show varying degrees of sensitivity to pollution.
A single macroinvertebrates sample was collected at all sites where the SEV was being calculated. These were sites E2, E3, E4, E5, E10, E13 in the Mangapepeke Stream catchment and sites E6, E7, E25, E26, E27 and E28 in the Mimi River catchment (Figure 2.1).
Aquatic macroinvertebrate samples were collected using a kick net (D-shape, 0.5mm mesh size). At most sites sampling followed the semi-quantitative method for soft bottomed streams – Protocol C2 of Stark et al. (2001). Stable habitat features (eg bank margin, woody debris, macrophyte and gravel substrate) were sampled according to their occurrence in the reach. At sites E5 and E6 the substrate allowed the semi-quantitative method for hard-bottomed streams to be used (Protocol C1 of Stark et al. 2001) with woody debris also sampled when it was encountered.
Macroinvertebrate samples were preserved in alcohol and processed using Protocol P2 (200 fixed count and scan for rare taxa) of the Protocols for sampling macroinvertebrates in wadeable streams (Stark et al. 2001).
The following ecological indices were calculated to assess the biological health of the river:
• Taxa Richness. This is a measure of the types of invertebrate taxa present in each sample.
• EPT richness and EPT abundance (Ephemeroptera-Plecoptera-Trichoptera). This measures the number of pollution sensitive mayfly, stonefly and caddisfly (EPT) taxa in a sample (excluding Oxyethira and Paroxyethira) and is an indicator of long-term water quality.
• Macroinvertebrate Community Index (MCI). The MCI is an index for assessing the water quality and ‘health’ of a stream using the presence/absence of macroinvertebrates (Stark 1985).
• Quantitative MCI (QMCI). The QMCI is similar to the MCI but is based on the relative abundance of taxa within a community (Stark 1993, Stark 1998).
The MCI and QMCI reflect the sensitivity of the macroinvertebrate community to pollution and habitat change, with higher scores indicating higher water quality. Generally accepted water quality classes for different MCI and QMCI scores and the soft-bottomed variations (MCI-sb and QMCI-sb) are shown in Table 2.2.

Assessment of Ecological Effects – Freshwater Ecology | Technical Report 7b Page 12
Table 2.2- Suggested quality thresholds for interpretation of the MCI and QMCI from Stark (1998)
2.7 Stream Ecological Valuation (SEV) The Stream Ecological Valuation (SEV) method was used to assess the ecological value of streams at 11 sites along the proposed Route using the method described in Storey et al. (2011), Neale et al. (2011) and Neale et al. (2016).
Streams and waterways provide a number of ecological functions. The SEV is a standard method for assessing stream values and quantifying loss and any requirements for offset compensation. It classifies stream functions as:
• Hydraulic functions (ie processes associated with water storage, conveyance, flood flow retention and sediment transport);
• Biogeochemical functions (ie processes associated with processing of minerals, particulates and water chemistry);
• Habitat provision functions (ie the type, amount and quality of habitat for flora and fauna); and
• Native biodiversity functions (ie the occurrence of diverse populations of indigenous native plants and animals) (Rowe et al. 2008).
The results of the survey were entered into the SEV calculator version 2.3 to calculate SEV scores. Reference site values were based on SEV scores from pristine steams. The reference sites used were site E6 (Mimi River tributary), and site N7 (Mangapepeke Stream) and W1 (Waipingao Stream); the latter two sites had previously been surveyed in February 2017 by Hamill (2017).
SEV surveys were undertaken along the main stem of Mangapepeke Stream and Mimi River and representative tributaries. For other tributary streams affected by the route, an SEV score was assigned based on scores from representative streams with similar habitat.
A fish survey was not undertaken at all sites where an SEV survey was applied. In these situations, the likely fish present at the site was based on what had been found in nearby fish surveys of similar habitat. For some sites additional fish and/or, invertebrates were assumed to be present even if they had not been caught. This was based on the suitability or habitat and nearby fish records; it recognises the limitations of a single fish survey at a particular site. Specific changes were:
Quality Class Description MCI QMCI
Excellent Clean water > 120 > 6.0
Good Doubtful quality or possible mild pollution 100 – 120 5.0 ‐ 6.0
Fair Probable moderate pollution 80 – 100 4.0 – 5.0
Poor Probable severe pollution < 80 < 4.0

Assessment of Ecological Effects – Freshwater Ecology | Technical Report 7b Page 13
• Freshwater mussels (kākahi) were observed at sites E1 (Mangapepeke Stream) and E7 (Mimi Stream) so kākahi were also assumed to be present at sites upstream of those sites with suitable habitat (ie Sites E2, E7, Ea10, Ea26 and Ea27).
• It was assumed that kōura were present at all forested sites surveyed regardless of whether they were caught, because past surveys found them to be widespread.
• At site E5 it was assumed that banded kōkopu and longfin eel would also be present in addition to the redfin bully caught during the fish survey based on habitat.
• At site E6 it was assumed that redfin bully would also be present in addition to the banded kōkopu based on the habitat present.
• Giant kōkopu were only caught in the Mimi River but were also assumed to be in the Mangapepeke Stream at site Ea10 based on the habitat present.
2.7.1 Environmental Compensation Ratio (ECR) The SEV scores were used to calculate an Environmental Compensation Ratio (ECR). The ECR determines the amount of another stream reach that would need to be restored relative to the amount of stream degraded, in order to achieve no net loss of stream ecological function. It is intended to apply to similar types of streams. Calculation of an ECR accounts for both functions actually degraded as a consequence of the development, and also the potential for improvement in these functions that is forgone by development of the site.
The ECR formula gives the number needed to multiply the area of the impacted stream by, to determine what stream area needs to be restored as part of an offset /compensation package, in order to replace the functions lost in the impacted stream. An ECR score less than 1 defaults to 1 (Storey et al. 2011).
ECR = [(SEVi-P – SEVi-I)/(SEVm-P – SEVm-C)] x 1.5
Where:
SEVi-C & SEVi-P are the current and potential SEV values respectively for the site to be impacted.
SEVm-C & SEVm-P are the current and potential SEV values respectively for the site where environmental compensation is to be applied.
SEVi-I is the predicted SEV value of the stream to be impacted, after impact.
The length of stream requiring restoration was calculated by first multiplying the length of stream being piped or diverted during the Project by the ECR (Appendix C). This was then multiplied by the average stream width, and expressed as stream area to ensure ‘no net loss’ of overall habitat. There will be little difference in an analysis based on area or length if the impact and offset compensation streams are of similar size, but it can make a difference if they are of different sizes. The use of stream area helps put more weight on streams with a larger quantum of aquatic habitat.
2.7.1.1 SEV after impact (SEVi-I)
In calculating the ECR, a lower after impact SEV was used for culverted streams (ie SEVi-I of 0.23) compared to streams that will be diverted or temporarily impacted (e.g. from access

Assessment of Ecological Effects – Freshwater Ecology | Technical Report 7b Page 14
tracks). The ‘after impact’ score was calculated by applying a hypothetical scenario within the SEV calculator using expert judgement; it is consistent with experience from other projects.
The ECR equation was not designed for stream diversions where the final stream values will be similar or better than the current stream values. Some assumptions embedded in the ECR equation don’t apply to stream diversions, eg unlike a piped stream, a stream diversion usually does not lose the potential for future restoration work to occur. Furthermore, if the ECR equation is applied to stream diversions the resulting ECR is often zero or cannot be defined because the denominator is zero.
For stream diversions where the final stream condition will be similar to before the works, a standard ECR value of 0.5 times was used, instead of applying the ECR equation. This means restoration of the stream diversion section plus offset compensation of another 50% of the stream diversion length /area. This is consistent with the SEV approach to account for temporary degradation during the period of the works and time lags in establishing restoration plantings. This applies to the stream diversion at site E7 and stream diversions at fill sites (ETL3, ETL4, ETL5, Ea30).2
It is unlikely that streams that are surrounded by high quality forest habitat will be returned to equivalent conditions after stream diversions - especially in the case of steep confined catchments. In these situations, the ECR equation was applied based on a hypothetical estimate of the stream diversion condition after the works and establishment of riparian vegetation. This applies to the stream diversions at site E5, Ea17 and Ea18.
The same approach was taken for short-term works where the impact will be limited to the construction period with restoration occurring after this period. Where the restoration will eventually result in a stream having similar habitat condition than before the works, then a ECR value of 0.5 times was applied, ie restoration of the affected length plus offset compensation of another 50% of the length/area. This addresses the time lag required for riparian vegetation to establish to a similar condition as before the works (e.g. sites ETL3, ETL4, Ea3, Ea4, Ea5, Ea7, Ea8, Ea9, and E3).
For short term works and stream diversions, where the after impact SEV score may be lower than the current score, the ECR was based on current state3 and any ECR values that were less than 0.5 defaulted back to 0.5.
2.7.1.2 SEV after restoration (SEVm-P) and SEV potential (SEVi-P)
The ‘potential’ SEV score for sites was based on applying hypothetical scenarios within the SEV calculator using expert judgement. For streams of similar habitat and SEV values then the SEV value assumed after restoration efforts (SEVm-P) was the same as the potential SEV (SEVi-P) used in the calculation.
2 The approach is conservative for stream being diverted with low current SEV scores, because the new channel can be rapidly restored to current state. However only site Ea30 is likely to meet this criteria. 3 This is because the stream potential is not lost; in practice, it made very little difference to the ECR.

Assessment of Ecological Effects – Freshwater Ecology | Technical Report 7b Page 15
It was assumed for the purpose of calculating ECRs, that restoration for the purpose of stream offset compensation would occur along the upper valley of the Mangapepeke Stream (eg near Sites E3 and E4) and in the Mimi River catchment (eg near Sites Ea26, Ea27, Ea28 and E7). The availability of restoration sites is still to be confirmed. The potential improvements in SEV from restoration work will need to be validated once the compensation package has been confirmed.
The ECR equations used an average value for habitat improvements expected at stream offset sites. The length of the Mangapepeke Stream and Mimi River that might be improved with restoration work was estimated. The difference between current and potential (after restoration) SEV was estimated (ie SEVm-P minus SEVm-C), and weighted by the stream area of each section (stream length times width). From this an area-weighted average SEV improvement was calculated for use in the ECR equations (Appendix C).
2.7.1.3 Adjusting the ECR
It should be remembered that the SEV is simply a tool and expert judgement is needed in any final decision about appropriate mitigation and offset compensation. In particular, the SEV approach only partially accounts for the rare and complex stream habitat associated with mature swamp forest. A remnant of degraded kahikatea swamp forest is present in the Mangapepeke Stream upstream of site Ea10. The stream morphology through this section has mostly maintained its complex character despite the degraded condition of the forest itself. The Mangapepeke Steam in this area is relatively narrow and deep with stream banks stabilised by the tree roots. This morphology is hard to recreate in a stream restoration until the floodplain forest has matured. To recognise this longer than usual time-lag for restoration, the ECR values for site Ea10 were doubled (Appendix C).
2.7.1.4 Measuring lengths of streams affected by the works
The length of streams affected by the works was measured from aerial photographs with an overlay of the route footprint. The lengths affected were measured separately for the permanent footprint and disturbance from temporary works outside the footprint. It was assumed that culvert headwalls and aprons would extend beyond the permanent footprint, so an additional impacted length of 5m and 10m was added for streams with catchment areas of <20ha and >20ha respectively.
Access tracks were assumed to be 8m wide. Where access tracks follow an existing farm track an additional 5m of culvert was allowed. Where access tracks were new, an additional 10m of culvert was allowed.
2.8 Assessment of effects scoring method The assessment of ecological effects follows Ecological Impact Assessment guidelines (EcIA) produced by the Environment Institute of Australia and New Zealand (EIANZ, 2015). The aim of using a standard framework and matrix approach is to provide a more consistent and transparent assessment of effects. It provides structure but does not replace the need for sound ecological judgement.
Assessment of Ecological Effects – Freshwater Ecology | Technical Report 7b Page 16
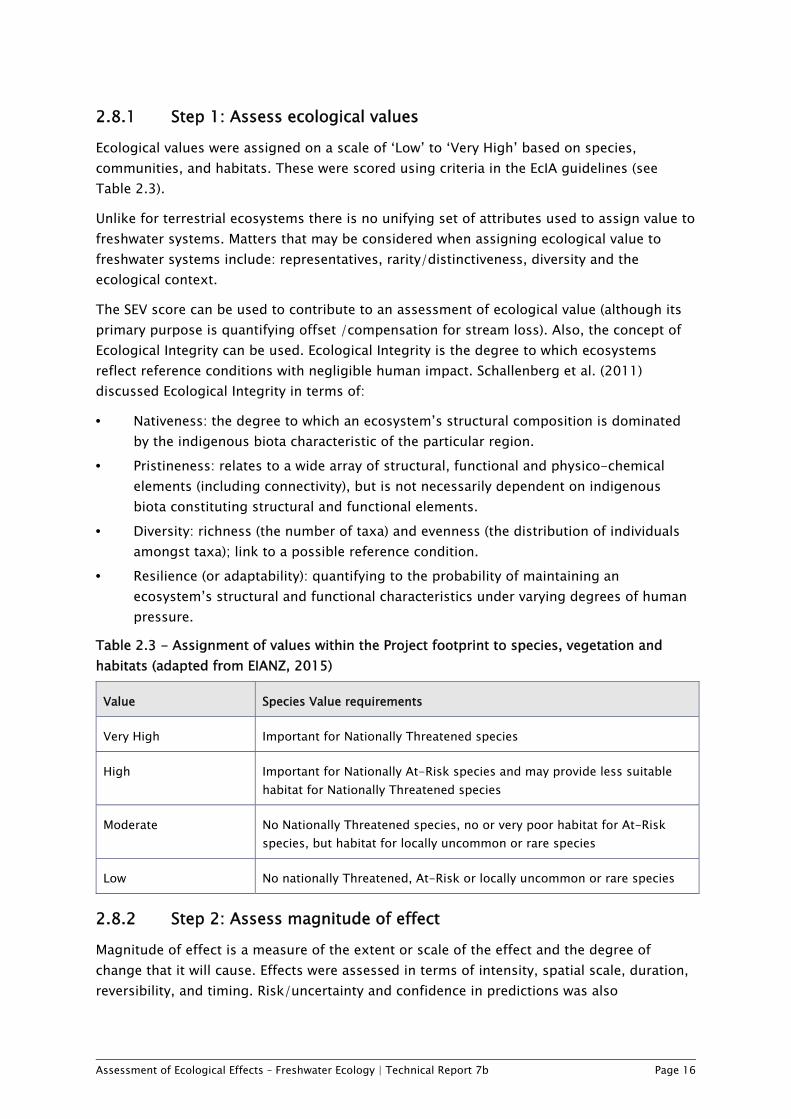
2.8.1 Step 1: Assess ecological values Ecological values were assigned on a scale of ‘Low’ to ‘Very High’ based on species, communities, and habitats. These were scored using criteria in the EcIA guidelines (see Table 2.3).
Unlike for terrestrial ecosystems there is no unifying set of attributes used to assign value to freshwater systems. Matters that may be considered when assigning ecological value to freshwater systems include: representatives, rarity/distinctiveness, diversity and the ecological context.
The SEV score can be used to contribute to an assessment of ecological value (although its primary purpose is quantifying offset /compensation for stream loss). Also, the concept of Ecological Integrity can be used. Ecological Integrity is the degree to which ecosystems reflect reference conditions with negligible human impact. Schallenberg et al. (2011) discussed Ecological Integrity in terms of:
• Nativeness: the degree to which an ecosystem’s structural composition is dominated by the indigenous biota characteristic of the particular region.
• Pristineness: relates to a wide array of structural, functional and physico-chemical elements (including connectivity), but is not necessarily dependent on indigenous biota constituting structural and functional elements.
• Diversity: richness (the number of taxa) and evenness (the distribution of individuals amongst taxa); link to a possible reference condition.
• Resilience (or adaptability): quantifying to the probability of maintaining an ecosystem’s structural and functional characteristics under varying degrees of human pressure.
Table 2.3 - Assignment of values within the Project footprint to species, vegetation and habitats (adapted from EIANZ, 2015)
Value Species Value requirements
Very High Important for Nationally Threatened species
High Important for Nationally At-Risk species and may provide less suitable habitat for Nationally Threatened species
Moderate No Nationally Threatened species, no or very poor habitat for At-Risk species, but habitat for locally uncommon or rare species
Low No nationally Threatened, At-Risk or locally uncommon or rare species
2.8.2 Step 2: Assess magnitude of effect Magnitude of effect is a measure of the extent or scale of the effect and the degree of change that it will cause. Effects were assessed in terms of intensity, spatial scale, duration, reversibility, and timing. Risk/uncertainty and confidence in predictions was also

Assessment of Ecological Effects – Freshwater Ecology | Technical Report 7b Page 17
considered. Effects magnitude was scored on a scale of ‘No Effect’ to ‘Very High’ (Table 2.4). The assessment was made both without mitigation and with mitigation (but not offset).
The spatial scale for effects such as habitat loss was considered in the context of the streams catchment or sub-catchment upstream of the Project area. Judgement is required in assessing the magnitude of effect in the context of the spatial scale.
Table 2.4 - Summary of the criteria for describing the magnitude of effect (EIANZ, 2015).
Magnitude of effect Description
Very High Total loss or alteration of the existing baseline conditions;
Loss of high proportion of the known population or range
High Major loss or alteration of existing baseline conditions;
Loss of high proportion of the known population or range
Moderate Moderate loss or alteration to existing baseline conditions;
Loss of a moderate proportion of the known population or range
Low Minor shift away from existing baseline conditions;
Minor effect on the known population or range
Negligible Very slight change from the existing baseline conditions;
Negligible effect on the known population or range
2.8.3 Step 3: Level of effects assessment An overall level of effect was using a matrix approach that combine the ‘ecological values’ and the ‘magnitude of effects’ on these values. The matrix describes a level of ecological effect on a scale of ‘No Effect’ to ‘Very High’ (Table 2.5).
The level of effect can be used as a guide to the extent of response in terms of avoidance, mitigation and, if necessary, biodiversity offsetting.4
4 Biodiveristy offsets are measurable conservation outcomes resulting from actions designed to compensate for significant residual adverse biodiversity impacts arising from project development after appropriate prevention and mitigation measures have been taken. The goal of biodiversity offsets is to achieve no net loss and preferably a net gain of biodiversity on the ground.

Assessment of Ecological Effects – Freshwater Ecology | Technical Report 7b Page 18
Table 2.5 - Criteria for describing overall levels of ecological effects (modified from EIANZ, 2015) .
Magnitude of effect Ecological Value
Very High High Moderate Low
Very High Very High Very High High Moderate
High Very High High Moderate Low
Moderate High High Moderate Low
Low Moderate Low Low Very Low
Negligible Low Very Low Very Low Very Low
No effect No effect No effect No effect No effect
Assessment of Ecological Effects – Freshwater Ecology | Technical Report 7b Page 19
3 Existing environment / survey results 3.1 Overview of existing environment The Mt Messenger area is situated in the North Taranaki Ecological District. The area contains high quality habitat for indigenous terrestrial and aquatic flora and fauna. The geology is dominated by papa mudstone; this has a considerable influence on stream substrate, the gravels are soft and there is a relatively high amount of fine sediment on the stream bed. The proposed route spans two hydrological catchments: the Tongaporutu River to the north (for which the Mangapepeke Stream is a tributary) and the Mimi River to the south.
3.1.1 Mangapepeke Stream The Mangapepeke Stream drains north-west to the Mangaongaonga Stream and the Tongaporutu River, which enters the coast at Tongaporutu, about 7km north of the Project footprint. The lower section of the Mangapepeke Stream (near the current SH3) is a small low gradient stream about 1.4m wide and 0.4m deep in runs with occasional deep pools.
The catchment is predominantly covered in indigenous forest but the valley through which the stream meanders is mainly pasture and grazed wetland. More wetland vegetation remains where the ground is poorly drained. In places near the current SH3 the stream has been straightened, but the stream meanders through most of the Mangapepeke valley. The substrate is silt with occasional wood becoming more common further up the catchment. Aquatic macrophytes common in the stream included watercress (Nasturtium officinale), starwort (Callitriche stagnalis) and native charophyte (stonewort) Chara sp. The streams in the valley have high potential to be enhanced by removing stock and riparian planting.
A remnant of degraded kahikatea swamp forest is present on the true right of the Mangapepeke valley near site Ea10. The forest condition has been degraded by stock grazing, nevertheless the stream through this small section has maintained much of its complex original complex morphology, ie relatively narrow and deep with tree roots stabilising the stream banks and forming pools, undercuts and small cascades. The streams in the valley have high potential to be enhanced by excluding stock, and riparian planting.
The upper reaches of the Mangapepeke Stream and most tributaries entering from the valley sides typically have a steep gradient, cascade-pool morphology and indigenous forest cover. The sections with dense forest cover are wider and shallower (about 2.5m wide and 0.25m deep at site E5) and have deep pools downstream of cascades and log jams. Waterfalls are common (eg sites Ea14, Ea15, and E5). Further up the main valley becomes very narrow (about 1.5 to 2.5m wide at the base) and is confined with steep sides (ie sites Ea16 and Ea17).
Fish caught in the lower reaches include: longfin eel (Anguilla dieffenbachii), adult inanga (Galaxias maculatus), redfin bully (Gobiomorphus huttoni), and common bully (Gobiomorphus cotidianus). Paratya shrimp (Paratya sp.), freshwater crayfish (koura) and

Assessment of Ecological Effects – Freshwater Ecology | Technical Report 7b Page 20
freshwater mussel (kākahi; Hyridella sp.) were also common. Steeper sites tended to have banded kōkopu (Galaxias fasciatus), redfin bully and kōura.
The aquatic macroinvertebrate community indicated ‘fair’ to ‘good’ water quality in the lower reaches, improving to ‘good’ and ‘excellent’ water quality further upstream. However, some tributaries have been recently dug out and straightened (eg site Ea3) and this has considerably reduced the habitat values.
3.1.2 Mimi River The Mimi River flows south-west to enter the coast between Waiiti and Urenui. The lower section near the current SH3 is a low gradient stream about 2.1m wide and 0.45m deep in runs with occasional deep pools. The catchment is predominantly covered in indigenous forest but the valley through which the main stream meanders is mainly pasture and grazed wetland (sites E7, Ea27 and Ea28). The aquatic macrophytes Potamogeton sp. and the aquatic weed Elodea canadensis are present in the lower reaches. The streams in the valley have high potential to be enhanced by excluding stock and riparian planting.
There is a kahikatea swamp-maire (Syzigium maire) swamp-forest downstream of tributaries affected by the proposed route. The stream through this section is narrow (about 1.1m) and deep (1m) with a complex morphology. This kahikatea forest has high ecological value because it is hydrologically intact and only a very small percentage of the original area of this forest type remains in the region. It offers high quality habitat suitable for wetland birds including fernbird (Megalurus punctatus) and spotless crake (Porzana tabuensis) (also see the Ecological Effects Assessment - Vegetation (Technical Report 7a, Volume 3 of the AEE).
Fish caught in the lower reaches of the Mimi River include: longfin eel, adult inanga, redfin bully, giant kōkopu (Galaxias argenteus) and banded kōkopu. Paratya shrimp, kōura and kākahi were also common. Steeper sites tended to have banded kōkopu, and kōura. Many of the fish species present are classified as all At Risk – Declining (ie longfin eel, inanga, giant kōkopu and redfin bully).
The aquatic macroinvertebrate community indicated ‘excellent’ water quality/ condition along the main stem of the river and forested headwater streams. However small tributaries running through pasture were heavily modified and affected by stock (eg cattle pugging). These had macroinvertebrate community’s indicative of ‘poor’ ecological condition (ie site Ea28).
3.2 Habitat The highest habitat scores (sites E5, E6, Ea10, Ea13, Ea21) occurred at sites with indigenous forest dominating the catchment. This provided shade and woody debris in the streams which in turn provided a diversity of cover and habitat for fish and invertebrates. Site Ea10 in the Mangapepeke Valley was located within a degraded remnant of a kahikatea swamp forest, and although the stream had limited shading it had high potential fish habitat and hydraulic complexity. The sites with the lowest (worst) habitat scores (Ea1, Ea22 and Ea28) were characterised by having little riparian vegetation cover, no shade, little cover for fish,

Assessment of Ecological Effects – Freshwater Ecology | Technical Report 7b Page 21
uniform hydraulic conditions, considerable sedimentation and bank erosion accelerated by cattle access.
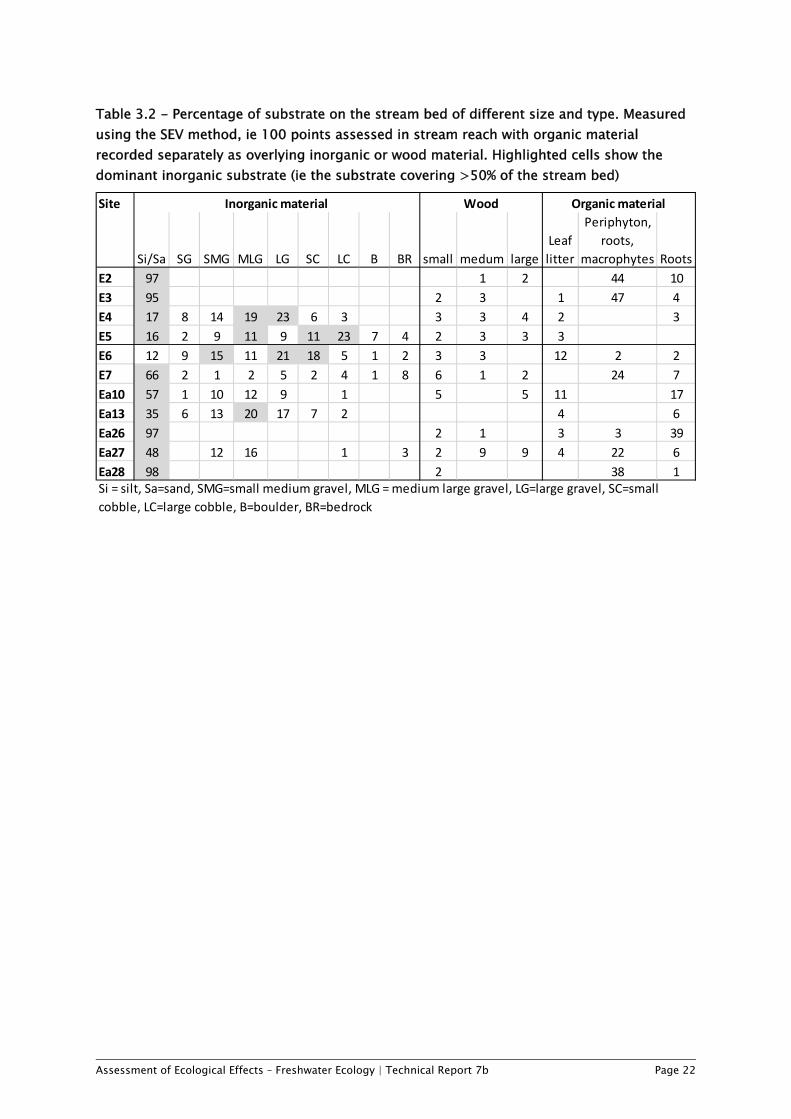
The geology of Mt Messenger is papa mudstone. This is a relatively soft rock and the gravel and cobbles are readily crushed to silt by hand. Small slips were common in the vicinity of the proposed route. In low gradient sections, the stream substrate in both the Mangapepeke Stream and Mimi Stream predominantly consisted of fine sediment (eg sites E1, E2, E3, E7, Ea26, Ea27). In steeper sections of the stream (E4, E5, E6, Ea13) gravels or cobbles formed more of the substrate. Even in the steep sections fine sediment was common in runs and pools (Table 3.1, Table 3.2).
Bank slumping and cattle near the streams had an observable impact on fine sediment within runs on the stream bed. In some cases, pugging by cattle caused complete smothering of the bed of smaller streams/drains (eg site Ea28).
All of the sites had a Regional Environment Classification (REC) climate category of wet and warm; source of flow is low elevation; and geology classed as soft sedimentary. Land cover was classed as pastoral for sites for the lowland sites, and indigenous forest for the upper Mangapepeke Stream.
Fly tipping from the top of Mt Messenger has resulted in rubbish and exotic weeds being transported down into both the Mangapepeke and Mimi catchments. As a result, pest plants such as wandering jew (Tradescantia sp.) and Arum lily (Zantedeschia aethiopica) occur in otherwise near pristine areas.
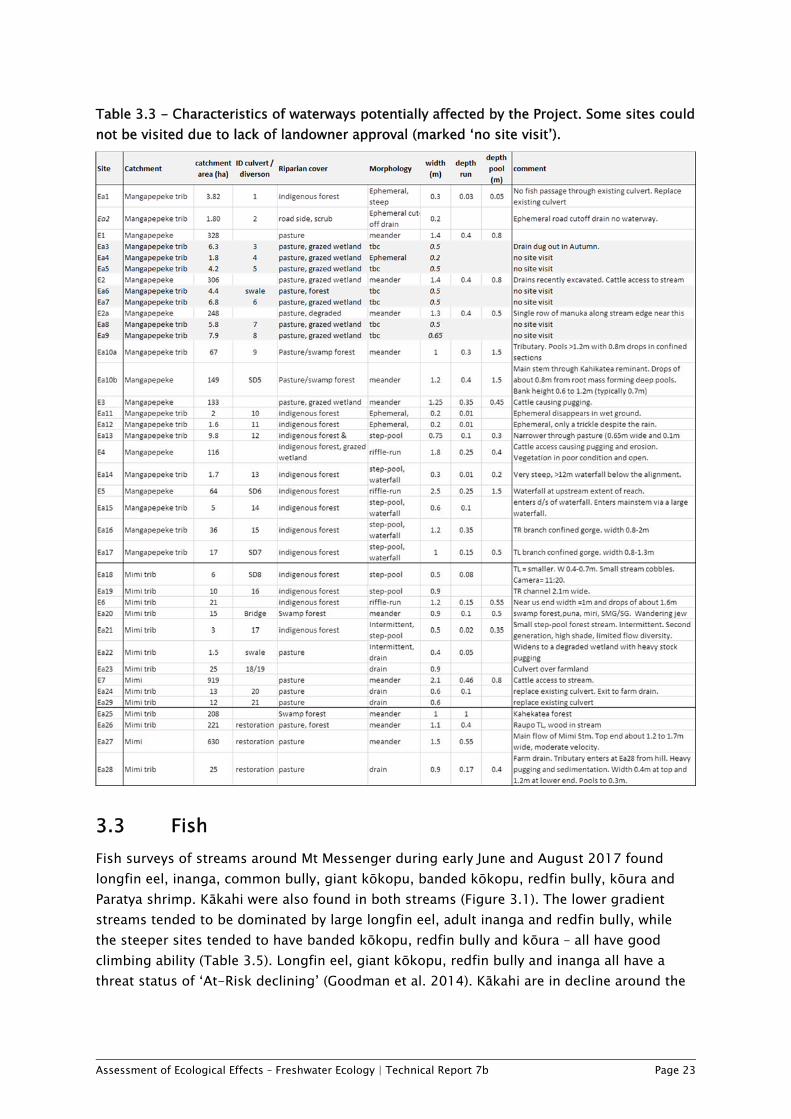
Most waterways directly impacted by the Project works are small; a third (10) have a catchment area of less than 5ha (probably intermittent or ephemeral), and about three quarters (22) have a catchment area of less than 20ha (Table 3.3).
Table 3.1 - Habitat scores for streams on Mt Messenger affected by the Project (Clapcott 2015). High scores indicate better habitat quality.
Habitat parameter E1 E2 E2a E3 E4 E5 Ea10 Ea13 E6 E7 Ea21 Ea22 Ea26 Ea27 Ea28
Deposited sediment 1 1 1 1 5 5 4 5 6 1 3 1 3 1 1
Invertebrate habitat diversity 4 3 7 4 7 7 8 8 9 8 8 1 7 5 1
Invertebrate habitat abundance 4 4 2 5 5 8 6 7 7 3 6 5 5 3 2
Fish cover diversity 4.5 5.5 6 4 7 7 9 8 9 7.5 8 3 7 5 2
Fish cover abundance 6 4 7 7 4 8 9 5 6 6 4 7 9 8 3
Hydraulic heterogeneity 4 8 7 7 7 8 10 6 8 7 6 1 7 8 4
Bank erosion 3 6 4 7 5 7 3 7 8 6 7 5 3 4 4
Bank vegetation 2 8 7 4 3 8 5 8 10 2 8 3 5 2 2
Riparian width 1 1 1 1 8 10 6 10 10 1 10 1 4.5 1 1.5
Riparian shade 4 4 5.5 1 4 8 6 9 9.5 3 9 1 3 1.5 1
Total score (out of 100) 33.5 44.5 47.5 41 55 76 66 73 82.5 44.5 69 28 53.5 38.5 21.5
Each habitat parameter scored on a scale of 1 to 10
Mimi catchmentMangapepeke catchment
Assessment of Ecological Effects – Freshwater Ecology | Technical Report 7b Page 22
Table 3.2 - Percentage of substrate on the stream bed of different size and type. Measured using the SEV method, ie 100 points assessed in stream reach with organic material recorded separately as overlying inorganic or wood material. Highlighted cells show the dominant inorganic substrate (ie the substrate covering >50% of the stream bed)
Site
Si/Sa SG SMG MLG LG SC LC B BR small medum large
Leaf
litter
Periphyton,
roots,
macrophytes Roots
E2 97 1 2 44 10
E3 95 2 3 1 47 4
E4 17 8 14 19 23 6 3 3 3 4 2 3
E5 16 2 9 11 9 11 23 7 4 2 3 3 3
E6 12 9 15 11 21 18 5 1 2 3 3 12 2 2
E7 66 2 1 2 5 2 4 1 8 6 1 2 24 7
Ea10 57 1 10 12 9 1 5 5 11 17
Ea13 35 6 13 20 17 7 2 4 6
Ea26 97 2 1 3 3 39
Ea27 48 12 16 1 3 2 9 9 4 22 6
Ea28 98 2 38 1
Organic materialWoodInorganic material
Si = silt, Sa=sand, SMG=small medium gravel, MLG = medium large gravel, LG=large gravel, SC=small
cobble, LC=large cobble, B=boulder, BR=bedrock
Assessment of Ecological Effects – Freshwater Ecology | Technical Report 7b Page 23
Table 3.3 - Characteristics of waterways potentially affected by the Project. Some sites could not be visited due to lack of landowner approval (marked ‘no site visit’).
3.3 Fish Fish surveys of streams around Mt Messenger during early June and August 2017 found longfin eel, inanga, common bully, giant kōkopu, banded kōkopu, redfin bully, kōura and Paratya shrimp. Kākahi were also found in both streams (Figure 3.1). The lower gradient streams tended to be dominated by large longfin eel, adult inanga and redfin bully, while the steeper sites tended to have banded kōkopu, redfin bully and kōura – all have good climbing ability (Table 3.5). Longfin eel, giant kōkopu, redfin bully and inanga all have a threat status of ‘At-Risk declining’ (Goodman et al. 2014). Kākahi are in decline around the
Assessment of Ecological Effects – Freshwater Ecology | Technical Report 7b Page 24
country, probably due to a combination of declining water quality and recruitment failure due to declining numbers of native fish that are needed as hosts by the juvenile mussel.
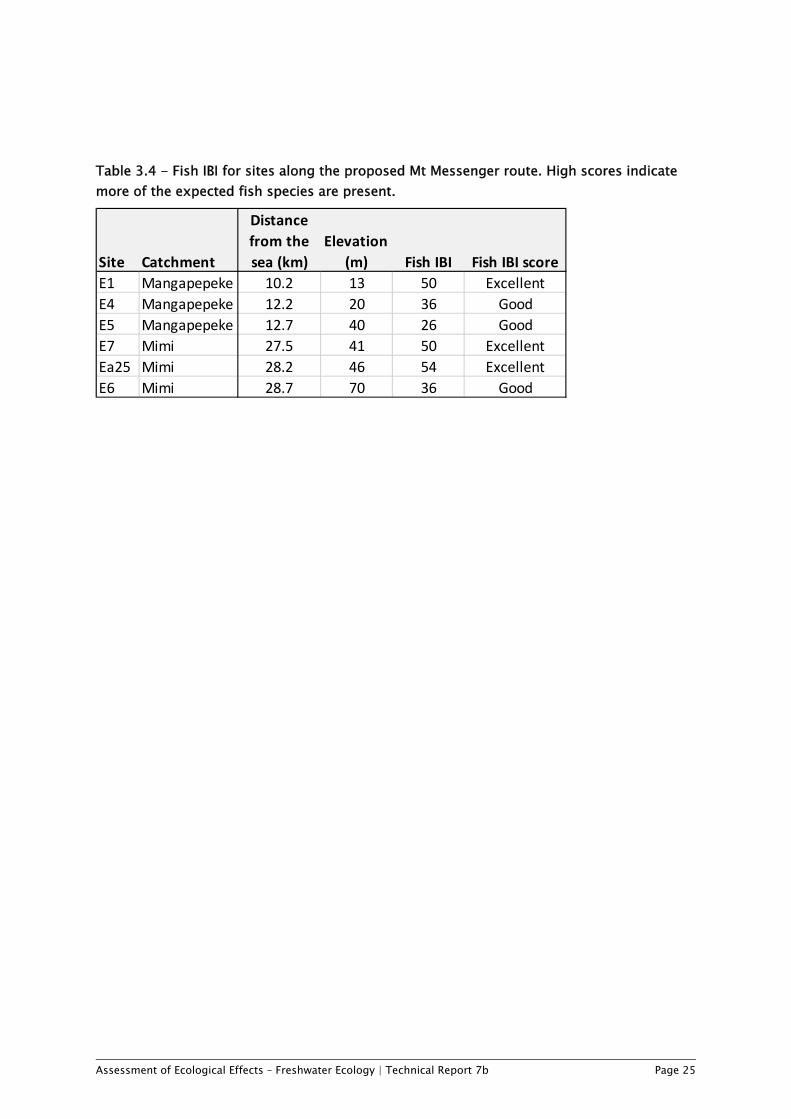
The Fish IBI was calculated for each stream. The lower gradient sites on both the Mangapepeke Stream and the Mimi Stream had ‘excellent’ Fish IBI scores (sites E1, E7, Ea25), while higher up the catchment the scores were ‘good’ (
Table 3.4). An excellent score means that most regionally expected species for the stream position are present, and that the presence of fish in the stream is similar to sites with minimal human disturbance.
Sampling fish during winter and soon after flood events (eg early August sampling) is not ideal and can find lower fish abundance. However, the diversity of fish caught during the June and August fish surveys were similar to what was found in other tributaries of the Mangapepeke Stream and Mimi River sampled during February 2017. The main difference was that the February surveys found shortfin eel but not giant kōkopu. Also, the February survey of the west branch of the Mangapepeke Stream caught higher abundance of inanga and longfin eel for a similar netting effort (Hamill 2017).
The species found during the sampling are similar to what is recorded in the NZ Freshwater Fish Database (NZFFD) of fish in streams close to Mt Messenger, although the NZFFD also records some marine wanderer species near the coast and koaro (Galaxias brevipinnis) in the Ureti Stream. The NZFFD database records:
A tributary to the Mangaongaonga Stream has records of banded kōkopu, giant kōkopu, longfin eel, inanga, common bully, redfin bully, giant bully, and kōura.
The Mimi Stream has records of giant kōkopu and eel. The Ruhi Stream has records of banded kōkopu, inanga, longfin eel, redfin bully,
Paratya shrimp and kōura. The Uruti Stream has records of longfin eel, giant kōkopu, redfin bully, koaro,
shortjaw kōkopu (Galaxias postvectis) and kōura. The lower Tongaporutu River has records of inanga. The lower Mokau River has records of inanga, longfin eel, shortfin eel (Anguilla
australis), common bully, redfin bully, kōura, smelt (Retropinna retropinna), yellow belly flounder (Rhombosolea leporine) and yellow eye mullet (Aldrichetta forsteri).
The Mohakatino River tributary has records of inanga and common bully.
DoC undertook a fish survey of the Taranaki area in 2013 targeting Galaxiid species using spotlighting method, including sites in the Mimi River and Waipingao catchment (Goodman McQueen 2013). The sites surveyed on the Mimi River were at site Ea26 and upstream of site Ea27. The survey found: redfin bully, longfin eel, banded kōkopu, and giant kōkopu. Redfin bully were most abundant. Beds of kākahi were found in the upper Mimi River (upstream of Ea27). All these species were present in the 2017 survey of Mimi River site. It was noted that the presence of large galaxiids was strongly associated with overhanging riparian vegetation and overhead shade.
Assessment of Ecological Effects – Freshwater Ecology | Technical Report 7b Page 25
Table 3.4 - Fish IBI for sites along the proposed Mt Messenger route. High scores indicate more of the expected fish species are present.
Site Catchment
Distance
from the
sea (km)
Elevation
(m) Fish IBI Fish IBI score
E1 Mangapepeke 10.2 13 50 Excellent
E4 Mangapepeke 12.2 20 36 Good
E5 Mangapepeke 12.7 40 26 Good
E7 Mimi 27.5 41 50 Excellent
Ea25 Mimi 28.2 46 54 Excellent
E6 Mimi 28.7 70 36 Good

Assessment of Ecological Effects – Freshwater Ecology | Technical Report 7b Page 26
Figure 3.1 - Some typical fish and bivalves in Mangapepeke Stream and Mimi River. From top to bottom: adult inanga (site E1), redfin bully (site E1), giant kōkopu (site E7), kākahi (site E1).

Assessment of Ecological Effects – Freshwater Ecology | Technical Report 7b Page 27
Table 3.5 - Fish and invertebrates caught along the proposed route, June and August 2017.
Site E7, Mimi River. 6 fine mesh fyke nets over 160m left overnight. June 2017
Species 0+ Small Med Large Total
Longfin eel Anguilla dieffenbachii 5 4 9
Giant kokopu Galaxias argenteus 1 1
Redfin bully Gobiomorphus huttoni 1 5 6
Paratya shrimp Paratya sp. 173
also kakahi
Site Ea25 Mimi River. 5 fyke nets and 12 Gee minnow traps over 80m left overnight. 31 July 2017
Species 0+ Small Med Large Total
Longfin eel Anguilla dieffenbachii 2 2
Giant kokopu Galaxias argenteus 1 1
Banded kokopu Galaxias fasciatus 2 5 1 8
Redfin bully Gobiomorphus huttoni 2 5 7
Koura Paranephrops planifrons 1 1
Paratya shrimp Paratya sp. 5 5
Site E6 Mimi River. 180m fished using back pack electro‐fishing. June 2017
Species 0+ Small Med Large Total
Banded kokopu Galaxias fasciatus 4 4
Koura Paranephrops planifrons 8 1 9
Site E5 Mangapepeke Stream. 150m fished using backpack electro fishing. June 2017
9 small redfin bully
Site E4 Mangapepeke Stream. 120m fished using backpack electro fishing. June 2017
Species 0+ Small Med Large Total
Longfin eel Anguilla dieffenbachii 1 1
eel unidentfied Anguilla sp. 1 1
Redfin bully Gobiomorphus huttoni 1 8 6 15
Site E1 Mangapepeke Stream. 6 fine mesh fyke nets over 200m left over night. June 2017
Species 0+ Small Med Large Total
Longfin eel Anguilla dieffenbachii 1 1 3 5
Inanga Galaxias maculatus 24 20 1 45
Redfin bully Gobiomorphus huttoni 6 2 8
Common bully Gobiomorphus cotidianus 3 4 7
Koura Paranephrops planifrons 1 1
Paratya shrimp Paratya sp. 153
also: kakahi

Assessment of Ecological Effects – Freshwater Ecology | Technical Report 7b Page 28
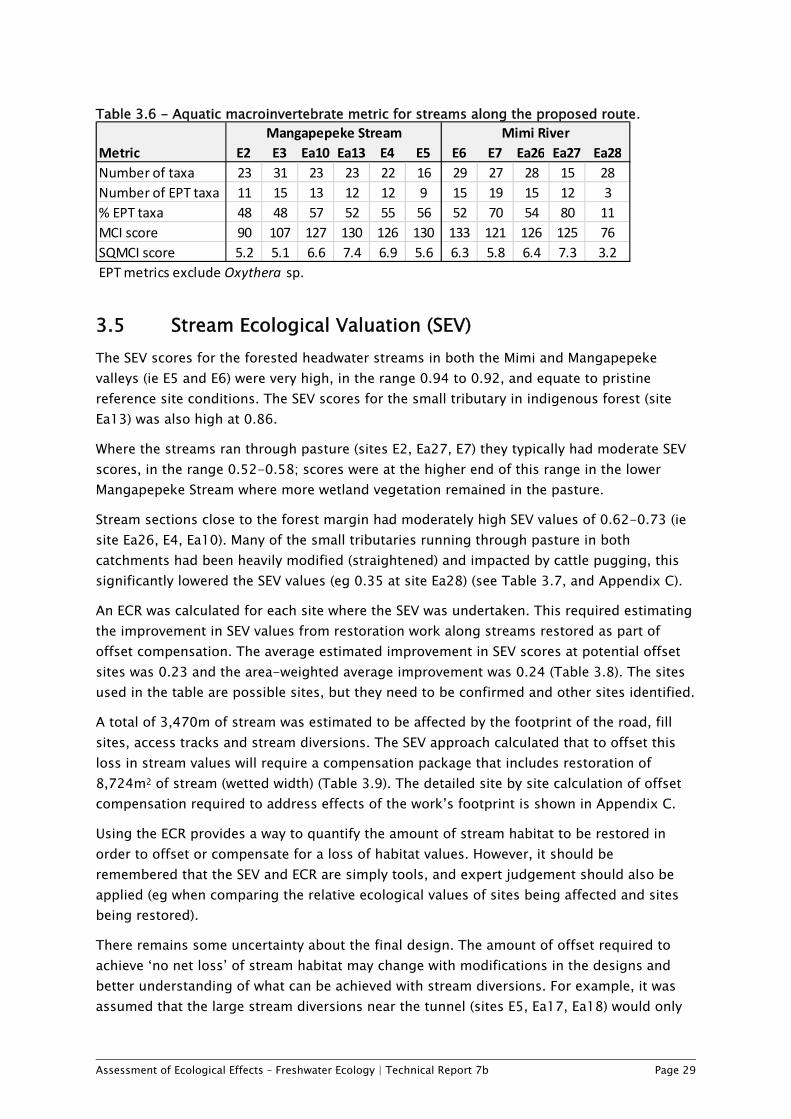
3.4 Aquatic macroinvertebrates A single aquatic macroinvertebrate sample was collected from each site where SEV was undertaken (Table 2.1). The MCI scores were indicative of ‘excellent’ water quality in the upper reaches of the Mangapepeke Stream, but reducing to ‘good’ and ‘fair’ further downstream (site E3 and E2 respectively). The MCI scores were indicative of ‘excellent’ water quality at all sites in the Mimi River catchment, except the drain at site Ea28 which was in ‘poor’ condition and had only a very few mayfly or stonefly (probably due to the large amount of sedimentation) (Table 3.6, Appendix B).
The most numerically dominant macroinvertebrate taxa in the Mangapepeke catchment sites were:
• E2: Paracalliope sp. amphiod, Austroclima sp. mayfly, and Potamopyrgus snail. • E3: Potamopyrgus snail, Austroclima sp. mayfly, and Austrosimulium (sandly larvae). • E4: Deleatidium mayfly, Potamopyrgus snail, Elmidae and Acroperla stonefly. • E5: Potamopyrgus snail, Acroperla stonefly and Deleatidium mayfly. • Ea10: Deleatidium mayfly, Elmidae and Potamopyrgus snail. • Ea13: Deleatidium and Zephlebia mayfly.
The most numerically dominant macroinvertebrate taxa in the Mimi catchment sites were:
• E7: Potamopyrgus snail, Zephlebia and Austroclima sp. mayfly and Paracalliope amphiod.
• E6: Potamopyrgus snail, Zephlebia and Deleatidium mayfly. • Ea27: Austroclima sp. mayfly, Potamopyrgus snail, Zephlebia mayfly and
Austrosimulium (sandly larvae). • Ea26: Austroclima sp. mayfly, Potamopyrgus snail, and Zephlebia mayfly. • Ea28: Ostracoda crustatea, Orthocladiinae (fly larvae), and oligochaete worms.
The freshwater mussel / kākahi (Hyridella sp.) and Paratya shrimp were present in the lower reaches of both Mangapepeke Stream and the Mimi River. Kōura (freshwater crayfish) were common throughout both catchments. During February sampling kōura were found in small streams above steep waterfalls (Hamill 2017).
The sampling of aquatic macroinvertebrates soon after large flood events (as occurred in early August for sites Ea10, Ea13, Ea26, Ea27 and Ea28) is not ideal as macroinvertebrate abundance and richness can be depleted. For state of environment monitoring it is recommended to wait at least two weeks following a large flood event to allow time for the stream algae and macroinvertebrate communities to recover.
Repeating sampling during a more stable period may find more species richness but is likely to make little difference to the MCI scores (which are consistent with MCI scores for the western tributary of the Mangapepeke Stream sampled in February (Hamill 2017). An increase in richness will also make only a small difference to the overall SEV score (eg perhaps an increase by 0.02 SEV points). Thus, the current samples are considered fit for purpose.
Assessment of Ecological Effects – Freshwater Ecology | Technical Report 7b Page 29
Table 3.6 - Aquatic macroinvertebrate metric for streams along the proposed route.
3.5 Stream Ecological Valuation (SEV) The SEV scores for the forested headwater streams in both the Mimi and Mangapepeke valleys (ie E5 and E6) were very high, in the range 0.94 to 0.92, and equate to pristine reference site conditions. The SEV scores for the small tributary in indigenous forest (site Ea13) was also high at 0.86.
Where the streams ran through pasture (sites E2, Ea27, E7) they typically had moderate SEV scores, in the range 0.52-0.58; scores were at the higher end of this range in the lower Mangapepeke Stream where more wetland vegetation remained in the pasture.
Stream sections close to the forest margin had moderately high SEV values of 0.62-0.73 (ie site Ea26, E4, Ea10). Many of the small tributaries running through pasture in both catchments had been heavily modified (straightened) and impacted by cattle pugging, this significantly lowered the SEV values (eg 0.35 at site Ea28) (see Table 3.7, and Appendix C).
An ECR was calculated for each site where the SEV was undertaken. This required estimating the improvement in SEV values from restoration work along streams restored as part of offset compensation. The average estimated improvement in SEV scores at potential offset sites was 0.23 and the area-weighted average improvement was 0.24 (Table 3.8). The sites used in the table are possible sites, but they need to be confirmed and other sites identified.
A total of 3,470m of stream was estimated to be affected by the footprint of the road, fill sites, access tracks and stream diversions. The SEV approach calculated that to offset this loss in stream values will require a compensation package that includes restoration of 8,724m2 of stream (wetted width) (Table 3.9). The detailed site by site calculation of offset compensation required to address effects of the work’s footprint is shown in Appendix C.
Using the ECR provides a way to quantify the amount of stream habitat to be restored in order to offset or compensate for a loss of habitat values. However, it should be remembered that the SEV and ECR are simply tools, and expert judgement should also be applied (eg when comparing the relative ecological values of sites being affected and sites being restored).
There remains some uncertainty about the final design. The amount of offset required to achieve ‘no net loss’ of stream habitat may change with modifications in the designs and better understanding of what can be achieved with stream diversions. For example, it was assumed that the large stream diversions near the tunnel (sites E5, Ea17, Ea18) would only
Metric E2 E3 Ea10 Ea13 E4 E5 E6 E7 Ea26 Ea27 Ea28
Number of taxa 23 31 23 23 22 16 29 27 28 15 28
Number of EPT taxa 11 15 13 12 12 9 15 19 15 12 3
% EPT taxa 48 48 57 52 55 56 52 70 54 80 11
MCI score 90 107 127 130 126 130 133 121 126 125 76
SQMCI score 5.2 5.1 6.6 7.4 6.9 5.6 6.3 5.8 6.4 7.3 3.2
EPT metrics exclude Oxythera sp.
Mimi RiverMangapepeke Stream

Assessment of Ecological Effects – Freshwater Ecology | Technical Report 7b Page 30
achieve a final SEV score of 0.55. This may be overly conservative, if a final SEV score of 0.75 was achieve than the ECR would change from 2.4 to 1.1and the total calculated offset would reduce by 907m2. Conversely if streams at E TL3 and E TL4 are culverted under the fill rather than diverted the amount of area required for offset would increase by 316m2. It is recommended that the required offsets are recalculated once offset sites are confirmed or if there are design changes that affect streams.
Table 3.7 - Summary of SEV scores for sites survey along the proposed route, Mt Messenger. See Appendix C for full breakdown of results.
Table 3.8 - Estimated change in SEV scores and available stream length at potential restoration sites. Estimates for the purpose of calculating an area weighted change in SEV
Function E2 Ea10 Ea13 E3 E4 E5 E6 Ea26 Ea27 Ea28 E7
Hydraulic 0.68 0.85 0.98 0.79 0.87 0.99 1 0.73 0.66 0.52 0.6
Biogeochemical 0.48 0.69 0.87 0.51 0.67 0.87 0.94 0.57 0.42 0.28 0.41
Habitat provision 0.55 0.64 0.68 0.43 0.57 0.94 0.94 0.42 0.55 0.22 0.51
Biodiversity 0.57 0.72 0.81 0.54 0.69 0.87 0.88 0.68 0.59 0.32 0.61
Overall mean SEV score
(maximum value 1)0.57 0.73 0.86 0.58 0.72 0.92 0.94 0.62 0.54 0.35 0.52
Mangapepeke Stream Mimi River
site
length
(m)
width
(m)
area
(m2) SEVm‐C SEVm‐P
SEVm‐C ‐
SEVm‐P description of length
Mangapepeke Stream (east branch)
tributaries 1041 0.43 538 0.55 0.82 0.26 Sum of tributaries excl bush and fill
ds E2 659 1.4 923 0.57 0.77 0.2 d/s E2
ds Ea10 1140 1.4 1596 0.57 0.77 0.2 E2 to Ea10 excl fill
E3 520 1.2 624 0.58 0.77 0.19 Ea13 to Ea10 excl bush and fill
E4 180 1.8 324 0.72 0.86 0.14 E4 ds to section adj. to fill
Mimi River
Ea27 909 1.5 1364 0.54 0.77 0.23 us of E26 trib
Ea28 700 0.8 560 0.35 0.77 0.42 drain TL of valley
E7 us 400 2.1 840 0.52 0.77 0.25 section ds of E26
E7 ds 360 2.1 756 0.52 0.77 0.25 downstream to corner
Ea26 165 1.1 182 0.62 0.86 0.24 tributaries to bush/wetland
Sum 6074 7705
Average 1.38 0.55 0.79 0.24 area weighted average = 0.24

Assessment of Ecological Effects – Freshwater Ecology | Technical Report 7b Page 31
Table 3.9 - Extent of stream affected by the Project and the area of offset to achieve ‘no net loss’.
Footprint Catchment
Length
(m)
Area
(m2)
Area
(m2)
Mangapepeke 1100 969 4150
Mimi 523 476 1865
Mangapepeke 1347 1464 2258
Mimi 500 333 450
Total 3470 3242 8724
Permanent
Short term &
diversions
Impact Offset
Assessment of Ecological Effects – Freshwater Ecology | Technical Report 7b Page 32
4 Assessment of effects on freshwater ecology
4.1 Overview of effects The potential effects on freshwater ecology of culverting and diverting streams has been assessed in terms of both short-term and long-term effects. Short term effects relate to the effects limited to the construction phase including: sedimentation, direct removal of fish from the stream, short-term loss of fish passage in some areas and short term loss of stream habitat from temporary culverts.
Potential long term effects include reduced fish passage, loss of stream ecological functions and habitat, and potential effects of road stormwater on stream hydrology and water quality. These effects may potentially occur as a result of different activities including the installation of culverts, diverting streams, bridge piers that may be needed for the final footprint and any access roads required for long-term maintenance purposes.
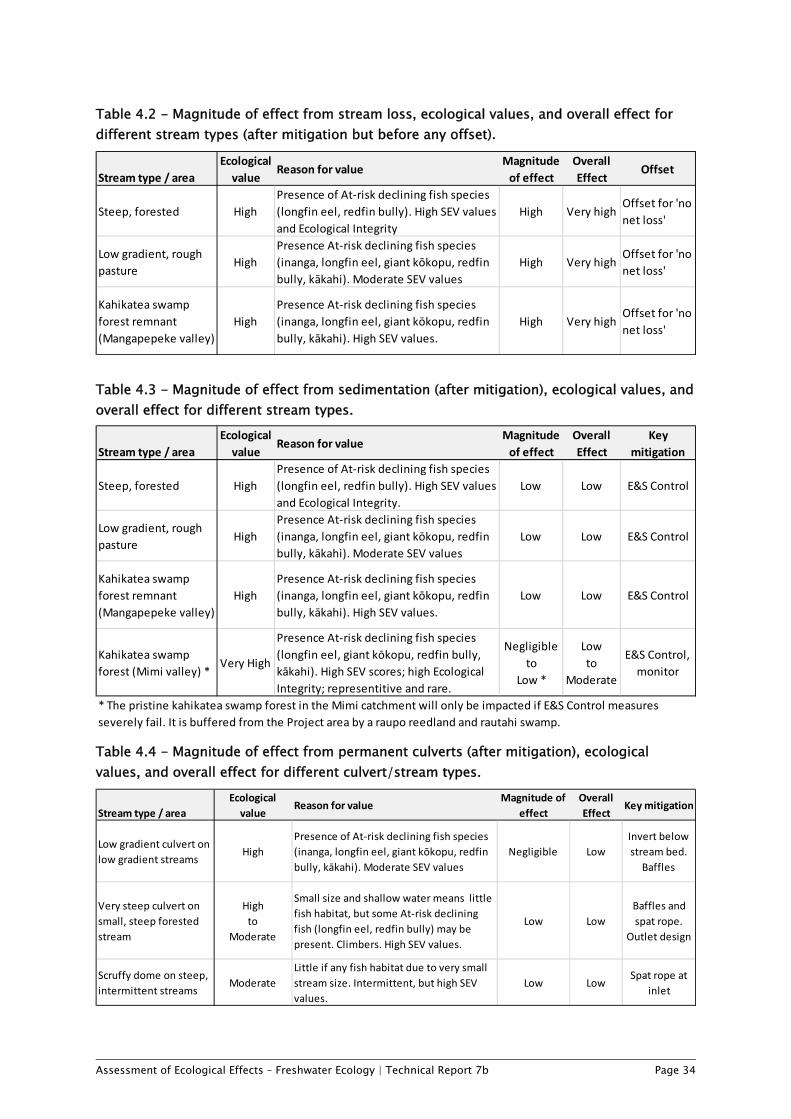
The magnitude of effect from different types of activity is summarised in Table 3.1, using the approach described in the EcIA guidelines (see section 2.8). The table is intended as a way to focus attention on activities with the highest potential effects. The largest magnitude of effects, after mitigation, will occur from the loss of stream habitat.
The overall level of effect from habitat loss was assessed for different types of stream, using the matrix approach to combine the ecological value and the magnitude of the effect (see section 2.8). The overall level of effect from habitat loss was ‘very high’ for all areas – confirming the need for the Project to provide a package of offset compensation. The amount of offset compensation was calculated using the SEV method to ensure ‘no net loss’ of stream values (Table 3.2).5
The residual risk of sedimentation from earthworks was assessed as ‘low’ after mitigation. This mitigation is primarily in the form of management plans to ensure good practice. The overall level of effect from sedimentation is expected to be ‘low’ at all stream types/area. The pristine kahikatea swamp forest in the Mimi catchment will only be impacted if Erosion and Sediment Control (E&SC) measures fail. It is buffered from the Project area by a raupo reedland and rautahi swamp, and this reduces the potential effects. Erosion and occasional slips are a common feature along other stream types affected by the Project.
The overall risk from vegetation clearance will be similar to that of sedimentation, however risk of residual adverse effects is more a feature of practice and less dependent on weather conditions. Good practice mitigation will ensure that any potential effects are low.
The residual risk of permanent culverts on fish passage was assessed as ‘negligible’ to ‘low’ after mitigation. In some cases, the proposed fish passage is less than ideal but the effect is
5 Note that some small, shallow, intermittent streams may have lower values than used in Table 3.2 due to limited habitat for fish.

Assessment of Ecological Effects – Freshwater Ecology | Technical Report 7b Page 33
limited due to existing natural fish barriers, the small stream size and limited habitat suitable for fish upstream (Table 4.4).
Potential effects from the Project on streams is discussed in more detail in the sections below.
Table 4.1 - Magnitude of impact for activities before and after mitigation.
Assessment of Ecological Effects – Freshwater Ecology | Technical Report 7b Page 34
Table 4.2 - Magnitude of effect from stream loss, ecological values, and overall effect for different stream types (after mitigation but before any offset).
Table 4.3 - Magnitude of effect from sedimentation (after mitigation), ecological values, and overall effect for different stream types.
Table 4.4 - Magnitude of effect from permanent culverts (after mitigation), ecological values, and overall effect for different culvert/stream types.
Stream type / area
Ecological
valueReason for value
Magnitude
of effect
Overall
EffectOffset
Steep, forested High
Presence of At‐risk declining fish species
(longfin eel, redfin bully). High SEV values
and Ecological Integrity
High Very highOffset for 'no
net loss'
Low gradient, rough
pastureHigh
Presence At‐risk declining fish species
(inanga, longfin eel, giant kōkopu, redfin
bully, kākahi). Moderate SEV values
High Very highOffset for 'no
net loss'
Kahikatea swamp
forest remnant
(Mangapepeke valley)
High
Presence At‐risk declining fish species
(inanga, longfin eel, giant kōkopu, redfin
bully, kākahi). High SEV values.
High Very highOffset for 'no
net loss'
Stream type / area
Ecological
valueReason for value
Magnitude
of effect
Overall
Effect
Key
mitigation
Steep, forested High
Presence of At‐risk declining fish species
(longfin eel, redfin bully). High SEV values
and Ecological Integrity.
Low Low E&S Control
Low gradient, rough
pastureHigh
Presence At‐risk declining fish species
(inanga, longfin eel, giant kōkopu, redfin
bully, kākahi). Moderate SEV values
Low Low E&S Control
Kahikatea swamp
forest remnant
(Mangapepeke valley)
High
Presence At‐risk declining fish species
(inanga, longfin eel, giant kōkopu, redfin
bully, kākahi). High SEV values.
Low Low E&S Control
Kahikatea swamp
forest (Mimi valley) *Very High
Presence At‐risk declining fish species
(longfin eel, giant kōkopu, redfin bully,
kākahi). High SEV scores; high Ecological
Integrity; representitive and rare.
Negligible
to
Low *
Low
to
Moderate
E&S Control,
monitor
* The pristine kahikatea swamp forest in the Mimi catchment will only be impacted if E&S Control measures
severely fail. It is buffered from the Project area by a raupo reedland and rautahi swamp.
Stream type / area
Ecological
valueReason for value
Magnitude of
effect
Overall
EffectKey mitigation
Low gradient culvert on
low gradient streamsHigh
Presence of At‐risk declining fish species
(inanga, longfin eel, giant kōkopu, redfin
bully, kākahi). Moderate SEV values
Negligible Low
Invert below
stream bed.
Baffles
Very steep culvert on
small, steep forested
stream
High
to
Moderate
Small size and shallow water means little
fish habitat, but some At‐risk declining
fish (longfin eel, redfin bully) may be
present. Climbers. High SEV values.
Low Low
Baffles and
spat rope.
Outlet design
Scruffy dome on steep,
intermittent streamsModerate
Little if any fish habitat due to very small
stream size. Intermittent, but high SEV
values.
Low LowSpat rope at
inlet
Assessment of Ecological Effects – Freshwater Ecology | Technical Report 7b Page 35
4.2 Short term construction effects 4.2.1 Direct effects on fish and Fish Recovery Protocols Filling-in stream channels and removing vegetation and sediment from streams poses a risk to native freshwater fish of mortality or injury. The magnitude of risk is dictated by the nature of the activity, the area of the stream disturbed, density of fish present in the stream, and the ability of fish to escape the disturbance. The rarity of the fish, ie its conservation status, is also relevant when assessing the potential level of effect.
The activities that can cause direct removal of fish include installing culverts and stream diversions. In the absence of any fish recovery there is a risk of direct removal, stranding or injury. Work in low gradient streams (eg culvert 9 and some access tracks) could affect species including inanga, longfin eel, redfin bully, giant kōkopu, kōura and kākahi. Work in steeper gradient streams (eg culverts 14, 15 and 21) are more likely to affect species including banded kōkopu, longfin eel, redfin bully and kōura, which can access these steeper catchments.
Ephemeral and intermittent streams with steep gradients along the route have limited fish habitat because of their small size and shallow water. Kōura may be present at these sites but other fish are likely to be absent or in low abundance (as found when intermittent tributaries to the Mimi River were electro-fished).
4.2.1.1 Mitigation
The direct effect of earthworks on large stream fauna (ie fish, kōura and kākahi) can be considerably minimised and mitigated by implementing Fish Recovery Protocols prior to draining, diverting or excavating streams. These should be applied in a risk based way, so that more intensive effort is applied to streams that are more likely to have ‘At-Risk’ species present, or high abundance of fish due to the type of habitat present.
Fish recovery is seldom 100% effective and techniques likely electro-fishing, netting and trapping have inherent risk of fish mortality and injury. These risks can be reduced by the choice of equipment and using good techniques, but cannot be eliminated. The fish recovery technique that has the least risk to fish and is often most effective is allowing the voluntary escape of fish as an area is dewatered. But this is not possible in every situation and often other fish recovery techniques also need to be used.
The purpose of the Fish Recovery Protocols (FRP) is to describe the methods that will be undertaken to minimise direct effects of construction on fish, kōura and kākahi (freshwater mussels) in waterways affected by the Project. It should cover procedures and locations for:
recovery of fish prior to instream works, rescue of fish from any spoil, relocation of fish, and reporting.
Assessment of Ecological Effects – Freshwater Ecology | Technical Report 7b Page 36
4.2.2 Potential sedimentation from earthworks and construction 4.2.2.1 General effects of sediment in streams
The primary ecological concern regarding sediment in discharges is not so much the change in clarity of water but instead deposition of sediment on the stream beds. Most fish species, with the exception of very sensitive species such as banded kōkopu, are tolerant of high levels of suspended sediment, but many taxa are affected by a combination of other environmental changes associated with high loadings of suspended solids.
Banded kōkopu reduce feeding and show avoidance behaviour when water turbidity is over 25 Nephelometric Turbidity Units (NTU) (Richardson et al. 2001), but numerous studies have shown that sublethal turbidity have little direct effect on most other fish species (Rowe et al.2002). Rowe et al. (2002) found that the supposedly ‘sensitive’ invertebrate and fish taxa were tolerant of very high levels of turbidity (over 24 hours), and even repeated exposures to 1000 NTU had no adverse effects on their survival. They concluded that ‘their absence from urbanised catchments and their relative scarcity in turbid rivers and streams is not caused by turbidity per se, but most likely reflects a combination of other environmental changes associated with high loadings of suspended solids.’
The main ways which suspended sediment affects aquatic macroinvertebrate abundance and diversity is:
• smothering and abrading; • deposition reducing their periphyton food supply or quality; and • deposition reducing available interstitial habitat.
Moreover, sediment deposition can alter substrate composition and change substrate suitability for some taxa (Wood and Armitage 1997). These effects persist long after a rain event has stopped.
4.2.2.2 Sediment in streams around Mt Messenger
Fine sediment is a typical feature of the substrate in streams around Mt Messenger. Low gradient sections of the Mangapepeke Stream and Mimi River were predominantly silt (eg 66% silt at site E7, >95% silt at sites E2 and E3). As streams become steeper, gravels and cobbles become more common but even steep forested sections (eg E4, E5, E6, Ea13) have a relatively high cover of fine sediment considering the low pressures in the catchment (see Table 3.2).
The reason for the relatively high sediment cover in streams is the papa mudstone geology. This is a soft rock and the gravel and cobbles are readily crushed to silt by hand. Small slips were common even in bush catchments and stream bank erosion is common in areas of pasture. High sediment loads appear to be a natural feature of these streams, but in the absence of mitigation measures land disturbance can easily cause accelerated erosion and sedimentation (see Figure 4.2).
The stream most likely to be sensitive to additional sedimentation is the tributary to the Mimi River at E6 and the downstream swamp forest. The substrate in this section of stream

Assessment of Ecological Effects – Freshwater Ecology | Technical Report 7b Page 37
is predominantly gravels and small cobbles. Downstream of site E6 is a pristine example of kahikatea swamp maire swamp forest (Figure 4.1). Although the streams in the swamp forest have fine sediment, their deep and often narrow morphology could be changed by excessive sedimentation. Also, banded kōkopu, which is more sensitive to high turbidity than most native fish, were found at sites E6 and the swamp forest streams.
The kahikatea swamp forest is buffered by a raupo (Typha orientalis) reedland and rautahi (Carex geminata) swamp. This naturally filters sediment entering the swamp forest during floods. Nevertheless, the high value of the swamp forest and the extent of work occurring upstream means that extra care should be taken with Erosion and Sediment Control (E&SC) upstream of the swamp forest. If an extreme event causes a failure of E&SC measures and significant sediment discharge occurs, then monitoring should be undertaken to confirm if sedimentation affected the kahikatea swamp forest (e.g. fish, channel morphology, vegetation). In the unlikely event that the Project does cause adverse effects within the kahikatea swamp forest then further biodiversity offsets may be required in addition to what is described in this report. This is also discussed in Technical Report 7a (Volume 3 of the AEE).
Other sections where particular care will be needed with E&SC is bridge works are Ea20 and the fill section at Ea21 - both upstream of kahikatea swamp maire swamp forest. Care should also be taken upstream of E4 because the Mangapepeke Stream substrate at this point is still dominated by gravels and cobbles.
4.2.2.3 Mitigation
Accelerated erosion and sedimentation can be minimised and mitigated by ensuring good Erosion and Sediment Control (E&SC) practices. The approach to E&SC for various activities is discussed in the Construction Water Assessment Report (Technical Report 14, Volume 3 of the AEE). This includes measures to avoid excessive reduction of pH caused by any flocculants used in the settling ponds. Some sediment is likely to be discharged from areas of works during rainfall events, but will generally occur when the streams are under higher flows and receiving sediment from other sources in the catchment.
There will also be a period during the early stages of construction when access tracks will be cleared in order to bring plant to the sites where long-term sediment control ponds will be constructed. During this period, there is greater risk of sediment release. The Project will manage this risk by working (to the extent possible) only in the dry and not adjacent to watercourses, minimising works areas, and installing “interim” ponds and traps (which will be to lower than normal design standard for long-term sediment control ponds).
Monitoring can be undertaken to assess the effectiveness of E&SC and whether there is any excessive sedimentation of waterways during construction. After implementing mitigation, the overall level of effect from sedimentation is expected to be ‘low’ for all stream types/area (Table 4.3).
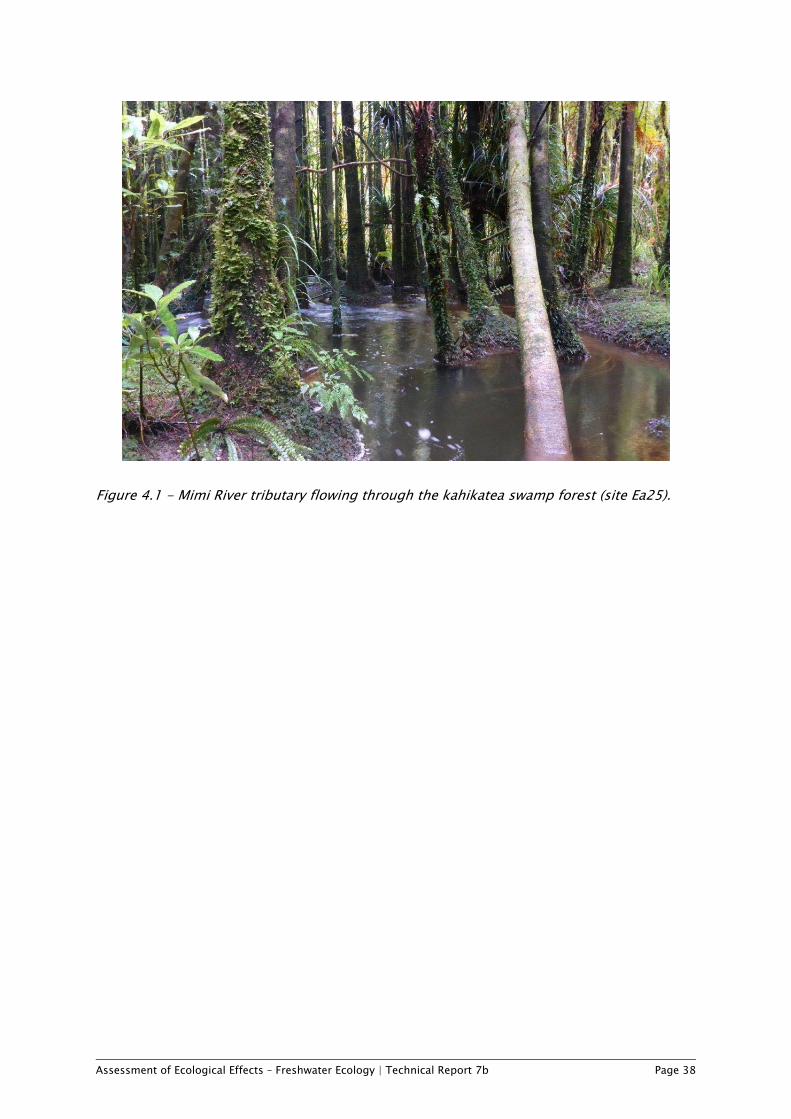
Assessment of Ecological Effects – Freshwater Ecology | Technical Report 7b Page 38
Figure 4.1 - Mimi River tributary flowing through the kahikatea swamp forest (site Ea25).

Assessment of Ecological Effects – Freshwater Ecology | Technical Report 7b Page 39
Figure 4.2 - Some sources of sediment to streams around Mt Messenger. Top: a landslide in a tributary downstream of the Project’s route (38.898097°, 174.576161°). Middle: sedimentation in a forested headwater of Mangapepeke Stream west branch (site N7, Hamill)

Assessment of Ecological Effects – Freshwater Ecology | Technical Report 7b Page 40
4.2.3 Potential water quality effects from vegetation clearance Vegetation clearance can have a number of potential effects on nearby streams. Felling and removal of trees can expose soil, make it more prone to erosion and cause sedimentation, the effects of which are discussed above. In addition, the accumulation or storage of sawdust, chip or mulch near or over waterways can cause serious water quality effects if it occurs.
The bulk storage of woodchip and wood residue can produce leachate with a high Biological Oxygen Demand (BOD) as well as organic dissolved organic matter that promotes the growth of heterotrophic organisms (eg bacterial mats and ‘sewage fungus’). Both the BOD load and heterotrophic growths deplete dissolved oxygen from the water and sediments, with consequent adverse effects on aquatic life.
Leachate from storage of wood residue can also leach potentially toxic compounds in the form of tannins, phenols, and resin acids. The toxicity of these compounds tends to reduce with increasing pH (Samis et al. 1999).
The effect on streams of woodchip residue from vegetation clearance depends on the amount stored, proximity to waterways, size of the waterways and mitigation. Moderate amounts of woodchip beside a stream has negligible effects and is commonly used to positive effect as part of restoration. Similarly, small amounts of woodchip entering a stream will have negligible adverse effects. However, in situations where vegetation clearance causes piles of woodchip to cover a waterway, the effect on the aquatic life can be devastating, with large loss of invertebrate and fish life downstream until sufficient reaeration or dilution occurs.
The Project requires a large amount of vegetation clearance. In the absence of good practice there would be a high potential risk of vegetation clearance causing adverse water quality effects, particularly in small waterways with a forest catchment. Fortunately, the adverse effect of vegetation clearance and wood residue can be avoided and minimised by ensuring good management practice.
4.2.3.1 Mitigation
A Vegetation Clearance Protocol should be prepared, which includes procedures for minimising the area and duration of soil exposure from vegetation clearance, minimising the volume of vegetation to be mulched, locating wood residue piles with an appropriate separation distance from any waterways, and minimising potential leachate from these piles.
The protocol should seek to minimise the amount of wood that is mulched and set it aside for later use in rehabilitating the site and streams. A risk based approach is appropriate for managing mulch taking into account the size of the stockpile, proximity to watercourses, topography and the duration of stockpiling. It should be noted that coarse woody debris is an important part of stream habitat, while it is excessive amounts of fine material like mulch that can cause adverse effects to watercourses.
Assessment of Ecological Effects – Freshwater Ecology | Technical Report 7b Page 41
If it is not practical to prevent piles of wood chip entering a stream that will eventually be culverted, then a culvert should be installed prior to the vegetation clearance to avoid potential effects on water quality.
If vegetation clearance adjacent to streams occurs prior to fish recovery then care is needed to ensure direct effects on the stream are minimal and logs and branches do not prevent access to the stream.
4.2.4 Potential water quality effects from concrete Water that comes in contact with unset concrete, concrete fines, concrete dust or concrete washings can become highly alkaline. If this runoff enters receiving waters untreated it can have adverse effects on aquatic life. There is a wide range of sensitivities of freshwater fish and invertebrates to pH, but most aquatic invertebrates and fish are tolerant to pH in the range of 6 – 9, and this range was proposed as a possible national bottom line (Davies-Colley et al. 2013). Causing pH to extend outside this range has the potential to adversely affect aquatic ecosystems and is likely to change some geochemical processes. Many native fish species show avoidance of pH values below 6.5 (West et al. 1997). The ANZECC (2000) guidelines recommend that discharges causing unnatural pH changes of more than 0.5 units should be investigated.
Concrete will be poured in a number of locations along the route, but particularly near the tunnel and for the bridge supports near site Ea20. The risk of concrete affecting stream water quality is low because the areas affected are limited in scale, are not directly in water and the potential effect of concrete on stream water quality will be minimised and mitigated by capturing and treating any runoff. This is described in the Construction Water Assessment Report (Technical Report 14, Volume 3 of the AEE).
4.2.5 Short term fish passage 4.2.5.1 Fish migration
Many New Zealand fish are diadromous and need to migrate between the freshwater and the sea in order to complete their life-cycle. Some populations can become landlocked but often mimic diadromous behaviour, but in freshwater. Maintaining fish passage upstream and downstream is important to allow fish populations to be sustainable and recruit. The timing of migration is often associated with environmental conditions such as temperature, rainfall, stream flow or tides. Upstream migrations may also be delayed by large floods.
The timing of fish migration and spawning is shown as a calendar in MPI (2015). The upstream migration period for migratory fish present in the Mimi River and Mangapepeke Stream span most of the year (August to April inclusive) however, for most of the species the peak migration occurs in spring to early summer (August to December). The period of peak upstream migration of each migratory species is: banded kōkopu (September to October), giant kōkopu (November), inanga (August to November), redfin bully (November to March6), longfin eel (December to March). Excluding works during a migration period can be 6 Hamer (2007) reports the peak upstream migration period for redfin bully as November to December.
Assessment of Ecological Effects – Freshwater Ecology | Technical Report 7b Page 42
used to mitigate effects, but is often not practical when dealing with multiple species. Furthermore, it is not necessary if alternative mitigation strategies are used. These are discussed below.
4.2.5.2 Potential effects of the Project
Upstream fish passage could potentially be restricted for a short period during construction when culverts are installed and water is flowing through any temporary diversion pipes. If restrictions to fish passage occur for only a few days the adverse effect on fish communities will be negligible. However, large amounts of fill are required on either side of the tunnel (ie upstream of sites E5 and E6), and the process of filling and creating a clean water diversion may take several months. A temporary culvert will be installed to carry water under the fill until the clean water diversion is created on top of the fill and permanent culverts installed. This could adversely impact one season of recruitment if it occurs during an upstream migration period and the temporary culvert does not allow adequate fish passage. The adverse effect will be greater for the upper Mangapepeke Stream because there is a larger upstream catchment beyond the area of works with more potential fish habitat.
The magnitude of effect of restricting upstream migration to about 50ha of catchment for a season is likely to be ‘low’. Using the EcIA approach a ‘low’ magnitude of effect on a system with ‘high’ ecological value results in a ‘low’ overall effect. Nevertheless, mitigation measures can be taken to reduce this effect.
Installing new culverts and extending existing culverts may be required for access tracks. Some of these culverts will be removed at the end of the construction period. In the absence of fish passage, they could restrict migration and recruitment for several years. This potential effect should be avoided by installing the culverts required for access tracks so as to allow for fish passage where fish migration and recruitment is identified.
4.2.5.3 Mitigation
Measures should be implemented to mitigate the effects of reduced fish passage during the construction period from temporary culverts used in large areas of fill near the tunnel. Ways to mitigate this short term effect include trap and transfer or placing spat rope through the culvert. Spat rope can facilitate the upstream migration of juvenile climbing species likely to be present in the stream, ie banded kōkopu, longfin eel and redfin eel. Waterfalls form a natural barrier to non-climbing fish species in these sections, and spat rope (as opposed to baffles) is an adequate approach to address a short-term effect.
4.2.6 Short term loss of stream habitat Streams will need to be diverted or culverted at multiple locations for the period of construction, but will be restored to a stream at the completion of works. These crossings will be removed after the end of the construction period, so their effect on stream habitat will be short-term. Nevertheless, there will be a loss of stream functions during the construction period. The SEV values of the lower Mangapepeke Stream is currently about 0.57 (moderate), in the sections being piped the SEV will reduce to about 0.23 while the pipes are in place. At the end of the construction period the pipes associated with temporary

Assessment of Ecological Effects – Freshwater Ecology | Technical Report 7b Page 43
access tracks will be removed and the stream channel and margin restored to their original (or better) condition.
The effect of access tracks on the Mangapepeke Stream has been minimised by following the existing access track where possible and rationalising stream crossings. Their effect will also be mitigated by ensuring fish passage as discussed above. However, the short-term loss of stream values requires offset compensation.
The amount of offset required to achieve ‘no net loss’ of stream habitat due to short-term effects is included within the overall compensation calculations (see discussed below).
4.2.7 Water takes for dust suppression 4.2.7.1 Background on water takes
Water takes can potentially affect aquatic life by changing the available habitat (eg wetted width, depth and velocity) and by changing physio-chemical water quality (eg water temperature, dissolved oxygen, and nutrients). In some cases, the water intake itself has potential to entrain and strand fish where intake velocities are high and /or barriers are not used.
The risk of the abstraction causing adverse effects depends largely on the stream flow relative to the take, its duration and frequency, the stream morphology and the species present. A stream with riparian shade, a U-shaped morphology and deep pools is less sensitive to water takes than unshaded streams with a wide, shallow morphology and few pools.
The draft guidelines for ecological flows (Beca 2008) notes that “an abstraction of up to 10% of the mean annual low flow (MALF) is barely measurable and therefore unlikely to result in adverse effects on the stream. Abstraction of up to 20% of MALF is unlikely to result in significant biological effects in lake- or spring-fed streams or in streams with frequent floods and freshes, such as those draining mountainous regions exposed to the prevailing westerly winds” (Beca 2008). One way to protect flows is to base it on historical flow events (eg setting a minimum low flow as 90% of the 7-day MALF); another is to adjust the total amount of water to be extracted from the river with flow, such as to allow the abstraction of 10% of the flow at any one time.
4.2.7.2 Effects of water takes for dust suppression
The Project is seeking two water takes for the purpose of dust suppression. These are:
up to 150m3/day from the Mimi River near the southern extent of the Project area with a catchment area of about 978ha; and
up to 300m3/day from the Mangapepeke Stream. The location will be near the northern extent of the designation either about 50m upstream of the confluence with the west branch (catchment area of about 330ha) or just downstream of this confluence (catchment area to 683ha).
There is no reliable hydrological information near the Project area that can be used to confidently estimate low flows in the Mimi River or Mangapepeke Stream. In the absence of
Assessment of Ecological Effects – Freshwater Ecology | Technical Report 7b Page 44
this information, it is proposed that water takes are restricted to no more than 10% of the flow at the time of the take.
For practical purposes it is proposed to use water level as a proxy for flow; thus a condition might read, “…no more than 20% change in water depth, measured on a staff gauge located in a run and measured at a time when unaffected by the take”. Water depth in runs should provide a reasonable proxy for flow in the lower Mangapepeke Stream and Mimi River because the stream morphology is U-shaped and the gradient is relatively flat. Furthermore, in these types of streams, water depth is more directly relevant to effects on fish habitat than flow.
The water intakes will need to be appropriately designed to exclude fish. In particular the screen mesh size will need to be less than 3mm (side of square) and the surface area sufficiently large so that water velocities through the intake are less than 0.12 m/s (see Jamieson et al. 2007).
4.3 Long term / permanent effects 4.3.1 Fish passage 4.3.1.1 The need for fish passage
Maintaining fish passage upstream and downstream is important to allow upstream fish populations to be sustainable. Most fish in the catchments are diadromous, requiring migration to and from the sea as part of their life cycle. Kōura are not diadromous but maintaining passage for kōura is still important to avoid isolated and fragmented populations.
Near the headwaters of both catchments, waterfalls and cascades form natural barriers to non-climbing fish species like inanga. However, climbing fish and invertebrate species such as longfin eel, banded kōkopu, redfin bully and kōura are often found above waterfalls (eg Mangapepeke Stream west branch in Hamill 2017).
Poor culvert design can restrict fish migration. Often this occurs as a result of culverts being perched, the water flowing too fast, too shallow, or as laminar flow with insufficient roughness. This becomes a more significant issue when fish access is restricted from larger upstream catchments.
4.3.1.2 Effects of the Project
The Project involves installing 21 new culverts. This may involve replacing or extending existing culverts. Most of the culverts will be about 25 to 40m long but near the headwaters the proposed culverts are about 100m to 210m long (eg at sites Ea16, Ea17 and Ea19) (Table 2.1, Figure 4.3).
12 of the 21 culverts will have a grade of about 1% or less (1:100). In most cases fish passage will be provided through these by ensuring the culvert invert is set below the stream bed and installing baffles at regular intervals (eg one every 10m for flexible iris baffles). Culvert 15 (site Ea16) has a low gradient (1%) but will require particular attention to
Assessment of Ecological Effects – Freshwater Ecology | Technical Report 7b Page 45
ensure good fish passage through it because it will be long (210m) and has a reasonably large upstream catchment (ca. 50 ha).
Four culverts will have a moderately steep grade of about 3 to 4% (1:30 to 1:25) (culverts 5, 7, 8, and 16). These culverts will have baffles to ensure fish passage with baffle spacing of about one every 2.5m for flexible iris baffles.
The culvert proposed for site Ea13 (culvert 12) has a 7% grade (ca. 1:14). This is steep but fish passage can still be provided by use of closely spaced baffles (eg every 1.4m spacing).
Four culverts will have very steep grades of 14% to 17% (ca. 1:7 to 1:6) (sites Ea12, Ea14, Ea15, and Ea21 at culvert id 11, 13, 14, and 17 respectively). One of these culverts (site Ea15) is long (117m). In order to provide fish passage through these baffles (eg iris baffles) would need to be very closely spaced (eg <1m). Spat rope may need to be used in combination with the baffles.
All of these waterways with steep gradient culverts have small catchments (1.6ha, 1.7ha, 5ha and 3ha respectively), all except site Ea12 have existing fish barriers in the form of large waterfalls (sites Ea14 and Ea15), or are perched culvert under the existing road (site Ea21) (Figure 4.4). Relying on spat rope to provide fish passage on new built culverts is not ideal, but is adequate when used with baffles and in the context of the limited upstream habitat and existing barriers.
Fish passage is not being provided for Culvert 2, 10 and 13 (sites Ea2, Ea11, and Ea14 respectively). These will be downstream of cut-faces and the inlet will be manholes with a scruffy dome lid. These all have very small catchments (<2ha) and are likely to be seasonally intermittent or ephemeral. Fish passage to sites Ea1 and Ea2 is currently restricted by an existing manhole (Figure 4.4), and fish passage to site Ea14 is restricted by a 12m high waterfall. All of these small waterways have a steep grade and shallow water that offers little, if any, fish habitat upstream of the alignment. Kōura may be present but probably low abundance due to the shallow water. Kōura are strong climbers and passage for them could be provided by hanging spat rope over conveyer-belt type material through the manhole. The abundance or absence of fish or koura in these particular intermittent streams should be confirmed to assist with decision of using spat rope.
The overall residual effect of the Project on fish passage, after mitigation, is expected to be ‘negligible’ to ‘low’ for those designed as steep culverts and scruffy domes. In some cases, the proposed fish passage is less than ideal but the impact is limited due to existing fish barriers (waterfalls), the small stream size and limited habitat suitable for fish upstream (Table 4.4). Options for designing fish passage through culverts are discussed below.
4.3.1.3 Fish passage provision options
Bridges and arch culverts have less effect on streams than pipe culverts and ensures reliable fish passage. However, these options are not always practicable. The next best option for ensuring good fish passage for low gradient streams, is to over-size the culvert by about 10 to 20%, place it with a relatively flat gradient (ie less than 0.5%), and ensure the downstream invert is below the level of the stream bed (about 20% of culvert diameter). This allows a natural bed material to form within the culvert and helps ensure sufficient water depth.
Assessment of Ecological Effects – Freshwater Ecology | Technical Report 7b Page 46
If there is a culvert apron it should be constructed to retain water to a depth of about 100mm (or more). This can be done by inserting the culvert invert below the streambed and/or constructing a pool and low rock weir (eg V-vane) downstream of the culvert and apron (Roisgen 2006, NZ Fish Passage Advisory Group 2015). Good outlet design can not only maintain fish passage but also provide habitat by retaining water depth, pools and diverse hydrology.
Installing habitat devices in the low gradient culverts on the larger streams (eg >25 ha) would help mitigate their effect on fish habitat. These are constructed habitat within stream banks that provides cover for eel and other fish. There is little value in using fish habitat devices in culverts associated with very small waterways due to the low water levels. Habitat devices can take multiple forms. Fish tunnel houses can be bolted to the culvert base or sides; or ‘tuna town houses’ can be installed in the banks of outlet structures.
Culverts with steeper grades will require baffles to slow water velocity and allow for fish passage. The baffles also help retain water depth within the culvert during base flow conditions. Spat rope can be a valuable fish passage solution for climbing species where baffles are not practical, e.g. in very steep gradient culverts where other solutions are not practicable. Guidance for their use is provided by David et al. (2014).
There are many options for baffle design. Cuboid spoiler type baffles are well proven for providing fish passage for grades up to 2-3%. They need to be placed along the length of the culvert (Boubée et al. 2000). Flexible iris baffles are also effective at providing fish passage when appropriately spaced and have additional benefits of being very robust, holding back water and creating micro habitats.
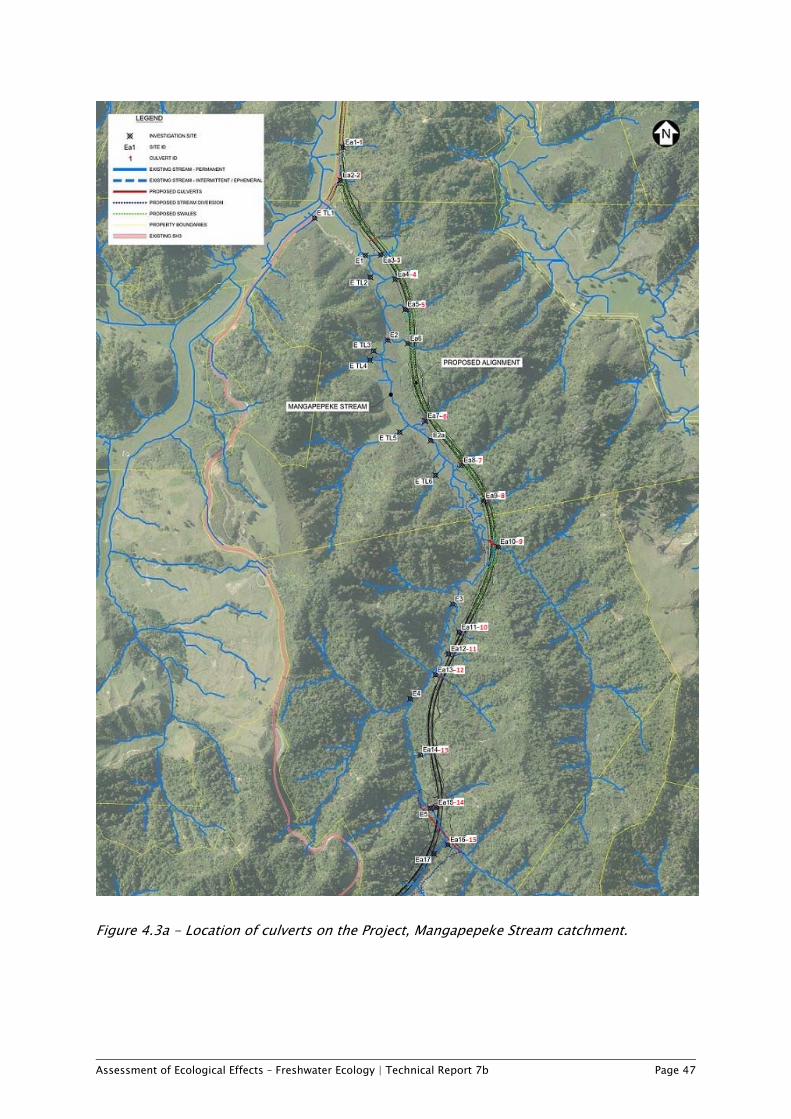
Assessment of Ecological Effects – Freshwater Ecology | Technical Report 7b Page 47
Figure 4.3a - Location of culverts on the Project, Mangapepeke Stream catchment.

Assessment of Ecological Effects – Freshwater Ecology | Technical Report 7b Page 48
Figure 4.3b - Location of culverts on the Project, Mimi River catchment.

Assessment of Ecological Effects – Freshwater Ecology | Technical Report 7b Page 49
Figure 4.4 - Fish barriers on small intermittent streams from the current SH3. Site Ea1/Ea2 (top) site Ea21 (bottom) (1 August 2017). Limited fish habitat upstream of these barriers reduces their overall effect on fish populations.
Assessment of Ecological Effects – Freshwater Ecology | Technical Report 7b Page 50
4.3.2 Loss of stream habitat and functions The Project will require installing or extending culverts on 21 waterways, diverting three small, intermittent waterways to swales and three larger stream diversions (sites Ea10, E5, Ea17/18 and E7). This will result in the loss of stream ecological function and values.
The amount of stream affected by the permanent footprint of the Project is 3,470m of length and 3,242m2 of stream habitat. About two thirds of the affected stream length is in the Mangapepeke catchment and one third in the Mimi catchment. About half the affected stream length is in pristine condition (an SEV score >0.9), and most (84% by length and 63% by count) of the affected streams are permanently flowing, perennial streams7 (Table 4.5).
The effect can be mitigated by ensuring fish passage and use of habitat devices in and around the culverts, nevertheless, this is a large scale, semi-permanent loss of moderate to high quality stream habitat, functions and values. It constitutes a very high adverse effect that requires offset as part of a compensation package.
The SEV approach was used to calculate the amount of offset compensation required for the loss of stream values. This accounted for the loss of potential stream values from the permanent footprint of the road and fill areas, as well as short-term loss from access tracks, stormwater ponds or stream diversions. It incorporated a multiplier to account for time lags associated with establishing riparian vegetation, and by using stream area placed more weight on the loss of larger streams which, to some extent, provide more habitat for fish than very small or intermittent streams.
The SEV approach calculated that 8,724m2 of stream area is required for restoration in order to offset or compensate for the loss in stream values. This restoration is in addition to creating stream diversions with SEV values of moderate to high ecological condition. This restoration could consist of riparian planting to improve the current stream condition.
In calculating offset compensation, realistic potential outcomes for restored streams using good design and implementation was assumed. It is important that ecological design principles are used in the final design and implement. Ecological Design Principles should be developed to guide the refinement of stream diversion designs. A Stream Restoration Plan will be developed as part of the Ecology and Landscape Management Plan (ELMP) to guide restoration and improve certainty that the assumed outcomes will be achieved.
There remains some uncertainty about the final design. The amount of offset required to achieve ‘no net loss’ of stream habitat may change with modifications in the designs and better understanding of what can be achieved with stream diversions. For example, ensuring higher quality stream diversions near the tunnel would result in less impact, lower ECR values and less offset being required. The amount of offset required was based on the designs available in the AEE drawing set; the amount of offset to achieve ‘no net loss’ of stream habitat should be recalculated if there are substantive changes to designs that affect streams.
7 Perennial streams were defined for this purpose as streams with a catchment area >5ha.
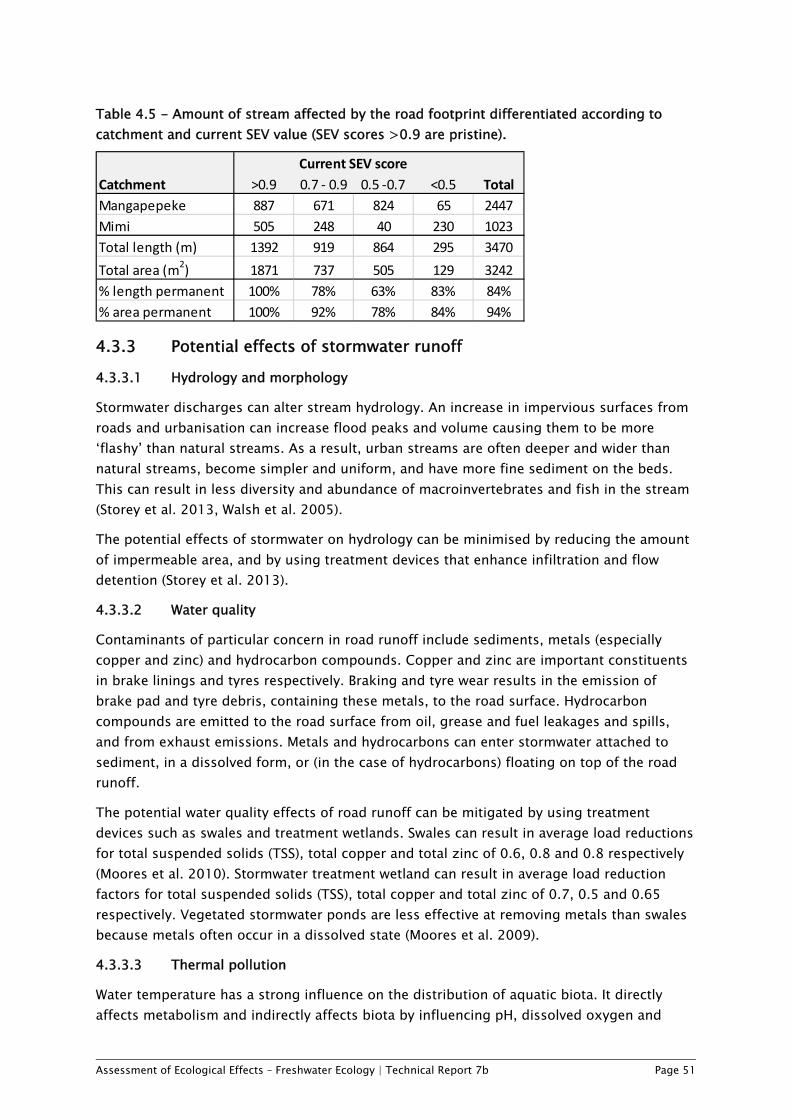
Assessment of Ecological Effects – Freshwater Ecology | Technical Report 7b Page 51
Table 4.5 - Amount of stream affected by the road footprint differentiated according to catchment and current SEV value (SEV scores >0.9 are pristine).
4.3.3 Potential effects of stormwater runoff 4.3.3.1 Hydrology and morphology
Stormwater discharges can alter stream hydrology. An increase in impervious surfaces from roads and urbanisation can increase flood peaks and volume causing them to be more ‘flashy’ than natural streams. As a result, urban streams are often deeper and wider than natural streams, become simpler and uniform, and have more fine sediment on the beds. This can result in less diversity and abundance of macroinvertebrates and fish in the stream (Storey et al. 2013, Walsh et al. 2005).
The potential effects of stormwater on hydrology can be minimised by reducing the amount of impermeable area, and by using treatment devices that enhance infiltration and flow detention (Storey et al. 2013).
4.3.3.2 Water quality
Contaminants of particular concern in road runoff include sediments, metals (especially copper and zinc) and hydrocarbon compounds. Copper and zinc are important constituents in brake linings and tyres respectively. Braking and tyre wear results in the emission of brake pad and tyre debris, containing these metals, to the road surface. Hydrocarbon compounds are emitted to the road surface from oil, grease and fuel leakages and spills, and from exhaust emissions. Metals and hydrocarbons can enter stormwater attached to sediment, in a dissolved form, or (in the case of hydrocarbons) floating on top of the road runoff.
The potential water quality effects of road runoff can be mitigated by using treatment devices such as swales and treatment wetlands. Swales can result in average load reductions for total suspended solids (TSS), total copper and total zinc of 0.6, 0.8 and 0.8 respectively (Moores et al. 2010). Stormwater treatment wetland can result in average load reduction factors for total suspended solids (TSS), total copper and total zinc of 0.7, 0.5 and 0.65 respectively. Vegetated stormwater ponds are less effective at removing metals than swales because metals often occur in a dissolved state (Moores et al. 2009).
4.3.3.3 Thermal pollution
Water temperature has a strong influence on the distribution of aquatic biota. It directly affects metabolism and indirectly affects biota by influencing pH, dissolved oxygen and
Catchment >0.9 0.7 ‐ 0.9 0.5 ‐0.7 <0.5 Total
Mangapepeke 887 671 824 65 2447
Mimi 505 248 40 230 1023
Total length (m) 1392 919 864 295 3470
Total area (m2) 1871 737 505 129 3242
% length permanent 100% 78% 63% 83% 84%
% area permanent 100% 92% 78% 84% 94%
Current SEV score

Assessment of Ecological Effects – Freshwater Ecology | Technical Report 7b Page 52
algae growth. Richardson et al. (1994) assessed the upper and preferred temperatures of eight NZ fish species.
Shortfin eel was the species found to be most tolerant of warm water (preferring 26.9oC), whereas banded kōkopu, inanga and smelt preferred cooler water (preferring 16.1, 16.1, and 18.7 oC respectively). Olsen et al (2012) recommended maximum water temperatures to protect the most sensitive native species of 20oC for upland stream and 25oC for lowland streams. Temperature tolerance of fish is affected by the acclimatisation temperature, and a rapid increase in temperature can cause thermal shock (Herb et al. 2007).
Thermal pollution from stormwater can be reduced by reducing the amount of impermeable area, maximising infiltration (eg grass swales and infiltration trenches), using vegetated treatment wetlands and increasing shading (of the stream or treatment devices). Swale vegetation cools the first flush of stormwater. Vegetated treatment wetlands can mitigate thermal pollution by providing shading, evapotranspiration and infiltration. Wetlands also mitigate the thermal load by capturing small rain events (Young et al. 2013).
4.3.3.4 Effects of stormwater from the Project
The effect of stormwater on the water quality and hydrology of a receiving water largely depends on the relative volume of stormwater compared to the stream, contaminant sources in the catchment, and type of stormwater treatment.
The Project will increase the amount of impervious surface area in both the Mangapepeke Stream and Mimi River catchments, but in absolute terms the amount of impervious area will remain very low. Where stormwater ponds are planned in the lower Mangapepeke Stream the impervious surface will be about 2.4% of the catchment; while in the Mimi River at site Ea7 it will be 0.7% of the catchment after the Project completion (Table 4.6). This amount of impervious surface is very low in the context of an SEV assessment. Traffic volumes over the road are low-moderate, with annual average daily traffic volumes currently 2,364 increasing to 3,798 by 2037.
Stormwater from the road will be treated in swales and treatment wetlands situated near site E1 at the northern end and site E7 at the southern end of the Project extent (see stormwater design description in Volume 1 of the AEE, and the Drainage Layout drawings in Volume 2 of the AEE). These will be vegetated wetlands with a banded design to provide stormwater detainment and treatment.
The combination of the Project having a small impervious footprint relative to the catchment, stormwater treatment devices and low to moderate traffic volumes will result in the Project having only a small effect on hydrology, thermal pollution and water quality. In fact, there may be a net improvement in water quality from the construction of stormwater treatment wetlands that are not currently present on this section of the road.

Assessment of Ecological Effects – Freshwater Ecology | Technical Report 7b Page 53
Table 4.6 - The amount of impervious area in the catchment before and after the Project.
4.4 Mitigation and monitoring 4.4.1 Summary of mitigation Previous sections have discussed a range of mitigation measures to address potential effects of the Project. The key mitigation and management plans measures are summarised below; they are:
• Develop and implement Fish Recovery Protocols for the recovery, rescue and relocation of native fish.
• Minimise the effect on upstream fish passage of temporary culverts that will be required for more than a few days, ie temporary culverts associated with large areas of fill near the tunnel (tributaries Ea16 and Ea19). This can be done by installing spat rope through the temporary culverts.
• Provide fish passage through permanent culverts and stream diversions that is appropriate for the fish present in the stream. This should include:
o Use of arch culverts in large streams where practicable. o Where possible, and in low gradient streams, culverts should be installed with
a low gradient (eg <0.3%) should have their downstream invert below the stream bed by about 20% of the culvert diameter.
o On steeper grade culverts use baffles to retain substrate, slow velocities and provide turbulence. Flexible polymer iris baffles are likely to provide a robust option for most culverts.
o Only rely on spat rope for fish passage in steep gradient culverts where other solutions are not practicable and where natural barriers (waterfalls) restrict the upstream fish community to climbing species.
o Designing culvert outlets to provide a resting pool near the outlet and ensure at least 100mm of water depth is retained at culvert outlet and over the apron. This might be achieved using V-vanes (cross-vane) made from boulders.
• Install fish habitat devices within low gradient culverts on the larger streams (>25 ha) in order to mitigate their effect on fish habitat.
• Minimise disturbance of streams and riparian areas during construction. Where streams and riparian area are piped, diverted or disturbed by temporary works outside the Project footprint then the stream channel and riparian margin should be restored.
Site
catchment
area
ha ha % ha %
Mangapepeke Stream at SH3 road 330 2.03 0.61% 7.91 2.40%
Mangapepeke Stream at Ea10 149 1.61 1.08% 5.99 4.02%
Mimi River tributary at Ea26 221 2.44 1.10% 4.64 2.10%
Mimi River at E7 919 2.82 0.31% 6.20 0.67%
Impervious area
after Project
Impervious area
current
Assessment of Ecological Effects – Freshwater Ecology | Technical Report 7b Page 54
• Base the design of stream diversions on Ecological Design Principles. Preliminary and final stream designs should be prepared by experienced engineers, aquatic ecologist and landscape architects. This should include a description of stream width, morphology, form and riparian vegetation.
• Develop and implement a Stream Restoration Plan as part of the ELMP for stream diversions and stream affected short term by the works, including:
o Length of stream affected; o Long section and typical cross-sections for stream diversions with a
meandering form and in more steep, confined landscapes. These should be consistent with ecological design principles;
o Description of work to remove structures; o Description of riparian planting and minimum widths planted; o Timing of restoration work. Planting should occur as soon as practical after
earthworks being completed to reduce risks of erosion and avoid unnecessary delays in restoration; and
o Monitoring of implementation. • Effective implementation is key to achieving good restoration outcomes. An
experienced ecologist should be available to give advice and guidance during construction of the new stream channel.
• Monitor the success of implanted stream diversions to ensure they are tracking towards achieving the ecological values assumed the SEV.
• Implement the Construction Water Management Plan to minimise and mitigate the effects of erosion and sedimentation. Particular attention should be given to reduction potential effects on sensitive areas such as the Mimi Valley Kahikatea swamp forest (see also Ridley and Parackal 2017).
• A Vegetation Clearance Protocol should be prepared, this should include procedures for minimising exposed soil and erosion from vegetation clearance operations, location of wood residue piles away from any waterways, collection and treatment of any leachate from wood residue piles.
• Undertake baseline monitoring and ongoing monitoring during the construction period of water quality and fish at selected sites to assess the effect of construction works. The baseline water quality monitoring should characterise natural variation in sediment concentration or deposition that occurs within the streams.
4.4.2 Biodiversity Offset Biodiversity offsets can be used to achieve ‘no net loss’ or a ‘net positive gain’ where residual effects remain after applying a hierarchy of avoiding, minimising and mitigating the effects on ecology. They are measures to counterbalance any residual environmental effects.
Even with the mitigation set out above, the Project will result in a very high adverse environmental effect due to stream loss. The amount of stream restoration required to achieve sufficient biodiversity offset was calculated by using the SEV method. Based on current calculations the offset restoration must include:

Assessment of Ecological Effects – Freshwater Ecology | Technical Report 7b Page 55
• Restoration of 8,724m2 of stream habitat; and • Development of a Stream Restoration Plan as part of the ELMP to ensure use of
appropriate species and sufficient overall improvement of stream values at the restoration sites.
The approach used for calculating ECRs means that where a stream diversion is returned to its current condition or worse (eg near sites E5 and E6), then these lengths should not be counted with any offset package (i.e. it is rehabilitation not offset). However, if a stream section is restored to be substantially better than its current condition, then this length can be included as part of the offset package.
Areas chosen for offset should ideally be ‘on-site’ and within the same catchment, but in practice this is often challenging. If the offset streams are off-site then they should be a similar size and order. The Mangapepeke Stream and Mimi River upstream of the current SH3 have high potential for successfully improving stream values through riparian planting and restoration, subject to obtaining the necessary access rights. This is because the restoration can be contiguous with the forested headwaters, which helps ensure good water quality, a source of plant seed and wood, and more rapid colonisation by invertebrates and fish.
Restoration planting along streams is typically done along a strip of land to provide, for example, a 10m riparian margin. However, the Mt Messenger offset package will include other restoration planting and long-term pest control to act as biodiversity offset for effects on terrestrial flora and fauna. Applying the different offset compensation measures in the same location will provide synergistic benefits for streams. For example, planting additional stream width provides additional improvement in ecosystem functions, pest control operations can reduce streambank erosion and trampling of spawning sites. These synergistic benefits are hard to quantify but could work to provide a net positive outcome for the Mangapepeke Stream and Mimi River.
The amount of offset required is based on the designs available in the AEE drawing set. The amount of offset to achieve ‘no net loss’ of stream habitat should be recalculated if there are substantive changes to designs that affect streams.
4.4.3 Further investigations While sufficient data have been gathered to support this assessment, the following additional investigations are recommended to improve understanding of the potential adverse effects of the Project, and potential further mitigation measures:
• Additional fish surveys should be undertaken in the intermittent tributaries where the proposed culvert will have steep gradient or scruffy domes will be installed (ie Sites Ea2, Ea11, Ea12, Ea13, Ea14, Ea15 and Ea21). Surveys should occur spring / early summer. These will provide more confidence about whether fish and koura are present or absent from these sites and the proposed designs for fish passage.
• Undertake a morphological survey downstream of the proposed water takes on Mimi River and Mangapepeke Stream during base flow conditions. This will provide
Assessment of Ecological Effects – Freshwater Ecology | Technical Report 7b Page 56
information about the potential effects of the water takes if more than the proposed 10% of the flow is taken from each stream.
• The SEV calculations assumed that stream restoration for offset purposes would occur in the upper Mimi River and Mangapepeke Stream. These locations may not be available. If other sites are used for stream offset then there may need to be additional SEV surveys of the restoration sites and recalculate offset requirements.
• Consideration should be given to initiating early baseline monitoring of settleable sediment, particularly in the tributary to the Mimi River. This will better characterise the current sediment load upstream of the Kahikatea swamp forest. .
Assessment of Ecological Effects – Freshwater Ecology | Technical Report 7b Page 57
5 Conclusions The Project will affect 2,447m of stream in the Mangapepeke Stream catchment and 1,023m of stream in the Mimi River catchment. The impacted streams have moderate to high ecological values, and a diverse fish community.
The potential effects on streams during the construction period can be reduced and mitigated by implementing good practice with respect to erosion and sediment control, fish recovery, vegetation clearance, water takes and undertaking monitoring during the construction period. Similarly, many of the long-term effects from the road footprint can be minimised and mitigated by good culvert design to ensure fish passage, stormwater management, and design of stream diversions. Nevertheless, the piping and diversion of streams required by the Project will cause considerable loss of streams that, in the absence of a biodiversity offset, would constitute a very high adverse effect.
The SEV method calculated that to address the effects of stream loss will require restoration of 8,724m2 of stream habitat. Streams in the Mangapepeke Stream and Mimi River have good potential for successful restoration that could be used as a biodiversity offset to balance the effect from piping and diversions.
Overall, the effects of the Project on freshwater ecology can be appropriately managed and mitigated, and the residual loss of habitat can be adequately offset to result in ‘no net loss’ of stream values.

Assessment of Ecological Effects – Freshwater Ecology | Technical Report 7b Page 58
6 References ANZECC 2000. Australian and New Zealand Guidelines for Fresh and Marine Water Quality Vol. 1. Australian and New Zealand Environment and Conservation Council.
Beca 2008. Draft Guidelines for the Selection of Methods to Determine Ecological Flows and Water Levels. Prepared by Becca Infrastructure for Ministry of the Environment.
Boubée J, Williams E, Richardson J 2000. Fish passage guidelines for the Auckland region. Technical publication 131. Auckland, Auckland Regional Council.
Clapcott J 2015. National rapid habitat assessment protocol development for streams and rivers. Prepared for Northland Regional Council. Cawthron Report No. 2649. 29 p. plus appendices.
David, B. Hamer, M., Tonkin, J. Bourke, C. 2014. Appropriate use of mussel spat ropes to facilitate passage for stream organisms. Waikato Regional Council Technical Report 2014/29.
Davies-Colley R., Franklin P., Wilcock B., Clearwater S., Hickey C. 2013. National Objectives Framework - Temperature, Dissolved Oxygen & pH Proposed thresholds for discussion. Prepared for Ministry for the Environment by NIWA. NIWA Client Report No: HAM2013-056.
Environment Institute of Australia and New Zealand (EIANZ) 2015. Ecological Impact Assessment (EcIA) EIANZ guidelines for use in New Zealand: terrestrial and freshwater ecosystems. ISBN: 978-0-9805878-2-1
Goodman D. and McQueen S. 2013. Taranaki Area large galaxiid survey 2013. Unpublished report for the Department of Conservation, Taranaki Area Office
Goodman JM, Dunn NR, Ravenscroft PJ, Allibone RM, Boubee JAT, David BO, Griffiths M, Ling N, Hitchmough RA, Rolfe JR 2014. Conservation status of New Zealand freshwater fish, 2013. New Zealand Threat Classification Series 7.
Hamer 2007. The Freshwater Fish Spawning and Migration Calendar Report. Environment Waikato Technical Report 2007/11. Prepared for Environment Waikato.
Hamill K.D. 2017. Mt Messenger Bypass Investigation: Effect on stream values. Prepared for Opus International Consultants by River Lake Ltd.
Herb WR, Mohensi O, Stefan HG 2007. Heat export and runoff temperature analysis for rainfall event selection. Prepared by St Anthony Fall Laboratory for the Minnesota Pollution Control Agency. Project Report No. 283.
Jamieson D., Bonnett M., Jellyman D., Unwin M. 2007. Fish screening: good practice guidelines for Canterbury. Prepared for the Fish Screen Working Party. NIWA Client Report: CHC2007-092
Joy M, David B, Lake M 2013. New Zealand Freshwater Fish Sampling Protocols: Part one – wadeable rivers and streams. Massy University, Palmerston North.
Assessment of Ecological Effects – Freshwater Ecology | Technical Report 7b Page 59
Joy M 2007. A New Fish Index of Biotic Integrity using Quantile Regressions: the Fish QIBI for the Waikato Region. Environment Waikato Technical Report 2007/23. ISSN: 1172-4005
Ministry of Primary Industries (MPI) 2015. Freshwater Fish Spawning and Migration Periods. Prepared by NIWA for Ministry of Primary Industries. MPI Technical Paper No: 2015/17. ISSN No: 2253-3923
Moores J, Pattinson P, Hyde C 2009. Enhancing the control of contaminants from New Zealand’s roads: results of a road runoff sampling programme. New Zealand Transport Agency research report 395. 161p.
Neale M.W., Storey R.G., Rowe D.K., Collier K.J., Hatton C., Joy M.K., Parkyn S.M., Maxted J.R., Moore S., Phillips N. & Quinn J.M. 2011. Stream Ecological Valuation (SEV): A User’s Guide. Auckland Council Guideline Document 2011/001.
Neale M W., Storey R G, Quinn J L 2016. Stream Ecological Valuation: application to intermittent streams. Prepared by Golder Associates (NZ) Limited for Auckland Council. Auckland Council technical report, TR2016/023.
NZ Fish Passage Advisor Group 2015. Lessons Learnt 003. Placement of downstream rock weir and installation of culvert baffles to enable salmonid passage.
Olsen DA, Tremblay L, Clapcott J, Holmes R 2012. Water temperature criteria for native aquatic biota. Prepared for Auckland Council, Environment Waikato and Hawkes Bay Regional Council. Cawthron Report No. 2024. Auckland Council Technical Report 2012/036
Roisgen DL 2006. The cross-vane, W-Weir and J-Hook Vane structures (updated 2006), and their description, design and application for stream stabilization and river restoration. Wildland Hydrology. Colorado.
Rowe D., Collier K., Hatton C.; Joy M., Maxted J., Neale M., Parkyn S., Phillips N., Quinn J. 2008. Stream Ecological Valuation (SEV): a method for scoring the ecological performance of Auckland streams and for quantifying environmental compensations – 2dn Edition. Prepared by NIWA for Auckland Regional Council.
Rowe, D.K., A. M. Suren, M. Martin, J. P. Smith, B. Smith, E. Williams 2002. Lethal turbidity levels for common freshwater fish and invertebrates in Auckland streams. Auckland Regional Council Technical Publication Number 337. 37 p.
Richardson J, Boubee JAT, West D 1994. Thermal tolerance and preference of some native New Zealand freshwater fish. New Zealand Journal of Marine and Freshwater Research 28: 399-407.
Richardson, J.; Rowe, D.K.; Smith, J. 2001. Effects of turbidity on the upstream movement of migratory banded kōkopu (Galaxias fasciatus) in a stream. New Zealand Journal of Marine and Freshwater Research 35: 191-196.
Ridley G. and Parackal S. 2017. Construction water assessment report. Prepared for Mt Messenger Alliance.

Assessment of Ecological Effects – Freshwater Ecology | Technical Report 7b Page 60
Samis, S.C., S.D. Liu, B.G. Wernick and Nassichuk, M.D. 1999. Mitigation of fisheries impacts from the use and disposal of wood residue in British Columbia and the Yukon. Can. Tech. Rep. Fish. Aquat. Sci. 2296: viii and 91 p.
Schallenberg M., Kelly D., Clapcott J., Death R., MacNeil C., Young R., … Scarsbrook M. 2011. Approaches to assessing ecological integrity of New Zealand freshwaters (Science for Conservation No. 307). Wellington: Department of Conservation.
Stark JD, Boothroyd IKG, Harding JS, Maxted JR & Scarsbrook MR 2001. Protocols for sampling macroinvertebrates in wadeable streams. New Zealand Macroinvertebrate Working Group Report No. 1. Ministry for the Environment, New Zealand.
Stark J. D. 1985. A macroinvertebrate community index of water quality for stony streams. Water and Soil Miscellaneous Publication 87.
Stark J. D. 1993. Performance of the Macroinvertebrate Community Index: effects of sampling method, sample replication, water depth, current velocity, and substratum on index values. New Zealand Journal of Marine and Freshwater Research 27: 463–178.
Stark J.D. 1998. SQMCI: A biotic index for freshwater macroinvertebrate coded abundance data. New Zealand Journal of Marine and Freshwater Research 32: 55-66.
Storey RG, Neale MW, Rowe DK, Collier KJ, Hatton C, Joy M, Maxted J, Moore S, Parkyn S, Phillips N & Quinn J 2011. Stream Ecological Valuation (SEV): a revised method for assessing the ecological functions of Auckland streams. Auckland Council Technical Report 2011/009.
Storey R, Brierley G, Clapcott J, Collier K, Kilroy C, Franklin P, Moorhouse C and Wells R 2013. Ecological responses to urban stormwater hydrology. Prepared by NIWA for Auckland Council. Auckland Council technical report TR2013/033.
Young D, Afoa E, Meijer K, Wagenhoff A, Utech C 2013. Temperature as a contaminant in streams in the Auckland region, stormwater issues and management options. Prepared by Morphum Environment Ltd for Auckland Council. Auckland Council technical report, TR2013/044
Walsh CJ, Roy AH, Feminella JW, Cottongham PD, Groffman PM, Morgan II RP 2005. The urban stream syndrome: current knowledge and the search for a cure. Journal of the North American Benthological Society, 24(3): 706-723.
West D.W., Boubee J., Barrier R.F.G. 1997. Responses to pH of nine fishes and one shrimp native to New Zealand freshwaters. New Zealand Journal of Marine and Freshwater Research 31: 461-468.
Wood, P. J.; Armitage, P. D. 1997. Biological effects of fine sediment in the lotic environment. Environmental Management 21: 203-217.

Appendices Appendix A: National rapid habitat assessment protocol 62
Appendix B: Macroinvertebrate results 63
Appendix C: SEV calculations 65
Appendix D: Site Photos 68

Page 62
Appendix A: National rapid habitat assessment protocol

Page 63
Appendix B: Macroinvertebrate results
Table B1: Mt Messenger sites, 7-8 June 2017
TAXON
MCI
scoreE2 E3 E4 E5 E6 Mimi E7 Mimi
ACARINA 5 4
COLEOPTERA
Elmidae 6 20 213 18 36 10
Hydraenidae 8 2 16
Ptilodactylidae 8 4
Scirtidae 8 7 4
CRUSTACEA
Isopoda 5 12
Paracalliope fluviatilis 5 1040 370
Paraleptamphopus species 5 52
Paranephrops planifrons 5 1
Paratya species 5 1
Talitridae 5 4
DIPTERA
Aphrophila species 5 7
Austrosimulium species 3 200 720 33 2 120
Ceratopogonidae 3 4
Empididae 3 16
Eriopterini 9 20
Hexatomini 5 1 7
Orthocladiinae 2 20 100 7 2 1
Tanypodinae 5 1 1 1
Tanytarsini 3 40 1
EPHEMEROPTERA
Acanthophlebia species 7 1
Ameletopsis perscitus 10 1
Austroclima species 9 460 800 7 330
Coloburiscus humeralis 9 20 12 28
Deleatidium species 8 10 40 580 96 148 220
Ichthybotus species 8 4
Mauiulus luma 5 140 10
Neozephlebia scita 7 110 480 2 20 70
Nesameletus species 9 20 8 50
Zephlebia species 7 30 140 40 18 172 530
HEMIPTERA
Sigara species 5 10
HIRUDINEA 3 40
MEGALOPTERA
Archichauliodes diversus 7 7 6 1 1
MOLLUSCA
Lymnaeidae 3 1 20
Potamopyrgus antipodarum 4 420 9400 247 132 192 830
Sphaeriidae 3 20
NEMATODA 3 20 1
NEMERTEA 3 10 1
ODONATA
Antipodochlora species 6 1
Xanthocnemis zealandica 5 1 1
OLIGOCHAETA 1 30 120 1 40 1
PLATYHELMINTHES 3 1
PLECOPTERA
Acroperla species 5 40 153 98 64 30
Austroperla cyrene 9 4 8
Megaleptoperla species 9 20 20
Spaniocerca species 8 7
Zelandobius species 5 1 7 28
Zelandoperla species 10 4
TRICHOPTERA
Helicopsyche species 10 60 36
Hudsonema alienum 6 1 20 30
Hudsonema amabile 6 20 1 1
Hydrobiosella species 9 20
Hydrobiosis clavigera group 5 1 1
Hydrobiosis umbripennis group 5 1 1 1 1
Oecetis species 6 1 1
Orthopsyche species 9 1 4 96
Polyplectropus species 8 1 1 10
Psilochorema species 8 1 1
Pycnocentria species 7 10 1 2 10
Pycnocentrodes species 5 1
Triplectides species 5 10 80 7 10
Zelandoptila species 8 10
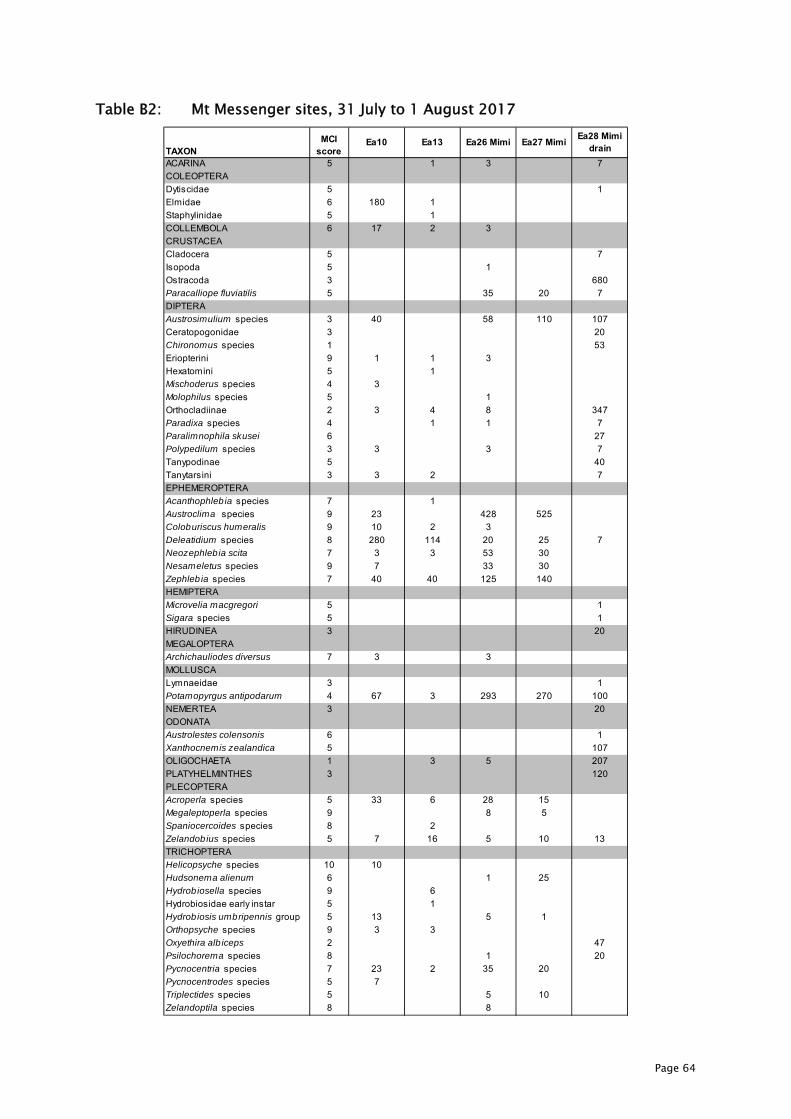
Page 64
Table B2: Mt Messenger sites, 31 July to 1 August 2017
TAXONMCI
scoreEa10 Ea13 Ea26 Mimi Ea27 Mimi
Ea28 Mimi drain
ACARINA 5 1 3 7
COLEOPTERA
Dytiscidae 5 1
Elmidae 6 180 1
Staphylinidae 5 1
COLLEMBOLA 6 17 2 3
CRUSTACEA
Cladocera 5 7
Isopoda 5 1
Ostracoda 3 680
Paracalliope fluviatilis 5 35 20 7
DIPTERA
Austrosimulium species 3 40 58 110 107
Ceratopogonidae 3 20
Chironomus species 1 53
Eriopterini 9 1 1 3
Hexatomini 5 1
Mischoderus species 4 3
Molophilus species 5 1
Orthocladiinae 2 3 4 8 347
Paradixa species 4 1 1 7
Paralimnophila skusei 6 27
Polypedilum species 3 3 3 7
Tanypodinae 5 40
Tanytarsini 3 3 2 7
EPHEMEROPTERA
Acanthophleb ia species 7 1
Austroclima species 9 23 428 525
Coloburiscus humeralis 9 10 2 3
Deleatidium species 8 280 114 20 25 7
Neozephlebia scita 7 3 3 53 30
Nesameletus species 9 7 33 30
Zephleb ia species 7 40 40 125 140
HEMIPTERA
Microvelia macgregori 5 1
Sigara species 5 1
HIRUDINEA 3 20
MEGALOPTERA
Archichauliodes diversus 7 3 3
MOLLUSCA
Lymnaeidae 3 1
Potamopyrgus antipodarum 4 67 3 293 270 100
NEMERTEA 3 20
ODONATA
Austrolestes colensonis 6 1
Xanthocnemis zealandica 5 107
OLIGOCHAETA 1 3 5 207
PLATYHELMINTHES 3 120
PLECOPTERA
Acroperla species 5 33 6 28 15
Megaleptoperla species 9 8 5
Spaniocercoides species 8 2
Zelandobius species 5 7 16 5 10 13
TRICHOPTERA
Helicopsyche species 10 10
Hudsonema alienum 6 1 25
Hydrobiosella species 9 6
Hydrobiosidae early instar 5 1
Hydrobiosis umbripennis group 5 13 5 1
Orthopsyche species 9 3 3
Oxyethira alb iceps 2 47
Psilochorema species 8 1 20
Pycnocentria species 7 23 2 35 20
Pycnocentrodes species 5 7
Triplectides species 5 5 10
Zelandoptila species 8 8
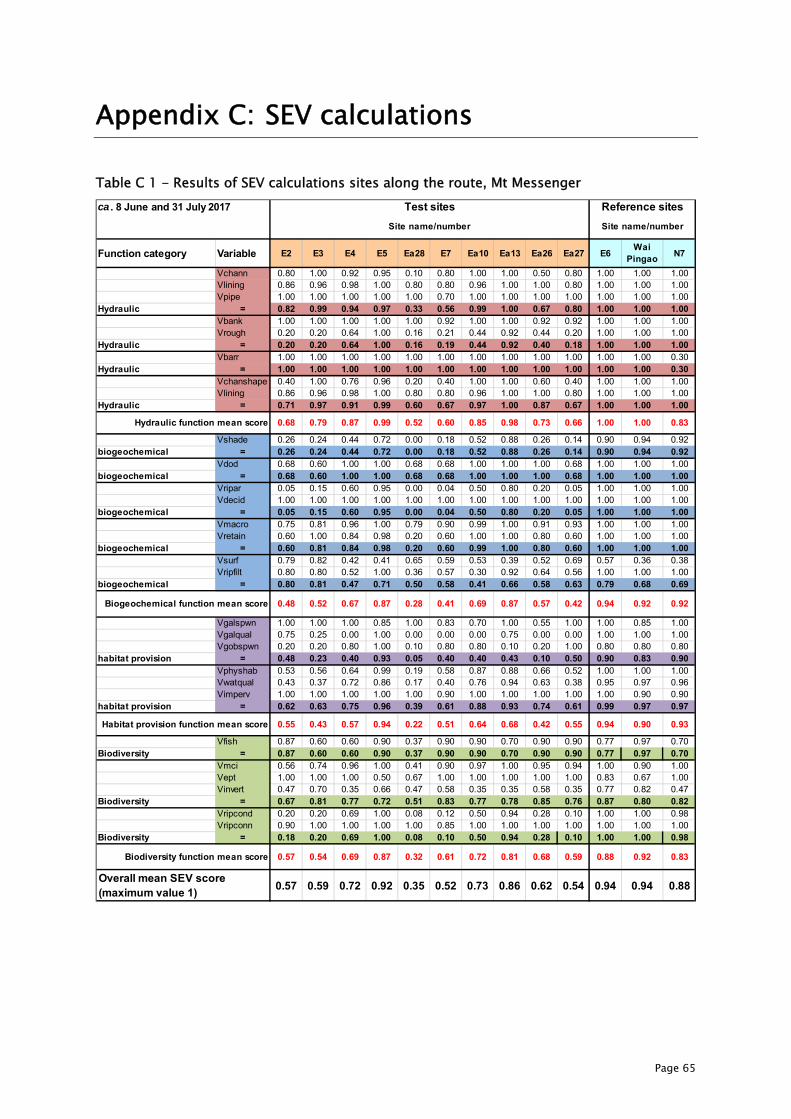
Page 65
Appendix C: SEV calculations
Table C 1 - Results of SEV calculations sites along the route, Mt Messenger
ca . 8 June and 31 July 2017
Function category Variable E2 E3 E4 E5 Ea28 E7 Ea10 Ea13 Ea26 Ea27 E6Wai
PingaoN7
Vchann 0.80 1.00 0.92 0.95 0.10 0.80 1.00 1.00 0.50 0.80 1.00 1.00 1.00Vlining 0.86 0.96 0.98 1.00 0.80 0.80 0.96 1.00 1.00 0.80 1.00 1.00 1.00Vpipe 1.00 1.00 1.00 1.00 1.00 0.70 1.00 1.00 1.00 1.00 1.00 1.00 1.00
Hydraulic = 0.82 0.99 0.94 0.97 0.33 0.56 0.99 1.00 0.67 0.80 1.00 1.00 1.00Vbank 1.00 1.00 1.00 1.00 1.00 0.92 1.00 1.00 0.92 0.92 1.00 1.00 1.00Vrough 0.20 0.20 0.64 1.00 0.16 0.21 0.44 0.92 0.44 0.20 1.00 1.00 1.00
Hydraulic = 0.20 0.20 0.64 1.00 0.16 0.19 0.44 0.92 0.40 0.18 1.00 1.00 1.00Vbarr 1.00 1.00 1.00 1.00 1.00 1.00 1.00 1.00 1.00 1.00 1.00 1.00 0.30
Hydraulic = 1.00 1.00 1.00 1.00 1.00 1.00 1.00 1.00 1.00 1.00 1.00 1.00 0.30Vchanshape 0.40 1.00 0.76 0.96 0.20 0.40 1.00 1.00 0.60 0.40 1.00 1.00 1.00Vlining 0.86 0.96 0.98 1.00 0.80 0.80 0.96 1.00 1.00 0.80 1.00 1.00 1.00
Hydraulic = 0.71 0.97 0.91 0.99 0.60 0.67 0.97 1.00 0.87 0.67 1.00 1.00 1.00
Hydraulic function mean score 0.68 0.79 0.87 0.99 0.52 0.60 0.85 0.98 0.73 0.66 1.00 1.00 0.83
Vshade 0.26 0.24 0.44 0.72 0.00 0.18 0.52 0.88 0.26 0.14 0.90 0.94 0.92biogeochemical = 0.26 0.24 0.44 0.72 0.00 0.18 0.52 0.88 0.26 0.14 0.90 0.94 0.92
Vdod 0.68 0.60 1.00 1.00 0.68 0.68 1.00 1.00 1.00 0.68 1.00 1.00 1.00biogeochemical = 0.68 0.60 1.00 1.00 0.68 0.68 1.00 1.00 1.00 0.68 1.00 1.00 1.00
Vripar 0.05 0.15 0.60 0.95 0.00 0.04 0.50 0.80 0.20 0.05 1.00 1.00 1.00Vdecid 1.00 1.00 1.00 1.00 1.00 1.00 1.00 1.00 1.00 1.00 1.00 1.00 1.00
biogeochemical = 0.05 0.15 0.60 0.95 0.00 0.04 0.50 0.80 0.20 0.05 1.00 1.00 1.00Vmacro 0.75 0.81 0.96 1.00 0.79 0.90 0.99 1.00 0.91 0.93 1.00 1.00 1.00Vretain 0.60 1.00 0.84 0.98 0.20 0.60 1.00 1.00 0.80 0.60 1.00 1.00 1.00
biogeochemical = 0.60 0.81 0.84 0.98 0.20 0.60 0.99 1.00 0.80 0.60 1.00 1.00 1.00Vsurf 0.79 0.82 0.42 0.41 0.65 0.59 0.53 0.39 0.52 0.69 0.57 0.36 0.38Vripfilt 0.80 0.80 0.52 1.00 0.36 0.57 0.30 0.92 0.64 0.56 1.00 1.00 1.00
biogeochemical = 0.80 0.81 0.47 0.71 0.50 0.58 0.41 0.66 0.58 0.63 0.79 0.68 0.69
Biogeochemical function mean score 0.48 0.52 0.67 0.87 0.28 0.41 0.69 0.87 0.57 0.42 0.94 0.92 0.92
Vgalspwn 1.00 1.00 1.00 0.85 1.00 0.83 0.70 1.00 0.55 1.00 1.00 0.85 1.00Vgalqual 0.75 0.25 0.00 1.00 0.00 0.00 0.00 0.75 0.00 0.00 1.00 1.00 1.00Vgobspwn 0.20 0.20 0.80 1.00 0.10 0.80 0.80 0.10 0.20 1.00 0.80 0.80 0.80
habitat provision = 0.48 0.23 0.40 0.93 0.05 0.40 0.40 0.43 0.10 0.50 0.90 0.83 0.90Vphyshab 0.53 0.56 0.64 0.99 0.19 0.58 0.87 0.88 0.66 0.52 1.00 1.00 1.00Vwatqual 0.43 0.37 0.72 0.86 0.17 0.40 0.76 0.94 0.63 0.38 0.95 0.97 0.96Vimperv 1.00 1.00 1.00 1.00 1.00 0.90 1.00 1.00 1.00 1.00 1.00 0.90 0.90
habitat provision = 0.62 0.63 0.75 0.96 0.39 0.61 0.88 0.93 0.74 0.61 0.99 0.97 0.97
Habitat provision function mean score 0.55 0.43 0.57 0.94 0.22 0.51 0.64 0.68 0.42 0.55 0.94 0.90 0.93
Vfish 0.87 0.60 0.60 0.90 0.37 0.90 0.90 0.70 0.90 0.90 0.77 0.97 0.70Biodiversity = 0.87 0.60 0.60 0.90 0.37 0.90 0.90 0.70 0.90 0.90 0.77 0.97 0.70
Vmci 0.56 0.74 0.96 1.00 0.41 0.90 0.97 1.00 0.95 0.94 1.00 0.90 1.00Vept 1.00 1.00 1.00 0.50 0.67 1.00 1.00 1.00 1.00 1.00 0.83 0.67 1.00Vinvert 0.47 0.70 0.35 0.66 0.47 0.58 0.35 0.35 0.58 0.35 0.77 0.82 0.47
Biodiversity = 0.67 0.81 0.77 0.72 0.51 0.83 0.77 0.78 0.85 0.76 0.87 0.80 0.82Vripcond 0.20 0.20 0.69 1.00 0.08 0.12 0.50 0.94 0.28 0.10 1.00 1.00 0.98Vripconn 0.90 1.00 1.00 1.00 1.00 0.85 1.00 1.00 1.00 1.00 1.00 1.00 1.00
Biodiversity = 0.18 0.20 0.69 1.00 0.08 0.10 0.50 0.94 0.28 0.10 1.00 1.00 0.98
Biodiversity function mean score 0.57 0.54 0.69 0.87 0.32 0.61 0.72 0.81 0.68 0.59 0.88 0.92 0.83
0.57 0.59 0.72 0.92 0.35 0.52 0.73 0.86 0.62 0.54 0.94 0.94 0.88
Site name/number
Test sites
Site name/number
Reference sites
Overall mean SEV score (maximum value 1)

Page 66
Table C 2 - Calculations for the amount of stream biodiversity offset required to address the impact on streams from the road footprint.

Page 67
Table C 3 - Calculations for the amount of stream biodiversity offset required to address the impact on streams of tracks, fill and ponds associated with the road.
Sitecatchment
area (ha)
width
(m)comment
Permanent,
short term,
diversion
SEVi‐C SEVi‐P SEVi‐ISEVm‐P ‐
SEVm‐CECR
Length of
impact
(m)
Area of
impact
(m2)
Area to
restore
(m2)
E TL1 1.3 0.2 extend culvert on farm track P 0.55 0.77 0.23 0.24 3.4 5 1 3
E TL2 1.9 0.2 extend culvert on farm track P 0.55 0.86 0.23 0.24 3.9 5 1 4
E TL3 2.1 0.3 Fill ‐ diversion section D 0.55 0.55 0.5 75 22.5 11
E TL3 0.3 Fill ‐ culvert section P 0.55 0.77 0.23 0.24 3.4 5 1.5 5
E TL4 6.6 0.5 Fill ‐ diversion section D 0.55 0.55 0.5 175 87.5 44
E TL4 0.5 Fill ‐ culvert section P 0.55 0.77 0.23 0.24 3.4 5 2.5 8
E TL5 32 0.8Riffle‐pool form, width 0.5‐
1.0m. Bank height 0.5mP 0.55 0.86 0.23 0.24 3.9 5 4 16
E TL6 3.1 0.4 extend culvert on farm track P 0.55 0.86 0.23 0.24 3.9 5 2 8
Ea3 6.3 0.5 Fill culvert under P 0.57 0.77 0.223 0.24 3.4 35 17.5 60
Ea3 6.3 0.5 access track S 0.57 0.5 0.5 10 5 3
Ea4 1.8 0.2 Fill culvert under P 0.57 0.77 0.23 0.24 3.4 40 8 27
Ea5 4.2 0.4 Fill culvert under P 0.57 0.77 0.23 0.24 3.4 60 24 81
Ea7 6.8 0.5 sediment retention ponds etc S 0.57 0.57 0.5 40 20 10
Ea8 5.8 0.5 works area, dirty water drain S 0.57 0.57 0.5 37 18.5 9
Ea9 7.9 0.65 works area, dirty water drain S 0.57 0.57 0.5 15 9.75 5
E2 1.4 Accrss track crossing x3 S 0.57 0.58 0.5 45 63 32
Ea10b 149 1.2works area, dirty water drain,
access track crossingS 0.73 0.86 0.75 0.24 2.0 35 42 84
E3 1.25Access track crossing + dirty
waterS 0.58 0.58 0.5 15 18.75 9
Ea11 2 0.2 access track S 0.86 0.86 0.75 0.24 0.7 15 3 2
Ea12 1.6 0.2 dirty water drain S 0.86 0.86 0.75 0.24 0.7 20 4 3
Ea13 9.8 0.75 clean water diversion works S 0.86 0.86 0.75 0.24 0.7 20 15 10
E4 116 1.8 inside temporary footprint S 0.72 0.85 0.75 0.24 0.6 50 90 56
Ea14 1.7 0.3 access track + dirtywater drain S 0.86 0.86 0.75 0.24 0.7 15 4.5 3
E5 2.5 access track + dirtywater drain S 0.92 0.92 0.75 0.24 1.1 100 250 266
Ea15 5 0.6 temporary works upstream S 0.86 0.86 0.75 0.24 0.7 50 30 21
Ea16 36 1.2 temporary works upstream S 0.92 0.92 0.75 0.24 1.1 50 60 64
E6 21 1.2 ponds, S 0.94 0.94 0.75 0.24 1.2 50 60 71
Ea23 25 0.9 fill upstream of SH3 P 0.73 0.8 0.23 0.24 3.6 160 144 513
Ea30 2.9 0.4farm cutoff drain affected by
fillD 0.4 0.4 0.5 160 64 32

Page 68
Appendix D: Site Photos
Figure D 1 - Site Ea1, intermittent tributary to Mangapepeke Stream.
Figure D 2 - Site E1 Mangapepeke Stream
.

Page 69
Figure D 3 - Site Ea3, tributary to Mangapepeke Stream entering at site E1. Recent drain clearance.
Figure D 4 - Site E2 Mangapepeke Stream.
Figure D 5 - Site E2a Mangapepeke Stream.
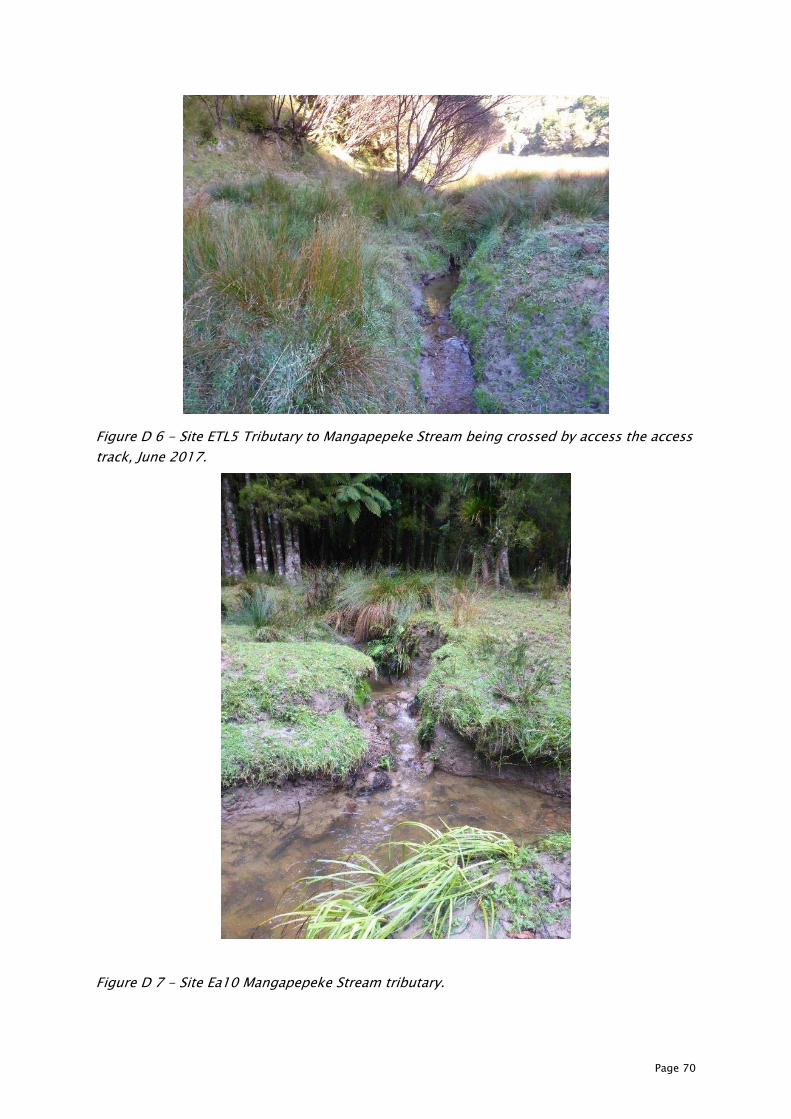
Page 70
Figure D 6 - Site ETL5 Tributary to Mangapepeke Stream being crossed by access the access track, June 2017.
Figure D 7 - Site Ea10 Mangapepeke Stream tributary.

Page 71
Figure D 8 - Mangapepeke Stream upstream of site Ea10 tributary, August 2017. Degraded kahikatea swamp forest.
Figure D 9 - Mangapepeke Stream upstream of site Ea10, facing upstream, August 2017.

Page 72
Figure D 10 - Site E3 Mangapepeke Stream, facing downstream.
Figure D 11 - Site Ea12, intermittent tributary to Mangapepeke Stream.

Page 73
Figure D 12 - Site Ea13, tributary to Mangapepeke Stream.
Figure D 13 - Site E4 Mangapepeke Stream. Sediment deposition on stream bank from a recent flood, 7 June 2017.

Page 74
Figure D 14 - Site Ea14 tributary to Mangapepeke Stream and waterfall.
Figure D 15 - Site E5 Mangapepeke Stream.

Page 75
Figure D 16 - Site Ea15, tributary to Mangapepeke Stream entering at site E5, August 2017.
Figure D 17 - Log jam in Mangapepeke Stream upstream of site E5 waterfall.

Page 76
Figure D 18 - Mangapepeke Stream upstream of site E5 waterfall.
Figure D 19 - Site Ea16 Mangapepeke Stream, August 2017.
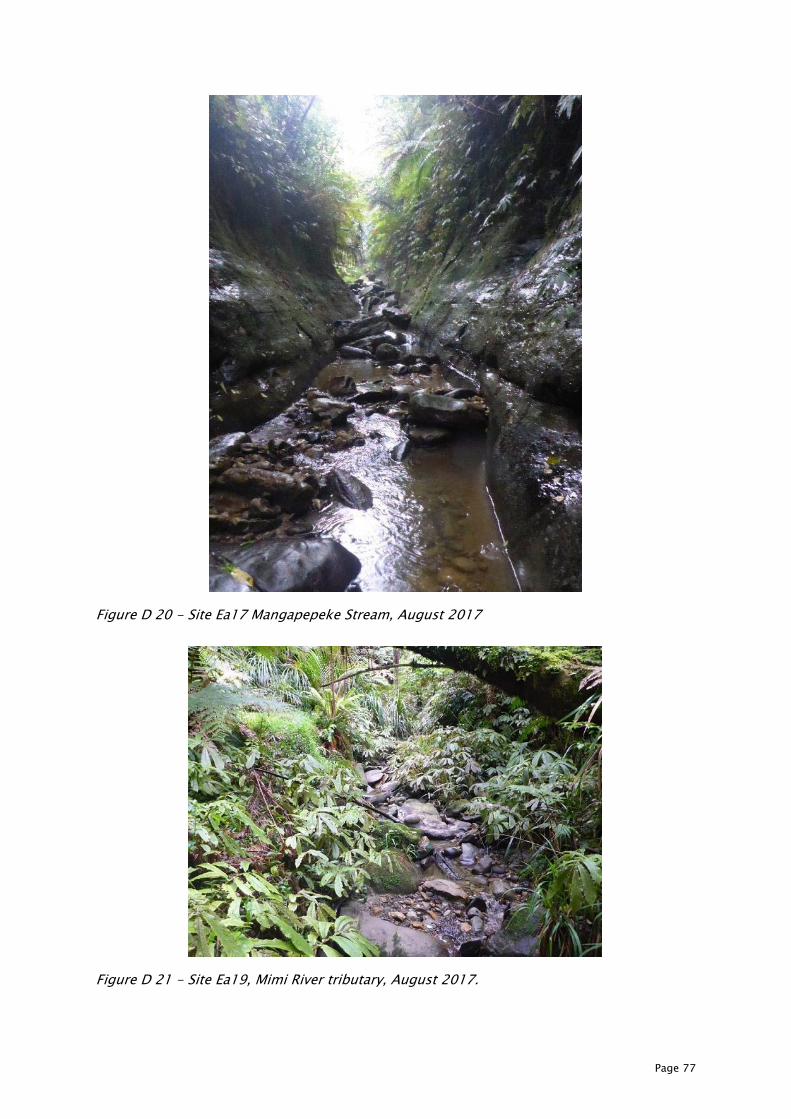
Page 77
Figure D 20 - Site Ea17 Mangapepeke Stream, August 2017
Figure D 21 - Site Ea19, Mimi River tributary, August 2017.

Page 78
Figure D 22 - Site E6 Mimi River tributary (upper end of reach).
Figure D 23 - Site E6 Mimi River tributary (lower end of reach).
Figure D 24 - Site Ea25 Mimi River tributary. Kahikatea swamp forest downstream of site E6
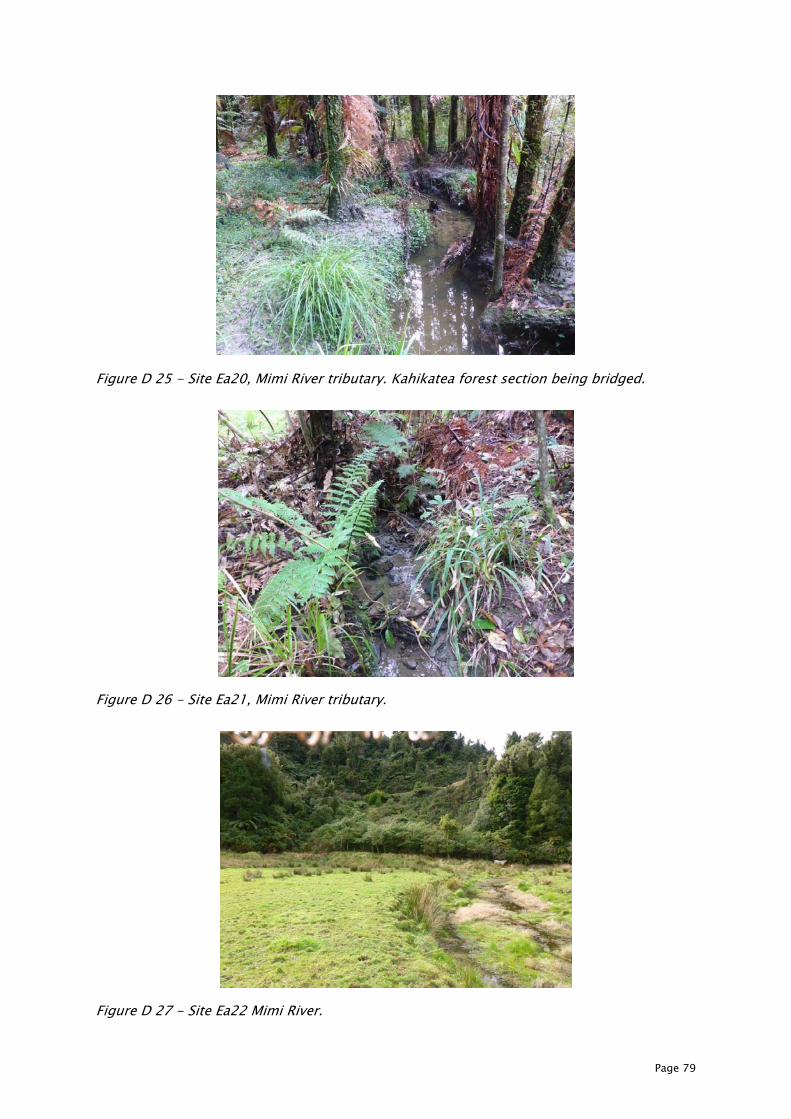
Page 79
Figure D 25 - Site Ea20, Mimi River tributary. Kahikatea forest section being bridged.
Figure D 26 - Site Ea21, Mimi River tributary.
Figure D 27 - Site Ea22 Mimi River.

Page 80
Figure D 28 - Site Ea26 Mimi River tributary, facing downstream.
Figure D 29 - Site Ea27, Mimi River facing upstream, August 2017.
Figure D 30 - Site E7 Mimi River facing downstream, June 2017.

Page 81
Figure D 31 - Site Ea28, Mimi River tributary facing downstream. Water turbid due to runoff from cattle pugging.
Figure D 32 - Mangapepeke Stream culvert under the current SH3 north of Mt Messenger, August 2017. This site is not affected by the Project.