assessment of emerging co2 capture technologies … · 2 capture technologies and their potential...
TRANSCRIPT

ASSESSMENT OF EMERGING CO2 CAPTURE TECHNOLOGIES AND THEIR POTENTIAL TO REDUCE COSTS Report: 2014/TR4
December 2014

INTERNATIONAL ENERGY AGENCY
The International Energy Agency (IEA) was established in 1974 within the framework of the Organisation for Economic Co-operation and Development (OECD) to implement an international energy programme. The IEA fosters co-operation amongst its 28 member countries and the European Commission, and with the other countries, in order to increase energy security by improved efficiency of energy use, development of alternative energy sources and research, development and demonstration on matters of energy supply and use. This is achieved through a series of collaborative activities, organised under more than 40 Implementing Agreements. These agreements cover more than 200 individual items of research, development and demonstration. IEAGHG is one of these Implementing Agreements.
DISCLAIMER
This report was prepared as an account of the work sponsored by IEAGHG. The views and opinions of the authors expressed herein do not necessarily reflect those of the IEAGHG, its members, the International Energy Agency, the organisations listed below, nor any employee or persons acting on behalf of any of them. In addition, none of these make any warranty, express or implied, assumes any liability or responsibility for the accuracy, completeness or usefulness of any information, apparatus, product of process disclosed or represents that its use would not infringe privately owned rights, including any parties intellectual property rights. Reference herein to any commercial product, process, service or trade name, trade mark or manufacturer does not necessarily constitute or imply any endorsement, recommendation or any favouring of such products.
COPYRIGHT
Copyright © IEA Environmental Projects Ltd. (IEAGHG) 2014. All rights reserved.

ACKNOWLEDGEMENTS AND CITATIONS This report describes research undertaken by IEAGHG. The report was prepared by:
• Mike Haines, Cofree Technology Ltd, UK
With contributions from IEAGHG staff:
• Jasmin Kemper • John Davison • John Gale • Prachi Singh • Stanley Santos
To ensure the quality and technical integrity of the research undertaken by IEAGHG each study is managed by an appointed IEAGHG manager. The IEAGHG manager for this report was:
John Davison The report should be cited in literature as follows: ‘IEAGHG, ‘‘Assessment of emerging CO2 capture technologies and their potential to reduce costs’’, 2014/TR4, December 2014.’ Further information or copies of the report can be obtained by contacting IEAGHG at: IEAGHG, Orchard Business Centre, Pure Offices, Cheltenham Office Park, Hatherley Lane, Cheltenham, GL51 6SH, UK Tel: +44(0) 1242 802869 E-mail: [email protected] Internet: www.ieaghg.org

Assessment of Emerging CO2 Capture Technologies and their Potential to Reduce Costs
Executive Summary
Introduction This Technical Review gives an interim overview of research and development aimed at improving and reducing the cost of commercial scale carbon dioxide capture in the power and process industries. It considers technologies principally applicable in post-combustion capture, pre-combustion capture, oxy-combustion capture and finally systems with circulating solids; in that order, which is more or less in line with the current maturity of each approach. It then goes on to consider applications in iron and steel and cement production and oil refining. IEAGHG’s normal practice is for its reports to be sent to external reviewers and for the reviewers’ comments to be taken into account prior to publication. This Technical Review is an interim report which has not yet gone through this process. An IEAGHG Report which has been subject to external review will be published in due course.
The report describes the general status of research and development and the main organisations carrying it out. It also examines the potential impact which each approach could have on the energy consumption and cost of electricity when capture is applied. It does this where possible on the basis of the thermodynamic fundamentals of the process and comparison with benchmark estimates for the established capture processes. Many cost reduction claims are found in the literature but these have been assessed critically as they sometimes give a misleading view of the magnitude of potential improvements. For purposes of comparison the percentage increase in Levelised Cost of Electricity (LCOE) is used as the principal cost comparator. This relates closely to the cost of CO2 abatement which can be calculated directly if also the efficiencies of baseline and capture plants and the fraction of CO2 captured are known. Where precise figures are not available a descriptive statement of the potential for cost reduction is given. Working on a percentage basis eliminates most of the variations in estimates which can arise from different assumptions regarding discount rate, project lifetime, region and currency.
Figure 1 below illustrates the estimated percentage increase in LCOE over a baseline supercritical steam coal-fired power plant when current post-, oxy- and pre-combustion capture technologies are added. This data has been extracted from the detailed studies performed by the US National Energy Technology Laboratory (NETL) and includes an adjustment so that the comparison is on the basis of plants of equal gross thermal energy input. The percentage increases of 80-100% in LCOE are the target which must be bettered by alternative capture technologies.
The costs in Figure 1 are based on one set of assumptions for each capture technology and the differences in cost increase are not large enough to indicate a strong preference for one class of technology over the others. The increase in LCOE for adding pre-combustion capture to an IGCC plant is lower than the costs of adding post and oxy-combustion capture to pulverised
1

coal plants but the LCOE of an IGCC without capture is higher than the LCOE of the baseline pulverised coal plant without capture, which eliminates the cost advantage of pre-combustion capture.
+
Figure 1 LCOE increases due to CO2 capture
The state of development of emerging technologies is assessed on a nine point numeric scale of Technology Readiness Level (TRL) based on the descriptive definitions proposed by the Electric Power Research Institute (EPRI). These are summarised in Table 1.
Table 1 Technology Readiness Level (TRL)
Demonstration
9 Normal commercial service
8 Commercial demonstration, full scale deployment in final form
7 Sub-scale demonstration, fully functional prototype
Development
6 Fully integrated pilot tested in a relevant environment
5 Sub-system validation in a relevant environment
4 System validation in a laboratory environment
Research
3 Proof-of-concept tests, component level
2 Formulation of the application
1 Basic principles, observed, initial concept
2

In this report the TRL is assessed for the main CO2 capture technologies under development and there is a focus on those which are already at levels 4, 5 and 6.
Many of the technologies have potential to be used in more than one of the four main types of capture processes and in specific industries. To avoid repetition, the first time a technology is discussed its key cost reduction and thermodynamic characteristics will be explained. The reader is referred back to this first description if the technology is discussed in the context of any of the other main capture routes later in the report.
Post-combustion capture The study identified about 16 technological approaches to improve post-combustion capture. These range over the full range of maturities and mostly they offer marginal reductions in LCOE and energy consumption. There are also novel approaches which on analysis may not offer either reductions in cost or energy consumption.
TRLs and LCOE reduction prospects for these technologies are assessed in Table 2. Technologies at TRL 4-6 are highlighted in green and those considered to have good prospects for cost reduction are highlighted in yellow for smaller, green for more significant and red for high potential. Improvements to conventional solvents are at high technology readiness level as existing solvent formulations can usually be changed out very easily. The potential for cost reductions is, however, relatively small. There is also scope for incremental improvements through a greater degree of heat integration and the main report indicates broadly, in terms of efficiency reduction, what this potential is.
Precipitating and biphasic liquid solvents are identified as having interesting potential for cost reduction but are at a relatively early stage of development. The use of membrane separation appears to have considerable potential to reduce cost, although this is heavily dependent on the cost per unit area of membrane surface. Much of the cost advantage would come from the much lower specific energy consumption in membrane processes arranged in an innovative way to use combustion air as a sweep gas. The study has also identified that this innovative process arrangement might be applied to other combinations of separation technologies.
3

Table 2 TRLs and LCOE reduction prospects –Post-combustion capture
Technology TRL Prospects to reduce the LCOE increase for capture
Benchmark proprietary mono-ethanolamine (MEA) process
9 LCOE increase expected to be about 100% of baseline
Improved conventional solvents 6-8 Incremental reductions possible
Encapsulated solvents 1 Potential still to be proven
Precipitating solvents 4-5 5-10%
Biphasic solvents 4 16%
Ionic liquids 1 No viable process yet
Polymeric membranes 6 (fast development
possible)
30%
Polymeric membrane/cryogenic separation hybrid
6 (fast development
possible)
Similar or better than polymeric membrane alone
Room temperature ionic liquid (RTIL) membranes
2 Could be similar or better than polymeric membranes
Enzyme catalysed adsorption 1 7% Incremental reduction due to
reduced absorber size
Algae based capture 1 Unlikely in mid-term future
Electrochemically mediated absorption
1 High electrical energy consumption makes reduction
unlikely
Cryogenic capture 3 (fast development
possible)
Moderate reduction possible if favourable assumptions are
valid
Supersonic inertial capture 1 Too early to validate
Vacuum pressure swing adsorption (VPSA)
3 Relatively high energy requirement makes significant
reduction unlikely
Temperature swing adsorption (TSA) with thermal regeneration
1 Uncertain
TSA with electric regeneration 1 Likely much higher
4

Energy requirements – Post-combustion capture
The report looks in some detail at the energy requirement for the capture of CO2 and how this is coupled to the LCOE. In this report, estimates of the electrical equivalent energy consumption per tonne of CO2 abated have been derived from information about process performance published in the literature.
The theoretical separation energy for post combustion capture is very low compared to the requirements of today’s typical processes, as shown in Figure 2, indicating that there is considerable scope for reduction. However, practical processes are unlikely to be able to approach this energy consumption. What the chart does not show is that significant work could be obtained by exploiting the loss of exergy, which occurs because power production thermodynamic cycles are unable to use the full temperatures of combustion of fuel. Some of the emerging capture process are able to tap some of this energy, thus potentially reducing the parasitic energy load on the power plants in which they might be incorporated.
In addition to separation, the captured CO2 has to be compressed for transport and storage. In a typical pulverised coal fired power generation process approximately 6% of the gross power is required for compression from atmospheric pressure to 150bar if 90% of the CO2 is captured. This is shown by the difference between the blue and red lines in Figure 2. Some extra auxiliary power is also typically required by the capture process itself, for fans, pumps etc. There are significant multiplicative effects because energy inefficient processes result in consumption of more fuel and hence there is more CO2 to capture and compress for the same net output of electricity. Figure 2 shows that the energy for compression of CO2 (the difference between the blue and red lines) becomes an increasing proportion as the energy consumption of the capture process rises.
Figure 2 Relationship between capture energy per ton CO2 gross and abated
5

In selecting the most promising areas for research and development, sound assessment of the energy reduction potential is thus essential. This is not only because of the implications for cost, energy security and environmental impacts of higher fuel consumption but also because there are significant knock on effects on capital costs and other operating costs. More detailed information on specific energy consumptions is in the main body of the report.
Cost drivers – Post-combustion capture
For comparison, either the increase in the levelised cost of electricity (LCOE) per unit of energy or the cost per unit of CO2 abated should be used. This summary focusses on LCOE.
There are two main drivers for the increased LCOE of post-combustion capture plants. Analysis of the costs of a baseline post-combustion capture plant reveals that about 40% of the increase is due to the effects of the energy consumption. This requires extra fuel, increased investment in the power plant to generate the extra heat and power needed and significant contributions to both fixed and variable costs. The other about 60% of the increase in LCOE is simply attributable directly to the cost of the capture plant. The contributions to the LCOE increase are illustrated in Figure 3 in which the areas are proportional to the LCOE contribution.
Figure 3 Post-combustion - contributions to LCOE increase
6

Part of the LCOE increase due to the capital cost of the capture plant is due to the capture plant having to be bigger to handle the increased emissions caused by the parasitic energy consumption. This element is thus also driven by the size of the parasitic energy consumption of the capture plant. Reductions in fuel consumption are thus almost as important as reductions in the capital cost of capture equipment and any process in which only one of these is reduced needs careful analysis, as claims that this would lead to overall cost reduction on the basis of reductions in one of these drivers will not be valid if there is a significant increase in the other. Most of the technologies are targeting the energy consumption element even though the capital cost is the bigger driver.
Technologies which might target the capital cost driver for post combustion capture are enzymatic catalysis and membranes. The cost per m2 of membranes is highly uncertain and cost estimates are driven by the unit price. Membrane based processes seem viable at seemingly conservative prices, so that research is worthwhile both to improve separation performance but also to reduce unit cost.
There may be scope for reduction in capital costs through innovation in equipment design or construction methods. This type of technology improvement tends not to be covered in the CCS literature and is probably applicable to wider industry and a literature search with a different focus would be required to identify these. For example, a cheaper method for construction of large concrete structures may potentially be a fruitful area of research, as the absorber column for conventional solvents is a major cost element.
The benchmark for the yellow area in Figure 3 is a supercritical coal-fired power plant as evaluated by NETL [NETL 2012]. The LCOE comparison of plants with and without capture in this report is on the basis of plants with equal fuel feed rates. If the comparison was on the basis of equal net power output, as in the source reference for post combustion capture, the cost increases would be lower because of economy of scale effects, as shown by the grey area in Figure 3.
Pre-combustion capture As for post-combustion capture, each technology has been assessed and the TRLs and cost reduction potentials are indicated in Table 3 below.
Capture technologies have to be closely integrated into pre-combustion power plants making large scale demonstration of complete systems more difficult. However, the equipment for the heat and power integration is generally based on well-established technology, so there may be less necessity to demonstrate complete systems before proceeding to commercial scale. Two technologies; hydrogen separation membranes and sorption enhanced water gas shift, offer substantial cost reductions but still require significant development. Low temperature separation also offers considerable potential but is as yet at a very early stage. Integration of solid oxide fuel cells into IGCC has the potential to perform capture at almost no additional cost. However, although the technology is well into the development stage, there are significant scale up hurdles.
7
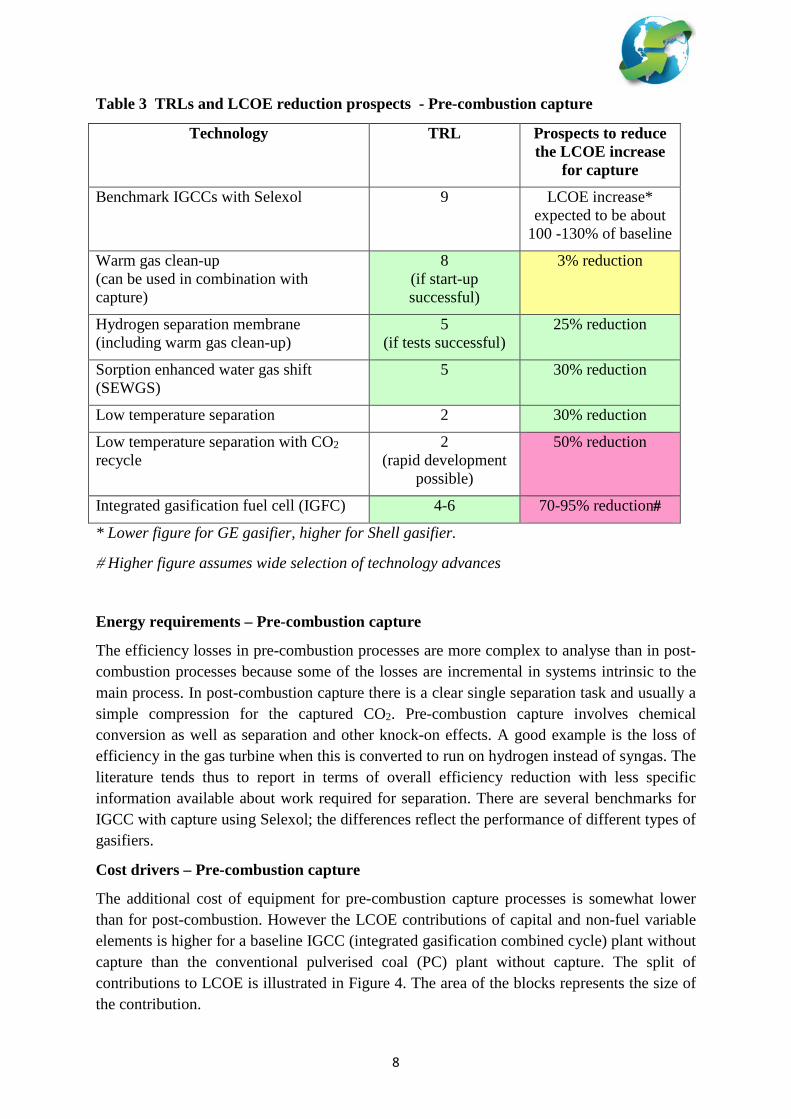
Table 3 TRLs and LCOE reduction prospects - Pre-combustion capture
Technology TRL Prospects to reduce the LCOE increase
for capture
Benchmark IGCCs with Selexol 9 LCOE increase* expected to be about
100 -130% of baseline
Warm gas clean-up (can be used in combination with capture)
8 (if start-up successful)
3% reduction
Hydrogen separation membrane (including warm gas clean-up)
5 (if tests successful)
25% reduction
Sorption enhanced water gas shift (SEWGS)
5 30% reduction
Low temperature separation 2 30% reduction
Low temperature separation with CO2 recycle
2 (rapid development
possible)
50% reduction
Integrated gasification fuel cell (IGFC) 4-6 70-95% reduction#
* Lower figure for GE gasifier, higher for Shell gasifier.
# Higher figure assumes wide selection of technology advances
Energy requirements – Pre-combustion capture
The efficiency losses in pre-combustion processes are more complex to analyse than in post-combustion processes because some of the losses are incremental in systems intrinsic to the main process. In post-combustion capture there is a clear single separation task and usually a simple compression for the captured CO2. Pre-combustion capture involves chemical conversion as well as separation and other knock-on effects. A good example is the loss of efficiency in the gas turbine when this is converted to run on hydrogen instead of syngas. The literature tends thus to report in terms of overall efficiency reduction with less specific information available about work required for separation. There are several benchmarks for IGCC with capture using Selexol; the differences reflect the performance of different types of gasifiers.
Cost drivers – Pre-combustion capture
The additional cost of equipment for pre-combustion capture processes is somewhat lower than for post-combustion. However the LCOE contributions of capital and non-fuel variable elements is higher for a baseline IGCC (integrated gasification combined cycle) plant without capture than the conventional pulverised coal (PC) plant without capture. The split of contributions to LCOE is illustrated in Figure 4. The area of the blocks represents the size of the contribution.
8

Figure 4 Pre-combustion – contributions to LCOE increase
Figure 4 illustrates that the main driver for the increased LCOE, when capture is applied, is the energy loss which drives about two thirds of the increase. Thus unlike post-combustion capture, where the capital cost of capture equipment is a significant target for cost reduction, for pre-combustion capture process efficiency is more important. Indeed, more expensive processes are certainly in the frame if these lead to substantial improvements in efficiency.
The efficiency of baseline IGCC plants varies by about 3% depending on the type of gasifier selected. The baseline here is taken from the NETL analysis for a General Electric (GE) gasifier based IGCC with capture [NETL 2010]. This has the lowest efficiency but has lowest LCOE with capture. The baseline PC is as for the earlier diagram (Figure 3). There is no ‘economy of scale’ grey area in this diagram because the fuel feed rate and net power output of IGCC plants are fixed by the size of the gas turbines and they cannot be varied, unlike pulverised coal plants.
9

Oxy-combustion Most coal-based oxy-combustion developments can be considered as adaptations of mainstream power plants in which conventional combustion equipment is used with oxygen instead of air and there is a recycle of flue gases to mitigate temperatures in burners and furnaces. There are also developments of novel combustion turbine systems employing circulation of water and/or CO2.
Within the mainstream development there are three key areas: the furnace and associated recycle systems, the air separation unit (ASU) and the CO2 processing unit (CPU), which cleans up and pressurises the CO2 for transport.
Research and development is taking place in all of these areas and the TRL assessments are shown in the table below. This identifies which parts of the system are targeted. There is some work on alternative oxy-combustion systems which are also described in the report.
Table 4 TRLs and LCOE reduction prospects – Oxy-combustion
Technology Applicable capture process element
TRL Prospects to reduce the LCOE
increase for capture
Benchmark oxy-combustion Oxy 7 80% increase over base LCOE
Furnace and boiler Boiler 9 Small reductions
O2 production - ASU development ASU 9 22% reduction for target 40%
reduction in ASU power
O2 production – Direct drive ASU 8 3% if power losses reduced by 5%
O2 production – Ion transport membrane (ITM)
ASU 7 24% reduction claimed
O2 production - Oxygen transport membrane (OTM)
ASU 4 Too early to tell
O2 production – Ceramic autothermal recovery system - CARS
ASU 4 Too early to tell
CO2 process unit – warm gas clean up CPU 6-7 Minor
CO2 process unit - Inert removal CPU 8 Minor
CO2 process unit – Recovery from vent
CPU 7 2-3% reduction if O2 and CO2 recovered.
CES’s oxyfuel turbine cycle Full system 5 Too early to tell
Other oxyfuel turbine cycles Full system 2 Too early to tell
10

The assessment of percentage reductions in the table is based on analysis of performance figures and a simple model of how changes in the energy consumptions of ASU, CPU and the main plant auxiliaries interact with the main elements of the LCOE increase. Significant reductions in the LCOE increase are targeted by cryogenic ASU development. This gain is matched by the more revolutionary ion transport membrane process being developed by Air Products.
Potentially competitive alternative technologies which employ completely different thermodynamic cycles are being developed by CES and NET Power. Development work is currently focussing on gas fired power plants but they could also potentially use syngas from coal gasification.
Energy requirements – Oxy-combustion Most information on energy consumption concerns the power requirement for the ASU. Reductions, where figures are available, have been translated into plant efficiency changes. At this stage no assessments have been included for novel oxy-combustion processes. More independent work will be required on these to establish true potential. The major industrial gas companies all have on-going development programs to reduce the cost of producing oxygen on a very large scale, which target gasification/gas-to-liquids (GTL), steel as well as oxy-combustion requirements, which differ in purity needs. A surprising finding [NETL 2008] is that a coal-fired oxy-combustion power plant using the ITM process would have similar efficiency to its cryogenic counterpart. The claimed 24% reduction in additional LCOE thus needs further investigation.
Cost drivers – Oxy-combustion
The main contributors to LCOE are illustrated in Figure 5 below. Again, the areas of the blocks illustrate relative contributions. The estimated LCOE increase for application of oxy-combustion is somewhat less than for solvent based post-combustion capture according to the reference used in this study but the figures should be taken as only a rough indication.
The parasitic energy is a slightly bigger driver than capital for the capture process in conventional coal-fired oxy-combustion systems. This is reflected in the emphasis which is placed on reducing the specific energy requirement for producing oxygen, which is the main consumer of extra energy. Note that the baseline PC plant here is slightly different, being that from the NETL study on oxy-fuel processes [NETL 2008].
11

Figure 5 Oxy-combustion – contributions to LCOE increase
Solid looping systems
Solid looping technologies are at a much earlier stage of development in that there is no detailed evaluation of a baseline system utilising these technologies. It is only recently that data collected from larger MW scale pilot plants has been collected and could be used for making such estimates. As the processes will use large fluidised or fixed bed reactor systems making accurate cost estimates of these components will be difficult. The technology readiness level assessments given in Table 5. The scope for LCOE reductions cannot be assessed accurately at present, only general indications of potential are thus given in the table.
In making TRL assessments, the ability of the various test and demonstration systems to meet sufficient levels of complete volatiles combustion in the fuel reactor and solid sorbent/oxidant performance have been taken into account.
12

Table 5 TRLs and LCOE reduction prospects – Solid looping
Technology Capture process type
TRL Prospects to reduce the LCOE increase for
capture
Calcium carbonate looping (CaL)
Post plus oxy 6 Potentially significant but more detailed
evaluations needed Indirectly heated calciner CaL Post 3 Potential may be
greater than for basic CaL process
H2 production using CaL Pre 1 Early claims of 9-12% reduction
Sorption enhanced reforming (SER)
Pre 1 Too early to assess
ENDEX (as pressure change CaL)
Post More work needed
Too early to assess
CaL in cement production Post Same as for CaL
Too early to assess
Chemical looping combustion (CLC)
Indirect oxy 2 (low due to issues to be resolved)
Potentially very large reduction (coal only)
Chemical looping gasification (CLG)
Indirect oxy 1 Potentially very large reduction
Chemical looping with oxygen uncoupling (CLOU)
Indirect oxy 1 Potentially very large reduction (coal only)
Syngas CLC Indirect oxy 1 High capital appears to counterbalance large
efficiency gains Coal direct chemical looping (CDLC)
Indirect oxy 1 Potential to roughly halve LCOE increase
Steam reforming CLC Indirect oxy 1 N/A as this is a H2 production process
Autothermal reforming (a-CLR) Indirect oxy 3 N/A as this is a H2 production process
Limestone chemical looping (LCL)
Indirect oxy 4 Developer claims up to 80% reduction (needs detailed validation)
The main observation is that calcium looping is much more advanced than chemical looping combustion even though both processes use very similar equipment. Indeed, the pilot plants are often able to operate using either process. A key point is that CLC could offer exceptionally good performance for coal-fired applications but not for gas-fired, since it cannot be configured to reach the high temperatures needed for efficient gas turbine operation. To date, operating with sufficiently complete combustion of coal has been elusive. Thus even though most of the equipment needed is at a higher stage of development, a viable
13

design for the fuel reactor which will enable full combustion has to be found. Limestone chemical looping which is a similar process to mainstream CLC but uses a different type of oxygen carrier is noticeably more advanced and currently has an aggressive development programme.
Overall conclusions A wide range of alternative CO2 capture technologies has been reported. There may be significant differences between claims of the developers and the practicality, which this study has attempted to highlight. Amongst the many R&D initiatives there are several which stand out usually because of their favourable thermodynamics allowing reduction of the energy efficiency penalty. Of particular note are proposals which have been made for system configurations where recycles are created to concentrate CO2. This allows simpler, lower cost separation processes which do not work well on low concentrations of CO2 to be included in overall schemes.
Figure 6 below shows, in light green, the potential for LCOE reduction of some of the more promising technologies for post-, pre- and oxy-combustion capture which have emerged from the analysis. The reductions shown must be interpreted as rough assessments of the potential. Note that the baseline oxy-combustion process starts with approximately 20% advantage over the baseline post- and pre-combustion processes in this analysis, indicated in hashed dark green, based on the particular references used in this study.
There are also very promising technologies in which CO2 capture is a more integral part of the power generation process, such as solids looping combustion, alternative thermodynamic cycles and certain types of fuel cells. Solid looping technologies, and chemical looping combustion applied to coal has great potential to reduce both the parasitic energy consumption and the LCOE increase for CO2 capture. However, these technologies are at too early a stage to quote numbers for potential reductions and also have to overcome some significant technological hurdles. Only technologies for which percentage reductions have been estimated are shown in Figure 6.
Direct reduction of the capital cost of the equipment used in the processes does not appear to be a significant target for innovation. This may be because the individual pieces of equipment used in most capture processes are mature products with little potential for further cost reduction. However, the capital cost of capture equipment is a major contributor to LCOE and research directed at reducing this cost may still yield some incremental benefits.
The more developed technologies appear, as perhaps expected, to be taken up and championed by large industrial concerns, which is understandable on the basis of their potential and also the high costs of demonstration and commercialisation. Committed and experienced industrial support on this scale is probably a prerequisite for moving any of the technologies beyond TRL-6.
14

Figure 6 Potential to reduce the LCOE increase for CO2 capture
15

1
Assessment of Emerging CO2 Capture Technologies and
their Potential for Cost Reduction
Main chapters
Page
Introduction 9
Cost progression for new technologies 12
Post-combustion capture 29
Pre-combustion capture 74
Oxy-combustion 92
Solid looping 110
Non-power industries 135
Conclusions 145
List of abbreviations 149
References 153
2
Table of Contents
1. Introduction .............................................................................................................................. 9
1.1. The need to reduce greenhouse gas emissions ................................................................... 9 1.2. Background to the report .......................................................................................................... 11
2. Cost Progression for new technologies ......................................................................... 12
2.1. Cost learning curves .................................................................................................................... 12 2.2. Engineering assessment of cost reduction for new technologies ............................... 14 2.3. Methodology for comparison of capture costs. ................................................................. 16 2.4. Cost comparisons – breakdown into elements .................................................................. 19 2.5. Cost comparisons – relationship between LCOE increase and cost of CO2/tonne 19 2.6. Using LCOE increase to estimate cost of CO2 avoided ..................................................... 20 2.7. Improving cost comparisons between diverse CO2 capture technologies .............. 21 2.8. Thermodynamic considerations ............................................................................................ 23
2.8.1. Combustion of fuel and conversion to work ............................................................................ 23 2.8.2. Energy required for separation of gases .................................................................................... 25 2.8.3. Relationship between energy consumption for capture and costs ................................. 26 2.8.4. Costs – Conventional post-combustion capture ..................................................................... 27
3. Post combustion capture .................................................................................................... 29
3.1. Improvements to amine solvent absorption ...................................................................... 29 3.1.1. Cost reduction potential of improved solvents ....................................................................... 31 3.1.2. Thermodynamic and chemical equilibrium considerations .............................................. 34 3.1.3. Solvent processes with lower heat of regeneration .............................................................. 36 3.1.4. Solvents with higher absorption capacity ................................................................................. 36 3.1.5. Solvents with higher absorption rate .......................................................................................... 37 3.1.6. Solvents with lower degradation rates ....................................................................................... 37 3.1.7. Solvents with less corrosive properties ..................................................................................... 37 3.1.8. Lower cost solvents ............................................................................................................................ 37 3.1.9. Improved solvents - Current status and technology readiness level ............................. 38 3.1.10. Overall efficiency and cost prospects for improved solvents ......................................... 38
3.2. Encapsulated Solvent .................................................................................................................. 39 3.2.1. Cost reduction potential of encapsulated solvents ................................................................ 39 3.2.2. Thermodynamic considerations ................................................................................................... 40 3.2.3. Current Status, technology readiness level and development requirements. ............ 40
3.3. Precipitating Solvent................................................................................................................... 41 3.3.1. Energy requirement / Cost evaluation ....................................................................................... 41 3.3.2. Thermodynamic and chemical equilibrium considerations .............................................. 42 3.3.3. Current Status, technology readiness level and development requirements. ............ 42
3.4. Two phase liquid solvents ........................................................................................................ 43 3.4.1. Energy requirement / Cost evaluation ....................................................................................... 43 3.4.2. Thermodynamic and chemical equilibrium considerations .............................................. 44 3.4.3. Current Status, technology readiness level and development requirements. ............ 44
3.5. Ionic Liquids ................................................................................................................................... 45 3.5.1. Energy requirement / Cost evaluation ....................................................................................... 45 3.5.2. Current Status, technology readiness level and development requirements. ............ 45

3
3.5.3. Thermodynamic and chemical equilibrium considerations .............................................. 46 3.6. Membrane separation ................................................................................................................ 47
3.6.1. General issues ....................................................................................................................................... 47 3.6.2. Cost and performance of membrane separation systems .................................................. 49
3.7. Polymeric and Hybrid membranes ........................................................................................ 50 3.7.1. Energy requirement / Cost evaluation ....................................................................................... 51 3.7.2. Current Status, technology readiness level and development requirements. ............ 51
3.8. Polymeric membrane and low temperature separation ............................................... 52 3.8.1. Energy requirement / Cost evaluation ....................................................................................... 53 3.8.2. Current Status, technology readiness level and development requirements. ............ 53
3.9. Other hybrid membrane systems ........................................................................................... 53 3.10. Gelled Ionic Liquid-Based Membranes .............................................................................. 53
3.10.1. Current Status, technology readiness level and development requirements. ......... 54 3.11. Pressurized post combustion capture ............................................................................... 54
3.11.1. Current Status, technology readiness level and development requirements. ......... 55 3.12. Enzyme catalysed CO2 absorption/desorption ............................................................... 56
3.12.1. Energy requirement / Cost evaluation .................................................................................... 56 3.12.2. Cost considerations .......................................................................................................................... 57 3.12.3. Thermodynamic considerations ................................................................................................. 57 3.12.4. Current Status, technology readiness level and development requirements. ......... 57
3.13. Algae based CO2 capture ......................................................................................................... 57 3.13.1. Energy requirement / Cost evaluation .................................................................................... 58 3.13.2. Thermodynamic considerations ................................................................................................. 59 3.13.3. Current Status, technology readiness level and development requirements. ......... 59
3.14. Electrochemically-mediated amine system ..................................................................... 60 3.14.1. Energy requirement / Cost evaluation .................................................................................... 60 3.14.2. Current Status, technology readiness level and development requirements. ......... 61
3.15. Low temperature (cryogenic) separation of CO2 ........................................................... 62 3.15.1. Energy requirement / Cost evaluation .................................................................................... 64 3.15.2. Current Status, technology readiness and development requirement. ...................... 64
3.16. Supersonic Post-combustion Inertial CO2 Extraction System ................................... 64 3.16.1. Energy requirement / Cost evaluation .................................................................................... 65 3.16.2. Current Status, technology readiness level and development requirements. ......... 65
3.17. Vacuum Swing Adsorption Process (VPSA) ...................................................................... 66 3.17.1. Energy requirement / Cost evaluation .................................................................................... 67 3.17.2. Thermodynamic considerations ................................................................................................. 67 3.17.3. Current Status, technology readiness level and development requirements. ......... 67
3.18. Temperature Swing Adsorption (TSA) .............................................................................. 68 3.18.1. Energy requirement / Cost evaluation .................................................................................... 69 3.18.2. Thermodynamic considerations ................................................................................................. 69 3.18.3. Current Status, technology readiness level and development requirements. ......... 70
3.19. Post Combustion Capture Technologies for Non-Power Industries ........................ 70 3.20. Conclusions - Post combustion technologies ................................................................... 70
4. Pre-Combustion Capture Technologies ......................................................................... 74
4.1. Gas Separation Membranes ...................................................................................................... 77

4
4.1.1. Description and status ....................................................................................................................... 77 4.1.2. Metallic hydrogen separation membranes ............................................................................... 78 4.1.3. Porous inorganic hydrogen separation membranes ............................................................ 80 4.1.4. Carbon hydrogen separation membranes ................................................................................. 80 4.1.5. Dual stage hydrogen separation membrane schemes .......................................................... 80 4.1.6. CO2 separation membranes ............................................................................................................. 81 4.1.7. Energy requirement / cost evaluation ........................................................................................ 81 4.1.8. Current Status, technology readiness level and development requirements. ............ 82
4.2. Sorbent –Enhanced Water Gas Shift (SEWGS) .................................................................... 82 4.2.1. Performance and costs ...................................................................................................................... 83 4.2.2. Current Status, technology readiness level and development requirements............. 84
4.3. Low temperature separation ................................................................................................... 84 4.3.1. Energy requirement / cost evaluation ........................................................................................ 85 4.3.2. Current Status, technology readiness level and development requirements. ............ 87
4.4. Low temperature separation with CO2 recirculation – The Timmins process....... 87 4.4.1. Energy consumption and costs ...................................................................................................... 88 4.4.2. Technology readiness level ............................................................................................................. 89
4.5. Fuel cells .......................................................................................................................................... 89 4.5.1. Performance and costs ...................................................................................................................... 90 4.5.2. Thermodynamic considerations ................................................................................................... 91 4.5.3. Technology readiness level ............................................................................................................. 91
5. Oxy-Combustion .................................................................................................................... 92
5.1. Oxy-combustion for solid fuel fired boilers ........................................................................ 92 5.2. Pressurized Oxy-combustion ................................................................................................... 93
5.2.1. Staged Pressurized Oxycombustion (SPOC) ............................................................................. 94 Figure 41 Staged pressurized oxycombustion flow scheme ..................................................... 94
5.2.2. Conventional and Flameless Pressurized Oxy-combustion (FPOC) ............................... 94 5.3. Oxygen Production ...................................................................................................................... 96
5.3.1. Cryogenic Air Separation .................................................................................................................. 96 5.3.2. Other Novel Oxygen Production Technologies ....................................................................... 97 5.3.3. Thermodynamic considerations ................................................................................................. 100 5.3.4. Costs and energy consumption .................................................................................................... 101 5.3.5. Technology readiness level ........................................................................................................... 102
5.4. CO2 Processing Unit .................................................................................................................. 102 5.4.1. Pre-treatment of the CO2 Rich Flue Gas .................................................................................... 102 5.4.2. Inert Removal Process ..................................................................................................................... 104 5.4.3. Capture of Additional CO2 from CPU Vent ............................................................................... 105
5.5. Oxy-combustion for gas fired power plants .................................................................... 106 5.5.1. Clean Energy Systems (CES) ......................................................................................................... 106 5.5.2. The Allam Cycle .................................................................................................................................. 108 5.5.3. Thermodynamic considerations ................................................................................................. 109 5.5.4. Cost and energy consumption ...................................................................................................... 109 5.5.5. Current Status, technology readiness level and development requirements. .......... 109
6. Solid looping technologies .............................................................................................. 110
6.1. Calcium/carbonate looping (CaL) ....................................................................................... 111

5
6.1.1. Current status...................................................................................................................................... 112 6.1.2. Performance and cost ...................................................................................................................... 112 6.1.3. Technology readiness level ........................................................................................................... 114
6.2. CaL for combustion: an indirectly heated CaL process ................................................ 114 6.2.1. Performance and cost ...................................................................................................................... 115 6.2.2. Current status, technology readiness level and development requirements ........... 115
6.3. CaL for H2 production .............................................................................................................. 115 6.3.1. Performance and cost ...................................................................................................................... 116 6.3.2. Future developments ....................................................................................................................... 116
6.4. Combined shift-carbonation ................................................................................................. 116 6.4.1. Performance and cost ...................................................................................................................... 117 6.4.2. Current status, technology readiness level and development requirements ........... 117
6.5. Sorption enhanced reforming (SER) and sorption enhanced water gas shift
(SEWGS) .................................................................................................................................................... 117 6.5.1. Performance and cost ...................................................................................................................... 117 6.5.2. Current status, technology readiness level and development requirements ........... 117
6.6. The ENDEX process ................................................................................................................... 117 6.6.1. Performance and cost ...................................................................................................................... 118 6.6.2. Current status, technology readiness level and development requirements ........... 118
6.7. CaL integration into cement production ........................................................................... 118 6.7.1. Performance and cost ...................................................................................................................... 118 6.7.2. Current status, technology readiness level and development requirements ........... 120
6.8. Chemical looping combustion (CLC) .................................................................................. 120 6.8.1. Performance and cost ...................................................................................................................... 122 6.8.2. Thermodynamic and chemical reaction considerations ................................................... 123 6.8.3. Current status, technology readiness level and development requirements ........... 123
6.9. Chemical looping gasification (CLG) ................................................................................... 124 6.9.1. In-situ gasification CLC (iG-CLC) ................................................................................................. 124 6.9.2. Chemical looping with oxygen uncoupling (CLOU) ............................................................. 125 6.9.3. Syngas-CLC ........................................................................................................................................... 126 6.9.4. CLC in coal-based IGCC (ICLC-CC) .............................................................................................. 127 6.9.5. Chemical looping reforming (CLR) for H2 production........................................................ 130 6.9.6. Steam reforming (SR-CLC) ............................................................................................................. 130 6.9.7. Autothermal reforming (a-CLR) .................................................................................................. 131
6.10. Limestone chemical looping (LCL): a hybrid process ................................................ 133 6.10.1. Performance and cost ................................................................................................................... 134 6.10.2. Current status, technology readiness level and development requirements ........ 134
7. CCS Development in Non Power Industries .............................................................. 135
7.1. Iron and Steel Industry ........................................................................................................... 135 7.2. Cement Industry ........................................................................................................................ 140 7.3. Oil Refining .................................................................................................................................. 142
8. Conclusions .......................................................................................................................... 145
9. List of abbreviations.......................................................................................................... 149
10. References ............................................................................................................................ 153

6
List of Figures
Fig 1 Contributions to emissions reduction (IEA 2DS scenario)
Fig 2 Capital cost learning curve
Fig 3 Cost of CO2 avoided v Base plant LCOE and LCOE% increase due to capture
Fig 4 Parametric estimation of additional costs of CO2 capture
Fig 5 Important factors to be considered when developing a solvent for CO2 absorption
process.
Fig 6 Split of contributions to extra fuel and power in typical solvent based PCC
Fig 7 Split of contributions to additional OPEX in typical solvent based PCC
Fig 8 Relationship between ∆H and CO2 solvent absorption/regeneration temperatures
Fig 9 Projected efficiency penalty of future PCC plants with improved solvents and
optimised process
Fig 10 Carbonate-filled capsules with thymol blue as a pH indicator (inset shows loaded
capsules) [Aines et al. 2013]
Fig 11 Shell Global Solutions carbonate slurry bench-scale pilot-plant [Moene et al. 2012]
Fig 12 Simplified process flow diagram of the IFP Energies Nouvelles DMXTM process
[Raynal et al 2011]
Figure 13 Some cations and anions constituting ionic liquids (ILs) [Hasib-ur-Rahmana et al.
2010]
Fig 14 Two stage recycling membrane arrangement
Fig 15 Optimisation of recycle fraction in two stage membrane process
Fig 16 Schematic illustration of the membrane concept for CO2 separation from coal-fired
power plant. (FGC: flue gas cleaning, Mem: membrane module) [Franz et al. 2013]
Fig 17 A post-combustion carbon capture plant scenario with three CO2 selective membrane
stages [Merkel et al. 2010]
Fig 18 RTILs gelled membrane (hmim/Tf2N 98.5 wt% with 12-hydroxy stearic acid 1.5
wt%) [Noble et al 2013]
Fig 19 Pressurised post combustion capture as proposed by Sargas
Fig 20 Concept for the use of enzymes to capture carbon dioxide employing the conventional
absorber/stripper configuration [CSIRO 2012]
Fig 21 Design principle of a tubular photo bioreactor system [CO2-to-Bio 2012]
Fig 22 (a) Schematic diagram of EMAR process (b) A cross sectional view of EMAR
electrochemical cell stack [Stern 2013]
Fig 23 Layout of the low temperature CO2 capture system [Clodic 2002]
Fig 24 CO2 capture system operational scheme [Clodic et al., 2004b]
(CS: cooling stage; Ev: Evaporator; FF: Heat Exchanger; LTFE: Low Temperature Frosting
Evaporators IC: Integrated Cascade
Fig 25 Configuration of an individual ICES unit [NETL]
Fig 26 Six-step VSA cycle: I – pressurization, II – adsorption, III – rinse, IV – co-current
blowdown, V – counter-current blowdown, and VI – counter-current evacuation
[Huang et al.2013]
Fig 27 Two-step indirect TSA cycle [Clausse 2011]
Fig 28 Evaluation required for future generation post-combustion capture technologies.
Fig 29 Specific Total Plant Costs of power plants with and without CO2 capture
Fig 30 Temperature match for membrane IGCC integration [NETL, 2009]
Fig 31 Metallic hydrogen separation membrane [Jack, 2011]
Fig 32 Dual-stage membrane reactor

7
Fig 33 Low temperature CO2 capture unit with external refrigeration [Berstad, 2012]
Fig 34 Auto-thermal CO2-H2S co-capture phase change separation AGR [Mori, 2013]
Fig 35 Economic evaluation of IGCC with auto-thermal AGR [Mori, 2013]
Fig 36 The main techno-economic results obtained from DECARBit [DECARBit, 2012]
Fig 37 Example overall flow scheme Timmins process low temperature CO2 removal
Fig 38 Arrangement of Selexol process in Timmins process
Fig 39 Integrated Gasification Fuel Cell (IGFC) plant [NETL 2011a]
Fig 40 Development pathway of PF coal fired boiler – also depicting the current status of
oxyfuel combustion boiler development Figure adapted from [Marion et al (2009]
Fig 41 Staged pressurized oxy-combustion flow scheme
Fig 42 Flowscheme of pressurized oxy-combustion
Fig 43 Flowscheme of flameless pressurised oxy-combustion
Fig 44 Maturity and total R&D investment of different oxygen production processes [De
Costa et al, 2013]
Fig 45 Arrangement of ITM oxygen process (after Quintell)
Fig 46 IGCC process with carbon capture using ITM
Fig 47 Air products sour gas compression technology
Fig 48 The CES cycle
Fig 49 The Allam cycle
Fig 50 Location of CaL and CLC in the CCS chain [Epple 2011]
Fig 51 Scheme of a standard calcium looping process [Epple 2013]
Fig 52 Summary of CaL pilot plants [Dean 2011]
Fig 53 Sensitivity analysis showing the impact of varying critical cost parameters by ±30%
on CO2 capture cost [MacKenzie 2007]
Fig 54 Process scheme for indirectly heated carbonate looping [Junk 2013]
Fig 55 Left: Design of the 300 kWth test facility; Right: Design of the heat exchanger [Junk
2013]
Fig 56 The ENDEX process [Ball 2010]
Fig 57 Integration of CaL process with power and cement plant [Romano 2013]
Fig 58 COE for cement plant integration for a carbon tax of 40€/tCO2 [Romano 2013]
Fig 59 Scheme of a standard CLC process [Epple 2013]
Fig 60 LCOE for chemical looping compared to conventional CCS technologies [Alstom
2013]
Fig 61 Scheme of the iG-CLC process [Adanez 2012]
Fig 62 Mechanisms of the different CLG technologies [Adanez 2012]
Fig 63 Schematic layout of the syngas-CLC process [Adanez 2012]
Fig 64 CLC combined cycle power plant using syngas as fuel [Mantripragada 2013]
Fig 65 Scheme of SR-CLC process, (1) air reactor, (2) fuel reactor, (3) cyclone, (4) + (5) loop
seals [Adanez 2012]
Fig 66 Scheme of a-CLR process, (1) air reactor, (2) fuel reactor, (3) cyclone, (4) + (5) loop
seals [Adanez 2012]
Fig 67 Alstom's LCL process [Abdullaly 2012]
Fig 68 Refinery CO2 emissions breakdown by process (%m/m) from hydroskimming
(simple) and conversion refinery with capacity of 150,000 bbl/d (CONCAWE, 2011)
Fig 69 Potential of key technologies for LCOE reduction

8
List of Tables
Table 1 Technology Readiness Level (TRL)
Table 2 Comparison of Baseline LCOE estimates from different sources
Table 3 Theoretical electrochemical conversion efficiencies of fuels
Table 4 Theoretical and practical efficiencies attainable from combustion based power
processes. (LHV basis)
Table 5 Typical breakdown of parasitic energy requirements for solvent based PCC
Table 6 Contributions to increased LCOE of main users of parasitic energy in solvent based
PCC
Table 7 Preliminary evaluation of future generation post-combustion capture technologies
Table 8 Assessment of Technology Readiness Levels and LCOE reduction prospects –Post-
combustion
Table 9 Performance and costs of plants with warm gas cleaning and H2 membranes
Table 10 Cost and performance of IGCC SEWGS and reference plants
Table 11 Efficiencies and costs of fuel cell power plants with CO2 capture.
Table 12 Techno-economics of the coal-to-H2 and SMR cases [Connell 2013]
Table 13 Techno-economics of the IGCC cases [Connell 2013]
Table 14 Summary of chemical looping pilot plants [Adanez 2012]
Table 15 Aspen Plus modelling results for CDCL process [Bayham 2103]
Table 16 First-year COE for CDCL process [Bayham 2013]
Table 17 LCL performance and costs
Table 18 Current status of post- & oxyfuel combustion technologies applied to cement
industry [Adapted from IEAGHG 2013]
Table 19 Potential processes suitable for CO2 capture in an oil refinery (CONCAWE, 2011)

9
1. Introduction
1.1. The need to reduce greenhouse gas emissions
The earth’s atmosphere contains gases that are collectively called the greenhouse gases. The
greenhouse gases are so called because in the atmosphere they both absorb and emit
radiation. This process is the fundamental cause of what is termed the greenhouse effect
[IPCC, 1990]. The main greenhouse gases in the earth's atmosphere are water vapour, carbon
dioxide (CO2), methane, nitrous oxide, and ozone. It is a well-established scientific fact that
these greenhouse gases affect significantly the earth’s temperature, without them, scientists
predict that the earth's surface would average about 33 C° colder than the present average of
14 °C [Le Treut, 2007].
Since the late 18th century the atmospheric concentrations of these greenhouse gases and in
particular CO2 has risen by some 40%. The principal reason for the increase in global
greenhouse gas emissions is the increased use of fossil fuels and global deforestation since
the period we call the Industrial Revolution, the beginning of which is taken as the year 1750
[Le Treut, 2007]. The atmospheric concentration of CO2 in the atmosphere has increased
from 280 to 392.6 parts per million (ppm) in 2012. In May 2013 the atmospheric
concentration of CO2 at the Mauna Loa atmospheric observatory in Hawaii, taken as the
“gold standard” atmospheric monitoring laboratory in the world, was recorded as 400 ppm.
This is the first time that the atmospheric CO2 concentration has reached 400 ppm in millions
of years. Scientific analyses suggest that atmospheric CO2 levels reached as much as 415
ppm during the Pliocene era, between 5 and 3 million years ago. In that period, global
average temperatures have been estimated to be 3-4°C higher than the present average and as
much as 10°C warmer at the poles. Sea levels have been estimated to have ranged between 5
and 40 m higher than today [SIO, 2014].
The principal effects of increased greenhouse gas concentrations in the atmosphere are:
• An uptake of energy by the climate system causing average surface temperatures to
rise.
• Melting of polar ice sheets.
• Increased sea levels:
The other significant effect of increased atmospheric concentrations of CO2 is ocean
acidification. The ocean absorbs about a quarter of the CO2 that is released into the
atmosphere every year, so as atmospheric CO2 levels increase, so do the concentrations of
CO2 in the ocean. Initially, scientists considered that there were benefits from the ocean
removing CO2 from the atmosphere. However, decades of ocean observations now show that
there is also a downside in that the CO2 absorbed by the ocean is changing the chemistry of
the seawater, as more CO2 is absorbed the pH of the ocean is increasing [IGBP, 2013].
The International Energy Agency (IEA) assesses on a regular basis the role that low carbon
technological options can play in transforming the current energy system. The 2012 edition of
the IEA’s Energy Technology Perspectives [IEA, 2012] 2°C Scenario (2DS) identifies the
technology options and policy pathways that ensure an 80% chance of limiting long-term
global temperature increase to 2°C [IEA, 2012]. This IEA analysis shows that CCS is an
integral part of any lowest-cost mitigation scenario where long-term global average

10
temperature increases are limited to significantly less than 4°C, particularly for the 2°C
Scenario (2DS). Figure 1 below provides a summary of the IEA’s analyses of the impacts that
each low carbon technology must achieve to attain the 2DS scenario.
Figure 1 Contributions to emissions reduction (IEA 2DS Scenario)
The IEA’s analysis indicates that a combination of low carbon technology options will need
to be deployed globally to meet the 2DS target. There is no individual technology that can
achieve the desired levels of emission reductions on its own. All the options on the table have
their own merits and demerits. For carbon capture and storage (CCS), its advocates point to
its ability to decarbonise the power sector without significant modification and investment in
the current energy infrastructure. Detractors point to the energy efficiency penalty associated
with the capture component and the storage integrity of geological reservoirs. More recently
it has become accepted that CCS is probably the only technology on the horizon today that
would allow industrial sectors (such as iron and steel, cement and natural gas processing) to
meet deep emissions reduction goals.
The IEA indicates that abandoning CCS as a mitigation option would significantly increase
the cost of achieving the 2DS. The additional investment needs in electricity that are required
to meet the 2DS would increase by a further 40% if CCS is not available, with a total extra
cost of USD 2 trillion over 40 years. Without CCS, the pressure on other emissions reduction
options would also be higher.
More recently the IEA has considered a new scenario of 4DS. The 4°C Scenario (4DS) takes
into account recent pledges made by countries to limit emissions and step up efforts to
improve energy efficiency. Like the 2DS, the 4DS is already an ambitious scenario that
requires significant changes in policy and technologies. Moreover, capping the temperature
increase at 4°C requires significant additional cuts in emissions in the period after 2050. The
need for CCS is not reduced in this scenario, rather its deployment needs to be ramped up
quickly after 2020.
The IEA’s analysis is not unique, one other example of many is the recent Global Energy
Assessment [GEA, 2012] which uses a different assessment approach to that of the IEA
11
which works from setting a “business as usual” base case also. The GEA study reports that
there are many combinations of energy resources, end-use, and supply technologies that can
simultaneously address the multiple sustainability challenges. One of the report’s key
findings is that energy systems can be transformed to support a sustainable future through (a)
radical improvements in energy efficiency, especially in end use, and (b) greater shares of
renewable energies and advanced energy systems with carbon capture and storage (CCS) for
both fossil fuels and biomass [GEA, 2012].
The combination of biomass and CCS (bioCCS or BECCS) is one that is being taken up by
environmental groups because of its potential to take emissions out of the atmosphere and
reduce the atmospheric carbon budget, the so called “negative emissions” effect. Recent work
to assess the global potential for bioCCS has suggested the global technical potential is large
and, if deployed, could result in negative emissions of up to 10 Gt of CO2 equivalent
annually. The key obstacle to the implementation of the technology is identified as the
absence of a price for stored biomass based CO2. There is therefore a need for policy
developments in this area to assist global take-up of the technology [IEAGHG, 2011].
1.2. Background to the report
CO2 capture is already well established in large commercial plants in various industries,
particularly natural gas processing and chemicals and synthetic fuels production. In most
cases the capture of CO2 is an inevitable part of the industrial process and it is either vented
to the atmosphere or it is used as a product, e.g. for enhanced oil recovery (EOR) or for food
and drinks production. CO2 capture is also starting to be demonstrated in large commercial
power plants, for example a plant at Boundary Dam in Canada (post-combustion capture)
started up in 2014 and another at Kemper County in the USA (pre-combustion capture) is due
to start up in 2016. There are also plans to build commercial demonstration plants in the UK
and DECC is funding FEED studies for power plants at Peterhead, Scotland (natural gas
combined cycle plant with post-combustion capture) and White Rose, Yorkshire (coal-fired
oxy-combustion). Construction and operation of these plants is essential to demonstrate the
viability of the full chain of CCS, to improve investor and public confidence in the
technology, to start to develop a commercial business and to start the process of ‘learning-by-
doing’. These plants will use first generation capture technologies but other technologies,
which offer the possibility of improved efficiency and lower costs, are currently at an earlier
stage of development and could possibly be used in CCS plants in the longer term.
One objective of this report is to assess what stage of development emerging CO2 capture
technologies have reached. Technology readiness level (TRL) is a measure of the
development status of a technology which was developed in the 1990s by NASA. Other
entities using the TRL system have provided additional descriptive language on top of the
primary framework in order to better connect the level definitions to fit their particular
industry or technology. EPRI has produced definitions of TRL levels for CO2 capture, shown
in Table 1 [Freeman, 2011].

12
Table 1 Technology Readiness Level (TRL) D
emonst
rati
o
n
9 Normal commercial service
8 Commercial demonstration, full scale deployment in final form
7 Sub-scale demonstration, fully functional prototype
Dev
elopm
ent 6 Fully integrated pilot tested in a relevant environment
5 Sub-system validation in a relevant environment
4 System validation in a laboratory environment
Res
earc
h 3 Proof-of-concept tests, component level
2 Formulation of the application
1 Basic principles, observed, initial concept
These definitions of TRL are used throughout the report. TRL level is not necessarily an
indication of the timescales until commercialisation because it does not indicate the difficulty
of overcoming the remaining development issues.
The report includes an overview of cost reduction for CO2 capture technologies in general,
which draws on discussions at CCS cost workshops organised by IEAGHG and others.
Examples of technologies under development for post-combustion, pre-combustion, oxy-
combustion, and solid looping processes for capture of CO2 at power plants are reviewed, and
new technologies specific to non-power industries are also discussed. The reviews quantify,
where possible, the potential cost improvements, although it is emphasised that estimation of
costs for new technologies is subject to considerable uncertainty.
2. Cost Progression for new technologies
Costs of CO2 capture, in common with many new technologies, are expected to reduce in
future due to a combination of ‘learning by doing’ and development, but estimating future
costs of new technologies is subject to considerable uncertainty. Techniques that are used to
estimate cost reductions include ‘learning curves’, engineering assessments and parametric
modelling.
2.1. Cost learning curves
Continuing cost reductions, mainly due to ‘learning by doing’ and incremental
improvements, are well recognised for a wide range of different technologies. It has been
observed that the rate of cost reduction remains approximately constant for each doubling of
installed capacity, although this is just a correlation and does not explain the reasons for cost
reduction. The rates of cost reduction have been significantly different for different
technologies. Indeed it should also be noted that costs do not always fall over time when the
extent of deployment of a technology increases. A particular example is nuclear power,

13
where costs have increased in real terms over the last 40 years, i.e. ‘negative cost learning’,
despite a large increase in deployment and continuing predictions that costs would fall
[UKERC, 2013]. It is therefore difficult to predict the rate of cost reduction that could be
achieved by CO2 capture processes. Historical information is available for technologies that
could be considered to be analogous to some extent to CO2 capture technologies, such as Flue
Gas Desulphurisation (FGD), Selective Catalytic Reduction (SCR), oxygen production and
liquefied natural gas (LNG) production but there is still no guarantee that the learning rates
for these processes would apply to CO2 capture processes [IEAGHG, 2006].
An important factor when predicting cost reduction is the extent of current deployment,
which is used as the baseline when calculating the doubling of installed capacity. Many of the
components used in CO2 capture processes are already widely used in other types of plants,
for example air separation plants, gas compressors and coal fired boilers. For the purposes of
calculating learning cost reductions a capture plant could be regarded as a single unit with an
overall learning rate or a collection of sub-units each with its own learning rate, depending on
the installed capacity of that type of unit in other applications as well as in capture plants. The
extent to which components used in CCS processes can be considered to be ‘new’ is an
uncertainty if they are modifications of designs that are currently used. For example, oxy-
combustion boilers are a modification of conventional air blown boilers and CO2 compressors
are a variant of other large gas compressors. The overall system may be regarded as ‘new’
and hence subject to learning cost reduction, even if the components are already widely used
in other applications.
Evidence of technology cost reductions are often masked or accentuated in the short term by
external factors. The supply/demand balance for materials, equipment, specialist labour and
services can affect production costs. The availability of subsidies etc. can also affect the price
charged for the finished equipment or plant. Costs may appear to increase in the short term
due to these market factors even though there is a continuing long term trend of cost
reduction, and conversely the market factors may accentuate the cost reductions in the short
term. Fluctuations in exchange rates and corrections used to account for general inflation, to
convert costs to a constant money value basis, can also affect perceived costs. Another
significant external factor can be increasing regulatory requirements, which can result in
increased costs.
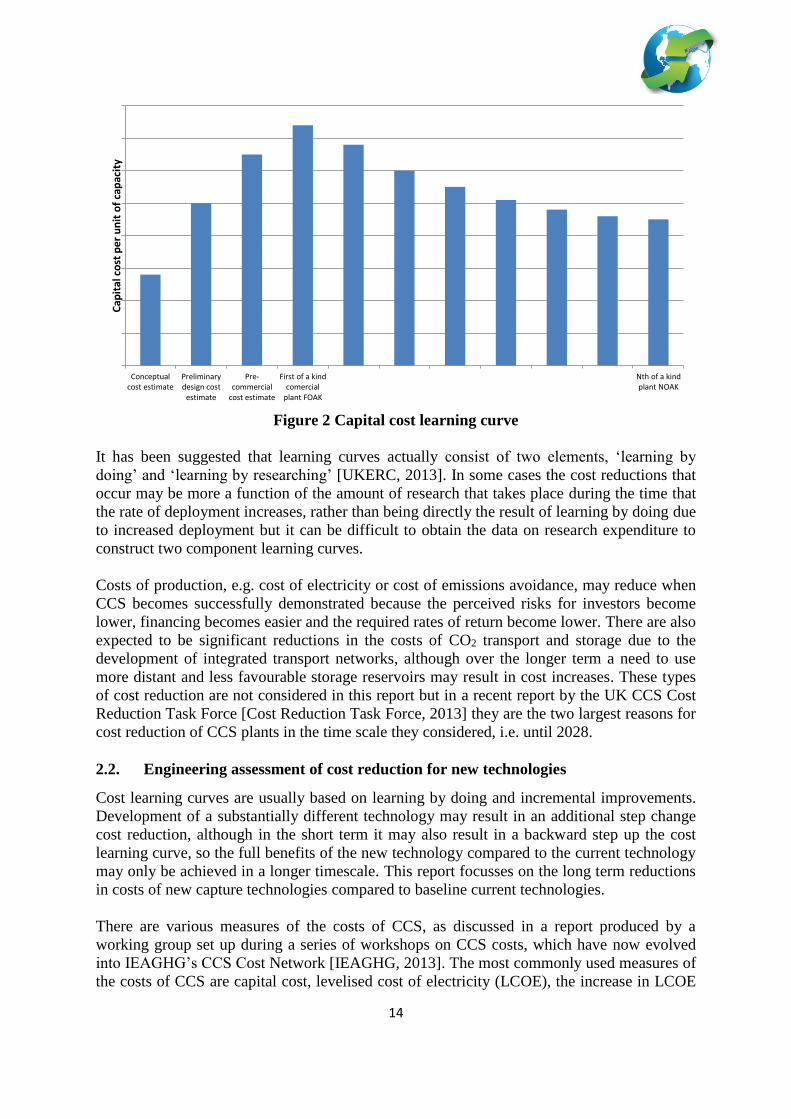
Although costs of new technologies tend to reduce when they are used at a greater scale, the
projected costs tend to increase during the time that a process is being developed, reaching a
peak around the time when the first large scale plants are built or shortly afterwards, as
shown in Figure 2. This can be explained for example by general optimism by the
researchers, a need to demonstrate large benefits to obtain development funding, inadequate
knowledge of the scope of equipment required, the absence of adequate engineering designs
for large scale units and the inability to achieve performance targets. Figure 2 shows costs
reducing immediately after the first plant but sometimes costs remain high for early plants
and there is a delay before the cost reduction for each doubling of installed capacity
commences [IEAGHG, 2006]. Note this figure is purely illustrative and it is not intended to
be an accurate indication of the magnitude of cost variations.
14
Figure 2 Capital cost learning curve
It has been suggested that learning curves actually consist of two elements, ‘learning by
doing’ and ‘learning by researching’ [UKERC, 2013]. In some cases the cost reductions that
occur may be more a function of the amount of research that takes place during the time that
the rate of deployment increases, rather than being directly the result of learning by doing due
to increased deployment but it can be difficult to obtain the data on research expenditure to
construct two component learning curves.
Costs of production, e.g. cost of electricity or cost of emissions avoidance, may reduce when
CCS becomes successfully demonstrated because the perceived risks for investors become
lower, financing becomes easier and the required rates of return become lower. There are also
expected to be significant reductions in the costs of CO2 transport and storage due to the
development of integrated transport networks, although over the longer term a need to use
more distant and less favourable storage reservoirs may result in cost increases. These types
of cost reduction are not considered in this report but in a recent report by the UK CCS Cost
Reduction Task Force [Cost Reduction Task Force, 2013] they are the two largest reasons for
cost reduction of CCS plants in the time scale they considered, i.e. until 2028.
2.2. Engineering assessment of cost reduction for new technologies
Cost learning curves are usually based on learning by doing and incremental improvements.
Development of a substantially different technology may result in an additional step change
cost reduction, although in the short term it may also result in a backward step up the cost
learning curve, so the full benefits of the new technology compared to the current technology
may only be achieved in a longer timescale. This report focusses on the long term reductions
in costs of new capture technologies compared to baseline current technologies.
There are various measures of the costs of CCS, as discussed in a report produced by a
working group set up during a series of workshops on CCS costs, which have now evolved
into IEAGHG’s CCS Cost Network [IEAGHG, 2013]. The most commonly used measures of
the costs of CCS are capital cost, levelised cost of electricity (LCOE), the increase in LCOE
Conceptualcost estimate
Preliminarydesign cost
estimate
Pre-commercial
cost estimate
First of a kindcomercial
plant FOAK
Nth of a kindplant NOAK
Cap
ital
co
st p
er u
nit
of
cap
acit
y
15
due to the addition of capture, and CO2 avoidance cost. Capital costs can be expressed as total
plant cost, including contingency, or total capital requirement, which also includes interest
during construction, owner’s costs, working capital and start-up costs. Costs of CCS should
normally include the cost of CO2 transport and storage, as transport and storage is an essential
part of CCS. However, when considering the costs of new capture technologies compared to
current technologies it is simpler to exclude transport and storage costs and that is the basis
used in this report.
Assessment of new capture technologies tends to focus initially on efficiency because this
can be evaluated scientifically and because the consequence of extra energy consumption is
large, and in some cases it contributes the largest part of the cost of capture. Discussions at
IEAGHG’s Cost Workshops have indicated that this may be the most meaningful metric for
assessing early stage capture technologies because the lack of large scale process and
equipment design information may make cost estimates meaningless. The first stage in the
assessment should be to look at whether the process is potentially technically feasible, based
on thermodynamics, kinetics, complexity etc. and only look at costs later. This approach is
taken in this report when meaningful cost information is not available. Examination of
detailed cost estimates for plants with capture shows that the greatest effect of reduced
efficiency is not usually the extra cost of the fuel but the capital charge which accrues for the
extra plant needed to consume the fuel, generate the electricity and process the additional flue
gases which are created.
As discussed earlier, costs of new technologies often increase until the time when large
commercial plants are built. Sometimes large ‘process contingency’ factors are used in cost
estimates to allow for incomplete estimates of the amount of equipment required and
optimism in system performance predictions but the use of high process contingencies may
bias cost estimates upwards inappropriately for new processes, resulting in the early rejection
of technologies that may in practice be able to achieve significant cost reductions. Another
way in which this underestimation is compensated in some studies is to use higher risk
factors when calculating the capital charge during LCOE estimation.
Costs of new technologies are usually compared to a baseline technology, for example to
show a percentage reduction in the cost of electricity, the incremental cost of electricity due
to capture, or the cost of CO2 emissions avoided. Selection of the baseline is an important
issue. The baseline should be the best currently available technology but it should be noted
that the costs of the baseline will improve over time due to general cost learning effects,
incorporation of incremental improvements and greater optimisation. Developers of new
technologies sometimes select an unfavourable baseline or a baseline based on old
technology to show a high cost reduction for their new technology. Ideally a common
baseline would be used for assessment of all new technologies but that is not always possible.
In many cases cost improvement data for new technologies from published references has to
be used and the details of the baseline case are not always clear. In this report a somewhat
conservative approach has been taken when considering baselines for steam conditions and
class of gas turbine. However, the adoption of more advanced conditions usually has positive
knock-on effects on the costs of capture.

16
2.3. Methodology for comparison of capture costs.
In the face of the above mentioned difficulties in assessing and comparing costs a
methodology has been developed for the purposes of this report in order to be able to make
meaningful comparisons of the various capture technologies which are under development.
Comparing capture costs is complicated as there are different ways of performing capture
with differing operating and capital cost structures. The costs of the three main conventional
technologies have been estimated and compared and these form a useful benchmark for
calibrating the costs of new capture technologies. This is for two reasons, firstly their costs
can be broken down into a number of elements and some of these are common to other
processes, especially those which are hybrids of the main ones. Secondly there are only a
limited number of ways in which the CO2 end product of combustion with oxygen derived
from air can be isolated. Different approaches to the key separations can thus be compared
and relative costs estimated.
As noted earlier, costs can be reported in several ways for comparison. The most useful are
costs per tonne of CO2 and this can either be the gross amount captured or the amount
avoided. The latter is a better measure of the effectiveness of a process for emission
reduction. The other main metric is the levelised cost of electricity, which is useful when
comparing capture processes in the power industry and is one which gives a much better feel
as to the costs relative to business as usual. It is calculated using discounted cash flow at a
constant present day electricity cost which gives zero net present value with a constant
discount rate and no tax. Thus the LCOE will be adopted as the main metric in the rest of this
report. There is a clear distinction between COE and LCOE. The latter is based on discounted
cash flow (DCF) calculations with no allowances for inflation over time. When examining
cost methodologies it is thus important to identify whether any allowances for inflation of
cash streams such as fuel or labour have been made or whether the declared discount rate has
been adjusted for effects of inflation. For a true comparison between technologies all of the
key factors used in the DCF calculation such as discount rate plant operating lifetime etc.
should be identical. (Table 2 illustrates that different organisations do use slightly different
discount and inflation assumptions) A feature of all the estimates is that the costs are made up
of capital and operating costs and usually these two elements are of similar size. Longer term,
when the capital investment in a plant has been written off, the operating element will be of
greater interest. It is this on-going operating cost which will determine whether it is viable to
keep the capture plant in operation. Part of this on-going cost though is related to the original
capital cost as this is usually in proportion to many elements of the on-going maintenance
costs.
During combustion, essentially a fuel containing both hydrogen and carbon is oxidised with
oxygen from the air which is of course mixed with nitrogen. The end products are water and
CO2 mixed with any residual components of air which are left after the combustion process
which has been used. Without the nitrogen and other inert gases in the air the recovery of
CO2 would be easy as the water formed can simply be condensed. The problem of CO2
capture is thus more about nitrogen separation.
In post-combustion capture nitrogen, some residual oxygen and water in the form of steam
are separated from CO2.
In oxy-combustion most of the nitrogen is separated from air before combustion leaving only
water/steam and some residual nitrogen, argon and oxygen to be separated from the CO2.
17
In pre-combustion capture some nitrogen is separated from air but the main separation of CO2
is from hydrogen and steam.
In all processes the separation from steam or water product occurs mainly through cooling
and condensation but all need to have a further drying step to produce sufficiently dry CO2 to
avoid corrosion during transport. Those processes which use cryogenics for CO2 processing
will generally need deeper drying to avoid equipment blockages due to ice formation.
Novel processes and hybrid processes can thus be analysed to determine what separations are
used and to do this it is useful to look not just at how CO2 is separated but also how the other
substances, i.e. N2, O2, H2, H2O are separated. In this way it is possible to identify how the
alternative approaches to these separations, when compared to those used in the conventional
capture processes, will compare in terms of both cost and thermodynamic efficiency. This
allows a judgement to be made as to the potential for overall cost reduction as compared to
the benchmark processes.
This approach will assist with calibrating estimates against one another. This differential
costing approach has been successfully applied for example in analysing the value of
additional heat integration of the CO2 compression system with the main capture processes in
a study for IEAGHG carried out by Foster Wheeler [IEAGHG 2011a].
Combustion of fossil fuels also results in production of impurities and inerts, most notably
sulphur compounds and nitrogen compounds. Ash and mercury are the other most significant
contaminants. These compounds also have to be handled in the processing to avoid emissions
to atmosphere and in some cases to protect the CO2 removal processes. The separations used
for these compounds can be included in the analysis.
In addition to separations of components various reactions are carried out on the fuel. In
simple power generation processes there is a single complete combustion reaction. However,
other processes employ a sequence of reactions and these may involve additional substances.
Integrated gasification combined cycle (IGCC) splits the combustion into two stages,
gasification followed by syngas combustion. In pre-combustion capture an additional shift
reaction is added. Solid looping technologies introduce metal oxides and carbonates as
intermediates, for example chemical looping combustion (CLC) involves two reactions:
oxidation of a solid oxygen carrier and reaction of this with the fuel. Mapping both the
reactions and separations assists in classifying the technologies for cost comparison purposes.
The comparison will thus proceed using the following initial steps.
Classify processes by the separations and reactions used
Select a benchmark process for each of the main capture routes
Identify which benchmarks are applicable for each of the novel or developing
processes
The next step is to analyse a detailed cost estimate for each of the benchmark processes to
identify the main elements which increase cost of electricity. Interdependencies and their
relationship to efficiency will also be assessed. It will also be necessary to identify any key
assumptions which are made, so that costs can be normalised if these differ between
estimates. The importance of these steps is illustrated by consideration of a detailed cost
estimating study made by the US NETL [NETL 2012], which compares costs of power

18
generation from coal without capture, with conventional post-combustion capture and with
two developing technologies – CO2 membranes and pressure swing adsorption (PSA).
Examination of cost estimates for pulverised coal (PC) power plants, with and without
conventional post-combustion capture, reveals the effect which the addition of capture has on
the various components of the estimate. It is important to understand how these effects are
distributed in order to appreciate how new technologies might reduce costs. In the case
considered, plants with equal net power output were compared requiring that many of the
components for the capture plant have larger capacity. The estimate reveals that about 66% of
the capital cost increase is due to the additional compression and capture equipment whilst
33% is due to increases in the coal handling, boiler, generator and utility systems needed to
compensate for the auxiliary power and heat loads. Furthermore, these indirect increases are
not distributed equally but depend on the extent to which the added capture process imposes
additional capacity on these various components. In the example the coal feed is increased by
a factor of 1.38 because more fuel is needed to generate additional power and to provide
stripping steam. On the other hand, the gross power output of the turbine/generator set
increases only by a factor of 1.14, reflecting the smaller percentage increase in electrical
auxiliary power as compared to use of thermal energy for the solvent regeneration.
These capacity increases do not necessarily translate into proportional cost increases. In the
case of the NETL 2012 estimate the coal handling facilities increase in cost by a factor of
only 1.23, whereas the handling capacity is up by a factor 1.38, implying a scale up exponent
for cost of about 0.63. The water system is increased in raw capacity by a factor of 1.9 while
costs are only 1.63 higher, implying a scaling exponent of about 0.76. The choice of scaling
methods for the necessary increase in capacity does thus have an effect on estimates of the
additional cost of adding capture. Choosing lower scaling exponents, either as the estimating
method or as a result of actual quotations, would result in reduction of the additional costs.
In the case of adding capture to a gas turbine based power plant the option to incrementally
increase the size of this portion of the equipment is not available since the turbines are of
fixed power rating. In that case the comparison has to be made on the basis of equal gross gas
turbine powers, which will result in larger differences between the LCOE in capture and non-
capture cases. The magnitude of the effect of the scale factor assumption can be calculated by
adjusting the cost figures for the main elements to be linear with the appropriate capacity
change with values chosen from fuel input, generator power or water consumption where
appropriate. This results in a further 25% increase relative to baseline no capture costs so is
not insignificant. The capital increase before owners and financing costs for adding Fluor’s
Econamine FG Plus process to a 550MW PC station was estimated (NETL 2012) at about
75% but would be about 100% if account is not taken of economies of scale.
The above insights into the capital cost structure need to be taken into account when making
comparisons of capture technologies. For the purposes of this report the costs will be adjusted
to reflect those for plants of equal gross thermal capacity, i.e. of equal fuel consumption. To
do this a set of cost/capacity scaling exponents will be chosen for the different elements of
the plant for use when such scale effects need to be taken into account.
A further issue that arises is the way in which capital expenditure (CAPEX) is reflected in the
cost of electricity. The “capital charge” which is calculated will depend on several factors,
notably, stream factor, project lifetime and financing structure. The financing structure affects
the “cost of capital” because estimates sometimes assign higher costs of borrowing for more
19
risky technologies. For this study the basis for cost comparison should be nth of a kind
(NOAK), which means that the cost of financing will be adjusted to be equal to that for
conventional power plant.
2.4. Cost comparisons – breakdown into elements
The extra cost of producing electricity for a plant fitted with capture is generally divided into
two main components. Those for additional equipment and those for capacity increases in the
base plant due to increases in use of auxiliary power and/or thermal energy. In some cases
major sections of a conventional plant may be replaced by alternative power generating
technology (for example a fuel cell) and usually there will be larger overall capacity to
provide the extra auxiliary energy streams needed to drive the separation processes. The cost
comparison will thus identify the main sources of difference in these two categories, i.e. extra
separation processes and additional energy production.
The cost of electricity is made up of the capital element and the variable element. The
variable element is made up of three main components; fuel, other variable operating
expenses such as chemicals and consumables, which are dependent on production, and a
fixed element which includes such things as operating and maintenance labour. A proportion
of any increase in the fixed costs could be attributed to higher overall capital cost and a
proportion of the variable costs could be attributed to the higher requirement for auxiliary
energy. For the existing well established post-, oxy- and pre-combustion alternatives the cost
increases for capture will be broken down and attributed to these categories. For the emerging
technologies the effect on costs will be assessed in the same way, as far as the currently
available information allows. In the next section the breakdown of costs for the conventional
capture benchmark technologies is described.
2.5. Cost comparisons – relationship between LCOE increase and cost of CO2/tonne
The LCOE increase is used as a key indicator for comparison. However, sometimes there is
interest in the actual cost per tonne captured and particularly per tonne avoided as this can be
related to prospects for CO2 emission certificate prices. Rather than quote both figures the
relationship between these two values is presented here, as this can be related to the LCOE
increase and the baseline emissions and the ratio between baseline and capture plant electrical
efficiency.
The cost per tonne avoided is the cost increase per kWh divided by the CO2 avoided per
kWh. This latter is the baseline emission per kWh less the baseline emission times the ratio of
efficiencies baseline/capture plant times the uncaptured fraction.
Eb = baseline emission g/kWh
Effbase = baseline efficiency
Effcap = capture plant efficiency
C = captured fraction
Cost per tonne avoided = (LCOE increase $/MWh) / (Eb – Eb x Effbase / Effcap x (1-C)) x103
For post-combustion the baseline example has Eb = 802 g/kWh, Effbase = 39.3% , Effcap =
28.4%, C = 0.9. LCOE increase is 44.4 $/MWh, so that cost of CO2 avoided is $64.3/tonne.

20
2.6. Using LCOE increase to estimate cost of CO2 avoided
Because of the close relationship between LCOE and cost of CO2 avoided it is possible to
estimate the latter with reasonable accuracy if the percentage LCOE increase is known and
also the cost and efficiency of an appropriate baseline plant. Figure 3 below is an example
and allows this conversion to be made for capture processes which are adaptations from a
baseline of a coal-fired PC plant.
Figure 3 Cost of CO2 avoided v base plant LCOE and LCOE% increase due to capture
Although the cost of CO2 capture can be derived from the increase in levelised cost of
electricity (LCOE), the plant electrical efficiency and the carbon content of the fuel; unlike
the metric of percentage increase in LCOE; it is an absolute measure which will vary
according to currency, region and year of the estimate. Furthermore, the assumptions on
which the LCOE calculations are based will also introduce variations. The variations which
might be found in the latter are illustrated in Table 2, which summarises some of the key
assumptions used by DECC, SINTEF, NETL, US EIA, EBTF and Fraunhofer Institute in
recent studies [DECC 2012, Jordal 2012, NETL 2012, US EIA 2014, CAESAR 2011, Kost
2013].

21
Table 2 Comparison of baseline LCOE estimates from different sources
Note the variation in assumptions for discount rate and plant operating lifetime and the
variations in the LCOE which the different studies report as a result. It is thus recommended
that capture costs are compared by first evaluating the % LCOE increases reported and then
converting these to costs per tonne using the same baseline LCOE.
2.7. Improving cost comparisons between diverse CO2 capture technologies
Although much literature is available on costs of emerging technologies it would be useful if
future estimates could be guided towards use of a more consistent basis, making comparisons
more meaningful. In order to do this a methodology for generating costs is proposed which
makes use of cost elements which are common to the processes being compared.
The conventional approach to making cost estimates is to identify the size and characteristics
of all the main pieces of process equipment for a plant fitted with capture and a reference
plant without capture. This means that a process flow scheme has to be developed along with
basic heat and material balances. This can be an expensive and time consuming task and
estimating the cost of novel types of equipment can be difficult. The task can be somewhat
simplified once the cost consequences of adding parasitic power have been analysed, as that
element of cost increase can be estimated as a percentage of that for the baseline plant. This
does however require a thermodynamic analysis of the process to identify exactly what the
parasitic thermal and electrical load increases will be. However, this is potentially simpler
than developing a full process design for the power plant.
A simple estimate of the rest of the capture plant could then be made on a parametric basis by
breaking it down into a number of complete sub-systems for which individual costs might be
found. Sub-systems which might be amenable to this approach are ASU’s, low pressure (LP)
and high pressure (HP) gas liquid contacting systems, refrigeration systems and CO2
compression/drying. A good example is air separation where the cost of an ASU could be
roughly estimated as a function of its oxygen capacity. This approach does not of course
allow investigation of developments in ASU technology for which more detailed estimating
methods would be needed. However, many capture processes, for example calcium looping,

22
IGCC, and IGFC, utilize a certain amount of oxygen and optimization of the ASU is not the
main driver of cost reduction. Similarly, gas/liquid contacting units’ capital cost could be
estimated simply as a function of the flow of treated gas. Refrigeration systems could
similarly be treated as a process block for estimating purposes with refrigeration duty and
lowest temperature as key variables. The coefficient of performance (COP) of refrigeration
systems is closely linked to the cold temperature required, enabling simple estimates to be
made of the power consumption for compression based systems.
Allowance can be made for easily identifiable secondary cost drivers such as oxygen purity
with information often readily available from the literature.
The great advantage of this systems approach is that the alternative of a bottom up, item-by-
item equipment approach often results in different results for the same basic system and is
also much more time consuming to undertake.
The proposed approach for comparative assessment across a wide range of diverse processes
is illustrated in Figure 4. The aim is to minimize repeats of detailed cost engineering on those
parts of the system where it is not needed and where doing so may even reduce the
comparability of overall estimates.
Where parts of the capture plant cannot be represented by standard systems, an equipment
based cost estimating approach is all that is left. Here it is also possible to work at higher
levels by grouping the remaining equipment into broad categories. A first split could be
between rotating equipment and fixed equipment; and fixed equipment being subdivided into
heat exchange and vessels, the latter covering all columns, reactors, fluidized beds, adsorbers
etc. Power, area and volume can be the primary cost drivers and a cost factorial approach
used to account for different subtypes, internals, fills and materials of construction. Scaling
exponents should also be used the same way as for complete sub-systems. Since the
percentage of the costs attributable to parts of the process estimated in this way may be quite
small, estimates can be rough without unduly affecting overall cost comparisons.
There remain a few processes that are fundamentally so different from the conventional
power generation process, that only stand-alone detailed engineering estimates can be used
and a step-out approach is not possible. For example processes involving fuel cells, fluidised
beds or novel turbines.
In summary, a simple cost comparison system is proposed based on two elements. The first is
an estimate of the costs of the parasitic power and the second an estimate of the capital and
direct consumables costs for the capture facility. For the second element, costs for complete
subsystems should be sought wherever possible rather than using the more detailed
equipment based method. An approach along these lines is described in a recent SINTEF
report investigating hybrid cryogenic CO2 separation systems [Jordal 2013]. A very simple
system was developed some years ago by IEAGHG, specifically for the purpose of
comparing novel capture technologies [IEAGHG 2005a]. It is however beyond the scope of
this study to develop such a system any further.

23
The procedure described above is illustrated in Figure 4 below.
Figure 4 Parametric estimation of additional costs of CO2 capture
2.8. Thermodynamic considerations
2.8.1. Combustion of fuel and conversion to work
When fuel is reacted with oxygen from the air in a process designed to convert the energy in
the fuel to electrical power, only a portion of the free energy of the combustion reaction can
be converted to power. Theoretically, in a reversible electrochemical process all of the free
energy could be converted. This would be the ultimate potential efficiency for a fuel cell.
However, the normal processes all rely on thermal energy to work conversion processes
which have limits to their efficiency. The maximum efficiency for these processes is the
Carnot efficiency, which is calculated as a simple relationship involving only the starting
temperature at which heat enters the process and the temperature at which is rejected after
extraction of work. The formula is (Tin-Tout)/Tin. In practice, because of inefficiencies in
turbo-machinery, processes are only able to reach about 73% of the Carnot efficiency.
The efficiency of processes is usually calculated on the basis of the amount of electrical
energy produced divided by the heat of combustion, which is derived from the standard
enthalpy of formation of the fuel. In fuels containing hydrogen the enthalpy change depends
on whether the final product H2O is in the liquid or gaseous phase. The former gives the
higher heating value (HHV) and the latter the lower heating value (LHV). Note that the

24
Standard Gibbs free energy of formation differs slightly from the standard enthalpy of
formation.
Thus the theoretical efficiencies for a perfect electrochemical conversion of pure methane,
pure hydrogen and pure carbon fuels are as follows.
Table 3 Theoretical electrochemical conversion efficiencies of fuels
Combustion reaction
Free energy change
∆Gf0 kcal/mol
Enthalpy change
∆Hf0 kcal/mol
Theoretical efficiency
Methane to CO2 and 2H2O(g) 191.3902 191.7588 99.81
Methane to CO2 and 2H2O(l) 195.4998 212.7978 91.87
Carbon to CO2 94.26 94.052 100.22*
Hydrogen to steam 54.6351 57.7979 94.53
Hydrogen to water 56.6899 68.3174 82.98
*> 100% as ∆Gf0 is slightly greater than ∆Hf
0
Table 4 shows the theoretical efficiencies and practically attainable efficiencies based on
LHV for combustion of pure methane, pure carbon and pure hydrogen. Attainable
efficiencies are presumed to be 73% of theoretical Carnot efficiency which is typical of
current technologies. The table also shows the typical temperature limitations which apply to
gas turbines and steam boilers at present.
Table 4 Theoretical and practical efficiencies attainable from combustion based power
processes (LHV basis).
Adia
bat
ic f
lam
e te
mp °
C
Max
. usa
ble
tem
p °
C
Car
not
effi
cien
cy %
Pra
ctic
al e
ffic
iency
bas
ed
on f
lam
e te
mp %
Car
not
effi
cien
cy w
ith
tem
per
ature
lim
itat
ion %
Pra
ctic
al e
ffic
iency
wit
h
tem
per
ature
lim
itat
ion %
Theo
reti
cal
elec
tro-
chem
ical
eff
icie
ncy
%
Theo
reti
cal
elec
tro-
chem
ical
to t
her
mal
advan
tage
%
Methane air 1950 1500.0 86.1 62.89 82.63 60.3 91.87 5.7
Methane O2 2810 1500.0 90.0 65.71 82.63 60.3 91.87 1.9
Anthracite air 2180 650.0 87.4 63.83 66.63 48.6 100.22 12.8
Anthracite O2 2900 650.0 90.3 65.91 66.63 48.6 100.22 9.9
H2 air 2210 1500.0 87.6 63.94 82.63 60.3 82.98 -4.6
H2 O2 3200 1500.0 91.1 66.53 82.63 60.3 82.98 -8.2
From the table it can be seen that there is a small efficiency gain of around 2.5% still
available to air consuming gas turbines simply by raising inlet temperatures towards the
flame temperature. Further gains would require other forms of improvement. Raising
temperatures in steam boilers has much larger potential of nearly 18% but would require tube
materials far beyond what is practical or affordable at present. Indeed current research (for
example the European AD700 project) is aimed at a relatively modest increase to 700ºC. The
last column shows the potential advantage of following an electrochemical route which is

25
quite significant for methane. The same applies to carbon, although an electrochemical route
involving solid fuel would be physically difficult to achieve even at laboratory scale.
Interestingly the electrochemical route is less favourable for hydrogen, which certainly raises
questions about the competitive efficiency of a fuel to hydrogen to electricity process route
by a fuel cell.
2.8.2. Energy required for separation of gases
When two ideal gases are allowed to mix there is an increase in entropy and the free energy
of the mixture is reduced. In order to re-separate them this free energy reduction has to be re-
supplied to the gases in the form of work. The amount to be supplied is relatively modest but
the processes which can be used to perform the separation are very inefficient so that many
times the theoretical minimum has to be used. To illustrate this the theoretical energy
required to separate oxygen is around 0.18 GJ/tonne depending on purity required whereas a
cryogenic oxygen plant might consume 1 GJ/tonne. Thus 5 times as much energy has to be
consumed as the work actually required for the separation. That does not mean that any
practical process could approach this energy consumption. Firstly, the energy is in the form
of work and even the best power plants are only 60% efficient which already sets an ultimate
limit of 0.18/0.6 = 0.3GJ/tonne on the basis of fuel energy input. This energy then has to be
utilised in processes such as compression where further losses are experienced. The main
energy input to a cryogenic separation plant is as electrical power to the main air compressor.
The overall efficiency of a large compressor may be only 80% because of frictional, electrical
and aerodynamic losses so that the ultimate limit is already reduced again to 0.3/0.8 =
0.375 GJ/tonne. Thereafter there are losses because of temperature differences in heat
exchange and in the distillation process.
Similarly, recovery of most of the CO2 from the flue gases of a coal plant requires a free
energy change of about 0.15 GJ/tonne, whereas typical processes will consume 2.5 to over
4 GJ/tonne. The two main reasons for these very low thermal efficiencies, often only a few
percent, are thus that the theoretical separation energy is for work rather than thermal energy
and because every process in the separation system needs a driving force, whereas the
theoretical figure is based on reversible processes with no driving force. A practical process
must create sufficient driving forces in the form of concentration, pressure, temperature or
chemical potential gradients. Furthermore, to achieve a practical size of equipment large
gradients are needed and energy and material flows over such gradients incur significant
energy and hence efficiency losses.
A simple illustration of the obstacles to achieving energy efficiency for separation close to
the theoretical would be the use of a membrane for separation of CO2 from flue-gas.
Theoretically a compressor could draw the CO2 through a perfectly selective membrane. The
first practical problem is that if all the CO2 was to be recovered, the suction pressure would
need to be zero and the compressor would be infinitely large. Thus a set of membranes each
connected to a compressor of successively lower suction pressure could be used with a limit
to the lowest pressures so that only say 90% of the CO2 is recovered. What at first sight might
seem a simple and efficient process has a significant limitation to the recovery efficiency. For
a typical coal-fired power station flue-gas, containing 14% CO2, this compromise of 90%
recovery would need a highest compressor suction pressure of 0.14 bar absolute and a lowest
of 0.014 bar absolute. Furthermore, to reach the minimum separation work each compressor
would have to be isothermal, thus consisting of many small stages with inter-cooling. Lower
pressure stages could however feed into higher pressure stages, limiting the amount of
26
machinery required to some extent. In practice there would also be a resistance across the
membrane so that the compressors would have to operate at pressures somewhat below the
partial pressure of CO2 on the other side of the membrane thus increasing their power
requirement. Reducing the differential would reduce the power but would require increased
membrane area so that a practical balance has to be struck. Dividing the system into more
than several stages would entail an over-complex plant and these practical limitations to how
“work” can be applied to perform a gas separation underlie the low efficiencies of the many
different types of processes which can be used. This example illustrates the many practical
barriers to performing gas separations with energy inputs approaching anywhere near to the
theoretical minimum.
Examination of the combination of power production and CO2 separation processes shows
that there are synergies between the power production and gas separation tasks which can be
exploited to reduce costs and increase thermal efficiency. Further synergies are to be found
between the gas separation task and other major process industries. Examples in power
production are the use of combustion air as a sweep gas in membrane separation processes,
and the use of steam both as a working fluid and a chemical reagent in the fuel conversion
process. Examples in wider industry are use of LNG for CO2 condensation or anti-
sublimation, use of calcium oxide/carbonate for CO2 removal and as a constituent in cement
clinker manufacture.
2.8.3. Relationship between energy consumption for capture and costs
Addition of a capture process will add a number of unit operations each of which will require
input either of work or thermal energy. Each unit operation will reject some or all of the input
energy as heat at a lower temperature than supplied. This rejected heat is available for
conversion to work and hence electrical energy if it is at a high enough temperature. In some
cases (e.g. turbo expansion processes) work input in one operation (e.g. compression) can be
recovered as work in a subsequent process (e.g. turbo-expansion). The additional generating
capacity which has to be added to maintain net power output when a capture process is added
will be the amount of work consumed as a result of the addition less the amount of work
which can be recovered by using the heat or power rejected by the capture processes. Note
that part of the additional work is needed to increase the capacity of the normal power plant
auxiliaries. This defines the increase in the size of the generation unit and driver.
The additional fuel which has to be consumed is in part due to that required to generate the
extra power. However, where heat is consumed by processes this will require an additional
amount of fuel. This amount of additional fuel is determined by the amount of heat but is
reduced if the heat is rejected at a temperature high enough to be used in the power
generation process and has an appropriate destination. Heat at or above the saturation
temperature of steam at the LP turbine inlet pressure has such a destination but below this
temperature the main destination is feed water heating for which there is strictly limited
capacity. The reduction is in the ratio of the amount of heat multiplied by the efficiency
which corresponds to its temperature or the maximum utilisable temperature in the process
whichever is the lower. A consequence of this is that heat consumed and then rejected while
still above the maximum temperature useable in a steam raising coal plant of around 650ºC
would not in theory require any additional fuel to be consumed. The heat flowing through the
process would thus effectively be free. Again, where extra fuel has to be consumed this is
further increased by any auxiliary power consumed by those units whose capacity is
primarily set by fuel flow.

27
In most capture processes a significant element is compression of CO2 and it is thus possible
to subdivide the additions for capture into the compression element and the rest of the
processes. CO2 compression is a consumer of work, some of which is rejected as heat that can
partly be recovered and converted back to work. In assessing the potential efficiency of a
capture process the recovery of rejected heat needs to be taken into account and in order to
make a balanced comparison the same cut-off criteria for implementing heat recovery need to
be applied.
In order to make comparative estimates of cost it is useful to identify by how much the
thermal capacity and the electrical capacity of the plant needs to be augmented to provide the
energy inputs needed by the capture processes. Analysis of the work and thermal
requirements along with their heat rejection characteristics enables this to be estimated and
this approach will be used wherever possible in making comparison of the cost of electricity.
Furthermore it would also be useful to be able to attribute costs for increasing the size of
elements in the base plant to the different elements of a capture process in order to assess the
scope for cost reduction.
NETL has produced a suite of studies which contain detailed estimates, using a consistent
methodology, covering post-, pre- and oxy-combustion capture processes [NETL 2008,
NETL 2010, NETL 2012, NETL 2013]. Analysis of the detailed capital cost estimate [NETL
2012] prepared for the Fluor Econamine FG Plus process has been performed to identify the
contributions which consumption of extra fuel and power make to the cost of electricity. This
shows that consumption of extra fuel and power accounts for about 37% of the increase in
LCOE whilst the remaining 63% is attributable to the additional capture equipment. It also
shows that there is a slightly higher LCOE penalty for utilising extra power. A 1% increase in
fuel consumption to provide thermal energy results in a base plant LCOE increase of 0.82%,
whereas for the same percentage increase in power consumption a 0.95% increase in base
LCOE results. It is slightly higher because the electrical power generation components have
to be larger. Note that these are percentage increases. Where electrical power is consumed by
the capture process instead of thermal energy, the absolute consumption of fuel increases far
more due to the inefficiency of the process converting thermal energy to electrical energy.
For the purposes of comparative evaluation in this study a thermal to AC electrical energy
conversion efficiency of 40% has been used when no other value is available.
2.8.4. Costs – Conventional post-combustion capture
The extra cost of producing electricity for a plant fitted with conventional post-combustion
capture technology is made up of two main elements. Using the recent NETL 2012 study as
reference, the additional costs of electricity are attributed to an 88% increase in the capital
element and a 52% increase in the operating cost element. However, the capital element is
reported at a slightly higher value than the basic 76% increase in overnight capital cost as
higher risk factors are used in calculating the cost of capital. For strict comparison purposes
the capital element should be adjusted downwards accordingly to respect the NOAK
estimating basis. The estimate recognises 12 relevant subsections, 7 of which are closely
related to thermal capacity, one to gross electric power output, one to cooling water (CW)
load and 4 are more general categories which are affected by a variety of factors. It thus
allows the effect of the changes in thermal and electrical loads introduced by adding capture
to be linked directly and proportionately to capital costs. For evaluation of other post-
combustion type technologies the same factors will be used for estimating how capital costs
will change.

28
The assessment of variable cost differences is somewhat easier. Standard prices for fuel and
key process materials such as limestone sorbent will be used. An element of the fixed costs
will be presumed as being proportional to the capital cost using a suitable percentage.
The other factorial adjustments which need to be made are for cost of capital and year of
estimate. Capital charge will be based on total overnight cost escalated to 2014, converted
where necessary to US$ to which a fixed factor will be applied representing a 30 year
lifetime, low risk financing route as adopted for the base power plant in the NETL study of
post combustion capture technologies [NETL 2012]. LCOE is a factor 1.47 higher than COE
due to the effects of the inflation assumptions which are assumed to be zero for the LCOE
calculation. The uplift from the 2007 baseline to 2014 based on the CEPCI index is a factor
1.08.
CO2 removal from flue gas by absorption in an amine based solvent process is one of the
leading technologies for post combustion capture (PCC). There has been continuous research
effort to reduce the energy penalty and cost of CO2 avoidance for the CO2 absorption process.
The research work undertaken has focused on improvements in solvent characteristics,
modifications to the process flow scheme and heat integration.

29
Solvent
Improvements
Absorption Capacity
Absorption Rate
Energy for
Regeneration
Degradation
Corrosion
Environmental Impact
Solvent Cost
3. Post combustion capture
3.1. Improvements to amine solvent absorption
Regarding solvent development, different amine based solvents have been developed such as
precipitating 2-Amino-2-methyl-1-propanol (AMP) + carbonate solvent process; activators
such as Piperazine and Triethylenetetramine have been used to improve the absorption rate
for existing solvents such as Monoethanolamine, 2-amino-2-methyl-1-propanol,
Diethanolamine etc. The focus for these newly developed solvents is on improving the CO2
absorption rate, absorption capacity and heat of regeneration. It is also important to focus on
developing fundamental data such as: vapour liquid equilibrium, absorption rate constant,
enthalpy of absorption and heat capacity for newly developed solvents at real process
conditions and especially at the stripper conditions (~120°C and ~1.5 Bara) (see Figure 5).
Figure 5 Important factors to be considered when developing a solvent for CO2
absorption process.
With regard to process improvements, various process modifications have been proposed in
the literature such as: Split flow process, Heat pump distillation with a Split flow process,

30
Absorber Intercooling, Matrix stripping, Multi stage stripping, Lean Vapour recompression
etc. Currently the evaluation of these process improvements focuses mainly on the energy
requirement for the CO2 capture plant and for conventional amine based solvent
(Monoethanolamine). However, it is also important to focus on evaluating these process
improvements on the basis of the process economics as well as for improved solvents.
Currently IEAGHG is looking into these different process modifications on the technical and
economical basis for coal and natural gas based power plant. Moreover, in the current state of
power plant operation, it is also important to evaluate these process improvements on the
basis of plant dynamics and process control during full and part load conditions. IEAGHG
has in undertaking a project on developing process control strategies for different operating
conditions for post combustion capture processes at coal and natural gas based power plant.
The environmental impact of the amine based CO2 absorption process is an important area to
be further understood. In order to avoid amine emissions to the atmosphere, it is important
first to develop an understanding of different amine based solvent degradation rates under
real process conditions. Further, it is also important to develop suitable emission monitoring
technologies such as Fourier transform infrared spectroscopy (FTIR). Aerosols can be present
in the treated gas leaving the absorber, which can be reduced by having suitable plant
operational conditions such as water wash temperature control to minimise aerosol emissions.
Further evaluation of flue gas filters and their effectiveness in avoiding aerosol emissions
needs to be performed. Moreover, other options such as an acid wash on top of the absorber,
maintaining a suitable acid wash liquid pH and salt concentration can also be an effective
method to reduce emission of other alkaline components (e.g. MEA, degradation products,
etc.) Another suitable emission reducing technology demonstrated at pilot plant scale is to
have an adsorption bed above the absorber, which will require no additional liquid stream; no
waste stream generated and will have very little pressure drop. This adsorption bed
technology has been tested successfully at RWE Pilot plant Niederaussem, Germany. A
recent IEAGHG study on ‘Evaluation of reclaimer sludge disposal from Post Combustion
CO2 capture’ looked into different reclaiming technologies such as; thermal reclaiming, ion
exchange and electrodialysis for conventional solvents on the basis of their technical and
economic performance. Furthermore different reclaimer waste disposal options such as
landfilling, co-firing in a boiler, using in a cement kiln and waste water treatment were also
evaluated.
Currently there are several solvent based pilot plant and demonstration projects in
operation/construction/planning around the world. These pilot plant operations based on
different post combustion technologies have successfully demonstrated the applicability of
the amine based solvent CO2 absorption process. These pilot plants have identified
improvements in the technology which will result in reducing both the capital and operational
costs. Also, from these pilot plants robust procedures, operating guarantees and competitive
performance have been developed. These pilot plant tests have provided invaluable
knowledge for incorporation into the full commercial deployment of PCC technology.
In addition to the process modification and improved amine solvent described above, various
novel technologies are being researched to improve the efficiency, environmental
performance and costs of post combustion capture. The main technologies are described
below and their environmental impacts, energy consumptions, material/solvent costs and
costs of CO2 avoidance compared to current solvent scrubbing technology are summarised in
tabular form at the end of this section of the report.

31
3.1.1. Cost reduction potential of improved solvents
Fig 5 identifies 7 areas of improvement for conventional capture and in this section an
estimate of the potential for reduction of LCOE through each type of improvement will be
made and the particular elements of the LCOE which are likely to be affected will be
identified. Some of the areas are closely interrelated and this interdependency will also be
discussed.
The provision of the thermal energy for regeneration causes increases in the coal receiving
and handling facilities, the boiler, feedwater system, flue gas clean up and ash/spent sorbent
handling systems more or less in proportion. Generating capacity is not directly affected and
other systems will only increase in cost to a minor extent. This element of the base plant
represents 67% of the capital cost. Compression power and additional power for the induced
draft fan and solvent circulation pumps are the main additional electrical auxiliary loads. The
turbine/power generator represents only 13% of the total cost and also has to increase when
energy to the capture process is supplied as work. Cooling water systems represent only 4%
of the cost and other systems such as instrumentation, general electrical distribution and
buildings are the final 16%. Cooling water can be considerably increased if the process
rejects a lot more low grade heat but the other elements are less affected by fuel or power
increases.
When the fuel or electric power systems are increased in capacity their associated electrical
loads also increase so there is a small multiplying effect. In the base plant the electric
auxiliaries are 5.2% of the gross power so for every 10% increase in power for the capture
process a further approximately 0.5% is required to provide for the increase in these.
Analysis of the NETL 2012 estimate reveals that the additional thermal and electrical loads
require a 38% increase in fuel and a 14% increase in total power. The increase in auxiliary
power can be divided into three elements: compression power, power for and directly related
to the Econamine FG Plus process (e.g. extra power for the induced draft fan to overcome
pressure drop) and finally additional power related to the increase in thermal energy for the
Econamine FG Plus process. The calculated division is shown in table 5 below.
Table 5 Typical breakdown of parasitic energy requirements for solvent based PCC
User of extra auxiliary power % of extra auxiliary power
CO2 compression 42% of which 2% indirect
Econamine related electrical power 24% of which 1.2% indirect
Econamine related thermal energy 34% all indirect
The 38% extra fuel is partly for generating the extra power for compression and the
Econamine FG Plus process (14%) and partly for providing additional thermal energy for
solvent regeneration (24%). Overall the approximate division is that 42% of the 14% extra
fuel for extra auxiliary power is for CO2 Compression i.e. about 5.9%. The Econamine FG
Plus process demands 24% more fuel for its thermal requirement and 58% of the 14% i.e.
8.1% more for the extra power demands. These factors can be used to give some insight into
the potential cost reductions which solvent improvements could offer. They are based on the

32
cost breakdown used by NETL and other analyses may produce slightly different
breakdowns.
Apart from those elements of cost directly associated with either fuel rate or power there are
5 other more general elements each of which increases primarily as a result of these increases
but also as a result of addition of the capture process. To estimate the effects of the additional
fuel and power these costs also need to be allocated.
Before doing this an adjustment is made to reflect the fact that the estimate made by NETL is
for a larger gross capacity and beneficial scaling effects have been taken into account. The
adjustment is made by factoring each of the base plant cost elements up to reflect their true
percentage capacity increase. The capture plant cost is then escalated with an exponential
scaling factor of 0.75. The unit costs per MW are then in line with what those of a 550MW
gross plant with capture would be.
The costs of the 5 general systems are firstly split between costs for the capture plant and
costs for the fuel and power capacity increase. A basis for this first split could be the ratio of
additional base plant costs to new capture plant costs which in the adjusted NETL estimate is
roughly 39:61. Within the assumed 39% contribution of these systems to the base plant cost
increase a further split in the ratio 13:67 between power generating cost increase and fuel
related cost increase is made (i.e. 16% and 84%).
This translation into the effects on the capital and hence capital charge element of LCOE
results in the split summarised in Table 6 and Figure 6 below.
Table 6 Contributions to increased LCOE of main users of parasitic energy in solvent
based PCC
Element Contribution
to 38%
Extra Fuel
Share of
Extra
power
contribution
Extra fuel
cost
contribution
Extra
power cost
contribution
Total
contribution
CO2 Compression 5.9% 42% 13.0% 6.7% 19.8%
Econamine FG plus
related electrical
power
8.1% 24% 17.9% 3.8% 21.7%
Econamine FG plus
related thermal
energy
24% 34% 53.1% 5.4% 58.5%
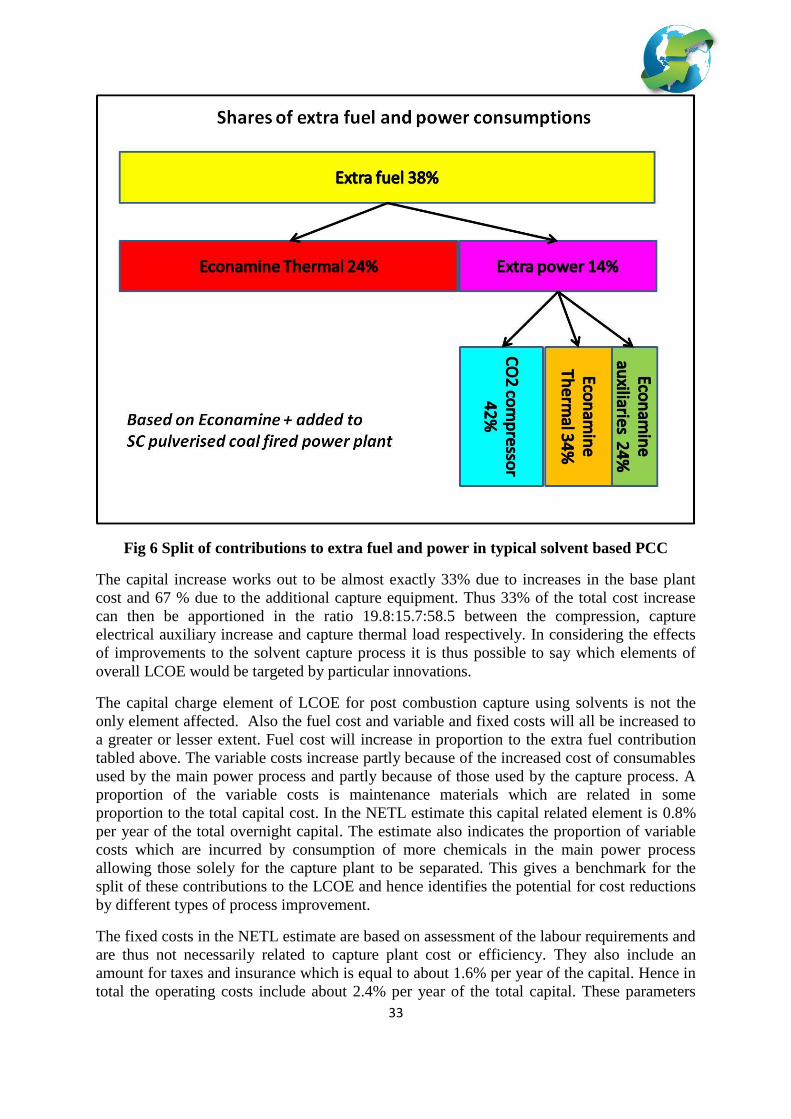
33
Fig 6 Split of contributions to extra fuel and power in typical solvent based PCC
The capital increase works out to be almost exactly 33% due to increases in the base plant
cost and 67 % due to the additional capture equipment. Thus 33% of the total cost increase
can then be apportioned in the ratio 19.8:15.7:58.5 between the compression, capture
electrical auxiliary increase and capture thermal load respectively. In considering the effects
of improvements to the solvent capture process it is thus possible to say which elements of
overall LCOE would be targeted by particular innovations.
The capital charge element of LCOE for post combustion capture using solvents is not the
only element affected. Also the fuel cost and variable and fixed costs will all be increased to
a greater or lesser extent. Fuel cost will increase in proportion to the extra fuel contribution
tabled above. The variable costs increase partly because of the increased cost of consumables
used by the main power process and partly because of those used by the capture process. A
proportion of the variable costs is maintenance materials which are related in some
proportion to the total capital cost. In the NETL estimate this capital related element is 0.8%
per year of the total overnight capital. The estimate also indicates the proportion of variable
costs which are incurred by consumption of more chemicals in the main power process
allowing those solely for the capture plant to be separated. This gives a benchmark for the
split of these contributions to the LCOE and hence identifies the potential for cost reductions
by different types of process improvement.
The fixed costs in the NETL estimate are based on assessment of the labour requirements and
are thus not necessarily related to capture plant cost or efficiency. They also include an
amount for taxes and insurance which is equal to about 1.6% per year of the capital. Hence in
total the operating costs include about 2.4% per year of the total capital. These parameters

34
can be used to give an estimate of the effect which solvent improvements might have on cost
of electricity. Thus when total capital increases there is an associated element of operating
cost increase which for the NETL estimate amounts to a further 20% of the capital charge.
The apportionment of the extra operating costs to LCOE are shown in figure 7 below.
Percentages are based on the NETL cost estimates adjusted to reflect plants of equal gross
power output and low risk Nth of a kind financing. The figures are rounded off and will be
used as part of the benchmark for evaluating cost reduction potential. It should be borne in
mind that this is just one benchmark estimate and others may result in slightly different
apportionment.
Figure 7 Split of contributions to additional OPEX in typical solvent based PCC
Reductions in regeneration energy will reduce fuel costs, the capital charge element
associated with extra fuel consumption, and parts of the variable operating costs which are
dependent on the fuel consumption or fuel consumption related capital cost. From this
analysis the all-pervasive effects of increased energy consumption on the capital and
operating costs of producing electricity are evident. Using the above factors the effect for
example of a 1% change in the thermal energy requirement of the power plant (i.e. the fuel
consumption) on overall LCOE increase can be calculated. This works out to be just 0.47%
and helps illustrate what the potential for different types of improvement in solvent
performance will offer.
3.1.2. Thermodynamic and chemical equilibrium considerations
The absorption of CO2 into a reactive solvent is a chemical reaction and there is an
equilibrium loading which depends on the free energy of the CO2 solvent reaction. The
higher the free energy of reaction the greater the solvent loading. The enthalpy and free

35
energy of reaction are usually similar and thus the heat required to decompose the rich
solvent is depends roughly on the free energy of the reaction. When the free energy is low the
amount of CO2 which can be taken up at equilibrium is also low so that much higher solvent
recirculation rates are needed to remove the same amount of CO2. Whilst the heat for
decomposing the rich solvent goes down that for providing the sensible heat to warm the
solvent to regeneration temperature goes up. A substantial amount but by no means all of this
sensible heat is recovered by heat exchange. There is thus an optimum heat of reaction where
the total heat of regeneration is minimised. This is estimated to be around 77kJ/mol which is
only slightly lower than that of MEA. A goal of low heat of reaction solvent alone does not
minimise regeneration energy. Higher solvent loading can be achieved by having higher
concentrations of the active species or by selecting lower molecular weight reagents. These
will both reduce the sensible heat losses from warming and re-cooling the solvent. Typically
the heat requirements are split roughly equally between three components, the heat for
decomposition, the sensible heat loss and the distillation loss which is incurred when steam or
other vapour is produced in the regenerator reboiler and subsequently condensed at much
lower temperature in the condenser.
A further consideration is that because of chemical equilibrium effects the temperature
required for absorption reduces as the heat of reaction decreases to the point that refrigeration
may be required. These theoretical thermodynamic and equilibrium effects are described by
[van Nierop et al. 2011] and figure 8 below illustrates the effect of reaction enthalpy on
operating temperatures. This will be a consideration when considering for example
precipitating or demixing solvents. These enable significantly higher CO2 loading so that the
optimal solvent may have a lower free energy of absorption. However if reduced too far there
could be a refrigeration energy penalty. On the other hand the efficiency and economic
effects of this could be offset by the accompanying lower regeneration temperature which
may enable normally unused low grade heat sources to be applied.
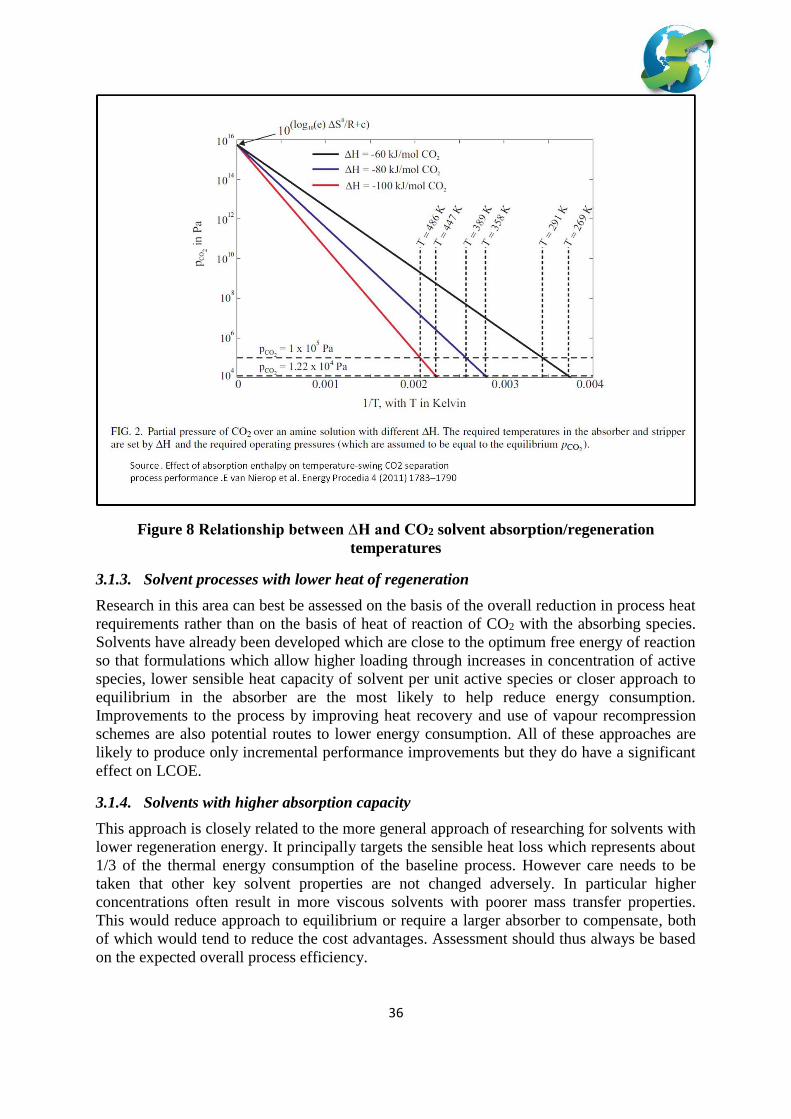
36
Figure 8 Relationship between ∆H and CO2 solvent absorption/regeneration
temperatures
3.1.3. Solvent processes with lower heat of regeneration
Research in this area can best be assessed on the basis of the overall reduction in process heat
requirements rather than on the basis of heat of reaction of CO2 with the absorbing species.
Solvents have already been developed which are close to the optimum free energy of reaction
so that formulations which allow higher loading through increases in concentration of active
species, lower sensible heat capacity of solvent per unit active species or closer approach to
equilibrium in the absorber are the most likely to help reduce energy consumption.
Improvements to the process by improving heat recovery and use of vapour recompression
schemes are also potential routes to lower energy consumption. All of these approaches are
likely to produce only incremental performance improvements but they do have a significant
effect on LCOE.
3.1.4. Solvents with higher absorption capacity
This approach is closely related to the more general approach of researching for solvents with
lower regeneration energy. It principally targets the sensible heat loss which represents about
1/3 of the thermal energy consumption of the baseline process. However care needs to be
taken that other key solvent properties are not changed adversely. In particular higher
concentrations often result in more viscous solvents with poorer mass transfer properties.
This would reduce approach to equilibrium or require a larger absorber to compensate, both
of which would tend to reduce the cost advantages. Assessment should thus always be based
on the expected overall process efficiency.
37
3.1.5. Solvents with higher absorption rate
The chemical and physical driving forces for absorption are quite low so that the absorber
column has to be large and hence is costly. The CO2 has to overcome mass transfer
limitations to enter the solution from the gaseous phase and also chemical reaction limitations
to become dissolved as reactive ions before it can react with the absorbing species. The
results are that full equilibrium may not be reached at the bottom of the absorber thus
reducing solvent loading and larger absorption columns. Research into methods of improving
absorption rate can thus directly reduce capital costs and in general are not counterbalanced
by other negative effects on efficiency.
3.1.6. Solvents with lower degradation rates
Solvents degrade through reactions with acid species in the flue gas such as SO2 and NOx.
They also degrade through chemical side reactions. They also degrade thermally with the
highest rates experienced in the regenerator reboiler where temperatures are highest. The
degradation has three main effects. The concentration of active species reduces and thus the
degradation products have to be removed and solvent replaced. By products may form which
accelerate corrosion. Thirdly the rate of thermal degradation increases with temperature
thereby limiting the acceptable temperature in the regenerator. This has a small knock on
effect on the CO2 compression power as operating at higher pressure, which requires higher
temperature, reduces the required compression ratio to reach export conditions.
Developments which reduce degradation will thus have a small effect on solvent
replenishment costs, cost of corrosion inhibitors and may allow some cost reductions in the
CO2 compression system which will include those associated with reduced power.
3.1.7. Solvents with less corrosive properties
As CO2 is present with water in solvent systems which use aqueous formulations there is
potential for acid corrosion in parts where acid conditions exist. Parts of the process operate
under alkaline conditions because of the basic nature of the solvents. Thus corrosion resistant
materials are specified for significant parts of the capture plant which range from use of
stainless steel either solid or as cladding and corrosion resistant tiles or polymeric linings. In
addition corrosion inhibitors may be added to limit corrosion. Corrosion caused by
degradation products is a complex issue because the concentration of these can build up over
a long time. Improvements in this area will thus have a second order effect on LCOE
potentially through cheaper equipment by allowing use of cheaper materials of construction,
through lower costs of solvent replacement and inhibition chemicals. Corrosion repairs may
also be reduced although this cost is not explicit in cost estimates.
3.1.8. Lower cost solvents
Solvent consumption as a result of degradation, operational leakages and to atmosphere or to
stack clean up system represents a small but significant on-going cost. If the solvent is
expensive then the costs for initial fill also become more significant. Higher performing
solvents on the market are more expensive partly because they contain more expensive
compounds but also because they are sold through proprietary process licensors who need to
recover development costs. An example of a very cheap solvent is ammonia. So one aspect of
developing low cost solvents is to be able to make use of such low cost bulk chemicals in a
practical process. The conventional solvents such as MEA are also relatively cheap compared
to higher performing solvents such as Mitsubishi’s KS series. Enabling the low cost solvent
options to perform better is thus potentially worthwhile developing although the cost benefit
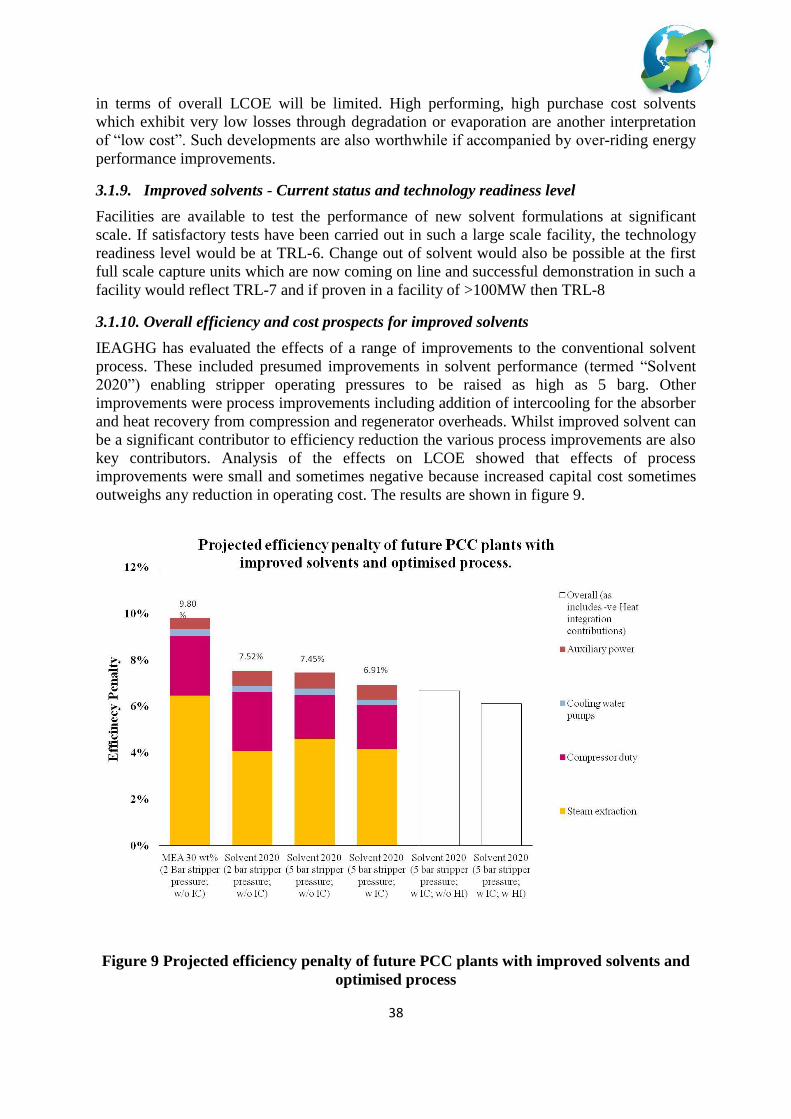
38
in terms of overall LCOE will be limited. High performing, high purchase cost solvents
which exhibit very low losses through degradation or evaporation are another interpretation
of “low cost”. Such developments are also worthwhile if accompanied by over-riding energy
performance improvements.
3.1.9. Improved solvents - Current status and technology readiness level
Facilities are available to test the performance of new solvent formulations at significant
scale. If satisfactory tests have been carried out in such a large scale facility, the technology
readiness level would be at TRL-6. Change out of solvent would also be possible at the first
full scale capture units which are now coming on line and successful demonstration in such a
facility would reflect TRL-7 and if proven in a facility of >100MW then TRL-8
3.1.10. Overall efficiency and cost prospects for improved solvents
IEAGHG has evaluated the effects of a range of improvements to the conventional solvent
process. These included presumed improvements in solvent performance (termed “Solvent
2020”) enabling stripper operating pressures to be raised as high as 5 barg. Other
improvements were process improvements including addition of intercooling for the absorber
and heat recovery from compression and regenerator overheads. Whilst improved solvent can
be a significant contributor to efficiency reduction the various process improvements are also
key contributors. Analysis of the effects on LCOE showed that effects of process
improvements were small and sometimes negative because increased capital cost sometimes
outweighs any reduction in operating cost. The results are shown in figure 9.
Figure 9 Projected efficiency penalty of future PCC plants with improved solvents and
optimised process

39
3.2. Encapsulated Solvent
A new concept is to use an encapsulated form of carbon capture solvent in which the
operating fluid, amines or carbonates is enclosed in a thin polymer shell forming 200-400 μm
beads. These beads are intended to dramatically increase the surface area of solvent in contact
with flue gas as alveoli do in mammalian lungs (see Figure 10).
Figure 10 Carbonate-filled capsules with thymol blue as a pH indicator (inset shows
loaded capsules) [Aines et al. 2013]
In order to provide this functionality, the polymer shell must be highly permeable to carbon
dioxide, permitting the inner solvent to perform the selectivity role, but it must also be strong
enough to survive an industrial regime in which capture, and presumably release of pure CO2
via heating, occurs over thousands of cycles. Several carbon dioxide capture solvents of
interest, including MEA, piperazine, sodium carbonate, and potassium carbonate, at
concentrations up to 30 wt. % have been encapsulated. Silicones and NOA (Norton Optical
Adhesive) as the polymer material is used for encapsulation. In all these systems the liquid
remains immobilized within the polymer capsule while gas is absorbed through the shell. The
capsules may then be heated to release the captured CO2. Encapsulated solvents have the
capacity of liquids and the physical behaviour of solid sorbents. It is assumed that these
encapsulated solvents will be useful in fairly conventional-style capture applications, as well
as exotic new approaches facilitated by their high surface area. The liquid, as well as any
degradation products or precipitates, remains encapsulated within the beads.
3.2.1. Cost reduction potential of encapsulated solvents
The key areas for potential cost reduction will be in the heat and power consumption as
compared to conventional systems and in reduction in the size and hence cost of equipment.
Encapsulation may also allow higher temperature/pressure regeneration with associated
reduction in CO2 compression requirements. There would be two main options for the
process, either use of fixed beds or circulating fluid beds. Scale considerations would suggest
that circulating beds would be more appropriate for large power plants. The arrangements for
regeneration on a large scale need some consideration. The carrier for introducing heat and
that for removing the CO2 released need to be selected. Steam and CO2 are the obvious
choices if a gas is used as heat carrier. Consideration also has to be given to whether and how
heat supplied for regeneration will be recovered. In a liquid system this can be done in a heat
exchanger without any intermediate fluid. In a solid system it is likely that an intermediate
fluid would have to be used. Another consideration in the cycle is the water balance since the

40
regeneration tests using dry nitrogen revealed that water is lost and the surface of the capsules
wrinkles. This dry out was however observed to be reversible. Nevertheless a cycle, which
maintains the water balance of the capsules, may be advantageous indicating that steam,
rather than dry CO2 might be a preferred heat carrier gas.
At this stage the research has not addressed how the capsules would be used in a large scale
practical process.
3.2.2. Thermodynamic considerations
The researchers point out that using capsules the problems of high viscosity of concentrated
solvents and its effect on mass transfer is much reduced. This would thus allow much higher
solvent loadings to be achieved, which in a conventional process would allow the sensible
heat loss to be reduced. However unless a process which allows the same level of heat
recovery is found this advantage cannot be exploited. The other loss which will be affected is
the distillation loss. If steam is used as the regenerant gas the system will behave as though
live steam is being used. This will assist in lowering the partial pressure of CO2 to a greater
extent than a system with indirect heating of the solvent potentially reducing the distillation
loss. In a system with circulating CO2 as regeneration gas heat would be supplied indirectly
to the CO2. Any water which evaporates from the capsules would represent an additional
energy loss akin to the distillation loss in a conventional solvent system. However if
encapsulation allows very low or even water free solvents to be used this would be
eliminated.
In summary the use of encapsulation opens up possibilities to greatly reduce some of the
inherent energy consumption of conventional solvent systems but does depend on how the
loss of an easy sensible heat recovery method counterbalances this advantage. The revised
balance between heat of absorption, sensible heat and distillation loss components may shift
the optimum free energy of reaction to a lower level. To evaluate the possible potential of
encapsulated solvents suitable processes using the technology need to be designed and
simulated.
3.2.3. Current Status, technology readiness level and development requirements.
As part of a US-DOE ARPA-E program, a team from the University of Illinois Urbana-
Champaign, Babcock and Wilcox, and Lawrence Livermore National Laboratory has created
a new encapsulated form of carbon capture solvents in which the operating fluid, amines or
carbonates in the tests to date, is enclosed in a thin polymer shell forming 200-400 μm beads.
Aines et al. 2013 have demonstrated rapid CO2 uptake and desorption using colorimetric
methods, which permit rapid spectroscopic determination of the extent of CO2 uptake and
release. Results from this study showed the mechanical/thermal cycling tests demonstrate
long-term stability of silicone encapsulated carbonate.
First experiments on encapsulated solvents have indicated some potential. It is too early to
formulate a full application until more has been done to characterise and optimise capsule
performance. The technology readiness level is therefore assessed as TRL-1.
Further testing under real flue gas condition needs to be performed and pilot plant tests are
required in order to develop better understanding of this type of solvent. HSE related issues
such as solvent handling and environmental impact of these encapsulated solvents also need
to be looked at in further detail and cost benefits reported.

41
3.3. Precipitating Solvent
Certain solvents such as inorganic solvents (potassium carbonate) and amino acid salts tend
to precipitate (i.e. solid phase) when they react with CO2. This precipitation is to be avoided
in conventional process configurations but by doing modifications precipitation can be used
to create a highly concentrated CO2-rich phase (slurry). This concentrated slurry is then sent
for regeneration, while the solvent is sent for further CO2 absorption (see Figure 11).
However it is important to consider that in these type of solvents the majority of CO2 is
converted into the precipitate.
Figure 11 Shell Global Solutions carbonate slurry bench-scale pilot-plant [Moene et al.
2012]
This precipitating solvent allows a lower energy requirement for solvent regeneration and
also it is possible to regenerate at higher pressure, which will result in energy savings from
CO2 compression. These solvents also tend to show low degradation. Moreover this
technology shows low cost and is based on well-known separation principles. Regarding to
the environmental impact the inorganic solvent will have lower impact but when using the
ammonia process further related HSE must be evaluated.
3.3.1. Energy requirement / Cost evaluation
The amino acid salt based DECAB process from TNO has been evaluated based on coal fired
power plant flue gas conditions with 90% CO2 capture rate [Feron et al 2005]. The reported
energy requirement for the DECAB process was 2.34 GJ/tonne CO2 compared to
conventional amine based solvent Monoethanolamine (MEA) which was reported to be 4.2
GJ/tonne CO2. A more recent paper [Fernandez et al 2011] reported 3.2 GJ/tonne with a
possibility to reduce to 2.8 GJ/tonne if the residual heat in flue gas could be used for crystal
melting prior to regeneration. This initially estimated reduction in thermal energy was

42
substantial, representing a reduction to 55% of that for MEA. However the benchmark NETL
study reported only 3.55 GJ/tonne so that the more recent evaluation suggests only a
reduction to 90% with a possibility of increasing this to 79%. This would reduce the increase
in COE by roughly 10 x 0.47 = 4.7% with a promise of a reduction to roughly 21*0.47 =
approx. 10% when using the more recent NETL Econoamine FG Plus performance as a
benchmark.
3.3.2. Thermodynamic and chemical equilibrium considerations
The attraction of precipitating processes is that the direct relationship between free energy of
reaction and equilibrium concentration of products is broken. At the point that the CO2
solvent product starts to precipitate its chemical potential ceases to rise as further CO2 reacts.
Thus the reaction can continue as any new product formed precipitates. The equilibrium
relationship is no longer governing the loading. Instead the capability to slurry the solid
product sufficiently for it to flow through the process becomes the limitation to solvent
loading. This opens the way for lower free energy of reaction solvents to be used as well as
allowing much higher CO2 loadings to be reached.
3.3.3. Current Status, technology readiness level and development requirements.
Currently several precipitating solvents have been investigated by different companies and
research organizations such as SINTEF/NTNU (Norway), TNO (The Netherlands), Shell
Global Solutions, Alstom (Chilled Ammonia), University of Melbourne (Australia), CSIRO
(Australia), CO2CRC (Australia). The activated potassium carbonate is the most mature
system. This solvent has been tested at pilot/lab scale by Shell Global Solutions [Schoon et al
2011]. The University of Melbourne has tested CO2CRC’s patented precipitating potassium
carbonate concept at the pilot scale [Quyn et al 2012]. A chilled ammonia process (CAP)
with precipitation has been tested by Alstom, but currently Alstom is operating their pilot
plants without precipitation [Telikapalli et al 2012].
Precipitating solvents are still in the early developmental stage with the most advanced
systems having undergone pilot scale testing. It is not clear to what extent all of the systems
needed to handle solids has been proven in an integrated system and Alstom’s limited
progress in this area so far is possibly indicative of the need for further validation. Most of
these systems are thus assessed as being at TRL-4 and those with some claimed pilot test
results at TRL-5.
The next step will be to test this concept under real flue gas conditions at larger scale. For the
chilled ammonia process the impact of SO2 and NO2 and required solvent reclaiming need to
be further evaluated. Further research on the column packing materials and optimization of
the liquid/gas ratio is required. It will also be necessary to establish the slurry concentration
limits for transport through the piping, heat exchanger, circulating pumps and the column
packings. In addition any tendency for solids to build up and slowly block the process will
need to be checked by long pilot plant runs. If such tendencies are detected then practical
methods for removing such build-ups will need to be developed and the limits of slurry
concentration required to keep the rate of build up at practical levels will need to be
established.

43
3.4. Two phase liquid solvents
In this process two liquid phases are formed once CO2 is absorbed in the solvent. The lower
phase will contain most of the absorbed CO2.
Figure 12 Simplified process flow diagram of the IFP Energies Nouvelles DMXTM
process [Raynal et al 2011]
This liquid phase is separated out and sent for CO2 regeneration. This results in a lower
quantity of CO2 rich solvent to be regenerated and thus reduces the regeneration energy
requirement. The solvent used for this process has hydrophobic functionality under certain
conditions. From the process engineering point of view the two-phase liquid/liquid separation
is easier in design and operation than solid/liquid separation (precipitating solvents).
3.4.1. Energy requirement / Cost evaluation
Based on current research the reboiler duty can be reduced to 2.3 GJ/tonne and possibly as
low as 2.1 GJ/tonne CO2. As well, captured CO2 is regenerated at higher pressure which will
result in a reduced CO2 compression energy requirement. The techno-economic process
evaluation of the DMX-1™ process finally results in a CO2 cost of about 56 €/tonne CO2
which represents a significant reduction when comparing to the reference case estimated at
about 75 €/tonne CO2 with the same boundary conditions [Raynal et al 2011]. This reduction
in capture cost is about 26%. Comparing with the NETL benchmark on the basis of this lower
energy requirement a reduction of 35% of the thermal load could be made. The LCOE would
reduce by about 35*0.47 = roughly 16%. The capital costs are expected to be similar with
some extra costs for the decanting equipment offset by smaller sizes for columns and pumps.
Some further small reduction due to reduced compression power could also be expected if the
regeneration process proves suitable for operation at higher pressure.

44
3.4.2. Thermodynamic and chemical equilibrium considerations
These are similar to those for precipitating solvents and it is already interesting to note that
the chosen solvent for the DMX process has a significantly lower heat of reaction at 60kJ/mol
than the ~80kJ/mol for MEA. Apart from the effect of lower free energy of reaction on
attainable solvent loading there is also an effect on the required absorption and regeneration
temperature. These become lower and with wider spread as the heat of reaction falls. This
implies that some refrigeration may be necessary as is the case with the chilled ammonia
process.
3.4.3. Current Status, technology readiness level and development requirements.
University of Dortmund, Germany has been investigating a two-phase system
‘Thermomorphic Biphasic solvent’ for several years. The IFP concept ‘DMX’ solvent is
under development by testing at a pilot plant in recent years and there are ongoing activities
to perform pilot plant tests under real process conditions for biphasic solvents e.g. Octavius
project (EU FP7) and the IFP DMX-1 process is under evaluation to be tested at Enel’s
Brindisi pilot plant, Italy. The two phase de-mixing concept developed by NTNU will be
tested at lab-pilot scale as part of the iCap project (EU FP7).
Although several groups are conducting or planning pilot testing there is a need for a firm
validation of the process. The basic concept does however appear to be proven. The current
assessment is that this technology is at TRL-4. If plans to test at pilot scale come to fruition
this will raise to TRL-5 or possibly TRL-6 once successful long term runs have been
completed.
This process needs to be evaluated under real process conditions. Further work on optimizing
solvent formulation and composition based on operability, degradation and emissions as well
as overall energy performance needs to be undertaken. This needs to include careful
evaluation of any refrigeration energy requirements but also opportunities to use lower grade
waste heat for regeneration. Two phase solvents have not been evaluated in detail for their
environmental impact, so this area also needs to be looked into further. As the process relies
on separation of liquids further work needs to be undertaken to establish the separation
performance and the selection of liquid/liquid separation equipment.
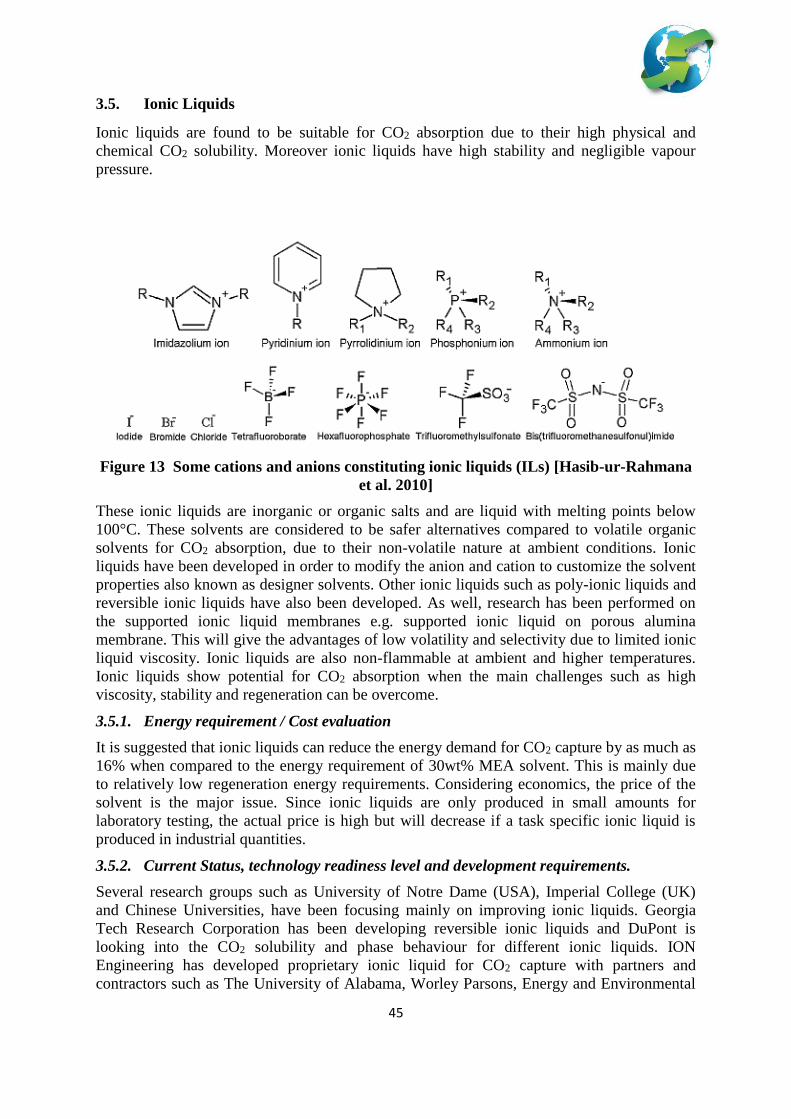
45
3.5. Ionic Liquids
Ionic liquids are found to be suitable for CO2 absorption due to their high physical and
chemical CO2 solubility. Moreover ionic liquids have high stability and negligible vapour
pressure.
Figure 13 Some cations and anions constituting ionic liquids (ILs) [Hasib-ur-Rahmana
et al. 2010]
These ionic liquids are inorganic or organic salts and are liquid with melting points below
100°C. These solvents are considered to be safer alternatives compared to volatile organic
solvents for CO2 absorption, due to their non-volatile nature at ambient conditions. Ionic
liquids have been developed in order to modify the anion and cation to customize the solvent
properties also known as designer solvents. Other ionic liquids such as poly-ionic liquids and
reversible ionic liquids have also been developed. As well, research has been performed on
the supported ionic liquid membranes e.g. supported ionic liquid on porous alumina
membrane. This will give the advantages of low volatility and selectivity due to limited ionic
liquid viscosity. Ionic liquids are also non-flammable at ambient and higher temperatures.
Ionic liquids show potential for CO2 absorption when the main challenges such as high
viscosity, stability and regeneration can be overcome.
3.5.1. Energy requirement / Cost evaluation
It is suggested that ionic liquids can reduce the energy demand for CO2 capture by as much as
16% when compared to the energy requirement of 30wt% MEA solvent. This is mainly due
to relatively low regeneration energy requirements. Considering economics, the price of the
solvent is the major issue. Since ionic liquids are only produced in small amounts for
laboratory testing, the actual price is high but will decrease if a task specific ionic liquid is
produced in industrial quantities.
3.5.2. Current Status, technology readiness level and development requirements.
Several research groups such as University of Notre Dame (USA), Imperial College (UK)
and Chinese Universities, have been focusing mainly on improving ionic liquids. Georgia
Tech Research Corporation has been developing reversible ionic liquids and DuPont is
looking into the CO2 solubility and phase behaviour for different ionic liquids. ION
Engineering has developed proprietary ionic liquid for CO2 capture with partners and
contractors such as The University of Alabama, Worley Parsons, Energy and Environmental

46
Research Centre (EERC), EPRI (USA), Xcel Energy, Evonik and Eltron R&D [Shiflett et al
2011 and 2012]. A pilot plant unit at ION Engineering is in use and a 0.2 MW test at the
EERC in North Dakota started in 2012.
Development of a commercially viable capture process based on ionic liquids is at a very
early stage. It is still unclear whether the inherent limitations imposed by the rather high
viscosity of such solvents can be overcome. Thus although the principle is well understood
and basic parameters have been measured it is still not possible to formulate a viable
application. Thus although scientifically very interesting, from a commercial perspective the
technology readiness level is assessed as TRL-1
One of the important areas of improvement required is the viscosity of ionic liquids (66cP to
1110cP at 293K to 298K) this creates one of the main challenges when absorbing CO2 thus
increasing the energy required for solvent pumping and the potential for mass transfer
problems and operational difficulties in engineered processes. Optimizing physical and
chemical properties of ionic liquids should be researched further and improvements are
required in lowering the thermal energy requirements for regeneration of CO2 and solvent
stability. More work is required in evaluating the toxicity of long chain ionic liquids and
effects of cation/anions, this is because in some studies it is indicated that these solvents
cannot be labelled ‘green solvents’ due to many of unknowns.
3.5.3. Thermodynamic and chemical equilibrium considerations
Ionic liquids can be made more absorptive to CO2 by including suitable chemical reactive
groups in the cation species. The properties can be changed from those of a physical
absorbent obeying Henry’s law towards those of a chemical solvent. However the molecular
weight of ionic liquids is quite high so that the absorptive capacity of chemically reactive
formulations is inevitably significantly less than for MEA or other amines. The chart
illustrates the equilibrium concentrations for MEA as compared to three candidate ionic
liquids. Thus from the chemical/physical equilibrium standpoint these solvents are more
likely to be useful in high partial pressure applications such as exist in pre-combustion
capture. Because ionic liquids have very low vapour pressure and can be more thermally
stable than amines it may be possible to regenerate at higher temperatures and hence
pressures thus saving on CO2 compression energy.
The viscosity of ionic liquids is inherently high and this is a potential barrier to rapid mass
transfer in contacting devices. Alternatives to conventional packed columns which offer
higher shear are likely to be needed, for example spray towers or high-G contactors might be
considered.
There are a very large number of possible ionic liquids with cationic species running into
hundreds and around 20 common anionic species. The anionic species are grouped according
to their basic chemical structure and properties can be fine tuned by varying for example the
length of alkyl groups. Correlations have been developed to aid prediction of properties and
can be useful in guiding the search for combinations most suited to CO2 capture.
In summary ionic liquids may struggle to compete with conventional absorption systems
because their absorption capacity is likely to be much lower.
Their unique properties may be more suited to membrane separation applications. The key
reasons for this are a) that the cation can be tailored to have a very high solubility for CO2 so
that a membrane formed of the ionic liquid has a very high selectivity and b) it is possible to

47
make very thin films on a suitable support. Furthermore a support of a second membrane with
very high permeability low selectivity can yield a composite membrane with both high
selectivity and permeance.
3.6. Membrane separation
3.6.1. General issues
It is worth at this stage discussing the key properties of membranes and their potential for
CO2 separation as the next sections cover various developments in membranes for post
combustion separation of CO2. As discussed earlier there is a theoretical minimum work for
separation of CO2 from flue gases. This work is equivalent to that which would have to be
expended if the CO2 was separated from the flue gas through a perfectly selective and
infinitely permeable membrane using isothermal compression to draw the CO2 through and
compress it to atmospheric pressure. This sets a theoretical benchmark for the minimum work
per tonne for a thermodynamically reversible separation. Because the separation process is
part of a larger system i.e. the fuel combustion and power generation process, researchers
have identified a combination which further reduces the theoretical minimum work. This can
be done by allowing the combustion air necessary for the process to act as sweep gas for a
second stage membrane with the final flue gas stream on the retentate side. The effect is to
recycle CO2 to the boiler thus raising the partial pressure of CO2 in the flue gas which has the
effect of reducing the minimum work of separation. Note that there is no work of separation
in the second stage membrane if this is infinitely permeable and selective as there is no need
for compression. The reason that this approach can reduce the energy penalty is that the
recycle of CO2 dilutes the air and lowers flame temperatures. However as the power
generation process does not utilise the full flame temperature in its working cycle the
additional work is made available without any additional energy penalty. Fig 14 shows the
overall arrangement of the two membrane stages needed to achieve this.
Figure 14 Two stage recycling membrane arrangement
Figure 15 illustrates how the concentrations of CO2 and oxygen in the flue gases will change
as the fraction of CO2 crossing the second membrane as recycle increases. It also shows how
the effect on total flow of air and CO2 to the boiler.
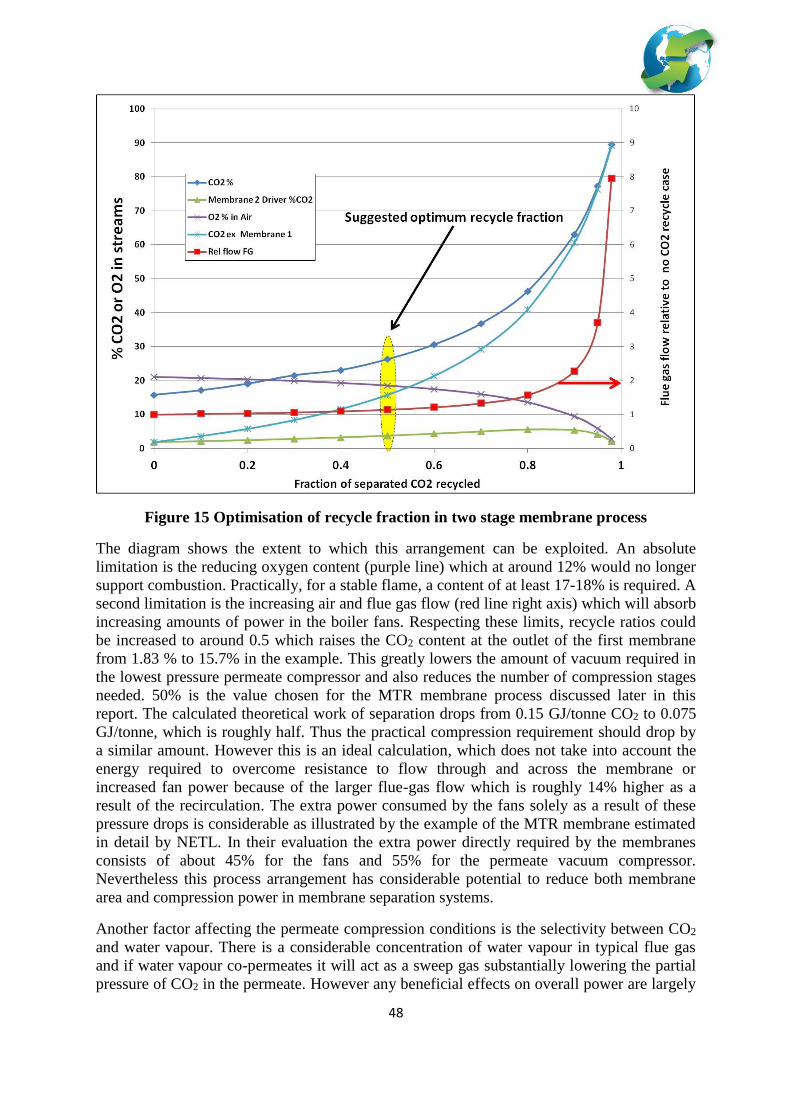
48
Figure 15 Optimisation of recycle fraction in two stage membrane process
The diagram shows the extent to which this arrangement can be exploited. An absolute
limitation is the reducing oxygen content (purple line) which at around 12% would no longer
support combustion. Practically, for a stable flame, a content of at least 17-18% is required. A
second limitation is the increasing air and flue gas flow (red line right axis) which will absorb
increasing amounts of power in the boiler fans. Respecting these limits, recycle ratios could
be increased to around 0.5 which raises the CO2 content at the outlet of the first membrane
from 1.83 % to 15.7% in the example. This greatly lowers the amount of vacuum required in
the lowest pressure permeate compressor and also reduces the number of compression stages
needed. 50% is the value chosen for the MTR membrane process discussed later in this
report. The calculated theoretical work of separation drops from 0.15 GJ/tonne CO2 to 0.075
GJ/tonne, which is roughly half. Thus the practical compression requirement should drop by
a similar amount. However this is an ideal calculation, which does not take into account the
energy required to overcome resistance to flow through and across the membrane or
increased fan power because of the larger flue-gas flow which is roughly 14% higher as a
result of the recirculation. The extra power consumed by the fans solely as a result of these
pressure drops is considerable as illustrated by the example of the MTR membrane estimated
in detail by NETL. In their evaluation the extra power directly required by the membranes
consists of about 45% for the fans and 55% for the permeate vacuum compressor.
Nevertheless this process arrangement has considerable potential to reduce both membrane
area and compression power in membrane separation systems.
Another factor affecting the permeate compression conditions is the selectivity between CO2
and water vapour. There is a considerable concentration of water vapour in typical flue gas
and if water vapour co-permeates it will act as a sweep gas substantially lowering the partial
pressure of CO2 in the permeate. However any beneficial effects on overall power are largely

49
counterbalanced by the need to compress a far larger permeate flow, until a pressure is
reached at which the water vapour can be condensed out.
The other practical limitation is the increasing size and hence cost of the second membrane as
the recycle increases.
3.6.2. Cost and performance of membrane separation systems
There are a number of different types of material from which membranes can be fabricated.
Within each type variations in structure and manufacture can endow a range of permeabilities
and selectivities. However, as a general rule, selectivity increases result in permeability
decreases and when plotted on a log/log scale there is straight line termed the “Upper bound”
which delineates the limits of performance for each class of membrane. This relationship,
first proposed by Robeson in 1991, limits to some extent the scope for improvements but also
helps direct research. The “upper bound” has been reviewed recently to take account of
performance advances but only minor shifts resulted. The other key variable in membrane
performance is the thickness since the rate of permeance to gas is proportional to the inverse
of the thickness. The achievable minimum thickness will depend on the ability to avoid
defects in the manufacturing process and, where necessary, to provide the structural support
needed to prevent damage to the membrane due to the prevailing differential pressure during
operation. The costs of membranes are generally taken as per unit area with typical prices of
around $50/m2. The cost of membrane elements is not expected to show much economy of
scale other than quantity discounts. An allowance for structure and piping has to be made
and, unlike the membrane elements, the costs for these will benefit from some economies of
scale.
A major cost of membrane systems is compression or vacuum pumping equipment. The extra
power consumed by the compression will also reflect in increased capital cost of the main
generating plant and play through into the LCOE in much the same way as for post
combustion solvent systems. Thus arrangements, which can minimise compression power are
likely to have lower increases in LCOE. It is noted that estimates tend to assign much higher
costs per kW to vacuum pumps than to compressors. For very large machines where
centrifugal or axial compression is appropriate there should in principal be little difference in
cost per kW for a given power. However where vacuum pumping is based on a different type
of machine, for example a liquid ring pump, unit costs will be higher. It is thus important in
assessing estimates to analyse what type of compression machinery is specified and what
type is actually needed.

50
3.7. Polymeric and Hybrid membranes
Polymeric membranes have been used at low temperature to separate CO2 at industrial scale
for several years e.g. in natural gas CO2 separation. There are two types of general polymeric
membranes available for CO2 separation, glassy and rubbery membranes.
Figure 16 Schematic illustration of the membrane concept for CO2 separation from
coal-fired power plant. (FGC: flue gas cleaning, Mem: membrane module) [Franz et al.
2013]
Glassy membranes are rigid, with lower permeability and operate below the glass transition
temperature, while rubbery membranes are flexible with higher permeability and operate at
above the glass transition temperature. These dense phase polymer membranes show CO2/N2
selectivity in the range of 40/70 and permeability 570-120 Barrer. A CO2 purity of up to 90%
or more is obtained when selectivity of CO2/N2 is 70/80 Barrer with a CO2 capture rate of
80% from flue gas with 15% CO2. Therefore a multi-stage membrane is required to achieve
acceptable captured CO2 purity (see Figure 16). Another type of membrane is fixed site
membrane where a chemical reaction takes place in the presence of water on both sides of the
membrane. The presence of water limits the permeability; the selectivity of these membranes
for CO2/N2 is 50-230 with CO2 permeance in the range of 1000-1 GPU. Still it is difficult to
achieve captured CO2 purity of 90% or more with 80% CO2 capture rate with 15% CO2 in the
flue gas.
Hybrid membranes made from polymeric membranes and integrated nano-particles show the
potential in increased CO2 flux and selectivity when compared to polymeric membranes.
These membranes show selectivity of above 100 and flux of more than 0.7Sm3/m2.h.bar.
Another type of membrane is liquid membrane which also shows the potential of higher CO2
selectivity of up to 45000. A single stage membrane process is feasible for these membranes.
The main advantage of polymeric membrane based CO2 separation is that it produces a non-
hazardous waste stream and thus has minimal environmental impact. Membranes can be
designed in modules which allows for scale up of the unit and retrofit. There have been
several studies in which the suitability of membrane separation is investigated for coal and
NGCC power plants.

51
3.7.1. Energy requirement / Cost evaluation
Cost evaluation for coal fired power plant was reported by Ramasubramanian et al. 2012. At
a low membrane price of $2.5/ft2 ($27/m2), the purely membrane-based air-sweep process can
result in a cost of electricity (LCOE) increase of 33-35% and a capture cost of $24/t CO2 at a
CO2 permeance of 3000GPU, a CO2/N2 selectivity of about 140 and a feed pressure of close
to 1bar.
Analysis of the cost and material balances for the MTR membrane process [NETL 2012]
reveals a 20% increase in fuel consumption due to the additional parasitic loads, much less
than that for the baseline Econamine FG Plus process (38%). This increase in fuel to supply
the increased electrical load can be divided into three elements. Approximately 47% is for
CO2 compression, 29% is for the vacuum compression and 24% for the increased pressure
drop in the flue gas system and other utilities. Specific energy calculates as 0.45GJ/tonne
captured and 0.55GJ/tonne abated. The LCOE cost increase calculated by NETL is only 70%
of that for the baseline Econamine FG Plus process i.e. a 30% reduction is projected. This
does however rely on assumptions about the cost and performance of the membrane modules.
In this study costs were evaluated based on a future membrane cost of 80$/m2 which
compares with 140$/m2 near term target. Installed cost of the CO2 separation plant was
however about $154/m2. Permeance was a somewhat optimistic 3500 GPU but selectivity
CO2/N2 was taken as a reasonably conservative 35. Even with these comparatively high costs
per m2 when compared with other projections the cost of the separation equipment i.e. the
membranes plus vacuum pump was less than for the comparable benchmark Econamine FG
Plus process. The costs for the vacuum pump were not reported separately but based on the
calculated power and taking unit cost as 2X that of the main CO2 compressor, it is estimated
to represent about 25% of the separation equipment, meaning that the membranes were
costed at around $113/m2 installed.
Whilst much more detailed analysis of costs is warranted and recognising the wide range of
per m2 costs reported in the literature the technology nevertheless appears to promise
considerable reductions in cost of capture.
3.7.2. Current Status, technology readiness level and development requirements.
Currently there are several research organizations and companies developing improved
membranes and carrying out pilot plant testing. The EU project nanoGLOWA has tested a
diffusion transport membrane and a fixed site carrier membrane at a power plant in Germany.
The NTNU patented polyvinylamine (PVAm) membrane together with fixed amine groups
(which acts as carrier for CO2) i.e. fixed site membrane (FCS), is evaluated at a pilot plant at
an EDP power plant in Portugal. The PVAm+FCS membrane test resulted in a promising
result of extremely high separation of CO2 at a low feed pressure (maximum 2 bar) condition.
Membrane Technology Research Inc (MTR) is testing their membrane Polaris in a 1MW unit
at DOE’s National Carbon Capture Center (NCC) in Wilsonville, Alabama from 2013. The
flue gas is taken from Alabama Power’s Gaston Power plant Unit5 (supercritical pulverized
coal unit). Other organizations such as MEMFO, NTNU, and SINTEF Norway; Membrane
Technology Group an Twente University, The Netherlands; Centre of Membrane Technology
and NJIT, USA; and RTI International, USA are active in the area of membrane based CO2
separation process development.
There are several tests of membranes in this application at reasonable scale and membranes
have been used at larger scale for the similar separation of CO2 from natural gas. The
technology readiness level is assessed as TRL-6. It is further noted that given the widespread

52
deployment of membranes in other applications development could proceed relatively
quickly.
Further material development and tests of the impact of impurities on the membrane need to
be performed. Pilot plant tests at larger scale to the level of 10MWe are also required.
3.8. Polymeric membrane and low temperature separation
This process utilises a membrane stage to concentrate CO2 in the permeate stream and then
undertakes liquefaction of the CO2 to achieve the necessary purity. This minimises the energy
requirements of the liquefaction process as the majority of the N2 has been excluded by the
membrane stage. The second and third membrane stages are to ensure high CO2 recovery.
The second membrane stage recovers CO2 from the retentate of the first membrane stage and
recycles this back to the process feed through the coal burner. The third membrane stage
recovers CO2 from the liquefaction column off-gas stream and recycles the permeate stream
back to the first membrane stage permeate, while the retentate stream is recycled back to the
first membrane stage feed stream. Critically, a sweep gas is applied to the second membrane
stage to generate the pressure driving force. This maximises CO2 recovery while minimising
the membrane area, as well as avoiding the high energy duty of a compressor or vacuum
pump. It is this sweep gas, the combustion air for the coal burner, which Merkel et al. 2010,
indicates makes the membrane design cost competitive. This is because the recycle of CO2
from the second membrane stage through the coal burner increases the CO2 partial pressure in
the flue gas going to the first membrane stage, and hence improves separation performance.
Figure 17 A post-combustion carbon capture plant scenario with three CO2 selective
membrane stages [Merkel et al. 2010]
Another configuration for this process involves operating the membrane at low temperature (-
25°C to -45°C). The membrane CO2/N2 selectivity and permeance increases significantly
when operated at these temperatures. However this concept is more complicated and requires
significant heat and work integration.
First evaluation of this technology shows that the process has better performance when
compared to an MEA based process when the CO2 concentration in flue gas is in the range of

53
15-30%. A lab scale test at 0.1 MWe for this technology by Hasse et al 2012 showed that this
technology has potential for performance improvements.
3.8.1. Energy requirement / Cost evaluation
In the study performed by Scholes et al 2013, the cost of CO2 capture is estimated of 42 US$
per tonne of CO2 avoided for a 2 stages membrane gas separation process, when compared to
an MEA based process of 55 US$ per tonne of CO2 avoided. SINTEF has also studied the
costs and energy requirements of hybrid cryogenic systems and evaluated those situations
where it is most likely to be applicable [Jordal et al 2012]. Marginal improvements were
deemed possible in post combustion capture and more substantial gains in pre-combustion
systems.
This hybrid process has the potential to improve on the performance of a membrane only
process. It may allow the use of less selective membranes which are likely to be cheaper.
Liquefaction and pumping of recovered CO2 will also reduce the costs and energy
consumption for CO2 compression although this gain will be offset by additional compression
costs in the process. A detailed evaluation of this trade off needs to be performed.
3.8.2. Current Status, technology readiness level and development requirements.
Currently Air Liquide has run a bench-scale test operation for the membrane in operation at
-25°C to -45°C. Linde Engineering, Germany is also involved in developing low temperature
CO2 purification technology.
The majority of this process is at a similar development stage to that of the full membrane
process but membrane performance requirements will be more relaxed. The CO2 liquefaction
element can be based on well developed cryogenic gas processing technology. The
technology readiness level is therefore also assessed as TRL-6
This hybrid technology needs to be tested next at the scale of 1MW-10MW.
3.9. Other hybrid membrane systems
The key to the dual membrane system is the use of combustion air as a sweep gas in the
second stage of the system. In fact air (or oxygen in oxycombustion systems) could
potentially be used as a sweep gas for other separation systems such as solvent stripping of
solid sorbent regeneration. Also the first stage of the separation process where the CO2 partial
pressure has been raised by the recycling could be conducted using absorption, cryogenics or
adsorption. Thus a large number of hybrid variants are potentially worth investigation. There
is some evidence that researchers are starting to look at these alternatives for example
[Freeman 2014] has examined a system where the first stage separation of the MTR system is
replaced by a conventional solvent absorption system.
3.10. Gelled Ionic Liquid-Based Membranes
Gel-RTILs (Room Temperature Ionic Liquids) are formed by incorporating low molecular
weight organic gelators (LMOGs) into RTILs – H-bonding, van der Waals interactions, and
pi-pi stacking between LMOG and RTIL are responsible for physical gelation. Gel-RTIL
maintains CO2 affinity and permeability characteristics of RTILs. A low fraction of LMOG is
required, typically 1-5 wt%. Free RTIL provides for fast liquid-like diffusion and enhanced
flux. This also provides an increase in mechanical and thermal properties of RTIL upon
gelation. Gelation is a thermo-reversible process with transition temperatures ranging from 20

54
to 180°C. This membrane has demonstrated high perm-selectivity for CO2 over other
components of coal-fired power plant exhaust gas.
Figure 18 RTILs Gelled membrane (hmim/Tf2N 98.5 wt% with 12-hydroxy stearic
acid 1.5 wt%) [Noble et al 2013]
3.10.1. Current Status, technology readiness level and development requirements.
Under DOE’s funded project, University of Colorado (CU), Boulder is working on selective
layer material design and synthesis for these membranes. Fabrication of these gel-RTIL and
RTIL/Poly(RTIL) composite membranes by Ultrasonic-atomized spray-coating is done by
Los Alamos National Laboratory (LANL) and 3M (USA). Based on the tests and results for
these membranes Electric Power Research Institute (EPRI) will perform process evaluation.
The use of ionic liquids as CO2 solvents while scientifically interesting has yet to be shown to
offer a real advantage in a commercial system. A convincing application of this type has yet
to be formulated thus the technology readiness level is assessed as TRL-1. The application in
membranes appears to offer a more viable application with some possibilities of attaining a
breakthrough in performance. However the research is still at the stage of finding methods of
fabrication of the membranes so that they exhibit the necessary high permeance and stability.
The performance can then be validated under laboratory conditions. Thus the technology
readiness level is assessed as being at TRL-2.
It is required to develop a quantitative understanding of how the deposited material is
distributed in the composite membrane both within the support and through the selective
layer thickness. Multiple Layer coatings and post-processing can be used to increase the
permeability and selectivity of the final membrane. Complete parametric studies are required
to further understand the influences of membrane performance characteristics on process
economics.
In order to enhance the potential for industrial interest, evaluation of these membranes for
CO2/CH4 separation (natural gas treatment) will be evaluated. The selectivity target is
CO2/CH4 selectivities >20 at low pressure and ambient temperature.
3.11. Pressurized post combustion capture
Sargas of Norway has proposed to use a coal fired pressurised fluidised bed boiler in post
combustion applications to take advantage of much higher partial pressures of CO2.
(Bringelsson 2009). Energy would be expended in compressing air into the boiler. However
energy would be recovered by re-expanding the flue gas after CO2 capture with greater

55
efficiencies achieved the hotter the starting temperature of this expansion. In effect a Brayton
cycle is added across the main Rankine cycle of the steam boiler.
They have also proposed a similar process for gas turbine based power plant whereby the
capture of CO2 would occur at high pressure prior to expansion. The proposal is to use hot
potassium carbonate as the absorption medium. The hot flue gas has first to be cooled to
about 100C before entering the capture plant but is reheated using heat exchange so that most
of the heat is recovered. The pressurised gas, scrubbed of CO2, is then expanded to generate
power. Sargas formed an alliance with GE in 2012 to develop the technology based initially
on the LMS100 gas turbine. However there are few published technical details after 2009.
Figure 19 Pressurised post combustion capture as proposed by Sargas.
3.11.1. Current Status, technology readiness level and development requirements.
Apart from the alliance with GE development of the proposed technology appears to be
dormant since pilot plant tests results were reported in 2009. Tests were performed on the hot
Potassium absorption system at a pressure of approximately 10bar. The operation of the main
subsystems required is thus validated and the technology readiness level is assessed as TRL-
5. Bubbling bed pressurised fluidised bed combustion (PFBC) has been demonstrated at a
large scale, for example a 360MWe plant at Karita in Japan and is at TRL-8, but further work
is needed to demonstrate it as a commercially competitive technology to conventional
pulverised coal combustion. Also further work needs to be done to establish the overall
energy efficiency of the systems with CO2 capture.

56
3.12. Enzyme catalysed CO2 absorption/desorption
Enzymes can be used to catalyse the CO2 absorption process in carbonate/bicarbonate
(potassium carbonate) solvents. This is based on natural catalysis of CO2/O2 in the respiration
system catalysed by the enzyme Carbonic Anhydrase II (CA II). These pure aqueous
carbonate/bicarbonate solvents exhibit severe limitations in the CO2 absorption rate. Thus
there are several formulations available of carbonate/bicarbonate solvent together with amine
based solvent which overcome this limitation in CO2 absorption rate. Similarly tertiary amine
based solvent such as Methyldiethanolamine (MDEA) also suffers from low CO2 absorption
rate and require an activator to enhance the CO2 absorption rate.
Figure 20 Concept for the use of enzymes to capture carbon dioxide employing the
conventional absorber/stripper configuration [CSIRO 2012]
Enzymes have potential to be used as an activator to accelerate the CO2 absorption rate. In
this process the enzymes are clustered together in a cross-linked enzyme aggregate (CLEA)
and filtration is used to separate the enzyme from the CO2 rich solvent before solvent is send
for CO2 regeneration. From the environmental perspective, the inorganic
carbonate/bicarbonate solvent activated with enzyme is very favourable as no emission will
occur. One of the main challenges related to enzymes is the stability of enzymes in the
chemical and physical environment especially at higher temperature. Industrial enzymes are
routinely immobilised, i.e. non-destructively bound to inert supports such as silica, resins,
nylon and polyurethane for use in reactors. Immobilisation often increases stability of
enzymes to pH and temperature, and extends their useful life as well as improving their ease
of handling, separation and recovery [Mateo et al. 2007]. Figure 20 shows the conceptual
process diagram of immobilised enzyme in the absorber wetted by an aqueous solution
containing counter-ions.
3.12.1. Energy requirement / Cost evaluation
CO2 Solutions, Canada enzymatic technology showed an energy cost reduction of at least
33% compared to existing carbon capture technologies when employed to capture 90% of the
CO2 emissions from natural gas combustion at a typical in-situ oil sands operation. Codexis
has claimed that their enzyme based process could significantly reduce CAPEX (capital cost),
Human Enzyme:
Carbonic Anhydrase II
(CA II)

57
with a ~95% reduction in CO2 absorber column size with low-energy solvent MDEA and
~80% reduction in desorber volume without use of structured packings.
3.12.2. Cost considerations
The main reduction in costs would appear to be for the capital cost of the absorption column.
In the baseline estimate about 67% of the capex increase is due to the capture system of
which 10% is for compression. This leaves 60% of the capex increase as a target for cost
reduction through having a smaller absorption column and other capture process equipment.
Fabricating and erecting the column will be a major part of this and reducing its size will
affect that element of the overall cost. The basis for the 95% size reduction of the absorber is
not clear. Only a detailed cost estimate could reveal the full potential. Considerations are that
the reaction rate of CO2 with the solvent is not the only limitation to column sizing. There
will be a limit to the gas velocity in a conventional packed absorber tower which will limit
the minimum cross sectional area and also sufficient theoretical stages have to be provided to
achieve the desired capture efficiency which will limit the minimum absorber height. Each
10% reduction in capital cost would translate into a reduction in the extra cost of electricity of
about 7% using simple factoring. More evidence would need to be produced from process
modelling and pilot plant results to validate claims of an energy consumption reduction.
Nevertheless the capex for capture plant is a significant driver of the increase in LCOE but
claims for such large reductions below the cost of conventional post combustion capture
should be carefully scrutinised.
3.12.3. Thermodynamic considerations
The action of the enzymes is similar to that of the chemical promoters used in solvent
formulations. The key effect is thus to enhance mass transfer and thus reduce the size of the
absorption plant. The equilibria of the absorption reactions are not changed although in
principle a closer approach to equilibrium might be obtained. It is thus not entirely clear how
the use of enzymes will reduce energy consumption as claimed.
3.12.4. Current Status, technology readiness level and development requirements.
Currently CO2 Solutions (Canada), Novozymes and Carbozymes are developing their
proprietary enzymes for CO2 absorption processes. This technology is still at a proof of
concept level.
As the work on developing suitable enzymes is only at proof of concept stage the technology
readiness level is assessed as TRL-1.
It is important that the enzymes are evaluated under real flue gas conditions and that the
effect of flue gas impurities such as SOx and NOx are looked into. Solvent reclaiming
processes for enzyme activated solvents also need to be assessed. Long term pilot plant
testing is required to develop further understanding of this concept and assess the cost
benefit.
3.13. Algae based CO2 capture
Biological carbon capture describes the process of using plants to capture, react and fix CO2
through the photosynthesis reaction. While the photosynthesis reaction involves a complex
set of light and dark chemical reactions, it can be described as reacting light energy, water
and CO2 to form oxygen and simple sugars, and expressed as the generic formula:
6CO2 + 6H2O + light C6H12O6 + 6O2

58
In this reaction, C6H12O6 represents the sugars which are metabolized further by the plant into
more complex sugars, starches, and lipids. In most plant species, photosynthesis is an
inefficient reaction with slow kinetics. This is especially the case for larger plant species
which have to expend significant amounts of energy to build their structure, grow foliage,
uptake and transport water, and reproduce. With simpler and smaller plants, the efficiency of
the photosynthesis reaction (light energy to chemical energy) is comparatively higher as they
do not need to invest as much energy to build large structures. At the extreme end of this
scale are single cell algae. They are the smallest and simplest forms of plants and they lack
traditional plant structures relying instead on water as their supporting structure. By not
having to invest energy in growing roots, leaves and flowers, algae can commit all of their
energy into reproduction. The simplest way to promote the growth of algae is to supply them
with abundant amounts of CO2 and light. As the amount of sunlight that shines on any one
location cannot be changed, the only improvement is to supply them with CO2 and mix them
so that each alga has some exposure to the water’s surface to conduct its light reactions
before being mixed under water where the light is dim.
A photo bioreactor is a device that can be used to give better condition for the microalgae to
go with the photosynthesis process, it is designed to be able to adjust the condition of light,
temperature, pH, CO2 and nutrients. In this system, a pump is used to make the cultures re-
circulated within the tube, and the CO2 will be pumped into these tubes with the air pumps.
This photo-bioreactor can be used for the outdoor mass cultures due to the large illumination
surface.
Figure 21 Design principle of a tubular photo bioreactor system [CO2-to-Bio 2012]
Most photo bioreactors differ in the design of the transparent vessel, which in this example would be closed loop
glass tubes with a diameter between 3-5 cm. The light system can be based on either natural or artificial light –
or a combination of the two.
3.13.1. Energy requirement / Cost evaluation
CO2 capture by microalgae has high costs (energy for pumping the medium, compressing air,
harvesting biomass, etc.), but this process has also benefits: (i) CO2 conversion to biomass;
and (ii) production of valuable products.

59
3.13.2. Thermodynamic considerations
Harvesting of solar energy can be accomplished by a range of technologies such as solar
thermal, solar electric arrays and energy crop harvesting. The yields of energy crop
harvesting are in general less than 1% of the incident solar energy whereas solar PV systems
can reach much higher levels albeit reduced by shading effects. The 15gm/day/m2 of CO2 is
roughly in line with that from other energy crops indicating that very large areas would have
to be used to replace a commercial scale power plant.
3.13.3. Current Status, technology readiness level and development requirements.
Researchers at EniTecnologie in Italy conducted a field experiment of CO2 uptake by algae in
a raceway pond (which is a shallow artificial pond used in the cultivation of algae; it is
divided into a rectangular grid, with each rectangle containing one channel in the shape of an
oval). The Tetraselmis suecica algae were supplied with CO2 from natural gas turbine flue
gas. The experiment was conducted between the months of April to November and it
measured the rates of production correlated to ambient temperature and available light.
EniTechnolgie reported growth rates as mass of dry algae produced each day per square
meter of raceway. During the April to November time period, productivity ranged between
10 and 30 g/m2/day. The CO2 uptake represents roughly half the weight of the dry algae, or
~5 to 15 g CO2/m2/day. Green Fuel is investigating photo bioreactors which bubble flue gas
through high-rate micro-algae for CO2 and NOx removal. Idaho National Lab is investigating
the uptake of inorganic carbon in a photosynthetic reactor with bacteria (Cyanobacterial:
Synechococcus sp. strain PCC 8806) which raises the pH and promotes CaCO3 precipitation.
ORNL and Ohio State are validating bench-scale photo bioreactor designs to grow algae from
flue gas.
Duke Energy’s project at East Bend Power Plant in Kentucky is to demonstrate an algae-
based system for CO2 mitigation from coal-fired power plants. Project participants include
the University of Kentucky Center for Applied Energy Research and the University of
Kentucky Department of Bio systems and Agriculture Engineering. Several other companies
and organizations are testing this technology such a Latrobe University, Australia; KEPCO,
South Korea, NALCO, India etc.
It is questionable whether work on micro-algae should be included in the scan of capture
technologies. Production of high value chemicals may be a more fruitful application more
suited to the practical scale and economics. To qualify for large scale capture the application
needs to be formulated on the same scale as commercial fossil fuel power plant. It is also
questioned whether at this scale suitably large sites could be found. The CO2 emissions of a
baseline coal fired power plant are just over 10,000 tonnes per day. To capture 90% of these
emissions at the rate of 15gm/m2/day would require an area of about 625 square km (a square
25km by 25km). This technology is thus assessed at TRL-1 for large power plants.
More work is needed to understand how regional weather effects will impact the productivity
and marginal cost impacts. An economic assessment of processes in different embodiments
(capture only, capture with co-firing, capture to biofuels) is needed to understand the cost of
CO2 capture. One of the main challenges in large scale production of microalgae to be used
as a feedstock will be to increase the dry weight from ca 2% to 20% in order to get a
sustainable production.

60
3.14. Electrochemically-mediated amine system
In order to reduce the energy penalty and eliminate solvent thermal regeneration a novel
process of electrochemically-mediated amine regeneration (EMAR) is proposed by Stern et
al. 2013. In this process the heat exchanger and stripper is replaced with an electrochemical
cell. This concept offers the advantage of easier retrofitting as no integration is required with
the plant steam cycle. Also probably lower CO2 lean loading can be achieved. Therefore, this
process has potential to improve the overall process economics by reducing absorber size and
lowering system energy penalty.
(a) (b)
Figure 22 (a) Schematic diagram of EMAR process (b) A cross sectional view of EMAR
electrochemical cell stack [Stern 2013]
The CO2 reacts with an amine and it is subsequently decomposed in an electrochemical cell
in a process similar to electrolysis. However the transfer of electrons is not directly to the
CO2 amine compound but between a metal and its cation. The cation once formed has greater
affinity for the amine than the CO2 which is this released. The metal ions of higher oxidation
state are formed at the anode where they displace the CO2 from the amine/CO2 complex. The
Metal ion amine complex which results is then reduced at the cathode to regenerate the amine
which can then absorb more CO2. The work of Stern concluded that only three transition
metals might be suitable; Cr, Cu and Fe but that Cr and Fe would likely suffer oxidation from
oxygen present in the flue gas. A system based on reduction of Cu++ to Cu was thus selected
for further research. A number of different amines were also examined for applicability as a
result of which EDA was found to be superior.
3.14.1. Energy requirement / Cost evaluation
The EMAR system claims several distinct advantages over traditional thermal scrubbing
designs. The advantages claimed range from easing installation logistics, reduction in capital
costs, to improved operational efficiency.
The half cell potential for the Cu++ to Cu reaction is 0.34 volts which is equivalent to a free
energy of reaction of about 66kJ/mol. This is the reaction which occurs at the anode. The
Cu++ displaces bound CO2 releasing this at the anode. At the cathode the Cu++ amine complex
is decomposed depositing copper and releasing lean amine for further reaction. The
difference in these two potentials is the work required for the separation. In open circuit

61
conditions this voltage was found to be of the order of 0.2 volts which equates to about
38kJ/mole with values falling as low as 0.12 volts at 80°C equivalent to 23kJ/mole. However
it will be increased by losses in the electrochemical cell which include electrode over-
potentials, ionic and conductive resistances and also a Faradaic efficiency loss whereby not
all electrons flowing result in release of CO2. Furthermore the work is supplied as DC
electrical energy which is generated at the efficiency of the power plant less the conversion
efficiency from AC to DC. A further interesting feature of the system is the ability to operate
under high pressure. The CO2 would then be released at pressure so that less compression
energy is required. The increased partial pressure of CO2 however raises the cell potential
required but this direct use of electric energy for compression is more efficient than using
mechanical compression. A practical limitation however is the solubility of CO2 in the
solvent which limits how much is released as gas so that using pressures above around 15bar
is not efficient.
The experimental work so far has concluded that at practical flux rates an electrical
consumption of 100kJ/mole would be required, far higher than that for estimates based on
open circuit voltages.
The system thus uses a much higher quality energy than the LP steam used for regeneration
in the conventional amine process. Some electrical energy will also be consumed for
circulation pumps and through increased flue gas pressure drops likely similar to those for
conventional amine systems. 100kJ/mole is equivalent to 2.27GJ/tonne but the thermal
energy in fuel needed would equate to nearly 6GJ/tonne. (taking power plant efficiency as
40% and AC/DC conversion as 95%.) This compares rather unfavourably with the thermal
requirement of the baseline amine process of 3.55GJ/tonne with prospects of this being
lowered to below 3GJ/tonne through process improvements. The capital cost of providing
electrical rather than thermal energy is also slightly higher as additional generating capacity
is required as well as boiler capacity.
Also to be considered is the likely cost of an electrochemical cell which could be similar to
that of an electrolyser. Estimates for the installed cost of electrolysers per kW vary widely but
there is intense interest in the field because of the potential for energy storage through
electrolysis of water to hydrogen using surplus electricity. Literature suggests cost in a wide
range for example from as low as 147 to 1486 $/kW [Manage 2011], with a recent estimate
from the NREL of $473/kW based on a 106MW unit costing $50.1 $million. [NREL 2011]
The costs for the electric regenerator, assuming that energy consumption could be halved to
50kJ/mol, would be that for a unit of about 170MW which would cost $85million. Compared
to the base capital cost estimate for the complete capture plant of $421million this amount
would not be excessive. At 100kJ/tonne this would be double and also the additional capital
for the main power plant and the additional fuel consumed mean the system could not
compete with the conventional process.
3.14.2. Current Status, technology readiness level and development requirements.
The electrochemically-mediated amine system has been tested at bench scale at
Massachusetts Institute of Technology, Massachusetts, USA. Siemens and Topchiev Institute
of Petrochemical Synthesis, Russia is also looking into this technology.
This technology is at a very early stage of development as only the basic principles and
concept have been researched. It is thus assessed as at TRL-1

62
The mode of failure in EMAR could be oxidation due to dissolved oxygen, poor cyclic
plating, or passivation, thus this shall be investigated further. The rate of degradation of the
amine sorbent must also be considered. The effects of flue gas impurities, primarily sulphur
dioxide (SO2), are also a significant concern. The EMAR process needs to be tested at pilot
scale for qualification of this technology.
3.15. Low temperature (cryogenic) separation of CO2
Clodic et al 2002 has developed a process involving antisublimation/freeze-out of CO2 on a
cold surface of -83°C (see Figure 20). In this process the flue gas is cooled at around
atmospheric pressure by a first cooling stage (CS1) designated as the free cooling stage. The
Flue Gases (FG) cooling is done by the ambient air and two water circuits (cooling tower),
one circuit exchanging energy with the flue gases, while the other exchanging energy with
the ambient air. A water/water heat exchanger links these two circuits together. This
arrangement isolates the process water, which comes in direct contact with the flue gases,
from any contact with the ambient air. Figure 23 illustrates how the "hot" refrigerant blend
enters in evaporator no.2 at a typical temperature of –50°C (the volume containing evaporator
no.2 is shut). Thus during the defrosting process, the temperature and the pressure raise up to
–56°C and 520 kPa. Then the solid CO2 begins to melt and is recovered in the liquid phase by
the pump.
Figure 23 Layout of the low temperature CO2 capture system [Clodic 2002]
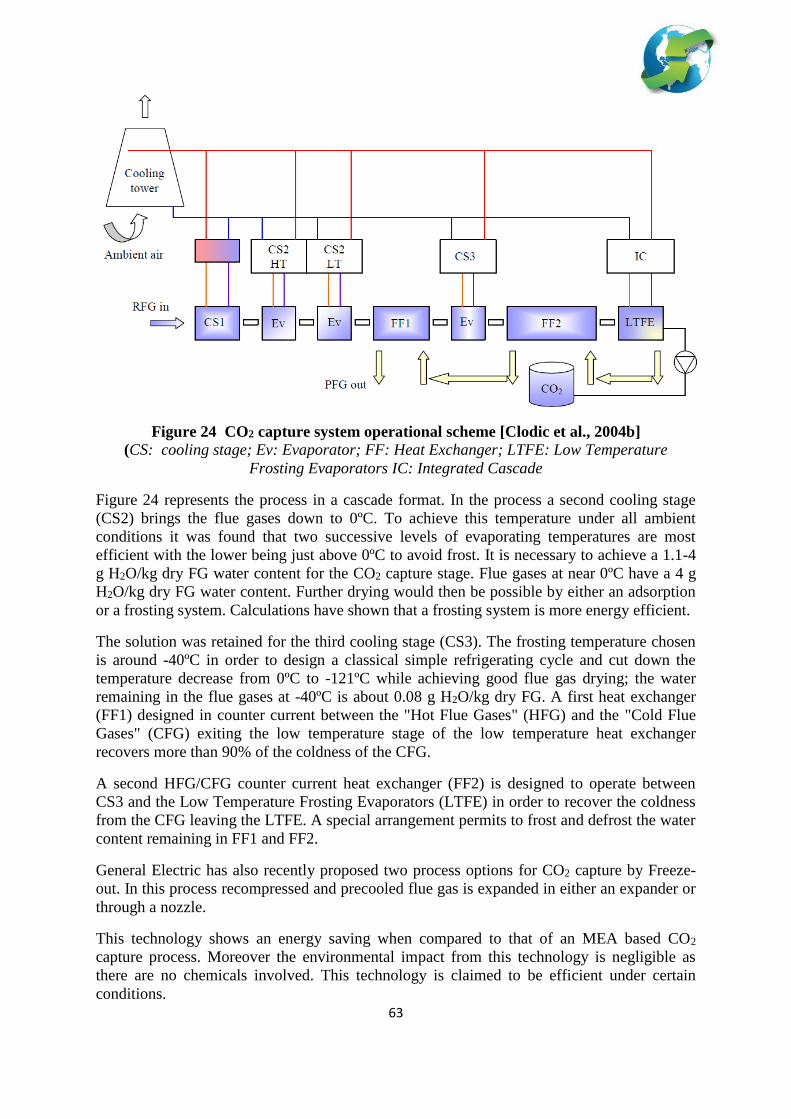
63
Figure 24 CO2 capture system operational scheme [Clodic et al., 2004b]
(CS: cooling stage; Ev: Evaporator; FF: Heat Exchanger; LTFE: Low Temperature
Frosting Evaporators IC: Integrated Cascade
Figure 24 represents the process in a cascade format. In the process a second cooling stage
(CS2) brings the flue gases down to 0ºC. To achieve this temperature under all ambient
conditions it was found that two successive levels of evaporating temperatures are most
efficient with the lower being just above 0ºC to avoid frost. It is necessary to achieve a 1.1-4
g H2O/kg dry FG water content for the CO2 capture stage. Flue gases at near 0ºC have a 4 g
H2O/kg dry FG water content. Further drying would then be possible by either an adsorption
or a frosting system. Calculations have shown that a frosting system is more energy efficient.
The solution was retained for the third cooling stage (CS3). The frosting temperature chosen
is around -40ºC in order to design a classical simple refrigerating cycle and cut down the
temperature decrease from 0ºC to -121ºC while achieving good flue gas drying; the water
remaining in the flue gases at -40ºC is about 0.08 g H2O/kg dry FG. A first heat exchanger
(FF1) designed in counter current between the "Hot Flue Gases" (HFG) and the "Cold Flue
Gases" (CFG) exiting the low temperature stage of the low temperature heat exchanger
recovers more than 90% of the coldness of the CFG.
A second HFG/CFG counter current heat exchanger (FF2) is designed to operate between
CS3 and the Low Temperature Frosting Evaporators (LTFE) in order to recover the coldness
from the CFG leaving the LTFE. A special arrangement permits to frost and defrost the water
content remaining in FF1 and FF2.
General Electric has also recently proposed two process options for CO2 capture by Freeze-
out. In this process recompressed and precooled flue gas is expanded in either an expander or
through a nozzle.
This technology shows an energy saving when compared to that of an MEA based CO2
capture process. Moreover the environmental impact from this technology is negligible as
there are no chemicals involved. This technology is claimed to be efficient under certain
conditions.

64
3.15.1. Energy requirement / Cost evaluation
It is reported by Clodic et al., 2002, that the total energy required by the system to capture the
CO2 and compress it to 15MPa will be 1.2 GJ/tonne CO2 for a coal based power plant with
~14% CO2 in the flue gas with a 90% CO2 removal rate.
The energy consumption is critically dependent on two parameters, the amount of cold
energy recovered in heat exchange of cold with hot flue-gas and the efficiency of the
refrigeration cycles. The former is limited by the temperature approach which is used.
Because the cold return flow of flue gas is lower than the hot feed flow the exchangers can be
designed to have a close final approach but not so easily a close overall approach. The other
parameter is the efficiency of the cooling cycles and here calculations were done on both a
low and a high figure. The higher figure, which may be more representative of a practical
application, showed 1248kJ/kg CO2 captured as cold liquid. This would equate to 3.12GJ/kg
which is competitive with amine absorption processes.
The main capital costs are for the refrigeration equipment and the heat exchangers. The cost
of the refrigeration will be partly driven by the compression power. The literature did not
present any cost estimates but a rough assessment can be made on the basis of the
refrigeration compression power and heat exchange duty.
3.15.2. Current Status, technology readiness and development requirement.
Clodic et al 2011, have performed pilot plant tests for this technology, whereas GE have
evaluated this technology on the basis of simulation work. Other companies who are involved
in the development of this technology are Shell Global Solutions, Alstom and Ereie. The
University of Eindhoven, The Netherlands and MINES ParisTech, France are also
investigating this technology.
The equipment required for this process consists largely of refrigeration systems and heat
exchangers which can be based on well-developed design and construction principles.
Engineering the cyclic frosting and defrosting stages for reliable large scale operation may be
a challenge and an effective solution at scale certainly needs to be demonstrated. The
principles have however been validated in a small scale laboratory environment. The
Technology readiness level is assessed as TRL-3 but development and commercialisation
could proceed very quickly.
As the process equipment is available, a test at larger scale is the next step for this
technology.
3.16. Supersonic Post-combustion Inertial CO2 Extraction System
In the inertial CO2 extraction system (ICES), coal-fired flue gas is directed to a converging
diverging nozzle and expanded to supersonic velocities. The process of aerodynamic
expansion to high velocity results in the conversion of potential energy contained in the form
of pressure and temperature into kinetic energy. The rapid temperature and pressure decrease
produced from this conversion results in condensation of undesirable constituents of flue gas
including the desublimation of CO2. The high density of the solid phase constituents of the
flow allows for inertial separation by centrifugal forces induced by flow path curvature.

65
Figure 25 Configuration of an individual ICES unit [NETL]
ICES does not require external media or chemical processes such as those used with solvent
or sorbent technologies, and, due to high flow velocity, is characterized by a very small
system volume compared to membrane systems. ICES technology has the ability to achieve
steady capture conditions very rapidly after start up. Unlike conventional technologies that
require thermal conditioning of the separation media, ICES only requires a few seconds of
system pre-evacuation using a steam ejector to initiate supersonic flow and be ready for
service. The ICES is characterized by a footprint approximately 25 percent the size of an
equivalent amine system, is readily scalable, reduces parasitic plant load from capture and
compression, and includes steps for capture, purification, and highly efficient pressurization.
3.16.1. Energy requirement / Cost evaluation
A previous preliminary techno-economic analysis in DOE’s project with conservative
assumptions predicted the cost of CO2 captured at $41.80 per tonne CO2 [NETL, 2014].
The viability of this process needs careful assessment as it relies on efficient recovery of
energy from the compressed fluegas stream. A similar process is offered for natural gas
dewpointing by “Twister” B.V. a Dutch company spun off by Shell Global Solutions. Their
process is viable when gas is already at pressure so that compression costs are avoided.
3.16.2. Current Status, technology readiness level and development requirements.
Alliant Techsystems Operations and ACENT Laboratories have teamed with the Electric
Power Research Institute and The Ohio State University for further development of the
technology for post combustion CO2 capture. Previous DOE-funded research has resulted in
one key remaining technical challenge: the generation of CO2 particles greater than
approximately 2.5 μm in effective diameter to ensure efficient inertial migration. Hence, the
key objective of the current DOE project is verification of CO2 particle growth to a size that
permits them to migrate to a compact layer adjacent to one wall where they can be readily

66
removed by a boundary layer capture duct. Additionally, the exhibition of efficient diffusion
of the CO2-depleted flow to atmospheric pressure is planned. A major project outcome will
be confirmation of the feasibility of the inertial CO2 separation in a compact device without
any moving parts or consumables.
The principle of inertial separation using supersonic flows is proven and commercialised in
another application. Although the principle is understood it is still questionable as to whether
sufficiently large solid particles can be generated for it to function. This has yet to be
observed. The technology readiness level is thus assessed at being in the early stage of TRL-1
A detailed laboratory-scale investigation and analysis of the mechanisms underlying CO2
condensation, nucleation, and particle growth is required. A bench-scale testing of the
complete ICES incorporating the selected particle growth method with the optimized capture
duct and diffuser systems to enable the integrated testing of CO2 condensation, migration,
removal, and flow diffusion is required. An updated techno-economic analysis based on the
newly developed ICES configuration and development of an environmental, health, and
safety assessment for the ICES system as deployed at a pulverized coal-fired power plant are
needed.
3.17. Vacuum Swing Adsorption Process (VPSA)
In this process the adsorption process takes place in a fixed bed column under low pressure.
Three or more adsorption beds filled with adsorbent pellets are used. In a typical process, first
adsorption takes place which is followed by applying rinse, evacuation and purge to desorb
the adsorbed gas (see Figure 26). In order to have a continuous process more than one
column is required. This process is mostly isothermal and adsorption and desorption take
place at the same temperature, typically 40-70°C. The adsorbents are selected with high
surface area, high CO2 selectivity with lower energy requirement for adsorption.
Figure 26 Six-step VSA cycle: I – pressurization, II – adsorption, III – rinse, IV – co-
current blowdown, V – counter-current blowdown, and VI – counter-current
evacuation [Huang et al.2013]
The VPSA process is most suitable for flue gases with a CO2 concentration >10%. The main
energy requirement of this process is from vacuum pumps, the valves and CO2 compressors.
There will be 7-8% water present in the flue gas; therefore water removal will be required to
reduce the moisture level, which will require additional energy. Mostly zeolites are used in
VPSA processes, however metal organic frameworks (MOFs), zeolite imidazolate

67
frameworks (ZIFs) or other improved adsorbents with higher surface are being developed. Of
particular interest are carbon based materials which are less adsorbent to water. This VPSA
process has no specific environmental effect as in most cases adsorbents are stable and non-
volatile.
3.17.1. Energy requirement / Cost evaluation
The CO2 avoidance cost for vacuum swing adsorption for a 500MW pulverized coal fired
power plant with 12% CO2 in flue gas is in the range of 12-25 $/tonne CO2 for 6 cycle steps
without purge, 82-83% captured and CO2 purity at 60-80%. For 9 step cycle with purge for
90-95% captured and CO2 purity at 60-70%, the CO2 avoided cost is in the range of 18-32
$/tonne CO2 [Zhang et al. 2008].
The power consumption depends greatly not only on the properties of the sorbent but also on
the design of the PSA cycle. In a study by Argawal 2010 (Carnegie Mellon) various cycles
for post combustion CO2 capture were simulated and one designed to minimise power
consumption predicted an energy consumption of 465kWh/tonne (1.67GJ/tonne). This is as
work and, assuming a 40% power plant efficiency, would equate to 4.2kJ/tonne thermal
which is considerably higher than for solvent absorption. The ability of such systems to
significantly lower the additional cost of electricity needs to be critically assessed as only
with highly energy efficient cycles and good selectivity is it likely that they will compete.
Although low costs are quoted in the literature these may be overly optimistic.
3.17.2. Thermodynamic considerations
This separation method applies work in the form of compression energy to desorb the CO2
from the adsorbents. The equilibrium partial pressure from which the CO2 has to be pumped
will be that to which the sorbent has been exposed. In addition the energy of adsorption will
also have to be supplied. Promising materials based on carbon have been identified and have
isosteric energy of adsorption of about 25kJ/mol which is equivalent to about 0.57 GJ/tonne
as work or 1.4 GJ/tonne thermal input assuming 40% power plant efficiency. However most
of this energy does not have to be supplied in a cyclic adsorption process for the following
reason. On adsorption the heat of adsorption will slightly raise the temperature of the sorbent.
On desorption the reverse effect will occur, in effect the captured gas is “evaporating” from
the surface sites and the sorbent cools, the binding energy is thus recovered. However the
temperature change will result in a change in the adsorption isotherm so that a slightly lower
pressure will be needed to desorb the gas. This will in turn slightly increase the vacuum
pressure which needs to be applied and thus the compression energy consumption.
In practice a lower than equilibrium pressure has to be used to provide an adequate driving
force. The theoretical minimum work will thus be that for the same separation using a staged
membrane process. Additional losses are incurred due to the depressurisation and re-
pressurisation process. The VPSA process thus theoretically has potential to deliver similar
performance to a membrane system provided a suitably selective adsorbent is found.
3.17.3. Current Status, technology readiness level and development requirements.
Currently there are two pilot plants for VPSA, one in Australia and a second in Shanghai,
both plants have three columns. The column diameter is 0.2 m and height is 1 m in the
Shanghai plant. In this plant continuous operation has been performed for 15% CO2 in flue
gas from coal fired power plant, capturing 79% CO2 at a rate of approximately 12kg/h of
CO2. The captured CO2 purity is 85%.
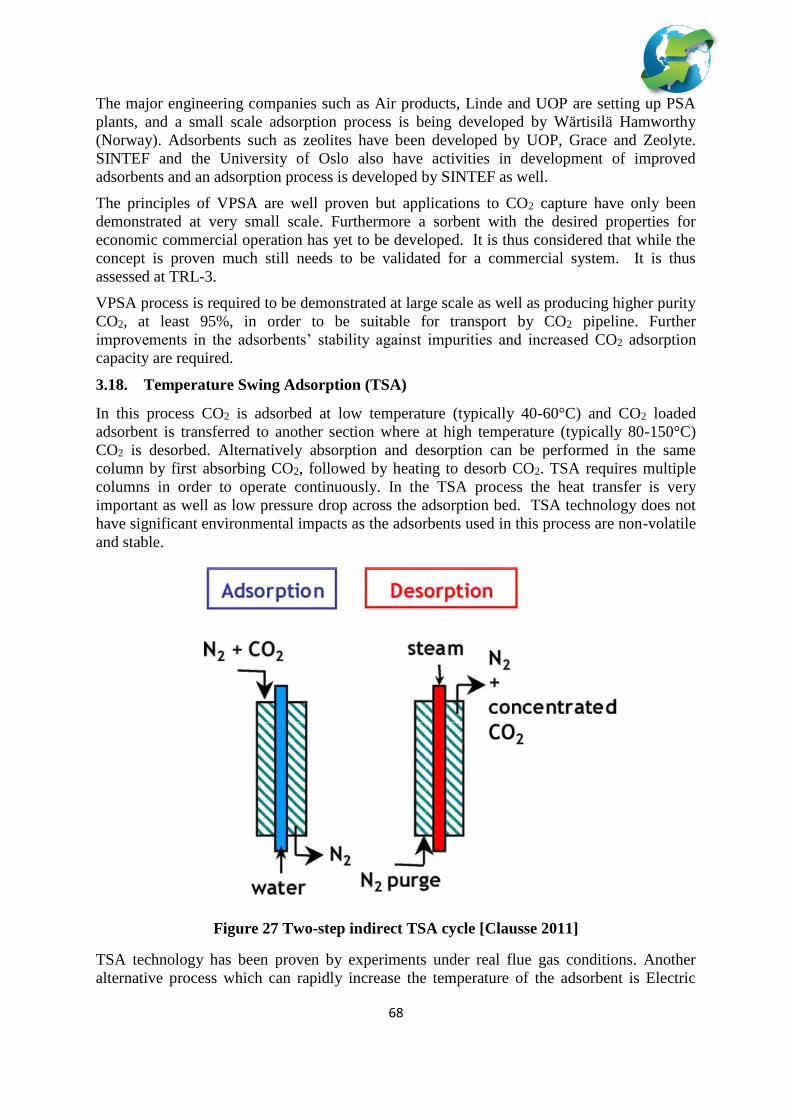
68
The major engineering companies such as Air products, Linde and UOP are setting up PSA
plants, and a small scale adsorption process is being developed by Wärtisilä Hamworthy
(Norway). Adsorbents such as zeolites have been developed by UOP, Grace and Zeolyte.
SINTEF and the University of Oslo also have activities in development of improved
adsorbents and an adsorption process is developed by SINTEF as well.
The principles of VPSA are well proven but applications to CO2 capture have only been
demonstrated at very small scale. Furthermore a sorbent with the desired properties for
economic commercial operation has yet to be developed. It is thus considered that while the
concept is proven much still needs to be validated for a commercial system. It is thus
assessed at TRL-3.
VPSA process is required to be demonstrated at large scale as well as producing higher purity
CO2, at least 95%, in order to be suitable for transport by CO2 pipeline. Further
improvements in the adsorbents’ stability against impurities and increased CO2 adsorption
capacity are required.
3.18. Temperature Swing Adsorption (TSA)
In this process CO2 is adsorbed at low temperature (typically 40-60°C) and CO2 loaded
adsorbent is transferred to another section where at high temperature (typically 80-150°C)
CO2 is desorbed. Alternatively absorption and desorption can be performed in the same
column by first absorbing CO2, followed by heating to desorb CO2. TSA requires multiple
columns in order to operate continuously. In the TSA process the heat transfer is very
important as well as low pressure drop across the adsorption bed. TSA technology does not
have significant environmental impacts as the adsorbents used in this process are non-volatile
and stable.
Figure 27 Two-step indirect TSA cycle [Clausse 2011]
TSA technology has been proven by experiments under real flue gas conditions. Another
alternative process which can rapidly increase the temperature of the adsorbent is Electric

69
Swing Adsorption (ESA), where a low voltage electric current is employed to heat the
adsorbent by the direct Joule effect. One disadvantage of ESA when compared to TSA is that
in ESA the temperature increase is achieved by using electric power while in the case of TSA
low-grade heat is employed.
3.18.1. Energy requirement / Cost evaluation
Grande et al. 2008 evaluated the cost of CO2 capture using an ESA process. They estimated
the energy consumption associated with the separation of CO2 to be 2.04 GJ/tonne CO2, for
an adsorbent consisting of 70 wt.% zeolite X and 30 wt.% of a conducting binder. This rather
high figure as electric energy almost certainly makes this process uneconomic
Regeneration using thermal energy is thus more likely to be of interest. The energy
consumption is discussed below and there are indications that it could be slightly superior to
the conventional amine absorption process. However the potential reduction being only
around 10% suggests that cost reduction due to better energy efficiency might only be 5% of
the benchmark increase. There may be more scope for cost reduction in the process
equipment but this cannot be assessed until more detailed schemes are assessed and decisions
on bed type, cycles, cycle times etc. have been made.
3.18.2. Thermodynamic considerations
The temperature change required to achieve regeneration will increase as the free energy of
adsorption increases. A high energy of adsorption will in turn result in higher loading for a
given partial pressure of CO2. It will not be efficient to use heat to regenerate if most is not
recovered because of the relatively high heat capacity of the sorbent as compared to that of
the adsorbed CO2. An issue is the method by which heat is transferred in and out of the
adsorbent beds in an efficient manner. Direct heating using a gas flow requires very large
flows because of the low heat capacity of appropriate gases. Thus despite the complexity of
arranging indirect heat transfer to either fixed or fluidised bed this method may be the more
practical. Using fixed beds it is possible to attain much higher CO2 loadings than with
fluidised beds because the feed gas can be allowed to flow until the entire bed is saturated at
the partial pressure of CO2 in the inlet. In a fluidised bed the equilibrium will be close to that
of the gas at the outlet because of the intense mixing. For 90% capture this would thus be
1/10th.
The thermodynamics and energy consumption of the TSA process are examined in some
detail in a paper by Pirngruber [Pirngruber 2013]. The lower limit for energy consumption in
a fixed bed TSA was predicted to be as low as 2.1GJ/tonne thermal but this is subject to
several optimistic assumptions including finding a sorbent with a higher capacity for CO2
than currently known and employing isothermal conditions in the adsorber necessitating
installation of a very large heat transfer area. More realistic predictions would suggest the
limit to be no lower than 3.2GJ/tonne thermal. Fluidised bed systems are considerably more
energy intensive and cannot compete. Thus the overall energy consumption would be only
slightly lower than the benchmark 3.55GJ/t thermal, which equates to 1.19GJ/tonne as work
excluding compression energy but including electrical auxiliaries for the capture process.
This would equate to about 1.09GJ/tonne as work assuming similar auxiliary load. Note that
this refers to amount captured. In practice it is the amount abated which is of interest and
benchmark performance studies indicate overall figures including compression of around
1.57GJ/tonne.
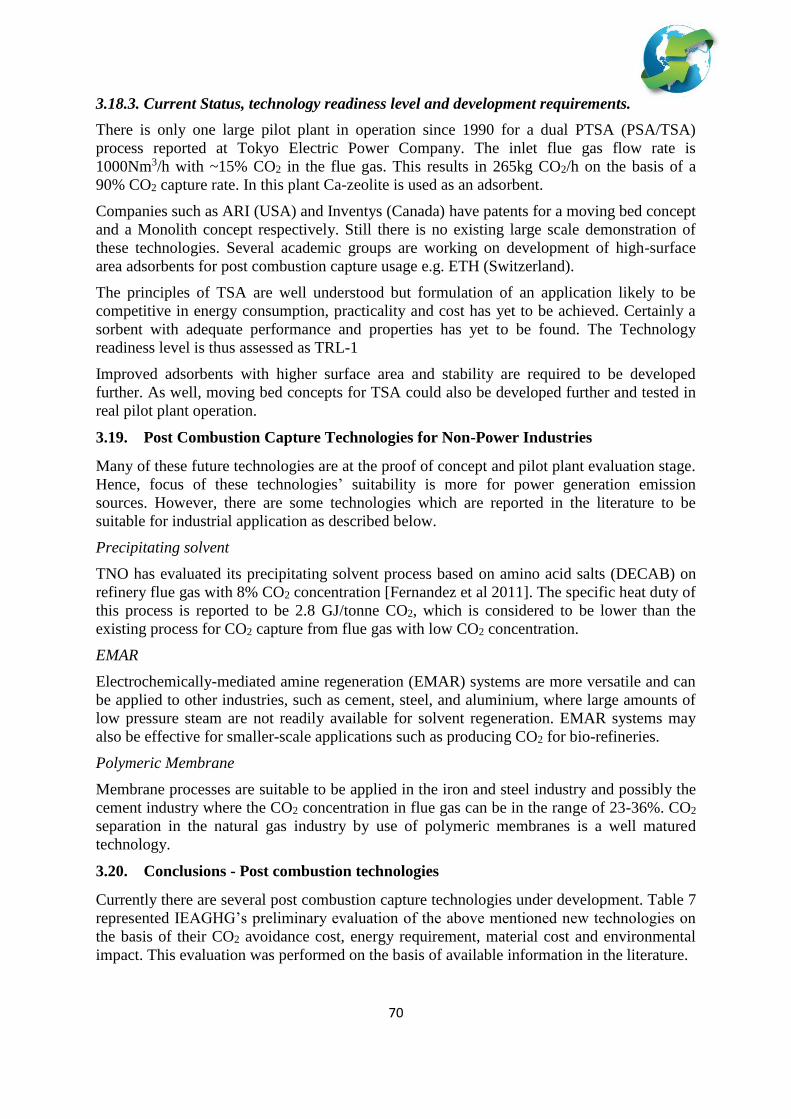
70
3.18.3. Current Status, technology readiness level and development requirements.
There is only one large pilot plant in operation since 1990 for a dual PTSA (PSA/TSA)
process reported at Tokyo Electric Power Company. The inlet flue gas flow rate is
1000Nm3/h with ~15% CO2 in the flue gas. This results in 265kg CO2/h on the basis of a
90% CO2 capture rate. In this plant Ca-zeolite is used as an adsorbent.
Companies such as ARI (USA) and Inventys (Canada) have patents for a moving bed concept
and a Monolith concept respectively. Still there is no existing large scale demonstration of
these technologies. Several academic groups are working on development of high-surface
area adsorbents for post combustion capture usage e.g. ETH (Switzerland).
The principles of TSA are well understood but formulation of an application likely to be
competitive in energy consumption, practicality and cost has yet to be achieved. Certainly a
sorbent with adequate performance and properties has yet to be found. The Technology
readiness level is thus assessed as TRL-1
Improved adsorbents with higher surface area and stability are required to be developed
further. As well, moving bed concepts for TSA could also be developed further and tested in
real pilot plant operation.
3.19. Post Combustion Capture Technologies for Non-Power Industries
Many of these future technologies are at the proof of concept and pilot plant evaluation stage.
Hence, focus of these technologies’ suitability is more for power generation emission
sources. However, there are some technologies which are reported in the literature to be
suitable for industrial application as described below.
Precipitating solvent
TNO has evaluated its precipitating solvent process based on amino acid salts (DECAB) on
refinery flue gas with 8% CO2 concentration [Fernandez et al 2011]. The specific heat duty of
this process is reported to be 2.8 GJ/tonne CO2, which is considered to be lower than the
existing process for CO2 capture from flue gas with low CO2 concentration.
EMAR
Electrochemically-mediated amine regeneration (EMAR) systems are more versatile and can
be applied to other industries, such as cement, steel, and aluminium, where large amounts of
low pressure steam are not readily available for solvent regeneration. EMAR systems may
also be effective for smaller-scale applications such as producing CO2 for bio-refineries.
Polymeric Membrane
Membrane processes are suitable to be applied in the iron and steel industry and possibly the
cement industry where the CO2 concentration in flue gas can be in the range of 23-36%. CO2
separation in the natural gas industry by use of polymeric membranes is a well matured
technology.
3.20. Conclusions - Post combustion technologies
Currently there are several post combustion capture technologies under development. Table 7
represented IEAGHG’s preliminary evaluation of the above mentioned new technologies on
the basis of their CO2 avoidance cost, energy requirement, material cost and environmental
impact. This evaluation was performed on the basis of available information in the literature.

71
Based on the evaluation presented in table 7, it can be noticed that the cost of CO2 capture is
claimed to be lowered by these future technologies as well as their environmental impact.
However more work is required to characterise the environmental impact of some of these
future technologies.
A more critical assessment of the costs and energy performance of technologies has been
made since the first assessment. In most cases this has led to a more conservative view of the
potential and identifies several technologies as unlikely to compete. The assessments have
been summarised in tables in the executive summary and for post combustion capture the
assessment is shown in table 8 below.
In addition to the consideration of individual technologies it has also been identified that
there may be interesting options to develop hybrid systems based around the recycling of CO2
to the power plant boiler using the combustion air as a sweep gas. Although this has been
proposed initially using a membrane separation it is in fact amenable to use by solvent and
solid adsorption systems. Furthermore whilst the primary separation stage for the CO2
enriched flue gas has been based on membranes all separation technologies could be used in
this location in the process. Evaluation of all possible combinations would have to be done to
identify which of them warranted further development. This hybrid scheme causes flame
temperatures in the power generation process to fall. However this does not reduce cycle
efficiency because the full combustion temperature cannot be used. This available exergy is
thus utilised to drive part of the capture process. This advantage appears to similar to that
derived by some of the high temperature solid looping processes which are able to reject heat
at temperatures above those of the working fluid thus avoiding efficiency losses in the power
generation cycle.

72
Table 7 Preliminary evaluation of future generation post combustion capture
technologies
Technology
CO2
avoidance
cost*
Energy
requirement*
Material/Solvent
Cost*
Environmental
Impact*
Precipitating
Solvent
Reduce by
Half
Low; << 3
GJ/tonne CO2 Low Low
Two phase liquid
solvent 25% lower
Low; <2.5
GJ/tonne CO2 Low Unknown
Ionic liquids High
Low;
approximate
16% lower*
High Low
Gelled Ionic
Liquid-Based
Membranes
Low Low Medium-High Unknown
Enzyme activated
solvent Medium
Low;
approximate
33% lower
Low Medium
Algae based CO2
capture Medium Low Low Low
Electrochemically-
mediated amine Medium Medium Low Similar
Supersonic
Inertial CO2
extraction
Low Low Low Unknown
Vacuum Swing
Adsorption Low
Low; 30-50
kJ/mole CO2 Low Low
Temperature
Swing Adsorption Low
Low; 2.04
GJ/tonne CO2 Low Low
Polymeric
membrane Low Low Medium Low
Low temperature
separation Low
Low;
1.2GJ/tonne CO2 Medium Low
Polymeric
membrane & low
temp. separation
~23% lower Low Medium Low
Notes: *compared to a conventional solvent Monoethanolamine (MEA) based process
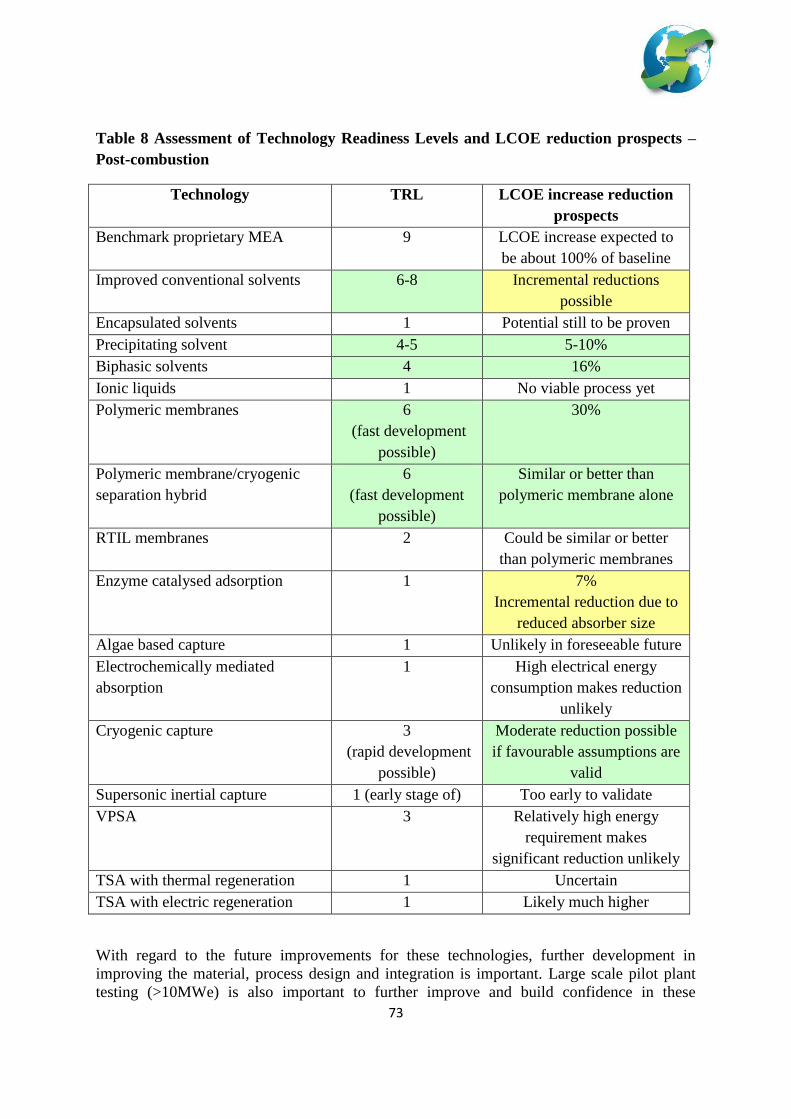
73
Table 8 Assessment of Technology Readiness Levels and LCOE reduction prospects –
Post-combustion
Technology TRL LCOE increase reduction
prospects
Benchmark proprietary MEA 9 LCOE increase expected to
be about 100% of baseline
Improved conventional solvents 6-8 Incremental reductions
possible
Encapsulated solvents 1 Potential still to be proven
Precipitating solvent 4-5 5-10%
Biphasic solvents 4 16%
Ionic liquids 1 No viable process yet
Polymeric membranes 6
(fast development
possible)
30%
Polymeric membrane/cryogenic
separation hybrid
6
(fast development
possible)
Similar or better than
polymeric membrane alone
RTIL membranes 2 Could be similar or better
than polymeric membranes
Enzyme catalysed adsorption 1 7%
Incremental reduction due to
reduced absorber size
Algae based capture 1 Unlikely in foreseeable future
Electrochemically mediated
absorption
1 High electrical energy
consumption makes reduction
unlikely
Cryogenic capture 3
(rapid development
possible)
Moderate reduction possible
if favourable assumptions are
valid
Supersonic inertial capture 1 (early stage of) Too early to validate
VPSA 3 Relatively high energy
requirement makes
significant reduction unlikely
TSA with thermal regeneration 1 Uncertain
TSA with electric regeneration 1 Likely much higher
With regard to the future improvements for these technologies, further development in
improving the material, process design and integration is important. Large scale pilot plant
testing (>10MWe) is also important to further improve and build confidence in these

74
technologies. Figure 28 below illustrates the key areas of further work for these future
generation post combustion capture technologies.
Figure 28 Evaluation required for future generation post combustion capture
technologies.
4. Pre-Combustion Capture Technologies
In pre-combustion capture, fuel is reacted with oxygen or air, and in some cases steam, to
give mainly carbon monoxide and hydrogen in processes known as gasification, partial
oxidation and reforming. The mixture of mainly CO and H2 is passed through a catalytic shift
conversion reactor where most of the CO reacts with steam to give CO2 and more H2. Most of
the CO2 is separated and the H2 can be used as fuel in a gas turbine combined cycle plant.
The process is in principle the same for coal, oil or natural gas, but when coal or oil are used
there are more stages of gas purification to remove particles of ash, sulphur and nitrogen
compounds and other minor impurities. For solid fuels this overall process is called
Integrated Gasification Combined Cycle (IGCC). Hydrogen produced in plants with pre-
combustion capture can also be used as a decarbonised energy carrier for distributed energy
consumers such as transport, domestic and commercial building, small scale industry and
some large energy consuming industries such as oil refining. As hydrogen is easier to store
than electricity, it can be more suitable for satisfying distributed heat demands, which have
high daily and season variations in demand. Stored hydrogen from pre-combustion capture
plants could also be attractive for decarbonisation of intermediate and peak load power
generation.
Future Generation Post Combustion
Capture Technologies
Solvent Based Process e.g. Enzymes, Biphasic, Ionic
liquids, Algae
Membrane Separation e.g Polymeric/ Hybrid membrane
Adsorption Process e.g. VPSA, TSA, Zeolite, Carbon based adsorbents (HCFC), Metal-
Organic Frameworks (MOF's)
Cryogenic Seperation; Supersonic Inertial CO2
Extraction
Hybrid Processes e.g. Membrane + Cryogenic,
Enzymes & Algae, Enzymes & Membranes, Amine &
Adsorption
• Material
improvements such
as resistance to
impurities present
in flue gas
• Lowering material
cost
• Pilot plant testing
using real flue gas
• Environmental
impact
• Process integration
and dynamics
• Suitability in power
generation & heavy
industries

75
The conditions for CO2 separation in pre-combustion capture processes are substantially
different from those in post-combustion capture processes. The feed to the CO2 capture unit
in a coal-based IGCC process, located upstream of the gas turbine, would have a CO2
concentration in the range of 15-60% and a total pressure of 2-7 MPa [IEAGHG, 2014;
IEAGHG, 2005]. The CO2 partial pressure is therefore up to 1000 times higher than in post-
combustion capture. This enables solvents with lower energy consumptions to be used such
as the physical solvent processes Rectisol (cold methanol) and Selexol (dimthylether of
polyethylene glycol). Another advantage is that these solvents can release some of their CO2
at elevated pressures, which reduces the energy consumption and cost of CO2 compression.
The physical solvents can also selectively separate sulphur compounds, mainly H2S, from the
hydrogen-rich gas before it is fed to the gas turbine.
Several integrated gasification combined cycle (IGCC) plants without CO2 capture, using
coal and petroleum residues, are already operational [Higman, 2013]. The technologies for
gas production and CO2 separation are already proven in ammonia production and other
industrial processes, especially in large modern coal gasification chemical production plants
in China. Currently no IGCC plants with large scale CO2 capture are in operation but a
524MWe lignite gasification plant at Kemper County, USA which has a 65% capture rate is
scheduled to start-up in 2016.
The optimum technologies for pre-combustion capture in natural gas fuelled plants may be
different to those in IGCC, because for example the partial pressure of CO2 is lower, which
improves the attractiveness of chemical solvents versus physical solvents. An alternative
technology is vacuum swing adsorption, which is being used for pre-combustion capture at a
commercial scale hydrogen plant at Port Arthur in Texas. This DOE funded project captures
1Mt/y of CO2.
The energy consumption for CO2 separation is less than in post combustion capture, for the
reasons described above but there are other significant energy efficiency losses in IGCC
which do not apply to post combustion capture:
Steam has to added to the feed to the shift converter, which is provided either by
addition of externally generated steam or by quenching the gasifier product gas,
thereby reducing the amount of steam that would be generated in a heat recovery
boiler. The surplus steam in the shifted fuel gas usually has to be condensed upstream
of the CO2 separation unit, and the energy from cooling and condensation is only
available at low temperatures.
Shift reaction is an exothermic process and although the heat of reaction can be used
to raise high grade steam this is less efficient than feeding the energy to the gas
turbine combined cycle plant.
Removal of CO2 from the fuel gas reduces the mass flow through the expansion part
of the gas turbine, thereby reducing the power output. In practice the removal of CO2
is usually offset by the addition of more compressed nitrogen or air. The power
consumption for the nitrogen or air compression is significant.
The gas turbine firing temperature may have to be reduced because burning a high
hydrogen fuel gas results in a higher steam concentration in the gas flowing through
the gas turbine, which increases heat transfer to the blades. This has to be offset by a
lower turbine inlet temperature, which reduces the gas turbine efficiency.

76
When considering new technologies to reduce the energy consumption for pre-combustion
capture in IGCC it is necessary to take a holistic view including interactions with the other
parts of the process such as gasification, fuel gas desulphurisation, shift conversion, CO2
compression and the power generation process.
The capital costs of pulverised coal plants with and without capture and an IGCC plant with
capture are shown in Figure 29 [IEAGHG, 2014b]. It can be seen that the cost of the capture
unit in the IGCC plant is substantially lower than the cost in the pulverised coal plant (even
though the ‘capture’ unit in the IGCC plant also removes sulphur compounds from the fuel
gas). However the overall cost of the IGCC plant is higher than that of the pulverised coal
plant with capture, because of high costs for other parts of the plant. However the costs of all
of these technologies are subject to significant uncertainty until full scale commercial plants
have been brought into service and consequently the relative costs of the different
technologies may change.
Figure 29 Specific Total Plant Costs of power plants with and without CO2 capture
The costs of adding CO2 capture to an IGCC plant have also been explored in detail by NETL
[NETL 2013]. Analysis of the cost breakdown reveals that about 17% of the increased cost of
electricity can be attributed to the capital cost of the shift reactors and extension of the
Selexol unit from one stage (for sulphur compound removal) to two stage. The rest of the
increase, about 87% is attributable to the loss of efficiency resulting in consumption of more
fuel and a higher capital charge for the base plant per unit of net output. Hence improvements
in LCOE for IGCC with capture need to focus on efficiency and furthermore there is
opportunity for favourable trade off between efficiency gains and more expensive capture
plant.
For post combustion capture, the main focus on cost reduction is on reducing the energy
consumption and capital and operating costs of the CO2 capture unit itself, as that is the main
77
contribution to the overall cost of capture. To substantially reduce the cost of IGCC with
capture not only should the cost of capture be reduced but also the costs of the other process
units associated with capture such as shift conversion and the interaction between these units
and the gasification, power generation and CO2 compression units should be improved.
Reductions in the costs of gasification, air separation and power generation units would also
help to improve the competitiveness of IGCC with CO2 capture. Improvements to oxygen
production technology are described in the oxy-combustion section of this report.
Improvements are being made to gas turbine combined cycles and thermal efficiencies are
expected to continue to improve in future, but discussion of these improvements is considered
to be largely outside the scope of this study. A particular issue at present for IGCC is that gas
turbine vendors are not willing to offer their most modern highest efficiency gas turbines for
combustion of high hydrogen content fuel gas in IGCC. Overcoming this constraint could
provide a significant improvement to IGCC efficiencies and costs. Although this report does
not consider improvements in gas turbines it does consider an alternative higher efficiency
power generation technology, namely fuel cells, because this can include integrated CO2
capture.
This report focusses on technologies which are in early stage development which offer the
potential for substantial reductions in costs of electricity for plants with pre-combustion
capture, namely gas separation membranes, sorbent enhanced water gas shift, low
temperature removal with and without CO2 recycle and solid oxide fuel cells with CO2
capture.
4.1. Gas Separation Membranes
4.1.1. Description and status
Gas separation membranes rely on differences in physical or chemical interactions between
gases and a membrane material, causing one component to pass through the membrane faster
than another. Various types of membrane are currently available for pre-combustion capture,
including porous inorganic membranes, palladium membranes, polymeric membranes and
zeolites. Membranes are used commercially for CO2 removal from natural gas at high
pressure but development is required before membranes could be used cost effectively on a
large scale for pre-combustion capture of CO2 in power plants.
Pre-combustion capture membranes can be classified as hydrogen membranes in which
hydrogen selectively passes through the membrane, and CO2 membranes, in which CO2
selectively passes through the membrane. There is a range of options for configuring
membranes for pre-combustion caption capture, e.g. before shift conversion, between shift
reactors, within shift reactors or during CO2 compression [NETL, 2009]. An important issue
is to match the operating temperature of the membrane to its location with an IGCC plant, as
shown in Figure 30.

78
Figure 30 Temperature match for membrane IGCC integration [NETL, 2009]
Membranes can be combined with methane reforming or partial oxidation and/or water gas
shift reaction. The removal of hydrogen from the reaction zone by the membrane pushes the
reaction equilibrium towards production of hydrogen, resulting in a higher degree of
conversion and possibly a lower steam requirement.
CH4 + ½O2 → CO + 2H2 (Methane partial oxidation)
CH4 + H2O → CO +3H2 (Steam reforming)
CO + H2O → CO2 + H2 (Water gas shift reaction)
Similar advantages can be achieved by sorbent enhanced water gas shift and methane
reforming reactors, which are described later in this report.
4.1.2. Metallic hydrogen separation membranes
Metallic membranes are generally based on palladium or palladium alloys although it is
possible to use various metals. As shown in Figure 31, hydrogen separation is achieved by
dissociative chemisorption of hydrogen on the surface producing atomic hydrogen which
diffuses through the metal lattice to the opposite side of the membrane. There the atomic
hydrogen recombines to H2 and diffuses away from the surface. In most cases the membrane
consists of an inorganic support covered with a thin layer of precious metal, which is
normally palladium or palladium alloy, although other metals can be used [Scholes, 2010].

79
Figure 31 Metallic hydrogen separation membrane [Jack, 2011]
The system results in hydrogen on one side of the membrane and a high pressure stream of
CO2 with a small amount of CO and other impurities on the other side of the membrane. The
high pressure of the CO2 minimises the energy consumption for CO2 compression. The
hydrogen is in principle almost pure because no other gas undergoes dissociation at the metal
surface, although microscopic holes in the membrane can permit other gases to pass through,
leading to a reduction in selectivity. The flux of hydrogen is proportional to the square root of
the partial pressure difference across the membrane. If the hydrogen is to be used in an IGCC
gas turbine, nitrogen sweep gas can be used to reduce the hydrogen partial pressure on the
hydrogen side of the membrane (nitrogen has to be added to the hydrogen feed to a gas
turbine anyway). If pure hydrogen is required the membrane can be operated with a greater
absolute pressure difference.
Metallic hydrogen separation membranes normally operate at elevated temperatures, e.g.
around 280-440°C [NETL, 2011c]. Metallic membranes can be used in combination with
conventional cold solvent desulphurisation, such as Selexol or Rectisol, but the advantage of
membranes would be maximised if they were used in combination with warm gas
desulphurisation operating at similar temperatures to the membranes. This avoids the costs
and energy losses associated with cooling the gas from the gasifier down to a low
temperature and condensing the steam included within it. Avoiding condensation of the steam
provides addition gas for expansion through the gas turbine. NETL is funding a warm gas
desulphurisation plant to process a side-stream of about 20% of the fuel gas flow at Tampa
Electric’s 250MWe Polk IGCC plant in Florida. This plant based on RTI’s technology uses
recirculating zinc oxide solid sorbent to remove more than 99.9% of the sulphur contaminants
from gasifier fuel gas. The resulting zinc sulphide is converted back to zinc oxide and SO2 by
combustion with oxygen in a separate reactor [RTI, 2014. The plant started-up in April 2014.
A disadvantage of hydrogen separation membranes is that the CO2-rich gas contains
relatively high concentrations of impurities. Catalytic oxygen-blown combustors can be used
to react the CO and un-separated H2 to CO2 and steam. Non-condensable impurities such as
nitrogen could if required be removed using low temperature separation, as is used for
processing the CO2-rich gas from conventional oxy-combustion CCS but this would be an

80
additional cost and efficiency penalty. Gasifiers which do not use nitrogen for fuel
pressurisation and feeding would be advantageous for combination with hydrogen separation
membranes. Gasifiers which can operate at higher pressures such as slurry feed gasifiers,
would have the advantage that it may be possible to avoid the need to compress the
hydrogen-rich gas before or after the membrane.
Another disadvantage of palladium membranes is the effect of impurities. Pure Pd
membranes have no tolerance to sulphur and are destroyed by large lattice expansion when
Pd-S is produced. However a small degree of tolerance, e.g. up to 1-2 ppm, can be achieved
by use of Pd-alloys [Grazzani, 2014]. Pd is also susceptible to CO, NH3 and chlorine, all of
which exist in pre-combustion syngas streams [Scholes, 2010]. Pd membranes currently have
short lifetimes, and the cost of periodically replacing them in a commercial plant would be
high.
4.1.3. Porous inorganic hydrogen separation membranes
Porous inorganic membranes can also be used to separate hydrogen from syngas. Materials
that have been used include zeolites, silica, alumina, nitrides and oxides. The materials have
carefully controlled pore structures to enable hydrogen molecules to pass through while
larger molecules are retained. Alternatively larger pores can be used and separation is
achieved by Knudsen diffusion. Important criteria for porous inorganic membranes are
selectivity, diffusion rate and tolerance to impurities. Surface treatment to improve the
sorption of H2 to the pore walls can improve selectivity by increasing the rate of migration
along the pore walls, in a process called surface diffusion [Scholes, 2010].
4.1.4. Carbon hydrogen separation membranes
Carbon membranes act as molecular sieves as well as allowing surface diffusion. They are
typically prepared by high temperature pyrolysis of organic polymers. In common with silica
membranes their performance can suffer in the presence of high levels of water vapour.
Carbon nanotubes have also been suggested as membranes but high cost would currently be
an issue.
4.1.5. Dual stage hydrogen separation membrane schemes
A dual-stage membrane-reactor approach is being developed by MPT. Hydrogen-selective
carbon molecular sieve (CMS) membranes accomplish warm gas clean-up of coal derived
syngas, water gas shift reaction and bulk hydrogen separation in a single unit. Co-Mo
catalysts is used for the shift reaction. The CO2-rich gas is than passed through a cold gas
cleaning unit and the clean gas, containing around 82% CO2 and 11% H2, is compressed and
fed to Pd membranes which recover the hydrogen. Although the selectivity of the CMS
membrane is not as high as competing polymeric and metallic (Pd-based) membranes the
CMS membranes are inert and robust

81
Figure 32 Dual-stage membrane reactor
4.1.6. CO2 separation membranes
The development of membranes that will retain the small molecular size of H2 but permeate
the larger CO2 molecules is reported to be a significant challenge [Scholes, 2010]. It is
important that the solubility selectivity strongly favours CO2 and that the diffusivity
selectivity, which favours H2, is minimised. The favoured option is polymeric membranes
and a wide range of polymeric materials have been considered [Scholes, 2010]. The
selectivity of such membranes is limited and CO2 recoveries are typically 50-80% and the
CO2 purity is up to 95% [MTR, 2014].
4.1.7. Energy requirement / cost evaluation
NETL has undertaken a detailed assessment of the performance and costs of IGCCs with
warm gas cleaning and hydrogen separation membranes [NETL, 2010] and the results are
summarised in Table 9. The cost assessment is based on NETL’s 2015 target flux and
temperature for the membrane. The efficiencies and costs are shown relative to a baseline
which is includes an advanced “F” class gas turbine and a dry feed entrained flow gasifier. In
the baseline plant the fuel gas from the gasifier is fed to a sour shift reactor and then to a 2-
stage Selexol unit. In the warm gas cleaning cases the gas is fed to a warm gas
desulphurisation unit similar to that being employed at the Polk IGCC plant, followed by a
clean shift and then either a single stage Selexol unit or hydrogen membranes.
Table 9 Performance and costs of plants with warm gas cleaning and H2 membranes
Difference compared to conventional IGCC
Warm gas cleaning and
Selexol
Warm gas cleaning and
hydrogen membrane
Efficiency, % points (LHV) +0.8 +3.0
Efficiency, % (LHV) +2.5 +11.4
Capex per kWe, % -2 -17
Levelised cost of electricity, % -1.4 -13.2
The cost differences are dominated by the differences in thermal efficiency, and hence fuel
cost, and capex. The cost of chemicals is higher in the warm gas clean-up cases due to the

82
cost of zinc oxide sorbent make-up and there is an operating cost allowance for membrane
replacement, but these costs are of relatively small significance overall. The NETL
assessment is based on a gasifier operating at about 70MPa, which favours a membrane plant
because the hydrogen would be produced at a pressure suitable for feeding directly to a gas
turbine. If the gasifier operated at a lower pressure, typical for a dry feed gasifier, a hydrogen
compressor would be needed. The high operating temperatures of membranes would result in
a relatively high compression power consumption.
The thermal efficiency of an IGCC plant using the dual stage membrane reactor process
shown in Figure 32 is estimated to be 2 percentage points higher than that of a plant with CO2
capture using a conventional 2-stage Selexol process and the LCOE is predicted to be
$95/MWH compared to $106/MWh for the Selexol based plant and cost of CO2 avoided
relative to an IGCC without capture is $25/t CO2 compared to $42/t for a Selexol-based plant
with capture [Liu, 2013].
4.1.8. Current Status, technology readiness level and development requirements.
Tests of various types of membrane (polymeric, carbon-based and palladium hydrogen
separation membranes and a polymeric CO2 separation membrane) have been carried out
using a slip stream of gasifier fuel gas at the National Carbon Capture Centre (NCCC) at
Wilsonville, USA [Wu, 2013].
MTR’s polymeric CO2 separation membrane is being tested at a 225kg/h pilot plant at the
NCCC, using syngas from a transport gasifier. MPT’s membrane reactor system is being
tested at a 23kg/h scale pilot plant at the same site and MTR and WPI are testing hydrogen
membranes at a 5kg/h scale [Wu, 2013].
A 20 Nm3/h pilot plant to test membranes from various suppliers has been built by
Tecnimont-KT at Chieti Scalo, Italy [Hamilton, 2012].
The testing of membranes is proceeding at moderate scale. It still remains to be established
whether any of these membranes being tested will have the performance required for useful
commercial application. Their use also depends on successful development of warm gas
desulphurisation. The technology is thus assessed as being at TRL-5 presuming a favourable
outcome from the current testing. The development of warm gas desulphurisation in more
advanced and is assessed as being at TRL-8 presuming that the demonstration at Polk is
successful.
Hydrogen separation membranes have the potential for substantial increases in efficiency and
reductions in cost of power plants with pre-combustion capture and they have the potential
for high CO2 capture rates. Commercialisation of high temperature membranes must
surmount challenges of:
1. Manufacturing membranes with consistently high flux properties and long lifetimes in
the presence of impurities contained in coal derived fuel gas;
2. Fabrication of the membrane units themselves with gas inlet and outlet interconnects;
3. Scale-up to large unit sizes.
4.2. Sorbent –Enhanced Water Gas Shift (SEWGS)
A concept called Sorption Enhanced Reaction uses a packed bed containing a mixture of a
steam methane reforming or water gas shift conversion catalyst and a selective adsorbent

83
which removes CO2 from the high temperature reaction zone, thus driving the reaction to
completion [Hufton, 2005]. The adsorbent is periodically regenerated using PSA or TSA.
In the Sorption-Enhanced Water Gas Shift (SEWGS) process the water gas shift conversion
reaction:
CO + H2O → CO2 + H2
is executed with multiple vessels filled with catalytically active CO2 adsorbent, such as
promoted hydrotalcite. The removal of CO2 from the gas phase drives the equilibrium to the
right hand side, maximising the production of H2 and minimising the residual CO and the
steam requirement. The hot gas from the SEWGS reactors, at about 400°C, can be fed
directly to the gas turbine, thereby avoiding the energy losses associated with cooling the
hydrogen gas fuel gas. The sorbent is regenerated by steam. A commercial sized plant is
envisioned to consist of multiple fixed beds.
4.2.1. Performance and costs
The projected performance and costs of an IGCC SEWGS plant using the ALKASORB+
sorbent developed during the CAESAR project and comparable reference plants is given in
Table 10 [Jansen, 2013].
Table 10 Cost and performance of IGCC SEWGS and reference plants
IGCC IGCC
Selexol
IGCC
SEWGS
Advantage of
SEWGS vs
Selexol
Net electric efficiency, % LHV basis 47.1 36.0 39.7 +3.7
CO2 avoided, % - 86.5 93.7 +7.2
LCOE, €/MWh 66.3 89.5 82.3 -7.2 (-8%)
CO2 avoidance cost, €/t (IGCC base) - 36.7 23.4 -13.3 (-36%)
The main application of SEWGS is considered to be IGCC rather than production of
hydrogen for distributed use or industry, as IGCC can take full advantage of the high
temperature of the hydrogen and is not penalised by its medium purity (90-95 mol%).
SEWGS is expected to also enable significant improvements in efficiency and costs of CO2
capture in natural gas combined cycle plants [Manzolini, 2011].
Overall, SEWGS has the potential for substantial increases in efficiency and reductions in
cost for pre-combustion power plants. Development issues include the performance, capacity
and durability of sorbent using real power plant fuel gas and the reliability of valves.
The thermodynamic performance has been examined in some detail [Gazzini 2013] Specific
energy consumptions of between 2.0 and 2.5 kJ/tonne CO2 avoided were calculated. This
equates to 0.8 to 1.0 GJ/tonne electric when the power plant is 40% efficient. Good heat
integration is essential to obtain this performance and the better figure is for a sorbent with a
higher capacity. The process requires recovery of latent heat from steam used in the
regeneration cycle and involves expansion of CO2/steam to subatmospheric pressure,
condensation of the steam and recompression of the CO2.

84
4.2.2. Current Status, technology readiness level and development requirements
SEWGS has been developed at the laboratory pilot scale (70kg CO2/d) in the EU FP7 project
CAESAR. The next stage in the process development would be pilot testing (35t CO2/d) with
coal based syngas to prove long term stability of the sorbents and reliability of key equipment
[Jansen, 2013]. High temperature valves would be required for switching gas flows between
the beds but availability of suitable valves is reported to not be an issue.
The system requires far deeper integration in the pre-combustion process than for typical post
combustion capture technologies. Thus whilst validation of the subsystem can be done at
scale moving to demonstrate the full system integrated into the IGCC plant will be more
difficult. However the other equipment required for the deep integration is all based on
established designs although the various expanders required will need to be custom designed
for the service. The technology is assessed as TRL-5 and it should be possible to progress the
development into the large scale demonstration phase without necessarily applying the deep
integration needed to achieve the target high efficiency.
4.3. Low temperature separation
CO2 can be separated from syngas by reducing the temperature resulting in liquefaction of
CO2. This is normally referred to as ‘low temperature’ separation rather than ‘cryogenic
separation’ because the temperatures involved is typically around -60°C, whereas ‘cryogenic’
normally refers to temperatures below about -150°C. A disadvantage of low temperature
separation is that the percentage capture of CO2 is limited by phase equilibria. To achieve a
capture rate of 90%, which is normally expected for capture processes, high pressures in
excess of 10MPa are needed [Berstad, 2010]. An alternative would be to combine the phase
change separation with solvent separation. An advantage of low temperature separation is
that a liquid CO2 stream can be produced, which can be pumped to high pressures thereby
avoiding most of the energy consumption and cost of CO2 compression.
The cooling required for low temperature separation can be provided by expansion of the
process gas or by external refrigeration. A low temperature CO2 capture process with an
external refrigeration is shown in Figure 33.

85
Figure 33 Low temperature CO2 capture unit with external refrigeration [Berstad,
2012]
Autothermal phase change separation process configurations have proposed by MHI and BP
[Mori, 2013]), an example of which is shown in Figure 34. The feed gas is compressed and
the clean hydrogen-rich gas is expanded in a turbine (inlet pressure 6-18 MPa, outlet pressure
around 3MPa).
Figure 34 Autothermal CO2-H2S co-capture phase change separation AGR [Mori, 2013]
4.3.1. Energy requirement / cost evaluation
Performance and costs of autothermal acid gas removal are shown in Figure 35 [Mori, 2013].
The power consumption of the AT-AGR process is 44% less than that of Selexol and the
CAPEX is 23% less.

86
Figure 35 Economic evaluation of IGCC with autothermal AGR [Mori, 2013]
The EU DECARBit project carried out economic assessments of pre-combustion capture
using pressure swing adsorption (PSA), membrane gas desorption (MGD), low temperature
separation (LT) and high temperature ion transport membrane oxygen production (ITM). The
costs are shown in Figure 36, along with the European Benchmarking task force (EBT)’s
costs of plants with and without Selexol CO2 capture [DECARBit, 2012]. The costs per tonne
of CO2 avoided are broadly similar or higher for the new technologies, with the exception of
low temperature separation. However, the LT separation process they considered has a
relatively low capture rate of 76.5%.
Figure 36 The main techno-economic results obtained from DECARBit
[DECARBit, 2012]
In order to compare these processes in terms of energy efficiency the figures have been used
to calculate the amount of work which each process needs to perform the separation required
to abate 1 tonne of CO2. This measure is chosen as it is universally comparable to both the

87
theoretical work required for separation and to that of competing processes. Although thermal
energy is often used when comparing some technologies, especially those based on thermal
regeneration of solvent, this is not necessarily a good measure for wider comparisons.
The results in GJ/tonne avoided derived from the capture rate and efficiency reduction figures
are:
Baseline 1.17GJ/tonne
LT 0.94GJ/tonne
MGD 0.95GJ/tonne
PSA 1.27GJ/tonne
4.3.2. Current Status, technology readiness level and development requirements.
Low temperature separation in general is a well-established technology, using mostly
conventional equipment. Key elements have been demonstrated at laboratory and semi-
industrial scale [Bouwers, 2010]. A multi-stage radial turbine-expander for low molecular
weight service in the autothermal phase change process has been designed and tested [Mori,
2013].
To date the processes for low temperature separation are all at the stage of proposals for
process line ups using mainly conventional refrigeration and heat exchange equipment. The
arrangements for the application have thus been formulated but actual testing and
demonstration has not been attempted. The technology readiness level is assessed as TRL-2
with the rider that rapid development should be possible since the processes use conventional
equipment.
4.4. Low temperature separation with CO2 recirculation – The Timmins process
An interesting variant of pure low temperature separation has been proposed by Timmins. In
this process a recycle loop of the syngas is created and CO2 levels are allowed to build up so
that CO2 can be removed as a liquid by light refrigeration. This has the advantage of greatly
reducing the energy required to compress the CO2 to export conditions. The process makes
use of the capacity of the raw syngas to strip CO2 from CO2 loaded Selexol and thus avoids
the need to supply heat for regeneration. The general arrangement is shown in Figure 37.
Figure 37 Overall flow scheme - Timmins low temperature CO2 removal process
The invention – IGCC scheme overview –crude (sour) shift case
GASIF
+QUENCH
CO
SOUR
SHIFT
COOL PPU
POWER
ISLAND
(CCGT)
CO2
REGEN
CRYO
COND’
CO2
ABS’
CRYO
H/E VHP CO2
TO PIPE
CO2
RECYCLE
H2S
Rem’
INVENTION
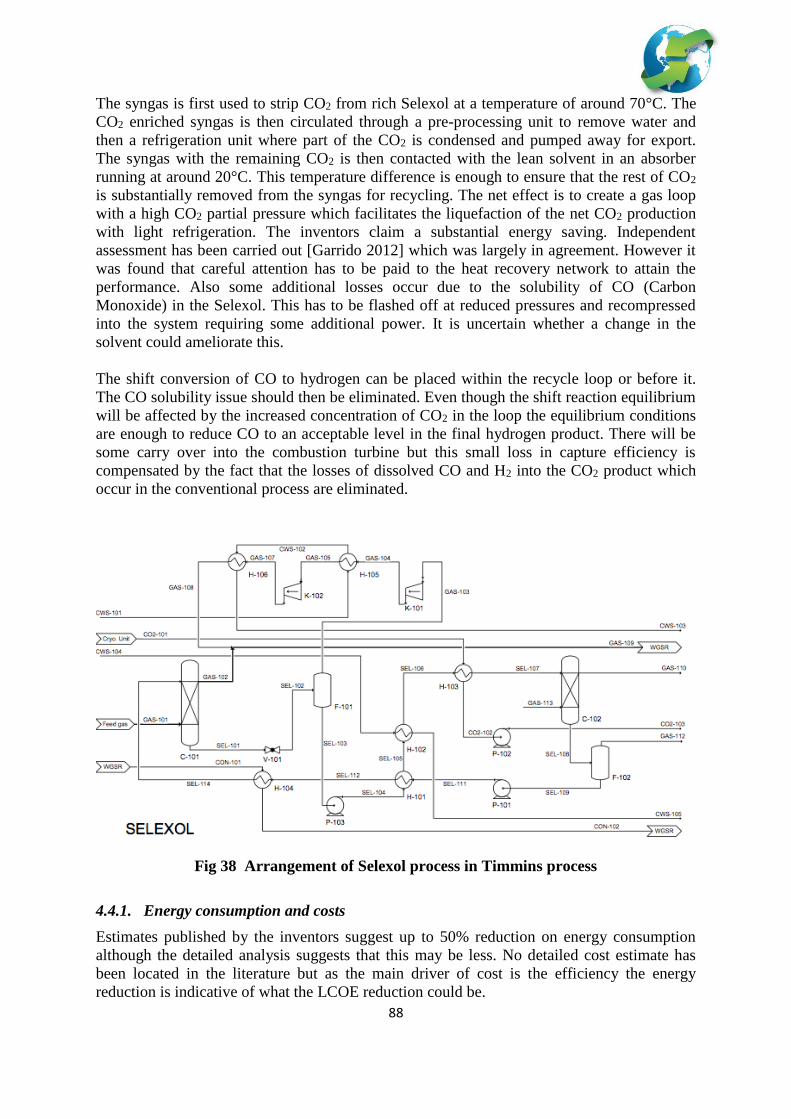
88
The syngas is first used to strip CO2 from rich Selexol at a temperature of around 70°C. The
CO2 enriched syngas is then circulated through a pre-processing unit to remove water and
then a refrigeration unit where part of the CO2 is condensed and pumped away for export.
The syngas with the remaining CO2 is then contacted with the lean solvent in an absorber
running at around 20°C. This temperature difference is enough to ensure that the rest of CO2
is substantially removed from the syngas for recycling. The net effect is to create a gas loop
with a high CO2 partial pressure which facilitates the liquefaction of the net CO2 production
with light refrigeration. The inventors claim a substantial energy saving. Independent
assessment has been carried out [Garrido 2012] which was largely in agreement. However it
was found that careful attention has to be paid to the heat recovery network to attain the
performance. Also some additional losses occur due to the solubility of CO (Carbon
Monoxide) in the Selexol. This has to be flashed off at reduced pressures and recompressed
into the system requiring some additional power. It is uncertain whether a change in the
solvent could ameliorate this.
The shift conversion of CO to hydrogen can be placed within the recycle loop or before it.
The CO solubility issue should then be eliminated. Even though the shift reaction equilibrium
will be affected by the increased concentration of CO2 in the loop the equilibrium conditions
are enough to reduce CO to an acceptable level in the final hydrogen product. There will be
some carry over into the combustion turbine but this small loss in capture efficiency is
compensated by the fact that the losses of dissolved CO and H2 into the CO2 product which
occur in the conventional process are eliminated.
Fig 38 Arrangement of Selexol process in Timmins process
4.4.1. Energy consumption and costs
Estimates published by the inventors suggest up to 50% reduction on energy consumption
although the detailed analysis suggests that this may be less. No detailed cost estimate has
been located in the literature but as the main driver of cost is the efficiency the energy
reduction is indicative of what the LCOE reduction could be.

89
4.4.2. Technology readiness level
The process makes use of existing technologies but to date has only been proposed as an
application and no pilot or demonstration testing has been done. Thus the technology
readiness level is assessed as TRL-2. However rapid development should be possible.
4.5. Fuel cells
The potential for higher efficiency power generation using fuel cells has been recognised for
a long time. There is active development work on various fuel cell technologies in many
companies and countries but units for large scale power generation are not yet available.
Certain types of fuel cells have high energy efficiencies and they are also able to inherently
capture CO2, which means that the incremental cost of including CCS could be low. This
section of the report focuses on such fuel cells.
Some other fuel cells are designed to use hydrogen, which could be produced in plants with
pre-combustion capture. Hydrogen fuel cells could be attractive particularly for distributed
combined heat and power production, which would make hydrogen production with pre-
combustion CCS a more favoured technology if their cost and efficiency were better than
those of combined cycle plants.
NETL has undertaken detailed technical and economic assessments of Integrated Coal
Gasification Fuel Cell (IGFC) plants [NETL 2011a] and natural gas fuel cell plants with
integrated CO2 capture [NETL 2011b], both based on solid oxide fuel cells. These types of
fuel cells are currently developed at a 60kWe scale, making them around TRL-6. A block
diagram of the IGFC plants is shown in Figure 39. Desulphurised fuel gas from coal
gasification is fed to the anode of the fuel cell and the anode off-gas, consisting mainly of
CO2 and H2O, along with small amounts of CO, H2 and inerts is fed to an oxy-fuel
combustor, and the resulting CO2 is compressed for storage. Pre-heated air is fed to the fuel
cell cathode and air with a reduced oxygen content from the cathode is cooled in the pre-
heater heat exchanger. The fuel cell operates at a temperature of 650-750°C and a pressure
either close to atmospheric or at 2MPa.
Figure 39 Integrated Gasification Fuel Cell (IGFC) plant [NETL 2011a]

90
The study assesses plants based on two types of coal gasifier; a conventional Conoco Phillips
E-Gas gasifier and a catalytic fluid bed gasifier, which is at an early stage of development.
The E-Gas gasifier produces a gas with a relatively low methane concentration and the
catalytic gasifier produces a gas with a much higher methane concentration (around 30%),
which is an advantage for an IGFC plant. Conventional gas cleaning technologies, including
Selexol desulphurisation, are assumed to be used up-stream of the fuel cells. Warm gas
cleaning technologies may result in further efficiency and cost improvements. The plants
have CO2 capture rates >98%.
NETL has also published a techno-economic assessment of natural gas fuel cell power plants
with CO2 capture. These plants are similar to the IGFC plants except that natural gas
autothermal reforming replaces coal gasification and gas cleaning.
4.5.1. Performance and costs
The power generation efficiencies and Levelised Costs of Electricity of fuel cell plants and
the improvements compared to reference IGCC and natural gas combined cycle plant with
post combustion capture reported in NETL’s reports are shown in Table 11. The data are
given for reference plants based on conventional solvent scrubbing and gas turbine combined
cycles, baseline fuel cell plants and plants with various improvements leading to the best
efficiencies and costs. Details of these improvements and their individual contributions to the
cost reductions are given in the references. Note the efficiencies are on an HHV basis, unlike
most NGCC efficiencies which are on an LHV basis. LHV efficiencies are around 10% (not
percentage points) higher for natural gas power plants.
Table 11 Efficiencies and costs of fuel cell power plants with CO2 capture.
Efficiency LCOE
%, HHV Difference
% point
$/MWh Difference
%
E-Gas gasifier Reference IGCC 31.0 - 110.4 -
Baseline fuel cell 40.0 +9.0 96.3 -12.8
Improved fuel cell 46.5 +15.5 72.5 -34.3
Catalytic gasifier Baseline fuel cell 50.5 +19.5 79.8 -27.7
Improved fuel cell 60.0 +29.0 61.2 -44.6
Natural gas Reference NGCC 42.8 - 85.9 -
Baseline fuel cell 53.3 +10.5 85.0 -1.0
Improved fuel cell 65.9 +23.1 63.1 -26.5
The assessment of IGFC plants was undertaken on a consistent basis to NETL’s 2007
baseline plants study, in which an IGCC plant with CCS based on the E-Gas gasifier had an
HHV efficiency of 40% and a LCOE of $105.7/MWh and a supercritical pulverised coal
plant with post combustion capture had an efficiency of 27.2% and an LCOE of
$114.8/MWh. The baseline IGFC plant based on E-Gas gasification has an efficiency of 40%,
i.e. 8.3 percentage points higher than an IGCC plant and 12.8% points higher than the plant
with post combustion capture. The efficiency of the plant based on catalytic gasification,
pressurised fuel cells and the most favourable sensitivity assumptions is 60%. The LCOE of
the baseline IGFC plant is $96.3/MWh, i.e. a 9% reduction compared to the IGCC plant and
the most favourable IGFC plant has a LCOE of $61.2/MWh, i.e. a 42% reduction. This

91
analysis indicated that IGFC has the potential for large improvements in efficiency and
LCOE.
The additional costs are dominated by the SOFC power island and also the small ASU.
Because the SOFC power island replaces the conventional gas turbine in an IGCC plant it is
questionable as to what portion of its costs should be attributed to CO2 Capture. One
approach could be to compare with the costs of the conventional power island but as many
other aspects of the plant also change this would only give a rough indication. The full costs
of the ASU are however attributed to the capture process. The NETL study was a pathway
study for development of a SOFC based capture system and did not include a baseline IGFC
plant without capture. Much of the development of IGFC should be considered as being in
the domain of mainstream power generation technology.
4.5.2. Thermodynamic considerations
A key element of the efficiency improvements is the superior electrical conversion
performance of the solid oxide fuel cell. In order to capture CO2 a version of the SOFC in
which the anode and cathode gases are kept separate is required. The SOFC electrolyte
membrane is an oxygen conductor and it is this property which is the essence of its ability to
capture CO2 since it performs the processes of combustion and oxygen separation in a single
device. The pathway study by NETL considers improvements to the current performance of
SOFC’s which enhance its conversion efficiency. The main one is to reduce the cell
overpotential from 140mv to 70mv. As the cell potential is only around 1000mv this
projected 70mv reduction represents a significant efficiency gain. The second is to pressurise
the cells which raises the Nernst potential. However their studies indicated that it is so costly
to build the necessary pressure containments that there is no economic advantage.
The methane content of the fuel to the SOFC affects the overall efficiency. This is because
methane reforming in the cell assists with the cooling which otherwise has to be provided by
increased cathode air flow. The internal transfer of heat from the reforming reaction is
thermodynamically more efficient than providing external cooling. Hence the development of
a catalytic gasifier which produces higher methane content syngas is an important
development. Blending natural gas into the syngas has a similar effect and could be
considered if gas prices are favourable.
The only change to fuel cell design required to allow CO2 capture is that the anode and
cathode gases have to be kept separate. The first designs of cell allow the cathode and anode
gases to combine which is far simpler to manifold and results in complete combustion of the
fuel. In the capture design the final combustion is accomplished by mixing with pure oxygen
so a small ASU is required.
4.5.3. Technology readiness level
Although SOFC stacks have been developed to substantial size the full integration of these
into an IGCC with the capture feature has not yet been tested. Thus only some of the
subsystems could be claimed as fully validated. Furthermore the degradation of the SOFC
stacks which slowly reduces the voltage and hence efficiency over several thousand hours has
to be improved. In addition the better performance offered by catalysed gasification requires
further development of this technology. The technology readiness level is thus assessed at

92
between TRL-4 and TRL-6, the lower level because there has yet to be validation of low
enough SOFC stack degradation to take the concept to commercialisation.
5. Oxy-Combustion
5.1. Oxy-combustion for solid fuel fired boilers
Oxyfuel combustion for power generation with CO2 capture is the use of oxygen and
recycling part of the flue gas instead of air as oxidant to the fuel. This results in a flue gas
with a high concentration of CO2 and H2O which would require physical separation to deliver
the specified purity of CO2 for transport and storage.
Generally, technology development involves the following areas:
Fuel preparation (particularly important to brown coal application)
Boiler design and operation
Oxygen production
Flue gas processing
CO2 processing unit (CO2 Purification Unit/Gas Processing Unit)
Currently, technologies for oxyfuel combustion for PF or CFB coal fired power plants have
reached the necessary maturity ready for large scale demonstration (i.e. 100 – 400 MWe).
This is a crucial step to bring this technology forward and achieve the goal of
commercialisation by a 2020-2030 horizon. The large scale demonstration is an important
step to sustain the current R&D investment and activities necessary to develop technologies
and key components that would lead to cost reduction and improve efficiencies.
Boiler Design and Operation
Technology development for oxyfuel combustion boilers will broadly follow the
development of conventional air fired boilers as shown in Figure 40.
The following key areas could be the main focus of future development for oxyfuel
combustion PC and CFB boilers:
Co-firing of biomass or other alternative fuels (petcoke, etc.).
Development of CFD modelling tools for heat transfer, combustion characterisation,
emissions, etc.
Materials development contributing to the understanding of the impact on the boiler
materials, welding, etc. when operating under oxyfuel combustion condition.
Enabling the use of warm recycled flue gas to increase efficiency (i.e. materials
development along the flue gas recycle path).
Development of low flue gas recycle rate and high oxygen content in the furnace – for
CFB only.
Power plant flexibility.

93
Figure 40 – Development pathway of PF coal fired boiler – also depicting the current
status of oxyfuel combustion boiler development
Figure adapted from [Marion et al (2009]
It has been established that the basic principles used in designing conventional coal fired
boilers and burners are also applicable to design of oxy-fuel combustion boilers.
Development of oxyfuel combustion boilers will be evolutionary in nature rather than
through emergence of new breakthrough technologies.
For the demonstration and first generation Oxyfuel Combustion Power Plant (PC or CFB)
applied to coal or other solid fuels, the main consideration is the combustion characteristics
of the fuel and the optimization of design and operation associated with that fuel. In the early
deployment of this technology, it is expected that conservative designs based on known boiler
tube materials currently used by their air fired counterpart will be used. Operation of the
boiler (i.e. heat extraction rate) will be adjusted according to the dew point temperature of the
resulting flue gas. Current development will focus on flue gas processing (of the recycled flue
gas) to remove SOx, NOx, halogenated compounds, and water to reduce the risk of material
failures due to corrosion. These are vendors’ specific technology development. It is expected
that future generation oxyfuel boilers will follow the development of advanced ultra-
supercritical PC fired boilers to higher temperatures and pressure (i.e. 300 bar / 700°C).
5.2. Pressurized Oxy-combustion
Operating the combustion boiler under pressure is claimed to offer some advantages over
atmospheric operation. EPRI and US DOE are supporting developments of this technology.
Also ITEA, Italy, have described a flameless pressurized oxycombustion variant. A further
variant is a staged pressurized oxycombustion (SPOC).

94
5.2.1. Staged Pressurized Oxycombustion (SPOC)
This technology applies two refinements to the atmospheric oxycombustion process. The first
is to operate the combustion boiler under pressure. The reasons for this are to avoid the need
for compression of the CO2 rich flue gas, reduce the energy used for CO2 recycle and to
enable recovery of some the latent heat in the steam component of the flue gas. The second
refinement is to apply staged combustion which eliminates the need for recycle CO2 to
moderate the temperatures in the combustion chamber. This is done by staging the addition of
fuel so that in the first combustion chamber/boiler there is a sufficient excess of oxygen to
limit flame temperature. Typically 4 combustor/boilers would be used in series operating
under pressure. These technologies are supported by the US DOE and EPRI. Washington
University in St. Louis (WUSTL) is working on the evaluation of the technology. The SPOC
process is described in Gopan 2014. The arrangement is shown in figure 41.
Figure 41 Staged pressurized oxycombustion flow scheme
5.2.2. Conventional and Flameless Pressurized Oxy-combustion (FPOC)
Pressurized oxycombustion trades extra power required to compress oxygen into the
combustion chamber against reductions in CO2 compression power, power for recirculating
flue gas and recovery of latent heat from condensation of steam in the raw flue gases which
occurs at a useful temperature for power recovery because of the higher condensation
temperatures. It is claimed that overall efficiency is thus improved. The figure from a recent
presentation by EPRI on novel CCS cycles illustrates the basic process and proposes that
combustion takes place in a bubbling bed. Aerojet Rocketdyne is involved with the
development and Figure 42 illustrates this conventional pressurized concept.
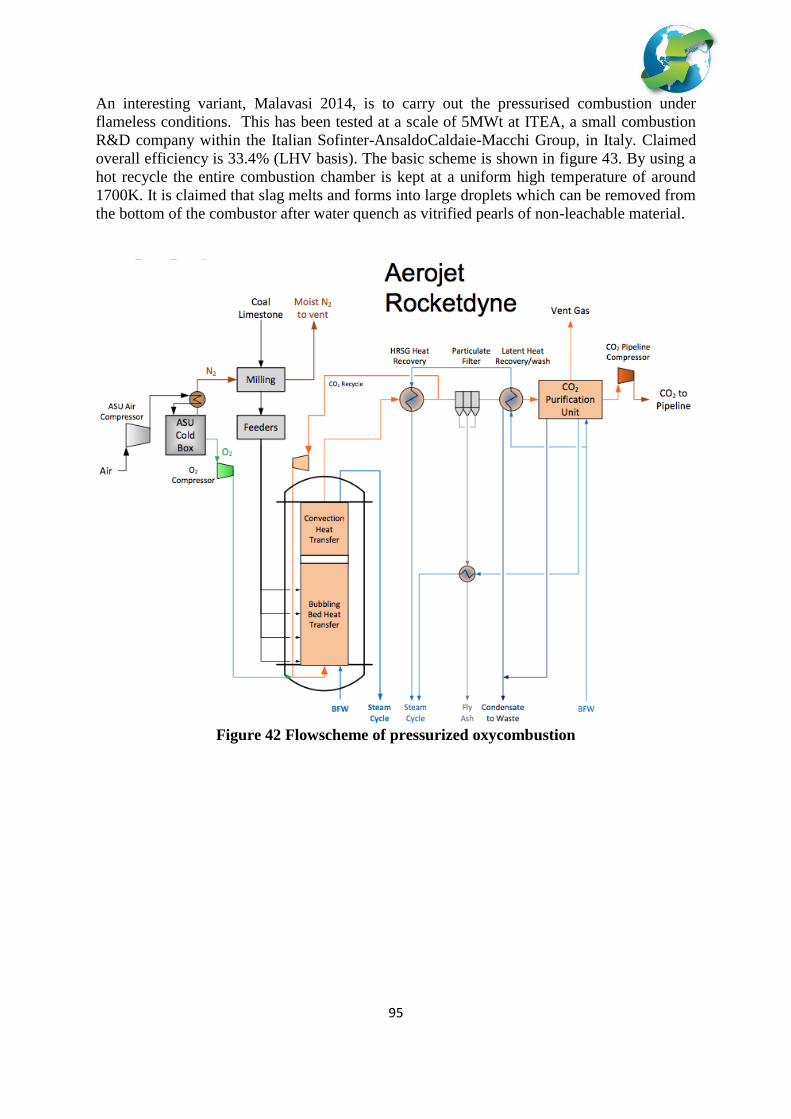
95
An interesting variant, Malavasi 2014, is to carry out the pressurised combustion under
flameless conditions. This has been tested at a scale of 5MWt at ITEA, a small combustion
R&D company within the Italian Sofinter-AnsaldoCaldaie-Macchi Group, in Italy. Claimed
overall efficiency is 33.4% (LHV basis). The basic scheme is shown in figure 43. By using a
hot recycle the entire combustion chamber is kept at a uniform high temperature of around
1700K. It is claimed that slag melts and forms into large droplets which can be removed from
the bottom of the combustor after water quench as vitrified pearls of non-leachable material.
Figure 42 Flowscheme of pressurized oxycombustion

96
Figure 43 Flow scheme of flameless oxycombustion
5.3. Oxygen Production
5.3.1. Cryogenic Air Separation
The major cost of CO2 capture by oxy-combustion is due to the energy consumption and
capital cost of the air separation unit (ASU). Cryogenic air separation is considered one of the
mature technologies within the CO2 capture chain. It would be difficult to achieve any major
improvement to the efficiency of conventional ASUs. However, ASUs for oxyfuel
combustion applications that deliver oxygen with low purity (i.e. 95 – 97% O2) and low
pressure (i.e. 1.2 to 1.8 Bara) have opened up opportunities for step change improvement in
energy efficiency [Beysel, 2009; Higginbotham, 2011; Shah, 2011(a); Higginbotham et al,
2011; Goloubev, 2012]. It is expected that advanced ASU cycles using three columns or dual
reboilers will be central to the ASU development pathway for oxyfuel combustion
applications. Based on these cycles, it is claimed that about 5 – 35% efficiency improvement
could be achieved as compared to the conventional two column ASU cycle.
Key to the development of the air separation unit is the demonstration of a large scale single
train ASU (i.e. in the range of 5,000 to 10,000 t/d O2). Today, the largest operating ASU is
3,900 t/d O2. A contract has recently been awarded to build the largest single train ASU at
5,250 t/d O2 in India for gasification application. This is expected to be operational by 2015.
This kind of commercial deployment will naturally feed into the development of large scale
single train ASUs for oxyfuel combustion application which should help reduce capital and
operating costs.
The following key areas could be the main focus of future development of cryogenic ASU for
oxyfuel combustion application [Golubev, 2012]:
Development of advanced ASU cycles for oxyfuel combustion applications and
meeting the flexible operation requirements of the power plant.

97
Development of the main air compressor to provide wider range of turn down.
Development of process control systems to allow smooth operation of the ASU
meeting the variable O2 demand of the power plant.
Development of process integration options of the ASU with the power plant and the
CPU.
Enabling the cryogenic ASU as energy storage platform. This development will be
driven by the peak electricity price and requirements for power plant flexibility.
Utilisation of waste N2 from the ASU (i.e. use of additional Brayton Cycle using N2
as working fluid).
Additionally, it expected that the cryogenic ASU will gain several incremental improvements
in the future once the large scale demonstration plants are initiated. It should be noted that
the selection of an appropriate ASU cycle to meet the requirements of the power plant is an
important aspect to the delivery of an optimized CAPEX and OPEX air separation unit for
oxyfuel combustion application.
Some of the key areas of development where improvements to the ASU could be gained and
capital cost could be reduced include the following:
• Improvement to the Front End Purification Processes (i.e. packing selection for Direct
Contact After Cooler, that could reduce pressure drop and minimize vessel diameter).
• Improvement to the main heat exchanger (i.e. use of brazed aluminium heat
exchanger with larger core sizes and lower pressure drop).
• Improvement of the distillation column (i.e. use of high capacity structured packing
that will lead to low pressure drop and smaller diameter).
• Improvement to the reboiler design (i.e. use of improved Thermosyphon reboiler
design).
5.3.2. Other Novel Oxygen Production Technologies
Inexpensive, large scale oxygen production is crucial to the development of the next
generation of integrated power plants with CCS based on oxyfuel coal combustion or IGCC
technologies. Currently, there are other oxygen production processes being developed that
could have the potential to deliver improvements. Some of the leading technologies include:
• Ion transport membrane (ITM)
• Oxygen transport membrane (OTM)
• Ceramic Auto-thermal Recovery System (CARS)
Figure 44 present the status of development and the maturity levels of the different oxygen
production processes.

98
Figure 44 – Maturity and total R&D investment of different oxygen production
processes [De Costa et al, 2013]
In general, the challenges to these novel oxygen production processes are to be able to scale
up to the same production capacity per train and achieve the same level of reliability as
compared to the current fleet of cryogenic ASUs. Basically, these technologies are also
applicable to future IGCC development (i.e. not limited to oxyfuel combustion). In fact, the
current trend of development indicated that early deployment will be toward IGCC rather
than oxyfuel combustion applications.
The most prominent among these technologies is the development of the Ion Transport
Membrane (ITM) developed by Air Products as this has already achieved small scale pilot
plant operation producing ~150 t/d O2. The basic principle of ITM is based on separation of
oxygen from ionized gas using a mixed conducting dense ceramic/polymeric membrane in
wafers configuration. The membranes are assembled in stacks of wafers with a central
oxygen collector tube which conducts the permeate stream. This design reduces the sealing
area per membrane area, whilst also providing a large membrane packing density, which
translates to high oxygen fluxes per unit volume.
The ITM system is not a direct replacement for the cryogenic oxygen plant as it requires a
feed of hot oxygen containing gas (i.e. air). Hence the ITM is integrated with a gas turbine so
that part of the power from an ITM based oxycombustion power plant would come from this
turbine. The arrangement is shown in Figure 45 [Qintrell, 2012].

99
Figure 45 Arrangement of ITM oxygen process (after Quintell)
Examples of this balance between the ITM unit and the main PC power plant show that just
over 30% of the gross power comes from the ITM power unit. A reduction in LCOE of 24%
is claimed on the basis of process studies.
Because of the need to integrate with a gas turbine the ITM may be a better fit with pre-
combustion technology where it could supply the oxygen requirements for the IGCC. The hot
air supply would be derived from the main gas turbine of the IGCC. An example of this
arrangement is shown in Figure 46

100
Figure 46 IGCC process with carbon capture using ITM
The Oxygen Transport Membrane (OTM) is being developed by Praxair. Primarily, the
development is more focused on a system where natural gas is used as fuel or coal is gasified
and the syngas is used as fuel. This involves the combination of POX and an oxy-gas boiler.
The OTM is based on ceramic tubes (primarily using Peroskovites) to separate the oxygen
from air. The oxygen is then delivered to the process fluid.
The Ceramic Auto-thermal Recovery System (CARS) is developed by BOC/Linde. The
oxygen is separated from an air stream using a perovskite ceramic oxide adsorbent
(composed of lanthanum, strontium, cobalt, and iron) at high temperature (800-900°C) in
cyclical operation consisting of a two bed configuration (i.e. one bed adsorbing the oxygen
and the other bed desorbing). The perovskite sorbent is alternately exposed to feed air and
regeneration gas flows. Partial pressure swing (using a sweep gas) enables production of an
O2-enriched stream. Internal regenerative heat transfer is used to maintain temperature (the
perovskite zone in each bed is sandwiched between two zones of heat transfer material).
5.3.3. Thermodynamic considerations
The work of separating oxygen from air is the main source of loss in oxycombustion
processes as compared to that for separation of CO2 from flue-gas in post combustion. The
theoretical energy of separation for post combustion is about 0.15GJ/tonne. To separate
oxygen from air to 95% purity requires about 0.175GJ/tonne oxygen. If burning coal with a
C:H mass ratio of say 16 and excess air of say 20% the equivalent separation energy is about
0.16GJ per tonne CO2, thus essentially the same. Note however that if natural gas is being
burned (with excess air of say 5%) then oxygen has to be provided for all of the hydrogen and
the theoretical energy rises to about 0.27GJ/tonne CO2 putting oxycombustion at some
considerable disadvantage for natural gas applications.

101
In practice efficiencies of separation are far lower than the theoretical. Typical energy
consumption quoted by one leading supplier of ASU’s is about 0.88GJ/tonne with the
promise of reductions to as low as 0.63 GJ/tonne. Further improvements to a target of around
0.5GJ/tonne are to be expected. The figure used in NETL 2008 cost estimates was
0.84GJ/tonne (235kWh/tonne). This study used ISO conditions and it should be noted that
ASU energy consumption will be affected by the actual ambient air conditions at site as these
affect the power required by the main air compressor which accounts for most of the
electrical load.
The conventional ASU process produces relatively pure nitrogen as a by-product although
theoretically this is not needed for the oxy-combustion process. The energy for extraction of
oxygen from air is about 25% lower. A membrane process with the retentate side openly
exposed to air could conceivably produce only purified oxygen but no nitrogen but would be
difficult to engineer. To date no process additions for oxycombustion to exploit the work put
into purifying the nitrogen appear to have been identified.
Finally there are minor separation efficiency trade-offs related to the purity of oxygen which
is produced. Producing a lower purity oxygen will reduce energy requirements in the ASU
but savings there have to be counterbalanced by the increased energy then required for final
purification of the CO2. The purity commonly used in designs is about 95% Oxygen.
5.3.4. Costs and energy consumption
The ASU contributes to a substantial part of the cost of the capture using oxycombustion. As
mentioned earlier both the capital cost and the additional energy consumption are significant.
The energy consumption incurs not only fuel costs but also the capital cost of providing
additional power generation. NETL produced detailed cost estimates for oxycombustion
[NETL 2008]. The specific energy consumption per tonne captured calculated from their
figures, both typical and advanced steam conditions, suggest a specific energy consumption
of about 1.23GJ/tonne.
Examination of these estimates for oxy-combustion processes shows that the capital for a
plant of equal net output increases by almost 70%. Of this increase just over 40% is for the
ASU about 20% for the CO2 clean up and compression and just under 40% for capacity
increases in the main plant associated with the extra electrical load. Examination of the load
increases reveals that that 65% is attributable to the ASU and 35% to the CO2 processing
unit. The capacity increases for the parasitic load are all attributable to these two elements
and this approximate 1/3:2/3 ratio defines the relative importance of these two elements in
driving the LCOE increase.
About 75% of the LCOE increase is due to increased capital charge and as increased capital
is a large driver of the fixed and variable costs as well this probably approaches 80%. The
rest of the increase is driven by the increased auxiliary power and its effect on fuel and
consumables costs. Reductions in power consumption of the ASU have some knock on effect
on the size of the rest of the equipment which would reduce their costs, however because of
the relatively high capital element ASU energy efficiency gains would need to be carefully
counterbalanced against any ASU capital cost increases.
An example has been calculated by prorating costs for improving the ASU specific power
from the 0.84 GJ/tonne of the estimate to the target of 0.5 GJ/tonne a 40% reduction. Keeping
ASU capital cost per tonne O2 the same reduces the LCOE increase by 22%.

102
5.3.5. Technology readiness level
Oxycombustion has been successfully demonstrated at significant scale of 90MWt and the
overall process can thus be assessed as being at TRL-7. Cryogenic ASU’s are in general
commercial service and are thus at TRL-9. However, the required capacities for a single train
ASU needed to meet the oxygen demand for full scale coal fired power plant is about 5000 –
10000 tonne/day O2 per train in order to reduce cost by achieving the economy of scale.
Currently, the maximum size of plants is being increased steadily in response to demands
primarily in the other industries (i.e. IGCC, coal gasification, gas to liquid, coal to liquid,
steel, etc…). Five trains of 5250 t/day O2 is currently under construction supplied by Linde
for Reliance Industry. Furthermore, single train ASUs with capacity of 7000-8000 t/day O2
per train are now being quoted by OEMs.
Of the new oxygen production processes the ITM is the most advanced as this has been tested
at a scale of 150t/day. Plans are in place to develop a 2000t/day unit which is of sufficient
size to be regarded as commercial scale demonstration. This element is thus assessed as at
TRL-7
The development of OTM is less advanced and appear to be focussed still on development of
the membrane materials and stacks. The CARS system is at a similar stage of development
using a small 0.7t/day pilot to test and validate the process. Both are thus assessed as being at
TRL-4
5.4. CO2 Processing Unit
The CO2 Processing Unit (CPU) is the purification step of the CO2 rich flue gas before its
delivery to the storage site.
The CPU and its development could be sub-divided into the three key areas namely:
• Pre-treatment of the CO2 rich flue gas from the oxyfuel boiler (i.e. removal of SOx,
NOx, particulates, Hg and water)
• Inert removal via a cryogenic process and the use of an auto-refrigeration cycle using
impure CO2 as refrigerant
• Development of the process for additional recovery of CO2 from the CPU vent.
5.4.1. Pre-treatment of the CO2 Rich Flue Gas
The pre-treatment of the CO2 rich flue gas is also called the “Warm Part” of the CPU. This
generally involves the following processes:
• Removal of water
• Removal of SOx and NOx
• Removal of dust particulates and
• Removal of trace elements (i.e. Hg)
There are several technology vendors providing different solutions in the pre-treatment of the
CO2 rich flue gas from the boiler. It is expected that water will be removed down to <10ppm
level due to the requirements of the cryogenic process downstream. The remaining NOx and
SOx in the flue gas will mostly be removed prior to its entry into the “Cold Part” of the CPU.
Particulates will be removed to less than 10 µg/Nm3 level to reduce the impact to the
downstream processes (i.e. erosion of heat exchangers, etc.). Mercury is considered an
operational issue due to the corrosive effect to any aluminium equipment downstream. This

103
will be removed to undetectable level similar to the standards used by the natural gas
processing industry.
Within the “Warm Part” of the CPU, the technology development involving the removal of
the NOx and SOx is considered an emerging technology where several vendors have
presented different options.
The paper published by Air Products [White, 2008; 2011] recognising the reaction of NOx
and SOx in the presence of oxygen and water producing sulphuric acids and nitric acids
during compression (i.e. classic lead chamber reaction) is an important development of the
previous decade that led to the development of a wide variety of processes to remove these
acidic components.
Depending on the technology vendors, the design of the NOx and SOx removal unit is also
dependent on the design of the Flue Gas Processing Unit (i.e. Flue Gas Desulphurisation and
Flue Gas Condenser) of the Oxyfuel Combustion Technology.
Some of these options are summarised below:
• Air Products [White, 2008, 2011; White et al, 2013] proposes the use of the Sour
Compression Process (based on lead chamber reaction) to knock out 99% of the SOx
as H2SO4 and remove at least 95% of NOx as HNO3 and HNO2 during the
compression of the CO2 rich flue gas.
Figure 47 Air products sour gas compression technology
• Linde [Ritter, 2009, 2011(a), 2011(b)] proposes the use of the LICONOX process
whereby 99% of the SOx is initially removed at the FGD and/or FGC. The cleaned
gas is compressed to 15 Bara to convert NO to NO2; and then NO2 is removed using
alkali wash (based on NH3 water or NaOH). This would result in a removal of at least
95% of NOx as spent salt of nitrite and nitrate. An option to reduce the salt loading is
possible by preheating the salt solution to 60oC therefore reducing the spent salt of
nitrite to N2 and H2O.
• Praxair [Shah, 2011(b)] presented two possible options for pre-treatment of the flue
gas. The first option uses sulphuric acid wash to recover nitric acid. This would result
in a clean gas containing 50-100 ppm SOx and less than 50 ppm NOx. The second
option uses activated carbon to adsorb any SOx and NOx resulting in dilute acid
during regeneration.

104
• Air Liquide [Lockwood et. al., 2013; Lelerc et al, 2013] proposes the use of NaCO3 to
quench and scrub the flue gas to reduce the SOx down to less than 10 ppm, and the
removal of the NOx at the knockout drum of the compressor and final removal at a
separate distillation column of the cold box. Co-capture of the remaining NO2 is also
a possibility.
Among the four options presented above, only the process of Air Liquide has been tested in a
large scale pilot plant (i.e. ~10 – 165 t/d CO2 at CIUDEN’s facility). Others have been
tested only at smaller scale pilot facilities (i.e. < 10 t/d CO2).
Future work in this area will primarily focus on the area of scaling up, process intensification
and process integration.
5.4.1.1. Technology Readiness level
The warm gas clean up processes have only been tested at small scale. They are however
based on well established technologies. Linde and Air Liquide use conservative approaches
and are assessed at technology readiness level TRL-7. The Air Products and Praxair
processes need validation of the flue gas compression with high SOx and NOx loading and
are assessed as being at technology readiness level TRL-6.
5.4.2. Inert Removal Process
The cold part of the CPU primarily functions as the separation of the other non-condensable
CO2 components mainly consisting of O2, N2 and Ar. This part of the CPU technology is an
evolutionary development of the liquefaction plant used in the current fleet of industrial and
food grade CO2 production. The newer innovation of this technology is the use of the auto-
refrigeration cycle using impure CO2 as refrigerant.
The CPU could consist of a cycle having a partial condensation and/or with a distillation
column. The primary driver in the design of the cycle is dependent on the limits on the
oxygen content of the CO2.
Future development in this area would only require engineering data of impure CO2 to
validate refrigeration performance of the current cycle presented by various OEMs for the
oxyfuel combustion applications. Development in process control systems will also get the
larger R&D investment share in the future to address the power plant flexibility requirements.
Newer technologies would focus on improving the refrigeration cycle and could also include
other possible refrigerants other than the impure CO2. It should be noted that best practices
developed in technologies used by the LNG industry could also be adapted to this process.
Linde has investigated [Alekzeev 2013] a range of configurations for the cryogenic part of
the CPU. Specific energy requirements were found to lie in the range 0.32 – 0.42GJ/tonne
CO2 recovered for processes using either two flashes or a flash and a column. No obvious
optimum process was identified and the best fit process is considered to depend on the
recovery and purity specifications.

105
5.4.2.1. Technology Readiness level
All of the technologies needed to perform the cold processing of CO2 are based on
commercially available processes. The technology readiness level is assessed as TRL-8.
5.4.3. Capture of Additional CO2 from CPU Vent
The capture of CO2 from the CPU vent is another innovation of the last 5 years of oxyfuel
combustion development. The additional capture from the vent could result in a high capture
rate of greater than 98% and could also minimize the impact of the air ingress in the boiler
system. These options are developed by taking advantage of the quality of the vent gas from
the CPU which is typically delivered at pressure (i.e. between ~15 -30 Bara) with high CO2
and O2 content.
Some of the processes presented by the different OEM vendors are described below:
• Air Products proposed the use of CO2 membrane (“Prism”) where the permeate,
consisting of CO2 and O2, is recycled back to the boiler. It is claimed that with this
equipment installed, the oxygen requirement from the ASU could be reduced by 3-5%
[White, 2008, 2011].
• Linde proposed the use of PSA to further recover CO2 from the vent gas of the CPU.
The CO2 rich gas recovered is recycled back to the dehydration unit of the CPU;
whilst the remaining gas could be fed into the front end purification unit of the ASU.
It is claimed that energy consumption of the CPU will increase by 6% as compared to
the CPU without PSA installed. However, Linde has not reported the possible saving
that could be gained in the ASU [Ritter, 2011(b)].
• Praxair proposed the use of VPSA to recover CO2 from the vent of the CPU. The
CO2 rich gas recovered is recycled back to the sour CO2 compressor just after the
FGC. Praxair has yet to report the performance of this process [Shah, 2011].
• Air Liquide proposed the use of membranes to recover CO2 from the vent of the CPU
and the permeate is recycled back to the flue gas compressor situated at the warm part
of the CPU [Lelerc et al, 2013].
The focus of development will be in the areas of the cycle improvement and process
integration.
5.4.3.1. Cost and energy consumption
The vent stream is relatively small so that the costs of treatment equipment will be only a
small part of the total plant cost. The vent stream leaves the CPU cold and at pressure and
current designs extract some power from it by heating and then passing through an expander.
The energy consumed in any extraction process will have to be balanced against any losses in
this recovered energy. However the gains from increased CO2 recovery and/or oxygen
recovery are likely to outweigh this. The potential gains will be quite small, based on the Air
products assessment of 3-5% reduction in ASU size a 2-3% reduction in LCOE may be
possible.

106
5.4.3.2. Technology readiness level
All of the vent recovery technologies are proposals based on use of existing processes.
Sufficient information on the processes is available to predict performance but until this is
validated the proposals are at the stage of formulation of the application. On the basis that the
applicable technologies have been used extensively in other gas processing applications, the
technology readiness level is assessed as TRL-7. The scale up of some processes may need to
be demonstrated.
5.5. Oxy-combustion for gas fired power plants
Oxy-combustion can be used in high temperature turbines, burning natural gas or gas
produced by solid fuel gasification. Typical gas-fired oxyfuel cycles would have the
following features:
• The combustor of the gas turbine is generally operated close to stoichiometric
combustion using nearly pure oxygen mixed with recycled flue gas or steam.
• The main working fluid mainly consists of CO2 or H2O (or mixtures of both).
• The combustion would require oxygen that could range between 10 to 300 bar,
and oxygen purity ranging from 95 to 99% - depending on the type of GT cycle
and the combustor design of the turbo machinery used.
• If fired with natural gas, the CO2 processing unit mainly consists of separation of
water and CO2. The amount of NOx present in the flue gas depends on the GT
combustor design and the purity of oxygen used. However, if fired with syngas
from gasification of coal or other solid fuels the CO2 processing unit would
require the removal of trace compounds such as SOx if sulphur compounds have
not been removed upstream in the syngas treating plant.
From the literature, there are several cycles proposed or under development. Examples of
oxyfuel cycles using CO2 as the working fluid include the MATIANT [Mathieu and Nihart,
1999, 2000], Coolenerg [Staicovici, 2002], COOPERATE [Yantovski et al, 1996a; 1996b],
and Allam [Allam et al 2013] Cycles. On the other hand, cycles using mainly water as the
working fluid include CES Water [Andersson et al 2003, 2008; Marin et al, 2003; Pronske,
2013] and Graz cycles [Jericha et al, 2004]. Other hybrid cycles which do not require any
ASU for oxygen production include the use of Chemical Looping [Ishida and Jin, 1994;
1998; Naqvi and Bolland, 2005] and AZEP cycle [Griffin et al, 2005; Moller et al, 2005].
Research using ITM and OTM technologies for oxygen production are being evaluated.
5.5.1. Clean Energy Systems (CES)
Among the cycles mentioned above the Clean Energy Systems (CES) cycle has been
developed to the largest scale. The CES Water Cycle was developed using the adaptation of a
rocket engine’s combustor to provide the main gas generator for the oxyfuel cycle. The
typical working fluid generated by the combustor is about 80% H2O and 20% CO2. The
initial temperature of the combustor (i.e. first chamber) is maintained between 1650 and
1750C; and the operating pressure is generally in the range of 50 to 100 bar. Temperature is
moderated in the cooling chamber downstream of the combustor/gas generator by water or
steam injection to match the operating inlet temperature of the high pressure (HP) steam
turbine (normally between 500-610C for current generation steam turbine, and up to 760C for

107
future generation steam turbine). The pressure ratio of the current generation HP steam
turbine is about 5. The working fluid is reheated in an external combustor to provide a
working fluid with a turbine inlet temperature (TIT) matching the capabilities of the
intermediate pressure (IP) gas turbine or OFT. Typical TIT could be in the range of 700 to
1750C depending on the operating inlet turbine temperature of the modified gas turbine to be
used. The heat from the exhaust of the gas turbine is recovered via HRSG and the steam
generated by the HRSG is delivered to the low pressure (LP) steam turbine; or the exhaust of
the OFT could be used as the working fluid for the LP steam turbine (if temperature match
the operating temperature of available steam turbine).
Figure 48 The CES cycle
A 200MWth high pressure combustor and a 43MWe turbine have been operated. Future
development of this technology includes, but is not limited to, the following:
• Further demonstration of the reheat combustor and long term operation of a full
scale turbine.
• Demonstration and validation of the sytems economic feasibility based on a large
scale full chain power plant with CO2 capture.
• The potential of the CES Water Cycle technology to improve its efficiency
depends on the development of two main components namely: the HP steam
turbine and the oxyfuel gas turbine to operate at higher inlet temperatures
• Demonstration of this technology using gaseous fuels other than natural gas. This
should benefit industrial users that could use low calorific value off-gases or
development of coal based systems using gasifiers to produce syngas.
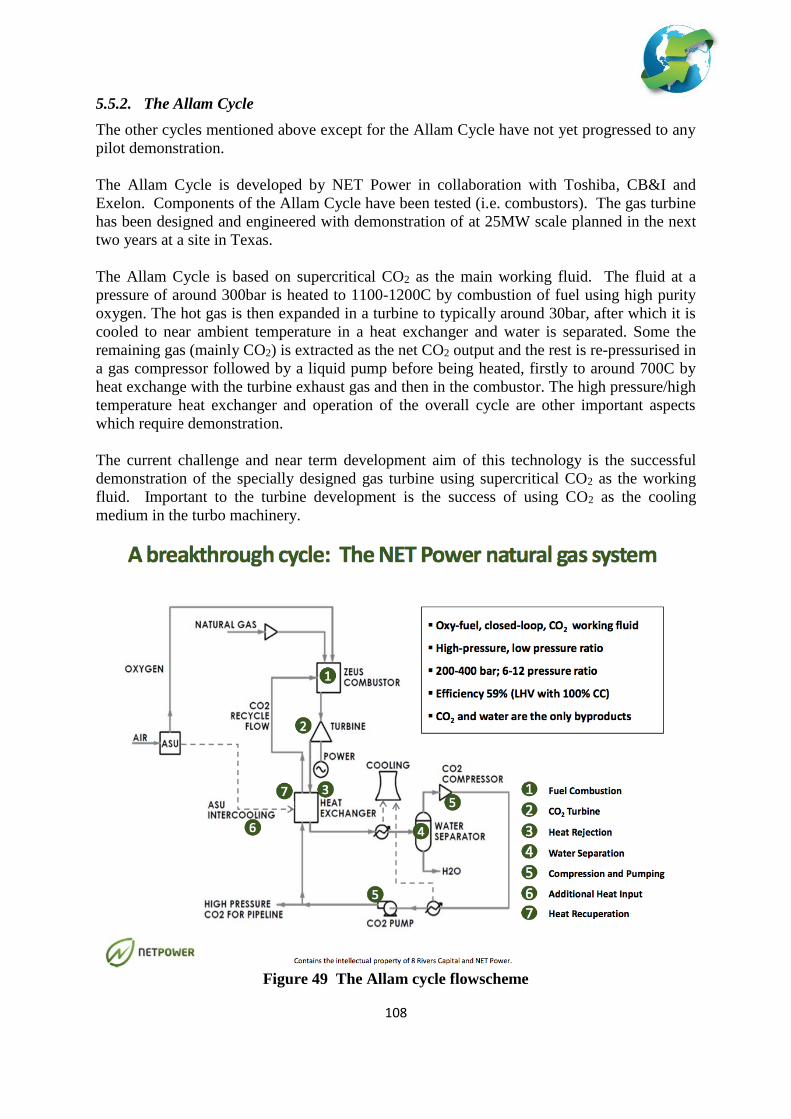
108
5.5.2. The Allam Cycle
The other cycles mentioned above except for the Allam Cycle have not yet progressed to any
pilot demonstration.
The Allam Cycle is developed by NET Power in collaboration with Toshiba, CB&I and
Exelon. Components of the Allam Cycle have been tested (i.e. combustors). The gas turbine
has been designed and engineered with demonstration of at 25MW scale planned in the next
two years at a site in Texas.
The Allam Cycle is based on supercritical CO2 as the main working fluid. The fluid at a
pressure of around 300bar is heated to 1100-1200C by combustion of fuel using high purity
oxygen. The hot gas is then expanded in a turbine to typically around 30bar, after which it is
cooled to near ambient temperature in a heat exchanger and water is separated. Some the
remaining gas (mainly CO2) is extracted as the net CO2 output and the rest is re-pressurised in
a gas compressor followed by a liquid pump before being heated, firstly to around 700C by
heat exchange with the turbine exhaust gas and then in the combustor. The high pressure/high
temperature heat exchanger and operation of the overall cycle are other important aspects
which require demonstration.
The current challenge and near term development aim of this technology is the successful
demonstration of the specially designed gas turbine using supercritical CO2 as the working
fluid. Important to the turbine development is the success of using CO2 as the cooling
medium in the turbo machinery.
Figure 49 The Allam cycle flowscheme

109
5.5.3. Thermodynamic considerations
A key to obtaining high efficiency in novel oxy GT cycles is attaining high enough
temperatures at the inlet to the turbo machinery. Modern gas turbines have been able to reach
high inlet temperatures by a combination of advanced materials and advanced turbine blade
cooling technologies. The use of inter-stage reheat is also a strategy which can be deployed.
Some of the cycles proposed use quite different working fluids and differences in their
properties can change the theoretically attainable efficiency. Some examples of the issues are
– in cycles using mixtures of CO2 and steam such as the CES cycle it is difficult to recover as
much of the latent heat of evaporation of water in the cycle as occurs in partially condensing
steam turbines. In the AZEP cycle temperature limitations in the oxygen separation
membrane limit turbine inlet temperatures unless additional fuel is added to the inlet duct.
Also the mass flow through the main power turbine is reduced because the fuel and oxygen
do not pass through the main power turbine.
Oxy gas turbine cycles are being developed initially to consume natural gas. They thus have
to compete with the very high efficiencies obtainable in NGCC plants which have already
reached 60% without capture. Application of oxycombustion to natural gas suffers from the
inefficiency that oxygen has to be produced to combust the hydrogen content as well as the
carbon content of the fuel.
5.5.4. Cost and energy consumption
Cost estimates for alternative oxy-combustion power cycles are difficult to establish because
they require development of new equipment. The easier driver to evaluate is that of overall
thermal efficiency since simulation software can make reasonably accurate predictions of
this. Care still needs to be taken to use appropriate parameters for equipment efficiencies and
heat exchange temperature approaches to ensure these reflect practicality. Process conditions
also need to respect material property limitations to avoid over optimistic predictions.
Efficiencies of 45-49% LHV are predicted for oxy-fuel combined cycle, water cycle and Graz
cycle plants [Kvamsdal, 2007]. An efficiency of 59% LHV has been claimed for a natural gas
fired Allam cycle with CO2 capture, which is similar to the efficiency of a conventional
natural gas combined cycle without capture [Allam, 2013]. A CCS plant which includes coal
gasification and a syngas fired Allam cycle is claimed to have an efficiency of 50% LHV and
a lower LCOE than pulverised coal and IGCC plants without CCS [Lu. 2014]. In this case the
gasification plant does not include acid gas removal, instead SOx is removed downstream of
the heat recovery heat exchanger. IEAGHG is currently undertaking a study to assess the
performance and costs of oxy-combustion turbine cycles.
5.5.5. Current Status, technology readiness level and development requirements.
Most of the alternative cycles are proposals needing further development of the required
hardware. Most of the alternatives are thus assessed as being at TRL-2. The main exception is
the CES technology where significant progress has been made in testing at moderate scale.
This is therefore assessed as being at TRL-5. Despite the size of the systems tested there is
still a need to proceed to test systems at the higher temperature and pressure conditions
needed for the process to be competitive. A fully integrated test at “commercial” process
conditions is also needed.

110
One of the key areas of development for the Oxy-GT cycles involves the right selection of the
ASU cycle suitable to deliver medium to high pressure oxygen with purity ranging from 95-
98%. Two important components of the ASU would require significant attention – this
involves the right selection of the main air compressor which in some cases is a necessary
part of the integration between the power plant and oxygen production unit. The second
element is the scaling up of the LOX pumps that could potentially provide additional
improvement to the efficiency of the ASU.
Development of the CPU suitable for the Oxy-GT will also be the focus of future work. This
is very dependent on the oxy-GT cycle. Depending on the trace elements (i.e. NOx, SOx) in
the CO2 rich flue gas, the CPU design could only involve a dehydration unit but may also
involve pre-treatment of the CO2 rich gas. Cryogenic separation of the inerts may not be
necessary but this depends on the CO2 purity required by for CO2 transport and storage.
6. Solid looping technologies
Solid looping technologies capture CO2 at high temperature in cyclical processes using either
circulating or fixed beds of solids. High-temperature solid looping cycles involve the use of a
solid carrier to transfer either CO2 or O2 from one reactor to another.
In calcium/carbonate looping (CaL), usually lime (CaO) captures CO2 from a gas mixture
with the sorbent then being regenerated to yield a pure stream of CO2. Limestone is abundant
and cheap but more effective and durable synthetic alternatives are also being developed. In
recent years considerable advances have been made in combating loss of reactive capacity
and attrition of the sorbent after a number of cycles to the point that these are no longer
barriers to implementation. Besides, it is possible to use the spent sorbent to produce cement.
Post-combustion CO2 capture is the main area of application for CaL (see Figure 50).
Chemical looping combustion (CLC) is a method of indirect, oxy-combustion (compare
Figure 50), where fuel and air are never mixed. A metal oxide transports oxygen from the air
to the fuel, yielding a pure stream of CO2 and H2O, which can then be easily separated and
the CO2 subsequently stored or utilised. CLC inherently avoids costly gas separation steps.
Therefore, CLC is one of the most energy-efficient approaches to capture CO2 from power
production or fuel upgrading. A key objective is to develop this technology to be able to
completely combust coal, which would yield a CO2 capture process whose only energy
penalty is the CO2 compression energy.
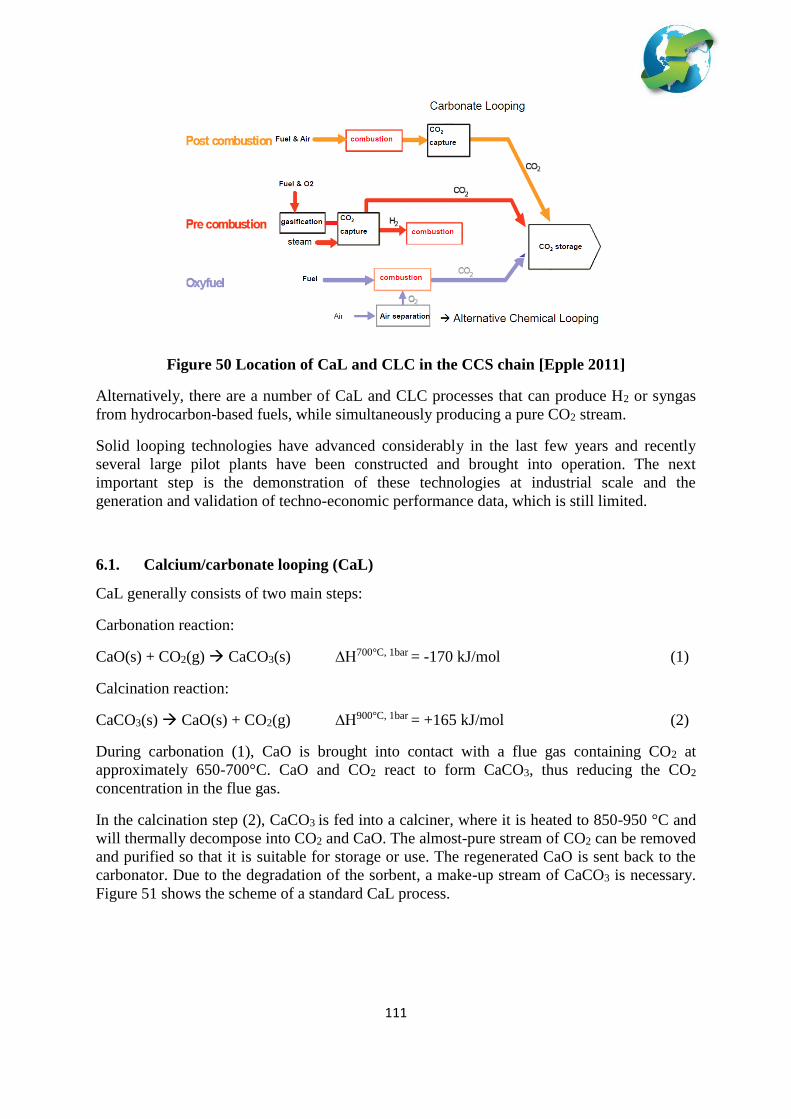
111
Figure 50 Location of CaL and CLC in the CCS chain [Epple 2011]
Alternatively, there are a number of CaL and CLC processes that can produce H2 or syngas
from hydrocarbon-based fuels, while simultaneously producing a pure CO2 stream.
Solid looping technologies have advanced considerably in the last few years and recently
several large pilot plants have been constructed and brought into operation. The next
important step is the demonstration of these technologies at industrial scale and the
generation and validation of techno-economic performance data, which is still limited.
6.1. Calcium/carbonate looping (CaL)
CaL generally consists of two main steps:
Carbonation reaction:
CaO(s) + CO2(g) CaCO3(s) ∆H700°C, 1bar = -170 kJ/mol (1)
Calcination reaction:
CaCO3(s) CaO(s) + CO2(g) ∆H900°C, 1bar = +165 kJ/mol (2)
During carbonation (1), CaO is brought into contact with a flue gas containing CO2 at
approximately 650-700°C. CaO and CO2 react to form CaCO3, thus reducing the CO2
concentration in the flue gas.
In the calcination step (2), CaCO3 is fed into a calciner, where it is heated to 850-950 °C and
will thermally decompose into CO2 and CaO. The almost-pure stream of CO2 can be removed
and purified so that it is suitable for storage or use. The regenerated CaO is sent back to the
carbonator. Due to the degradation of the sorbent, a make-up stream of CaCO3 is necessary.
Figure 51 shows the scheme of a standard CaL process.

112
Figure 51 Scheme of a standard calcium looping process [Epple 2013]
6.1.1. Current status
Figure 52 is an overview of the CaL pilot plants that were in operation in 2011. Please note
that the table is missing the 1.7 MWth pilot plant of CSIC-INCAR in Spain [Arias 2013],
which is in operation since 2011/2012. The concept of post‐combustion CaL, in continuous
mode of operation, has been successfully proven with two interconnected circulating
fluidised beds (CFBs) at the 1.7 MWth scale. In 2012, ITRI opened a 1.9 MWth pilot plant in
Taiwan [Chang 2013]. TU Darmstadt has a 1 MWth pilot and is currently undertaking design
studies for a 20 MWth scale-up [Junk 2014].
Figure 52 Summary of CaL pilot plants [Dean 2011]
6.1.2. Performance and cost
According to [Epple 2013] and [Kremer 2013], the electrical efficiency of a state-of-the-art
coal-fired power plant integrating post-combustion CO2 capture by CaL lies in the range of
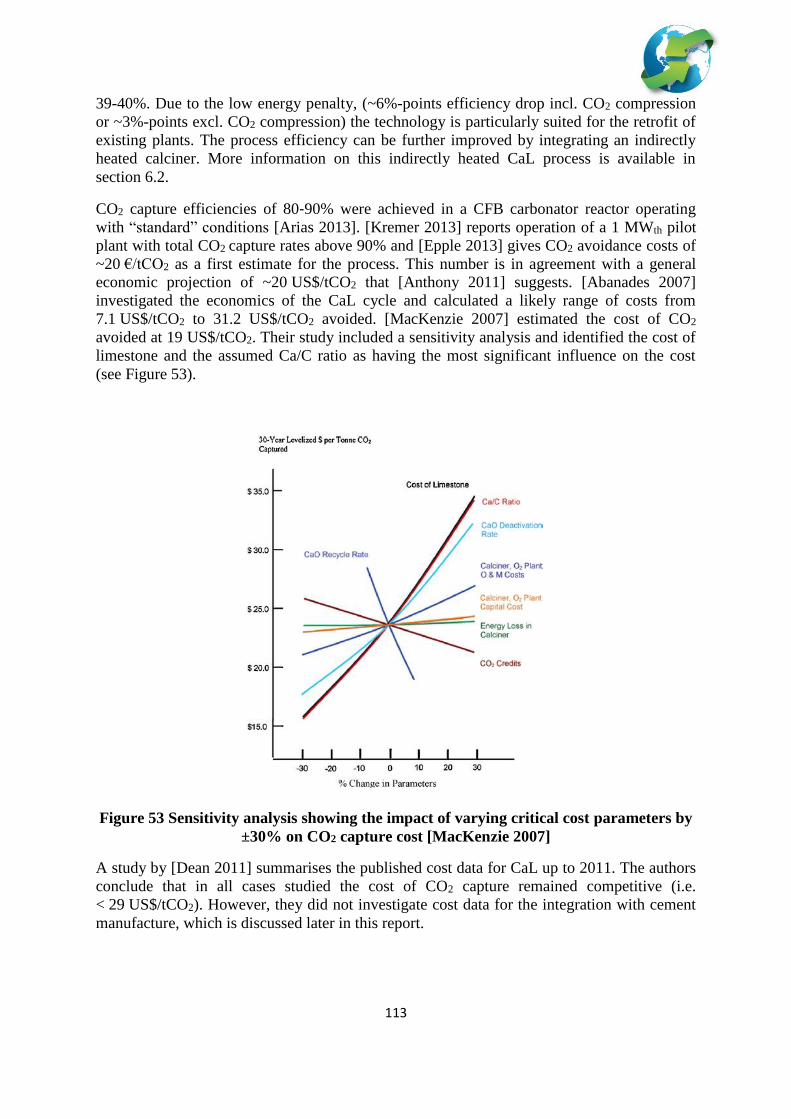
113
39-40%. Due to the low energy penalty, (~6%-points efficiency drop incl. CO2 compression
or ~3%-points excl. CO2 compression) the technology is particularly suited for the retrofit of
existing plants. The process efficiency can be further improved by integrating an indirectly
heated calciner. More information on this indirectly heated CaL process is available in
section 6.2.
CO2 capture efficiencies of 80‐90% were achieved in a CFB carbonator reactor operating
with “standard” conditions [Arias 2013]. [Kremer 2013] reports operation of a 1 MWth pilot
plant with total CO2 capture rates above 90% and [Epple 2013] gives CO2 avoidance costs of
~20 €/tCO2 as a first estimate for the process. This number is in agreement with a general
economic projection of ~20 US$/tCO2 that [Anthony 2011] suggests. [Abanades 2007]
investigated the economics of the CaL cycle and calculated a likely range of costs from
7.1 US$/tCO2 to 31.2 US$/tCO2 avoided. [MacKenzie 2007] estimated the cost of CO2
avoided at 19 US$/tCO2. Their study included a sensitivity analysis and identified the cost of
limestone and the assumed Ca/C ratio as having the most significant influence on the cost
(see Figure 53).
Figure 53 Sensitivity analysis showing the impact of varying critical cost parameters by
±30% on CO2 capture cost [MacKenzie 2007]
A study by [Dean 2011] summarises the published cost data for CaL up to 2011. The authors
conclude that in all cases studied the cost of CO2 capture remained competitive (i.e.
< 29 US$/tCO2). However, they did not investigate cost data for the integration with cement
manufacture, which is discussed later in this report.

114
6.1.3. Technology readiness level
Recent results from the MW scale pilot plants have reported good steady state performance in
line with expectations. The 1.7 MWth pilot at La Pereda has been able to use coal and oxygen
as the fuel for the calciner, effectively simulating the fully integrated system. The technology
readiness level is assessed as TRL-6. Use of this technology as a retro fit is possible but
increases the overall plant capacity by 30-40%. The technology is thus most appropriate
where there is a need for repowering to increase capacity or new build to replace retiring
capacity.
6.2. CaL for combustion: an indirectly heated CaL process
[Junk 2013] and [Epple 2013] propose an indirectly heated CaL process, where the heat for
the calciner is supplied by an external combustor via heat pipes, so no oxygen is needed for
firing the calciner (see Figure 54 for the layout of the process and Figure 55 for the design of
the integrated heat exchanger).
Figure 54 Process scheme for indirectly heated carbonate looping [Junk 2013]
CARBONATORT = 650 °C
Xave
CALCINERT = 900 °C
Flue gas from power plant
Depleted flue gas
CaCO3
CaO
CO2 to compression
Purge H2O
Make-up
COMBUSTORT = 1100 °C
λ = 1.1
Heat
Primary airAir 2
Flue gas from combustor
Ash
Heat
Coal
Air 1

115
Figure 55 Left: design of the 300 kWth test facility; right: design of the heat exchanger
[Junk 2013]
6.2.1. Performance and cost
The authors report low sorbent attrition rates in the calciner and low sorbent deactivation
rates. Because there is no coal present in the calciner, few additional impurities (e.g. sulfur,
ash) are brought into the system, which reduces the flow of circulating solids and facilitates
the further utilization of deactivated sorbents. Solid flux investigations showed that the heat
pipes do not significantly influence the particle flow through the calciner and the required
solids mass flow through the reactor can be achieved.
Because the air separation step in a standard CaL process accounts for a large amount of the
energy penalty (2%-points out of the total of 3%-points excl. CO2 compression), the
indirectly heated process will have a lower energy penalty of ~1 %-point.
6.2.2. Current status, technology readiness level and development requirements
A 300 kWth test rig has been designed and the first campaign is scheduled for the end of 2014
[Reitz 2014].
Successful operation of the pilot plant with indirect heating of the calciner will move this
technology towards TRL-6. At present, the concept of the individual components is tested
although the use of heat pipes in this type of application may still need validation. There may
also be technical and engineering issues in scaling up the heat pipes, particularly if much
longer pipes are needed at larger scale. The indirectly heated calciner version of CaL is
assessed as being at TRL-3 subject to successful testing in the new pilot plant.
A retrofit of the process is generally possible but causes big plant sizes, thus a new-build is
more appropriate.
6.3. CaL for H2 production
At present, most H2 (i.e. 96%) is produced from fossil fuels, resulting in an equivalent
amount of CO2 being released to the atmosphere. Given the enormous increase in production
that would be necessary to support a transition to a H2 economy, there is clear scope for
improved methods in order to decarbonise this sector.

116
6.3.1. Performance and cost
[Connell 2013] assessed the techno-economics of the CaL process (CLP) for three different
H2 and electricity production technologies: coal-to-H2, steam methane reforming (SMR) and
integrated gasification combined cycle (IGCC). In each of the coal-to-H2, SMR, and IGCC
cases evaluated, use of CaL results in a 9–12% reduction in cost of H2 (COH) or levelised
cost of electricity (LCOE), when compared with the use of conventional CO2 capture and
water-gas shift (WGS) technologies (see Tables 12 and 13). The reason for this economic
advantage is the large amount of high-quality heat produced in the processes that is available
to raise steam for electricity generation. Although CaL can reduce the cost of producing H2
from coal, the resulting cost is still about 26% greater than the cost of H2 produced from
natural gas using conventional WGS and CO2 capture. In the study, the lowest-cost route to
H2 production with CO2 capture is the SMR with CaL case.
Table 12 Techno-economics of the coal-to-H2 and SMR cases [Connell 2013]
Table 13 Techno-economics of the IGCC cases [Connell 2013]
[Dean 2011] also gives an overview of the possibilities of H2 production with methods of CaL
cycles. These processes, as well as the ones in Connell 2013, offer significant potential for
efficiency and economic improvements.
6.3.2. Future developments
[Connell 2013] conclude that additional research is required to resolve technical uncertainties
related to commercial application of these technologies, as they usually involve higher
technical complexity.
The following sections briefly describe three exemplary CaL technologies for H2 production.
6.4. Combined shift-carbonation
Combined shift-carbonation is an advanced process coupling the carbonation reaction (3)
with the WGS (4) to produce H2:
CaCO3(s) = CaO(s) +CO2(g) ∆H0 = +178 kJ/mol (3)
CO(g) +H2O(g) = CO2(g) +H2(g) ∆H0 = −41 kJ/mol (4)
117
6.4.1. Performance and cost
The removal of gaseous CO2 as solid CaCO3 shifts the CO conversion and thus increases the
output of H2.
6.4.2. Current status, technology readiness level and development requirements
The use of CaL for H2 production is at an early stage of investigation. The principles are
understood and several concepts have been proposed. The technology readiness level is
assessed as TRL-1.
The process suffers from the same issues as the standard CaL process, i.e. the degradation of
the sorbent through multiple cycles, which will lead to a decrease in H2 productivity and
therefore affects the efficiency of the process.
6.5. Sorption enhanced reforming (SER) and sorption enhanced water gas shift
(SEWGS)
SER of hydrocarbons for H2 production is a very complex process combining SMR according
to (5) with the carbonation (3) and the water-gas shift reaction (4) in a single step.
CH4(g) + H2O(g) ↔ 3H2(g) + CO(g) ∆H0 = +206 kJ/mol (5)
6.5.1. Performance and cost
This process also exploits the advantage of removing CO2 from the reaction system to
enhance conversion of CO and can produce a concentrated stream of H2 > 98 vol%. [Ortiz
2001] report potential energy savings of SER compared to standard SMR to be in the order of
20%.
6.5.2. Current status, technology readiness level and development requirements
The process has been demonstrated at lab-scale using a pressurised fixed-bed reactor by
[Balasubramanian 1999], reporting a product gas consisting of 94.7 vol% H2.
The SEWGS process has been covered in the chapter on pre-combustion technologies. The
SER process principle has been demonstrated some time ago but no further work appears to
have been done. The technology readiness level for SER is assessed as TRL-1.
6.6. The ENDEX process
The ENDEX process by Calix, as described in [Sceats 2009] and [Ball 2010], is a “reversed”
application of the conventional CaL technology, where calcination is carried out at a lower
temperature (650–760°C) than the carbonation (760–850°C). This together with the
minimisation of the CO2 pressure in the calciner eliminates some of the key technological
challenges of CaL processes (i.e. decay in CO2 capture capacity through multiple cycles,
process heat integration and sintering). Figure 56 shows the principle of the ENDEX
configuration.
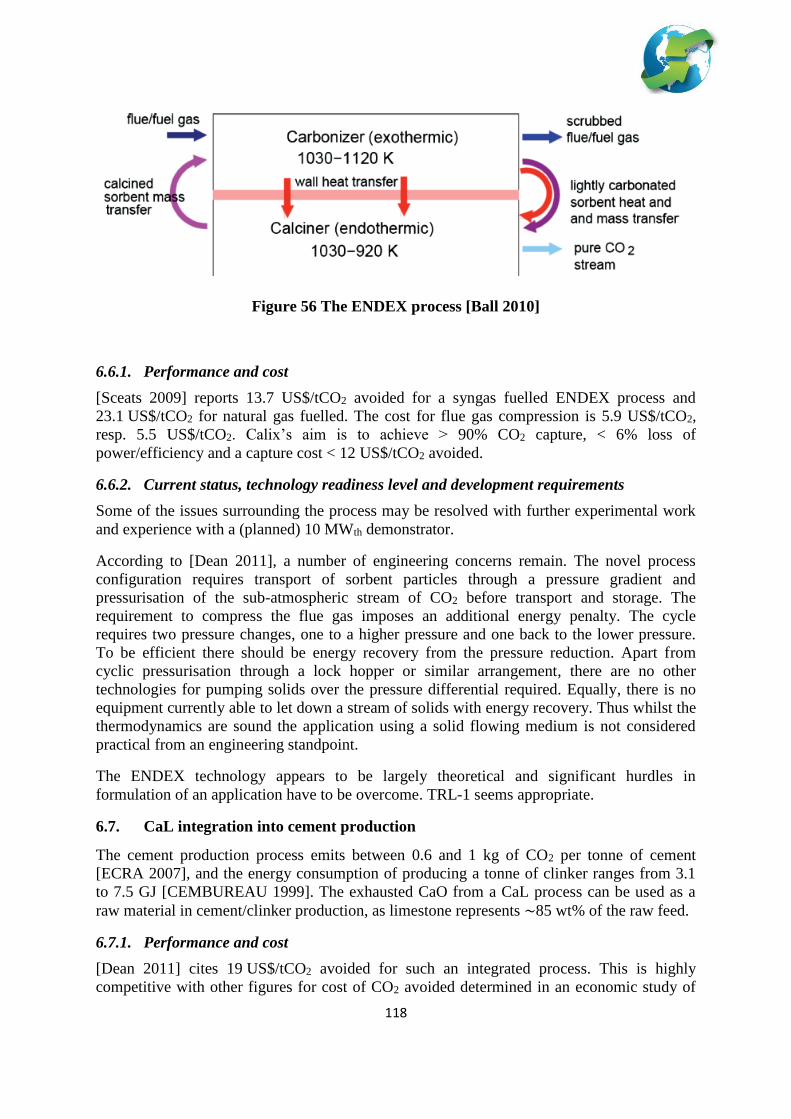
118
Figure 56 The ENDEX process [Ball 2010]
6.6.1. Performance and cost
[Sceats 2009] reports 13.7 US$/tCO2 avoided for a syngas fuelled ENDEX process and
23.1 US$/tCO2 for natural gas fuelled. The cost for flue gas compression is 5.9 US$/tCO2,
resp. 5.5 US$/tCO2. Calix’s aim is to achieve > 90% CO2 capture, < 6% loss of
power/efficiency and a capture cost < 12 US$/tCO2 avoided.
6.6.2. Current status, technology readiness level and development requirements
Some of the issues surrounding the process may be resolved with further experimental work
and experience with a (planned) 10 MWth demonstrator.
According to [Dean 2011], a number of engineering concerns remain. The novel process
configuration requires transport of sorbent particles through a pressure gradient and
pressurisation of the sub-atmospheric stream of CO2 before transport and storage. The
requirement to compress the flue gas imposes an additional energy penalty. The cycle
requires two pressure changes, one to a higher pressure and one back to the lower pressure.
To be efficient there should be energy recovery from the pressure reduction. Apart from
cyclic pressurisation through a lock hopper or similar arrangement, there are no other
technologies for pumping solids over the pressure differential required. Equally, there is no
equipment currently able to let down a stream of solids with energy recovery. Thus whilst the
thermodynamics are sound the application using a solid flowing medium is not considered
practical from an engineering standpoint.
The ENDEX technology appears to be largely theoretical and significant hurdles in
formulation of an application have to be overcome. TRL-1 seems appropriate.
6.7. CaL integration into cement production
The cement production process emits between 0.6 and 1 kg of CO2 per tonne of cement
[ECRA 2007], and the energy consumption of producing a tonne of clinker ranges from 3.1
to 7.5 GJ [CEMBUREAU 1999]. The exhausted CaO from a CaL process can be used as a
raw material in cement/clinker production, as limestone represents ∼85 wt% of the raw feed.
6.7.1. Performance and cost
[Dean 2011] cites 19 US$/tCO2 avoided for such an integrated process. This is highly
competitive with other figures for cost of CO2 avoided determined in an economic study of

119
CO2 capture in the cement process using amines (144 US$/tCO2) and using an oxy-fired kiln
configuration (54 US$/tCO2) by [Barker 2009]. [Dean 2011] concludes CaL integration can
reduce the energy requirement for clinker manufacture from 3.1 GJ/t by approximately 50%,
so there is the possibility for significant decarbonisation.
[Rodriguez 2008] state it would be possible to reduce the CO2 emissions from a cement plant
by as much as 60%, with a cost of around 19 US$/tCO2 avoided.
[Romano 2013] investigated integration of CaL into a state-of-the-art power plant and cement
manufacture (see Figure 57). The reference cement plant produces 4050 t/d of clinker with a
state-of-the-art dry process. Estimates indicate that complete substitution gives a reduction of
up to 70-75% of the thermal input and up to 85% of CO2 emissions, with respect to the
reference plant.
Figure 57 Integration of CaL process with power and cement plant [Romano 2013]
For the economic analysis the authors assumed a cost of 7 €/tCO2 for transport and storage.
They chose to calculate the LCOE by assuming different values of the carbon tax (instead of
calculating the cost of the CO2 avoided, which can provide misleading results for low CO2
capture cases). In COE-1 scenario, the selling price of cement increases by the same amount
of the cost associated to the carbon tax in a cement plant without CO2 capture. In COE-II, the
selling price of cement is unaffected by the carbon tax, and thus the additional cost of the
CO2 emitted from the stack of the cement plant is entirely charged on the cost of the
electricity. The authors expect that any real economic scenario would be intermediate
between these two and conclude that 27 €/tCO2 is the minimum cost of CO2 avoided
expected for the system. Figure 58 shows the detailed results of this economic analysis.

120
Figure 58 COE for cement plant integration for a carbon tax of 40 €/tCO2 [Romano
2013]
[Ozcan 2012] did a simulation study of a cement plant with CaL and reports a gross power
generation efficiency of 46% with CO2 capture rates between 92–99%. One of the cases
studied in their work showed an energy consumption of 5.3 GJ/tCO2, compared to a value of
4.6 GJ/tCO2 for an integrated MEA process. With heat recovery, the resulting energy
consumption would decrease to 2.3 GJ/tCO2.
6.7.2. Current status, technology readiness level and development requirements
ITRI is operating a 1.9 MWth pilot plant with flue gas from a cement plant in Taiwan since
mid of 2013 [Chou 2013].
The integration and use of waste CaL sorbent in the clinker are at an early stage of
development. However, the main CaL system can be considered as at the same stage as that
intended for a conventional power plant, which was assessed as TRL-6. The integration
aspects are thus assessed at TRL-1. It should be noted that use of waste sorbent derived from
a power generation process with CaL in cement clinker capture could potentially enhance the
economics of the power plant. A key concern for using spent sorbent from CaL in a cement
plant are trace elements, their incorporation into the clinker and their effects on the
production process and on cement performance [Bhatty 2003].
6.8. Chemical looping combustion (CLC)
In CLC, fuel and combustion air never come into contact with one another, creating a CO2
exhaust gas stream not diluted with N2. Figure 59 shows a scheme of a standard CLC process.
The reactions for the oxidation and reduction step of the metal oxygen carrier (MeO) are (6)
resp. (7). Simply condensing out the water vapour from the fuel reactor exhaust gas stream
results in a CO2 stream with >99% purity.
Oxidizer (air reactor):
MexOy-1 +1/2O2 MexOy (6)
Reducer (fuel reactor):
CnH2m + (2n+m)MexOy nCO2 + mH2O + (2n+m)MexOy-1 (7)

121
Figure 59 Scheme of a standard CLC process [Epple 2013]
Several publications discuss the advantages and disadvantages of CLC technologies
[Spigarelli 2013, DOE/NETL 2013, Adanez 2012, Moghtaderi 2012]. A summary is provided
below.
Advantages
Air separation unit (ASU) is not required. This eliminates large capital, operating, and
energy costs associated with O2 generation.
CO2 stream is not diluted with N2, which makes for an easier, in-situ CO2 separation.
Since no energy is required for the separation of O2 or CO2, CLC potentially has the
lowest efficiency penalties among all CO2 capture technologies.
Inherent reduction of NOx emissions since air and fuel never contact one another.
Process can be applied to any form of fuel (i.e. solid, liquid or gas).
CFB technology is relatively mature.
Challenges
Pressure of the two reactors must be the same to prevent air leakage to fuel reactor.
Reduced reduction rate of the MeO after the first cycle. Reasons are the deactivation
of the MeO due to unburned carbon deposition on the surface of the particles and
attrition.
Heat integration and ash separation.
Sulfur compounds will react to form metal sulphides, so the fuel needs
desulphurisation before entering the fuel reactor.
Technology is in the R&D phase, with no demonstrations or commercial plants in
operation.
Chemical looping offers a high degree of flexibility, as it can produce either steam for
electricity generation, or hydrogen, both in combination with CO2 capture. In this context,

122
chemical looping reforming (CLR) technologies can reduce the cost of CO2 capture whilst
simultaneously producing H2. Two interesting methods are steam reforming integrated with
chemical looping combustion (SR-CLC) and autothermal chemical looping reforming (a-
CLR), which are discussed later in this section.
[Spigarelli 2013] concludes that compared to other CO2 capture technologies, CLC is the
furthest behind in terms of commercial development.
6.8.1. Performance and cost
For a coal-fired CLC process, [Epple 2011] reports that the potential electrical efficiency can
reach values up to 42% depending on steam flow for fluidisation of the fuel reactor. The
authors discuss that CLC is a promising option for new power plants, rather than for retrofit,
and estimate the CO2 avoidance costs to be ~10 €/tCO2.
In 2006, Alstom compared the cost of electricity (LCOE) of CLC technologies with
conventional CCS technologies [Alstom 2013]. Figure 60 shows that CLC has the potential
for significantly lower LCOE than all other investigated CCS technologies and does not seem
to be sensitive towards the CO2 allowance price.
Figure 60 LCOE for chemical looping compared to conventional CCC technologies
[Alstom 2013]
The issue of estimating costs has been addressed [Lyngfelt 2014a], suggesting that costs
could best be compared with those for the similar CFB technology. Based on the performance
of a 100 kW CLC unit projections for a 410 MWe unit were prepared. A key assumption is
that volatiles would not undergo complete combustion, with between 5% and 15% of the
oxygen demand having to be met from an ASU. Recent results in the 100 kW unit suggest
that addition of manganese ore can significantly reduce this extra demand for oxygen by
increasing volatiles conversion. The final oxidation would have to be done in an oxy
polishing unit downstream of the main fuel reactor. The air reactor and fuel reactor each
would differ from a typical CFB and suggestions as to how the costs could be ratioed for
these differences are proposed. In particular, the fuel reactor would be adiabatic and the usual
steam raising walls would need to be replaced with more expensive insulated walls. The other
significant parasitic energy consumers are CO2 compression and solids circulation.

123
6.8.2. Thermodynamic and chemical reaction considerations
By using the chemical potential of the combustion reaction in two stages, the energy required
for separation is effectively derived directly from the combustion reactions eliminating
energy intensive separation processes. This can be done without penalty as long as the top
temperatures of the power generation working cycle are maintained. For coal-fired plants
running a steam cycle where top temperatures are currently limited to below 700°C this can
easily be achieved. However, gas-fired plants operate with turbine inlet temperatures up to
1500°C and this may be even increased with new materials developments. CLC fuel reactor
temperatures cannot match this and hence are unlikely to compete in gas-fired power
generation applications. The exception is locations where natural gas is the preferred fuel for
steam generation, notably for heavy oil recovery in remote locations.
6.8.3. Current status, technology readiness level and development requirements
[Spigarelli 2013] provides an overview of CO2 capture technologies, including CLC. The
authors report that the operating temperature and pressure of the reactors may range from 800
to 1200°C and 1 to 69 atm, depending heavily upon the type and size of oxygen carrier used.
Common oxygen carriers for CLC processes include iron, nickel, cobalt, copper, manganese,
and cadmium.
One important advantage of the use of a fluidized bed configuration for the CLC process is
that CFB technology is mature. Table 14 summarises the currently existing CLC pilot plants.
Table 14 Summary of chemical looping pilot plants [Adanez 2012]
According to [Adanez 2012], most of the CLC pilot plants existing worldwide at the moment
use two interconnected CFB reactors working at atmospheric pressure. Alternative reactor
concepts for CLC have only been tested at lab-scale.
Whilst small scale tests of the CLC process have been undertaken, a key to success is the
ability to fully combust the coal in the fuel reactor. Although high conversions have been
achieved the goal of effectively complete combustion has not. A solution to this is still
needed. Some advocate the use of oxygen carriers that release gaseous oxygen under fuel

124
reactor conditions in the CLOU variant of the process, which is discussed later. Two effects
preventing complete combustion of coal in a fluidised bed reactor need to be addressed. The
first is the tendency for volatiles released from the coal in the well mixed reactor to exit with
the combustion gases before they have had enough contact time to oxidise. This can be
worked around by installing an oxy-combustion polishing step, although this reduces
efficiency because of the parasitic energy needed to produce the oxygen required. The other
is that the heavier char needs a long residence time and in a well mixed reactor unburnt
material circulates to the air reactor affecting the capture efficiency. Initial approaches have
involved designs for staging the fuel reactor by inserting narrow sections so that it behaves
less like a CSTR (continuous stirred tank reactor). Because of these issues the technology
readiness level is assessed as still being at TRL-2.
[DOE/NETL 2013] contains a brief overview of the CLC projects supported by the US
Department of Energy’s (DOE) National Energy Technology Laboratory (NETL) that were
completed in 2012. NETL considers CLC a “transformational” technology with the potential
to meet programme cost and performance goals and be ready for demonstration-scale testing
after 2030. The overview identifies the following four areas that need further R&D: (1)
oxygen carrier characteristics, (2) solids circulation strategy, (3) reactor design, and (4)
overall system and process design.
Generally, for CLC to be a viable option for reducing CO2 emissions further development is
necessary with regards to large scale CLC operation and conversion/retrofitting of existing
facilities.
6.9. Chemical looping gasification (CLG)
Several gasification technologies for solid fuels exist that are suitable for combination with
CLC. This section provides a brief description of the technologies that have been recently
discussed in the literature, especially in [Adanez 2012].
6.9.1. In-situ gasification CLC (iG-CLC)
In-situ gasification CLC (iG-CLC) means gasification of a solid fuel by H2O or CO2 supplied
as fluidization agent, i.e. direct feeding of the solid fuel to the fuel reactor. Figure 61 shows a
scheme of this process. When CO2 is the agent, the process can avoid the energy required for
steam production. The net chemical reaction is the same as in usual combustion with the
same combustion enthalpy.

125
Figure 61 Scheme of the iG-CLC process [Adanez 2012]
[Shen 2009] evaluated biomass as a solid fuel in a continuous 10 kWth CLC combustor.
However, they found a low reactivity of the oxygen carrier particles used due to sintering.
6.9.1.1. Performance and cost
Initial calculations indicate that the iG-CLC process has the potential to obtain higher power
efficiencies and lower costs than other evaluated technologies, with a net efficiency of the
process of about 41-42% [Fillman 2010]. Pressurisation of the process is an option to further
increase the energy efficiency. According to [Adanez 2012], concepts using two
interconnected fluidized-bed reactors are prevalent in the works demonstrating the iG-CLC
technology.
6.9.1.2. Current status, technology readiness level and development requirements
This technology is still at the conceptual stage and is assessed at TRL-1.
[Adanez, 2012] also mentions the following key factors for the development of this process:
(a) combustion efficiency in the fuel-reactor; (b) efficiency of char separation in the carbon
stripper; and (c) separation of ash. The authors further discuss that it could be difficult to
reach complete gas conversion with solid fuels even when using highly reactive oxygen
carrier materials or high solids inventory. The unburnt components are another issue that
needs to be addressed. Finally, mixing of the ash and oxygen carrier could have negative
effects on performance of the oxygen carrier, such as loss in reactivity or agglomeration.
6.9.2. Chemical looping with oxygen uncoupling (CLOU)
In chemical looping with oxygen uncoupling (CLOU) a solid fuel is burned with gaseous
oxygen released by the oxygen carrier in the fuel reactor. This avoids the low reactivity of the
char gasification stage in the iG-CLC process. For comparison, Figure 62 provides the
mechanisms of the different CLG technologies discussed in this section.

126
Figure 62 Mechanisms of the different CLG technologies [Adanez 2012]
6.9.2.1. Performance and cost
[Adanez 2012] contains a detailed discussion of CLOU and the authors mention that the
lower amount of oxygen carrier material needed in the system will reduce the reactor size and
associated costs. The fluidization gas can be recycled CO2, which reduces the steam duty of
the plant and the corresponding energy.
6.9.2.2. Current status, technology readiness level and development requirements
[Mattisson 2009] identified three suitable metal oxide systems for application in CLOU:
CuO/Cu2O, Mn2O3/Mn3O4, and Co3O4/CoO. The proof of concept of the CLOU process with
coal was demonstrated in a 1,500 Wth unit located at ICB-CSIC consisting of two
interconnected fluidized-bed reactors [Adanez-Rubio 2011].
This technology is very similar to the basic CLC except that a different type of oxygen carrier
is required. A formulation for a viable system can only be made when solutions to the coal
conversion efficiency have been satisfactorily addressed. While much of the large scale
hardware needed is well developed, this particular application is, as for CLC, currently
assessed to be at TRL-1.
[Adanez 2010] argue that the high temperature dependency of the O2 concentration in the
CLOU process makes the thermal integration between fuel reactor and air-reactor a key
aspect in the development of the technology. A drawback of this technology compared to
normal CLC for solid fuels, which uses natural ores as oxygen carriers, is the cost of the
oxygen carrier. This higher cost must be compensated for with a very high carrier lifetime, a
high and stable reactivity, and a high resistance towards ash fouling [Adanez 2012].
6.9.3. Syngas-CLC
[Adanez 2012] describes syngas-CLC as coal gasification with subsequent introduction of the
syngas produced into the CLC system. The benefits of using natural gas as fuel apply to this
process as well. Figure 63 shows the layout of the syngas-CLC process.

127
Figure 63 Schematic layout of the syngas-CLC process [Adanez 2012]
The following two processes are syngas-CLC technologies.
6.9.4. CLC in coal-based IGCC (ICLC-CC)
CLC can be integrated in a coal-based IGCC (ICLC-CC) power plant, instead of the
conventional approach of a WGS reaction with subsequent CO2 capture in a physical
absorption process like Selexol or Rectisol. Figure 62 illustrates the layout of the process,
where cleaned syngas from the gasifier is combusted in a CLC system. The products from the
CLC reactor are separate high-temperature streams of O2-depleted air and flue gas (CO2 and
H2O), which can be used in a combined cycle power plant to generate electricity.
Figure 62 CLC combined cycle power plant using syngas as fuel [Mantripragada 2013]
6.9.4.1. Performance and cost (ICLC-CC)
[Xiang 2008] claims that integrating coal gasification, CLC and gas turbine combined cycle
would have similar efficiencies as a system with conventional IGCC application but no CO2
capture. [Jin 2008] reports an additional gain of 5-10%-points compared to conventional
IGCC with CO2 recovery.

128
[Mantripragada 2013] investigated performance and costs of this ICLC-CC process. The
authors report a CLC system efficiency of 57.7% (based on higher heating value (HHV)) and
an IGCC net efficiency of 38.9% (based on HHV) at a CO2 capture rate of almost 100%.
They found the COE to be ~90 US$/MWh and the plant capital cost to be close to 3040
US$/kW-net, with the CO2 capture part amounting to more than 10% of the costs. Since
ICLC-CC is a new technology, the authors assumed high contingency costs (about 50% of
the direct cost) for the estimation.
The reported efficiency is exceptional as it is close to that of a baseline plant at 39.3% (HHV)
This level of performance is clearly interesting despite the high estimate for the capital costs.
Reasons for this high efficiency are probably related mainly to the fact that all of the mass
flows of pressurised gases, both depleted air and burned fuel, are able to pass through the gas
turbines. The temperatures of the outlets of the reactors and hence the top inlet temperatures
of the turbines is limited to that of the two reactors. The paper suggests that the results are
based on reactor temperatures of 1100°C and that this is anyway limited to maximum 1200°C
because of melting point of suitable oxygen carriers. The paper suggests that the conventional
IGCC process used in comparison was using an inlet temperature for the gas turbine of
around 1350°C. Without doing detailed calculations it is difficult to fully assess the reasons
for such high efficiency when the turbine inlet temperatures are so low. The lower turbine
inlet temperature is expected to reduce overall efficiency by about 2.5%, even if the capture
process consumed no energy, whereas a difference of only 0.4% is reported.
6.9.4.2. Current status, technology readiness level and development requirements
This technology is at the conceptual stage, although it is based on principles that have been
researched. The technology readiness level is assessed as TRL-1.
[Adanez 2012] concludes that the ICLC-CC process remains a challenge due to the use of
interconnected pressurized CFB reactors.
6.9.4.3. Coal-direct chemical looping (CDCL)
Ohio State University (OSU) is developing an iron oxide (Fe2O3)-based syngas chemical
looping process for retrofit on existing coal-fired power plants with support by NETL. The
CDCL system consists of a moving-bed fuel reactor and an entrained-flow combustor and is a
versatile technology that can produce power, syngas or H2, while offering fuel flexibility.
6.9.4.4. Performance and cost (CDLC)
The CDCL process has the potential to meet DOE’s goal of > 90% CO2 capture at no more
than a 35% increase in LCOE. Table 15 and Table 16 show techno-economic performance
figures from an OSU simulation. CDCL increases the first-year COE by 33% compared to
the base plant, whereas an MEA process would lead to a 71% increase [DOE/NETL 2013,
Bayham 2013].

129
Table 15 Aspen Plus modelling results for CDCL process [Bayham 2013]
Table 16 First-year COE for CDCL process [Bayham 2013]
The costs reported give an indication of the potential to reduce the increase in COE.
However, the level of accuracy for the cost estimates for the fluidised bed systems will be
less than for those for baseline facilities using conventional capture. At this stage it would
appear that there is potential to halve the cost increase using this type of process. The
reported plant performance suggests an energy consumption for capture of just 0.52 GJ/tonne
abated.

130
6.9.4.5. Current status, technology readiness level and development requirements
OSU achieved > 800 hours of operation (incl. 200 hours of continuous operation) in 25 kWth
sub-pilot scale with nearly 100% CO2 purity and a steady fuel conversion greater than 95%.
This technology is still at the conceptual stage, although it is based on principles that have
been researched. The technology readiness level is assessed as TRL-1.
The Babcock and Wilcox Power Generation Group, Inc. (B&W) will validate the iron-based
CDCL process and evaluate its potential as a cost-effective CO2 capture technology for
electric power generation [DOE/NETL 2013].
6.9.5. Chemical looping reforming (CLR) for H2 production
Conventional CO2 capture technology integrated with H2 production is available today but
usually only at high cost. The CACHET project [Beavis 2009] aimed to develop innovative
technologies to reduce the cost of CO2 capture whilst simultaneously producing H2. The
project evaluated two reforming technologies: (a) steam reforming integrated with chemical
looping combustion (SR-CLC), and (b) autothermal chemical looping reforming (a-CLR).
The SR-CLC process avoids the need of any CO2 capture step, whereas the a-CLR process
avoids the ASU required in conventional autothermal reforming.
The following section describe SR-CLC and a-CLR in more detail.
6.9.6. Steam reforming (SR-CLC)
[Adanez 2012] describes the SR-CLC process, which avoids the need of any CO2 capture
step from the exhaust gases produced in the heating of the reformer tubes. Figure 65 provides
a scheme of the process. SR-CLC converts steam and hydrocarbons into syngas by
conventional catalytic reforming. The main difference with respect to conventional steam
reforming is that the CLC system provides the heat for the endothermic reforming reactions
and CO2 capture.
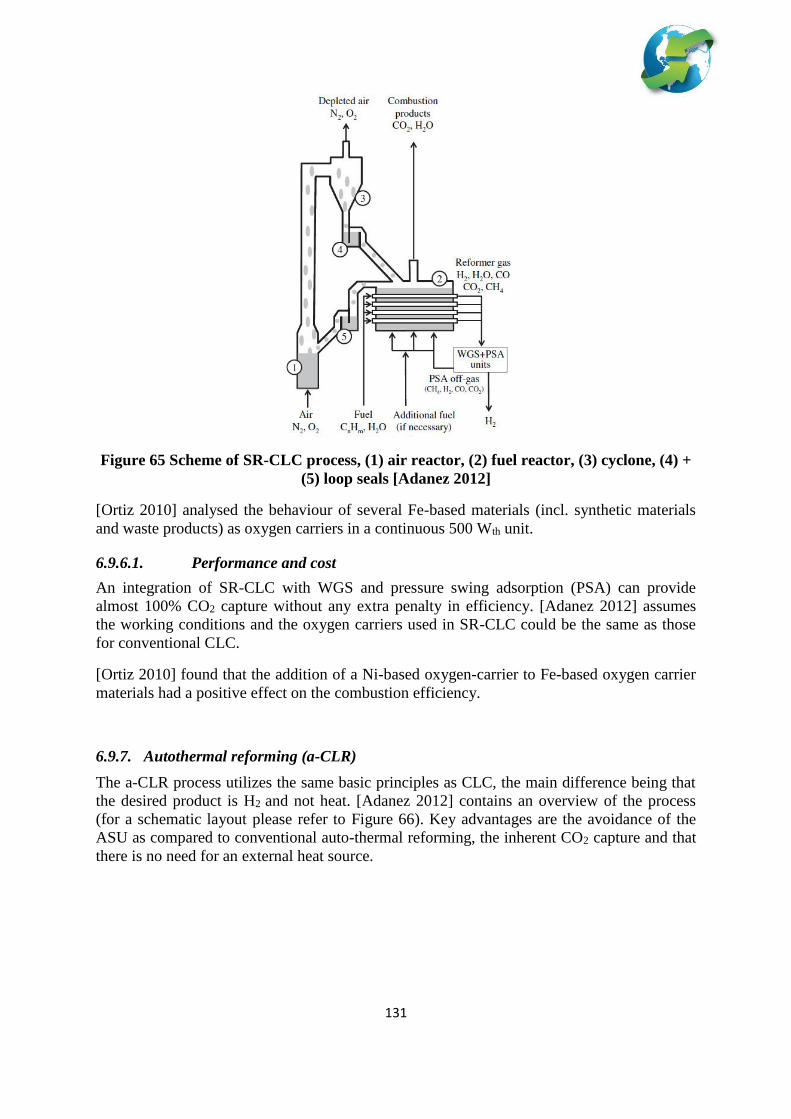
131
Figure 65 Scheme of SR-CLC process, (1) air reactor, (2) fuel reactor, (3) cyclone, (4) +
(5) loop seals [Adanez 2012]
[Ortiz 2010] analysed the behaviour of several Fe-based materials (incl. synthetic materials
and waste products) as oxygen carriers in a continuous 500 Wth unit.
6.9.6.1. Performance and cost
An integration of SR-CLC with WGS and pressure swing adsorption (PSA) can provide
almost 100% CO2 capture without any extra penalty in efficiency. [Adanez 2012] assumes
the working conditions and the oxygen carriers used in SR-CLC could be the same as those
for conventional CLC.
[Ortiz 2010] found that the addition of a Ni-based oxygen-carrier to Fe-based oxygen carrier
materials had a positive effect on the combustion efficiency.
6.9.7. Autothermal reforming (a-CLR)
The a-CLR process utilizes the same basic principles as CLC, the main difference being that
the desired product is H2 and not heat. [Adanez 2012] contains an overview of the process
(for a schematic layout please refer to Figure 66). Key advantages are the avoidance of the
ASU as compared to conventional auto-thermal reforming, the inherent CO2 capture and that
there is no need for an external heat source.

132
Figure 66 Scheme of a-CLR process, (1) air reactor, (2) fuel reactor, (3) cyclone, (4) +
(5) loop seals [Adanez 2012]
[Pröll 2010] demonstrated the a-CLR process in a 140 kWth dual CFB installation.
6.9.7.1. Performance and cost
[Ortiz 2011] reports that the H2 yield in this process can reach 2.7 molH2/molCH4. [Ortiz
2010] studied the performance of a pressurized a-CLR system and observed high CH4
conversion (> 98%). The oxygen carriers did not show any agglomeration or defluidisation
problems and attrition was negligible.
[Ryden 2008] concluded that pressurized CLR has the potential to achieve efficiencies about
5% higher because pressurized systems reduce the energy penalty for H2 compression.
6.9.7.2. Current tatus, technology readiness level and development requirements
The reforming processes proposed above differ only in that one uses CLC simply as a heat
source whilst the other uses the oxygen carrier to provide oxygen to a partial oxidation
reaction. The former has much more complex equipment requirements in particular the
engineering of the reformer tubes inside the fuel reactor. Thus the indirect heated approach is
at the stage of an initial concept. The technology readiness level is assessed as TRL-1. The
direct process does not require such complex engineering as it is based on a coupled CFB
system which has been tested in numerous similar applications. A single test has been
performed and more extensive work would be needed to validate the process. The technology
readiness level is assessed as TRL-3.

133
As pressurized CFB operation is not yet a standard technology, more research and
development effort will be necessary. A key issue for the CLR technology development is the
selection of an oxygen carrier with suitable properties [Adanez 2012]:
Enough reactivity through cycles to reduce solids inventory
High resistance to attrition to minimize losses of elutriated solids
Complete fuel conversion to CO and H2
Negligible carbon deposition, as this would release CO2 in the air-reactor
Good fluidization properties (no presence of agglomeration)
Oxygen carrier with simple preparation method to reduce costs
6.10. Limestone chemical looping (LCL): a hybrid process
Alstom is developing a hybrid combustion-gasification chemical looping process that uses
CaSO4 as oxygen carrier. Figure 67 shows the principle of the process that couples a
CaCO3/CaO cycle with a CaSO4/CaS cycle. The process has three options, i.e. it can produce
heat, syngas or H2 [Abdullaly 2012]:
1) Chemical looping combustion: product gas is CO2, heat produces steam for power
2) Chemical looping gasification: product gas is syngas, no inherent CO2 capture
3) Hydrogen production: product gas is H2, calciner off-gas is CO2
According to [Adanez 2012], a drawback for the use of CaSO4 is the possible formation of
CaO and SO2. CaO can eliminate the oxygen transport capacity of CaSO4, thus requiring the
addition of fresh carrier. To minimise sulphur release (either as SO2 or H2S), Alstom’s
process works at temperatures below 980°C in the fuel reactor.
Figure 67 Alstom's LCL process [Abdullaly 2012]

134
6.10.1. Performance and cost
[Marion 2013] presents performance and economic data for the LCL process compared to
conventional oxy-combustion. The CO2 capture cost was 79.3 US$/tCO2 for the oxy-
combustion case and 27.0 US$/tCO2 for the LCL case. [Marion 2013] concluded that LCL
has the potential to be one of the lowest cost technologies for CCS in coal-fired systems.
Recently updated information released by Alstom [Alstom 2014] confirms this cost as shown
in the table below.
Table 17 LCL performance and costs [Alstom 2014]
These figures suggest that the LCOE will increase by just under 20% compared to baseline
post-combustion. This compares with assessments for post- and oxy-combustion baselines
with capture of 100% and 80% increases in LCOE. This represents a very large claimed
reduction. That said it has to be realised that full calibration of estimates requires detailed
work using a consistent set of parameters.
6.10.2. Current status, technology readiness level and development requirements
Alstom scaled-up the LCL process from a 65 kWth pilot, which was successfully
demonstrated in an earlier project (DOE project NT41866), to a 3 MWth prototype facility
that was operational in 2010 and 2011 (DOE project DE-NT0005286). Alstom was able to
operate the 3 MWth prototype for 12 hours under autothermal conditions, using only coal as
fuel and achieving 96% capture of CO2 [DOE/NETL 2013, Marion 2013]. The 3 MWth unit is
currently undergoing modifications prior to a further testing programme. All tests so far have
been in two reactor configuration for CLC.
The LCL technology has been tested in two reactor configuration with encouraging initial test
results. The testing is due to resume in a modified equipment. The basic concept of the two
coupled reactors has been successfully demonstrated in other locations and the main
difference in Alstom’s process is the different oxygen carrier. The performance and stability
of this are critical to successful development. The next phase of testing is aimed at resolving
a number of issues identified so far, which, if successful, will raise the readiness level. The
technology readiness level is assessed as TRL-4.
In addition, the formation of CaO and SO2 need further investigation and clarification
135
7. CCS Development in Non-Power Industries
Non-power energy intensive industries are in general not very keen on immediate deployment
of CCS due to its impact on their market competitiveness but several of these industries have
investigated what are the options available to them to capture the CO2 emissions from their
plants. This report will only review the technologies currently evaluated by the different
energy intensive industries and highlight the different directions taken in developing CCS in
their industries.
7.1. Iron and Steel Industry
Steel is produced either from virgin ore or from scrap. Currently, there are three leading
groups of technologies that produce steel from virgin ore. These include: (a.) Blast Furnace –
Basic Oxygen Furnace (BF-BOF) route, (b.) Smelting Reduction – Basic Oxygen Furnace
(SR-BOF) route, and (c.) Direct Reduction – Electric Arc Furnace (DRI-EAF) route.
Some of the key features of an integrated steel mill via the BF-BOF route are:
CO2 is emitted from various point sources within the site. Nearly 90% of the CO2 is
emitted from the operation of the coke production, sinter production, lime kilns, BF’s
hot stoves, on-site power plant and finishing mills.
CO2 emissions profiles vary from site to site.
Most of the CO2 emitted is from the combustion of the by-product fuel gas derived
from the blast furnace, coke ovens and basic oxygen furnace.
For the steel production via the BF-BOF route, the hot metal production (i.e. iron making
process / blast furnaces) is the most carbon intensive process. This is responsible for up to 80-
90% of the CO2 emissions of the whole steel mill. However, the direct CO2 emission
attributed to this process is only ~20-25% of the total emissions (i.e. predominantly the CO2
emitted from the flue gases of the hot stoves). The other CO2 is emitted in other processes by
burning of the blast furnace gas as fuel.
The global steel industry has been very active in developing CCS in the past decade. There
are three major RD&D programmes on-going in Europe, Japan and South Korea. The focus
of their work is the capture of CO2 from the blast furnace gas.
It should be noted that the steel industry has concluded that the capture of CO2 from various
flue gases within their sites is not economically viable. They have concluded that to deploy
CCS within their industry will require new development in the iron making process that
would also increase efficiency.

136
ULCOS Programme (Europe)
The ULCOS Programme [van der Stel, 2013a; Meijer and Zeilstra, 2011; Silkström, 2013;
Birat, 2010; 2012] is Europe’s leading programme in development of breakthrough
technologies for the steel industry. Three out of the four technologies they have shortlisted
would require CCS to reduce CO2 emissions intensity by greater than 50% - these include:
ULCOS BF – Oxygen Blown BF with Top Gas Recycle
HISARNA
ULCORED
a.) ULCOS BF
ULCOS BF or Oxygen-Blown BF with Top Gas Recycle [van der Stel, 2013a ; Birat, 2010]
is a revamped version of the conventional blast furnace. CO2 is separated from the top gas
before it is recycled back into the blast furnace; whilst the captured CO2 could be transported
and stored. ULCOS has evaluated various technologies that could separate CO2 from the top
gas and these include:
Pressure Swing Adsorption (PSA)
Vacuum Pressure Swing Adsorption (VPSA)
PSA or VPSA in combination with cryogenic separation
Chemical Absorption
Component development for the ULCOS BF, i.e. tuyeres technology (gas injection), process
gas heaters, etc. are currently being pursued. The future direction in the development of the
ULCOS BF is to validate the coke reduction potential introduced by the top gas recycle. This
could only be achieved in large scale demonstration plant.
b.) HISARNA
HISARNA [van der Stel, 2013a; Meijer and Zeilstra, 2011] is one of the smelting reduction
technologies for hot metal production. This is a combination of three different technologies
that include the cyclone converter furnace (CCF), HISMELT and screw feeder / coal
pyrolysis.
The main driver of the HISARNA’s development is the reward of reducing CO2 emissions by
eliminating the coke and sinter production processes. Without CO2 capture, the HISARNA
process could potentially achieve a reduction of at least 25% of the total emissions as
compared to the best performing integrated steel mill using BF/BOF route. With CCS, this
could achieve up to 80% CO2 emissions reduction of the steel production.
Currently, the HISARNA is being tested in a pilot scale. Further tests will be needed to
validate its reliability and engineering design for scale up. HISARNA technology is
considered a high risk and high reward option for ULCOS. The future direction of this
development would require demonstration of a scaled-up version of the HISARNA process;
and ultimately to achieve a production capacity of at least 2 million tonnes of hot metal
annually in order to compete against the economics of steel production based on the BF/BOF
route.
137
c.) ULCORED
ULCORED [Knop et al, 2008; Silkström, 2013] is the development of a shaft based ore
reduction process using H2 rich syngas to produce DRI, and at the same time capturing
greater than 50% of the CO2 emitted from the process. Development of this technology
includes both gas and coal based DRI production.
The production of the DRI using gas-based ULCORED involves a shaft reactor fed with
lump ore or pellets and uses nearly pure oxygen to burn pre-heated fuel in a partial oxidation
reactor (POX) to produce the H2 rich syngas as the primary reducing gas. The process
involves the use of a shift reactor to convert at least 90% of the CO in the cleaned off-gas
from the shaft reactor to produce H2 and CO2. The CO2 is then separated using VPSA or
PSA. Most of the top gas from the PSA or VPSA is used as cooling medium of the DRI. This
is generally mixed with natural gas to make up the fuel demand of the POX reactor. Some
part of the top gas will be preheated in the shift reactor and mixed with the syngas produced
by the POX. Finally, a minor part of the gas could be exported to the steelworks as by-
product fuel to bleed out the nitrogen content.
The coal based DRI involves the use of coal gasification with water shift reactor. The H2 rich
syngas is then used as the primary reducing agent to the shaft reactor. CO2 separation
technologies for this process could be different to the gas based ULCORED (i.e. options for
physical absorption are possible).
Some of the current development and key challenges of ULCORED are:
Nearly every major component of the gas-based DRI reactor is in commercial
operation (shaft reactor, shift reactor, PSA/VPSA and POX). However, integrating
these components to produce the DRI and capture the CO2 at the same time would
require large scale demonstration to test its availability, reliability and the quality of
its products (DRI and CO2).
Development of the pilot plant is an important element of the demonstration of
ULCORED. This should provide the opportunity to establish and validate the
different technical and economic parameters in the integration of the different
components of ULCORED.
To reduce investment cost, the scaling up of all the components could be an important
element of consideration in the engineering of the ULCORED. For example, the
largest POX reactor currently operating today using NG is producing ~200,000 Nm3/h
of syngas (plant operated by Linde). This means that at least two trains of POX
reactor are necessary to meet the demand of a single train shaft reactor at today’s
capacity that could produce in the range of 2.0 to 2.5 Mt/y of DRI.
Like any DRI usage in steel production, the major source of indirect CO2 emissions is
the electricity consumption during the melting of the DRI in the EAF. An additional
feature of the development of the ULCORED process is the deployment of COMELT
technology (an EAF using DC power) developed by Siemens VAI which improves
the electricity consumption of melting DRI.

138
COURSE50 Programme (Japan)
The COURSE50 programme [Osame, 2011; Watakabe, 2013; JISF, 2013] is a consortium of
Japanese steel and allied industries funded by NEDO with an objective to evaluate options to
reduce GHG emissions from steel production.
The different technology options evaluated under COURSE50 include the following:
Technologies that reduces CO2 emissions from the blast furnace (i.e. technologies that
reduce coke consumption of the BF)
o Development of hydrogen injection technology to the BF and relevant control
systems
o Development of pre-reduction shaft reactor using hydrogen as the primary
reducing agent and introduction of pre-reduced ore into the BF
o Utilisation of CO rich gas from the CO2 capture plant as a reductant for the BF
and Pre-reduction shaft reactor.
Technologies for CO2 capture and storage (i.e. technologies that capture CO2 from the
BFG)
o Development of chemical absorption technology
o Development of physical adsorption technology
Technologies that support COURSE50 Technologies
o Improvement to coke ovens to produce coke that is optimum for hydrogen
injection
o Development of COG reformer to increase its hydrogen content (H2
amplification)
o Development of sensible heat recovery from steelmaking slag
o Development of Kalina cycle power generation technology
o Utilization of Phase Change Materials or PCM
o Utilization of heat pumps
The future direction of the current development will be initially aimed at validating
performance of each component and this should be followed by combining all technology
development into a large scale demonstration.
a.) Technologies that reduce CO2 emissions from the blast furnace
The cornerstone of this development is to enable the use of H2 or H2-rich gas as reducing
agent in the blast furnace that could result in coke reduction. Key to this development
includes (but is not limited to):
Identification of the feed conditions of the pre-heated H2/H2-rich gas
Quantification of the reducibility of the iron ore when using H2/H2-rich gas
Combustion simulation at the tuyere raceway with high H2/H2-rich gas level
Evaluation of the balances of the energy and CO2 of the entire steel works
To support this development would require the development of high strength coke to
maximise coke reduction when feeding with H2/H2 rich gas. This involves the development
of high performance caking (HPC) additives. The role of the HPC involves the lowering of
the softening and melting temperature of coking coal thus allowing these additives to fill in
the pores within the coke resulting in increased coke strength index.
139
b.) CO2 capture by Chemical Absorption or Physical Adsorption
The Japanese programme concluded that CCS is required to achieve drastic reduction of CO2
emissions from steel production. In this area, chemical absorption [Watakabe, 2013; Osame,
2011] and physical adsorption [Saima et al, 2013; Osame, 2011] technologies are the main
focus of development to capture CO2 from blast furnace gas. Currently, pilot plants for both
technologies have been demonstrated.
The chemical absorption technology involves the development of proprietary solvent to
achieve better performance (i.e. heat of regeneration of 2 GJ/t CO2 or better) for CO2 capture
ready for the large scale demonstration plant. The work involves the evaluation of the solvent
properties using CAT-1 pilot plant, and the improvement of the chemical absorption process
using the CAT-30 pilot plant.
The physical adsorption technology involves the use of PSA separating the CO2 and CO/H2
from the blast furnace gas in two stages. This involves the use of adsorbent based on
zeolites. Their test aims to evaluate the performance of the adsorbent to achieve at least 80%
recovery and 90% CO2 purity.
To support the development of the CO2 capture technologies, the programme also pursued the
development of recovering unused waste heat from the steel mill. One of the primary
candidates of this development is the recovery of heat from BF and BOF slag.
POSCO / RIST Programme (South Korea)
Development of CCS technology for the steel industry in South Korea is supported by the
Korean Ministry of Knowledge with some contribution from the private sector. The main
scope of work includes [Lee, 2013; Ahn, 2011]:
Capture of CO2 from the BFG.
Recovery and utilisation of waste heat within the steelworks
Utilisation of CO2 and CO for other industrial users
The POSCO / RIST Programme has evaluated the use of aqueous ammonia (10%) process to
remove the CO2 from the BFG. The recovery and utilisation of waste heat is based on
development of technology to recover heat from BF slag; whilst the CO2 utilisation
technology is based on reformation of COG to produce CO and H2 to be recycled back into
the blast furnace.
a.) Development of CO2 Capture Technology Using Aqueous Ammonia Solution
The capture of CO2 using aqueous ammonia process is based on chemical absorption process
using 3 columns – absorber, stripper and NH3 concentrator. They have tested this process in
a pilot plant handling 1000 Nm3/h BFG and have achieved >90% capture rate with CO2
purity between 95-98% (v/v wet basis). It was reported that at 9% aqueous ammonia solution,
the steam consumption for solvent regeneration is ~1.5 kg of steam/t CO2 (i.e. energy
consumption of ~3.0 GJ/t CO2). The ammonia slip is considered minimal.

140
The future direction of research will involve the improvement of the chemical absorption
process (i.e. use of additional lean NH3 pumps for intermediate cooling) and the use of higher
ammonia concentration. Future work is aimed at testing long term continuous operation to
validate process reliability and basic engineering design for commercial scale demonstration.
b.) Development of Waste Heat Recovery Technology from BF Slag
The development of this technology under the South Korean programme has a similar
direction to the Japanese Course50 programme. The basic aims of this development are the
development of the dry granulation and fast cooling of BF slag to recover waste heat. The
conceptual design of the process involves at least a heat recovery of 50% from the molten
slag and a production unit with a capacity of 180 t BF slag/h.
c.) CO2 Utilisation Technology
The utilisation of CO2 within the steel mill is the primary driver for this technology
development that will consequently reduce the CO2 to be transported and stored or resolve
the lack of CO2 storage capacity in South Korea.
The main objective of this research area is to make use of the captured CO2 as the reagent to
reform the coke oven gas to produce CO/H2 syngas. This syngas could be used as additional
reductant in the blast furnace or the Finex process.
The future direction of this work is aimed at:
Development of highly coking-resistant catalyst for the COG reforming
Optimization of reaction condition, heat integration, and scale-up of the reactor
7.2. Cement Industry
Cement is a blend of clinkers and other cementitious materials. Clinkers are produced by
heating limestone (calcium carbonate) with small quantities of other materials (such as clay)
to 1450°C in a kiln. CO2 emitted from the kiln is derived from the burning of fuel and from
the decomposition of calcium carbonate (calcination process).
Currently, the cement industry has exploited to a great extent the reduction of CO2 emissions
by efficiency improvement, use of alternative fuel, and use of clinker substitutes. It has been
recognised within the industry that to reduce drastically the CO2 emissions, CCS would be
required. Key stakeholders have identified the need to do pilot tests of CO2 capture
technologies to demonstrate and validate key technical viability as one of the requirements to
enable CCS deployment in the future.
This section of the report provides a summary of the current CCS activities undertaken by the
cement industry.
Post combustion capture and oxyfuel combustion are the CO2 capture technologies which are
most compatible with cement plants [IEAGHG, 2008, 2013]. Pre-combustion capture is at a
disadvantage because it would not capture the CO2 produced by mineral decomposition.
Additionally, the use of gaseous fuel could also penalise the productivity of the cement kiln.

141
Table 18 shows the current status of the CO2 capture technologies considered and their
impact to the cement plant.
Table 18: Current status of Post- & Oxyfuel Combustion Technologies Applied to
Cement Industry [Adapted from IEAGHG 2013]
Oxyfuel Combustion Post-Combustion CO2 Capture
(Solvent scrubbing)
Concept Integrated concept End of Pipe Technology
Development
Status
Oxygen enrichment has been
applied to cement kiln
Oxyfuel combustion will require
some R&D
Commercially available and
applied in other industry
Pilot testing applied to cement kiln
initiated
Time Horizon
for Commercial
Application
Not before 2025 Not before 2020
CO2 purity
CO2 in the flue gas from
combustion is ~85% (v/v dry
basis) and purified in the CO2
purification unit (CPU)
Development of the CPU
technologies in oxyfuel
combustion for coal fired power
plant should be adaptable
Delivered as high purity CO2 (i.e.
90-99% v/v dry basis)
Applicability to
Existing Plant
Retrofit is feasible and will require
modification to the existing plant
Space requirement for the ASU &
CPU
Existing plant structure has to
allow for oxyfuel combustion
technology infrastructure
Retrofitting is possible without
redesigning of the kiln
High space requirement for
capture plant and power
generation
Energy
Requirement
High electricity demand for ASU
and CPU resulting in doubling of
power demand per tonne of clinker
produced.
Thermal energy demand could be
reduced
High energy consumption for
solvent regeneration resulting in
doubling of electrical and thermal
demand per tonne of clinker
produced.
CO2 Avoidance
Cost 40 – 50€ / t CO2. 65 -110€ / t CO2

142
Other technologies have been also considered. These include the following:
Calcium looping
Membranes
Adsorption Technologies
Some of these technologies have pilot plants built and validation tests on-going. Most of
these technologies is expected to have similar development pathways to technologies applied
to the power generation industry.
Below is the list of post-combustion capture pilot facilities applied to the cement industry
worldwide:
Norcem, Brevik, Norway: Test centre offering the possibility to conduct several small
scale or pilot trials of post combustion capture using cement plant flue gas (2013-
2017). Companies involved in this project include Aker Solutions (amine scrubbing),
RTI (dry adsorption with specialized polymers), KEMA, Yodfat and NTNU
(membranes) and Alstom (calcium looing).
ITRI/Taiwan Cement Corp.: Pilot plant capturing 1 tonne CO2/h from a cement plant
and a power plant using a calcium looping process, commissioned June 2013.
Skyonic Corp.: Plant under construction, capable of capturing 83,000t CO2/y from a
cement plant in Texas, using the “SkyMine” process. In this process salt and water are
electrolyzed to produce hydrogen and chlorine gases and sodium hydroxide solution,
which is reacted with CO2 in flue gas to produce sodium bicarbonate, which can be
sold on the market. Other combinations of chemicals can also be produced
A pilot plant trial of oxy-combustion in a cement plant calciner with a capacity of 2-3t/h of
feedstock has been undertaken by FLSmidth, Air Liquide and Lafarge at Dania, Denmark
[Gimenez, 2014]
In the near term, the direction of the RD&D will focus on deploying pilot scale facilities to
validate the technical viability of CO2 capture technologies applied to the cement industry.
This is an important step necessary toward large scale demonstration.
7.3. Oil Refining
Oil refining is the processing of crude oil to produce petroleum products such as LPG,
naphtha, gasoline, kerosene, diesel, gas oil and bottom products (bunker fuel, bitumen, etc.).
Refineries are complex sites that are highly integrated and characterised by diverse process
configurations. CO2 emissions vary from site to site depending on refinery complexity and
fuel types used. Figure 68 shows an example illustrating the breakdown of CO2 emissions by
process from a hydroskimming (simple) refinery and a more complex conversion refinery.
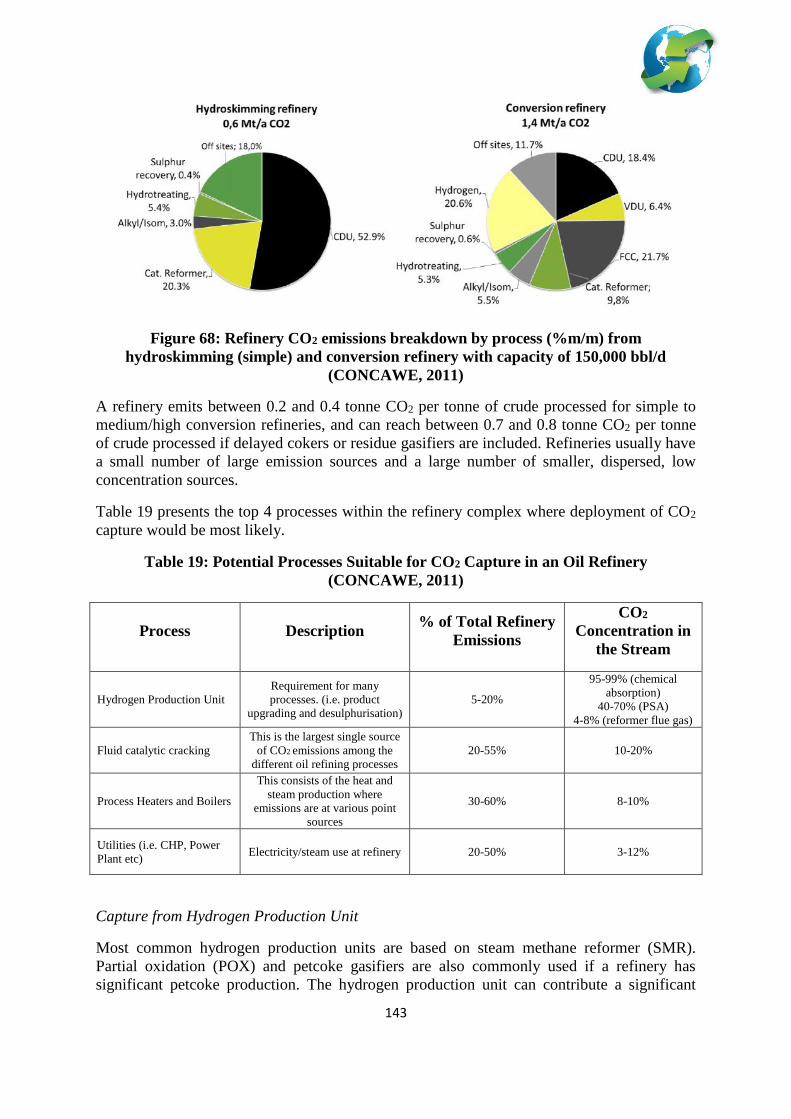
143
Figure 68: Refinery CO2 emissions breakdown by process (%m/m) from
hydroskimming (simple) and conversion refinery with capacity of 150,000 bbl/d
(CONCAWE, 2011)
A refinery emits between 0.2 and 0.4 tonne CO2 per tonne of crude processed for simple to
medium/high conversion refineries, and can reach between 0.7 and 0.8 tonne CO2 per tonne
of crude processed if delayed cokers or residue gasifiers are included. Refineries usually have
a small number of large emission sources and a large number of smaller, dispersed, low
concentration sources.
Table 19 presents the top 4 processes within the refinery complex where deployment of CO2
capture would be most likely.
Table 19: Potential Processes Suitable for CO2 Capture in an Oil Refinery
(CONCAWE, 2011)
Process Description % of Total Refinery
Emissions
CO2
Concentration in
the Stream
Hydrogen Production Unit
Requirement for many
processes. (i.e. product
upgrading and desulphurisation)
5-20%
95-99% (chemical
absorption)
40-70% (PSA)
4-8% (reformer flue gas)
Fluid catalytic cracking
This is the largest single source
of CO2 emissions among the
different oil refining processes
20-55% 10-20%
Process Heaters and Boilers
This consists of the heat and
steam production where
emissions are at various point
sources
30-60% 8-10%
Utilities (i.e. CHP, Power
Plant etc) Electricity/steam use at refinery 20-50% 3-12%
Capture from Hydrogen Production Unit
Most common hydrogen production units are based on steam methane reformer (SMR).
Partial oxidation (POX) and petcoke gasifiers are also commonly used if a refinery has
significant petcoke production. The hydrogen production unit can contribute a significant

144
proportion of the overall CO2 footprint of many refineries and is a major single-point CO2
emission source. Typically, the vent from SMR hydrogen production has a high CO2 partial
pressure.
Foster Wheeler [Ferguson and Stockle, 2012] has reviewed 4 different technology options for
CO2 capture in SMR for different overall CO2 capture ratios. This includes the use of PSA,
post-combustion capture, non-PSA pre-combustion capture and hybrid post- and pre-
combustion capture option.
The capture of CO2 from the hydrogen production unit can be considered a low hanging fruit
for CCS demonstration applied to the oil refining sector. Three leading large scale CCS demo
projects in the world (i.e. Port Arthur Project – USA; Quest Project – Canada; and
Tomakomai Project - Japan) are hydrogen production unit based on SMR technology. Port
Arthur and Tomakomai Projects are directly connected to oil refineries; and the Quest Project
is connected to an oil sand upgrader.
Capture from Fluid Catalytic Cracker (FCC)
The fluid catalytic cracker (FCC) is often the single largest source of CO2 among the
different oil refining processes. The emissions from FCCs are process related rather than
combustion related, and associated with the regeneration of a catalyst used in the process.
Depending on the process selection and quality of feedstock, the CO2 concentration in the
flue gas can range from 10% to 20%.
The use of post-combustion technology, such as amine or chilled ammonia CO2 capture, has
been evaluated at Test Centre Mongstad. Emerging technologies such as oxyfiring of the
FCC is also currently being evaluated at a pilot plant by Petrobras in Brazil [Mello et. al.,
2009].
Capture of CO2 from Process Heaters, Boilers and Utilities
Refineries employ numerous fired heaters (or process heaters) of different sizes and capacity
throughout the facility. These heaters could have capacities ranging between 2 to 250MW,
and a typical refinery could have between 20 and 30 different inter-connected processes
around the site. Most often, these process heaters use different types of fuel that are available
on-site thus producing flue gas with wide ranging CO2 compositions. However, it should be
noted that it is not unusual for some of these emission sources to be connected to a common
stack. Combined stacks can have CO2 concentrations as high as 15%, emitting up to 1.2
Mt/CO2 per year.
Emissions from the utilities of oil refineries are typically related to the emissions of the
captive power plants, CHPs or boilers. Refineries require a large amount of steam and
electricity to meet the energy demand of the different processes. Steam is provided on site
either by boilers or CHPs. In order to increase efficiency, most refineries nowadays use
cogeneration of heat and power. In some cases, natural gas is used as fuel for the industrial
gas turbines producing electricity, while waste heat is recovered and utilised to produce
steam.
These processes closely mirror those used in the power generation sector, which therefore
implies that opportunities for applying CO2 capture technologies in the utilities and boilers of
the refineries will follow the CO2 capture technology development of the power generation
sector. Several works has been reported evaluating the use of post-, pre- and oxyfuel capture

145
technologies [CO2 capture project – CCP; van Straelen et. al. 2010; Jamaluddin et. al., 2012;
Weydahl, et. al., 2013].
Future Direction of CO2 Capture Deployment in an Integrated Oil Refinery
It is expected that there will be a varying degree of deployment of CCS applied to integrated
oil refineries over time.
CO2 capture technologies being developed include but are not limited to:
Post-Combustion with CO2 Capture
Oxyfuel Combustion with CO2 Capture
Pre-Combustion with CO2 Capture.
Other technologies such chemical looping, physical adsorption and membranes are also being
considered.
CCS applied to hydrogen production units are currently demonstrated in larger scale at
various sites worldwide. This is considered as the lowest cost among all the possibilities
within an integrated oil refinery.
Development of CO2 Capture for process heaters, boilers, and utilities is expected to follow
the pathway of development of CO2 capture in the power generation sector.
A pilot plant of Oxy-FCC has been evaluated and test is currently on-going. Basic
engineering and scale up of the process will be necessary to move this forward to
demonstration.
8. Conclusions
This study has collected together a considerable body of information on emerging capture
technologies and has critically examined the claims for improved performance. It has resulted
in identification of a number of promising new capture technologies. It has also provided
insights into the cost and thermodynamic limitations which apply to many of the CO2 capture
processes and has identified those target areas likely to yield the greatest cost improvements.
An extensive list of references has been generated, although those which are listed in the
report represent only some of those which are available in the literature. These prime
references provide a good lead to this more extensive information.
The study has highlighted difficulties and pitfalls that exist when attempting to make cost
comparisons between diverse technologies. It proposes a procedure which might be
developed to simplify cost estimation for comparative purposes making use of information
generated by some of the excellent and detailed cost studies of benchmark capture processes.
A number of other key findings are listed below.
Costs of CO2 capture technologies are expected to decrease after they have become
established at a commercial scale, due to learning-by-doing and incremental
technology improvements, although costs of new technologies tend to increase during
the development phase
146
Further reductions in the costs of CO2 capture may be achieved by use of new
technologies. Estimating the cost reductions that could be achieved by new
technologies is subject to large uncertainties. Assessing costs of capture technologies
that are at a very early stage of development is especially difficult, so qualitative
assessments and assessments of potential energy efficiency improvements are often
more appropriate.
A wide range of technologies are being developed for post-combustion capture,
including two-phase solvents, adsorption, membranes and cryogenic separation. Some
of these technologies offer relatively modest cost reductions and others offer the
prospect of more substantial reductions. Claims of the potential for cost reduction and
energy consumption reduction found in the literature may be overoptimistic and some
new technologies may struggle to compete with those that are already established.
For plants with pre-combustion capture the cost of the CO2 separation stage is
substantially lower than for post-combustion capture. Technologies are being
developed that offer the prospect of substantial cost reductions by reducing not only
the cost of CO2 separation but also the costs of other process units in pre-combustion
capture plants such as shift conversion, CO2 compression and power generation.
The combination of pre-combustion capture with advanced solid oxide fuel cells has
very high potential for cost reduction but faces significant development hurdles.
The opportunities for significant cost reductions from the use of new technologies in
coal-based oxy-combustion are limited, with the possible exception of alternative
oxygen production technologies such as high temperature membranes.
Gas-fired oxy-combustion processes which involve the use of new turbine cycles are
at various stages of development. Some of these new cycles, particularly those that
are at an early stage of development, may have the potential for substantial
improvements in efficiency and costs compared to conventional post-combustion
capture. However, oxy-combustion of gas is relatively inefficient as half of the
oxygen required is converted to steam and does not directly contribute to the
separation of CO2.
Various solid looping technologies that provide CO2 capture are being developed.
These technologies are at a relatively early stage of development and are subject to
uncertainties but they have the potential to be one of the lowest cost technologies for
capture at coal-fired power plants. Chemical looping combustion of coal has the best
potential but application of this same technology to gas-fired power production does
not compete with gas turbine based power generation.
Industrial plants will in most cases employ capture technologies that are similar to
those being developed for power plants, although the gas compositions and operating
conditions will be different in some cases. Some new technologies that capture CO2
which are specific to the steel industry are being developed.
Adding CO2 capture to a power plant causes a substantial increase in the LCOE which for the
current generation of coal based capture processes is of the order of 80 to 100%. The
potential for lowering this increase in LCOE has been critically assessed to produce
numerical estimates of how much this increase might be reduced. By choosing this metric the

147
benchmark costs of the plants without capture are eliminated from the comparison which is
focussed solely on the extra costs of electricity resulting from operation of the capture
process. In earlier drafts estimates of the reduction in total LCOE were summarised on the
basis of the information found in the literature and quoted in this report. However, in some
cases the claims appear to be overoptimistic and in others rather conservative. Figure 69
below illustrates the potential of the leading technologies but excludes any figures for
systems based on solid looping. For both CaL and CLC large potential reductions have been
claimed and seem achievable, but these early projections do need to be backed up by more
detailed engineering cost estimates.
Figure 69 Potential of key technologies for LCOE reduction
The main indicator which has been used for assessing the potential of the various emerging
technologies is the percentage increase in the LCOE. Nevertheless there is great interest in
the cost per tonne of CO2 abated as a measure because of the linkage to what is seen as the
main financial driver, i.e. the cost of CO2 emission certificates in the emerging emission
trading systems. The cost per tonne is closely linked to the LCOE percentage increase but for
a more complete calculation also the power plant efficiency change, fuel carbon content and a
baseline electricity price need to be known. There is a strong relationship between the
specific energy demand for capture and the cost per tonne abated as the specific energy
determines the efficiency reduction.
Some costs of capture have been extracted from the literature and are mentioned in the report.
However, in making an assessment of the potential for cost reductions, these have not been
used as they did not always align with those based on considerations of the likely efficiencies,

148
thermodynamics and equipment cost structures of the processes. It is also apparent that
assumptions on inflation rates and discount rates vary between authors leading to cost
estimates which cannot be directly compared.

149
9. List of abbreviations
Abbreviation Description
2DS UN climate scenario in which rise is limited to 2°C
4DS UN climate scenario in which rise is limited to 4°C
a-CLR Autothermal Chemical Looping Reforming
AMP 2-Amino-2-methyl-1-propanol
ARPA-E Advanced Research Project Agency-Energy
ASU Air Separation Unit
AZEP Advanced Zero Emission Power (Process)
BF Blast Furnace
BFG Blast Furnace Gas
bioCCS CCS applied to processes burning or using biomass
BOC British Oxygen Company (now part of Linde)
BOF Basic Oxygen Furnace
CA II Carbonic Anhydrase 2
CaL Calcium Carbonate Looping
CAP Chilled Ammonia Process – (of Alstom)
CAPEX Capital Expenditure
CARS Ceramic Auto-thermal Recovery System
CCP Carbon Dioxide Capture Project (Industry lead consortium)
CCS Carbon Dioxide Capture and Storage
CDLC Coal Direct Chemical Looping
CEPCI Chemical Engineering Plant Cost Index
CES Clean Energy Systems (US company)
CFB Circulating Fluidised bed
CFD Computational Fluid Dynamics
CHP Combined Heat and Power
CIUDEN Ciudad de la Energía (Spanish energy research organization)
CLC Chemical Looping Combustion
CLEA Cross-Linked Enzyme Aggregate
CLG Chemical Looping Gasification
CLOU Chemical Looping with Oxygen Uncoupling
CLP Calcium Looping Process
CLR Chemical Looping Reforming
CMS Carbon Molecular Sieve
CO2CRC Australian - Cooperative Research Centre for Greenhouse Gas Technologies
COG Coke Oven Gas
COH Cost of Hydrogen
COMELT A DC electric arc based steel making process
CPU CO2 Processing Unit (in oxy-combustion process)
CSIC Consejo Superior de Investigaciones Científicas (Spain)
CSIRO Australian - Commonwealth Scientific and Industrial Research Organisation
CSTR Continuous Stirred Tank Reactor
CU Colorado University
CW Cooling Water

150
DECAB A process based on precipitating amino acid salts
DECC UK Department of Energy and Climate Change
DMX-1 A 2-phase liquid capture process of IFP Energies Nouvelles
DOE (US) Department of Energy
DR (DRI) Direct Reduction (Direct Reduction of Iron)
EAF Electric Arc Furnace
EBT European Benchmarking Task
Econamine A proprietary process using MEA based solvent licensed by Fluor
ECRA European Cement Research Academy
EDA Ethylene Diamine
EERC Energy and Environmental Research Centre
EMAR Electro-chemically Mediated Amine Regeneration
ENDEX Coupled Endo/Exo thermic processes
EPRI Electric Power Research Institute
ESA Electric Swing Adsorption
EU European Union
FCC Fluidised Catalytic Cracking
FEED Front End Engineering Design
FGC Flue Gas Cooler
FGD Flue Gas Desulphurisation
FTIR Fourier Transform Infrared spectroscopy
GEA IEA’s Global Energy Assessment
GT Gas Turbine
HHV Higher Heating Value
HISARNA Advanced Steel process combining HIsmelt and Isarna
HIsmelt An iron making technology of Rio Tinto
HPC High Performance Caking
HRSG Heat Recovery Steam Generator
HSE Health Safety and Environment
ICES Inertial CO2 Extraction System
ICLC-CC Integrated Chemical Looping and Combined Cycle
IEA International Energy Agency
IEAGHG International Energy Agency Greenhouse gas R&D programme
IFP French Institute of Petroleum
iG-CLC In-situ Chemical Looping gasification
IGCC Integrated gasification and Combined Cycle
IGFC Integrated Coal Gasification Fuel Cell
INCAR Instituto Nacional del Carbón (Spain)
IPCC International Panel on Climate Change
Isarna An Iron smelting technology of Tata
ITM Ion transport membrane
ITRI Industrial Technology Research Institute (Taiwan)
KEMA Keuring Van Electrotechnische Materialen (Dutch Institute)
KEPCO Korea Electric Power Corporation
KS Trademark for series of Mitsubishi’s hindered amine solvents
LANL Los Alamos National Laboratory
LCL Limestone Chemical Looping (Alstom)

151
LCOE Levelised Cost of Electricity
LHV Lower Heating Value
LMOG Low Molecular Weight organic Gelators
LNG Liquefied Natural Gas
LOX Liquid Oxygen
LP Low Pressure
LT Low Temperature
LTFE Low Temperature Frosting evaporator
MDEA Methyldiethanolamine
MEA Monoethanolamine
MEMFO The membrane research group at NTNU
MeO Metal oxygen Carrier
MGD Membrane Gas Desorption
MHI Mitsubishi Heavy Industries
MPT (1) Membrane Process Technology - Twente University
MPT (2) Media and Process Technology Inc.
MTPY Millions of Tonnes Per year
MTR Membrane Technology Research
MW Mega watts
NALCO National Aluminium Co. India
NCCC National Carbon Capture Centre
NEDO New Energy and Industrial Technology Development Organization (Japan)
NETL National Energy Technology Laboratory (of the USA)
NGCC Natural Gas Combined Cycle
NJIT New Jersey Institute of Technology
NOA Norton Optical Adhesive
NREL National Renewable Energy Laboratory
NTNU Norwegian University of Science and Technology in Trondheim
OEM Original Equipment Manufacturer
OFT Oxy-Fuel Turbine
OPEX Operating Expenditure
ORNL Oak Ridge National Laboratory
OSU Ohio State University
OTM Oxygen transport membrane
PC Pulverised Coal
PCC Post-combustion Capture
PCM Phase Change Material
PF Pulverised Fuel
POSCO Pohang Iron & Steel Co, Ltd (Korea)
POX Partial Oxidation (process)
PSA Pressure Swing Adsorption
PTSA Pressure and Temperature Swing Adsorption
PV Photo Voltaic
RIST Research Institute of Industrial Science and Technology (Korea)
RTI Research Triangle Institute
RTIL Room Temperature Ionic Liquids
RWE The energy company RWE AG

152
SER Sorption Enhanced reforming
SINTEF Norwegian Foundation for Scientific and Industrial Research
SMR Steam Methane Reforming
SOFC Solid Oxide Fuel Cell
SR-CLC Steam Reforming with Chemical Looping Combustion
SWEGS Sorption-Enhanced Water Gas Shift
TIT Turbine Inlet Temperature
TNO Toegepast Natuurwetenschappelijk Onderzoek – Dutch Applied Scientific Research
Institute
TRL Technology Readiness Level
TSA Temperature swing Adsorption
UKERC UK Energy Research Centre
ULCORED A direct reduction steel making process
ULCOS Ultra Low CO2 Steelmaking (European steel research consortium)
UOP UOP Honeywell (formerly Universal Oil Products)
VPSA Vacuum Pressure Swing Adsorption
VSA Vacuum Swing Adsorption
WGS Water Gas Shift
WPI Center for Inorganic Membrane Studies, Worcester Polytechnic Institute, USA
ZIF Zeolite Imidazolate Framework

153
10. References
Abanades, J.C., Grasa, G., Alonso, M., Rodriguez, N., Anthony, E.J., Romeo, L.M., 2007.
Cost structure of a post combustion CO2 capture system using CaO. Environmental Science
and Technology 41 (15), 5523–5527.
Abdulally, I., Beal, C., Andrus, H.E., Epple, B., Lyngfelt, A., Lani, B., 2012. Alstom’s
chemical looping prototypes program update. 11th Annual Carbon Capture, Utilization and
Sequestration Conference, 30 April – 3 May 2012, Pittsburgh.
Adanez-Rubio, I., Gayan, P., Abad, A., Garcia-Labiano, F., de Diego, L.F., Adanez, J., 2011.
CO2 capture in coal combustion by chemical-looping with oxygen uncoupling (CLOU) with a
Cu-based oxygen-carrier. 5th International Conference on Clean Coal Technologies
(CCT2011). Zaragoza.
Adanez, J., Abad, A., Garcia-Labiano, F., Gayan, P., de Diego, L.F., 2012. Progress in
chemical-looping combustion and reforming technologies. Progress in Energy and
Combustion Science 38, 215-282.
Ahn, C.K., 2011. CO2 capture from BFG stream using aqueous ammonia aided by waste heat
recovery. 1st IEAGHG Iron and Steel Industry CCS Workshop, Dusseldorf, Germany.
Aines R. D., Spaddaccini C. M., Duoss E. B., Stolaroff J. K, Vericella J., Lewis J. A.,
Farthing G., 2013. Encapsulated solvents for carbon dioxide capture. Energy Procedia, 37,
219 – 224.
Alekzeev A. et al. Linde AG presentation - Technological Evaluation of cryogenic CPU
processes. OCC-3 Ponferrada Spain 9-13 Sep 2013
Allam, R.J., Palmera, M.R., Brown Jr, G.W., Fetvedt, J., Freed, D., Nomoto, H., Itoh, M.,
Okita, N., Jones Jr., C.J., 2013. High efficiency and low cost of electricity generation from
fossil fuels while eliminating atmospheric emissions, including carbon dioxide, Energy
Procedia, 37, 1135–1149.
Alstom 2012, Alstom chemical looping advanced oxy – phase I. US DOE / NETL Kickoff
Meeting, 26 October 2012, Pittsburgh.
Alstom 2014 Alstom’s chemical looping technology update, Alstom power inc., 2014
USDOE/NETL CO2 capture technology meeting, 29th July-1st August 2014, Pittsburgh.
Anderson R, Brandt H, Doyle S, Pronske K, Viteri F., 2003. Power generation with 100%
carbon capture and sequestration. 2nd Annual Conference on Carbon Sequestration,
Alexandria, VA, USA, 2003.
Anderson, R.E., MacAdam, S., Viteri, F., Davis, D.O., Downs, J.P. and Paliszewski, A.,
2008. Adapting gas turbines to zero emission oxyfuel power plant. Proceedings of ASME
Turbo Expo 2008: Power for Land, Sea and Air, Berlin, Germany – June 2008.
Anthony, E.J. 2011. Ca looping technology: current status, developments and future
directions. Greenhouse Gas Sci Technol. 1, 36–47.

154
Arias, B., Diego, M.E., Abanades, J.C., Lorenzo, M., Diaz, L., Martinez, D., Alvarez, J.,
Sanchez-Biezma, A., 2013. Demonstration of steady state CO2 capture in a 1.7 MWth calcium
looping pilot. International Journal of Greenhouse Gas Control 18, 237–245.
Balasubramanian, B.A., Ortiz, A.L., Kaytakoglu, S., Harrison, D.P., 1999. Hydrogen from
methane in a single-step process. Chemical Engineering Science 54 (15–16), 3543–3552.
Ball, R., Sceats, M.G., 2010. Separation of carbon dioxide from flue emissions using Endex
principles. Fuel 89, 2750–2759.
Barker, D.J., Turner, S.A., Napier-Moore, P.A., Clark, M., Davison, J.E., 2009. CO2 capture
in the cement industry. GHTGT-9. Energy Procedia 1, 87–94.
Bayham, S., 2013. Coal direct chemical looping (CDCL) retrofit to pulverized coal power
plants for in-situ CO2 capture. 2013 NETL CO2 Capture Technology Meeting, 11 July 2013,
Pittsburgh.
Beavis, R., 2009. Introduction to Cachet. A pre-combustion technology, development
program, co-funded by the EU and CCP. Eide, L.I., 2009. Carbon dioxide capture for storage
in deep geological formations - results from the CO2 capture project, vol. 3. UK: CPL Press,
Chapter 10.
Berstad, D., Nekså, P., Gjøvåg, G., 2011. Low temperature syngas separation and CO2
capture for enhanced efficiency of IGCC power plants, Energy Procedia 4 (2011) 1260-1267.
Beysel, G., 2009. Enhanced cryogenic air separation unit – a proven process applied to
oxyfuel – the future prospect. 1st Oxyfuel Combustion Conference, Cottbus, Germany –
September 2009.
Bhatty, J.I., 2003. Effect of minor elements on clinker and cement manufacture: a laboratory
analysis. Portland Cement Association Internal Report, Serial No. 2147, IL, USA.
Birat, J.P., 2010. Carbon dioxide (CO2) capture and storage technology in the iron and steel
industry. Developments and Innovation in Carbon Dioxide (CO2) Capture and Storage
Technology. Volume 1: Carbon Dioxide (CO2) Capture, Transport and Industrial
Applications, Woodhead Publishing Ltd., pp 492‐521.
Birat, J.P., 2012. ULCOS: CCS for steel production. ZERO Seminar on CCS Industrial
Application, Berlin, Germany.
Bringelsson M. Westermark M., 2009 CO2 capture pilot test at a pressurized coal fired CHP
plant, Energy Procedia, Vol 1, Issue 1, February 2009 p. 1403-1410
Brouwers, J., Kemenade, H. van, 2010. Condensed rotational separation for CO2 capture in
coal gasification processes, 4th International Freiberg Conference on IGCC and XtL
Technologies, Dresden, Germany, 2010.
CAESAR project, 2011, European best practice guidelines for assessment of CO2 capture
technologies. EU project 213206 Deliverable D 4.9, Feb 2011
CCP – CO2 Capture Project. http://www.co2captureproject.org
CEMBUREAU, 1999. CEMBUREAU best available techniques for the cement industry.
155
Chang, M.-H., Huang, C.-M., Liu, W.-H., Chen, W.-C., Cheng, J.-Y., Chen, W., Wen, T.-W.,
Ouyang, S., Shen, C.-H., Hsu, H.-W., 2013. Design and experimental investigation of the
calcium looping process for 3 kWth and 1.9 MWth facilities. Chem. Eng. Technol. 36, 1525-
1532.
Clodic, D., Younes, M., 2002. A new method for CO2 capture: frosting CO2 at atmospheric
pressure. Sixth International Conference on Greenhouse Gas control Technologies GHGT6,
Kyoto, Japan, 1-4 October 2002, p. 155-160.
Clodic D., Younes M., Riachi Y., El Hitti R., Boulawz Ksayer E., Pan X., Yu Y., 2011. CO2
capture by antisublimation using integrated cascade system. International Congress of
Refrigeration -CD-ROM edition.
Clodic, D., Younes, M., EL Hitti, R., Boulawz Ksayer, E., Casier, F., Bill, A., 2004b.
Feasibility study of CO2 and water capture by anti-sublimation for power station units. Report
for the French Agency for Environment and Energy Management (ADEME), confidential.
Clausse M., Merel J., Meunier F., 2011. Numerical parametric study on CO2 capture by
indirect thermal swing adsorption. International Journal of Greenhouse Gas Control, 5, 1206–
1213.
CO2 to Bio: Report 2012, Microalgae as an omega-3 rich feedstock - integrating CO2
sequestration and aqua feed production.
CONCAWE, 2011. The potential for application of CO2 capture and storage in EU oil
refineries. Report No. 7/11.
Connell, D., Lewandowski, D.A., Ramkumar, S., Phalak, N., Statnick, R.M., Fan, L., 2013.
Process simulation and economic analysis of the Calcium Looping Process (CLP) for
hydrogen and electricity production from coal and natural gas. Fuel 105, 383–396.
Cost Reduction Task Force, 2013. CCS Cost Reduction Task Force final report, May 2013,
https://www.gov.uk/government/groups/ccs-cost-reduction-task-force
CSIRO, 2012. Assessing post-combustion capture for coal-fired power stations in Asia-
Pacific partnership countries. Final report to the Department of Resources, Energy and
Tourism. EP116217.
Dean, C.C., Blamey, J., Florin, N.H., Al-Jeboori, M.J., Fennell, P.S., 2011. The calcium
looping cycle for CO2 capture from power generation, cement manufacture and hydrogen
production. Chemical Engineering Research and Design 89, 836–855.
DECARBit, Newsletter 2012. http://www.sintef.no/Projectweb/DECARBit/Publications-/
DECC 2012 Electricity generation costs, UK Department of Energy and Climate Change
October 2012.
De Costa, J., Smart, S., Motuzas, J., Liu, S. and Zhang, D., 2013. State of Art (SOTA) report
on dense ceramic membranes for oxygen separation from air. ANLEC R&D Report.
DOE/NETL, 2013. Advanced combustion systems: Chemical looping summary. July 2013,
Online.
156
ECRA, 2007. Carbon capture technology—options and potentials for the cement industry.
Technical Report TR 044/2007.
Eltron, 2009. Maximum economical CO2 capture for IGCC power plants, tech brief. Eltron
Research and Development, Boulder Colorado
Epple, B., Ströhle, J., 2011. Towards efficient carbon capture for coal fired plants based on
chemical and carbonate looping processes. ICEPE, 20 June 2011, Frankfurt.
Epple, B., Kremer, J., Ströhle, J., 2013. Continuous carbonate looping tests in a 1 MWth pilot
plant. 5th IEAGHG HTSLCN Meeting, 2-3 September 2013, Cambridge.
Epple, B., 2013. Experience with Post Combustion limestone based CCS technology in the 1
MW scale. Taipei Taiwan CCSU Forum, 6-7 August 2013, Taipei.
Ferguson, S. and Stockle, M., 2012. Carbon capture options for refiners - an outline
methodology identifies the most appropriate way to achieve a refinery’s carbon capture goal.
PTQ, 2012-Q2 edition, pp. 77-87.
Fernandez E. S., Goetheer E. L.V., 2011. DECAB: process development of a phase change
absorption process. Energy Procedia, 4, 868–875.
Feron P. H. M., ten Asbroek N., 2005. New solvents based on Amino-Acid Salts for CO2
capture from flue gases. Greenhouse Gas Control Technologies, Volume 11.
Fillman B., Anheden M., Wolf J., 2010. Parameter study in order to reveal critical design
issues in the design for a CLC power plant using solid carbon as fuel. Proc. 1st International
Conference on Chemical Looping, Lyon.
Franz J., Schiebahn S., Zhao L., Riensche E., Scherer V., Stolten D., 2013. Investigating the
influence of sweep gas on CO2/N2 membranes for post-combustion capture. International
Journal of Greenhouse Gas Control, 13, 180–190.
Freeman B.C, Bhown, A. S., 2011. Assessment of the technology readiness of post-
combustion CO2 capture technolgies. Energy Procedia Vol 4, 1791-1796.
Freeman B, Hao P, Baker R, Kniep J, Chen E, Ding J, Zhang Y, 2014 Hybrid membrane-
absorption CO2 capture process, GHGT-12 Austin Texas Oct 2014
GEA, 2012. Global Energy Assessment - Toward a Sustainable Future. International Institute
for Applied Systems Analysis, Vienna, Austria and Cambridge University Press, Cambridge,
UK and New York, NY, USA.
Goloubev, D., 2012. Oxygen production for oxyfuel power plant - status of development. 2nd
Oxy-FBC Workshop, Stuttgart, Germany, June 2012.
Gopan A, Kumfer B., Phillips J., Thimsen D., Smith R., Axelbaum R. 2014 Process design
and performance analysis of a Staged, Pressurized Oxy-Combustion (SPOC) power plant for
carbon capture, Applied Energy Vol 125, 15 July 2014, Pages 179-188.
Grande C. A., Rodrigues A. E., 2008. Electric swing adsorption for CO2 removal from flue
gases. International Journal of Greenhouse Gas Control, 2, 194 – 202.

157
Griffin T, Sundkvist SG, Asen K, Bruun T., 2005. Advanced zero emissions gas turbine
power plant. ASME Journal of Eng. Gas Turbines Power, 27, 81–85.
Hamilton, H., 2012. Palladium based membranes for hydrogen separation, Platinum Metal
Review 56 (2) 117-123.
Hasib-ur-Rahmana M., Siaj M., Larachia F., 2010. Ionic liquids for CO2 capture development
and progress. Chemical Engineering and Processing, 49, 313–322.
Hasse D., Kulkarni S., Sanders E., Corson E., Tranier J.-P., 2012. CO2 capture by sub-
ambinet membrane operation. GHGT-11, Kyoto, Japan.
Higginbotham, P., 2011. Oxygen supply for oxyfuel coal CO2 capture. 2nd Oxyfuel
Combustion Conference, Yeppoon, Australia, September 2011.
Higginbotham, P., White, V., Fogash, K., and Guvelioglu, G., 2011. Oxygen supply for
oxyfuel CO2 capture. IJGCC 5, Special Issue/Suppl., pp. S194-S203.
Higman, 2013. Status of the gasification industry – the updated worldwide gasification
database. Gasification Technologies Conference, Colorado Springs, 16th Oct. 2013,
www.gasification.org
Huang Q., Mladen Eic´ M., 2013. Commercial adsorbents as benchmark materials for
separation of carbon dioxide and nitrogen by vacuum swing adsorption process. Separation
and Purification Technology, 103, 203–215.
Hufton, J.R. et. al., 2005. Development of a process for CO2 capture from gas turbines using
a sorption enhanced water gas shift reactor system. In Proceeding of the 7th International
Conference on Greenhouse Gas Control Technologies, Vancouver, Canada, 5-9th September
2004, Elsevier Ltd., 2005, Oxford, UK.
IEA, 2012. Energy Technology Perspectives 2012 -- Pathways to a clean energy system.
ISBN 978-92-64-17488-7, IEA, Paris.
IEAGHG, 2005. Retofitting of CO2 capture to natural gas combined cycle power plants.
Report 2005/1, Jan. 2005, IEA Greenhouse Gas R&D Programme, Cheltenham, UK.
IEAGHG, 2005a. Development of PPAP - Power Plant Assessment Program. Report 2005/7
Jan. 2005, IEA Greenhouse Gas R&D Programme, Cheltenham, UK.
IEAGHG, 2006. Estimating the future trends in the cost of CO2 capture technologies. Report
2006/6, Feb. 2006, IEA Greenhouse Gas R&D Programme, Cheltenham, UK.
IEAGHG, 2008. CO2 capture in the cement industry”. Report 2008/3, IEA Greenhouse Gas
R&D Programme, Cheltenham, UK.
IEAGHG, 2011. Potential for biomass and carbon dioxide capture and storage. Report
2011/06, July, 2011, IEA Greenhouse Gas R&D Programme, Cheltenham, UK.
IEAGHG, 2011a. Rotating Equipment for Carbon Dioxide Capture and Storage”. Report
2011/07, Sep 2011, IEA Greenhouse Gas R&D Programme, Cheltenham, UK.

158
IEAGHG, 2013. Toward a common method of cost estimation for CO2 capture and storage at
fossil fuel power plants. Report 2013/TR2, March 2013, IEA Greenhouse Gas R&D
Programme, Cheltenham, UK.
IEAGHG, 2013. Deployment of CCS in the cement industry. Report 2013/19, IEA
Greenhouse Gas R&D Programme, Cheltenham, UK.
IEAGHG 2014a. Evaluation of reclaimer sludge disposal from Post Combustion CO2 capture.
IEAGHG report 2014/2, 2014, IEA Greenhouse Gas R&D Programme, Cheltenham, UK
IEAGHG, 2014b. CO2 capture at coal-based power and hydrogen plants. IEAGHG report
2014/3, May 2014. IEA Greenhouse Gas R&D Programme, Cheltenham, UK
IGBP, IOC, SCOR, 2013. Ocean acidification summary for policymakers – Third symposium
on the ocean in a high-CO2 world. International Geosphere-Biosphere Programme,
Stockholm, Sweden.
IPCC, 1990. Climate Change: The IPCC Scientific Assessment (1990) Report prepared for
Intergovernmental Panel on Climate Change by Working Group I, J.T. Houghton, G.J.
Jenkins and J.J. Ephraums (eds.).Cambridge University Press, Cambridge, Great Britain,
New York, NY, USA and Melbourne, Australia 410 pp.
Ishida M, Jin H., 1997. CO2 recovery in a novel power plant system with CLC. Journal of
Energy Conversion and Management, 38, 187–92.
Ishida M, Jin H., 1994. A new advanced power-generation system using chemical-looping
combustion. Energy, 19, 415–22.
Jack, D., Evenson, C., Faull, J., Anderson, D., 2011. Scale-up of hydrogen transport
membranes for carbon capture applications, Gasification Technologies Conference, Oct.
2011.
Jamaluddin, J. et al., 2013. Oxy-firing a simulated process heater: CFD analyses and
comparison with test data. 3rd Oxyfuel Combustion Conference, Ponferrada, Spain.
Jansen, D. et al., 2013. SEWGS technology is now ready for scale-up. Energy Procedia 37
(2013) 2265-2273.
Japanese Iron and Steel Federation – JISF, 2013. Outline of COURSE50 programme.
http://www.jisf.or.jp/course50/outline/index_en.html
Jericha H, Gottlich E, Sanz W, Heitmeir F., 2004) Design optimization of the Graz cycle
prototype plant. ASME Journal of Eng. Gas Turbines Power 126, 733–740.
Jin, H., Ishida, M., 2008. A new type of coal gas fuelled chemical-looping combustion. Fuel
83, 2411-2417.
Jordal K. et al. 2012, Low temperature CO2 separation, SINTEF energy research report TR
A7639 December 2012
Junk, M., Epple, B., 2013. Design of a 300 kWth indirectly heated carbonate looping test
facility. 5th IEAGHG HTSLCN Meeting, 2-3 September 2013, Cambridge.

159
Junk, M. Reitz, M., Ströhle, J., Epple, B., 2013. Thermodynamic evaluation and cold flow
model testing of an indirectly heated carbonate looping process. Chem. Eng. Technol. 36,
1479-1487.
Junk, M., Kremer, J., Ströhle, J., Eimer, N., Priesmeier, U., Weingärtner, C.,Stallmann, O.,
Epple, B., 2014. Design of a 20 MWth carbonate looping pilot plant for CO2-capture of coal
fired power plants by means of limestone. GHGT-12, 5-9 October 2014. Subject to
publication in Energy Procedia.
Knop, K., Hallin, M. and Burström, E., 2008. ULCORED: concept for minimized CO2
emission. Proceedings of 4th ULCOS Seminar.
Kost C. et al. 2013. Levelised cost of electricity, Renewable energy technologies. Fraunhofer
Institute for solar energy systems ISE. Nov 2013.
Kremer, J., Galloy, A., Ströhle, J., Epple, B., 2013. Continuous CO2 capture in a 1 MWth
carbonate looping pilot plant. Chem. Eng. Technol. 36, 1518-1524.
Kvamsdal, H., Jordal, K., Bolland, O., 2007. A quantitative comparison of gas turbine cycles
with CO2 capture. Energy 32. 20017, 10-24.
Leclerc, M., Dubettier, R., and Lockwood, F., 2013. High recovery – near zero emissions
CPU. 3rd Oxyfuel Combustion Conference, Ponferrada, Spain, September 2013.
Lee, M. S., 2013. Progress on CO2 capture pilot plant at RIST. 1st Joint IEAGHG/IETS Iron
and Steel Industry CCUS & Process Integration Workshop, Tokyo, Japan.
Le Treut H., Somerville R., Cubasch U., Ding Y., Mauritzen C., Mokssit A., Peterson T. and
Prather M., 2007. Historical overview of climate change science. In: Climate change 2007:
The physical science basis. Contribution of Working Group I to the Fourth Assessment
Report of the Intergovernmental Panel on Climate Change (Solomon S., Qin D., Manning M.,
Chen Z., Marquis M., Averyt K.B., Tignor M. and Miller H.L., editors) (PDF). Cambridge
University Press. Retrieved 14 December 2008.
Liu, P., 2013. Robust and energy efficient dual-stage membrane-based process for enhanced
carbon dioxide recovery. DE-FE0013064 kick-off meeting presentation, 2013.
Lu, X., 2014. Flexible integration of the sCO2 Allam Cycle with coal gasification for low-
cost emission-free electricity generation. Gasification Technology Conference, Oct. 2014
Lyngfelt, A., 2014. Chemical-looping combustion of solid fuels – Status of development.
Applied Energy 113, 1869–1873.
Lyngfelt, A., Linderholm C., 2014a Chemical-Looping Combustion of Solid Fuels –
Technology Overview and Recent Operational Results in 100 kW Unit. GHGT-12
MacKenzie, A., Granatstein, D.L., Anthony, E.J., Abanades, J.C., 2007. Economics of CO2
capture using the calcium cycle with a pressurized fluidized bed combustor. Energy & Fuels
21, 920–926.
Malavasi M. 2014, A flameless oxycombustion route to lower cost CCS, Modern Power
Systems 24 June 2014
Manage, M., Hodgson D., Milligan N., Simons, S.J.R., Brett, D.J.L, A techno-economic

160
appraisal of hydrogen generation and the case for solid oxide electrolyser cells, International
journal of hydrogen energy 36, (2011), 5782-5796 Mantripragada, H.C., Rubin E.S., 2013. Chemical looping for pre-combustion CO2 capture:
performance and cost analysis. Energy Procedia 37, 618 – 625.
Manzolini, G., et al., 2011. Integration of SEWGS for carbon capture in natural gas combined
cycle: part B, reference case comparison. Int. J. Greenhouse Gas Control 5 (2011) 214-225.
Marin O, Bourhis Y, Perrin N, Zanno PD, Viteri F, Anderson R., 2003. High efficiency, zero
emission power generation based on a high temperature steam cycle. 28th International
Conference on Coal utilization & Fuel Systems, Clearwater, FL, USA, May, 2003.
Marion, J., Nsakala N., Griffin, T., Bill, A. Controlling power plant CO2 emissions: A long
range view. Annual CO2 Capture and Sequestration Conference.
http://www.netl.doe.gov/publications/proceedings/01/carbon_seq/1b2.pdf
Marion, J., Abdulally, I., Andrus, H., Chapman, P., Chiu, J., Edberg, C., Kenney, J., Kang, S.,
Thibeault, P., Turek, D., Lani, B., 2013. Alstom’s limestone-based chemical looping process
(LCLTM). 3rd Oxyfuel Combustion Conference, 12 September 2013, Ponferrada.
Mateo C., Palomo J. M., Fernandez-Lorente G., Guisan J. M. and Fernandez-Lafuente R.
2007. Improvement of enzyme activity, stability and selectivity via immobilization
techniques. Enzyme Microb Technol 40, 1451.
Mathieu P, Nihart R., 1999. Zero-emission MATIANT cycle. J. Eng. Gas Turbines Power
121, 116–20.
Mathieu P, Nihart R., 2000. Sensitivity analysis of the MATIANT cycle. Journal of Energy
Conversion and Management, 40, 1687–1700.
Mattisson T., Lyngfelt A., Leion H., 2009. Chemical-looping with oxygen uncoupling for
combustion of solid fuels. Int. J. Greenhouse Gas Control 3, 11-19.
Meijer, K. and Zeilstra, C., 2011. Development of the HIsarna process alternative ironmaking
technology with CO2 capture potential. 1st IEAGHG Iron and Steel Industry CCS Workshop,
Düsseldorf, Germany.
Mello, L. et al., 2009. Chapter 3: Oxy-combustion for CO2 capture from fluid catalytic
crackers. CO2 Capture for Storage in Deep Geologic Formations – Results from the CO2
Capture Project, (Vol. 3), Lars Eide (editor) ISBN978-1-872691-49-7.
Merkel T.C., Lin H., Wei X., Baker R., 2010. Power plant post-combustion carbon dioxide
capture: an opportunity for membranes. Journal of Membrane Science 359, 126–139.Moene
R., Schoon L., van Straelen J., Geuzebroek F., 2012. Precipitating carbonate process for
energy efficient post combustion CO2 capture. Energy Procedia, 37, 1881 – 1887.
Moghtaderi, B., 2012. Review of the recent chemical looping process developments for novel
energy and fuel applications. Energy & Fuels 26 (1), 15-40.
Moller BF, Torisson T, Assadi M, et al., 2005. AZEP gas turbine combined cycle power
plants – Techno-economic analysis. Proceedings of ECOS2005: 819–826, Trondheim,
Norway, 2005.

161
Mori, Y., Forsyth, J., 2013. High performance CO2 capture by autothermal AGR, Energy
Procedia 37 (2013) 2284-2292.
MTR, 2014. CO2 removal from syngas
http://www.mtrinc.com/co2_removal_from_syngas.html
Naqvi R, Bolland O., 2005. Off-design evaluation of a natural gas fired chemical looping
combustion combined cycle with CO2 capture. Proceedings of ECOS2005: 827–834,
Trondheim, Norway, June 2005.
NETL 2008, Pulverized Coal Oxycombustion Power, DOE/NETL-2007/1291, US
Department of Energy National Energy Technology Laboratory.
NETL, 2009. Integration of H2 separation membranes with CO2 capture and compression:
identifying the right membrane for the right job, DOE/NETL-401/113009, Nov. 2009.
NETL, 2010. Current and future technologies for gasification-based power generation,
volume 2: A pathway study focused on carbon capture advanced power systems R&D using
bituminous coal. DOE/NETL-2009/1389, rev 1, Nov. 2010, US Department of Energy
National Energy Technology Laboratory.
NETL, 2011a. Analysis of integrated gasification fuel cell plant configurations. DOE/NETL-
2011-1482, US Department of Energy National Energy Technology Laboratory.
NETL, 2011b. Analysis of natural gas fuel cell plant configurations. DOE/NETL-2011-1486,
US Department of Energy National Energy Technology Laboratory.
NETL, 2011c. Scale-up of hydrogen transport membranes, project facts. NT42469, US
Department of Energy National Energy Technology Laboratory.
NETL, 2012. Current and Future Technologies for Power Generation with Post- Combustion
Carbon Capture. Final report, DOE/NETL-2012/1557, US Department of Energy National
Energy Technology Laboratory
NETL, 2013. Cost and Performance Baseline for Fossil Energy Plants, Volume 1 Bituminous
Coal and Natural Gas to Electricity, DOE/NETL-2010/139
NETL, 2014. Project Fact Sheet: supersonic post-combustion inertial CO2 extraction system,
January 2014. US Department of Energy National Energy Technology Laboratory.
Noble R. D., Gin D. L., 2013. Separations using room temperature ionic liquids and
membranes. NETL Carbon Capture Technology Meeting Pittsburgh, 11th July, 2013.
Northington, J., Morton, M., Yongues, R., 2012. Advanced technology testing at the National
Carbon Capture Centre. 29th Annual Pittsburgh Coal Conference, Oct. 15-18, 2012.
NREL, 2011. Saur, G., Ramsden, T., Wind electrolysis: Hydrogen cost optimisation,
Technical report NREL/TP-5600-50408 May 2011
Ortiz, A.L., Harrison, D.P., 2001. Hydrogen production using sorption-enhanced reaction.
Industrial & Engineering Chemistry Research 40 (23), 5102–5109.

162
Ortiz, M., de Diego, L.F., Gayan, P., Pans, M.A., Garcia-Labiano, F., Abad, A., Adanez, J.,
2010. Hydrogen production coupled with CO2 capture by chemical-looping using mixed Fe-
Ni oxygen carriers. 1st International Conference on Chemical Looping, Lyon.
Ortiz, M., de Diego, L.F., Abad, A., Garcia-Labiano, F., Gayan, P., Adanez, J., 2010.
Hydrogen production by auto-thermal chemical-looping reforming in a pressurised fluidized
bed reactor using Ni-based oxygen carriers. Int. J. Hydrogen Energ. 35, 151-160.
Ortiz, M., Abad, A., de Diego, L.F., García-Labiano, F., Gayan, P., Adanez, J., 2011.
Optimization of hydrogen production by chemical-looping auto-thermal reforming working
with Ni-based oxygen-carriers. Int. J. Hyd. Energ. 36 (16), 9663–9672.
Osame, M., 2011. Development of high throughput and energy efficient technologies for
carbon capture in the integrated steelmaking process. 1st IEAGHG Iron and Steel Industry
CCS Workshop, Düsseldorf, Germany.
Ozcan, D.C., Ahn, H., Brandani, S., 2012. Fully integrated simulation of a cement plant with
a carbon capture Ca-looping Process. 4th IEAGHG HTSLCN Meeting, 20-21 August 2012,
Beijing.
Pröll, T., Bolhar-Nordenkampf, J., Kolbitsch, P., Hofbauer, H., 2010. Syngas and a separate
nitrogen/argon stream via chemical looping reforming- a 140 kW pilot plant study. Fuel 89,
1249-1256.
Pronske, K., 2013. Clean Energy Systems, inc. zero‐emissions baseload TriGen™ and load
balancing power plants. Presentation at AWMA Meeting, SCAQMD,February 2013.
Quyn D., Rayer A. V., Gouw J., Indrawan I., Mumford K. A., Anderson C. J., Hooper B.,
Stevens G. W., 2012. Results from a pilot plant using un-promoted potassium carbonate for
carbon capture. Energy Procedia, 37, 448 – 454.
Raynal L., Alix P., Bouillon P.-A., Gomez A., de Nailly M. F., Jacquin M., Kittel J., di Lella
A., Mougin P., Trapy J., 2011. The DMX™ process: an original solution for lowering the
cost of post-combustion carbon capture. Energy Procedia, 4, 779–786.
Ramasubramanian K., Verweij H., Ho W.S.W., 2012. Membrane processes for carbon
capture from coal-fired power plant flue gas: A modelling and cost study. Journal of
Membrane Science 421–422, 299–310.
Reitz, M., Junk, M., Ströhle, J., Epple, B.; 2014. Design and erection of a 300 kWth indirectly
heated carbonate looping test facility. GHGT-12, 5-9 October 2014. Subject to publication in
Energy Procedia.
Ritter, R., 2009. Energetic evaluation of CO2 purification and compression plant for oxyfuel
process. 1st Oxyfuel Combustion Conference, Cottbus, Germany, September 2009.
Ritter, R., 2011a. Development of the CPU demonstration plant from the experience of CO2
purification at Schwarze Pumpe pilot plant. 2nd Oxyfuel Combustion Conference, Yeppoon,
Australia, September 2011.

163
Ritter, R., 2011b. Linde’s activities for design and development of the CO2 processing unit in
the oxyfuel power plant. 2nd Oxyfuel Combustion Conference, Yeppoon, Australia,
September 2011.
Rodriguez N., Alonso M., Grasa, G., Abanades, J.C., 2008. Process for capturing CO2 arising
from the calcination of the CaCO3 used in the cement industry. Environ. Sci. Technol. 42,
6980–6984.
Romano, M.C., Spinellia, M., Campanaria, S., Consonnia, S., Cintib, G., Marchib, M.,
Borgarellob, E., 2013. The Calcium looping process for low CO2 emission cement and
power. Energy Procedia 37, 7091–7099.
Ryden, M., 2008. Hydrogen production with fossil fuels with carbon dioxide capture, using
chemical-looping technologies. PhD Thesis. Chalmers University of Technology, Göteborg,
Sweden.
RTI, 2014. RTI International completes mechanical installation of its warm-syngas cleanup
technology demonstration facility at Tampa Electric. RTI International, www.rti.org.
Saima, H., Mogi, Y., Haraoka, T., 2013. Development of PSA system for the recovery of
CO2 from blast furnace gas.
Sceats, M., 2009. The ENDEX configuration for CaO looping reactors. IEA, September
2009, Oviedo.
Scholes C. A., Hob M. T., Wiley D. E., Stevens G. W., Kentish S. E., 2013. Cost competitive
membrane-cryogenic post-combustion carbon capture. International Journal of Greenhouse
Gas Control, 17, 341–348.
Scholes, C.A, Smith, K.H., Kentish, S.E., Stevens, G.W., 2010. CO2 capture from pre-
combustion processes – strategies for membrane separation, International Journal of
Greenhouse Gas Control 4 (2010) 739-755.
Schoon L., van Straelen J., 2011. Development of a precipitating carbonate technology for
post-combustion CO2 capture. TCCS-6, Trondheim, Norway.
Shah, M., 2011a. Air separation unit for oxy-coal power plants. 2nd Oxyfuel Combustion
Conference, Yeppoon, Australia, September 2011.
Shah, M., 2011b. Purification of oxy-combustion flue gas for SOx/NOx removal and high
CO2 recovery”. 2nd Oxyfuel Combustion Conference, Yeppoon, Australia, September 2011.
Shen L., Wu J., Xiao J., Song Q., Xiao R., 2009. Chemical-looping combustion of biomass in
a 10 kW reactor with iron oxide as an oxygen carrier. Energ. Fuel 23, 2498-2505.
Shiflett M. B., Elliott B. A., Lustig S. R., Sabesan S., Kelkar M. S., Yokozeki A., 2012.
Phase behaviour of CO2 in room-temperature ionic liquid 1-ethyl-3-ethylimidazolium acetate.
Chemphyschem, 13, 1806-1817.
Shiflett M. B., Niehaus A. M. S., Yokozeki A., 2011. Separation of N2O and CO2 using
room-temperature ionic liquid [bmim][BF4]. J. Phys. Chem. B, 115 (13), 3478–3487.

164
Sikström, P., 2013. ULCORED: Direct reduction process for ULCOS – a brief introduction.
1st Joint IEAGHG/IETS Iron and Steel Industry CCUS & Process Integration Workshop,
Tokyo, Japan.
SIO, 2014. Scripps Institute of Oceanography. http://keelingcurve.ucsd.edu/what-does-this-
number-mean/
Staicovici M.D., 2002. Further research zero CO2 emission power production: the
‘‘COOLENERG’’ process. Energy, 27, 831–844.
Stern M. C., Simeon F., Herzog H., Hatton T. A., 2013, Post-combustion carbon dioxide
capture using electrochemically mediated amine regeneration. Energy & Environmental
Science, 6, 2505–2517.
Stern M. C., 2013. Electrochemically-mediated amine regeneration for carbon dioxide
separations. PhD Thesis.
Størset, S.O. et. al., 2013. Technology survey and assessment for piloting of CO2 capture
technologies, SINTEF Energy Research report TR F7294, 2013.
Telikapalli V., Joensson S., 2012. Chilled ammonia process installed at the Technology
Center Mongstad. TEKNA Conference Trondheim, Norway.
UKERC, 2013. Presenting the future, an assessment of future costs estimation methodologies
in the electricity generation sector. UK Energy Research Centre, www.ukerc.ac.uk
US EIA 2014, Levelized Cost and Levelized Avoided Cost of New Generation Resources in
the Annual Energy Outlook 2014, U.S. Energy Information Administration April 2014
Van der Stel, J., 2013a. Development of ULCOS-blast furnace: working toward technology
demonstration. 1st IEAGHG/IETS Iron and Steel Industry CCUS & Process Integration
Workshop, Tokyo, Japan.
Van der Stel, J., et. al., 2013b. Update to the developments of Hisarna - an ULCOS
alternative ironmaking process. 1st Joint IEAGHG/IETS Iron and Steel Industry CCUS &
Process Integration Workshop, Tokyo, Japan.
van Straelen, J. et. al., 2010. CO2 capture for refineries, a practical approach. IJGCC, Vol. 4,
316–320.
Watakabe, S., 2013. Current progress in COURSE50 project - recent results on H2 reduction
including LKAB’s EBF experiments and CO2 capture. 1st Joint IEAGHG/IETS Iron and Steel
Industry CCUS & Process Integration Workshop, Tokyo, Japan.
Weydahl, T., 2013. Pursuing the pre-combustion CCS route in oil refineries – the impact on
fired heaters. Applied Journal of Applied Energy, 102, 833-839.
White V., 2011. Air Products oxyfuel CO2 compression and purification development. 2nd
Oxyfuel Combustion Conference, Yeppoon, Australia, September 2011.
White, V., 2008. Purification of oxyfuel derived CO2. 3rd IEAGHG Oxyfuel Combustion
Research Network Workshop, Yokohama, Japan, March 2008.

165
White, V., Wright, A., Tappe, S., and Yan, J., 2013. The Air Products–Vattenfall oxyfuel
CO2 compression and purification pilot plant at Schwarze Pumpe. 3rd Oxyfuel Combustion
Conference. Ponferada, Spain, September 2013.
Wu T., 2013. Pre-combustion CO2 capture at National Carbon Capture Center. 2013 NETL
CO2 capture technology meeting, Pittsburgh, USA, July 2013
Xiang, W., Wang, S., 2008. Investigation of gasification chemical looping combustion
combined cycle performance. Energ. Fuel, 22, 961-966.
Yantovski E.I., Zvagolsky KN, Gavrilenko VA., 1996a. The COOPERATE - Demo Power
Cycle. Journal of Energy Conversion Management 37, 861–864.
Yantovski E.I., 1996b. Stack downward zero emission fuel-fired power plants concept.
Journal of Energy Conversion Management, 37, 867–877.
Zhang J., Webley P. A., Xiao P., 2008. Effect of process parameters on power requirements
of vacuum swing adsorption technology for CO2 capture from flue gas. Energy Conversion
and Management, 49, 346–356.