co capture technologies and costs
TRANSCRIPT

COCO2 2 Capture Technologies Capture Technologies and Costsand Costs
Results of the IPCC Special Report on Results of the IPCC Special Report on Carbon dioxide Capture and StorageCarbon dioxide Capture and Storage
Edward S. RubinDepartment of Engineering & Public Policy
Carnegie Mellon UniversityPittsburgh, Pennsylvania
Presentation to
MIT Carbon Sequestration Forum VICambridge, Massachusetts
November 3, 2005
E.S. Rubin, Carnegie Mellon
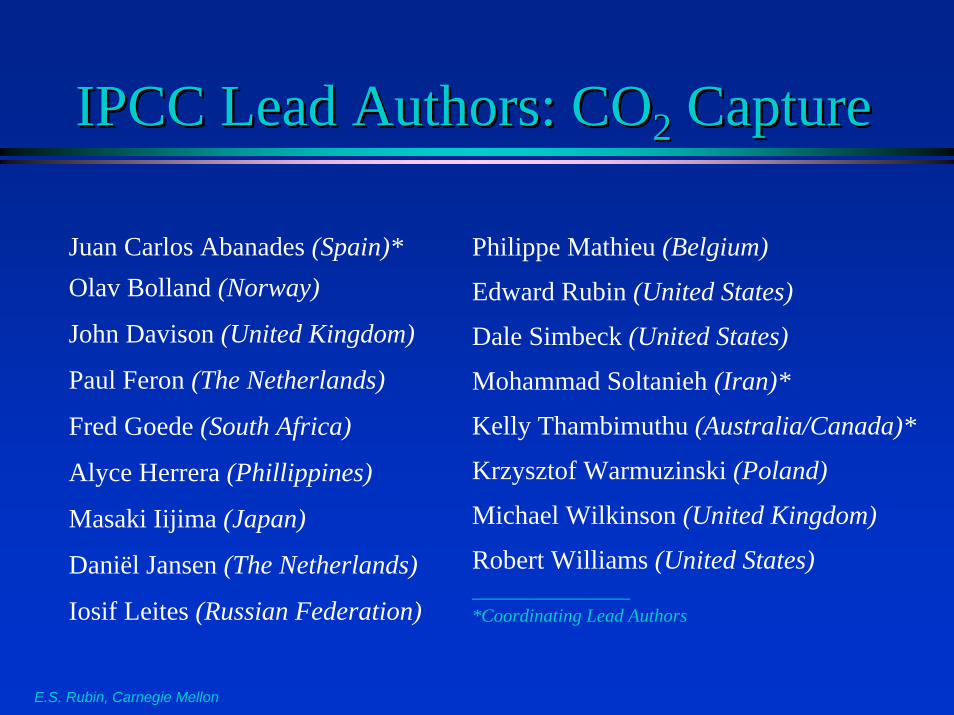
IPCC Lead Authors: COIPCC Lead Authors: CO22 CaptureCapture
Juan Carlos Abanades (Spain)*Olav Bolland (Norway)
John Davison (United Kingdom)
Paul Feron (The Netherlands)
Fred Goede (South Africa)
Alyce Herrera (Phillippines)
Masaki Iijima (Japan)
Daniël Jansen (The Netherlands)
Iosif Leites (Russian Federation)
Philippe Mathieu (Belgium)
Edward Rubin (United States)
Dale Simbeck (United States)
Mohammad Soltanieh (Iran)*
Kelly Thambimuthu (Australia/Canada)*
Krzysztof Warmuzinski (Poland)
Michael Wilkinson (United Kingdom)
Robert Williams (United States)_________________*Coordinating Lead Authors

E.S. Rubin, Carnegie Mellon
Questions AddressedQuestions Addressed
• What is the current status of technologies and systems for CO2 capture ?
• What is the current cost of CO2 capture, and what are the factors that most influence cost?
• What are the energy, environmental, and resource impacts of CO2 capture systems?
• What is the outlook for future technology improvements that can reduce CO2 capture costs and impacts?

E.S. Rubin, Carnegie Mellon
Study ApproachStudy Approach
• Review, summarize and draw upon recent (ideally peer-reviewed) literature to assess capabilities, costs and impacts
E.S. Rubin, Carnegie Mellon
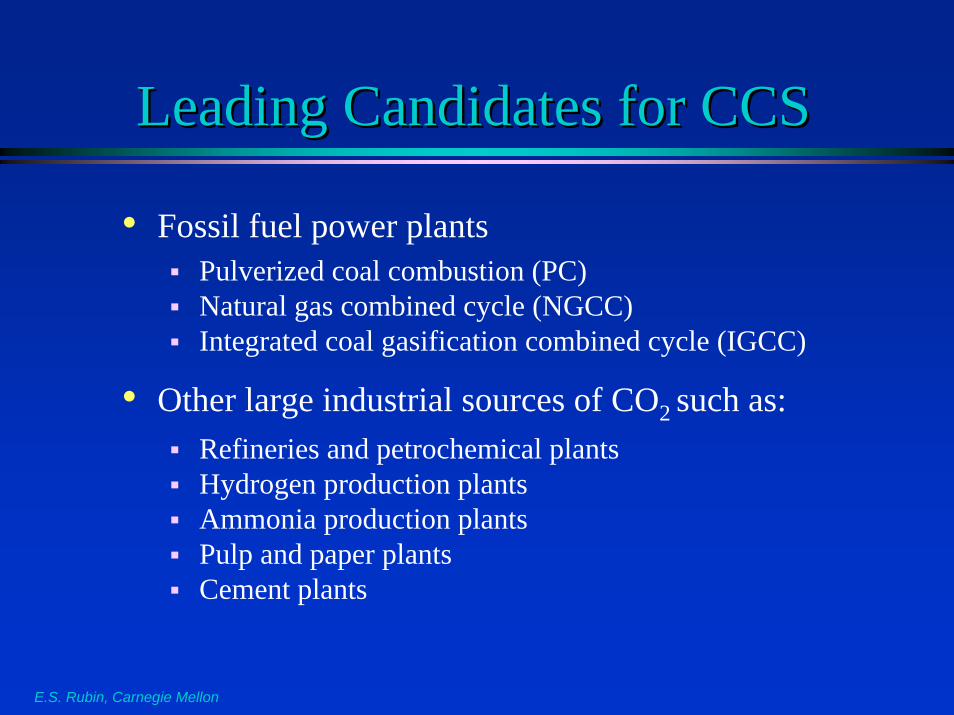
Leading Candidates for CCSLeading Candidates for CCS
• Fossil fuel power plantsPulverized coal combustion (PC)Natural gas combined cycle (NGCC)Integrated coal gasification combined cycle (IGCC)
• Other large industrial sources of CO2 such as:Refineries and petrochemical plantsHydrogen production plantsAmmonia production plants Pulp and paper plantsCement plants

E.S. Rubin, Carnegie Mellon
Systems ConsideredSystems Considered
Raw material Gas, Ammonia, Steel
Reformer+CO2 Sep
Air Separation
CO2Separation
Coal Gas
Biomass
CO2Compression& Dehydration
Power & Heat
Power & Heat
Power & Heat
Process +CO2 Sep.
N2
N2 O2
O2
H2
N2O2
CO2
CO2
CO2
CO2
Air
Post combustion
Pre combustion
Oxyfuel
Industrial Processes
Air
Air
Coal Gas
Biomass
Coal Gas
Biomass
Gasification
Gas, Oil
Coal Gas
Biomass
Air/O2Steam
Air/O2
Raw material Gas, Ammonia, Steel
Reformer+CO2 SepReformer+CO2 Sep
Air Separation
CO2Separation
CO2Separation
Coal Gas
Biomass
CO2Compression& Dehydration
Power & HeatPower & Heat
Power & HeatPower & Heat
Power & Heat
Process +CO2 Sep.
N2
N2 O2
O2
H2
N2O2
CO2
CO2
CO2
CO2
Air
Post combustion
Pre combustion
Oxyfuel
Industrial Processes
Air
Air
Coal Gas
Biomass
Coal Gas
Biomass
GasificationGasification
Gas, Oil
Coal Gas
Biomass
Air/O2Steam
Air/O2
Source: IPCC SRCCS

E.S. Rubin, Carnegie Mellon
Capture Technology ToolboxCapture Technology ToolboxProcess streams Post-combustion
decarbonizationOxy-fuel combustion Pre-combustion
decarbonization
Separation task CO2/CH4 CO2/N2 O2/N2 CO2/H2
Capture Technologies
Current Emerging Current Emerging Current Emerging Current Emerging
Solvents(Absorption)
Physical solvents
Chemical solvents
Improved solvents;Novel contacting equipment;Improved design of processes
Chemical solvents
Improved solvents;Novel contacting equipment;Improved design of processes
n.a. Biomimeticsolvents, e.g. hemoglobine-derivatives
Physical solvents
Chemical solvents
Improved chemical solvents;Novel contacting equipment;Improved design of processes
Membranes Polymeric Ceramic;Facilitated transport;CarbonContactors
Polymeric Ceramic;Facilitated transport;CarbonContactors
Polymeric Ion transport membranes;Facilitated transport
Polymeric Ceramic;Palladiumreactors;Contactors
Solid sorbents Zeolites;Activated carbon
Zeolites;Activated carbon
Carbonates;Carbon based sorbents
Zeolites;Activated carbon
Adsorbents for O2/N2separation; Perovskites;Oxygen chemical looping
Zeolites;Activated carbon;Alumina
Carbonates; Hydrotalcites;Silicates
Cryogenic Ryan-Holmes process
Liquefaction Hybrid processes
Distillation Improved distillation
Liquefaction Hybrid processes
Source: IPCC SRCCS
E.S. Rubin, Carnegie Mellon
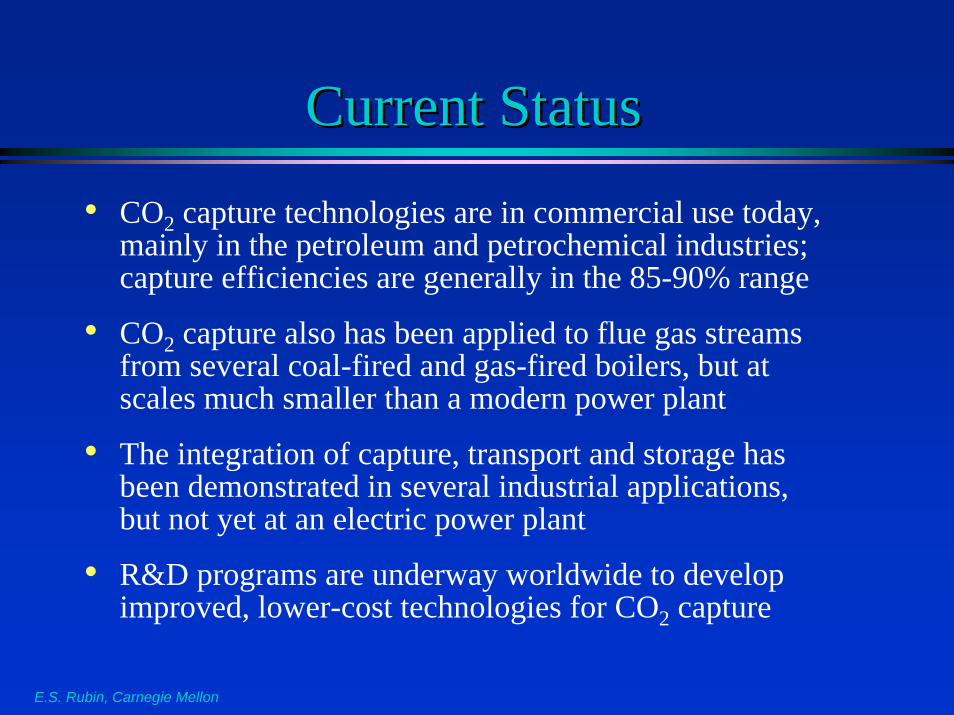
Current Status Current Status
• CO2 capture technologies are in commercial use today, mainly in the petroleum and petrochemical industries; capture efficiencies are generally in the 85-90% range
• CO2 capture also has been applied to flue gas streams from several coal-fired and gas-fired boilers, but at scales much smaller than a modern power plant
• The integration of capture, transport and storage has been demonstrated in several industrial applications, but not yet at an electric power plant
• R&D programs are underway worldwide to develop improved, lower-cost technologies for CO2 capture

CO2 Capture at an Industrial Process
Source: Mitsubishi
E.S. Rubin, Carnegie Mellon

CO2 Capture at a Coal-Fired Power Plant
Source: ABB Lummus
E.S. Rubin, Carnegie Mellon

CO2 Capture at a Coal Gasification Plant
Source: U.S. DOE
E.S. Rubin, Carnegie Mellon

What Does It Cost ?What Does It Cost ?
E.S. Rubin, Carnegie Mellon

E.S. Rubin, Carnegie Mellon
Many Factors Affect Reported Many Factors Affect Reported Costs of COCosts of CO22 Capture Capture
• Choice of Process and Capture Technology• Process Design and Operating Variables• Economic and Financial Parameters• Choice of System Boundaries; e.g.,
Power plant only vs. partial or complete life cycleGHG gases considered (CO2 only vs. all GHGs)One facility vs. multi-plant system (regional, national, global)
• Time Frame of InterestCurrent technology vs. future (improved) systemsConsideration of technological “learning”

E.S. Rubin, Carnegie Mellon
Different Measures of Cost Different Measures of Cost Often Adds to the ConfusionOften Adds to the Confusion
• Cost per Unit of Product (e.g., $/MWh)• Cost of CO2 Avoided ($/ton CO2 avoided)• Cost of CO2 Captured ($/ton CO2 captured)
E.S. Rubin, Carnegie Mellon
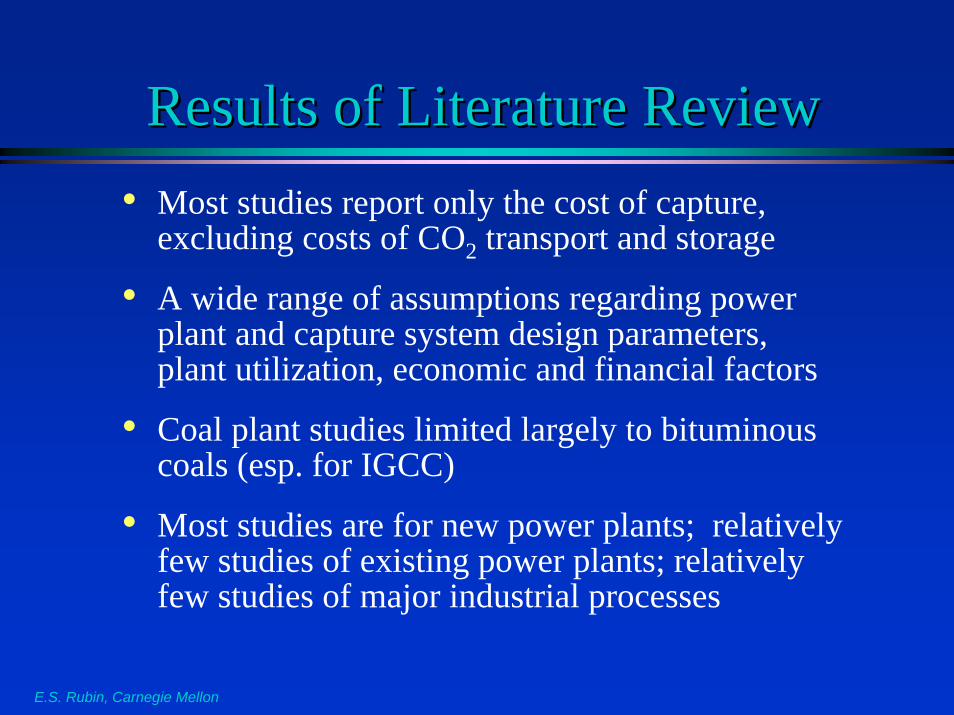
Results of Literature ReviewResults of Literature Review• Most studies report only the cost of capture,
excluding costs of CO2 transport and storage
• A wide range of assumptions regarding power plant and capture system design parameters, plant utilization, economic and financial factors
• Coal plant studies limited largely to bituminous coals (esp. for IGCC)
• Most studies are for new power plants; relatively few studies of existing power plants; relatively few studies of major industrial processes

Costs Based on Costs Based on Current Technology Current Technology

E.S. Rubin, Carnegie Mellon
Assumptions in Power Plant Cost StudiesAssumptions in Power Plant Cost Studies
Parameter Range in Recent Studies
Base Plant Efficiency Subcrit, supercrit, ultraSC, CCFuel Cost & Quality NG, bitum, subbit, lignite
CO2 Removal Efficiency 85% – 95% Capital Charge Rate 11% – 16%
Plant Size 300 – 800 MW
Plant Capacity Factor 50% – 95%
No single set of assumptions applies everywhere —differences in the site-specific factors above are the main
source of variability in reported CO2 capture costs

E.S. Rubin, Carnegie Mellon
Details of Cost Study Assumptions and Results are in the Full ReDetails of Cost Study Assumptions and Results are in the Full Report port

E.S. Rubin, Carnegie Mellon
Summary of COSummary of CO22 CCapture Costs apture Costs for New Power Plantsfor New Power Plants
NGCC Plant PC Plant IGCC Plant Cost and Performance Measures Range
low-high Rep. value
Range low-high
Rep. value
Range low-high
Rep. value
Ref. plant emissions (kg CO2/MWh) 344-379 370 736-811 760 682-846 770 Percent CO2 reduction per MWh (%) 83-88 86 81-88 85 81-91 86 Capital cost w/o capture ($/kW) 515-724 570 1161-1486 1290 1169-1565 1330 Capital cost with capture ($/kW) 909-1261 1000 1894-2578 2100 1414-2270 1830 Percent increase in capital cost (%) 64-100 76 44-74 63 19-66 37 COE w/o capture ($/MWh) 31-50 37 43-52 45 41-61 47 COE with capture ($/MWh) 43-72 54 62-86 73 54-79 62 Percent increase in COE w/capture 37-69 46 42-84 57 20-55 33 Cost of net CO2 captured ($/t CO2) 37-74 53 29-55 41 13-37 23
Costs include CO2 compression; PC and IGCC data are for bituminous coals only; Natural gas prices range from $2.8-4.4/GJ (LHV); Coal prices approx. $1.2/GJ; Other assumptions vary across studies.
(Excludes transport and storage costs; all costs in constant 2002 USD)

E.S. Rubin, Carnegie Mellon
Graphical Summary of Graphical Summary of Emissions vs. Emissions vs. CCapture Costapture Cost
(Excludes transport and storage costs; all costs in constant 2002 USD)
Based on current technology, bituminous coals and supercritical PC units; Natural gas prices $2.8-4.4/GJ (LHV), coal price ~$1.2/GJ Costs include CO2 compression. Other assumptions vary across studies.
0
20
40
60
80
100
0 0.1 0.2 0.3 0.4 0.5 0.6 0.7 0.8 0.9 1.0
Cos
t of E
lect
ricity
($ /
MW
h)
CO2 Emission Rate (tons CO2 / MWh)
New Plants with Capture
New Gas and Coal Plants without Capture
Pulv erized Coal Combustion (PC)
Coal Gasification Combined Cycle (IGCC)
Natural Gas Combined Cycle (NGCC)

E.S. Rubin, Carnegie Mellon
PC vs. IGCC Cost for Individual StudiesPC vs. IGCC Cost for Individual Studies
2.0
3.0
4.0
5.0
6.0
7.0
8.0
9.0
10.0
2.0 3.0 4.0 5.0 6.0 7.0 8.0 9.0 10.0
PC (cents/kWh)
IGC
C (c
ents
/kW
h)
Reference Plants
with CO2 Capture

E.S. Rubin, Carnegie Mellon
Transport & Storage CostsTransport & Storage Costs
• Pipeline transport of CO2 is most widely studied option. Annualized costs typically in the range of:
$1–5/ton CO2 shipped for on-shore pipelines 40–70% more for off-shore pipelines
• Main focus for CO2 storage is geologic sequestration. Storage costs are highly variable because of site-specific factors; range assumed for plant-level studies is:
$0.5–8.0/ton CO2 stored in deep saline formationsNet credit of $10–16/ton CO2 stored via EOR

E.S. Rubin, Carnegie Mellon
Cost of COCost of CO22 AvoidedAvoided
Assumes transport costs of 0–5 US$/tCO2, geological storage costs of 0.6–8.3 US$/tCO2, and net storage costs for EOR of -10 to -16 US$/tCO2.
Cost of CO2 avoided (US$/tCO 2 avoided) Type of Plant with CCS
NGCC Reference Plant PC Reference Plant
Power plant with capture and geological storage
NGCC 40–90 20–60
PC 70–270 30–70
IGCC 40–220 20–70
Power plant with capture a nd EOR
NGCC 20–70 0–30
PC 50–240 10–40
IGCC 20–190 0–40
E.S. Rubin, Carnegie Mellon
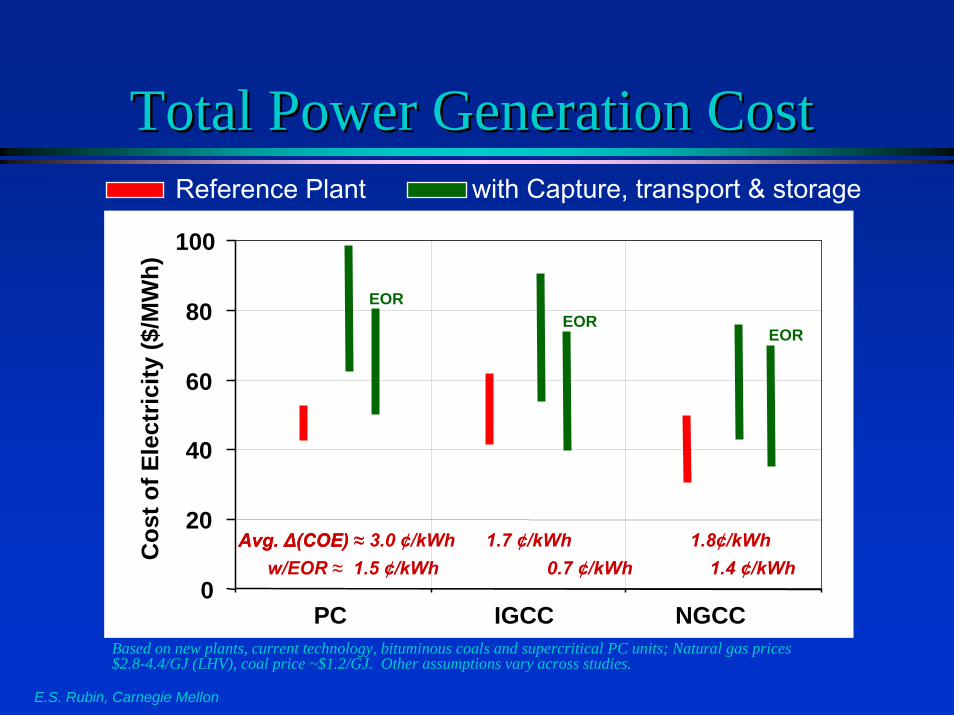
Total Power Generation Cost Total Power Generation Cost
Avg. ∆(COE) ≈ 3.0 ¢/kWh 1.7 ¢/kWh 1.8¢/kWh
0
20
40
60
80
100
0.5 2.5 4.5 6.5
Cos
t of E
lect
ricity
($/M
Wh)
PC IGCC NGCCBased on new plants, current technology, bituminous coals and supercritical PC units; Natural gas prices $2.8-4.4/GJ (LHV), coal price ~$1.2/GJ. Other assumptions vary across studies.
Reference Plant with Capture, transport & storage
EOREOR
EOR
Avg. ∆(COE) ≈w/EOR ≈ 1.5 ¢/kWh 0.7 ¢/kWh 1.4 ¢/kWh

E.S. Rubin, Carnegie Mellon
COCO22 Capture at Existing Power PlantsCapture at Existing Power Plants
• Retrofitting a CO2 capture unit is technically feasible but higher in cost than for new plants; site-specific retrofit difficulties may limit applications
• Most cost-effective approaches appear to be:Supercritical boiler rebuild + Amine scrubber Repowering with IGCC + CO2 capture
• Further study is needed to assess and compare options and their applicability to specific situations

E.S. Rubin, Carnegie Mellon
Other Industrial Processes StudiedOther Industrial Processes Studied(Costs based on current technology, excluding T&S costs)(Costs based on current technology, excluding T&S costs)
Process Approx. Cost of Capture
Hydrogen production plants$2 –56/ t CO2 avoided
5% –33% increase in product cost
Multi-product plants:Liquid fuels + Electricity
-$18 –13/ t CO2 avoided-13% –13% increase in product cost
Refineries & petrochemical plants—boilers and heaters $74 –116/ t CO2 avoided
Steel mill—blast furnace gas ~ $35/ t CO2 avoidedBiomass plants: Pulp mill liquor combustionIGCC biomass power plantSugar cane bagasse comb.
~ $34/ t CO2 avoided$25 –70 / t CO2 avoided
~ $53/ t CO2 avoided

Energy and Environmental Energy and Environmental Impacts of Capture Plants Impacts of Capture Plants
E.S. Rubin, Carnegie Mellon
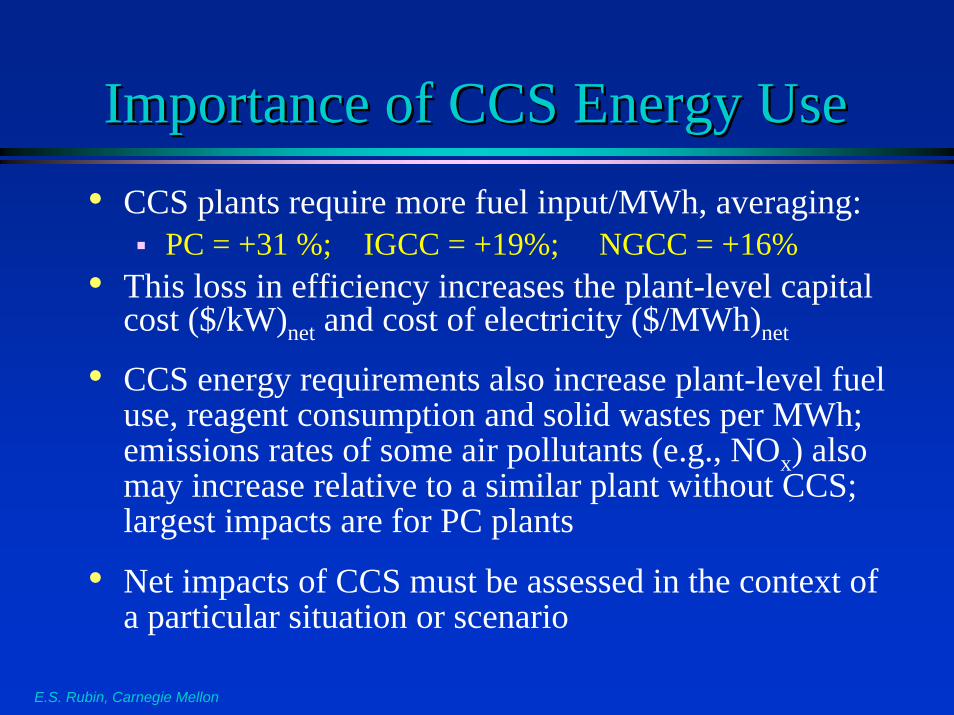
Importance of CCS Energy UseImportance of CCS Energy Use• CCS plants require more fuel input/MWh, averaging:
PC = +31 %; IGCC = +19%; NGCC = +16%• This loss in efficiency increases the plant-level capital
cost ($/kW)net and cost of electricity ($/MWh)net
• CCS energy requirements also increase plant-level fuel use, reagent consumption and solid wastes per MWh; emissions rates of some air pollutants (e.g., NOx) also may increase relative to a similar plant without CCS; largest impacts are for PC plants
• Net impacts of CCS must be assessed in the context of a particular situation or scenario

E.S. Rubin, Carnegie Mellon
Illustrative Impacts of Capture on PlantIllustrative Impacts of Capture on Plant--level Emissions & Resource Uselevel Emissions & Resource Use
PC b IGCC c NGCC d Capture Plant Parameter a Rate Increase Rate Increase Rate Increase Resource Consumption (all values in kg/MWh)
Fuel 390 93 361 49 156 23 Limestone 27.5 6.8 - - - - Ammonia 0.80 0.19 - - - -
CCS Reagents 2.76 2.76 0.005 0.005 0.80 0.80 Solid Wastes/ Byproduct
Ash/slag 28.1 6.7 34.2 4.7 - - FGD residues 49.6 12.2 - - - -
Sulfur - - 7.53 1.04 - - Spent CCS sorbent 4.05 4.05 0.005 0.005 0.94 0.94
Atmospheric Emissions CO2 107 –704 97 –720 43 –342 SOx 0.001 – 0.29 0.33 0.05 - - NOx 0.77 0.18 0.10 0.01 0.11 0.02 NH3 0.23 0.22 - - 0.002 0.002

Advanced TechnologiesAdvanced Technologiesfor COfor CO22 Capture Capture
E.S. Rubin, Carnegie Mellon
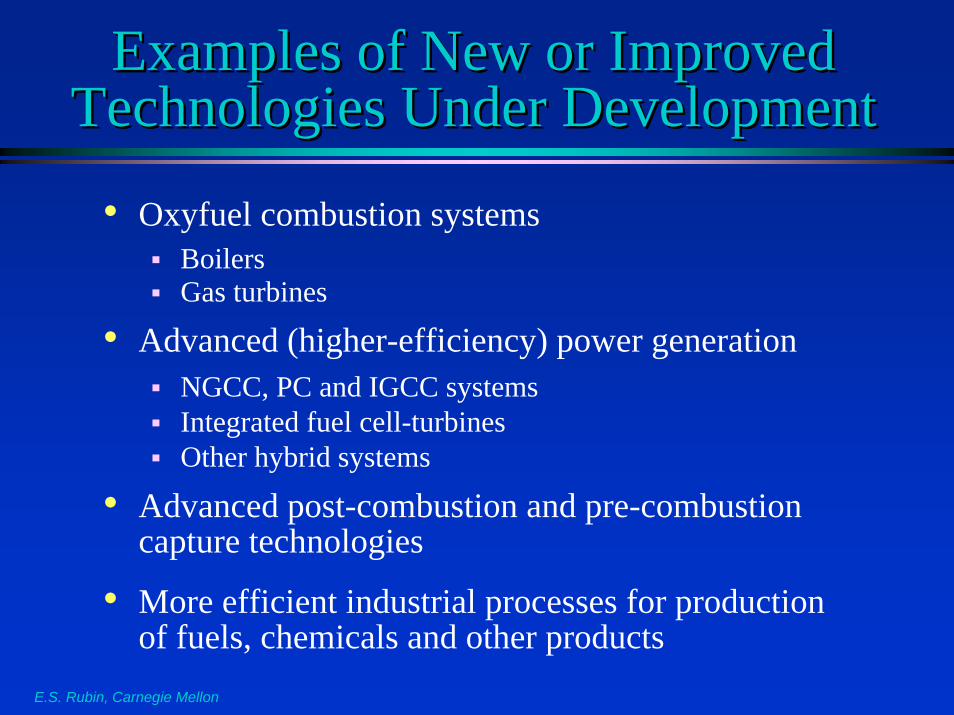
Examples of New or Improved Examples of New or Improved Technologies Under DevelopmentTechnologies Under Development
• Oxyfuel combustion systemsBoilersGas turbines
• Advanced (higher-efficiency) power generationNGCC, PC and IGCC systemsIntegrated fuel cell-turbines Other hybrid systems
• Advanced post-combustion and pre-combustion capture technologies
• More efficient industrial processes for production of fuels, chemicals and other products

E.S. Rubin, Carnegie Mellon
Implications for Future CostsImplications for Future Costs
• Cost reductions of at least 20 –30% are achievable in the near term
• Much more substantial cost reductions are expected with continued R&D and future deployment of CCS technologies in the marketplace
• Government policies will play a key role in determining the magnitude and timing of future CCS deployment

E.S. Rubin, Carnegie Mellon
Gaps in KnowledgeGaps in Knowledge
• Need for data on “true” performance and cost of CCS in large-scale (e.g., 500 MW) power plant applications
• Need for better understanding of advanced concepts and enabling technologies