assessment of grain loss due to insect pest during storage...
TRANSCRIPT

IOSR Journal of Agriculture and Veterinary Science (IOSR-JAVS)
e-ISSN: 2319-2380, p-ISSN: 2319-2372. Volume 3, Issue 5 (May. - Jun. 2013), PP 38-50 www.iosrjournals.org
www.iosrjournals.org 38 | Page
Assessment of grain loss due to insect pest during storage for
small-scale farmers of Kebbi
Iliyasu Mohammed Utono
(College of Agriculture P.M.B 1018, Zuru, Nigeria;
Abstract: Grain storage losses due to insect pests have been a serious problem threatens the livelihood of
small-scale farmers. Sampling and inspection of grain stores provide important information that is useful in
identifying and managing insects problems associated with grain storage. A survey of sampling farmers’ grain
stores was conducted in three geo-political regions (Central, North and South) of Kebbi state to gain a better
understanding of the insect pest species and the impending associated problems they cause in farmers grain
stores, and to help farmers with new approach (VDS) for assessing grain damage by themselves and compare
the precision of the new approach with conventional approach in assessing grain weight loss. The findings of
this research indicate that the VDS method is comparable (r2 = 0.76; t=14.19, df=147, p<0.001) with
conventional method of assessing weight loss and can be used as a rapid method of assessing the degree of
damage to grain and proportional loss for sorghum, millet and threshed maize. The most commonly found insect
was T. castaneum, followed by R. dominica. Sorghum significantly (χ2 = 230.62, df = 12, p < 0.003).had the
highest mean number of insect species, and the highest number of insects of each species, mainly T. castaneum (10.1±0.83) than found in millet (4.0±0.78), and maize (7.9±0.78). Threshed sorghum stored in storerooms in
the south significantly suffered most weigh loss than all other types of grain stored in both granaries and
storerooms in all regions. This study highlights the groups most in need of help with insect control.
Key words: Insects, Region, Threshed grain, Weight loss, Visual damage scale
I. Introduction Storage losses due to insect pest infestations have been a problem of major concern among small-
holder farmers who use traditional storage structures [1]; [2]. Inspection, sampling and monitoring of grain
stores provide baseline information that is useful in identifying and managing problems associated with grain
storage, particularly insect pest infestations. Information generated from these techniques can be useful in
evaluating the relative importance of loss-causing factors such as temperature, moisture content of grains the
presence of insect pest species and the effect of storage structures. Damage to stored grain is easier to categorise by visual observation of the relative amount of damage to the grain and by measuring the amount of weight loss
[3].
At a local farmer level, farmers judge damage and losses to their grain stores by visual observation of
the condition of their grain. Thus, development of simple and standardised methods of loss assessment that is
rapid and can be easily understood and conducted by farmers is important. Farmers need to be able to identify
and understand grain damage in their store and estimate of the likely economic value associated with each level
of grain damage. Understanding this damaged-economic value link could help farmers to better understand what
quality of grain is required by the market in order to improve their income. The visual damage scale (VDS)
method, whereby farmers are asked to assess the status of their grain against an annotated photograph of typical
loss categories (described in more detail below) has been found to be simple, rapid, easy to work with and
relatively standardized, producing outcomes similar to the more conventional ‘count and weigh’ weight loss
method [4]. The VDS method has already been established for maize cobs [4] and pearl millet [5], but not sorghum, threshed maize or un-threshed millet. Therefore, for this study, new visual damage scale (VDS) charts
were produced for these grains, as described below, with aim to:
* Established a rapid method of assessing the degree of damage to grain and proportional loss for sorghum,
millet and threshed maize.
* Use the VDS to help farmers gain an understanding of the process and importance of grain damage
assessment through participatory research, so that they can classify degree of grain damage and loss for
themselves.
* To compare the precision of the VDS assessment method with the conventional weight loss method.
* To obtain baseline data on the insect pest species and associated weight loss they cause in stored grain
amongst farmers in Kebbi * To identify the target farmers groups most in need of help with insect control.

Assessment of grain loss due to insect pest during storage for small-scale farmers of Kebbi
www.iosrjournals.org 39 | Page
II. Materials And Methods
2.1 Study area and grain stores sampling
This study was conducted in the three geo-political regions (Central, North and South) of Kebbi state.
Samples of grain were collected from 150 farmers’ stores ( 50 for each region) storing either sorghum, millet or maize (at least 15 stores for each type of grain) during storage season in a single visit to determine the insect
pest species present and to estimate the degree of damage and the proportional weight loss due to insect pests.
The store samples were obtained from the stores of at least five out of ten farmers presented by the village
extension agent in each of eight villages for each region. The sampling was done the same way in all the stores
of farmers chosen.
2.2 Estimating the proportion of grain loss due to damage caused by insects
Sampling grain in stores
The percentage damage caused by the insect pest species present here were estimated from samples of
grain collected from the farmers’ stores, using 50 cm, and 1 m compartmentalized sample spears. The 50cm
spear was used to collect 1kg samples from grain stored in bags and weight loss was calculated from 100g sub-
sample by the ‘count and weigh’ method [6]. The spear was effectively a long tube, with one side of the tube cut away, so that as the spear is pulled out of the bag, if the opening faces downward the grain in the tube will fall
into the collecting container.
The 1 m compartmentalized sample spear was used to collect grain samples stored in mass from
granaries and rooms. Each sample was taken by inserting the spear into the grain mass straight to the maximum
depth, and then rotating the inner tube to ensure that the open compartments filled up with grain, and then
rotated back to close the compartments. The spear samples were emptied, on a cloth spread on the ground. An
assessment of each pile of grain was done by visual analysis. Five samples were taken using the 1m spear from
different portions of the stored grain mass. The samples were pooled for final assessment and measuring weight
loss.
Developing a visual damage scale (VDS) for Kebbi region To help farmers learn how to assess losses in their stored grain themselves, a rapid loss assessment
method [7] (Compton et al., 1998; [4] was used. This method involve using a standardize visual damage scale
(VDS) which was developed for this research following the basic principles of [7] and [4]. A scale based on five
levels of damage was developed, with the first level being sound grain and each of the other levels increasing in
the proportion of damaged grain.
The five levels damage scale was defined in relation to the percentage of grain that showed evidence of
insect damage. The range of values that were chosen to define each level was based on levels that farmers
typically use to describe the relative use-value of a particular grain. For example, a sample of maize with > 85%
damage would not be suitable for home consumption, but would be used as animal food. Maize with about 70%
undamaged grains would be used for home consumption, depending on the financial status of the household, etc.
(Tables 1- 4). The percentage categories are not the same for every grain, as discussed in more detail below.
These scales are highly subjective, but it has been shown that the system is effective because it reflects the basis by which farmers usually assess the potential food or market value of their grain.
Assessment of grain loss due to insect pest during storage for small-scale farmers of Kebbi
www.iosrjournals.org 40 | Page
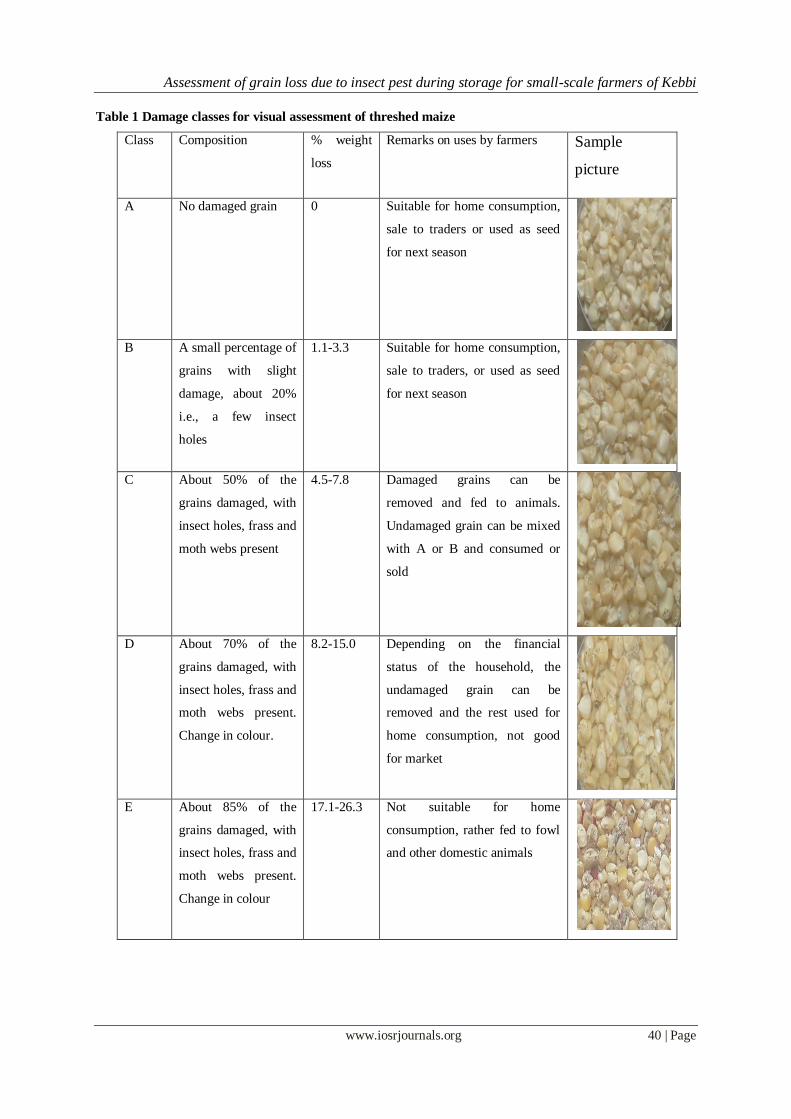
Table 1 Damage classes for visual assessment of threshed maize
Class Composition % weight
loss
Remarks on uses by farmers Sample
picture
A No damaged grain 0 Suitable for home consumption,
sale to traders or used as seed
for next season
B A small percentage of
grains with slight
damage, about 20%
i.e., a few insect
holes
1.1-3.3 Suitable for home consumption,
sale to traders, or used as seed
for next season
C About 50% of the
grains damaged, with
insect holes, frass and
moth webs present
4.5-7.8 Damaged grains can be
removed and fed to animals.
Undamaged grain can be mixed
with A or B and consumed or
sold
D About 70% of the
grains damaged, with
insect holes, frass and
moth webs present.
Change in colour.
8.2-15.0 Depending on the financial
status of the household, the
undamaged grain can be
removed and the rest used for
home consumption, not good
for market
E About 85% of the
grains damaged, with
insect holes, frass and
moth webs present.
Change in colour
17.1-26.3 Not suitable for home
consumption, rather fed to fowl
and other domestic animals
Assessment of grain loss due to insect pest during storage for small-scale farmers of Kebbi
www.iosrjournals.org 41 | Page
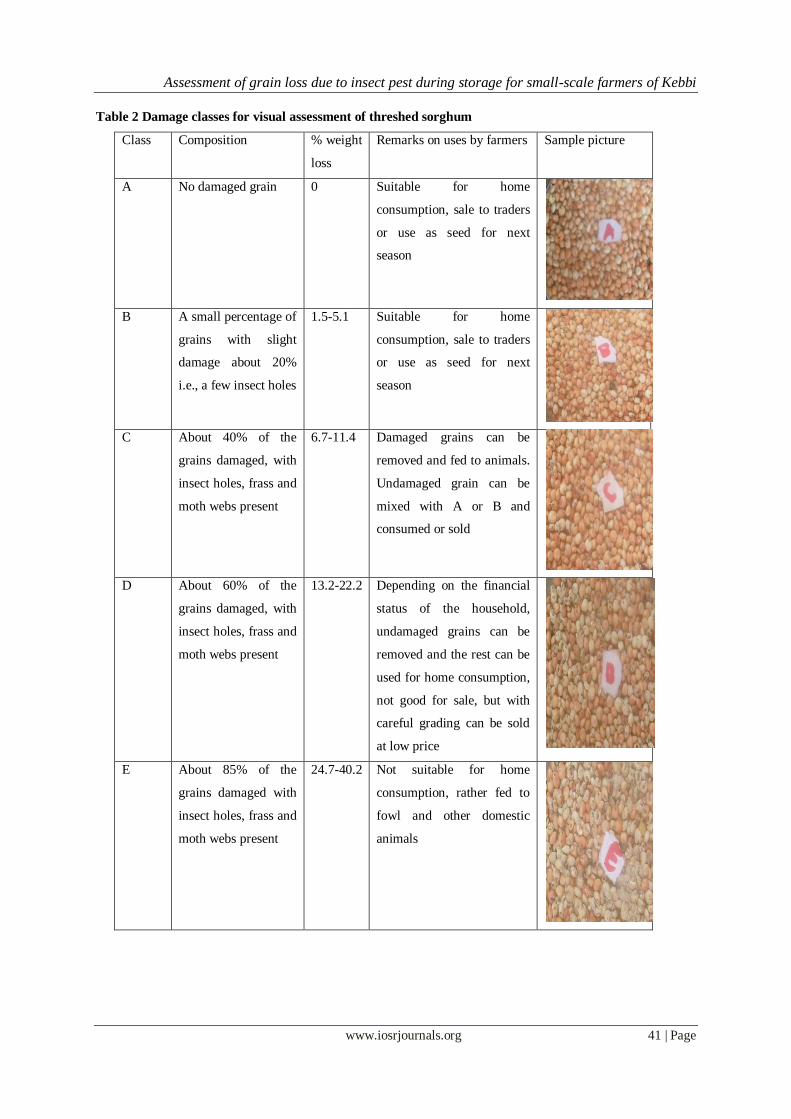
Table 2 Damage classes for visual assessment of threshed sorghum
Class Composition % weight
loss
Remarks on uses by farmers Sample picture
A No damaged grain 0 Suitable for home
consumption, sale to traders
or use as seed for next
season
B A small percentage of
grains with slight
damage about 20%
i.e., a few insect holes
1.5-5.1 Suitable for home
consumption, sale to traders
or use as seed for next
season
C About 40% of the
grains damaged, with
insect holes, frass and
moth webs present
6.7-11.4
Damaged grains can be
removed and fed to animals.
Undamaged grain can be
mixed with A or B and
consumed or sold
D About 60% of the
grains damaged, with
insect holes, frass and
moth webs present
13.2-22.2 Depending on the financial
status of the household,
undamaged grains can be
removed and the rest can be
used for home consumption,
not good for sale, but with
careful grading can be sold
at low price
E About 85% of the
grains damaged with
insect holes, frass and
moth webs present
24.7-40.2 Not suitable for home
consumption, rather fed to
fowl and other domestic
animals

Assessment of grain loss due to insect pest during storage for small-scale farmers of Kebbi
www.iosrjournals.org 42 | Page
Table 3 Damage classes for visual assessment of un-threshed sorghum
Class Description Average
weight loss
Remarks on uses by
farmers
Sample picture
A No damaged grains 0 Thresh and use for
home consumption,
sale to trader, or as
seed for next crop
season
B Very few damaged
grains
1.6-3.5 Thresh and use for
home consumption,
sale to trader, or as
seed for next crop
season
C Less than 50% grains
damaged and moth
webs present. Few
grains are destroyed
or missing
4.7-10.1 Threshed and sale to
traders at low price.
Can still be used for
home consumption or
sale to traders after the
damaged one are
removed
D More than 50% of
grains damaged or
contaminated with
moth webs and other
debris
13.2-23.3 Not good for home
consumption, remove
moth webbing and tie
into bales of about 70-
80 sorghum heads and
sale to livestock
owners

Assessment of grain loss due to insect pest during storage for small-scale farmers of Kebbi
www.iosrjournals.org 43 | Page
Table 4 Damage classes for visual assessment for un-threshed millet
Class Description Average
weight loss
Remarks by the
farmers
Sample picture
A No damaged grains 0 Thresh and use for
home consumption or
sale to traders. Can be
used as seed for next
crop season
B Very few grains
damaged about 30%
damaged grain
3.4-10.4 Thresh and use for
home consumption or
sale to traders. Can be
used as seed for next
crop season or sale
C 50% grains damaged
and moth webs
present. Few grains
are destroyed or
missing
11.6-20
Thresh and sale to
traders at low price.
With damaged one
removed can still be
used for home
consumption or sale
D More than 50% of
grains damaged or
contaminated with
moth webs and other
debris
22.4-28.4 Not suitable for home
consumption, rather fed
to livestock
Once the percentage ranges for the five most significant levels of damage for each type of grain had
been established, ‘standardized’ samples were produced representing the mean percentage damaged grains for
each level by mixing the appropriate proportions of damaged and undamaged grains. Photographs of the
standard samples were used to produce VDS charts for each type of grain representing the typical range of
damaged experienced in farm stores for each type of grain, i.e., Class A-E (Table 1-4). The mean percent weight
loss associated with each damage level of grain was determined by the ‘count and weigh’ method and added to the VDS charts as a second measure by which to score the class of a sample (Tables 1-4).
Similarly, the same visual damage method was followed for sorghum and millet heads (un-threshed).
The visual damaged scale was prepared by initially collecting of samples from different farm stores and

Assessment of grain loss due to insect pest during storage for small-scale farmers of Kebbi
www.iosrjournals.org 44 | Page
classified into four VDS of grade A-D as it occurred in the farmers stores, based on a sample of ~ 10
sorghum/millet heads for each damaged grade (Tables 1 & 4). However, weight loss for each VDS for these
grains was determined by applying a modified version of ‘count and weigh’ method of assessing weight loss to
each sorghum and millet head [7]. The calculated mean weight loss for each grade was used as a coefficient for
the number of grain heads in that grade A-D and used as a formula (see below) for assessing visual loss in
sorghum/millet heads.
Standard samples representing each damage class for each grain were carried in small plastic containers along
with the VSD charts to the field to help farmers assess the status of their stored grain. The famers grain damaged
and respective weight loss was assessed by collecting samples from farmers stores and each farmer was asked
to compare the sample with standard samples or VDS chart that was most like their stored grain. The
corresponding grain damage level in VDS chart and its weight loss was noted, and if the class score for farmers
sample fell between two classes on the VDS chart, this was noted in the assessment record, and an intermediate
class was declared (Example AB for intermediate class between Class A and B).
The percent weight loss for each farmer sample to be compared with the weight loss of the
corresponding VDS samples was calculated by collecting a 100g subsample of the samples drawn from stores
and then analyzed with the ‘count and weigh’ formula.
To assess the weight loss for the samples of sorghum and millet head, the number of grain heads corresponding to each class on the VDS was count and multiplied by the mean percent weight loss for that class
in the equation below; these values were added together and divided by the total number of samples of grain
heads to give overall estimate of weight loss.
Visual loss for sorghum= 0 x NA + 3.1 x NB + 5.4 x NC + 19.2 x ND
NT
Visual loss for millet= 0 x NA + 6.6 x NB + 17.8 x NC+24.4 x ND
NT
Where:
Values shown refer to the mean percent weight loss for the class designated
NA-ND = number of grain heads in each class A-D
NT = total number of grain heads in each sample – usually 50
2.3 Insect pest species identification
As many insects as possible were extracted from the grain samples with a Brass Impact Test sieves
(U.K.) (mesh sizes: 3.35 mm, 3.0 mm and 2.0 mm). Insect samples were kept in sealed containers and taken to
the laboratory at the College of Agriculture, Zuru, Kebbi, Nigeria for species identification using a light
microscope (STM- 9T 16-x magnification). The insects were observed under the microscope for species
identification, using the method of [8]
Samples of the pest moth P. interpunctella were obtained by hanging sticky Delta traps (20 x 21cm
base and 28 x 15cm sides, Agrisense, U.K.), baited with a pheromone lure (rubber septa) containing 0.1 mg of
P. interpunctella pheromone blend (Z9, E12 – 14:Ac, NRI) in grain storage structures. Each trap was suspended
in a central position above stored grain. Pitfall traps baited with a general beetle’s attractant (Agrisense, U.K.) were set in the stores, for two weeks to catch moths and beetles.
III. Statistical Analysis Linear regression analysis was used to compare the correlation between the two methods of assessing
weight loss (the VDS and Conventional methods). Analysis of variance (ANOVA) tests were performed using
statistical software package R-statistic windows, version 2.10.0 (www.r-project.org) to analyse the data for grain
weight loss, and chi-square was used for insect sampling data. A three way ANOVA analysis tested for the
following factors that might have a significant effect on weight loss: region (north, central, south), storage type
(granary, storeroom), grain type (threshed maize, threshed sorghum, unthreshed millet, unthreshed sorghum). The Tukey HSD test was used to compare the means of particular variables. Means are considered to be
significantly different when p≤0.05.
IV. Results
4.1 Comparison of VDS and Conventional method of assessing weight loss
The weight loss measured by the count and weigh method and the VDS method were calculated for
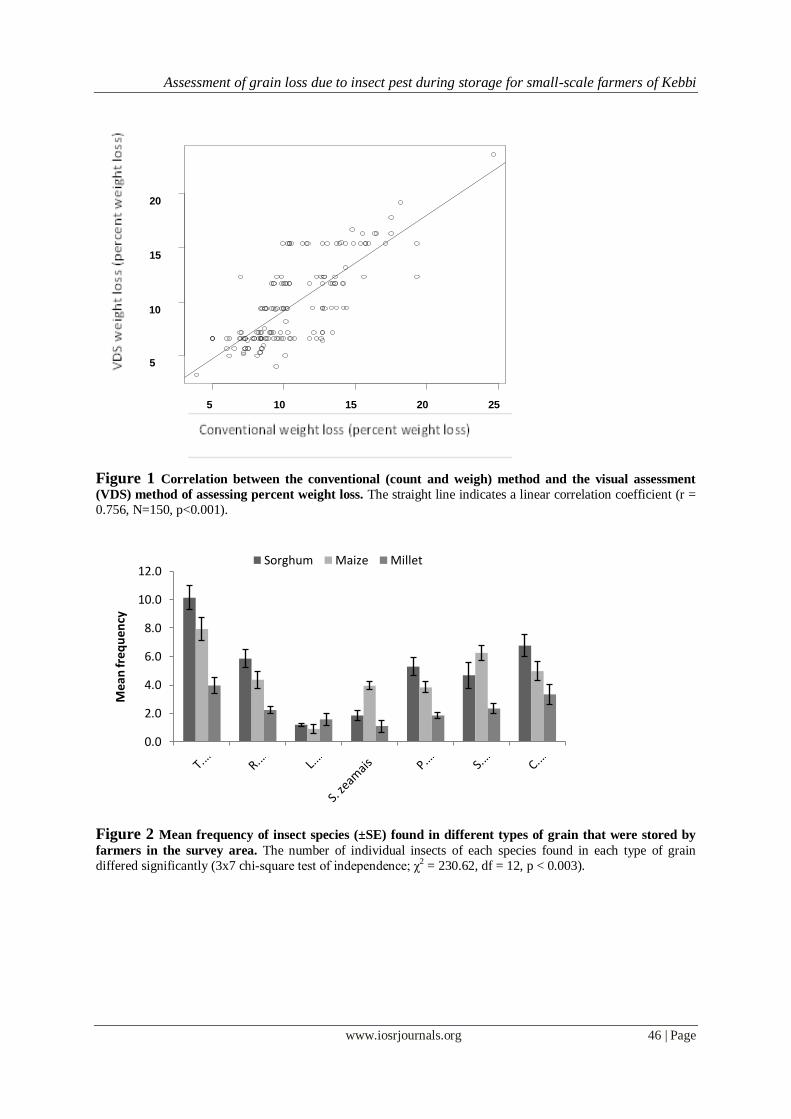
maize, sorghum and millet in order to compare their precision. The VDS method was highly correlated with the
count and weigh method (r2 = 0.756), i.e., there was a positive linear relationship (t=14.19, df=147, p<0.001,

Assessment of grain loss due to insect pest during storage for small-scale farmers of Kebbi
www.iosrjournals.org 45 | Page
Fig. 1), which suggests that data obtained by the quicker VDS method is a reasonable alternative to the more
time consuming conventional method.
4.2 Insect species found in different stored grain
In the grain samples used to assess weight loss, seven insect species were identified in sorghum, maize
and millet (threshed and unthreshed data pooled for each grain type, and method of storage pooled for each
grain type). Four species were coleopterans beetles (Tribolium castaneum, Rhyzopertha dominica, Sitophilus zeamais and Lasioderma serricorne), and the remaining three were lepidopteran moth species (Plodia
interpunctella, Sitotroga cerealella and Corcyra cephalonica). In total, 3707 insects were collected, including
T. castaneum, which was the most common species (n = 969), with the highest mean number found in sorghum
(~11/store), followed in rank order by maize (~9/store) and millet (4/store) (Fig. 2). The species found in the
second highest number was R. dominica (547), which was found in the greatest abundance in sorghum
(~6/store), followed by maize (5/store) and millet (~3/store). A total of 302 S. zeamais were recorded, with the
highest mean number in maize (~4/store), followed by sorghum (~2/store) and millet (~2). Lasioderma
serricorne was the least found with similar number (<2) in all the grain. For the Lepidoptera, C. cephalonica
was found in greater numbers (663) than the other two species; P. interpunctella (581) and S. cerealella (584),
with the highest mean number in sorghum (7/store), followed by maize (5/store) and millet (~4). Amongst all
the types of grain, millet had the lowest number of insect species. There was a statistically significant difference in the number of insect species found in the different types of grain (χ2 = 230.62, df = 12, p < 0.003).
4.3 Assessment of grain weight loss
To estimate the percentage weight loss in different types of grain stored in different types of storage
structures, grain samples were collected and assessed for weight loss using a conventional ‘count and weigh’
method. The ANOVA analysis showed that the following factors had a significant effect on weight loss: region
(F=7.4861, df=2, p<0.001), storage type (F=16.2781, df=1, p<0.001) and grain type (F=18.7144, df=3,
p<0.001). A significant difference in mean weight loss for grain type (p<0.001) was found only between
threshed sorghum (13.12±1.01) and all other grains, i.e. threshed maize (10.36±1.01), unthreshed millet
(9.52±0.91) and unthreshed sorghum (8.34±1.30), Tukey HSD. There was significantly greater amount of
weight loss (p<0.001) in storerooms (11.17±0.91) than granaries (8.21±0.81). And irrespective of grain type, a
significantly greater amount of weight loss (p<0.01) was found in the south (11.87±1.03) than in the central (9.20±0.92) and north (9.18±0.95) regions, suggesting that the latter two regions experience better grain
protection than the south region.
The results in Fig. 3 show the weight loss observed in the different grain stores (granary and room) of
famers in Kebbi central. It indicates that storerooms provided the most consistent protection with similar levels
of weight loss across all types of grain. There was an indication that grain stored in granaries provided better
protection to unthreshed grain (millet and sorghum) with greatest weight loss in threshed sorghum. However,
there was no significant effect of protection from weight loss in grain stored between storerooms and granaries
and across all types of grain within the same storage structure (Tukey HSD; p>0.05).
The results in Fig. 4 show the weight loss observed in the different grain stores of famers in the Kebbi
north. The results indicate that, both granaries and storerooms provided a similar level of protection with >7%
percentage weight loss across all types of grain, although <7% was found in threshed maize stored in granaries and unthreshed sorghum stored in rooms. Threshed sorghum stored in both storerooms and granaries had the
greatest weight loss (>11%). However, there was no significant difference in weight loss between storerooms
and granaries (Tukey HSD test; p>0.05).
The results in Fig.5 show the weight loss observed in the different grain stores of famers in Kebbi
south. There was a significant (p<0.05) effect of mean weight loss between threshed sorghum stored in
storerooms (>17%) and all other grain stored in storerooms and granaries (<12%), Tukey HSD.
Assessment of grain loss due to insect pest during storage for small-scale farmers of Kebbi
www.iosrjournals.org 46 | Page
Figure 1 Correlation between the conventional (count and weigh) method and the visual assessment
(VDS) method of assessing percent weight loss. The straight line indicates a linear correlation coefficient (r =
0.756, N=150, p<0.001).
Figure 2 Mean frequency of insect species (±SE) found in different types of grain that were stored by
farmers in the survey area. The number of individual insects of each species found in each type of grain
differed significantly (3x7 chi-square test of independence; χ2 = 230.62, df = 12, p < 0.003).
0.0
2.0
4.0
6.0
8.0
10.0
12.0
Mea
n fr
eq
uen
cy
Sorghum Maize Millet
5 10 15 20 25
5
10
15
20

Assessment of grain loss due to insect pest during storage for small-scale farmers of Kebbi
www.iosrjournals.org 47 | Page
Figure 3 Mean percent weight loss (±SE) observed in different types of grain stored using different
storage structures for eight months in Kebbi central (N= 50 stores). Standard error bars obtained from the
analysis of variance residuals. ANOVA test indicates no significant difference (p>0.05) in mean weight loss
between grain and types of storage structures.
Figure 4 Mean percent weight loss (±SE) observed in different types of grain stored using different
storage structures for eight months in Kebbi north (N= 50 stores). Standard error bars obtained from the
analysis of variance residuals. ANOVA test indicates no significant difference (p>0.05) found in the mean
weight between grain and types of storage structures.

Assessment of grain loss due to insect pest during storage for small-scale farmers of Kebbi
www.iosrjournals.org 48 | Page
Figure 5 Mean percent weight loss (±SE) observed in different types of grain stored using different
storage structures for eight months in Kebbi south (N=50 stores). Standard error bars obtained from the
analysis of variance residuals. The only significant difference found in the mean weight loss was between
threshed sorghum in rooms and all other grain in rooms and granaries unthreshed millet stored in bags and
granaries (Tukey HSD; p<0.05).
V. Discussion
Knowledge of storage conditions is a key to tackling storage problems. Accurate information about the
species of insect causing the worst infestations and infestation levels in different types of farmers’ grain stores
can help in planning appropriate action at the right time [9]. The study presented in this here undertaken to gain
a better understanding of farmers’ grain storage situations and the impending associated problems. The aim was
to develop a ‘user-friendly’ guide to identify the problems associated with grain storage and to help plan for
future improvements. Kebbi state farmers are faced with serious problems associated with grain storage insect
pests [10]. However, in the study area the insect pest species that cause the most important problems, the grain
that is attacked most seriously and the factors that contribute to these problems have not been well established.
In the research work presented in this study, the VDS weight loss method was developed to provide a rapid method of on-farm grain loss assessment and identification of insect pests most responsible for the damage. The
VDS method had already been developed for un-threshed maize at the laboratory level [4], however, the results
presented here demonstrate the application of VDS to obtain information from farmers about their perceptions
of grain loss due to insect infestations in their locality, i.e., for the crops stored most commonly in their area and
the insect pest most responsible for their stored crop losses.
The finding of this research indicates that the VDS method is comparable with conventional method of
assessing weight loss and can be used as a rapid method of assessing the degree of damage to grain and
proportional loss for sorghum, millet and threshed maize. More importantly can help farmers gain an
understanding of the process and importance of grain damage which they can classify degree of grain damage
and loss for themselves. Although the method might be open to some degree of error, as there may give an
under-estimate of percent damage and weight loss for some insect species, particularly those for which the
larvae bore into the grains [1]; [11], and therefore the damage to grains might not manifest during the time of assessments. However, as the name implies, VDS provides a practical and reasonably accurate assessment of
grain based on a quick and simple visual observation.
The VDS method presented to farmers included the most common locally stored grains (sorghum,
millet and maize), categorised into grades of damage from the ‘no damage’ to ‘most damage’, based on ranges
of percent weight loss that had been determined previously as standards. The results and information obtained
from famers’ use of VDS indicates that it would be a useful way to involve farmers in assessing grain infestation
and insect pest damage. For instance, during the survey, after a short argument among them, participating
farmers were able to agree on the economic value and use of each grade in their locality. They determined that
for the stored threshed maize to be marketed, it must have < 50% damaged grains (5.7% weight loss), for
sorghum <40% damaged grains (7.2% weigh loss) and for unthreshed millet <50 damaged grains (17.8% weight

Assessment of grain loss due to insect pest during storage for small-scale farmers of Kebbi
www.iosrjournals.org 49 | Page
loss). They also concluded that grain containing even higher percentages of damaged grains could be sold in the
market if the damaged grain could be removed and mixed with sound grain. However, when the percentage
damaged grains was about 70% for maize, 60% for sorghum and > 50% for millet farmers felt their only option
was to remove damaged grains to be used as feed for the animals and use the undamaged grains for home
consumption. The main problem with grain containing high levels of damaged grains is the high content of
insect frass and debris. [8] Reported that grain that is heavily infested by insects usually has a strong smell of
insect and debris, which discourages potential buyers. The market has a limited tolerance to the quality of grain it can accept, beyond which farmers have no option but to mix some of the high quality grain with the low
quality grain to re-grade the grain overall, or if the grain is highly damaged, use it to feed animals, which is a
great economic loss to the household. The information obtained from local farmers about their assessment of the
potential use and value of each VDS Class in their locality was added to the VDS chart (Table 4.2 – 4.5), which
will provide a useful reference to help all the farmers in the area check the status of their stored grain throughout
the storage season and help them make decisions about how and when to improve their grain storage practices.
In Kebbi, the study area, information on the most damaging insect species’ and the type of grain most
damaged is not well established. Therefore, a part of this study was carried out to obtain baseline data on the
insect pest species and associated weight loss they cause in the different storage structures used by farmers.
The most commonly found insect was T. castaneum, followed by R. dominica, C. cephalonica, P.
interpunctella, S. cerealella and L. serricorne. It is not surprising that sorghum suffered the most weight loss of the crops assessed, as it had the highest number of pest species, and the highest number of insects of each
species, mainly T. castaneum, R. dominica and C. cephalonica. These findings are consistent with [12] and
[13] reports that the level of damage to stored grain due to insects depends on the type and population size of
pests in the grain, as well as the influence of environmental factors that support their development.
The analysis of grain weight loss due to insect damage for the different types of grain stored in the
different regions indicates that sorghum stored in threshed state had more weight loss than sorghum stored in
unthreshed form. The effect of weight loss varies in threshed sorghum stored in rooms in the south and all other
types of grain stored in both granaries and rooms in all regions. This suggests preferences of insects to certain
types of grain, storage structure and region than the others. Granary is a storage facility known to be used by
many small-holder farmers in many parts of Africa, including Nigeria [14] and [15]. However, in this research it
was found that many farmers store their grain in storerooms associated with the main dwelling, either in bags or
just loose in the storerooms. Considering the nature and the type of the room used by farmers for grain storage in the surveyed area, it is not surprising that grain stored in loose or in bags in storerooms had more weight loss
than grain stored in granaries. Some granaries that are common in the study area are sealed, with only one
access on the roof or a small window on the side. This is contrary to the conditions of storerooms found in the
surveyed area; they have many openings, such as small doors as an entrance to the room and sometimes
windows. Items other than grain are often stored alongside the grain, which increases the movement of people.
Hence, there is a greater chance of grain loss due to insects, moisture and pathogens, which can move more
easily in and out of this type of store compared to local granaries.
VI. Conclusion
This part of the survey was intended to be a quick study to get an indication of which type of grain in
which region was most in need of improvements to insect pest control. Therefore, despite the variability in the
data for weight loss assessment, it appears that sorghum attacked most by the storage insects mainly T.
castaneum in the southern region. This insect causes the most damage, especially when sorghum is stored in
storerooms rather than in granaries. For farmers to enjoy the market value of their stored sorghum, it must be
maintained within the accepted market quality. Based on the analysis of damage levels and weight loss done in
this phase of the research most of the grain observed was damaged above the level accepted for sale in the
market. Hence, this highlights the area that requires intervention; low-income farmers, who cannot maintain
conditions required to produce good quality stored grain, due to their financial status or access to good storage
management facilities, are more liable to produce and live off of food of low nutrient value, thus are most in
need of help with a better insects’ control.
References [1] Gwinner, J., Harnisch, R. and Műck, O. Manual on the prevention of post-harvest grain losses, post-harvest project, Pickhuben 4,
D-2000 Hambung, 1990.
[2] Mendalis, E., Abdeta, C., Tesfaye, A., Shumeta, Z. and Jifar, H. Farmer’s perceptions and management practices of insect pest on
stored sorghum in Ethiopia. Crop Protection 26, 2007 1817-1825.
[3] Anonymous.. Post-harvest food losses in developing countries. Board on Science and Technology for International development
Commission on International Relations, National Resources Council. National Academy of Science Washington DC. 1978, 206pp.
[4] Compton, J.A.F. and Sherington, J. Rapid assessment methods for stored maize cobs: weight losses due to insect pests. Journal of
stored products Research 35, 1999. 77-87.

Assessment of grain loss due to insect pest during storage for small-scale farmers of Kebbi
www.iosrjournals.org 50 | Page
[5] Hodges, R.J.. Post-harvest Team: Preparatory activities for a mahangu storage management survey and loss assessment baseline.
National Agricultural Support Services Programs (NASSP) In Namibia, 2005.
[6] Adams, J.M. and Schulten, G.G.M. Losses caused by insect mites and microorganisms. In: Harris, K.L. and Lindblad. Post-harvest
grain loss assessment methods: a manual of methods for the evaluation of post-harvest losses. (England: American Association of
Cereal Chemist, 1978) 83-99.
[7] Compton, J.A.F., Floyd, S., Ofosu, A. and Agbo, B. The modified count and weight method: an improve procedure for assessing
weight loss in stored maize cobs. Journal of Stored Product Research 34 (4), 1998, 277-285.
[8] Dobie, P., Haines, C.P., Hodges, R.J., Prevett, P.F. and Rees, D. P. . Insects and Arachnids of tropical stored products: Their
biology and identification (training manual). (Natural Resources Institute, Chatham Maritime, UK, 1991) P.232.
[9] Loewer, O.J., Bridges, T.C. and Bucklin, R.A. On-farm Drying and storage system. (United State of America: American Society of
Agricultural Engineering, 1994) 560pp.
[10] KARDA (Kebbi Agriculture and Rural Development Authority). Agricultural potentials of Kebbi State. KARDA along Kalgo road,
Birnin Kebbi, Kebbi State, Nigeria, 2004.
[11] Cronholm, G., Knutson, A., Parker, R., Teettes, G. and Pendleton, B. Managing insect and Mite pests of Texas sorghum. Texas
Agric. Exp. Stat. Bull., B-1220. 1998, 26pp.
[12] FAO (Food and Agriculture Organization). Introduction to general taxonomy and biology/ ecology of stored product insect pests.
In: Semple, R.L., Hicks, P.A., Lozare, J.V. and Castermans, A. (Eds.). Towards integrated commodity and pest management in
grain storage. Training manual for application in humid tropical storage system. FAO Cooperate document repository, 1992.
http://www.fao.org/docrep. [13] Odogola, W.R. Post-harvest management and storage of food legumes: Technical system for Agriculture. (Zimbabwe:
AGROTECC . 1994) 59pp.
[14] Udoh , J.M., Cardwell, K.F. and Ikotun, T. Storage structures and aflatoxin content of maize in five agro-ecological zones of
Nigeria. Journal of Stored Product Research 36, 2000, 187-201.
[15] Bett, C. and Nguyo, R. Post-harvest storage practices and techniques used by farmers in Semi-arid Eastern and Central Kenya.
African Crop Science Conference Proceedings 8, 2007. 1023-1227.