assessment of novel utilisation pathways for biogas and
TRANSCRIPT

Assessment of novel utilisation pathways for biogas and nitrogenous waste streams at
wastewater treatment plants
Oliver Richard Grasham
Submitted in accordance with the requirements for the degree of Doctor of
Philosophy as part of the integrated PhD with MSc in Bioenergy
April 2019
Centre for Doctoral Training
School of Chemical and Process Engineering
University of Leeds


I
Declaration of Authorship
The candidate confirms that the work submitted is his own, except where work,
which has formed part of jointly authored publications, has been included. The
contribution of the candidate and the other authors to this work has been
explicitly indicated below. The candidate confirms that appropriate credit has
been given within the thesis where reference has been made to the work of
others.
Much of the work contained in Chapter 5 is based on the following
publication:
Grasham O, Dupont V, Camargo-Valero MA, García-Gutiérrez P, Cockerill T.
Combined ammonia recovery and solid oxide fuel cell use at wastewater
treatment plants for energy and greenhouse gas emission improvements.
Applied Energy 2019;240:698–708.
As lead author, the candidate performed all numerical modelling, process
modelling, data analysis and the candidate also wrote the manuscript. The
remaining authors provided supervision, guidance and corrections to the
manuscript.
This copy has been supplied on the understanding that it is copyright material
and that no quotation from the thesis may be published without proper
acknowledgement.
© The University of Leeds and Oliver Richard Grasham

II
Acknowledgements
First and foremost, I would like to express my profound gratitude to Dr. Valerie
Dupont, Dr. Miller Alonso Camargo-Valero and Prof. Timothy Cockerill for their
supervisory and moral support during my PhD. Without Dr. Dupont’s initial
encouragement to apply for the Bioenergy Centre for Doctoral Training, I would
not be submitting this thesis, or any thesis at all. Her weekly meetings since
have been a constant source of encouragement, motivation and insight. For this
I am truly grateful.
There are other University of Leeds staff members I would also like to thank for
their expertise and assistance, including; Emily Bryan-Kinns, James McKay,
Karine Alves Thorne, Dr. David Elliot, Sheena Bennett, Kevin Dyer, Scott
Prichard and Ed Woodhouse. Without whom, this submission would be
happening many, many months in the future. On a similar note, I would like to
reserve special thanks to Dr. Christian Aragon Briceño, Cigdem Oz and Dr.
Tande Lifita Nguve whose patience, humour and training in the lab
unequivocally enhanced my aptitude and enjoyment. A special mention also to
the staff at Esholt WWTP and Yorkshire Water for their help and willingness to
assist me with data and sample collection.
My appreciation extends to the EPSRC for their funding via the Bioenergy
Centre for Doctoral Training and NWaste2H2 grant - making this entire process
possible. I have spent much of the last three and a half years with Dr. Lee
Roberts, Robert White, Hana Mandova, Kiran Palmer, Charlotte Stead, Diarmaid
Cleary, Andy Dyer and Gillian Finnerty. From day one, the surrounding wit,
passion and drive, bettered me as a researcher but more so as a person. Further
recognition to Dr. Douglas Phillips, Dr. Dave Allen, Daisy Thomas, Andy Price
and Fernando Barba whose friendship has been an invaluable distraction.
Outside of the University; Rory Dormer, Matt Jakeman, Jack Hutchinson, Lizi
Gilham, Martin Ashcroft, Nicole Ashcroft, Fin Boyter, Joe Gumb, Matt Quigley
and Gavin Schofield have been a constant crutch and you have my lifelong
appreciation of your friendship. Catriona Dunn has been there every step of the

III
way with me, your love and laughter has kept me going. I cannot thank you
enough. I am indebted to you and hope I can replicate the support yo u have
given me during your PhD.
My mother Clare, my father Nigel, my sisters Patricia and Victoria, my Nan Betty
and those no longer here, have been and continue to be my inspiration. Thank
you.
Missy, this is for you.

IV
Abstract
A combination of process modelling, numerical modelling, economic analysis
and experimental techniques have been used to analyse novel utilisation
pathways for biogas and nitrogenous waste streams at wastewater treatment
plants. An assessment of a large wastewater treatment plant serving a
population equivalent of 750,000 people was carried out including
compositional analysis of various streams at the facility. This facilitated three
key findings that function as the bedrock for the rest of study: the facility’s
greenhouse gas footprint, its energy balance and its digestate liquor ammonia
concentration.
Aspen Plus process modelling software was used to develop a system that
recovers ammonia in a way that prepares it for thermochemical decomposition
to hydrogen and nitrogen. Sensitivity analysis showed that air stripping was
energetically preferable to steam stripping as the base recovery technology.
This was proceeded by an absorption step that uses a water-only solvent and
finally a distillation step that was found to be energetically preferential to flash
separation. The modelling showcased an ability to recover 91% of ammonia
contained in the digestate liquor. Ordinarily, the wastewater treatment plant
would recycle the liquor back into its conventional process. By recovering the
ammonia, and diverting it away from conventional treatment, it is proposed
that the plant will experience significant reductions in energy consumption and
GHG emissions.
Aspen Plus was used to develop a process model that combines the recovery of
ammonia with the operation of an internally reforming solid oxide fuel cell
stack, which uses a blend of biomethane and ammonia as its fuel. A numerical
model was developed that precisely calculates its power production potential,
based on a commercially available solid oxide fuel cell stack. It was found to
operate at a net electrical efficiency of 48% and if implemented at the
referenced wastewater treatment plant, would increase the site’s power
production by 45%. It was also proposed that the site’s lifecycle GHG emissions
would reduce by 7.7% due to a combination of ammonia diversion and reduced
grid electricity consumption. An economic study showed that it would be

V
financially viable to implement this technology at the site with a positive net
present value facilitated after eight years of operation.
A process model was developed which utilises recovered ammonia and
biomethane as feedstock for a thermochemical H2 production system. Steam to
carbon ratios of 2, 3 and 4 were analysed to assess their impact on H2
production, energetics and financial viability. The scenario with a steam to
carbon ratio of 3 showcased the best economic potential with net present value
becoming positive during its 14th year of operation. It was proposed that if the
H2 produced was used as a vehicle fuel for bus transportation the process
implementation would reduce the facility’s lifecycle GHG emissions by 25%.
An H2-rich syngas was generated experimentally using ammonia, methane and
steam feeds in a fixed-bed reactor holding a conventional Ni-Al catalyst.
Ammonia, methane and carbon monoxide conversions were less than
predicted via equilibrium calculations. However, the general selectivity of
products closely resembled that of equilibrium equivalents – showcasing an
ability to combine the steam reforming of methane and the decomposition of
ammonia in a single reactor.

VI
Table of Contents
Declaration of Authorship..................................................................................................................... I
Acknowledgements ................................................................................................................................. II
Abstract .........................................................................................................................................................IV
Table of Contents.....................................................................................................................................VI
List of Tables ............................................................................................................................................ XII
Table of Figures ...................................................................................................................................... XV
Abbreviations............................................................................................................................................XX
Nomenclature ....................................................................................................................................... XXII
1 Introduction ........................................................................................................................................1
1.1 Opening Remarks & Rationale.......................................................................................1
1.1.1 Climate Change and UK Policy .............................................................................1
1.1.1 Nitrogen removal at wastewater treatment plants – energy use
and GHG emissions .........................................................................................................................2
1.1.2 H2 Potential ......................................................................................................................4
1.1.3 Energy Recovery at wastewater treatment plants ..................................5
1.1.4 Research Problem........................................................................................................6
1.1.5 Research Gap ..................................................................................................................7
1.2 Aims, Scope, Objectives ......................................................................................................8
1.2.1 Aims......................................................................................................................................8
1.2.2 Objectives..........................................................................................................................8
1.3 Thesis Structure...................................................................................................................11
2 Literature Review .........................................................................................................................13
2.1 Anthropogenic Nitrogen Balance..............................................................................13
2.2 Wastewater treatment plant design and sewage system ..........................14
2.2.1 Pre-treatment ..............................................................................................................16

VII
2.2.2 Activated Sludge Process ..................................................................................... 17
2.2.3 Nitrification/Denitrification during ASP.................................................... 17
2.2.4 Activated Sludge Process Design .................................................................... 21
2.3 Anaerobic Digestion.......................................................................................................... 23
2.3.1 Overview ........................................................................................................................ 23
2.3.2 Biogas Purification ................................................................................................... 25
2.3.3 Digestate......................................................................................................................... 28
2.3.4 Digestate Separation............................................................................................... 29
2.4 Energy at wastewater treatment plants............................................................... 30
2.5 Hydrogen ................................................................................................................................. 32
2.5.1 Hydrogen Background........................................................................................... 32
2.5.2 Safety ................................................................................................................................ 34
2.6 Current hydrogen production methods ............................................................... 35
2.6.1 Steam Reforming....................................................................................................... 35
2.6.2 Water Electrolysis .................................................................................................... 38
2.6.3 Dark fermentation.................................................................................................... 39
2.6.4 Ammonia-based hydrogen studies ................................................................ 40
2.6.5 Steam reforming with unconventional reagents................................... 41
2.6.6 Hydrogen generation at wastewater treatment plants..................... 41
2.7 Ammonia Recovery Options ........................................................................................ 44
2.7.1 Stripping......................................................................................................................... 44
2.7.2 Membrane Technology.......................................................................................... 48
2.8 Fuel Cell Technology ........................................................................................................ 49
2.8.1 Solid oxide fuel cells ................................................................................................ 50
2.8.2 Molten Carbonate Fuel Cell................................................................................. 54
2.9 UK Renewables Incentives ........................................................................................... 55

VIII
2.9.1 Non-Domestic Renewables Obligation ........................................................56
2.9.2 Feed in Tariffs..............................................................................................................57
2.9.3 Contracts for Difference ........................................................................................57
2.9.4 Non-Domestic Renewable Heat Incentive .................................................58
2.10 Concluding remarks ..........................................................................................................59
3 Wastewater Treatment Plant Assessment ....................................................................61
3.1 Introduction ...........................................................................................................................61
3.2 Process Description...........................................................................................................61
3.3 Wastewater Characterisation & Mass Balance Methodology..................63
3.3.1 Sampling .........................................................................................................................63
3.3.2 Sample Preparation .................................................................................................63
3.3.3 Total Kjeldahl nitrogen (TKN) and total ammoniacal nitrogen
(TAN) 64
3.3.4 Chemical Oxygen Demand (COD)....................................................................65
3.3.5 Total suspend solids (TSS) and volatile suspended solids (VSS) 66
3.3.6 Total phosphorus (TP) and phosphate determination (PO4) ........67
3.3.7 Interpretation of Mass flow ................................................................................68
3.4 Results .......................................................................................................................................69
3.4.1 Characterisation.........................................................................................................69
3.4.2 Mass Flows ....................................................................................................................71
3.4.3 Current Esholt energy inventory.....................................................................76
3.4.4 Current Esholt GHG inventory ..........................................................................78
3.5 Concluding Remarks .........................................................................................................79
4 Ammonia Recovery .....................................................................................................................81
4.1 Introduction ...........................................................................................................................81
4.2 Process Design......................................................................................................................82

IX
4.2.1 Sensitivity Analysis .................................................................................................. 84
4.2.2 Economic Costing ..................................................................................................... 89
4.3 Results and Discussion.................................................................................................... 91
4.3.1 Stripping Sensitivity Analysis ........................................................................... 91
4.3.2 Absorption and Flash Sensitivity Analysis ................................................ 94
4.3.3 Flash Separation ........................................................................................................ 96
4.3.4 Distillation..................................................................................................................... 99
4.3.5 Ammonia recovery: combined process.................................................... 101
4.3.6 Economic Analysis ................................................................................................ 106
4.4 Conclusions ......................................................................................................................... 110
5 Solid Oxide Fuel Cell operating on recovered NH3 and Bio-CH4 .................. 112
5.1 Introduction........................................................................................................................ 112
5.2 Process Design .................................................................................................................. 115
5.2.1 Biogas Clean-up System..................................................................................... 119
5.3 Numerical Modelling Method .................................................................................. 120
5.3.1 Cell Voltage ................................................................................................................ 120
5.3.2 Nernst Voltage Potential ................................................................................... 121
5.3.3 Activation Voltage Loss ...................................................................................... 122
5.3.4 Ohmic Voltage Loss............................................................................................... 123
5.3.5 Concentration Voltage Loss............................................................................. 123
5.3.6 Efficiency Calculations........................................................................................ 124
5.3.7 Sensitivity Analysis methodology................................................................ 125
5.4 Economic Analysis Methodology ........................................................................... 125
5.4.1 Equipment Costing................................................................................................ 126
5.4.2 Economic Feasibility Analysis Methodology ........................................ 127
5.4.3 Economic Sensitivity Analysis ....................................................................... 128

X
5.5 Results and Discussion .................................................................................................129
5.5.1 Process Modelling Results ................................................................................129
5.5.2 Numerical Modelling Results..........................................................................134
5.5.3 Wastewater Treatment Plant Impact: Energy and GHG Emissions
139
5.5.4 Economic Analysis.................................................................................................141
5.6 Constraints, Considerations and Further Work............................................147
5.7 Conclusions..........................................................................................................................148
6 Hydrogen Production Process ...........................................................................................150
6.1 Introduction and background ..................................................................................150
6.1.1 Steam Methane Reforming ...............................................................................150
6.1.2 Water-gas Shift ........................................................................................................153
6.1.3 Ammonia Decomposition..................................................................................154
6.1.4 Economics of thermochemical hydrogen production .....................154
6.2 Process Design...................................................................................................................155
6.2.1 Calculator Blocks ....................................................................................................157
6.2.2 Process Modelling Sensitivity Analysis Methodology .....................158
6.3 Economic Analysis Methodology ...........................................................................161
6.4 Results and Discussion .................................................................................................163
6.4.1 Sensitivity Analysis ...............................................................................................163
6.4.2 Final Process Conditions ...................................................................................166
6.4.3 Economic Analysis.................................................................................................178
6.5 Wastewater treatment plant energy and GHG emission impacts......185
6.6 Conclusions..........................................................................................................................187
7 Experimental Feasibility of Bio-H2 Production from AD-generated NH3 and
CH4 using combined catalytic cracking and steam reforming. ................................189

XI
7.1 Background and Introduction ................................................................................. 189
7.2 Experimental Rig and Equipment Description ............................................. 190
7.3 Catalyst Preparation ...................................................................................................... 194
7.4 CHN analysis....................................................................................................................... 195
7.5 Ammonia analysis ........................................................................................................... 195
7.6 Experimental Procedure ............................................................................................. 197
7.7 Output analysis ................................................................................................................. 199
7.8 Equilibrium Modelling ................................................................................................. 201
7.9 Experimental Results and Discussion................................................................. 204
7.9.1 Syngas Composition ............................................................................................. 204
7.9.2 Overall ammonia contribution ...................................................................... 217
7.10 Methodological flaws and further work ............................................................ 219
7.11 Conclusions ......................................................................................................................... 220
8 Conclusions and Future Work ........................................................................................... 222
8.1 Ammonia recovery ......................................................................................................... 223
8.2 SOFC operation ................................................................................................................. 224
8.3 H2 production .................................................................................................................... 225
8.4 Comparison of process routes................................................................................. 226
8.5 Future direction ............................................................................................................... 227
9 References ..................................................................................................................................... 229
10 Appendices ............................................................................................................................... 262
10.1 Appendix A .......................................................................................................................... 262
10.2 Appendix B. ......................................................................................................................... 267
10.3 Appendix C........................................................................................................................... 269
10.4 Data referred to in Chapter 7 ................................................................................... 269

XII
List of Tables
Table 2-1. Typical Screening Composition [72] ..................................................................16
Table 2-2 Biogas chemical composition [9] ...........................................................................24
Table 2-3. Average EUI values from literature for respective regions ..................31
Table 2-4. RHI tariff rates as of 1 January 2019 [246] ....................................................59
Table 3-1. Required sample size for TKN and TAN determination .........................64
Table 3-2. Required sample dilution fraction for COD determination ..................66
Table 3-3. Required sample size for TP determination ..................................................67
Table 3-4. Average results for each parameter at each sample point ..........from
Esholt WWTP (mg l-1)………………………………………………………………………………… ...69
Table 3-5 Ofgem data for electricity production at Esholt WWTWs between
December 2013-March 2018 [256]. (Data excluded where capacity factor is
<10%) ............................................................................................................................................................77
Table 4-1 Aspen Plus blocks and property method descriptions.............................84
Table 4-2. Required water outlet for associated downstream S:C ratios. ...........97
Table 4-3. Required vapour fraction operation for the flash separator, quantity
of ammonia recovered and heating requirements when quantity of water for
future modelling scenarios with differing S:C ratios. Vapour fraction
relationship with water vapour outlet: y = 0.00725x + 0.01165. Ammonia
recovery relationship with water vapour outlet: y = 0.90037 + 0.06642x -
0.00103x2 + 5.91E-06x3. Heat duty relationship with water vapour outlet: y = -
4.51775 + 5.46941x + 0.02442x2. ................................................................................................99
Table 4-4. Sensitivity data showing the least energy consuming results for
incoming flow rates for distillation at 40 kmol h-1 intervals. ...................................100
Table 4-5. Stream composition for final ammonia recovery process. ................102
Table 4-6. Energy consumption of process and components. .................................106
Table 4-7. Equipment capital costs and total installed costs (includes capital
and installation expenditure) from Aspen Process Economic Analyser ...........108

XIII
Table 4-8. NPV analysis results using a value of £1.87 per kg of recovered
ammonia. .................................................................................................................................................. 109
Table 5-1. SOFC capital cost functions. Currency exchange rates used:
£0.78/US$ and £0.9/EUR ............................................................................................................... 126
Table 5-2. Economic Sensitivity: Scenario descriptions ............................................. 129
Table 5-3. Ammonia recovery stream results ................................................................... 130
Table 5-4. Ammonia recovery block conditions .............................................................. 131
Table 5-5. SOFC operation stream results ........................................................................... 132
Table 5-6. Thermal power production analysis (positive values indicate net
thermal power production, negative indicate consumption).................................. 133
Table 5-7. Coefficients used in SOFC numerical model ............................................... 134
Table 5-8. SOFC operating conditions and results.......................................................... 136
Table 5-9. Table of GHG emission impacts due to ammonia diversion ............. 140
Table 5-10. Equipment cost for combined ammonia-SOFC process ................... 141
Table 5-11. Net Present Value analysis for SOFC process integration at Esholt
WWTP assuming a 10% discount factor .............................................................................. 143
Table 6-1. H2 production-based stream compositions and mass flows for S:C 4
scenario ..................................................................................................................................................... 167
Table 6-2. Furnace-based stream compositions for S:C 4 scenario ..................... 169
Table 6-3. Heat consumption and production for S:C 4 scenario.......................... 170
Table 6-4. Power consumption for S:C 4 scenario .......................................................... 170
Table 6-5. H2 production-based stream compositions and mass flows for S:C 4
scenario ..................................................................................................................................................... 172
Table 6-6. Furnace-based stream compositions for S:C 3 scenario ..................... 173
Table 6-7. Heat consumption and production for S:C 3 scenario.......................... 174
Table 6-8. H2 production-based stream compositions and mass flows for S:C 2
scenario ..................................................................................................................................................... 176

XIV
Table 6-9. Furnace-based stream compositions for S:C 2 scenario .....................177
Table 6-10. Heat consumption and production for S:C 2 scenario .......................178
Table 6-11. Total installed cost breakdown for S:C 4 scenario...............................179
Table 6-12. Process power and heat consumption for S:C 3 scenario................185
Table 6-13. System GHG emissions for the S:C 3 scenario .........................................186
Table 7-1 Calibration gas mixtures used for GC calibration in mol %................193
Table 7-2. Required flow of ammonia solution and deionised water .................198
Table 7-3. RGibbs reactor inputs in moles h-1 ...................................................................202

XV
Table of Figures
Figure 2-1. Typical WWT process flow diagram............................................................... 15
Figure 2-2. Wastewater nitrogen cycle. Interpreted from: [73].............................. 18
Figure 2-3. Conventional nitrogen removal process (1 aerobic/nitrification
zone; 2 anoxic/denitrification zone).......................................................................................... 22
Figure 2-4. 2-stage pre-denitrification (1 aerobic/nitrification zone; 2
anoxic/denitrification zone) ........................................................................................................... 22
Figure 2-5. 4-stage pre-denitrification (1 aerobic/nitrification zone; 2
anoxic/denitrification zone) ........................................................................................................... 22
Figure 2-6. Distribution (%) of various factors after liquid-solid separation by
rotary screen separator and screw extractor. Source: Bauer et al. [108]. .......... 30
Figure 2-7. Energy demand breakdown at conventional WWTPs data derived
from [52]. .................................................................................................................................................... 32
Figure 2-8. General operation of MCFC................................................................................... 54
Figure 2-9. Comparison of performance between SOFCs, MCFCs, internal
combustion engines (ICE) and micro-gas turbines (µGT). Taken from Lanzini et
al. [237]. ....................................................................................................................................................... 55
Figure 2-10. Operation of CfD renewables incentive scheme sourced from
[243]............................................................................................................................................................... 58
Figure 3-1. Process flow of Esholt WWTP............................................................................. 62
Figure 3-2. Incoming flow data for Esholt WWTP over a 2.5 day period in
September 2016...................................................................................................................................... 72
Figure 3-3. Incoming flow data for Esholt WWTP over 8 day period in . August
2016…………………………………………………………………………………………………………73
Figure 3-4. Material concentration and flow diagram for Esholt WWTP .......... 75
Figure 3-5. GHG footprint for Esholt WWTP ....................................................................... 79
Figure 4-1. Process flow used for stripping sensitivity ................................................ 85
Figure 4-2. Process flow for absorption sensitivity analysis ..................................... 86

XVI
Figure 4-3. Process flow for flash sensitivity analysis ...................................................87
Figure 4-4. Process flow for distillation sensitivity analysis .....................................88
Figure 4-5. Graph illustrating the effect of air temperature and air flow rate on
the % of ammonia recovered from digestate liquor.........................................................92
Figure 4-6. Chart comparing the thermal energy requirement to heat incoming
stripping air of the twelve least energy intensive conditions. a) 900 kmol h -1 at
150°C, b) 950 kmol h-1 at 150°C, c) 700 kmol h-1 at 200°C d) 550 kmol h-1 at
250°C, e) 450 kmol h-1 at 300°C, f) 1000 kmol h-1 at 150°C, g) 500 kmol h-1 at
275°C, h) 650 kmol h-1 at 225°C, i) 750 kmol h-1 at 200°C, j) 350 kmol h-1 at
400°C, k) 250 kmol h-1 at 550°C, l) 600 kmol h-1 at 250°C............................................93
Figure 4-7. Six least energy consuming conditions for steam stripping
providing 95% NH3 recovery. a) 110 kmol h-1 at 270°C, b) 120 kmol h-1 at 160°C,
c) 110 kmol h-1 at 280°C, d) 120 kmol h-1 at 170°C, e) 110 kmol h-1 at 290°C, f)
120 kmol h-1 at 180°C. .........................................................................................................................94
Figure 4-8. Chart comparing the water flow in to the absorption column to
absorb 95% of incoming ammonia for the twelve least energy intensive
conditions found for air stripping: a) 900 kmol h -1 at 150°C, b) 950 kmol h-1 at
150°C, c) 700 kmol h-1 at 200°C d) 550 kmol h-1 at 250°C, e) 450 kmol h-1 at
300°C, f) 1000 kmol h-1 at 150°C, g) 500 kmol h-1 at 275°C, h) 650 kmol h-1 at
225°C, i) 750 kmol h-1 at 200°C, j) 350 kmol h-1 at 400°C, k) 250 kmol h-1 at
550°C, l) 600 kmol h-1 at 250°C .....................................................................................................95
Figure 4-9. Correlation between incoming gaseous flow rate and required
water flow to achieve 95% ammonia recovery. Line of best fit; y = 0.3679x +
52.989, R2 = 0.998. .................................................................................................................................96
Figure 4-10. Sensitivity analysis results with outlet water and ammonia flow-
rates (kmol h-1) from flash separation with varying inlet flow rates between
140-420 kmol h-1. ...................................................................................................................................98
Figure 4-11. Process flow for ammonia recovery. .......................................................103
Figure 5-1. Layout of SOFC...........................................................................................................113
Figure 5-2. Aspen Plus process model flow sheet .........................................................119

XVII
Figure 5-3. Polarisation curve showing experimental data of SPGI’s 120 kW
SOFC from [291] and model data (from this work) using fuel composition 89%
H2 11% H2O, Uf of 0.85 and operating temperature of 1000 °C............................. 135
Figure 5-4. Relative percentage impact on thermal (ntherm), net electrical (nelect,
net) and combined efficiency (nCHP, net).................................................................................... 138
Figure 5-5. Diagram of Net Cashflow and NPV with a 10% discount factor . 144
Figure 5-6. Sensitivity analysis: combined cash-flow and NPV diagrams. X-axis
in number of years and Y-axis in £. Scenario 1: existing cogeneration
technology; Scenario 2: existing biogas purification technology; Scenario 3: CfD
contract lowered to £114 MWh-1; Scenario 4: failure to obtain CfD; Scenario 5:
10 % increase in capital expense; Scenario 6 10% decrease in capital expense.
........................................................................................................................................................................ 146
Figure 6-1. Effect of S:C and temperature on equilibrium methane conversions
under SMR at 20 bar [136]............................................................................................................ 152
Figure 6-2. Process Flowsheet for ammonia recovery-H2 production model
........................................................................................................................................................................ 159
Figure 6-3. S:C 4 sensitivity analysis data detailing the effect of primary
reformer temperature on H2 generation and stripping thermal requirements
via AIRHT. ................................................................................................................................................ 163
Figure 6-4. S:C 3 Sensitivity analysis data detailing the effect of primary
reformer temperature on H2 generation and stripping thermal requirements
via AIRHT. ................................................................................................................................................ 165
Figure 6-5. S:C 2 Sensitivity analysis data detailing the effect of primary
reformer temperature on H2 generation and stripping thermal requirements
via AIRHT. ................................................................................................................................................ 166
Figure 6-6. SC 4 cash flow and NPV over plant lifetime ............................................ 180
Figure 6-7. Tornado graph showing the results of the sensitivity analysis
performed by changing a number of variables by +/- 15 % under S:C 4 process
conditions. ............................................................................................................................................... 181
Figure 6-8. S:C 3 cash flow and NPV over plant lifetime ........................................... 182

XVIII
Figure 6-9. Tornado graph showing the results of the sensitivity analysis
performed by changing a number of variables by +/- 15 % under S:C 3 process
conditions.................................................................................................................................................183
Figure 6-10. S:C 2 cash flow and NPV over plant lifetime ........................................184
Figure 7-1 Schematic of experimental rig ..........................................................................191
Figure 7-2. Image of rig set up ...................................................................................................191
Figure 7-3 Diagram of reactor internal layout. Internal diameter 9.8 mm, length
250 mm......................................................................................................................................................192
Figure 7-4 18wt% NiO/AL2O3 catalyst before (left), after crushing (middle)
and spent catalyst (right) ...............................................................................................................194
Figure 7-5 (a-c). Graphs detailing the equilibrium syngas flows of H2 and CH4
between temperatures 200°C and 900°C and runs with ammonia (labelled
‘Comb’ for ‘combined’) and without (labelled ‘SMR’). a) S:C 2 conditions, b) S:C
3 conditions, c) S:C 4 conditions ................................................................................................203
Figure 7-6. Raw GC data example a run without ammonia at S:C 4 and 700°C
.........................................................................................................................................................................204
Figure 7-7(a-c). Comparison of dry syngas specie flow from equilibrium
modelling and experiments at a S:C ratio of 2. Where ‘SMR’ describes runs
without the presence of ammonia and ‘Comb’ describes runs with the presence
of ammonia. a) 700 °C, b) 750 °C, c) 800 °C ........................................................................206
Figure 7-8. Results of H2 production at S:C 2, 700 °C, 750 °C and 800 °C from
experimental and equilibrium studies. ..................................................................................207
Figure 7-9. Difference in CH4 flow between runs with and without ammonia at
S:C 2 ∆nCH4 = nwith, CH4 − nwithout, CH4......................................................................208
Figure 7-10. Raw GC results in mole % for H2, CO2 and CH4 for a run at S:C 2
and 800 °C................................................................................................................................................209
Figure 7-11. Graph showing the molar % of methane depositing as solid C on
the catalyst for S:C 2 experiments.............................................................................................210

XIX
Figure 7-12 Comparison of dry syngas specie flow from equilibrium modelling
and experiments at a S:C ratio of 3. Where ‘SMR’ describes runs without the
presence of ammonia and ‘Comb’ describes runs with the presence of ammonia.
a) 700°C, b) 750°C, c) 800°C......................................................................................................... 212
Figure 7-13. Molar % of methane depositing as solid C on the catalyst for S:C 3
experiments............................................................................................................................................ 213
Figure 7-14. Difference in CH4 flow between runs with ammonia in the feed
and runs without at S:C 3 ∆nCH4 = nwith, CH4 − nwithout, CH4. ...................... 214
Figure 7-15. (a-c) Comparison of dry syngas specie flow from equilibrium
modelling and experiments at a S:C ratio of 3. Where ‘SMR’ describes runs
without ammonia and ‘Comb’ describes runs with ammonia in the feed. a) 700
°C, b) 750 °C, c) 800 °C ..................................................................................................................... 216
Figure 7-16. Molar % of methane depositing as solid C on the catalyst for S:C 4
experiments with (‘Comb’) and without (‘SMR’) NH3 in the feed. ........................ 217
Figure 7-17. Diagram showing the calculated H2 difference between runs with
and without the addition of ammonia (∆nH2(out)) the H2 generated from
contribution of ammonia decomposition nH2(NH3decomp) as calculated in
equation 7-11. Also shown as diamond plots are the % flow of ammonia on
expected (due to volatilisation). ................................................................................................ 218
Figure 7-18. Relationship of carbon deposition and ammonia conversion .. 219

XX
Abbreviations
ACT Advanced conversion technology
AD Anaerobic digestion
ADBA Anaerobic Digestion & Bioresources Association
AFC Alkaline fuel cell
APEA Aspen Process Economic Analyzer
ASP Activated sludge process
BOD Biological oxygen demand
CfD Contracts for Difference
CHP Combined heat and power
COD Chemical oxygen demand
CV Cell voltage (V)
CSD Compression, storage and dispensing technology
FCEV Fuel cell electric vehicle
FCHJU Fuel Cells and Hydrogen Joint Undertaking
FiT Feed in tariff
GC Gas chromatograph
GHG Greenhouse gas
GHSV Gas hourly space velocity
GWP Global warming potential
HHV Higher heating value
HPS High pressure scrubbing
HTS High temperature shift
HT-SOFC High temperature solid oxide fuel cell
IT-SOFC Intermediate temperature solid oxide fuel cell
IR-SOFC Internally reforming solid oxide fuel cell
LTS Low temperature shift
MCFC Molten carbonate fuel cell
MLVSS Mixed liquor volatile suspended solids
NH3-DEC Ammonia decomposition reaction
NPV Net present value

XXI
ONS Office for national statistics
PAFC Phosphoric acid fuel cell
PEMFC Proton exchange membrane fuel cell
PSA Pressure swing adsorption
RAS Return activated sludge
RHI Renewable heat incentive
RO Renewables obligation
ROC Renewables obligation certificate
RPI Retail price index
SAS Surplus activated sludge
S:C Steam to carbon ratio
SMR Steam methane reforming reaction
SOFC Solid oxide fuel cell
SPGI Siemens Power Generation, Inc
SS Suspended solids
TAN Total ammoniacal nitrogen
TCD Thermal conductivity dectectors
TKN Total kjeldahl nitrogen
TN Total nitrogen
TP Total phosphorus
TPB Triple Phase Boundary
TSS Total suspended solids
UWWTD Urban Wastewater Treatment Directive
VSS Volatile suspended solids
WAS Waste activated sludge
WGS Water gas shift reaction
WHSV Weight hourly space velocity
WWTP Wastewater treatment plant
YSZ Yttria-stabilised zirconia

XXII
Nomenclature
𝐴𝑐𝑒𝑙𝑙 Cell active area (m2)
𝛽 Apparent charge transfer coefficient
∆𝐻 Enthalpy change of reactions (kJ)
𝐷𝑒𝑓𝑓 Effective diffusivity (m2 s-1)
𝐷𝑂2 Oxygen ordinary diffusivity (m2 s-1)
휀 Porosity of electrode material
E Nernst voltage potential (V)
Ea Activation energy (J)
𝐸𝑜 Reference voltage (V)
F Faraday constant (96,48 C mol-1)
𝛿𝑎 Component thickness (m)
i Discount rate (10%)
I Current (A)
𝑗 Current density (A m-2)
𝑗𝑙 Limiting current densities (A m-2)
𝑗0 Exchange current density (A m-2)
ṁ𝑥 Mass flow rate of species x (kg h-1)
Mx Molar mass of species x (g mol-1)
�̇�𝑥 Mole flow rate of species x (kmol h-1)
n Number of participating electrons
nact Activation loss (V)
nCHP, net Net cogeneration efficiency
nelect, net Net electrical efficiency
nohm Ohmic loss(V)
nconc Concentration loss (V)
ntherm Thermal efficiency
N Plant lifetime (yr)
NOL Number of operators per shift
Nnp Number of non-particulate processing steps
𝜌 Anode material resistivity (Ω m)

XXIII
𝑝𝑥 Partial pressure of component x (bar)
𝑃𝐴𝐶,𝑛𝑒𝑡 Net AC system power (kW)
𝑃𝑐𝑒𝑙𝑙 Cell operating pressure (bar)
PP Number of processing steps
p.e. Population equivalent
Pgross Cell output power (kW)
𝑄𝐿 Heat loss from cell (kW)
QR System heat output
𝑄𝑡𝑟𝑎𝑛𝑠 Heat transfer across cell (kW)
R Universal gas constant (8.314 J mol-1 K-1)
𝑅𝑜ℎ𝑚𝑖𝑐 Global internal resistance (Ω m2)
Rt Net cashflow for the year
𝜏 Tortuosity of electrode porous material
𝑇𝑐𝑒𝑙𝑙 Cell Temperature (K)
texp Experiment length (h)
UF Fuel Utilisation (fraction)
�̇�𝑥 Volume flow of species x (l h-1)
𝛾𝑎 Anode activation barrier overpotential coefficient (A m-2)
𝛾𝑐 Cathode activation barrier overpotential coefficient (A
m-2)
𝑦𝑥 Mole fraction of species x


1
1 Introduction
1.1 Opening Remarks & Rationale
1.1.1 Climate Change and UK Policy
Over the time period in which this body of work has been carried out, the planet
has experienced the four hottest years on record (2015-2018) [1,2]. The
unprecedented change in the earth’s climate has been determined, irrefutably,
as anthropogenically induced due to emission of greenhouse gases (GHGs). The
consequences are, and will continue to be, devastating. Global efforts to combat
climate change began in 1992 at the Rio Earth Summit and led to multiple
international treaties committing governments to limit their GHG emissions
[3]. 23 years after the Rio Earth Summit, 195 countries adopted the first legally
binding universal global climate change deal, at COP21 in Paris, which aims to
keep average global warming well below 2°C above pre-industrial levels [4].
The UK, one of these 195 nations, has also constitutionally pledged to reduce
GHG emissions by 80% on 1990 levels by 2050, under the Climate Change Act
[5]. The Carbon Plan [6] has set out a framework in order to achieve these
targets, focussing on key areas such as; energy efficiency, low carbon heating,
electricity, transport, industry and waste management. However, it is the UK’s
policy towards bioenergy, waste management and hydrogen deployment
within this framework that is of particular relevance to this research. The
carbon plan highlights the key role bioenergy will play in the UK’s energy
infrastructure to 2050, and led to the development of a ‘UK Bioenergy Strategy’
[7]. This blueprint suggests that 12% of the UK’s primary energy demand will

2
be met through bioenergy in 2050 via a series of pathways that include: waste,
heat, transport and electricity.
Waste-derived energy is expected to make up a considerable proportion of UK
renewable and bio energy over the coming years. One of the primary methods
this will be achieved is via anaerobic digestion (AD) of waste material.
Feedstocks for AD include; sewage sludge, food waste, farm manures and
slurries [7,8]. AD generates a ‘biogas’ composed mostly of methane (55-70%)
and carbon dioxide (30-45%) [9]. The ‘biomethane’ fraction of biogas makes
for its satisfactory use as a fuel. As such, it is generally utilised as a fuel for
internal combustion combined heat and power (CHP) units or can be scrubbed
of its impurities and used as a vehicular fuel or for injection to the natural gas
grid. The anaerobic digestion of sewage sludge is already extensively used in
the UK with over 80% of sewage treated by AD [10] and delivers roughly 30%
of AD-derived energy [11].
1.1.1 Nitrogen removal at wastewater treatment plants –
energy use and GHG emissions
Before wastewater management was integrated as an indispensable part of
human society, the apathetic disposal of wastewater resulted in serious
ramifications for the environment and human health [12]. From the late 19th
century, advancement in wastewater treatment technology and process
development erupted [12]. By the 1960s Ludzack and Ettinger proposed the
use of an anoxic zone to achieve biological denitrification (conversion of nitrite
to gaseous nitrogen) in the now well established activated sludge process [13].
A decade later, James Barnard patented a process that applies both nitrification
(conversion of ammonium to nitrite) and denitrification that could achieve
almost total destruction of nitrogen present in wastewater [14].
When the EU placed strict limits on the discharge of ammonia and nitrites to
water-courses under the Urban Wastewater Treatment Directive
(91/271/EEC) [15] and the Water Framework Directive (2000/60/EC) [16], it
was the de/nitrification process that was most widely implemented in order to

3
meet restrictions. Although significantly improving the health of aquatic
ecosystems affected by wastewater induced eutrophication, nitrogen removal
resulted in unfavourable impacts for plant operators. Firstly, the aerobic
bacteria involved in nitrification require the pumping of vast quantities of
oxygen, which increases the electricity consumption of the plant. Secondly,
nitrous oxide (N2O) is often emitted due to its formation as an intermediary and
side-product during de/nitrification [17]. N2O is a fierce GHG with 298 times
the global warming potential of CO2. In essence, not only does nitrogen removal
increase plant operational costs but also deepens its GHG footprint.
One key contributor of total nitrogen in wastewater plants is the digestate
liquor from AD units which is recycled back to the head of the treatment works.
The nitrogen contained in digestate liquor originates from the assimilation of
nitrogen by activated sludge bacteria or retention in solid fractions of the
wastewater which are internally retained until the plant’s anaerobic digester.
Here, a significant volume of ammonium is formed during biological
processing. The liquid fraction of the digestate produced during AD, known as
liquor, is often logistically too difficult to be sold for land application and is
recycled back into the conventional treatment process. However, it is estimated
that this stream contains 15-20% of a facility’s nitrogen load [18,19], thus,
significantly impacting on plant GHG emissions and energy consumption.
In support of attempts to close nutrient cycles and recuperate valued products
from waste, ammonia recovery from digestate liquor has received considerable
attention from industry and academia [20–26]. A wide variety of options are
available such as, membrane filtration, adsorption techniques, struvite
precipitation and stripping with absorption [20,23]. In the vast majority of
cases, ammonia is being recovered for use as a fertiliser. However, ammonia,
comprising ¾ of hydrogen on a molar basis, can also be used for energy
recovery [27] or as a hydrogen storage medium [28]. Regardless of the desired
end use, the diversion of ammonia from conventional treatment has the
potential to significantly impact the sustainability of wastewater management.

4
1.1.2 H2 Potential
Hydrogen has long been touted as an energy vector for the future, due to its
unparalleled energy/weight ratios, the potential for long-term storage and for
pollution free emissions. However, interest has surged recently with the view
that green hydrogen has an important part to play in the global transition to
carbon-free economies [29–32]. Hydrogen’s flexibility seems to be its unique
selling point, with an ability to penetrate all energy sectors; heat, power,
transport and storage.
There is vast interest in the use of green hydrogen as a replacement or addition
to the natural gas grid for decarbonisation of the heat sector. In the UK,
Northern Gas Networks are researching the potential of converting the gas grid
of Leeds, in the UK, to 100% hydrogen [33]. The concept is that natural gas is
converted to hydrogen via steam reforming with attached carbon capture and
storage technology. Meanwhile, the collaborative project, ‘HyDeploy’, involving
a consortium consisting of members such as Cadent Gas Limited and ITM Power
are pilot testing the addition of hydrogen in the gas grid of Keele University by
up to 20% in order to better understand the implications of partial injection
[34]. A recent consortium including Northern Gas Networks and Cadent is now
looking at expanding the scope of 100% H2 penetration of the UK’s gas grid in
the North of England into heat for industrial, commercial and domestic heat but
also power generation and transport (H21 North of England).
Due to the intermittency of renewable electricity production from wind and
solar and the inefficiency and cost of battery storage, ‘power to gas’ schemes
have generated vast global interest. The hope is to use hydrogen as an energy
storage medium, produced from excess renewable electricity via electrolysis,
and either directly inject it into gas grids or store and use it for electricity
generation via fuel cells during times of grid deficits [35–37]. RWE’s ‘power-to-
gas’ project, launched in 2015, is producing hydrogen for gas injection from a
PEM electrolyser at a competitive overall efficiency of 86% [38].
Hydrogen has long been recognised as a plausible transport fuel of the future.
Its lightweight properties and pollution-free emissions at the point of use mean
this vision is starting to be realised. It is envisaged that 800,000 fuel cell electric

5
vehicles will be on the road in Japan by 2030 [39] and 37,000 in California by
2023 [40]. Meanwhile, the UK government announced the roll-out of 200 new
hydrogen powered police cars and taxis in March 2018 [41] a year after the
announcement of a £23 million fund to aid development of FCEV infrastructure
[42]. The indication here is that green hydrogen may play an important role in
decarbonising the transport sector for years to come.
1.1.3 Energy Recovery at wastewater treatment plants
In general, WWTPs use the anaerobic digestion of sewage sludge to recover
energy used during the treatment process. The biogas produced, which
generally contains 55-65% methane is used as fuel for combustion-based
combined heat and power (CHP) units [43]. However, more often than not, the
energy demand for the facility is not matched by the renewable power
generated onsite. Resultantly, treatment plants must purchase grid-based
electricity, which adds to both operational costs and lifecycle greenhouse gas
emissions.
Providing solutions to these sustainability issues at WWTPs is becoming an
increasingly important issue. The consequences of climate change have had and
will continue to impact on the global security of supply of fresh water due to
changes in hydrological cycle patterns [44]. Combined with the growing global
population and the mass migration from rural areas to cities, there is more
pressure than ever for sustainable wastewater treatment to maintain a secure
supply of clean, fresh water sustainably.
The research drive to overcome energy deficits at WWTPs is extensive and
wide-ranging [45–52]. One frequently discussed option is the replacement of
existing CHP units with fuel cells which operate at superior electrical
efficiencies. Several studies have analysed the implementation of sewage -
biogas operated solid oxide fuel cells (SOFCs), modelling electrical efficiencies
of over 50% [53–55]. This demonstrates the potential to make vast
improvements on the current electrical efficiencies of standard CHP units
typically used in the industry which stand at around 35%.

6
One important advantage of SOFCs is their flexibility of potential fuel options
[56]. Their high temperature operation means they are capable of carrying out
thermochemical reactions internally such as steam methane reforming (SMR),
water-gas-shift, partial oxidation of hydrocarbons and ammonia
decomposition to produce a hydrogen rich syngas (a gas mixture composed
mainly of hydrogen and carbon monoxide). The hydrogen is then utilised
electrochemically in the SOFC with oxygen from an air supply to generate
electrical power. Due to their capability of carrying out both SMR and ammonia
decomposition, in theory, both recovered ammonia and biogas from WWTPs
could be used as direct fuel inputs for SOFC operation.
1.1.4 Research Problem
There are three key research problems this work will address. The first is the
need to address GHG emissions from wastewater treatment. The second is
whether the energetic balance of wastewater treatment can be improved via
proposed process designs. The third is developing a novel method of
sustainable hydrogen production. Each topic is of abundant academic and
commercial interest, whilst their combination fulfils an academic niche.
During sewage treatment, nitrogen is removed from wastewater via biological
processing in a WWTP’s activated sludge process. It is a problematic process
for two key reasons.
(1) The aeration required contributes to roughly ¼ of a WWTP energy
demand [57].
(2) The biological transformation generates substantial N2O emissions; a
powerful GHG [58,59].
As such, WWTP operators are under increasing pressure to reduce both the
energy demand and the GHG emissions while meeting stringent ammonium
discharge constraints. Thus, source separation and diversion of nitrogenous
material from the activated sludge process is an obvious method of preventing
the use of energy and emissions of GHGs. Digestate liquor is often promoted for

7
diversion and ammonia recovery but with the aim of producing agricultural
products, which are uncompetitive in the well-established commercial
fertiliser market [21]. Alternatively, this research proposes the use of
recovered ammonia from this waste stream along with biomethane for either
hydrogen production or use in a SOFC. It will then be determined whether the
processes can address the research problems discussed.
1.1.5 Research Gap
Hydrogen production from biogas and biomethane has been the focus of
research for several years. It has been identified as a far more sustainable
method of H2 production compared to conventional steam reforming of natural
gas; with roughly half the lifecycle emissions of GHGs [60]. There have also been
examples of pilot testing of bio-methane steam reforming at a WWTP in
Germany, where it is seen as an important component in a future hydrogen
infrastructure [61].
However, examples of unconventional reagent use in the steam reforming
process are extremely limited. Zin et al. (2015) assessed the production of
hydrogen via the reforming of ethanol with the aqueous fraction of bio -oil
produced from fast pyrolysis and liquefaction of pine wood. In Zin et al.'s study
(2015), the aqueous fraction acted as both a conventional steam reagent and a
supplementary source of hydrocarbon-produced hydrogen and was
systematically advantageous. There exists a clear knowledge gap in the use of
ammonia recovered from wastewater treatment waste streams as a feedstock,
alongside biomethane for hydrogen production.
There are reports of research carried out on the use of ammonia in fuel cells
[63–66]. However, limited examples of combining ammonia and biogas as
inputs for SOFCs exist and fewer that have discussed the extended impacts of
recovering ammonia from wastewater treatment plants or other renewable
sources for such use. Thus, by combining process modelling, energetic analysis,
GHG emission analysis, financial analysis and experimental validation, a robust
understanding of the feasibility of the proposed processes will be achieved.

8
1.2 Aims, Scope, Objectives
1.2.1 Aims
With the identification of the discussed research gaps, a number of aims have
been constructed to help plug them: 1) determine the feasibility and impact of
recovering ammonia from digestate liquor generated at wastewater treatment
facilities in a manner that is acceptable for the following two aims; 2) assess the
feasibility and impact of utilising the recovered ammonia for use, alongside
biomethane, as fuel for a solid oxide fuel cell; 3) evaluate the feasibility and
impact of employing the recovered ammonia, alongside biomethane, as a
feedstock for thermochemical hydrogen production.
1.2.2 Objectives
To achieve these aims, the following four key research objectives (listed below
in italics) have been generated and encompass a number of research activities
(displayed below under each key objective).
Key objective #1: Assessment of reference wastewater treatment plant for mass
flows, energy balance and GHG emissions.
1. Thorough sampling of various process streams at Esholt wastewater
treatment plant over a one-year period.
2. Compositional analysis of samples. Characterisation of: Kjeldahl
Nitrogen (TKN), Ammoniacal-nitrogen (NH3-N), Chemical Oxygen
Demand (COD), Total Suspended Solids (TSS), Volatile Suspended Solids
(VSS), Total Phosphorus (TP), Total Reactive Phosphorus (PO43-).
3. Development of a mass flow diagram by applying the above
concentrations to anticipated total flows of wastewater throughout
treatment process.
4. Determination of the plant energy balance, informed by data gathered
in activities 1-3 and external sources.

9
5. Determination of plant GHG footprint, informed by data gathered in
activities 1-3 and external sources.
Key objective #2: Perform process modelling of ammonia recovery, SOFC
processing and thermochemical hydrogen production systems.
1. Perform thorough literature review of current ammonia recovery
options.
2. Use mean ammonia concentration found in Esholt’s digestate liquor
stream as input to Aspen Plus process modelling software.
3. Calculate the quantity of lime required to convert ammonium to
ammonia.
4. Perform energy-based sensitivity analysis, using Aspen Plus, on
technology options for ammonia recovery: stripping, absorption, flash
separation, distillation.
5. Select highest performing recovery technology options and operational
conditions for the final process.
6. Review thoroughly the literature on solid oxide fuel cell process
modelling.
7. Develop a Microsoft Excel-based numerical model for robust power
production data.
8. Develop integrated process flow for solid oxide fuel cell system using
Aspen Plus
9. Perform energy-based sensitivity with heat integration alongside
ammonia recovery process for selection of optimum operational
conditions.
10. Assess energetic and GHG emission impacts for SOFC process
implementation at Esholt WWTP.
11. Review thoroughly the literature on steam reforming-based process for
hydrogen production.
12. Develop integrated process flow for hydrogen production system using
Aspen Plus.

10
13. Perform energy-based sensitivity with heat integration alongside
ammonia recovery process for selection of optimum operational
conditions.
14. Assess energetic and GHG emission impacts for SOFC process
implementation at Esholt WWTP.
Key objective #3: Perform economic assessments for the introduction of ammonia
recovery, solid oxide fuel cell and hydrogen production systems in the WWTP.
1. Cost the equipment based on Aspen Plus process diagrams for each
system including biogas purification step.
2. Cost the installation costs of equipment.
3. Determine operational costs for each system.
4. Identify eligible renewable incentives.
5. Identify revenue options for each process, including offset energy costs.
6. Perform net present value analysis to evaluate the financial
attractiveness of the different processes.
7. Thorough sensitivity analysis, covering a range of realistic scenarios.
Key objective #4: Experimentally analyse the production of hydrogen via
combined ammonia decomposition and steam methane reforming.
1. Review thoroughly the literature of catalysts that can be used for both
steam methane reforming and ammonia decomposition.
2. Identify ammonia concentrations to be used for experimental input,
based on results of process model.
3. Perform analysis for feed molar steam to carbon ratios 2, 3 and 4.
4. Perform analysis for temperatures 700°C, 750°C and 800°C
5. Perform runs with and without the presence of ammonia
6. Determine catalyst carbon deposition on catalyst via CHNS tests
7. Analyse ammonia decomposition via HACH LCK 303, ammonium
cuvette tests.
8. Compare experimental results with equilibrium model.

11
1.3 Thesis Structure
This thesis contains eight Chapters. Please note that due to the interdisciplinary
nature of this thesis, each results chapter contains an individual outline of
research methods rather than an overarching methodology thesis chapter.
Chapter 1 aims to introduce the research topic, provide rationale for the study
and outline the investigation’s aims and objectives.
Chapter 2 contains a comprehensive review of literature encompassing each
key research topic. It aims to inform the reader of fundamental theories behind:
wastewater treatment; the influence of nitrogen on the energetics and emission
of greenhouse gases from wastewater treatment; the role of anaerobic
digestion in producing biogas and ammonia-containing digestate liquor;
ammonia recovery techniques, fuel cells for the production of heat and power;
hydrogen production techniques and feedstock options; and the current status
of UK financial incentives for renewable energy. The chapter also critically
identifies the current status of research amongst these themes and showcases
the gaps which have led to this study taking place and helped highlight its
novelty. Furthermore, the literature discussed will be consistently referred to
throughout subsequent chapters to place the author’s work in context.
Chapter 3 covers the assessment performed for the reference plant. It acts as
the foundation for each of the subsequent chapters, detailing mass flows,
energetics and GHG emission data that are used as an inventory for everything
from model inputs to critical analysis and determination of process
implementation feasibility.
Chapter 4 focusses on process identification, modelling and optimisation of
ammonia recovery from digestate liquor. It utilises flow and compositional data
found in Chapter 3 to match real-life operation as best as possible. An economic
assessment of the process has been carried out to indicate whether it is
financially worthwhile in the context of systems set up downstream of the
ammonia recovery unit.
Chapter 5 synthesises a number of analysis techniques to facilitate a thorough
investigation into the feasibility and impact of implementing a combined

12
ammonia recovery and biomethane-ammonia fuelled SOFC process at the
referenced wastewater treatment plant. A numerical model has been
developed to calculate the power production potential of a SOFC stack based on
a real operational module. The numerical model results feed into a process
model, developed on Aspen Plus which integrates both ammonia recovery and
SOFC processing. Effective heat integration has also been employed that
provides robust indications of thermal power production potentials. A
thorough economic study has been carried out detailing investment and
operational costs, income flows, expense savings, payback periods and net
present value. An economic sensitivity analysis has also been carried out via
evaluation of a number of hypothesised scenarios to justify its true financial
viability.
Chapter 6 details the process model developed which combines the ammonia
system from Chapter 4 with the thermochemical production of hydrogen.
Thorough sensitivity analysis has been carried out on the process model to
optimise system efficiency and analyse the impact of temperatures, pressures
and feed molar steam to carbon ratios in the reformer. It contains an evaluation
of the potential impact on the energetics and GHG footprint of the reference
facility. The work in Chapter 6 is finalised with an economic study, utilising
similar methods as employed during Chapter 5 to demonstrate the financial
viability of process implementation and evaluate which process is the more
monetarily attractive.
Chapter 7 covers the research activities detailed under the final thesis
Objective displayed in Section 1.2.2. It book-ends the results chapters with the
experimental validation of the use of a singular packed-bed reactor for the
production of a hydrogen rich syngas facilitated by a combination of ammonia
decomposition, steam methane reforming and water-gas-shift reactions.
Chapter 8 concludes the thesis with a summary of its findings, a
comprehensive critical analysis of the research methodologies and
identification of gaps in which future work can be developed.

13
2 Literature Review
2.1 Anthropogenic Nitrogen Balance
Diet depending, humans consume between 20-100g of protein daily per capita
[67]. The nitrogen contained in this protein enters the food-chain via initial
vegetational uptake from soil, and makes up the entirety of nitrogen processed
by humans. The consequential metabolic breakdown augments the release of
N-containing products in urine as urea and in faeces as unassimilated protein.
The quantity of N in human waste is estimated to be on average 13g of nitrogen
per capita per day [67] and is carried through sewage systems and eventually
to WWTPs.
If soluble nitrogen in wastewater is left untreated, a plethora of issues may
occur. For example, the final plant effluent will discharge ammonium ions
(NH4+) which are toxic to fish, cause eutrophication and oxidise to undesirable
nitrates. Nitrogen, alongside phosphorus and potassium, is a key determining
nutrient for the status of water-based trophic communities. If NH4+ is released
from WWTPs, its bioavailability facilitates overactive biological activity;
causing algal blooms and excessive growth of aquatic plants [68].
Eutrophication is the resultant blockage of light and depletion of dissolved
oxygen, which can devastate entire habitats.
In response to these environmental concerns, the EU has placed strict limits on
nutrient emissions from WWTPs to land water bodies. Under the Urban Waste
Water Treatment Directive (UWWTD) (91/271/EEC) and the Water
Framework Directive (2000/60/EC) [15,16], all large WWTPs located in areas
with ‘sensitive’ waters, in member states, must reduce the overall load of N and
P entering the facilities by at least 75%. Smaller plants are not exempt either,

14
but with local environmental regulators enforcing limitations. From these
directives came the introduction of tertiary (nutrient removal) treatments to
wastewater plants in order to transform N and P to more favourable forms.
This is most frequently done either through biological processing in upgraded
activated sludge processes and/or through chemical precipitation [69].
However, tertiary treatment has led to undesired consequences for WWTP
operators. For example, energy consumption in the activated sludge process
can be increased by 60-80% with the introduction of nitrogen removal [18].
Meanwhile, amplified capital expenditure is required for chemicals for P-
precipitation or additional carbon for intensified biological activity. These
problems not only impact on the financial stability of a facility, but also its
lifecycle greenhouse gas (GHG) emissions. The latter is further augmented by
nitrous oxide (N2O) emissions affiliated with biological nitrogen removal [59].
N2O is a potent GHG with a global warming potential (GWP) 298 times that of
CO2 over a 100 year period [58]. It has also been proven as the most important
ozone-depleting substance during the 21st century [70]. Moreover, the IPCC
[58] calculated that 2.8% of anthropogenic N2O emissions originate from
WWTPs.
2.2 Wastewater treatment plant design and sewage system
Figure 2-1 illustrates a conventional WWTP design. Sewage enters the plant
and is pre-treated via screening and grit removal to limit equipment damage
downstream. A percentage of suspended solids present in the wastewater are
then allowed to settle in a primary clarifier, forming a sludge. The sludge is
removed and dewatered before being anaerobically digested. The liquid
effluent from the primary clarifier is sent to the activated sludge process (ASP)
for biological processing and secondary settlement. The water from the
secondary clarifier is ordinarily clean enough to be placed into a water source.
A proportion of the sludge from the secondary clarifier is recycled back through
the ASP as it contains the bacterial matter required in the aeration basin. The
rest is dewatered for anaerobic digestion with the primary sludge. The

15
anaerobic digester produces a methane-rich biogas, which is sometimes
scrubbed for methane purification for use in a combined heat and power (CHP)
unit; providing heat and electricity for the plant. Alternatively, if the biogas has
been upgraded to biomethane via scrubbing, it can be sent into the natural gas
grid or compressed for use as a transport fuel.
Fig
ure
2-1
. T
ypic
al W
WT
pro
cess
flo
w d
iagr
am.

16
2.2.1 Pre-treatment
The preliminary stage in most wastewater treatment involves the removal of
gross solids from the influent. For efficient biological processing later,
problematic contraries such as plastics, rags and rubber must be withdrawn.
Table 2-1 shows the typical composition of screenings; ordinarily removed via
centrifugation or filtration and pressing. There are energy costs during the
screening with additional energy demand associated with their removal from
site, conventionally via road transport [71].
Table 2-1. Typical Screening Composition [72]
Component Concentration
(%dw)
Paper 20-50
Rags 15-30
Plastic 5-20
Rubber 0-5
Vegetable Matter
0-5
Faecal Matter 0-5
As illustrated in Figure 2-1, the second stage of pre-treatment comprises of the
removal of grit. Here, influent flow velocity is reduced to ~0.3 m/s to allow
inorganic grit to settle in a specific chamber, of which grit channels and
detritors are the most common options in the UK [71].
Primary clarifiers, or primary sedimentation tanks, act to remove 60-70% of
suspended solids (SS) in the wastewater. The SS contain around 30-35% of the
Biochemical Oxygen Demand (BOD) due to the high organic nature of the solid
fraction; thus making an effective feedstock for anaerobic digestion [71].
Primary sedimentation most commonly occurs in horizontal flow or radial flow
tanks. The target for both is to allow the settlement of heavy solids for removal
by scrapers and to clear the scum that forms on the surface-water, composed
of mostly fats, oils and grease. The settled material, known as primary sludge,
can then be thickened/dewatered and transferred for anaerobic digestion

17
treatment. The supernatant (liquor) from sludge thickening is sent for
activated sludge processing.
2.2.2 Activated Sludge Process
The activated sludge process (ASP) is the most common wastewater
‘secondary’ treatment system in the UK. Biological activity is used to degrade
organic material and remove phosphorus or nitrogen-containing products in
the final effluent. The ASP is ordinarily comprised of an aeration basin, a
secondary clarifier and a recycling system (Figure 2-1). The primary clarifier
effluent and recycled sludge from the secondary clarifier is first transferred to
an aeration basin where it meets air and biomass (bacteria and protozoa). The
aim is for full degradation of carbonaceous waste by bacteria which utilise the
embedded carbon for energy [73]. The biomass, along with the degraded
organic material (known as activated sludge) is then allowed to settle in a
secondary clarifier, before being recycled back into the aeration basin. The
biomass can, in essence, be re-used to continue degrading waste entering the
treatment facility. However, surplus sludge is generated as the biomass
reproduce and multiply. Thus, fractions are siphoned off and mixed with
primary sludge for anaerobic digestion. The treated liquid effluent is then
passed through for disinfection or, more likely, placed straight into a water -
course.
2.2.3 Nitrification/Denitrification during ASP
In order to comply with national and international regulations on the discharge
of nitrogen-containing compounds to water-courses, a series of steps have
been incorporated to the activated sludge process to remove them. Nitrogen
contained in the food humans consume is mostly emitted into sewers in the
form of urea and some organic nitrogen held in proteins. However, much of this
is quickly transformed into ammonium ions, as amino acids undergo
deamination and urea is hydrolysed. The result, is that by the time wastewater

18
reaches a treatment facility, roughly 40% of the total N is in ammonium form
[73,74].
Figure 2-2. Wastewater nitrogen cycle. Interpreted from: [73]
Eq 2-6
AOB (Eq 2-3)
NOB (Eq 2-4)
Eq 2-2 Eq 2-1

19
As Figure 2-2 shows, the elimination of total nitrogen (TN) occurs in 4
transformative steps. The first is the deamination of amino acids to ammonium
ions and the hydrolysis by bacteria of urea to ammonia (Eq 2-1 & Eq 2-2).
Amino acid – organotrophs → NH4+ + Acid 2-1
NH2COHN2 + H2O – Citrobacteria → 2NH3 + CO2 2-2
In addition to materialising in sewage pipes, ammonification is promoted in the
aeration basin. There are then three potential chemical routes ammonium ions
can take [73]:
1. Used as a N-nutrient source by organotrophs and nitrifying bacteria
(nitrogen assimilation)
2. Air stripped as NH3 in high pH conditions
3. Oxidised to nitrite ions (NO2-)
Whilst N can be lost to the atmosphere as ammonia, under a typical
temperature range of 10-200C and a pH between 7-8.5, roughly 95% of the
reduced form of nitrogen will remain as ammonium for conversion to nitrite
(Equation 2-3). Alternatively they could be used nutritionally by the bacteria
and trapped as organic-N in the mixed liquor volatile suspended solids
(MLVSS). In total, approximately 14% of the nitrogen entering a wastewater
plant will be assimilated by bacteria [73].
The nitrification process begins with the oxidation of ammonium to nitrite (Eq
2-3) by ammonium-oxidising bacteria (AOB) [17,73]. The AOB’s use ammonia
and CO2 as energy and carbon sources respectively. The nitrite ions are then
quickly oxidised to nitrate (NO3-) (Eq 2-4) by nitrate-oxidising bacteria (NOB)
in other text [17]. Combined, these processes complete the nitrification
process, providing the equation displayed in Eq 2-5.

20
NH4+ + 1.5 O2 AOB → NO2- + 2H+ + H2O 2-3
NO2- + 0.5 O2 - NOB → NO3- 2-4
NH4+ + 2O2 - Nitrifiers → NO3- + 2H+ + H2O 2-5
C5H10O5 + 4NO3- + 4H+ → 5CO2 + 7H2O + 2N2 2-6
This process occurs in the aeration basin with a greater than stoichiometric
quantity of dissolved oxygen (DO) available. Forster [71] suggests that “good
nitrification” will occur with a DO of ≥ 2mg/l for sludge aged 10 days or more
at 100C. Greater aeration also limits N2O emissions [75]. For these reasons, the
energy required for aeration for nitrogen elimination makes up around 27% of
a treatment facility’s energy demand [57].
Nitrate ions are used as substrate by denitrifying bacteria; where nitrate is
reduced to molecular nitrogen (equation 2-6). There are a number of
intermediate steps in the denitrification process where nitrate is converted to
NO2, then to NO, followed by N2O and finally to nitrogen gas. But, essentially
heterotrophic denitrifying bacteria utilise nitrate in the absence of DO to
degrade organic carbon (cBOD) for energy; e.g. lyxose as shown in equation
2-6. Thus, in order for effective denitrification to occur, there are three major
requirements: firstly, an abundant population of denitrifying bacteria, secondly
an anoxic environment, and finally, sufficient presence of soluble cBOD. Some
of the nitrate-N is nutritionally used by bacteria, whilst the N2 generated as a
metabolic bi-product is removed totally from the system, escaping to the
atmosphere in gaseous form.
As Figure 2-2 indicates, nitrous oxide (N2O) forms as an intermediary product
of denitrification and is emitted to the atmosphere. Thus, if full denitrification
is not achieved, substantial nitrous oxide will be emitted. As such, N 2O
emissions can be limited by maintaining low O2/DO levels and high COD:N
ratios in the anaerobic basin [17]. N2O can also be formed during nitrification
by autotrophic and heterotrophic oxidising bacteria alike. However, unlike
during denitrification, N2O is not an intermediate in the catabolic pathway [17].
Contrary to the denitrification step, limited O2 will facilitate N2O production by

21
AOB during nitrification. AOB will attempt to save oxygen and use nitrite as an
electron donor instead and generate N2O preferentially over NO2. This may also
occur if nitrite is not converted to nitrate quickly enough, leaving high
concentrations of NO2 in the nitrification tank [76].
The emissions of N2O from WWTPs contribute an estimated 2.8% of total
anthropogenic N2O emissions [58] and roughly 26% of the total GHG emissions
from the water chain; including drinking water production, water transport,
wastewater and sludge treatment and discharge [17]. Because there are many
different parameters that can facilitate N2O emissions, it is difficult to estimate
the exact quantity of nitrogen that will be emitted in this form. Kampschreur et
al. [17] reviewed numerous studies in the literature and found huge variations
in N2O emissions as a % of wastewater N-load at lab scale (0-95% N-load) and
full scale (0-14.6% N-load).
2.2.4 Activated Sludge Process Design
A number of N-removal design options are available for WWTPs. Initially,
designs focussed on following the sequential flows of the biochemical
reactions, where nitrification precedes denitrification (Figure 2-3). However,
an external carbon source (often as methanol) is required to supply sufficient
carbonaceous material for the denitrifying bacteria, adding significantly to
system costs and environmental impact. Resultantly, pre-denitrification
options were developed where cBOD is supplied by the return activatedsludge
(RAS) from the secondary clarifier and the incoming wastewater from the
primary clarifier (Figure 2-4). Typically the process, also known as the
Ludzack-Ettinger process, can see improved N-removal efficiencies by
incorporating an internal recycle of mixed liquor from the aerobic zone,
allowing more contact with nitrified material [77].

22
RAS
1 2
SAS
RAS
Carbon
1 2
SAS
RAS
1 2
SAS
Figure 2-3. Conventional nitrogen removal process (1 aerobic/nitrification zone; 2 anoxic/denitrification zone).
Figure 2-4. 2-stage pre-denitrification (1 aerobic/nitrification zone; 2 anoxic/denitrification zone)
Figure 2-5. 4-stage pre-denitrification (1 aerobic/nitrification zone; 2 anoxic/denitrification zone)
Alternatively, a 4-stage process may be used (Figure 2-5), also known as the
Bardenpho process [77]. Here, the incoming sludge from the primary clarifier
is split between the two denitrification zones and encourages high nitrogen
removal. Anammox
1 2

23
The anaerobic ammonium oxidation (anammox) process, discovered by Strous
et al. [78] is a further nitrogen removal option. It is becoming an increasingly
attractive option for WWTPs as it does not require an organic carbon source
and considerably reduces the energy input for aeration [51]. Here, ammonium
is used as the electron donor as nitrite is converted to nitrogen gas (Eq uation
2-7).
NH4+ + NO2- → N2 + 2 H2O 2-7
The autotrophic nature of the catalysing bacteria means this can occur without
additional COD/methanol [79]. Anammox is argued by some as a more effective
option for nitrogen removal compared to the others discussed [80]. However,
these bacteria have a slow growth rate of roughly 11 days doubling time; thus,
reducing the quantity of sludge and therefore biogas [79]. It also means there
can be long start-up times associated with the reactor. Furthermore, Anammox
generates more GHG emissions comparatively as the partial nitrification that
occurs generates excessive N2O [80].
2.3 Anaerobic Digestion
2.3.1 Overview
In the UK, around 80% of all sewage sludge generated at WWTPs is
anaerobically digested, equating to 24.5 million wet tonnes per annum [10].
The result is the production of 4,950 m3 of biogas per hour; almost ¼ of the
nation’s total [43]. Anaerobic Digestion (AD) is essentially the microbial
breakdown of organic matter in the absence of oxygen [81,82]. Anaerobic
bacteria utilise oxidised compounds for metabolic processes, converting
organic matter to methane, carbon dioxide, ammonia and hydrogen sulphide
(Table 2-2). The combination of these gases is colloquially known as biogas.
The primary and secondary sludge provided by their associated clarifiers are
first thickened/dewatered in order to lessen the load entering the digesters.

24
The liquor from this process contains much less organic matter volumetrically
and is sent back upstream to the primary clarifier or activated sludge process.
The dewatered sludge is then ready for digestion.
Table 2-2 Biogas chemical composition [9]
Composition Concentration
CH4 55-70 (vol%) CO2 30-45 (vol%)
H2S 500-4000 (ppm) NH3 100-800 (ppm) H2 <1 (vol %) O2 <1 (vol %)
H2O <1 (vol %)
The Buswell equation (Eq 2-8) describes the collective reactions that
breakdown organic matter (CcHhNnSs) to biogas during anaerobic digestion
[83,84].
CcHhNnSs + ¼ (4c – h -2o + 3n +2s) H2O 18⁄ (4c – h – 2o + 3n +2s) CO2 +
18⁄ (4c – h -2o + 3n + 2s) CH4 +
nNH3 + sH2S
2-8
A series of steps occur during AD to achieve the full degradation of organic
matter shown in the Buswell equation. This includes: 1) ‘hydrolysis’ which
converts carbohydrates, proteins and fats to sugars, amino acids and fatty
acids; 2) ‘fermentation’ which converts the products of hydrolysis to acetic
acid, volatile fatty acids (VFAs), H2 and CO2; 3) ‘acetogenesis’ which converts
VFAs to acetic acid, H2 and CO2; 4) ‘methanogenesis’ which converts acetic acid,
H2 and CO2 to mostly methane and CO2 [81]. Each stage is carried out by
particular microbial communities with differing biochemical processes and
preferential conditions. They run near-on sequentially, where the product of
one becomes the substrate for the next. The Buswell equation assumes 100%
metabolic breakdown, thus can be used to infer the composition of biogas but

25
not the volume. However, from simple stoichiometric analysis, it can simply be
assumed that every kg of CH4 generated took the removal of 4kg of COD [57].
The energy content of the methane contained in biogas (Table 2-2) makes for
satisfactory use of biogas as a fuel. Currently, around 60% of biogas produced
at WWTPs is used for onsite electricity and heat using combustion-based
cogeneration technology [43]. However, other properties of biogas can prove
problematic. As Table 2-2 shows, the other major components of biogas are
CO2, hydrogen sulphide, ammonia and saturated with water vapour. CO2
lowers the energy content, ammonia can be inhibitory and facilitate NOx
emissions, whilst H2S converts to SO2 and H2SO4 which are highly corrosive and
hazardous [85–87]. Furthermore, biogas often contains siloxanes (not shown
in Table 2-2), which are silicon-bearing volatile compounds and form micro-
crystaline silica during combustion that can cause considerable damage to
energy recovery equipment [87,88]. As such, in many cases biogas is purified
in order to remove some or all of these components.
2.3.2 Biogas Purification
There are a number of technology options that can be utilised to purify biogas
and separate CO2 and other impurities such as H2S from biomethane. These
have been extensively reviewed in literature, exemplified by Abatzoglou and
Boivin [89] and Awe et al. [90]. Discussed options include: physical and
chemical absorption, pressure swing adsorption, chemical adsorption and
membrane separation.
2.3.2.1 Physical Absorption
The preferred method utilised in industry is water scrubbing with a 41% share
of the market at the time of the IEA’s 2014 market report on biomethane [91].
Water scrubbing works on the principle that the solubility of CO2 is 26 times
that of CH4 (at 25°C). H2S solubility is greater than that of CO2 and is often
removed prior to CO2 in a separate column due to its corrosiveness [90]. The

26
biogas is often pressurised anywhere between 4-12 bar [92] before being fed
into the column. This contributes significantly to the energy demand of the
process which can be comparatively greater than competing options [93].
However, the comparatively lower maintenance costs of water stripping dwarf
any energetic disadvantages, justifying industry’s technology preference.
Water scrubbers generally facilitate a biomethane product containing >96% of
CH4 and <2% of CO2 [94].
Organic solvents, such as methanol and dimethyl ethers of polyethylene glycol
(DMPEG), can be used in place of water due to the comparative high solubility
of CO2 and H2S over CH4 in them [90]. Organic solvents of choice exhibit higher
affinity to the biogas impurities, meaning a smaller volume flow of scrubbing
liquid is required. This has the potential benefit of reduced equipment size and
operating costs. However, regeneration of the organic solvents can be an
energetically costly process [95]. Hence, there is a general preference for water
scrubbing in the AD industry [96]. Organic solvent scrubbers generally produce
a biomethane product of purity between 96-98.5% [94]. It is detailed in Munoz
et al. [96], that both water and organic solvent scrubbers generally results in
methane losses under 2%.
2.3.2.2 Chemical Absorption
Chemical absorption/scrubbing utilises CO2-reactive absorbents such as
alkanol amines and alkali aqueous solutions to separate CO2 from CH4
contained in the biogas. As with the discussed physical absorption techniques,
it involves the transfer of CO2 from gas to liquid but via chemical reactions.
However, unlike water scrubbing, H2S must be carried out separately in order
to eliminate the chance of H2S-amine poisoning [90]. The use of chemical
absorption enables the recovery of over 99% of biomethane due to the high
reaction selectivity with CO2 [90]. The process can also make sure little to no
CO2 remains present in the biomethane product [96]. Similarly to organic
solvent scrubbing, the process incurs high regeneration costs , reasoning its
limited (22%) share of the biogas upgrading market [91].

27
2.3.2.3 Pressure Swing Adsorption
Pressure swing adsorption (PSA) units manipulate molecular characteristics in
order to separate species according to their molecule size [92]. Water vapour
within the biogas must initially be condensed before the biogas is pressurised
and passed through adsorptive media, typically in the form of activated carbon
and/or zeolites. The smaller particle size of CH4 allows for its passage through
the material’s pores, whereas CO2 is adsorbed to its surface. When the
biomethane has been partitioned off, the pressure inside the PSA is dropped,
releasing CO2 from the, now re-useable, adsorptive material [93]. PSA can
achieve over 97% CH4 enrichment but at high energetic costs. The high
pressures required dictates that every ton of CO2 removed requires 915 MJ
electricity. In addition to the removal of water vapour, any H2S must also be
eliminated before PSA activity because its low sorbent characteristics means it
will remain in the biogas.
2.3.2.4 Chemical Adsorption
Chemical adsorption is a popular technology for the reduction of H 2S
concentration in biogas. Fe2O3, Fe(OH)3, ZnO and activated carbon are all
potential adsorptive media options [96]. However, the high costs of
regeneration and replacement limits the technology to large-scale applications
[89]. The adsorption can be described via the following stoichiometry:
Fe2O3 + 3H2S → Fe2S3 + 3H2O 2-9
2Fe(OH)3 + 3H2S → Fe2S3 + 6H2O 2-10
2Fe2S3 + 3O2 → 2Fe2O3 + 6S 2-11
Despite the high costs, chemical adsorption remains a well-used option because
of its simplicity and ability to reduce concentrations of species other than CO2
and CH4 down to 1ppm [96]. The use of such adsorption technology has

28
recently been tested at pilot scale for the removal of H2S from biogas at a
wastewater treatment plant in Spain as a pre-treatment for SOFC processing
[97] with great effect. However, if CO2 removal is required, it must be combined
with an alternative technology such as water scrubbing.
2.3.2.5 Membrane Separation
Conventional membrane systems work under the principle of preferential
permeation of CO2, H2S, O2 and H2O and the retention of CH4 and N2 across a
semi-permeable membrane [98]. Membrane upgrading can occur in low
pressure (atmospheric) gas-liquid modules or high pressure (>20bar) gas-gas
modules [96]. CH4 concentrations of 92-94% are typical for single-pass gas-gas
units [98]. However, 96-98% CH4 concentrations are guaranteed by standard
gas-liquid modules or in multi-stage gas-gas units [98]. Maintenance costs are
typically more than water scrubbing but less than other options discussed [92].
High energy costs can result from the pressurisation or heating with membrane
technology, yet as a mature option it still holds a market share of 10 %
[93,98][93,98].
2.3.3 Digestate
Digestate is the digested effluent from AD, i.e. what is left of the feedstock
material after biogas extraction plus the mix of microbial biomass responsible
for the biogas production. Thus, the composition of the digestate is highly
dependent on that of the initial feedstock, maintaining all of the original
nitrogen, phosphorus and potassium (NPK). These nutrients are the foundation
of biological growth, making it suitable for use as a fertiliser.
However, the nature of wastewater as a product of human and industrial waste
has led to varying opinions on the use of digestate from WWTPs as a fertiliser.
Direct application of primary and secondary sludge has brought about no
instances of human, animal or crop contamination [99]. However, concerns
regarding toxic substances and harmful micro-organisms has led to varying

29
acceptance and a ban in Switzerland on the use of sludge as a fertiliser [100].
These concerns have trickled down to application of digestate from sludge
digestion. Furthermore, in the UK, both sewage sludge, through the European
directive 86/278/EEC, and digestate, through PAS 110 [101] are regulated for
land application. As such, digestate often doesn’t meet these standards and
significantly limits the market for digestate in the UK.
2.3.4 Digestate Separation
In the AD industry, digestate is most often dewatered to produce a solid
(fibre/cake) and liquid (liquor) fraction. The wastewater industry most
commonly refers to the solid fraction as cake [102], thus, it will be referred to
as such from here-on. Separation is done for a number of reasons. Firstly, the
cake fraction is far smaller by mass and volume, making it easier to store,
transport and apply as a fertiliser. Furthermore, the cake retains more of the
phosphorus contained whilst the liquor contains the majority of nitr ogen from
the whole digestate [103]. The distribution of these factors can be viewed in
Figure 2-6.
As aforementioned, there is an increasing flux of phosphorus from rural to
urban areas [104–106]. A such, there is a higher demand for the phosphorus-
rich cake, justifying further why transport of cake over liquor is often favoured
[103]. A number of methods for dewatering are used in industry that range
between biological, mechanical and thermal techniques. A review of these
technologies can be found in ADBA [102] and Drosg et al. [107]. The most
popular options include: screw press, centrifuge, belt filters, membrane
filtration and evaporation.

30
Figure 2-6. Distribution (%) of various factors after liquid-solid
separation by rotary screen separator and screw extractor. Source: Bauer
et al. [108].
In the wastewater industry, digestate liquor is often recycled back into the
treatment process for activated sludge conditioning [19]. The recycling of
digestate liquor contains 15-20% of a plant’s N-load [18,19]. Resultantly, it
significantly contributes to the energy demand and carbon footprint of a
wastewater treatment system due to the forcing of having an increased
nitrogen plant load.
2.4 Energy at wastewater treatment plants
Conventional wastewater treatment facilities both recover and use energy.
However, with the exception of a handful of cases [50,57], more energy is
consumed than generated. The specific energy use varies drastically amongst
regions and facilities. Comparisons can be made between plants by calculating
electricity use as a function of influent flow, known as the ‘source electrical
energy use intensity’ (EUI). This variation can be seen displayed in Table 2-3,
ranging from 0.30-0.78 kWh /m3 treated wastewater.
79.2
71.8
68.6
56.3
48.5
42
35.8
20.8
28.2
31.4
43.7
51.5
58
64.2
M a s s
P o t a s s i um
N i t r o g e n
A s h
P h o s p h or us
V o l a t il e S o li ds
C a r b o n
Liquid phase Solid phase

31
Table 2-3. Average EUI values from literature for respective regions
Region Average EUI (kWh/m3 treated
sewage)
Reference
USA 0.78 [109]
Canada 0.35 [110]
Flanders 0.30 [111]
Austria 0.30 [112]
Sweden 0.47 [112]
Displayed in Figure 2-7 are the primary formats in which electricity is used at
WWTPs and makes up the EUI’s shown in Table 2-3. The largest share of
demand is that associated with aeration, with an average share of 54%. As
discussed in sections 2.2.2 and 2.2.3, aeration is required in ASP for the
biological processing of nitrogen and organic carbon. According to the
stoichiometry of Eq 2-5, the conventional nitrification process requires 4.57 kg
O2 /kg oxidised-N. Aeration efficiency varies between 1-2 kg O2 /kWh therefore
energy requirements lie between 4.57-9.14 kWh /kg oxidised-N [57,67].
According to calculations in [57], conventional removal of nitrogen (via
predenitrification) accounts for roughly 27% of a WWTP’s total energy
demand.

32
Figure 2-7. Energy demand breakdown at conventional WWTPs data
derived from [52].
Energy is conventionally recovered through anaerobic digestion of primary
secondary sludge in most wastewater treatment facilities in the UK [43]. AD is
a way to convert the energy stored in organic compounds to a biogas which can
be combusted in CHP units. The composition of biogas is shown in Table 2-2.
Methane (CH4) has a high energy content, with a heat of combustion of 55.53
kJ/ g CH4 [113]. Spark ignition internal combustion engines are almost
exclusively used with biogas for CHP applications and run with varying
electrical (37-42 %) and thermal efficiencies (35-43 %) [114].
2.5 Hydrogen
2.5.1 Hydrogen Background
The origins of producing an electric current when combining hydrogen and
oxygen i.e. the fuel cell effect, can be traced back to the early 19 th century [115].
This electrochemical conversion and/or its combustion has the ability to
provide energy whilst emitting no GHGs or pollutants, just water (Equation
2-12):
Aeration54.0%
Return Sludge Pumping
0.5%
Gravity Thickening
0.1%
Anaerobic Digestion
14.2%
Belt Press3.9%
Chlorination0.3%
Lighting and Buildings
8.1%
Wastewater Pumping
14.3%
Grit1.4%
Clarifiers3.2%

33
H2 + ½ O2 → H2O 2-12.
H2 has a greater energy density by mass than any other fuel, with an energy
content of 141.78 MJ/kg [116]. This is more than double that of liquefied
natural gas (54.4 MJ/kg) and more than triple that of automotive gasoline (46.4
MJ/kg) [116]. Hydrogen is also the most simple and abundant element in the
universe. However, accessing/extracting it sustainably in its pure form has
been the most important stumbling block for the uptake of hydrogen energy
technologies.
On earth’s surface, the majority of hydrogen is found combined with oxygen in
water or carbon in hydrocarbons. Water’s abundance makes it a near -perfect
feedstock at face-value, but its thermodynamic stability means dissociation
requires vast quantities of energy [117]. Instead, the preferred method of
industrial hydrogen production is through steam methane reforming (SMR)
[118]. However, high temperatures are still required to crack the CH4, which
makes it an expensive process with limited thermal efficiencies. Resultantly,
the majority of hydrogen is used for industrial processes such as ammonia
production, oil refining, and methanol production, rather than as fuel
[119,120].
The notion of an energy system broadly based on molecular hydrogen has been
touted since the early 1970’s with Bockris [121] coining the term ‘Hydrogen
Economy’. However, despite vast swathes of research and enough molecular
hydrogen produced every year to power 600 million fuel cell cars [122], it plays
a miniscule role in current energy infrastructure. This boils down to 4 main
reasons (1) the energy intensive nature of its production, (2) safety concerns,
(3) storage problems, (4) lack of a sustainable feedstock.

34
2.5.2 Safety
Many properties of H2 facilitate concerns over the safety of its use and have
been extensively researched and reviewed in literature such as Rigas &
Amyotte (2013) [123] and Crowl & Jo [124]. Its high energy content and
combustion efficiency are the crux of both the resistance and attraction of its
use as a fuel. Historical high profile disasters involving hydrogen gas such as
the Hindenburg zeppelin fire of 1937, the Pasadena chemical plant explosion of
1989 and the Sodegaura refinery explosion of 1992 killed 36, 23 and 10 people
respectively [123]. Hydrogen requires a very small amount of energy to ignite
and just a small electrostatic spark is enough to enable its combustion [125].
Furthermore, in broad daylight, flames during its combustion are near-invisible
to the naked eye, making them hard to locate, extinguish or avoid. The burning
velocity is also much greater than other fuels, meaning ignition in a confined
space will likely lead to an explosion [125].
The public’s fear of these hazards has been coined ‘Hindenburg syndro me’ after
the disaster in 1937 where a zeppelin containing 200,000m3 fuel ignited whilst
flying over New Jersey, USA. However, questions over hydrogen’s comparative
risk to other fuels or whether Hindenburg syndrome is felt universally have
been questioned. Hydrogen may represent a greater hazard over natural gas
and gasoline for its higher deflagration index, wider flammability limits and
lower ignition energy as shown by Crowl & Jo [124]. However, hydrogen
happens to be the lightest element in nature meaning, unless it is ignited in a
contained space, it will disperse into the atmosphere before any damage can be
done. This is significant if comparing H2 to traditional vehicle fuels such as
gasoline which, unlike hydrogen, would leak over a long period of time;
increasing the chance of fire [125]. Furthermore, hydrogen is often compared
to methane as a potential pollution free, light-weight transport fuel for the
future, but it too, requires very little energy to ignite. Study by Kiwa found it to
be just another flammable gas.
Despite ‘social concern’ continually expressed as a key reason for the lack of
hydrogen uptake [126,127], critical reviews of public perception studies
carried out in Ricci et al. [128] and Yetano Roche et al. [129] have questioned

35
this. They found the Hindenburg disaster, along with the aforementioned
related events, are seldom associated with hydrogen by the public and positive
views of hydrogen far outweigh negative ones. However, both studies did
illustrate the widespread lack of understanding and awareness of
hydrogen/fuel cells and they also displayed the varied outlooks towards public
willingness to pay more for hydrogen fuel or vehicles.
2.6 Current hydrogen production methods
2.6.1 Steam Reforming
Steam reforming of natural gas, often referred to as steam methane reforming
(SMR) is the most widely used method of hydrogen production. In principle,
super-heated steam is used to separate natural gas into its individual
hydrocarbon components; resulting in a syngas of hydrogen and carbon
monoxide (Equation 2-13). The reaction is highly endothermic with a standard
enthalpy of formation (H298) of +206 KJ molCH4-1. Resultantly, temperatures of
~850-900oC are used by industry for this process [130].
CH4 + H2O CO + 3H2 2-13.
2CO C + CO2 2-14.
CH4 C + 2H2 2-15.
C +H2O CO + H2 2-16.
CO + H2O CO2 + H2 2-17.
CH4 + CO2 2H2 + 2CO 2-18.
Equation 2-13 indicates that 2 moles of reactants are used to produce 4 moles
of syngas. Therefore, under Le Chatelier’s Principle, a forward reaction would
hold a preference for lower pressures. However, high pressures of 20-30 bar
are usually used in industry due to space saving, and synthesis loop
requirements (in the case of ammonia production) [130]. Equation 2-13 also
shows under stoichiometric conditions an equimolar feed ratio of steam to

36
carbon (S:C) of 1:1. However, S:C ratios of 2.5 to 3 are more commonly used to
prevent coke deposition on the catalysts [131]. Elemental carbon (coke) can
form through Equation 2-14 and Equation 2-15. Thus, excess steam is used in
order to keep the reaction shown in Equation 2-16 going forward.
The hydrogen production process doesn’t stop there in an SMR plant, however.
The reforming stage is followed by a mildly exothermic (H298 = -41 KJ molCO-
1) ‘water gas shift’ (WGS) (Equation 2-17) that is used to maximise H2 yields.
By facilitating the reaction of steam with the carbon monoxide in the syngas, it
is possible to dissociate hydrogen bonds held in water.
The syngas is rapidly cooled to 350oC, before entering the WGS reactor.
However, the reaction’s exothermicity increases the temperature, which aids
the catalysts and increases the rate of reaction [130]. However, this shifts the
equilibrium leftwards which limits hydrogen formation. To bypass this, two
reactors can be used, with a high temperature shift (HTS) and low temperature
shift (LTS) reactor. However, the LTS step has become obsolete in recent years
due to the introduction of pressure swing adsorption (PSA) units [130] which
are used to separate hydrogen from the unconverted CH4 and carbon dioxide
product by manipulating adsorption properties for differing partial pressures
[132].
2.6.1.1 SMR Catalysts and deactivation
Catalysts are agents used to accelerate the rate of reaction and lower required
activation energy without being consumed themselves [133]. Metals such as
nickel, ruthenium, rhodium, iridium cobalt, platinum and palladium (amongst
others) can and have been used as catalysts in SMR [134–136]. Despite less
favourable activity per unit weight, nickel-based catalysts are most commonly
used due to their financial advantages of production [135,136].
The steam reforming reaction must take place on the surface of Ni catalysts for
it to be catalytically influential, making the available surface area an important
factor of catalysis. As such, nickel is dispersed as small crystallites on a strong
‘support’ with good porosity, to allow a stable and large active surface area

37
whilst being able to withstand great heights of its own weight [135]. Commonly
used supports include aluminium oxide (Al2O3), magnesium oxide (MgO),
calcium oxide (CaO), magnesium aluminate (MgAl2O4) and silicon dioxide
(SiO2) [135,136]. The support material must fit a number of criteria: allow the
dispersion of Ni; prevent particle migration; allow access of reactants; not
interfere with reactivity or catalyse side reactions [136].
Ni-based catalysts can undergo physical decay via the agglomeration of
crystallites, often referred to as ‘sintering’ [137]. Agglomeration results in a
loss of surface area, which as aforementioned, is a quintessential component
for the effectiveness of a catalyst. Elevated temperatures, the presence of water
and an inadequate support to prevent particle migration are known to be the
most important factors to enhance sintering [135,136]. In fact, without an
effective support, extensive and deactivating sintering would occur in seconds
[136].
Catalyst poisons work by blocking active surface sites and/or by changing
atomic surface structures whereby reducing catalytic activity [135]. Sulphur
can be considered as the most important poison for Ni-based catalysts. It is
both a powerful poison and present in most naturally occurring feedstocks,
such as natural gas [136]. Sulphur binds to metal sites after decomposing from
H2S and forms stable compounds with all transition metals [138,139]. This not
only coats the nickel surface but also alters its structure [140]. It is widely
regarded that concentrations of <0.5 ppm are acceptable in the feed gas for
reforming [136]. However, above this and desulphurisation methods should be
implemented.
‘Coking’ is a common form of poisoning in the steam reforming of hydrocarbon
compounds. Coking describes the process of elemental carbon deposition
which causes both operational instability and deactivation of catalysts [141].
As discussed in section 2.6, coke forms during intermediate reactions of the
reforming process (Eq 2-14 and Eq 2-15) and proceeds to diffuse and dissolve
into Ni catalysts. It has been found that coking is more susceptible on nickel-
based catalysts than on noble metal counterparts, temperatures above ~450oC
and low S:C ratios [135]. Thus, in order to prevent coking, greater than

38
stoichiometric quantities of H2O are used, which often equates to S:C ratios
>2.5. Alternative noble metal-based catalysts may also be used, such as
ruthenium and rhodium, which are generally considered to facilitate less
carbon formation[141]. However, financial costs rarely outweigh the benefits.
Furthermore, trace amounts of sulphur in feed streams have been found to
minimise coking by restricting the space for formation to occur on Ni catalyst
surfaces [141].
2.6.1.2 Desulphurisation
Both chemical reaction technologies and adsorptive technologies can be used
for the removal of sulphur [118]. The most widely used for large-scale
applications is hydrodesulphurisation (HDS) [118], which is only used on
hydrocarbon feedstock containing chemically bound sulphur in the form of
sulphides, mercaptans, thiophene and benzo-thiophenes, commonly present in
petroleum crudes. A chemical reaction technology, it uses H2 (often recycled)
to hydrogenate sulphur to release H2S under elevated temperatures and
pressures [142,143]. It is able to reduce sulphur levels to several ppm, but is
energy intensive; running at temperatures of (300-340oC) and pressures (20-
100 atm) [143].
For gaseous feedstocks contaminated with H2S, adsorption processes are
similar to those described in section 2.3.2. Whereby a reaction takes place
between a reduced metal and sulphur, forming a metal sulphide [142]. The
sorbent is continuously regenerated and recycled which is advantageous but
chemical costs still remain expensive [96,142].
2.6.2 Water Electrolysis
Simply put, water electrolysis is the separation of hydrogen and oxygen from
water via the use of an electric current [118,144]. The process occurs in an
electrolytic cell, which is configured of three main elements; two electrodes, a
diaphragm and an electrolyte [144]. In the cell, electrodes are submerged in an

39
electrolyte which facilitates strong ionic conductivity. The diaphragm divides
the two electrodes and ensures hydrogen and oxygen do not recombine once
separated. The flow of electrons creates a positively polarised cathode and a
negatively polarised anode. Water is normally introduced at the cathode (in
alkaline electrolysers) and decomposes to hydrogen and OH- [145]. The OH-
ions travel across the electrolyte to the anode where O2 is formed [145]. The
process is essentially the conversion of electric and thermal energy to chemical
energy (in the form of molecular hydrogen):
H2O → H2(g) + ½O2(g) 2-19
The electrolyte material used will dictate the operational conditions used and
create different classifications of electrolysers. The main options of which
include; alkaline electrolysers, proton exchange membrane electrolysers and
solid oxide electrolysers that can be seen reviewed extensively in Ursua et al.
and Holladay et al. [118,144]. Water electrolysis holds roughly 4% of the
market share of hydrogen production [144]. One of its main advantages is the
potential to obtain unparalleled high purity H2. However, the requirement of
electricity is where it comparatively falls short of other technologies for a
number of reasons. Firstly, it facilitates low exergetic efficiency, it is expensive
and (in most part) non-renewable [146]. However, there are scattered
examples of large-scale plants using inexpensive and renewable electricity
from hydro-electric dams [146].
2.6.3 Dark fermentation
Dark fermentation involves the microbial degradation of organic material in
anaerobic environments to generate an H2 rich biogas [147]. The process
works under similar fundamentals to anaerobic digestion (see section 2.3.1),
but conditions are catered for bio-hydrogen production rather than bio-
methane. This is done by manipulating a number of parameters such as
temperature, pH, organic loading rate, type of reactor, pre-treatment, solids

40
retention time to name a few [148]. By doing this, one can promote hydrogen
production pathways and limit its consumption. However, this is problematic
as by limiting particular biochemical routes, a large proportion of substrate will
be left in the fermenter/digester [149]. As such, in practice only a third of the
theoretical H2 can be generated, equating to 4 mol H2/mol glucose, known as
the Thauer limit [148,150].
Despite its flaws, system efficiencies range between 60-80 % [151].
Furthermore, the remaining substrate can be used for standard anaerobic
digestion [152]. Under this scenario, bio-hydrogen and biomethane could be
generated sequentially using the same feedstock. However, dark fermentation
is yet to see commercial uptake and is likely to be the case until significant
process optimisation is achieved.
2.6.4 Ammonia-based hydrogen studies
Due to issues in storing hydrogen, ammonia has been touted as a carrier of
hydrogen that can be used for chemical storage. Ammonia contains a high
quantity of hydrogen (17.6 wt%) and has multiple sustainable storage options
[153]. Thus, the release of its hydrogen via catalytic decomposition has
received much attention as can be seen in reviews by Bell & Torrente-Murciano
[153], Yin et al. [154] and Schüth et al. [155]. Ammonia decomposes under the
reverse Haber-Bosch process (Equation 2-20):
2NH3(g) ↔ 3H2 + N2 2-20
With a ΔH of +92.4 kJ mol-1, it is an endothermic reaction and is
thermodynamically limited at low temperatures. Under equilibrium conditions
ammonia conversion at 1atm and 773K is 99.1%, exponentially decreasing
with lower temperatures [154]. In real systems, decomposition is heavily
dependent on the type of catalyst being used. It is widely accepted that
Ruthenium(Ru)-based catalysts are the most active for ammonia

41
decomposition [154,155]. However, Ru is a rare and expensive material,
making cheaper metals such as iron, cobalt and nickel more attractive [153].
Ni/Al2O3 has been found to provide competitive rate of reactions for ammonia
decomposition [153,155]. It is also a common catalyst used in steam methane
reforming (SMR) reactors and the anode of internal reforming solid oxide fuel
cells (SOFCs). An investigation by Wang et al. [156] found that ammonia, when
mixed with methane and used as fuel for a SOFC with a Ni/Al2O3 anode catalyst,
significantly suppressed carbon deposition. They found at an ammonia
concentration of 33.3% with methane, coke formation decreased by 71%,
whilst maintaining high conversions of both methane and ammonia.
There are few other cases of in-situ combined SMR and ammonia
decomposition. However, one exception is a study carried out by Xu et al. [157],
whom experimentally analysed the recovery of ammonia from landfill leachate
for use alongside biogas in a SOFC. The anode, consisting of NiO +
(ZrO2)0.92(Y2O3)0.08 (YSZ, NiO: YSZ = 6:4 by weight) was able to perform both
ammonia decomposition and SMR.
2.6.5 Steam reforming with unconventional reagents
Zin et al. [62] investigated the potential of using a reagent that could
simultaneously act as a source of steam and a supplementary hydrogen
feedstock in the reforming of ethanol. In their experiments, waste aqueous bio -
oil from fast pyrolysis was used in replacement of pure steam. It was shown to
have an organic content of 7.1 wt%; with the remaining 92.9 wt% water. At
temperatures of 600oC the water content conventionally reformed ethanol,
whilst the organic fraction broke down, boosting final H2 yields. As of yet, it is
the only paper to have replaced steam in conventional hydrocarbon reforming.
2.6.6 Hydrogen generation at wastewater treatment plants
Producing H2 from biogas generated at WWTP was first proposed by Shiga et
al. [158] in 1998. Since, however, only scattered examples of hydrogen

42
production at wastewater treatment works can be found in literature and even
fewer real applications. The Emschergenossenschaft's Bottrop wastewater
treatment facility was recently chosen as the location for the EuWaK project,
where a pilot-scale operation involving the processing of biogas to bio-methane
and hydrogen has been implemented [61]. As at most WWTPs, sewage sludge
is anaerobically digested to generate biogas. The biogas is then scrubbed of CO2
and other impurities within a PSA unit, generating high quality biomethane.
The biomethane supply is then split between a biogas filling station and a
conventional SMR process. A review of the project by Reinders et al. [61] has
discussed the operation which generates high-purity hydrogen for use in a H2
combined heat and power (CHP) unit to supply a local school and swimming
pool with electricity and heat. This is the only example in literature that could
be found for a pilot-scale thermochemical hydrogen production system based
at a wastewater treatment facility. However, a study by Hajjaji [60] found that
a steam biomethane reforming hydrogen production facility would have half
the lifeycle emissions of a conventional SMR plant. It is also important to note
findings from Appari et al. [159] and Chattanathan et al. [160], which describe
the importance of H2S removal prior to any reforming by highlighting the
detrimental impacts of only small quantities of H2S in biogas for the operation
of catalysts during steam reforming.
Due to the presence of CO2 in biogas, dry reforming has been considered an
option for hydrogen production at wastewater treatment and AD plants. The
dry reforming reaction (CO2 reforming of methane) can be seen in Eq 2-18 and
involves the reaction of methane and carbon dioxide to produce a syngas of
hydrogen and carbon monoxide. Studies such as Cruz et al. [161] have found
competitive exergetic efficiencies of around 55%. Wheeldon et al. [162],
showcased a process modelling-based study for the implementation of biogas
dry reforming technology at WWTPs. They were able to determine potential
flow-rates and system efficiencies but omitted mentioning some of the
technological barriers which have hindered market uptake of this technology.
This has been largely due to catalytic issues such as coke formation and poor
catalytic activity with affordable catalyst options [163,164].

43
Another potential route for hydrogen production at wastewater treatment
plants is via biological processing of sludge. Ordinarily, sludge is anaerobically
digested to generate a methane-rich biogas, a technology extensively used in
WWTPs globally. However, by manipulating the bacteria present in the
digester, it is possible to generate an H2 rich gas, instead, via dark fermentation.
An extensive review of biohydrogen production can be found in Ntaikou et al.
[147], whilst a review in its application with multiple wastewater streams can
be found in Lin et al. [165]. The prevention of bacterial methane production,
however, leaves a considerable amount of substrate in the digestate which can
be used for conventional anaerobic digestion [152]. As such, it is possible to
produce both bio-hydrogen and biomethane with the same sludge feedstock.
However, dark fermentation is yet to be utilised on a large scale in WWTPs.
A further option for hydrogen production at WWTPs discussed in literature is
the use of microbial electrolysis cells (MECs). These work by the oxidation of
organic material present in wastewater by electrochemically active bacteria to
produce electrons and protons [166]. The electrons are passed through a
circuit from the anode to the cathode, whilst the protons are released into
solution. Simultaneously, an external voltage is applied which enables the
production of hydrogen at the MEC’s cathode via the combination of protons
(H+) and electrons (e-). It is considered a promising technology due to the
relatively low energy input of 0.2-0.8 V compared to water electrolysis’
requirement of 1.23-1.8 V [166]. There are further benefits, considering their
use facilitates the destruction of COD simultaneously. The potential impact of
MEC implementation has been discussed in studies such as Zou & Zhen [167]
and Khan et al. [168]. Scale-up rates and pilot testing have been slow due to
high internal resistances, contaminated electrodes and product gas and capital
investment costs [166]. A partnership between Northumbrian Water and
Newcastle University have been carrying out pilot tests as discussed in Cotterill
et al. [169]. However, it is concluded that significant research and development
is required before full-scale implementation can be realised.

44
2.7 Ammonia Recovery Options
2.7.1 Stripping
Stripping is a desorption technique, relying on the principle of liquid to gas
mass transfer. It is the most popular method of recovering ammonia from
waste streams such as digestate liquor, landfill leachate, farm slurry and urine
[22,170–172]. There are two main stripping agents used in industry, air and
steam [173]. Air is generally the preferred method for the fact that steam
generation is energetically more intensive than heating air to required
temperatures.
In the case of both air and steam stripping, ammonia should be present in its
un-ionised (free) form of NH3 over its ionised form of NH4+ (ammonium). This
allows the ammonia to be in its more volatile form, thus increasing the chances
of it being successfully stripped. The equilibrium between ammonium and
ammonia is temperature and pH dependent, as described in Equation 2-21:
⌊NH3⌋ = [NH3 + NH4
+]
1 + [H+]/Ka
2-21
𝑝𝐾𝑎 = 4 × 10⁻⁸𝑇3 + 9 × 10⁻⁵𝑇2 + 0.0356𝑇 + 10.072 2-22
where, [NH3], [NH3 + NH4+] and [H+] are the free ammonia, total ammonia and
hydrogen ion concentrations respectively and Ka is the acid ionisation constant
for ammonia. The pKa can be calculated via Equation 2-22 which has been
derived in Bonmatí & Flotats [174] by polynomial regression of data from Lide
[175]. In essence, together, they show that the higher the temperature and pH,
the more ammonia will be present in its free form. Caustic soda is often used
to increase the pH of the liquor. However, there is a balance between boosting
pH and keeping the cost of recovery down. It was found by Hidalgo et al. [176]
that when pH is increased to above 10.5, the extra costs of purchasing alkali
products are not balanced out by the marginal increase potential of ammonia

45
recovery. Alongside alkali doping, carbon-dioxide stripping is often carried out
as a pre-treatment, as it also helps to boost the pH of the remaining liquor [177].
Dissolved CO2 reduces the pH of solution, thus its removal acts inversely. This
has been experimentally demonstrated in Lei at al. [178]. CO2 has roughly one
thousand times the volatility of ammonia, meaning CO2 stripping can be
completed without significant increases in operational costs, requiring less
than 5% of the air required for ammonia stripping [177]. In most cases of
ammonia recovery from digestate liquor, stripping is followed by an absorption
step to form a product that can compete with industrial fertilisers. Sulphuric
acid (H2SO4) and nitric acid (HNO3) are popularly used as absorption agents
[20]. A concentrated solution of ammonium sulphate ((NH4)2SO4; AmS) can be
generated with the addition of sulphuric acid. AmS has been used as a fertiliser
for over 150 years [179] and still holds roughly a 3% share of the nitrogen-
based fertiliser market [180]. Ammonium nitrate (NH4NO3) can alternatively
be generated with the use of nitric acid during absorption [20], which currently
holds roughly a 6% share of the nitrogen-based fertiliser market [180].
2.7.1.1 Air Stripping
Air stripping is normally carried out in stripping towers where a liquid stream
is trickled from the top, travelling through spaces in a packing material where
it meets air blown from the bottom. The amount of ammonia removed from
liquid is dependent on a number of factors, one of the most important being the
flow of air used. Effectively, the more air used, the more ammonia that will be
stripped. At low concentrations, such as those found in digestate liquor, this is
dictated by Henry’s law (Equation 2-23). This describes the distribution of
volatile compounds between gas and water phase at thermodynamic
equilibrium, where solubility is directly proportional to the partial pressure of
a gas above a liquid [181].
𝐇 =𝐏𝒂
𝑪𝒂 2-23

46
where, H is the proportionality constant (bar.L.mol-1), Pa is the partial pressure
of the solute (in this case ammonia) in gas phase (bar) and Ca is the
concentration of the solute in the liquid (mol l-1). Thus, solubility lowers with
partial pressure which can be achieved by increasing the flow of air.
Temperature is another factor which influences the effectiveness of stripping.
This is because it is a property of the Henry proportionality constant (H) which
follows Van’t Hoff’s relationship Equation 2-24:
𝐥𝐨𝐠𝐇 = (−𝐇𝐨
𝐑𝐓) + 𝒌 2-24
where Ho is the standard enthalpy of reaction for the dissolution of ammonia
(kJ mol-1), R is the ideal gas constant (kJ K-1 mol-1), T is absolute temperature
(K) and k is an empirically derived compound dependent constant. The
solubility of ammonia, as with most substances, decreases with temperature
[181]. As such, boosting the temperature of the liquor and air being used will
aid the stripper’s capability.
It is not just temperature and air flow that control the rate at which ammonia
can be stripped. The overall mass transfer coefficient (Equation 2-25) [182]
describes other important factors such as packing material properties and
physical properties of the liquid in question:
𝑲𝑳𝒂 = 𝛂 (𝑳𝑴
𝑼𝑳)
𝟏−𝒏
(𝑼𝑳
𝛒𝑳𝑫)
𝟎.𝟓𝑫
2-25
where α and n are packing-specific constants, LM is the liquid mass flux rate (kg
m-2), UL is the liquid’s viscosity (Pa . s), ρL is the liquid’s density (kg m-2) and D
is the molecular diffusion coefficient (m2 s-1) of ammonia in water. It is,
therefore, important that appropriate packing material is used for effective
ammonia stripping to occur due to the effect of packing-specific constants in

47
equation 2-25. Options are often made of polypropylene, PVC or ceramic and
can be any size or shape from rings to saddles to spheres [183].
In a review by Kinidi et al. [184], seven packed bed ammonia stripping reactors
were assessed from various types of industrial wastewater. Initial ammonia
concentrations ranged from 12-5000 mg l-1, stripping temperatures ranged
from 14-60°C, pH ranged from 10-12 and the corresponding ammonia removal
varied from 72 to 99%. Kinidi et al. noted the significant influence,
temperature, pH and air-water ratios have on stripping capabilities. Theyalso
note that at higher temperatures the air-water ratio is far less significant.
Other research has analysed the use of high temperature units (<60°C) such as
Saracco and Genon [185] and Errico et al. [21]. Saracco and Genon studied air
stripping of ammonia at temperatures between 40°C and 80°C, finding not only
markedly improved performance at higher temperatures but also a reduction
in capital cost projections. Capital costs for stripping carried out at 40°C was
concluded to be twice those at 80°C due to the increased size of stripping and
absorption units, pumps and fans required with a greater gas-liquid ratio used
at lower temperatures. However, it was noted that operational costs were likely
to increase with heating requirements, a sentiment also backed in Liu et al.
[186]. On the other hand, Errico et al. found that heating requirements can be
met internally with effective heat transfer with stripping temperatures up to
70°C.
The use of air stripping technology is limited at wastewater treatment works
at present. However, there is an abundance of commercially available
technology from various companies and countries of origin. Some
manufacturers include: RVT [187] and ANAStrip® from Germany [188]; ACWA
in the UK [189], Anaergia from Canada [190]; Monroe environmental [191],
Branch Environmental Corp [192] and CECO Environmental [193] in the US;
Nijhuis Industries (AECO-NAR process) [194] and Colsen (AMFER®) [195]
from Holland; and CMI Group (RECOV’AMMONIA™) from Belgium [196]. The
range of available technology demonstrates the readiness of the potential
process implementation at UK wastewater treatment plants.

48
2.7.1.2 Steam Stripping
Steam stripping, like air stripping, is a liquid-gas mass transfer process but
carried out at higher temperatures. One key benefit is that post-absorption
doesn’t have to be carried out, as the gaseous effluent can be condensed to
produce a concentrated ammonia solution as shown by Teichgräber and Stein
[197]. This in turn has the potential to reduce capital costs of the process. Zeng
et al. [198] found that pH did not significantly impact on stripping efficiency
due to natural increase of pH inside the stripper. If pH adjustments do not need
to be made, then basic substances do not need to be purchased, which could
reduce operational costs. However, one key reasons air stripping is industrially
preferred is because the cost of raising steam is so much more intensive and
expensive than raising the temperature of air [172,173].
2.7.2 Membrane Technology
Membrane technology is another method from which ammonia can be
recovered from solution. Such options include reverse osmosis RO, forward
osmosis (FO), membrane distillation (MD) and electrodialysis (ED)
[20,199,200]. Reverse osmosis uses semi-permeable membranes and
hydraulic pressure to overcome natural osmotic pressures in order to separate
ions from water [201]. Thus, much like stripping requires a high pH in order to
favour ammonia in its free gaseous form, RO requires a low pH so as to favour
its ionised form (NH4+). However, use of RO for ammonia recovery is limited in
industry for a number of reasons such as: high pressure (50 bar) requirements,
scaling causing frequent down-times and extra operational costs, high
retention of micropollutants and the need for additional separation processes
such as ion exchange are required in order to recover ammonia without other
components [107,202].
Forward osmosis (FO), like RO uses a semi-permeable membrane to allow the
flow of water whilst retaining solutes such as ammonium. However, in FO a
‘draw’ solution is used which provides an osmotic pressure greater than that
held in the wastewater [203]. It is seen as a promising alternative to RO because

49
direct hydraulic pressure is not required, reducing operational costs. However,
FO is not without its issues. For example, there is often over-contamination in
draw solutions and for pure ammonia removal it also needs to be paired with
other separation technologies, which boosts operational and capital costs
[204].
Membrane distillation (MD) uses a hydrophobic microporous membrane to
separate a feed stream from distillate [204]. Heat is used in order to vaporise
water and volatile components such as ammonia which pass through the
membrane. MD regularly achieves ammonia recovery over 96% [204].
However, like most other membrane-based processes, fouling is a serious
technological problem [205]. Due to the fact that it is a gas-liquid separation
process, wetting of the membrane is also an issue, which results in direct liquid
flow-through causing detrimental inorganic contamination [206].
In electrodialysis, an ion-exchange membrane is used to allow the movement
of ionic compounds such as ammonium by electromigration under the driving
force of an electrical potential created by a direct current field [25]. The current
field allows the attraction of cations and anions to cathodes and anodes
respectively [204]. Electrodialysis suffers from similar issues as other
membrane technologies with persistent fouling and the need to be preceded or
proceeded with other separation processes to generate a pure ammonia
solution.
2.8 Fuel Cell Technology
Fuel cells enable the conversion of chemical energy in fuels directly to electrical
energy. They tend to have greater electrical efficiencies compared to
conventional power generation systems because they are not limited by Carnot
efficiency or other thermodynamic obstructions experienced by combustion-
based systems [56]. Fuel cells consist of an anode, a cathode and an electrolyte.
Typically, fuel and an oxidant (usually oxygen in air) are fed continuously at the
anode and cathode respectively. Electrochemical reactions take place causing

50
the movement of ions through an electrolyte, generating an electric current
and, therefore, power.
Fuel cells are generally classified by the type of electrolyte in use. The most
common of which include solid oxide fuel cell (SOFC), molten carbonate fuel
cell (MCFC), phosphoric acid fuel cell (PAFC), alkaline fuel cell (AFC), proton
exchanger membrane fuel cell (PEMFC) and polymer electrolyte fuel cell
(PEFC) [56,207]. The electrolyte dictates the operating temperature range and,
therefore, the type of fuel permitted and the quality of heat produced [56]. As
such, this limits the type of fuel cell that can be used for CHP applications at
wastewater treatment plants to SOFCs and MCFCs.
2.8.1 Solid oxide fuel cells
SOFCs use hard ceramic electrolytes operating at temperatures between 600-
1000°C [207,208]. A crystal lattice, normally consisting of zirconium oxide and
calcium oxide, forms the electrolyte [208]. The latticed nature of the electrolyte
allows oxide ions (O2-) to pass through to the anode, reacting with hydrogen to
form water and electrons (Equation 2-26):
𝑯𝟐 + 𝑶𝟐− → 𝑯𝟐𝑶 + 𝟐𝒆− 2-26
The reaction shown in Equation 2-26 is an exothermic one, which alongside the
high temperatures used in the fuel cell produces a high quality heat stream.
SOFCs have been found to generally operate at the highest electrical efficiencies
of up to 60% and cogeneration efficiencies up to 90% [207]
2.8.1.1 Internal reforming capabilities
One key attribute of SOFC is their ability to handle a wide variety of fuels. The
anode side of the fuel cell incorporates a catalyst, often nickel-based, which
allows for steam reforming or gasification of hydrocarbons [209,210].
Accordingly, the most popular fuels for use in SOFCs have been natural gas or

51
methane which have been widely analysed in literature [208,210–212]. The
internal reforming capabilities mean costs normally associated with external
reforming reactors and separation technology are no longer required.
The high operating temperatures mean they can also reform other fuels, most
notably ammonia. Ammonia will thermally crack on the anode side, generating
hydrogen and inert nitrogen gas [213]. Ammonia has been analysed both as the
sole fuel for SOFC in literature [63–66] and alongside other fuels [156,157,214].
It has been found that ammonia decomposes at a high rate, even at lower
temperatures of 500°C [213].
Interestingly, it has also been found that using ammonia alongside methane
significantly reduces coke formation in a study by Wang et al. [156]. The study
found ammonia conversions over 96% above 750°C. Whilst, a mixture
containing 33.3% ammonia reduced carbon formation by 71%. This
demonstrates that it is not only possible to co-reform ammonia and methane
directly in a SOFC but ammonia’s presence could be operationally beneficial.
2.8.1.2 Use at wastewater treatment facilities
WWTPs are often net consumers of electricity [215]. As such, the use of SOFCs
has been proposed as a way to enhance the power output of facilities and
reduce net consumption [53–55]. A study by Gandiglio et al. [216] found that
Castiglione WWTP in Italy can transform from producing just 50% of its energy
demand to fulfilling all of it by co-digesting food waste and using a SOFC
running off biogas made at the facility.
This highlights another important factor; that biogas containing both methane
and CO2 can be directly fed to a SOFC without scrubbing of the biogas.
DEMOSOFC is a European project that will install a SOFC at SMAT Collegno
WWTP in Turin and will be the largest SOFC system to run off biogas in Europe
[217]. Many other authors have studied the use of using biogas in SOFC
[53,54,97,157,207,218]. However, the fuel cell efficiency tends to be slightly
impaired compared to pure bio-methane and pre-treatment to scrub H2S is
necessary due to its catalyst poisoning effects.

52
2.8.1.3 Modelling of SOFC systems
There has been an abundance of research carried out on the modelling of SOFC
in literature. There are three key forms of modelling carried out, the first being
numerical-based, the second being process modelling and the third fluid
dynamics. A review of numerical modelling of SOFCs has been carried out by
Hajimolana et al. [208]. Numerical modelling can illustrate the effect of
important parameters such as current density, feed composition and operating
conditions such as temperature and pressure on the overall cell voltage.
The fuel cell voltage is calculated via Equation 2-27:
𝐶𝑉 = 𝐸 − 𝑛𝑎𝑐𝑡 − 𝑛𝑜ℎ𝑚 − 𝑛𝑐𝑜𝑛𝑣 2-27
where, E is the Nernst voltage potential which describes the theoretical cell
voltage potential and nact, nohm and nconv are the activation, ohmic and
concentration losses respectively. The calculation of each of these components
forms the basis of numerical fuel cell modelling carried out in literature
[53,63,157,208,212,219–224] because from here power production potential
can be determined.
However, in order to understand the full efficiency and sustainability of the
system, process modelling needs to be done. Process modelling allows
investigation into the thermal power potential when heat transfer is taken into
account. It also can be used to determine syngas compositions when externally
or internally reforming hydrocarbons, the syngas compo sitions can then be
used as inputs for variables required in numerical modelling. Aspen plus is
frequently used to simulate mass and heat transfer for fuel cell systems
[53,221,224–227].
2.8.1.4 Costing and Economics
Due to its fledgling market availability, techno-economic assessments of SOFCs
have produced considerably varied results. For example, in the 2011

53
conference proceedings discussed by Colantoni et al. [228], a 2005 fuel cell
stack cost of 2600 €/kW is presented. In this study, it was also projected that
this figure would reduce to 501 €/kW by 2085 due to the influence of
economies of scale and research and development. Data generated by the
California Self-Generation Incentive Program (SGIP) and detailed in a study by
Wei et al. [229] state that Bloom Energy’s 200 kW base SOFC system has a
capital cost of 7,000-8,000 $/kW and installation costs of 2,000-3,000 $/kW.
However, it should be noted that the system cost also includes the price of
equipment other than the fuel cell stack such as the AC/DC converter, burners,
blowers etc. Colantoni et al. [228] state that the SOFC stack corresponds to
roughly 39% of the total system costs. If this figure is used as an indicator of
the SOFC capital cost from Wei et al. [229], the price would stand at 2,730-3,120
$/kW.
Siefert and Litster [230] suggest a stack cost of $1700 per m2 of active area and
indicate this would correspond to a capital cost of just 494 $/kW. This is
significantly lower than any other figure discussed in literature and, thus,
provokes questions over its reliability. MosayebNezhad et al. [54] discuss a
number of SOFC capital cost scenarios dependent on the influence of the
number of units manufactured by the company (i.e. economies of scale) based
on findings by Ammerman et al. [231]. MosayebNezhad et al. [54] suggest that
with the manufacture of 500 units per year, a 50 kW SOFC capital cost would
be 5,656 €/kW. Whereas, at a manufacture rate of 5,000 units per year the
CAPEX would be 2,326 €/kW. Furthermore, articles by Arsalis [232], Cheddie
[233] and Naja et al [234] utilise Equation 2-28 to calculate the CAPEX for SOFC:
𝐶𝑆𝑂𝐹𝐶 = 𝐴𝑆𝑂𝐹𝐶 (2.96𝑇𝑆𝑂𝐹𝐶 − 1907) 2-28
where, CSOFC is the capital cost ($), ASOFC is the cell area (m3) TSOFC is the fuel cell’s
operating temperature (K). However, the source of this calculation has either
been incorrectly referenced or omitted. Furthermore, the study by Arsalis
[232] is over a decade in age. As such, a question hangs over its reliability as an
effective method of estimating capital costs.

54
2.8.2 Molten Carbonate Fuel Cell
The electrolyte of MCFCs consist of a molten mix of carbonate salts, operating
at roughly 650°C, they enable the transport of carbonate ions from the cathode
to the anode [56,222]. Figure 2-8 illustrates the operation of an MCFC. On the
cathode side, air is continuously fed alongside carbon dioxide. Oxygen reacts
with carbon dioxide and incoming electrons Equation 2-29. The carbonate ion
generated (CO32-), transports through the electrolyte and is used as the oxidant
for the electrochemical reaction with hydrogen Equation 2-30.
1
2O2 + CO2 + 2𝑒− ↔ CO3
2− 2-29
H2 + CO32− ↔ H2O + CO2 + 2e− 2-30
The electrons produced in Equation 2-30 enter an external circuit, producing
electrical power before flowing back to the cathode for Equation 2-29. It is
general practice that CO2 required at the cathode is sourced from the CO2
generated on the anode side [56]. However, combusted gases from the anode
or an alternate source altogether, may be used.
Figure 2-8. General operation of MCFC

55
Like SOFCs, MCFCs also have the capability of direct internal reforming due to
the high temperatures used. They are also a more mature technology and
stacks have been developed with greater power output than SOFC to date, as
illustrated in Figure 2-9. For example Fuel Cell Energy Inc. based in Danbury,
Connecticut have developed stacks rated at 2800 kW [235]. However, although
competitive, they do not reach the electrical efficiency potential of SOFCs, as
illustrated in Figure 2-9. This of significance in respect to applications where
there is an electrical deficit. Furthermore, in an assessment carried out by
Gabrielli et al. [236], it was found that the total annual costs for SOFCs was 60%
that of MCFCs.
Figure 2-9. Comparison of performance between SOFCs, MCFCs, internal combustion engines (ICE) and micro-gas turbines (µGT). Taken from Lanzini et al. [237].
2.9 UK Renewables Incentives
If renewable technology is to penetrate the energy market in a capacity that
will facilitate the achievement of GHG emission targets, financial incentives are
absolutely essential. The UK and global economy is almost entirely reliant on a
well-established fossil fuel-based infrastructure. As such, fledgling renewable

56
technology are often uncompetitive without incentive schemes to boost their
investment potential. The UK has implemented a range of incentives schemes
for renewable energy suppliers (RES) that are currently in an unquestionable
state of flux.
2.9.1 Non-Domestic Renewables Obligation
The Renewables Obligation (RO) began in 2002 and has since been one of the
key support mechanisms for UK renewable electricity generators (RES-E)
[238]. Renewable Obligation Certificates (ROCs) are issued to providers that
are able to substantiate the generation of green electricity. These certificates
can then be traded at a premium price to RES-Es that are not meeting their
renewable requirements. ROC’s were first distributed per MWh but are now
weighted depending on the technology-type’s market readiness level [239]. For
example, biogas-fuelled power production at wastewater treatment plants
have received 0.5 ROCs per MWh since 2013. In contrast, advanced gasification
technology sourced power has received between 1.8-2 ROCs per MWh in the
same time period. This is because anaerobic digestion at WWTPs is a relatively
mature practice that requires far less support to achieve market
competitiveness. Conversely, advanced gasification technology with higher
capital investment costs and limited applications needs a higher grade of
support.
However, in July 2011, it was announced that the RO would close to new
generators from 31 March 2017. The price of an ROC is determined via supply
and demand forcings. For variable supply renewables, such as wind and solar,
the uncertainty that this brought is thought to have affected the potential
uptake of renewables [238,240]. For example, when renewable supply is high,
income from both grid sales and ROC may lower. This uncertainty experienced
under RO has led to the development of Contracts for Difference for a
fundamental overhaul of RO.

57
2.9.2 Feed in Tariffs
In 2010 the Feed in Tariff (FiT) scheme was introduced for small scale <5 MW
for wind, hydro and AD structures and microgenerators <2kW. The system
provides a fix payment per unit of renewable electricity generation, adjusted
for inflation which removed some of the uncertainty hindering small
generators under the RO. However, FiT will be closed to new applicants from
the 1st April 2019 [241]. The government claim that installation costs for small-
scale RES-Es have been brought down enough via existing incentive schemes
that will allow for continuing investment [242]. It is questionable whether the
legitimacy of this hypothesis will stand the test of time.
2.9.3 Contracts for Difference
The Contracts for Difference (CfD) scheme was first proposed in 2011 under
the Electricity Market Reform (EMR) which also announced the closing of the
RO [243]. Figure 2-10 illustrates how the CfDsoperate and why they have been
proposed as a replacement of RO. The strike price is contractually determined
and represents the total income that will be provided by generating renewable
electricity. The government will pay the difference between revenue generated
from export to the grid and the contracted strike price. Figure 2-10 also
demonstrates that if the market value of electricity overtakes the strike price,
the operators will be obliged to pay the difference back to the government. By
setting a constant value for the electricity generated, much of the market
uncertainty experienced under the RO has been taken away. It is thought,
investors will be far more willing to invest if clear calculations for income can
be determined.

58
Figure 2-10. Operation of CfD renewables incentive scheme sourced from [243].
CfDs are distributed in allocation rounds (auctions), the first of which was held
in 2015. The contracts are issued by a subsidiary private company to the
government (The Low Carbon Contracts Company) and set the allocated strike
price depending on technology type and market readiness. There are set
‘Admin prices’ which are pre-determined strike-price ceilings that can be
allocated. However, these are often not met. For example, in the first auction an
Admin price of £140 per MWh was set for advanced conversion technologies
(ACTs), yet the highest allocated strike price was £119.89 [244]. Only time will
tell of the CfD scheme can overcome some of the uptake shortfalls experienced
under the RO.
2.9.4 Non-Domestic Renewable Heat Incentive
The non-domestic renewable heat incentive (RHI) was launched in 2011 to aid
increasing the UK’s share of renewable heat from 1% in 2010 to 12% by 2020
under its National Renewable Energy Action Plan [245]. The RHI operates in a
similar fashion to the FiT, in that a fixed payment is made to renewable heat
generators for each kWhth produced. RHI payments are also banded depending
on scale and technology type, as shown in Table 2-4.

59
Table 2-4. RHI tariff rates as of 1 January 2019 [246] Tariff Name Sizes Tariff
(p kWhth-1)
Small commercial biomass <200 kWth (Tier 1) 3.05
<200 kWth (Tier 2) 2.14
Medium commercial biomass 200 – 1000 kWth (Tier 1) 3.05
200 – 1000 kWth (Tier 2) 2.14
Large commercial biomass >1 MWth (Tier 1) 3.05
>1 MWth (Tier 2) 2.14
Solid biomass CHP systems All 4.42
Water/Ground-source heat pumps All (Tier 1) 9.36
All (Tier 2) 2.79
Air-source heat pumps All 2.69
Deep geothermal All 5.38
All solar collectors <200 kWth 10.75
Biomethane injection On the first 40,000 MWh 4.78
Next 40,000 MWh 2.8
Remaining MWh 2.16
Small biogas combustion <200 kWth 4.64
Medium biogas combustion 200 – 600 kWth 3.64
Large biogas combustion >600 kWth 1.16
2.10 Concluding remarks
The literature review performed in this chapter has discussed the
fundamentals and current status of key research topics investigated
throughout the thesis. An assessment of standard wastewater treatment
practices uncovered the substantial use of energy required for biological
conversion of ammonia to nitrogen gas and the associated generation of the
potent greenhouse gas, N2O. Digestate liquor was revealed as a significant
contributor of nitrogen to the wastewater treatment system and current
practices for ammonia recovery from digestate liquor were evaluated.
Opportunities for H2 production at wastewater treatment plants were
examined with particular focus on catalytic processes such as
biogas/biomethane steam reforming and ammonia decomposition. A review of

60
thermodynamic conditions and catalyst options concluded that nickel-based
catalysts at high temperatures could be used to achieve H2 production from
both ammonia decomposition and steam reforming. However, examples in the
literature of investigation into this form of co-reforming was limited.
Fuel cells that can produce heat and power were also explored. The study found
that both solid oxide fuel cells (SOFCs) and molten carbonate fuel cells (MCFCs)
were capable of internally reforming ammonia and methane whilst generating
heat and power. However, it was found that SOFCs were capable of greater
electrical efficiencies and have considerably lower operational costs than
MCFCs. The literature indicated there has been some prior interest by WWTPs
for on-site use of SOFCs but there is certainly a gap to fill analysing the use of
both bio-methane and ammonia as fuel cell hydrogen carriers.
In addition to the aforementioned findings, the literature review presented in
this chapter has highlighted the novelty of the investigations carried out in the
following chapters. It can also be used as a toolbox for the overall
understanding of the work and validating results with comparisons and
verification. As such, several studies discussed here will be referenced
throughout to highlight this thesis’ position amongst existing literature.

61
3 Wastewater Treatment Plant Assessment
3.1 Introduction
Samples from different stages of the treatment process at Esholt WWTP in
Yorkshire have been taken and analysed to generate a material flow diagram of
the process. Determining and analysing component mass flows is crucial as
GHG emissions and energy demand for different processes cannot be directly
measured from the treatment facility. By producing a robust material flow
dataset, the impacts of nitrogenous-waste diversion on GHG emissions and
energy use can be interpreted. The compositional and volume flow of digestate
liquor will also be used as inputs for ammonia recovery process modelling in
chapters 4, 5 and 6. The material flow can also be used for future work,
highlighting key streams for nutrient and/or energy recovery.
3.2 Process Description
Esholt WWTP, located in West Yorkshire, between the cities of Leeds and
Bradford, serves a population equivalent to roughly 750,000 people. Operated
by Yorkshire Water, it is the second largest of their treatment facilities. The
process design is displayed in Figure 3-1. The process begins with initial
screening of coarse and fine particles followed by a grit chamber. Duplicate

62
Archimidean screw generators then recover some power before primary
clarification. The primary clarifiers consist of circular settlement tanks which
allow solid material contained in the wastewater to fall with gravity and
rotating arms scrape and remove the sediment. Colloquially termed ‘primary’
sludge, this material is sent for preparation for anaerobic digestion.
The clarified liquid from primary settlement is sent to the activated sludge
process (ASP). Which consists of 12 aeration lanes, 7500 m3 each and
representing U-shaped plug flow reactors with diffused aeration. Oxic and
anoxic zones allow sequential nitrification/denitrification alongside chemical
oxygen demand (COD) and biological (BOD) destruction. The second part of the
ASP consists of final clarification tanks, of the same description and operation
as their primary counterparts. These prepare water for release into a nearby
watercourse. The solid outlet of the final clarifiers (secondary sludge) is split in
two. The sludge still contains useful bacteria required in the ASP. Thus, one
stream returns to the beginning of the ASP and the second is prepared for AD
along with the primary sludge.
Figure 3-1. Process flow of Esholt WWTP
A thickening step is used to increase the concentration of carbonaceous
material of the feedstock. This is followed by thermal hydrolysis, using a Veolia
Biothelys® design, which pre-treats the sludge prior to AD. Utilising increases

63
in temperature and pressure, a significant amount of volatile suspended solids
are dissolved, thus, boosting the feedstock’s digestibility [87,247]. Four
mesophilic digesters process this treated sludge with a retention time of 15
days, producing biogas and digestate. The biogas is used in four gas engines
which provide heat and power for the site.
3.3 Wastewater Characterisation & Mass Balance
Methodology
3.3.1 Sampling
Samples were taken monthly, along with other members of the BioResource
Systems Research Group at the University of Leeds, from seven parts of the
wastewater treatment process: the raw wastewater inlet, the primary clarifier,
the activated sludge inlet, the activated sludge outlet, the anaerobic digester
and the final effluent outlet. The samples were collected using a bucket on a
rope and placed in clean sealed storage containers. The bucket collector was
cleaned using acid wash and rinsed with distilled water after each collection to
ensure no contamination.
3.3.2 Sample Preparation
Each sample was separated into three clean 500ml containers. 0.4 ml and 1 ml
of concentrated H2SO4 were added to two of the three containers to make 0.8
ml l-1 and 2 ml l-1 solutions. The acid was added to ensure preservation of the
samples and prevent the volatilisation of ammonia. Two 200 ml of untreated
sample and one 200 ml of each treated sample were centrifuged to remove the
majority of suspended solids. Two 50 ml of 0.8 ml l-1 and one 50 ml of 2 ml l-1
sample were filtered through 9 cm GF/C filter paper for total solids removal.

64
3.3.3 Total Kjeldahl nitrogen (TKN) and total ammoniacal
nitrogen (TAN)
Total Kjeldahl nitrogen (TKN) is the summation of inorganic nitrogen
contained in ammonia and ammonium, along with nitrogen found in organic
compounds. Total ammoniacal nitrogen (TAN) is the measure of the nitrogen
present in ammonia in both its ionic and neutral state. Standard test 4500 C
and 4500 B were used for determination of TKN and TAN respectively [248].
The procedure for both analyses is the same except total ammonia
determination uses filtered samples.
The procedure begins with digestion, where all nitrogen containing
compounds are broken down using sulphuric acid to liberate the nitrogen as
ammonium sulphate ((NH4)2SO4). Pre-determined sample sizes, as displayed in
Table 3-1, were used depending on the expected concentration of nitrogen and
only samples pre-treated with 0.8 ml l-1 sulphuric acid were used.
Table 3-1. Required sample size for TKN and TAN determination
Sample Location TKN analysis
sample size (ml) TAN analysis
sample size (ml) Raw WW 25 50 Primary Settlement 50 50 Activated Sludge Inlet 25 50 Activated Sludge Outlet 10 50 Secondary Clarifier 50 50 Digestate 1 50 Digestate Liquor 1 1 Final Effluent 50 50
Each sample was placed in digestion tubes and topped up to 50ml with distilled
water, where necessary. A control was also used with 50ml of distilled water.
Glass beads, a copper catalyst and 10 ml of concentrated sulphuric acid were
then added to each digestion tube. The samples were allowed to digest on a
digestion rack at high temperature with a scrubber unit in place. After full
digestion of samples had occurred and allowed to cool, distillation could begin.

65
The distillation was carried out using a Buchi (Switzerland) Distiller, where the
concentrated acid mixture from the digestion step was diluted and NaOH added
to make a strongly alkaline solution, which liberates ammonia (NH3) as follows:
(NH4)2SO4 + 2NaOH → 2NH3 + Na2SO4 + 2H2O 3-1
The ammonia was fed to a duran bottle containing 50ml of boric acid indicating
solution. After distillation is complete the receiving arm contains an
ammonium-borate complex (NH4+:H2BO3-) which is ready for titration.
10mM sulphuric acid was used to neutralise the ammonium borate complex via
reaction 3-2-3-2:
2NH4H2BO3- + H2SO4 → (NH4)2SO4 + 2H3BO3 3-2
The reaction facilitates a colour change from blue to lavender. The volume of
titrant used when the colour change occurs was recorded. The concentration of
TKN was calculated via equation 3-3:
TKN (mg 𝑙−1) =(A−B) ×280
V 3-3
Where A is titrant volume for sample, B is titrant volume for control and V is
volume of sample used.
3.3.4 Chemical Oxygen Demand (COD)
Standard test 5220 D was used to determine chemical oxygen demand (COD)
[248]. Samples were first diluted using distilled water by the quantities shown
in Table 3-2, dependent on the expected quantity of COD. 2.5ml of sample (in
duplicate) and a blank of distilled water were added to digestion tubes
containing 1.5ml digestion reagent (potassium dichromate solution), followed

66
by 3.5ml of catalyst reagent (sulphuric acid). The samples were left to digest
for two hours at 160 oC before being ready for titration.
Table 3-2. Required sample dilution fraction for COD determination
Sample Location Dilution fraction Raw WW 1/100 Primary Settlement 1 Activated Sludge Inlet 1/10 Activated Sludge Outlet 1/100 Secondary Clarifier 1 Digestate 1/1000 Digestate Liquor 1/1000 Final Effluent 1
An undigested reference blank was formulated in a conical flask by adding
1.5ml COD digestion reagent, 15ml distilled water and 3.5 ml COD catalyst
reagent. Two drops of ferroin indicator were added and titrated using Ferrous
Ammonium Sulphate (FAS) solution. Samples were then transferred to conical
flasks, two drop of ferroin indicator added to each and titrated with FAS
solution. COD concentration were then calculated using equation 3-4.
COD = (𝐵−𝑆)
𝑇 × 𝐷 × 1000 3-4
Where B=Titre of blank (ml), S=Titre of sample (ml), T=Titre of undigested
blank (ml), D=Dilution factor.
3.3.5 Total suspend solids (TSS) and volatile suspended solids
(VSS)
TSS and VSS were determined by standard tests 2540 B and 2540 E
respectively [248]. 20 ml of untreated, unfiltered samples were filtered in
duplicate through a 9 cm GF/C filter paper with 1.2 µm pores. Each filter paper
used was previously weighed to enable before and after calculations. Vacuum

67
apparatus was used to allow filtration of entire sample. After drying in a
desiccator, the filter papers were weighed again and TSS calculated via
equation 3-5.
TSS (mg 𝑙−1) = −dried wt.(mg)– initial wt.(mg)
volume used (ml)× 1000 3-5
For VSS analysis, the filter papers from the above TSS methodology were placed
in a muffle oven for 1 hour at 550 °C. The samples were then weighed and the
difference in weight from the TSS weight was used as the weight of VSS present
in the sample.
3.3.6 Total phosphorus (TP) and phosphate determination
(PO4)
Standard test 4500 P was used for TP and PO4 determination. For total
phosphorus, a digestion step was first necessary to convert all phosphorus to
phosphates. Unfiltered samples treated with 2 ml sulphuric acid were used at
the quantities displayed in Table 3-3.
Table 3-3. Required sample size for TP determination
Sample Location Dilution fraction Raw WW 1/100 Primary Settlement 1 Activated Sludge Inlet 1/10 Activated Sludge Outlet 1/100 Secondary Clarifier 1 Digestate 1/1000 Digestate Liquor 1/1000 Final Effluent 1
The samples were topped up to 25 ml, where necessary, with distilled water
and added to conical flasks containing 0.4 g ammonium persulphate. 1 drop of
phenolphthalein indicator, followed by 1 ml 5.6M sulphuric acid were also
added. The conical flasks were then placed on a hot plate until a final volume of
approximately 10 ml was reached.

68
Total phosphorus levels could then be measured via spectrophotometry.
Digested samples were added to Nessler tubes and topped up to 50 ml with
distilled water. 8 ml of combined reagent (containing sulphuric acid, potassium
antimonyl tartrate solution, ammonium molybdate solution and ascorbic acid
solution) was added to each Nessler tube. The spectrophotometer was set to a
wavelength of 880 nm and the spectrophotometer was zeroed with a control
solution of distilled water before the absorbance of each sample was recorded.
A calibration curve was created by forming a series of standard phosphate
solutions at a series of concentrations ranging from 0-1.25 mg of P per litre
using standard phosphate solution and distilled water. The absorbance of each
concentration was recorded from the spectrophotometer and used to plot a
calibration curve. The total phosphorus concentrations from the samples were
then calculated via equation 3-6:
TP (mg l-1) = Pgraph measurement (mg l-1) ×50
𝑠𝑎𝑚𝑝𝑙𝑒 𝑠𝑖𝑧𝑒 (𝑚𝑙) 3-6
Phosphate concentration was determined via the same technique, using
filtered samples and without the digestion step.
3.3.7 Interpretation of Mass flow
Internal flow data from Esholt WWTP is unavailable. As such, a steady-state
mass and volume flow diagram has been made via a combination of methods.
Esholt WWTP takes sewage from an equivalent 750,000 people [249]. The
average person in the UK generates 140 litres of wastewater per day, providing
an indication of the total incoming flow to the plant.
The internal flow rates of the plant have been interpreted using data from
[250], that modelled a plant of similar size (500,000 population served) and
also employs a modified Ludzack-Ettinger process set up for nutrient removal
in the ASP. Using estimated internal flow rates, the mass flow of individual

69
components could be created using characterisation data carried acquired in
the laboratory.
3.4 Results
3.4.1 Characterisation
The characterisation results are based on data recorded between October 2014
and May 2016. They consist of a combination of first-hand results and data
acquired by other members of the BioResource Systems Research Group at the
University of Leeds. The mean of each parameter from each sample point has
been calculated and displayed in Table 3-4. The raw data, of which, can be
found in Appendix A, Table A 1(a-f).
Table 3-4. Average results for each parameter at each sample point from Esholt WWTP in mg l-1 with standard deviation in brackets
TSS VSS COD TP PO4 TKN TAN
Raw 322
(130) 264
(112) 788
(381) 6.1
(2.3) 4.2
(1.8) 44.9
(15.6) 24.2 (9.5)
Primary Clarifier
100 (37)
81 (28)
277 (125)
2.0 (1.2)
1.4 (0.7)
27.5 (10.4)
16.2 (8.7)
ASP Inlet 578
(142) 461
(116) 1289
(1164) 10.3 (3.5)
5.3 (3.1)
62.4 (20.6)
20.7 (9.9)
ASP Outlet 3838 (398)
2919 (288)
4281 (2101)
46.6 (25.9)
12.7 (6.3)
251.7 (60.6)
3.4 (2.7)
Secondary Clarifier
36 (28)
28 (17)
54 (26)
0.2 (0.1)
0.1 (0.1)
3.3 (1.4)
1.1 (0.6)
Digestate 38781
(15149) 22412 (9480)
4713 (29609)
289.5 (201)
18.2 (15.8)
3155.4 (710)
1502.1 (262)
Digestate Liquor
349 (137)
303 (104)
3796 (2830)
24.0 (16.2)
18.2 (15.8)
1598.2 (207)
1502.1 (262)
Final Effluent
37 (26)
28 (18)
52 (23)
1.2 (1.2)
1.2 (1.1)
3.0 (1.9)
1.3 (1.1)

70
3.4.1.1 TSS and VSS
Table 3-4 shows how the treatment facility’s operation alters the concentration
of solids and volatile solids between operational units. The primary settlement
tanks remove over 2/3 of TSS and VSS from the raw wastewater, all of which
can be used as feedstock for anaerobic digestion. The concentration of solids
increases before entrance to the ASP, with recycling of activated sludge. The
solids concentration increases again in the ASP with the pronounced growth of
bacteria used to remove COD, phosphorus and nitrogenous compounds. This
sludge easily settles in the secondary clarifiers for a final TSS discharge of just
37 mg l-1. The fraction of volatiles within the solids does not alter considerably,
falling from 82 % in the plant inlet to just 76 % in its outlet. The digestate holds
the greatest concentration of solids which is to be expected after the sludge
thickening step which precedes AD. The whole digestate holds the smallest
ratio of VSS:TSS because of the utilisation of volatile solids by anaerobic
bacteria for the production of biogas. Coefficients of variance, measured as the
ratio of the standard deviation to the mean, range between 10 % (activated
sludge outlet) and 79 % (secondary settlement outlet) with an average of 43%.
This indicates the dynamic nature of solid concentrations within the WWTP.
3.4.1.2 COD
Table 3-4 also highlights the fate of COD at the treatment facility; transforming
from a mean initial concentration of 788 mg l-1 to just 52 mg l-1. As with the
solids, much of the COD is diverted before the ASP via the primary clarification
step. The COD concentration increases with the growth of bacteria in the
activated sludge tanks but are almost entirely removed during the secondary
clarification stage, demonstrating the effectiveness of the ASP in removing COD
from the wastewater. However, the digestate retains a considerable amount of
COD, much of which remains in the solid (cake fraction). The average coefficient
of variance for COD at each sample location was greater than TSS at 58%, again
demonstrating the dynamic nature of wastewater treatment.

71
3.4.1.3 TP and PO4
The inflow of phosphorus to the treatment facility is considerably smaller than
any other components analysed, at a phosphorus concentration of just 6.1 mg
l-1. The proportion of phosphate-P is much lower in the activated sludge outlet,
which changes from 51% at inlet to 27% after ASP. This shows the effect of
biological P removal in the ASP via bacterial assimilation of the phosphate. The
phosphorus concentration peaks in the whole digestate at 289.5 mg l -1. 92% of
this phosphorus is contained in the solid fraction highlighting one of the
reasons the cake is far more marketable than the liquor. Phosphorus recovery
from digestate liquor is often promoted as an effective way to help close the
phosphorus nutrient cycle with its numerous sinks but finite sources. However,
at such small concentrations (24 mg l-1), its applicability at Esholt WWTP may
be limited.
3.4.1.4 TKN and NH3
Table 3-4 also illustrates the effectiveness of the ASP at converting ammonium
from the wastewater. The concentration of ammoniacal nitrogen transforms
from 20.7 to 3.4 mg l-1. The increase in TKN during ASP is due to the
accumulation of bacteria. Nitrogen concentrations peak in the whole digestate
with a TKN concentration of 3155 mg l-1. Almost 50% of this nitrogen is
retained as ammonium in the digestate liquor at a concentration of 1502 mg l-
1. The comparative potency of ammonium in this stream makes it the most
applicable of all streams from an ammonia recovery perspective. Thus, an
understanding of the volume flow of digestate liquor at Esholt WWTP is
required for feasibility and impact analysis of the potential technology
introduction.
3.4.2 Mass Flows
Before a mass flow diagram can be produced for the key species characterised
in section 3.4.1, analysis of the plant flow rates must be carried out. The facility

72
does not measure internal (unit to unit) flow rates. However, incoming flow
rates have been sourced via personal communications [251,252].
Figure 3-2. Incoming flow data for Esholt WWTP over a 2.5 day period in September 2016
Figure 3-2 perfectly illustrates the nominal incoming flow-rates to Esholt
WWTP over 2.5 days. The graph indicates the temporal nature of human daily
activities. Flow rate steadily increases during the morning when discharge
from showers and other morning activities slowly make it to the treatment
facility. The flow-rate tends to drop slowly in the afternoon before experiencing
another peak in the evening due to the influence of meal-time and night time
preparations. The daily flow rate variations between roughly 600 and 1600
litres per second remain fairly consistent day-to-day. This demonstrates that
these data corresponds to a relatively dry-period, where the impact of rain has
very little influence on the incoming flow of sewage to the WWTP. The influence
of precipitation on plant flow is more starkly highlighted in Figure 3-3:
Flow
ra
te (
l s-1
)
Time

73
Figure 3-3. Incoming flow data for Esholt WWTP over 8 day period in August 2016.
The first four days in Figure 3-3 show very similar flow-rate patterns to that
displayed in Figure 3-2; with daily variations between 600 and 1400 litres per
second. However, on the morning of day 4, rain has clearly hit the local area,
causing a dramatic increase in the flow of wastewater to the facility to a peak
of almost 3,500 l per second. This shows the dramatic impact that weather has
on incoming flows and describes, in part, the variations in concentrations of
key species described in section 3.4.1.
The variation also makes it difficult to predict a mean flow rate to be used for
steady-state modelling. Esholt WWTP serves a population equivalent to
roughly 750,000 people that have been assumed to generate 140 litres of
sewage per capita per day. Thus, inferring a plant inflow rate of 105,000 m3
sewage per day or 1,215 l per second. This corresponds fairly well with real
flow data, illustrated in Figure 3-2 and Figure 3-3; lying between all daily peaks
and troughs.
The results from stream characterisation have been extrapolated to generate a
material flow diagram, displayed in Figure 3-4. The internal flow rates shown
in Figure 3-4 have been inferred from Minnini et al. [250] as a fraction of the
incoming flow rate as follows:
Flow
ra
te (
l s-1
)
Time

74
Primary settlement outlet - 1.009
ASP inlet - 1..012
ASP outlet - 1.018
Final Effluent - 0.999
Whole Digestate - 0.007
Digestate Liquor - 0.006
Figure 3-4 details the estimated average flow of digestate liquor at Esholt
WWTP at 661 m3 per day containing an ammonia flow of 993 kg per day. These
figures have been used as inputs for process models included in Chapters 4, 5
and 6. The diagram also details that the facility destroys 4,399 kg or 79% of
TKN each day. This indicates that the ASP-based biological nitrogen removal is
effective in meeting the Water Framework Directive’s 75% target [16]. Figure
3-4 also shows an interesting unknown liquor flow from the sludge thickening
step. It can be stipulated that this stream contains a considerable flow of
ammoniacal nitrogen. As such, it is suggested that future work should evaluate
its composition and potential use as a secondary feedstock for ammonia
recovery.

75
3.4.2.1 Material flow validation
As discussed, the volume flow to the WWTP is far from constant. As such, the
validity of the predicted material flow diagram has been assessed via
comparison with external data. For example, a characterisation of waste
activated sludge (WAS), used as the AD feedstock at Esholt WWTP and a stream
Fig
ure
3-4
. Ma
teri
al c
on
cen
trat
ion
an
d f
low
dia
gram
fo
r E
sho
lt W
WT
P
Pri
mar
y
Cla
rifi
er
ASP
F
inal
C
lari
fier
Slu
dge
T
hic
ken
AD
D
iges
tate
Se
par
atio
n

76
that cannot ordinarily be sampled, was carried out by Dr Ramirez Sosa at the
university of Leeds [253]. Dr. Ramirez Sosa calculated the WAS to contain 81 g
l-1 of total solids and that total volatile solids (TVS) were 72% of that. As such,
the total flow of volatile solids into the AD at Esholt would be 44,210 kg day -1
(see section 3.4.3). Dr Ramirez Sosa also calculated the bio-methane potential
to be 0.224 LCH4 g-1 TVS for the WAS. It has been determined that the facility
produces 8,235 kgCH4 day-1, meaning the destruction of 26.36 tonnes of TVS day-
1. Thus, subtracting the total destroyed TVS by the estimated starting amount,
it is predicted that there should be 17.8 tonnes of TVS remaining in the
digestate post-AD. This total is just 5% larger than this work’s projected figure,
shown in Figure 3-4.
Similarly, Yorkshire Water have confirmed they process around 30,000 tonnes
of dry solids per year in their thermal hydrolysis plant each year [254]. Thermal
hydrolysis is expected to reduce total solids by 25% [255], meaning the outlet
flow of solids from the thermal hydrolysis would be 22,500 tonnes per year.
This corresponds well with the predicted AD inlet of 22,300 TS per year
calculated via extrapolation from [253]. Thus, it is suggested that figures from
the predicted mass flow and volume flow diagram can be used with a strong
degree of confidence.
3.4.3 Current Esholt energy inventory
In personal communications, information was received that the average daily
plant consumption is roughly 60 MWh day-1 and electrical power production is
roughly 40 MWh per day [256]. These figures correspond with OFGEM data
[257], as shown in Table 3-5. The electricity generation between December
2013-March 2018 resulted in a monthly average of 1153 MWh and a daily
average of 38.4 MWh. Figures where the capacity factor is under 10% have
been excluded as these can mostly be attributed to ‘teething’ issues with the
implementation of the sludge hydrothermal treatment process. Methane
production was reverse calculated from the projected energy production of 40
MWh day-1 at the facility. With a CH4 LHV of 50 MJ kg-1 and an estimated 35%

77
electrical efficiency of the internal combustion-based CHP units used at Esholt,
the calculated daily generation of biomethane would stand at 8,235 kg.
Table 3-5 Ofgem data for electricity production at Esholt WWTWs between December 2013-March 2018 [257]. (Data excluded where capacity factor is <10%)
Month Generation (MWh)
Month Generation (MWh)
Dec-13 1073 Aug-15 523
Jan-14 1025 Sep-15 857
Feb-14 1095 Oct-15 1084
Mar-14 1423 Dec-15 556
Apr-14 1456 Nov-16 654
May-14 1570 Dec-16 982
Jun-14 1172 Jan-17 960
Jul-14 1451 Feb-17 832
Aug-14 1347 Mar-17 1164
Oct-14 1783 Apr-17 1074
Nov-14 930 May-17 1496
Dec-14 1317 Jun-17 723
Jan-15 581 Jul-17 1385
Feb-15 1111 Aug-17 1356
Mar-15 1280 Oct-17 1701
Apr-15 1700 Nov-17 1288
May-15 1335 Dec-17 1429
Jun-15 596 Jan-18 1547
Jul-15 559 Mar-18 1388
Monthly Mean
1152.7
The energy consumption is far more difficult to predict, for there are so many
contributing factors. Electrical consumption can range from approximately
0.26-0.84 kWh m-3 [258]. For Esholt, that would equate to somewhere between
27.3 MWh day-1 and 88.2 MWh day-1. Similarly, the destruction of nitrogen in
the plant can be calculated via the TN out of the primary clarifiers plus the flow
nitrogen in the digestate liquor minus the outflow of nitrogen in the final
effluent. The associated energy use to remove nitrogen in the ASP according to

78
[57] is 4.57 kWh kg-1 of oxidised nitrogen. This would equate to 16.8 MWh day-
1, which, if on average is 27% of a plant’s energy as described in [57], would
make the total plant consumption 62.2 MWh. For these reasons, the figures
communicated by Gavin Baker of a plant energy production 40 MWh and
consumption of 60 MWh have been accepted [256].
3.4.4 Current Esholt GHG inventory
There are three main gases that contribute to a wastewater treatment facilities
greenhouse gases (GHG) footprint. They include nitrous oxide (N2O), methane
(CH4) and carbon dioxide (CO2). N2O is mostly emitted during activated sludge
processing and Parravicini et al. [259] built a regression model estimating N2O
emissions based on the % removal of TN during treatment Equation 3-7.
y = -0.049x + 4.553 3-7
Where x is the % removal of TN which has been calculated as the incoming flow
of TN minus the TN contained in the final effluent and solid digestate. This
amounts a removal efficiency of 68.4%. Using 3-7, this assigns an emission
factor of 0.012 kg N2O N/ kg TNinfluent; equivalent to 56.5 kg N2O per day for
Esholt WWTP.
Methane emissions occur all over the treatment facility but are significantly
increased when anaerobic digestion of sludge is employed at the treatment
facility. Like nitrous oxide emissions, estimating the extent of methane
emissions is difficult due to plant-to-plant variability. A commonly used
conversion factor is 0.87% of incoming COD to the plant as presented in
Daelman et al. [260]. This figure will be used for consistency with N2O emission
calculations, as Parravicini et al. also used it in their study [259]. As such, when
combined with our mass flow provides a figure of 910 kgCH4 day-1 for methane
emissions.
The final key manner in which GHGs are emitted from WWTPs is via lifecycle
emissions from grid electricity use. The emission intensity of UK electricity

79
currently stands at 107 gCO2e/ kWh. Given an average daily use of 20 MWh of
grid electricity, this adds 2,100 kg CO2 to the facility’s GHG footprint. With
GWPs of 298 and 25 times that of CO2 for N2O and CH4 respectively [261],
tallied, the plant’s total emission of GHGS is 41.6 tonnes CO2e per day. The
footprint breakdown has been summarised in Figure 3-5, where N2O
contributes 40.4%, CH4 contributes 54.6% and CO2 contributes 5%.
Figure 3-5. GHG footprint for Esholt WWTP
3.5 Concluding Remarks
Internal stream sampling was carried out at Esholt WWTWs between October
2014 and May 2016. Sample characterisation was performed, recording the
streams’ TSS, VSS, COD, TKN, TAN, TP and PO4 levels. From characterisation
data a steady-state internal mass flow diagram of the treatment facility was
generated and validated using a number of methods.
Plant energy production and consumption has been calculated from OFGEM
data, mass flow calculations and discussions with plant technicians. It shows
that Esholt is able to generate 2/3 of the electricity it consumes. Thus, requires
Nitrous oxide Methane Carbon dioxide

80
on average 20 MWh of grid electricity each day. From the energy production
figures, biomethane generation has been inferred at 8,235 kg per day.
Emission of greenhouse gases, nitrous oxide, methane and carbon dioxide have
been estimated using the mass flow of various species in the facility. Thus, the
impact of any changes in GHG emissions caused by the diversion of ammonia
on the facility’s overall greenhouse gas footprint can be deduced.
Mass flow of ammonia from digestate will be used for ammonia recovery
process modelling in the following three chapters. Meanwhile, biomethane
flow will be utilised in the solid oxide fuel cell and H2 production processes
models (Chapters 5 and 6).

81
4 Ammonia Recovery
4.1 Introduction
This chapter focusses on the use of Aspen Plus v8.8 software [262] to design a
process that strips ammonia from digestate liquor and recovers it in a way that
it is ready for use in a hydrogen production system or direct input alongside
biomethane in a SOFC. A range of sensitivity analysis has been carried out in
order to optimise the system energetically and provide the versatility required
for transfer to the adjoined models of hydrogen generation by steam reforming
(SR) and combined heat and power generation via solid oxide fuel cell (SOFC).
Work has also been carried out to calculate the requirements to adjust the pH
of the liquor to an appropriate stripping level. An economic model has been
developed which costs the equipment and determines the financial value of
ammonia required in order for the system to be worthwhile.
Examples of process modelling the recovery of ammonia from waste streams
in Aspen Plus are limited. Errico et al. [21] simulated recovery of ammonia from
digestate liquor, which was present at a concentration of 0.224 mol L -1 or 4.04
g l-1. A flash drum was simulated to remove CO2 from the system before NaOH
was added to convert all ammonium to ammonia. An air stripper was used to
desorb the ammonia. This preceded an absorption column with a sulphuric acid
solvent to re-absorb the ammonia and generate a product of ammonium
sulfate. Errico et al. [21] were able to recover over 95% of the initial ammonia
concentration, using an air to liquid mass ratio of 0.28, a pH adjustment to 9

82
and stripping gas at 90 °C. They also found that the plant would be working in
profit after 6 years of operation.
Boul et al. [263] also simulated an ammonia stripper in Aspen plus. However,
the application was to produce clean water on the moon’s surface from human
urine. The stripper was preceded by a distillation column which volatilised
other volatile organic compounds alongside ammonia. Thedistillate stream,
which also contains water, was sent to the top of an air stripper where all of its
volatiles were removed, generating a flow of pure water from its bottoms. They
achieved 100% ammonia recovery but used an air to liquid mass ratio of 13.6,
which would be extremely costly for a wastewater treatment plant. Thus, it is
hard to draw too many comparisons with this particular piece of literature.
4.2 Process Design
As discussed in Chapter 2, air and steam stripping are the most mature and
preferred techniques in industry for ammonia recovery from digestate liquor
[22,170–172]. As such, comparative modelling has been done to designate the
fundamental stripping technique. Air stripping is ordinarily combined with
substances such as sulphuric or nitric acid to form marketable fertilisers.
However, sulphur is a powerful poison for catalysts used in both hydrogen
production and SOFCs [136]. Furthermore, the purchasing of substances, such
as sulphuric or nitric acid, will only increase operating costs and so have been
omitted. Resultantly, the absorption process in this body of work has been
carried out using just water and is followed by a final recovery method. A flash
separator has first been analysed, the operation of which has been be dictated
by downstream feed molar steam to carbon (S:C) ratios for simulated SMR and
SOFC plants. Secondly, a distillation column has been considered which will
recover ammonia in a far more concentrated form, thus, will not be dictated by
downstream S:C ratios. Again, energetic comparisons will be done so a choice
can be made on the most appropriate method.
Ammonia concentrations found from the digestate liquor characterisation,
carried out in Chapter 3, have been used for input to the model. The pH of liquor

83
carried out in characterisation analysis has been used to determine the
required amount of NaOH to boost pH sufficiently. Meanwhile, the total flow of
liquor has been taken from the mass flow analysis done for Esholt WWTP, as
also shown in Chapter 3. Three assumptions have been utilised throughout the
simulation:
1. Ambient conditions set at 1 bar and 23°C
2. Air composition assumed 79:21 molar split of N2:O2 only
3. Digestate consists of just water and ammonia
A ‘COMMON’ method filter and an ‘NRTL-RK’ base method have been used
throughout. The primary reason this property method has been chosen is that
it is applicable for both stripping settings and hydrocarbon processes [264]. A
short description of these methods and of the function of blocks used in the
simulation can be found in Table 4-1.
The stripper and absorption columns are simulated using Radfrac blocks
without condensers and reboilers. Equilibrium calculations have been specified
over the alternative rate-based option. Due to the difficulty in simulating
packing material, reasonable numbers of stages have been specified. For the
stripper, 20 has been used, as it provides adequate ammonia removal for the
flow of incoming liquor. The absorption column has a far lower total incoming
flow-rate, thus, 10 stages have been specified. A 10% pressure drop has also
been specified in the air stripper, meaning stripping air is compressed to 1.1
bar.
The flash separator has been simulated using a ‘Flash2’ block with ‘Vapor-
Liquid-DirtyWater’ valid phases. A ‘RadFrac’ column has been used to simulate
the distillation column with 15 stages, a ‘Partial-Vapor’ condenser, a ‘Kettle’
reboiler at standard convergence. All heaters and coolers have been simulated
using ‘Heater’ blocks with no pressure drop. All heat exchangers are simulated
using ‘HeatX’ blocks, using the ‘Shortcut’ model fidelity, ‘Design’ calculation
mode and with ‘Countercurrent’ flows.

84
Table 4-1 Aspen Plus blocks and property method descriptions RStoic Reactor block that calculates output composition based on
specified molar conversions of stated reactions
Flash2 Capable of simulating flashes, evaporators, knock-out drums. Calculates thermal and phase conditions for vapour-liquid separation
FSplit Separates material, heat or work streams into two or more according to specified splits. All outlet streams contain the same fractional composition.
Compr Simulates both compressors and turbines. In this work both compressors and turbines have been modelled as isentropic. Performs power consumption or production calculations based on desired pressure outlet.
Pump Models pumps or hydraulic turbines. Designed to handles single-liquid phase inlet streams. Performs power consumption or production calculations based on desired pressure outlet.
HeatX Capable of simulating a variety of heat exchangers. In this work ‘shortcut’ option has been used with counter-current flow. Calculates heat transfer capabilities based on properties of hot and cold side flows.
Heater Capable of simulating heaters and coolers. Calculates thermal and phase conditions for one or more inlet streams under specified conditions (normally temperature and pressure).
RadFrac Capable of modelling all types of multistage vapour-liquid fractionation operations including stripping and absorption
NRTL-RK Property Method
Component properties are based on NRTL activity coefficient model for liquid phase, Redlich-Kwong equation of state for vapour phase, Rackett model for liquid molar volume and Henry’s law for supercritical components
4.2.1 Sensitivity Analysis
Sensitivity analysis was carried out on each of the stripper, absorber and flash
separator. For the stripper, the factors requiring sensitivity analysis were air
flow-rate and temperature. The processused for stripping sensitivity can be
seen in Figure 4-1. The incoming liquor stream, labelled ‘LIQ1’, contains
1528.56 kmol h-1 of water and 2.952 kmol h-1 of ammonia, as dictated by
characterisation analysis of liquor from Esholt WWTP (Chapter 3). It enters the
stripper above stage 1. It is assumed that the liquor has been pre-treated with
NaOH to increase the pH to a state where all ammonia is in its free (NH3) form
and all solids have been removed. The liquor is pre-heated before entering the
stripper via heat exchange with the bottoms outlet of the stripper (labelled

85
BTMS1) in the HX1 heat exchanger. HX1 is designed so that BTMS1 outlet
temperatures is 1°C greater than the LIQ1 inlet temperature. This ensures
maximum heat exchange occurs.
Figure 4-1. Process flow used for stripping sensitivity
Air enters in through stream, ‘BOTAIR1’, and is preheated in the heater block,
‘BT-HEAT’. This hot air stream enters the stripper ‘on-stage’ 20. Air-flow rate
was varied between 200 and 1000 kmol h -1 at 50 kmol h-1 intervals for
sensitivity analysis. Air flow temperatures, set by heater ‘BT-HEAT’, was varied
at 25 °C intervals between 125-800 °C. It should be noted that incoming air
temperatures are not equal to the temperature profile of the stripper. The
liquor enters at a lower temperature and the heat transfer from air to liquor
dictates what temperature the stripper is operating at.
Sensitivity analysis was also carried out for steam stripping. This was done to
compare the energetic demand for steam and air stripping, which allows the
decision whether steam stripping is the more energetically intensive process,
as suggested by literature [172,173]. The analysis was performed using the
same process design showcased in Figure 4-9, where the air in stream BOTAIR1
is replaced by water. Two variables were investigated; the incoming
temperature of steam and its flow rate. Flow rate was varied between 100-300

86
kmol h-1 at 10 kmol h-1 intervals and the temperature (dictated by Heater block
‘BT-HEAT’) was varied between 100-300 °C at 10 °C intervals.
For the absorber, sensitivity analysis was carried out on incoming air and water
flow rate. Temperature contribution analysis was not necessary as literature
analysis informed that solubility of ammonia increases with lower
temperatures, so ambient temperature was utilised. The process flow used for
stripping sensitivity analysis can be found in Figure 4-2. The gaseous exit from
the stripper (STRIPGAS) is fed into a ‘Heater’ block labelled ‘COOLER’ which
cools the stream down to 23°C. ‘COOLER’ also acts as a condenser, condensing
out any water that has vaporised in the stripper. The cool stream (STRIP2) then
enters the bottom of the absorption column; ‘on-stage’ 10.
Figure 4-2. Process flow for absorption sensitivity analysis
Analysis was carried out using the stripping column’s gaseous outlet for each
of the twelve least energy intensive stripping conditions for input to the base
of the absorption column. Water flow from the top was also varied between 50
and 800 kmol h-1 at 10 kmol h-1 intervals.

87
Flash-based sensitivity analysis involved the variation of incoming
temperature, incoming flow rate and operating vapour fraction. The flash
separator has two key roles. Firstly, to recover as much ammonia as possible.
Secondly to recover ammonia alongside a quantity of water suitable for steam
methane reforming (SMR). In Chapter 2, it was calculated that Esholt WWTP
generates on average 8,235 kg of CH4 each day from anaerobic digestion. For
the fuel cell process model, all methane will be processed in the internal
reforming SOFC, whereas, in the hydrogen production process model, 28% will
be used for fuel in the reformer’s furnace to meet all thermal demands.
Figure 4-3. Process flow for flash sensitivity analysis
The process flow used for flash sensitivity analysis can be seen in Figure 4-3.
The bottoms of the absorption column, ‘EXIT-LIQ’, is twice pre-heated before
entering the flash separator. Firstly, via the heat exchanger, ‘HX3’, where the
hot vaporised outlet from ‘FLASH’ is used to heat the incoming ‘EXIT-LIQ’. HX3
is set up so that the EXIT-LIQ heats up to within 1°C of FLASH-O1. A ‘Design
Spec’ has been set up that dictates the temperature given to ‘FLASHIN2’ via
‘FLASHEAT’ so that the heat duty of ‘FLASH’ is zero. This ensures that no further
heating occurs in the flash separator to achieve the set vapour fraction. The
required water outlet for downstream feed molar S:C ratios of 2, 3 and 4 for
future hydrogen production and SOFC models are shown in Table 4-2.

88
Figure 4-4. Process flow for distillation sensitivity analysis
For sensitivity analysis the distillation column (DIST) has been set up so that
EXIT-LIQ from the absorption column enters ‘DIST’ above stage 2 without pre-
heating. The distillate stream (VAP), carrying recovered ammonia exits from
the top in gaseous form. The condensed bottoms (BTMS3), leaves at a higher
temperature than ‘VAP’ due to its exit from the reboiler. The heater block,
‘COOLER2’, cools the stream to ambient conditions so heat recovery potential
can be calculated. Two variables underwent sensitivity analysis. Firstly, molar
reflux ratio was varied between 0.15 and 1. Secondly, distillate rate was varied
between 2.8 and 5 kmol h-1. The reflux ratio can be described as the ratio
between the amount of liquid returned down the column and the quantity that
is collected in the distillate. The distillate rate can be described as the total flow
of fluid as distillate.
The sum of the heat duties of the condenser, reboiler and COOLER2 was used
as an indicator for the distiller’s energetic consumption. It could then be
compared with the energy demand of the flash system in order to appoint the
most appropriate final ammonia recovery step.

89
4.2.2 Economic Costing
Aspen Process Economic Analyzer (APEA) [265] was used to estimate the
capital expenditure and was examined under two key areas. Firstly, the
‘Equipment Cost’ which encompasses the material cost of the equipment unit
simulated. Secondly, the ‘Total Installed Cost’ which includes the material cost
plus: above ground piping, poling, concrete, instrumentation
underground/above ground electrics, grout and labour costs [266].
4.2.2.1 Cost of Operating Labour
Calculating the total cost of labour began with the consideration of the total
required labour for the plant. According to data obtained by Alkhayat & Gerrard
[267] and described in Turton et al. [268], the number of operators per shift
can be estimated via Equation 4-1:
𝑵𝑶𝑳 = (𝟔. 𝟐𝟗 + 𝟑𝟏.𝟕𝑷𝑷𝟐 + 𝟎. 𝟐𝟑𝑵𝒏𝒑)𝟎.𝟓 4-1
where, NOL is the number of operators per shift, PP is the number of processing
steps involving the handling of particulate solids and Nnp is the number of non-
particulate processing steps.
An operator would work on average 49 weeks per annum at five 8-hour shifts
per week; making 245 shifts per operator per year. For 24 hours/day
operation, the plant requires three set of shifts per day or 1,095 shifts per year.
This means that approximately 4.5 operators are required per NOL. According
to Glass Door, the average salary for a process engineer is £34,523 [269] and
has been used as the mean salary for plant operators in this assessment.
However, this salary is subject to an annual growth rate of 2.99%;
corresponding to data from the UK Office for National Statistics (ONS) for years
between 2005-2015 [270].

90
4.2.2.2 Maintenance costs
Annual maintenance costs have been estimated as 3% of the total installed
costs as suggested in both Turton et al. [268] and Rotunno et al. [271].
4.2.2.3 Net Present Value
Net Present Value (NPV) sensitivity analysis has been carried out using
speculative values for recovered NH3 to determine, over a 20 year operating
period, what value each unit of recovered NH3 will need to have in order for the
initial investment to be financially viable. For now, speculative ammonia values
have been used because its true value cannot be determined without evaluation
of its end-use as a fuel for SOFC processing or as a H2 production feedstock.
NPV takes into account the time value of money; where the value of a sum of
money is worth more in the present than the same sum of money will be worth
in the future. This is the case because any capital investment is in direct
competition with other opportunities that could guarantee a particular rate of
return. Thus, NPV analysis applies a discount factor to future cash flows to
account for the impact of value over time. The discount factor applied, known
as the ‘discount rate’, equates to alternative potential investment returns. A
10% annual return on investment is a reasonable assumption and, thus, has
been used as the discount rate for NPV analysis. Equation 4-2 displays the
calculation used for NPV:
𝑵𝑷𝑽(𝒊,𝑵) = ∑ 𝑹𝒕
(𝟏+𝒊)𝒕𝑵𝒕=𝟎 4-2
where; i is the discount rate (as a fraction), N is the plant life time, t is the year
of operation and Rt is the net cash flow for the year. Net cash flow includes
income based from the speculative value of recovered ammonia minus financial
outgoings. For year 0, financial outgoings include capital investment and for
operating years include the wage bill, maintenance costs and material costs. If

91
NPV ≥ 0 within a desired payback period, then process implementation can be
viewed financially viable.
Operation expenses such as maintenance costs and caustic soda have been
subject to annual inflation of 2.87%, based on the average retail price index
(RPI) inflation between 2008-2018, and calculated using data from the office of
national statistics (ONS) [272]. Employee salaries have been subject to annual
increments of 2.99%, based on the average annual growth between 2005-2015,
shown in data from ONS [270].
4.3 Results and Discussion
4.3.1 Stripping Sensitivity Analysis
4.3.1.1 Air Stripping
Review of literature informed that both flow and the temperature of the air feed
in the stripper have an impact on the effectiveness of stripping. This has been
demonstrated via sensitivity analysis of the process built in Aspen Plus ( Figure
4-1), the results for a select number of temperature options can be seen in
Figure 4-5. Figure 4-5 shows that where both low flow rates and temperatures
of feed air are used, it is not possible to achieve effective ammonia stripping.
Whereas, at high flow rates and temperatures, total ammonia recovery can be
attained. However, increasing both the temperature and flow rate of feed air
impact on the energy requirements of stripping and down-stream process.
Thus, it is important for further analysis to choose the most appropriate
conditions.

92
Figure 4-5. Graph illustrating the effect of air temperature and air flow rate on the % of ammonia recovered from digestate liquor.
It was decided that the minimum quantity of ammonia recovery desired in the
air stripper is 95%. The sensitivity analysis displayed in Figure 4-5, shows that
this is unachievable at the lowest air temperature considered of 125°C.
However, at 150°C and an air flow rate of 900 kmol h -1, 96% of ammonia can be
recovered. Under these conditions, the gas contained in the stream ‘STRIPGAS’,
leaves at a temperature of 37.4 °C, and the liquid effluent in stream ‘BTMS1’
leaves at a temperature of 38.7 °C. It also facilitates a mass air to liquid ratio of
0.94 on a mass basis and 799 on a volume basis.
Over 95% of ammonia can be recovered from digestate liquor using the lowest
air flow-rate analysed of 200 kmol h-1, if the air is heated to at least 700 °C.
Resultantly, the temperature profile of the column is far greater than the high
air flow scenarios discussed above. The stripped gas leaves at a temperature of
68.1°C and the liquid bottoms leaves at 70.2°C. The air:liquid ratio under this
scenario is much lower, at 0.21 on a mass basis and 178 on a volume basis.
The heater block, ‘BT-HEAT’, has been used as a proxy to determine the most
appropriate conditions for stripping. This is, in essence, the air temperature
and air flow rate of the incoming air-stream that requires the lowest energy
input. Results from stripping sensitivity that provided >95% recovery were

93
ordered in terms of heat duty requirements of ‘BT-HEAT’. The twelve least
energy intensive conditions have been detailed in Figure 4-6.
Figure 4-6. Chart comparing the thermal energy requirement to heat incoming stripping air of the twelve least energy intensive conditions. a) 900 kmol h-1 at 150°C, b) 950 kmol h-1 at 150°C, c) 700 kmol h-1 at 200°C d) 550 kmol h-1 at 250°C, e) 450 kmol h-1 at 300°C, f) 1000 kmol h-1 at 150°C, g) 500 kmol h-1 at 275°C, h) 650 kmol h-1 at 225°C, i) 750 kmol h-
1 at 200°C, j) 350 kmol h-1 at 400°C, k) 250 kmol h-1 at 550°C, l) 600 kmol h-1 at 250°C
The least energy intensive condition is at 150°C and 900 kmol h -1, which
requires 931 kW of heating. There is a general trend that higher flow rates, at
lower temperatures are less energy intensive than low flow rates at higher
temperatures. It is thought that this amount of heating could be fully met
internally when combined with hot streams generated during hydrogen
generation or fuel cell process models. However, the high flow rate of air brings
with it other issues, firstly the extra energy costs for compression, secondly, the
higher flow rates mean a larger column, which facilitates additional capital
costs. Lastly, a greater flow of air will require a greater flow of water for the
successive absorption step which has its own repercussions, of which will be
discussed with further sensitivity analysis.
a b c d e f g h i j k l
900
950
1000
1050
1100
1150
He
at D
uty
(kW
)
Condition

94
4.3.1.2 Steam Stripping
Sensitivity analysis was carried out for steam stripping as discussed in section
4.2.1. As with air stripping, 95% ammonia recovery was used as the benchmark
to analyse the conditions with the least associated energy demand. As shown in
Figure 4-7, the six least energy demanding conditions all had steam flow rates
of 110 and 120 kmol h-1 at varying temperatures. However, the least energy
intensive condition of 110 kmol h-1 at 270 °C requires 1,605 kW of thermal
power. This is 675 kW or 72% greater than the least energy demanding
condition analysed in air stripping. For this reason, air stripping was chosen as
the stripping technique of choice going forward.
Figure 4-7. Six least energy consuming conditions for steam stripping providing 95% NH3 recovery. a) 110 kmol h-1 at 270°C, b) 120 kmol h-1 at 160°C, c) 110 kmol h-1 at 280°C, d) 120 kmol h-1 at 170°C, e) 110 kmol h-1 at 290°C, f) 120 kmol h-1 at 180°C.
4.3.2 Absorption and Flash Sensitivity Analysis
Sensitivity analysis of the water flow requirement for ammonia recovery in the
absorption column was carried out using the range of flows discussed in section
4.2.1. The flow of water needed to absorb 95% of incoming ammonia for the
a b c d e f
1600
1610
1620
1630
1640
1650
Heat D
uty
(kW
)
Condition

95
twelve scenarios shown in Figure 4-6 were found. The results for each scenario
can be found in Figure 4-8. It highlights the fact that, although low temperatures
and high-flow rates suit ammonia stripping from an energetic perspective, it
has a negative impact on the quantity of water needed to effectively re-absorb
the ammonia into solution.
Figure 4-8. Chart comparing the water flow in to the absorption column to absorb 95% of incoming ammonia for the twelve least energy intensive conditions found for air stripping: a) 900 kmol h -1 at 150°C, b) 950 kmol h-1 at 150°C, c) 700 kmol h-1 at 200°C d) 550 kmol h-1 at 250°C, e) 450 kmol h-1 at 300°C, f) 1000 kmol h-1 at 150°C, g) 500 kmol h-1 at 275°C, h) 650 kmol h-1 at 225°C, i) 750 kmol h-1 at 200°C, j) 350 kmol h-
1 at 400°C, k) 250 kmol h-1 at 550°C, l) 600 kmol h-1 at 250°C
The workings of Henry’s law means that when the partial pressure of ammonia
is low in the gas phase, more water is required to absorb ammonia. In order to
assess this relationship, the incoming air flow was plotted with the required
water flow to recover 95% of the incoming ammonia, as shown in Figure 4-9.
The best-fit line shown in Figure 4-9, with an R2 of 0.998, illustrates the strong
linear relationship between incoming flow rate and required water flow for
ammonia recovery. For future models with varying quantities of incoming
a b c d e f g h i j k l
0
100
200
300
400
500
Wa
ter
Flo
w (
km
ol/h)
Stripping Condition

96
gaseous flow, a suitable water-flow rate can be predicted using the equation of
best-fit.
Figure 4-9. Correlation between incoming gaseous flow rate and required water flow to achieve 95% ammonia recovery. Line of best fit; y = 0.3679x + 52.989, R2 = 0.998.
The quantity of water required during absorption is also important in terms of
whole-process sustainability, due to the impact it has on the operation of the
flash separator or distillation column.
4.3.3 Flash Separation
The flash separator manipulates the differing enthalpy of vaporisation points
of components in its feed inlet to produce a vapour and a liquid outlet. In the
case of the discussed process, it acts to concentrate the ammonia, as its
enthalpy of vaporisation is much lower than water’s. However, some water still
vaporises in the flash separator, meaning its operational conditions are
dictated by down-stream feed molar S:C ratios to either the SR or SOFC units.
The required water outlet with ammonia is shown in Table 4-2:
100 200 300 400 500 600 700 800 900 1000 1100
100
150
200
250
300
350
400
450
Wate
r F
low
(km
ol/h)
Air Flow (kmol/h)

97
Table 4-2. Required water outlet for associated downstream S:C ratios. SOFC model Water requirement (kmol h-1)
S:C 2 42.8 S:C 3 64.2 S:C 4 85.5
H2 production model
Water requirement (kmol h-1)
S:C 2 30.9 S:C 3 46.4 S:C 4 61.8
Figure 4-10 shows the effect of varying water inlet flows (which corresponds
to the water flow used during absorption) on the outlet of vaporised water and
ammonia from the flash separator. Each point demonstrates a different set
vapour fraction between 0.12-0.5. The objective is to achieve the water flow
rates displayed in Table 4-2. In each case, it has been shown that a greater
quantity of ammonia recovery is achievable with lower total flow inlet. For
example, if the flash is to provide a S:C ratio of 2 for the SOFC model, a set
vapour fraction of just above 0.32 for an incoming flow-rate of 140 kmol h-1 can
be used and will recover 2.32 kmol h-1 of ammonia. However, with an incoming
flow-rate of 300 kmol h-1 a vapour fraction of just below 0.16 would be used
and would recover just 1.9 kmol h-1 of ammonia.

98
Figure 4-10. Sensitivity analysis results with outlet water and ammonia flow-rates (kmol h-1) from flash separation with varying inlet flow rates between 140-420 kmol h-1.
Lower flow rates in stream ‘EXIT-LIQ’ also lowers the heat demand of heater
block ‘FLASHEAT’. The operational preference for lower incoming flow rates to
the flash separator, has key knock-on effects. Firstly, it means the absorption
column should be operated with the lower flows of incoming water. In turn,
previous analysis has shown that in order to recover an adequate quantity of
ammonia, this is only possible if higher temperatures with lower air flow rates
are used in the air stripper.
Thus, the influence of the lowest incoming flow rate (140 kmol h -1) on the
required flash vapour fraction was analysed. This included analysis for the
steam requirements of S:C ratios 2, 3 and 4 for both future SOFC and H2
production models. Regression analysis was performed so that the required
vapour fraction, amount of ammonia recovered and associated energy demand
were calculated for each downstream S:C scenario. The results from this
analysis can be seen in Table 4-3.
1.6
1.8
2.0
2.2
2.4
2.6
0 50 100 150 200
140 kmol/h
180 kmol/h
220 kmol/h
260 kmol/h
300 kmol/h
340 kmol/h
380 kmol/h
420 kmol/h
Water (kmol/h)
Am
mon
ia (
km
ol/h)

99
Table 4-3. Required vapour fraction operation for the flash separator, quantity of ammonia recovered and heating requirements when quantity of water for future modelling scenarios with differing S:C ratios. Vapour fraction relationship with water vapour outlet: y = 0.00725x + 0.01165. Ammonia recovery relationship with water vapour outlet: y = 0.90037 + 0.06642x - 0.00103x2 + 5.91E-06x3. Heat duty relationship with water vapour outlet: y = -4.51775 + 5.46941x + 0.02442x2.
SOFC model Water requirement
(kmol h-1)
Vapour fraction
Ammonia Recovery
(kmol h-1)
Heat Duty (kW)
S:C 2 42.8 0.32 78.6 274.3
S:C 3 64.2 0.48 84.1 447.3
S:C 4 85.5 0.63 92.9 641.6 H2
Production Model
Water requirement
(kmol h-1)
Vapour fraction
Ammonia Recovery
(kmol h-1)
Heat Duty (kW)
S:C 2 30.9 0.24 72.6 187.8 S:C 3 46.4 0.35 79.8 301.8
S:C 4 61.8 0.46 83.5 426.8
Table 4-3 illustrates that when fulfilling the requirements of greater
downstream S:C ratios, greater vapour fractions must be specified in the flash
separator, this also means more ammonia can be recovered. However, the heat
demand to achieve this is significantly higher. In essence, it is energetically
cheaper to achieve lower S:C ratios but there will be a lower recovery of
ammonia. The lowest percentage recovery from the flash separator was 79%
for the S:C 2 hydrogen production scenario, whilst the highest was 93% for the
SOFC S:C 4 scenario.
4.3.4 Distillation
Distillation could be used in place of stripping technology to recover ammonia
straight from digestate liquor. However, due to the low concentrations and
quantity of incoming liquid, this was found to be energetically impractical.
However, post-absorption, the ammonia concentration is far greater which
would make it more feasible. There are very few examples in literature that

100
have applied distillation post-absorption for ammonia recovery. The RVT
group mentions the use of distillation after steam stripping to achieve a highly
concentrated ammonia product in their technology overview document [187].
The results shown in the sensitivity analysis carried out in this Chapter look
promising. Table 4-4 shows sensitivity results for the least energy consuming
runs (in terms of both reboiler duty and combined heat duty for the reboiler,
condenser and COOLER2) for eight different incoming flow rates between 140
and 420 kmol h-1 at 40 kmol h-1 intervals.
Table 4-4. Sensitivity data showing the least energy consuming results for incoming flow rates for distillation at 40 kmol h-1 intervals.
Distillate rate
(kmol h-1)
Reflux ratio
Flow in (kmol h-1)
H2O (kmol h-1)
NH3 (kmol h-1)
Reboiler Duty (kW)
Combined Heat Duty (kW)
3.4 1.5 140 0.10 2.705 348.37 68.19
4.4 0.05 140 1.11 2.700 301.68 82.04
3.6 1.5 180 0.06 2.808 428.31 79.49
4 0.15 180 0.54 2.728 375.40 85.75
3.6 1.5 220 0.00 2.740 472.74 86.82
4.6 0.05 220 0.97 2.769 452.10 102.85
3.8 1.5 260 0.00 2.813 552.03 98.32
4 0.25 260 0.31 2.704 528.61 104.03
4 1.5 300 0.03 2.858 663.16 112.86
5 0.05 300 1.11 2.779 605.70 126.58
4 1.5 340 0.00 2.768 705.40 119.45
4.4 0.25 340 0.40 2.766 683.56 127.74
4.4 1.5 380 0.19 2.860 824.57 136.48
4.8 0.15 380 0.73 2.723 758.16 142.64
4.2 1.5 420 0.00 2.734 859.29 140.71
5 0.15 420 0.79 2.749 835.66 154.57
Under each scenario shown in Table 4-4, over 97% of the incoming ammonia is
recovered. This shows a far superior ammonia recovery potential compared to
the alternative flash process. Similar to flash processing, the energy
consumption of the distiller increases with greater incoming flow. The lowest
reboiler duty was found under an inflow of 140 kmol h -1 at 301.68 kW. The
highest reboiler duty was found under an inflow of 420 kmol h-1 at 859.29 kW.

101
This, again, details the down-stream energetic preference of using lower flow
rates of air and water in the air stripper and absorption columns respectively.
Thus, if an incoming flow rate of 140 kmol h -1 is considered, the reboiler heat
duty could stand at 301.68 kW. This is greater than the lowest heat duty
requirement for flash processing of 275 kW. However, it is lower than all other
flash processing scenarios and guarantees a superior recovery of ammo nia.
The combined heat duty of the condenser, reboiler and COOLER2, labelled in
Table 4-4 as ‘combined heat duty’, describes the energy demand if ideal heat
recycling could be achieved. The reboiler is a heat sink whereas the condenser
and COOLER2 have the potential to act as heat sources. This explains the
disparity shown in Table 4-4 where the lowest reboiler duty doesn’t necessarily
equate to the lowest combined heat duty. Direct heat transfer between the
three is impractical. However, if integrated into a wider process, it could play a
part in whole-system sustainability.
Furthermore, a case could be made that the use of higher flow rates during
stripping and absorption would be preferential due to the energetic advantages
of using higher air flow rates at lower temperatures during stripping (as shown
in Figure 4-6), which outweigh the differences in the ‘Combined Heat Duty’
figures, shown in Table 4-4, between high and low distillation incoming flow
rates. However, there are no guarantees that ideal heat recycling can be
achieved or is worthwhile, due to the low quality nature of the heat provided
and the economic cost of heat exchange equipment. As such, it has been
proposed that low flow rate scenarios will be used for the process
henceforward.
4.3.5 Ammonia recovery: combined process
The sensitivity analysis carried out has enabled the formation of a combined
process where the most appropriate technology methods and process
conditions have been implemented. The full process flow combining air
stripping, NH3 absorption, and distillation in achieving the desired S:C for
downstream reforming or SOFC can be found in Figure 4-11 and the stream

102
compositions in Table 4-5. The overall process facilitates an annual recovery of
ammonia of 400.7 tonnes.
Table 4-5. Stream composition for final ammonia recovery process.
LIQ1 LIQ2 BOT AIR
BOT AIR1
BOT AIR2
BTMS1
BTMS2
STRIP GAS
H2O (kmol h-1)
1528.6 1528.6 0 0 0 1451.3 1451.3 77.3
O2 (kmol h-1)
0 0 52.5 52.5 52.5 0.6 0.6 51.9
N2 (kmol h-1)
0 0 197.5 197.5 197.5 0.9 0.9 196.6
NH3 (kmol h-1)
3.0 3.0 0 0 0 0.1 0.1 2.8
Total Mole Flow (kmol h-1)
1531.5 1531.5 250.0 250.0 250.0 1452.9 1452.9 328.6
Total Mass Flow (kg h-1)
27587.7 27587.7 7212.6 7212.6 7212.6 26191 26191 8609.0
Total Volume Flow (l min-1)
462.1 480.8 102546 96794 259314 457.9 438.9 153069
Temperature (°C)
23.0 62.4 23.0 34.3 550.0 65.6 24.0 63.5
Pressure (bar)
1 1 1 1.1 1.1 1 1 1
CONDENS STRIP2 WATER GAS-OUT
EXIT-LIQ
BTMS3
BTMS4
VAP
H2O (kmol h-1)
77.2 0.1 145.5 6.0 139.6 138.5 138.5 1.1
O2 (kmol h-1)
0 51.9 0.0 51.7 0.3 0 0 0.3
N2 (kmol h-1)
0 196.6 0.0 196.3 0.4 0 0 0.4
NH3 (kmol h-1)
0 2.8 0.0 0.1 2.7 0 0 2.7
Total Mole Flow (kmol h-1)
77.2 251.4 145.5 254.0 142.9 138.5 138.5 4.4
Total Mass Flow (kg h-1)
1390.5 7218.5 2621.2 7260.9 2578.8 2495.1 2495.1 83.7
Total Volume Flow (l min-1)
23.2 103124.
7 43.9
103106.8
43.1 45.3 41.8 2066.4
Temperature (°C)
23.0 23.0 23.0 20.0 10.8 99.6 23.0 67.4
Pressure (bar)
1 1 1 1 1 1 1 1

103
Fig
ure
4-1
1.
Pro
cess
flo
w f
or
amm
on
ia r
eco
very
.

104
Figure 4-11 legend
LIQ1 Digestate liquor representative inlet LIQ2 Preheated digestate liquor
BOTAIR Air for stripping inlet at ambient temperature and pressure BOTAIR1 Compressed air for stripping
BOTAIR2 Compressed and preheated air for stripping BTMS1 Hot liquid outlet from the stripping column
BTMS2 Cooled liquid outlet from the stripping column STRIPGAS Gaseous outlet from the stripper containing desorbed NH3 CONDENS Water condensed from the stripper’s gaseous outlet STRIP2 Dry gaseous inlet to the absorber WATER Water inlet used for NH3 absorption GAS-OUT Gaseous outlet from absorber EXIT-LIQ Liquid outlet from absorber containing reabsorbed NH3 VAP Gaseous distillate stream from distiller containing recovered NH3 BTMS3 Hot liquid outlet from distiller BTMS4 Cool liquid outlet from distiller
4.3.5.1 Stripping conditions
Due to the downstream benefits of using lower flow rates at higher
temperatures in the stripping column, the lowest flow rate condition of the 16
least energy intensive conditions found during sensitivity analysis has been
chosen (scenario ‘k’ as displayed in Figure 4-6). This means an incoming air
flow rate of 250 kmol h-1, equating to 7,213 kg h-1 or 15,558,840 l hr-1 at 550°C
and 1.1 bar, which facilitates an average column temperature of 64.3°C. These
conditions provide the stripping of 95% of the ammonia held in the incoming
digestate liquor, which equates to 2.81 kmol h-1. Furthermore, the compression
of ‘BOTAIR1’ stream requires 22.9 kW of power.
4.3.5.2 Absorption conditions
The quantity of water used for absorption has been calculated using the
equation presented from the regression analysis in Figure 4-9. This has
determined a water flow rate of 145.5 kmol h -1 and has led to the absorption of
2.69 kmol h-1 of ammonia. This represents a recovery of 98.7% of the ammonia

105
entering the absorption column and 91% of ammonia held in the initial
digestate liquor.
4.3.5.3 Distillation conditions
The stripping conditions with the lowest reboiler duty have been used for the
final ammonia recovery process. This means a distillate rate of 4.4 and a reflux
ratio of 0.05. This facilitates the recovery of 99.8% of the ammonia held in the
distillation feedstock and a final recovery of 91% of ammonia contained in the
initial digestate liquor. It has a reboiler duty of 310.1 kW, a condenser “duty” of
-2.6 kW and a ‘COOLER2’ heat “duty” of -226.3 kW. Here, negative heat duties
signify the generation of heat (vice versa, positive heat duty represent heat
consumption). The true net energy requirement for distillation will only be
known when integrated in to a wider process; where the heat generated at
‘COOLER2’ could be used for heat exchange with other streams. However, if all
the heat generated at ‘COOLER2’ and the column’s condenser can be recycled,
then the distillation’s net energy requirement is just 83.5 kW.
4.3.5.4 Energy Requirements
There are three main components during the proposed ammonia recovery
process that consume energy: the air compressor for stripping (CMPRS), the
stripping air heater (BT-HEAT) and the distiller’s (DIST) reboiler. There are
also three main components in the proposed process where cooling is required
and could be used for heat recovery or recycling; the unit used to cool the
gaseous inlet to the absorption column (COOLER), the distillation (DIST)
condenser and cooling unit for the distiller’s bottoms stream (COOLER2). The
figures, of which, have been displayed in Table 4-6.

106
Table 4-6. Energy consumption of process and components. Energy Utility
CMPRS (kW) 22.9 Power
BT-HEAT (kW) 1089.3 Heat
COOLER (kW) -1056.6 Heat
DIST Reboiler (kW) 310.1 Heat
DIST Condenser (kW) -2.6 Heat
COOLER2 (kW) -226.3 Heat
Total Energy Consumed (kW) 1422.3 P&H
Potential Energy Export (kW) 1285.5 Heat
Net Power Consumption (kW) 22.9 Power
Net Heat Consumption (kW) 113.9 Heat
Table 4-6 shows that the largest energy consumer in the process is the heater
used for pre-heating the stripping gas (BT-HEAT) at 1089.3 kW. This amounts
to 78% of all thermal energy requirements, which stands at 1,399.4 kW. The
only electrical power sink is during compression at 22.9 kW. The largest
potential heat source is from ‘COOLER’, which could provide 1 ,056.6 kW of
thermal energy if heat can be sensibly exchanged within a wider process.
However, it should be noted that this is low quality heat, as the hot stream inlet
to ‘COOLER’ (STRIPGAS) is entering at just 63.5°C. This limits the potential
application of this heat in a wider setting but could always be an option for
space heating at the WWTP.
Nevertheless, under the assumption that all heat sources from the proposed
ammonia recovery process are utilised, the combined net energy consumption
is just 136.8 kW. This translates to a net energy consumption of 2.99 kW per kg
of recovered ammonia. If none of the energy from the heat sources can be
utilised this figure rises to 31 kW per kg of recovered ammonia.
4.3.6 Economic Analysis
4.3.6.1 pH adjustment
The pH target for the ammonia liquor pre-stripping has been set to 10.5 as
suggested by Hidalgo et al. [176]. The digestate liquor was found to have an
107
initial pH of 7.8 which corresponds to a pOH of 6.2 and an OH - molar
concentration of 0.00000063 moles l-1. The reduction of pOH to 3.5 requires the
addition of 0.000316 moles of OH-1 per litre which equates to 0.0126 g l-1 of
NaOH. In total this would mean the addition of 8.34 kg of NaOH per day. ICIS
report the cost of caustic soda in north-west Europe 310-340 USD/tonne [273],
which means an expense in the range of £2.02-£2.22 per day with an exchange
rate of 0.78 £/$.
4.3.6.2 Equipment Cost
Results from the Aspen Process Economic Analyzer (APEA) can be found in
Table 4-7. The compressor has the highest capital and total installed cost at
£416,286 and £688,500 respectively. The reason for this high cost is the large
volume of gas required for compression and is another reason to keep the flow
of stripping air down with higher temperatures. However, the stripping tower
demands the greatest installation costs at £157,950. COOLER2 has the lowest
capital and installation costs. However, note that when integrated into the
wider process, this is likely to be replaced with a heat exchanger, which could
provide different results. APEA was unable to cost the heater block ‘BT-HEAT’.
As such, a heat exchanger was set up with the same ‘cold’ input to BT-HEAT,
counter-flowing against a stream of steam at 600 °C, which allowed for an
appropriate economic proxy.

108
Table 4-7. Equipment capital costs and total installed costs (includes capital and installation expenditure) from Aspen Process Economic Analyser
Name Equipment Capital Cost
[GBP] Total Installed Cost
[GBP] CMPRS 416,286 688,500
STRIPPER-tower 116,298 351,600
HX1 96,798 249,000 ABSORP-tower 59,670 231,700
DIST-tower 39,780 191,600 COOLER 23,634 126,700
DIST-cond 12,324 102,700 DIST-reflux pump 10,530 100,700
BT-HEAT 9,360 69,900 DIST-reb 7,722 68,700
COOLER2 3,588 27,700 Total 795,990 1,722,864
4.3.6.3 Net Present Value Analysis
It was found during NPV analysis that the minimum value required for each kg
of recovered NH3, to achieve an NPV of zero over a 20 year operating lifetime,
was £1.87. The results of the analysis using this speculative value of recovered
ammonia can be found in Table 4-8. £1.87 per kg of NH3 is equivalent to £1.54
per kg of recovered nitrogen. At face value this seems comparatively high
compared to the cost of ammonium nitrate fertiliser, for example, which the
AHDB reported to be £0.82 per kg of nitrogen in October 2018 [274]. However,
by recovering ammonia from digestate liquor the plant will experience
energy/expenditure savings from reduced oxygen provision for the f acility’s
activated sludge process (ASP). ASP aeration tanks consume 4.57 kWh kg -1
oxidised nitrogen [57]. Thus, the diversion of 329.6 tonnes of nitrogen per year
corresponds to 1,506.3 MWh of electricity savings. At a purchasing price of 10p
per kWh, this provides annual savings of £150,627 or £0.45 per kg of recovered
nitrogen. When this is taken into account, the required value of recovered
ammonia seems more viable, considering this is just one example of the added-
value the recovery of ammonia can provide wastewater treatment facilities.
However, its true value can only be determined when integrated into further

109
processes for SOFC use or hydrogen production, which is discussed in Chapters
5&6.
Table 4-8. NPV analysis results using a value of £1.87 per kg of recovered
ammonia.
If the value for the recovered ammonia shown in Table 4-8 can be achieved then
the time taken to pay back the initial investment, using non-discounted
cashflow would take just under 9 years. Also using, non-discounted cashflows,
a profit over the 20 year period of £2,723,537 could be achieved. Table 4-8 also
shows that, by far the largest cost to the facility is the expenditure on salaries,
consisting of roughly 88% of all annual outgoings.
Salaries
(£) Maintenance
(£) Caustic
(£) Total Expense
(£) NH3 Value
(£) Cashflow
(£)
Discount Cashflow
(£)
NPV (£)
Yr 0 1,722,864
Yr 1 507,654 66,264 737 574,656 749,379 174,723 158,840 -1,564,024
Yr 2 522,833 68,251.92 758 591,844 770,892 179,049 147,974 - 1,416,050
Yr 3 538,466 70,299.48 780 609,546 793,023 183,477 137,849 - 1,278,201
Yr 4 554,566 72,408.46 803 627,777 815,789 188,012 128,414 - 1,149,787
Yr 5 571,148 74,580.72 826 646,554 839,208 192,654 119,623 - 1,030,164
Yr 6 588,225 76,818.14 849 665,892 863,300 197,407 111,431 - 918,732
Yr 7 605,813 79,122.68 874 685,809 888,083 202,274 103,798 - 814,934
Yr 8 623,927 81,496.36 899 706,322 913,577 207,256 96,687 - 718,247
Yr 9 642,582 83,941.25 925 727,448 939,805 212,357 90,060 - 628,187
Yr 10 661,795 86,459.49 951 749,206 966,784 217,578 83,886 - 544,301
Yr 11 681,583 89,053.27 979 771,615 994,538 222,924 78,133 - 466,168
Yr 12 701,962 91,724.87 1,007 794,694 1,023,089 228,396 72,774 - 393,394
Yr 13 722,951 94,476.62 1,036 818,463 1,052,460 233,997 67,781 - 325,613
Yr 14 744,567 97,310.92 1,065 842,943 1,082,674 239,730 63,128 - 262,485
Yr 15 766,830 100,230.25 1,096 868,156 1,113,755 245,599 58,794 - 203,691
Yr 16 789,758 103,237.15 1,127 894,122 1,145,728 251,606 54,757 - 148,934
Yr 17 813,372 106,334.27 1,160 920,865 1,178,619 257,754 50,995 - 97,939
Yr 18 837,691 109,524.30 1,193 948,409 1,212,455 264,046 47,491 - 50,448
Yr 19 862,738 112,810.02 1,227 976,776 1,247,261 270,486 44,227 - 6,221
Yr 20 888,534 116,194.33 1,262 1,005,991 1,283,067 277,076 41,186 34,965

110
4.4 Conclusions
The recovery of ammonia from digestate liquor has been robustly modelled
using Aspen Plus process simulation software, utilising thorough sensitivity
analysis to provide an energy efficient and proficient method to recover
ammonia so that it is ready for processing in SOFCs or as a feedstock for
hydrogen production. The final process model discussed and analysed in this
chapter has been used as the base ammonia recovery method for models in the
following two chapters.
The sensitivity analysis carried out found that air stripping operating at lower
temperatures with greater air-flows demanded less heat than higher
temperature, lower air flow options. However, using higher flow rates creates
multiple down-stream issues. Firstly, more water is required during absorption
to recapture the ammonia. This greater load resulted in higher energy demands
for the flash separation and distillation steps. Secondly, a greater flow of air
resulted in both more energy for compression and capital expenditure for a
compression unit that can handle such high flow rates.
As such, the 16 least energy intensive stripping conditions that facilitated >95%
ammonia recovery were determined from the sensitivity analysis. The scenario
with the lowest air-flow rate was chosen for primary stripping conditions
moving forward. This was found to be an incoming air flow rate of 250 kmol h -
1, equating to 7,213 kg h-1 at 550°C, which recovered 95% of the ammonia held
in the digestate liquor. A water flow rate into the absorption column was set at
145.5 kmol h-1 which enables the absorption of 91% of the ammonia originally
found in the digestate liquor. Sensitivity analysis showed that a final recovery
step of distillation was energetically superior to flash separation. The
distillation input conditions were set at a distillate rate of 4.4 and a reflux ratio
of 0.05. The recovery potential using distillation was extremely effective and
very little ammonia was lost, facilitating the overall recovery of 91% of the
digestate liquor’s ammonia.
Aspen Process Economic Analyser was used to cost the capital and installation
costs of the equipment simulated in the discussed process. The total investment
cost for installation of the equipment stands at £1,722,864. This was then used

111
as the year ‘zero’ costs for NPV analysis, where discounted cash -flows were
used to determine what value the recovered ammonia would have to represent
in order to make the investment financially worthwhile, based on a discount
value of 10%. This required value has been determined as £1.87 per kg of
recovered ammonia. Whether this figure is achievable will depend on its end
use, which is discussed in the following chapters.

112
5 Solid Oxide Fuel Cell operating on recovered
NH3 and Bio-CH4
5.1 Introduction
This chapter focusses on the applicability of combining the recovery of
ammonia, via methods discussed in Chapter 4, with the operation of an
internally reforming solid oxide fuel cell (IR-SOFC) stack, which uses both
recovered ammonia and biomethane from the anaerobic digestion unit as fuels.
This has been achieved via a number of methods. Firstly, a process model has
been built using Aspen Plus to provide mass and thermal flow analysis. A
numerical model has also been developed to provide the electrical power and
heat generation potentials of the fuel cell. Finally, an economic analysis has
been carried out to determine the financial viability of process implementation.
IR-SOFCs are devices that facilitate electricity production via the
electrochemical oxidation of hydrogen that is simultaneously generated within
the cell. The exothermic nature of the electrochemical oxidation reaction also
generates thermal power; making the IR-SOFC a cogeneration device. Figure
5-1 illustrates the layout of a SOFC with the presence of an anode, cathode and
electrolyte. The anode, doped with catalyst facilitates the steam reforming of
hydrocarbons or the thermal conversion of other hydrogen carriers such as
ammonia to produce a hydrogen-rich syngas. The cathode, ordinarily fed with
air, enables the reduction of oxygen to its ionic form (O2-) via contact with a
circuit of electrons. The oxygen ions cross over the porous electrolyte to react
with hydrogen at the anodic triple phase boundary (TPB). Here, water, heat and

113
electrons are produced. The electrons generated in this reaction provide the
power output from the cell and are externally circulated back to the cathode for
the reduction of oxygen.
The introduction of high temperature fuel cell systems at wastewater
treatment plants (WWTPs) have been endorsed for two key reasons. Firstly,
they have the capabilities to achieve superior electrical efficiencies compared
to combustion-based cogeneration alternatives as they are not limited by
thermodynamic obstructions such as Carnot efficiency [56]. Secondly, their
high temperature operation allows for internal thermo-chemical reactions,
capable of accepting an abundance of fuels including biogas, biomethane and
ammonia [208].
Figure 5-1. Layout of SOFC
The two key types of high temperature fuel cells were discussed for
implementation at WWTPS; SOFCs and Molten Carbonate Fuel Cells (MCFCs).
However, SOFCs have been chosen as the best option due to their superior
electrical efficiency potential. For example, Stuttgart-Möhringen wastewater
treatment plant in Germany operated an MCFC using biogas and found it to run
with a net electrical efficiency of 44% [275]. On the other hand, a study by Mehr
et al. [276] projects that a SOFC stack, using a biogas fuel, to be installed at
SMAT Collegno WWTP in Turin will run with a net electrical efficiency of 51.6%.

114
The main commercially available SOFCs consist of ceramic yttria-stabilised
zirconia (YSZ) electrolytes, with Ni/YSZ anodes and Sr- or Ca-doped LaMnO3
cathodes, which operate at temperatures between 900-1000 °C [277]. Efforts
have been made in material development to facilitate lower temperature
operation using cheaper, metallic interconnects [278]. However, difficulties
with overcoming lower electrolyte conductivity, electrode kinetics and
sintering temperatures of using such materials has meant the technology
readiness levels of ‘intermediate temperature’ (IT) SOFCs has remained
markedly low.
SOFCs have also been identified as an efficient method of using ammonia as a
fuel for cogeneration [56,116,279]. The high temperature operation allows for
ammonia decomposition to hydrogen and nitrogen, the former being utilised
during electrochemical processing. In their review of ammonia applications in
SOFCs, Ni et al. [213] found that conventional high temperature SOFCs using
Ni/YSZ anodes facilitated full decomposition of ammonia and comparable
current densities to pure hydrogen.
However, there is just one other example in the literature, to date, that has
studied both the recovery of ammonia from digestate liquor and its use
alongside biogas in a SOFC. This was carried out by Xu et al. [157], in which an
electrodeionization process was carried out at lab-scale to recover ammonia
from synthetic ammonium-rich wastewaters for input to a three-layer button
SOFC reactor with biogas produced from a lab-scale AD reactor fed with local
sewage sludge. The researchers achieved 95% and 76% ammonium recovery
from dilute and concentrated synthetic wastewaters respectively, and
predicted a 60% improvement in net energy output compared to conventional
CHP systems. However, electrodeionization has been in development for over
60 years and advancements in the fundamental understanding of its operation
and application has been extremely slow [280]. Furthermore, its use often
needs to be coupled with energy intensive procedures such as reverse osmosis
to provide sufficient selectivity [199]. Thus, its pathway to commercialisation
may still be some way off and provides further justification of the process
discussed in Chapter 4.

115
5.2 Process Design
Aspen Plus V.8.8 software [262] has been used to process model the system
which combines ammonia recovery and cogeneration power from SOFC
utilisation. As with the other discussed Aspen Plus simulations (Chapter 4), a
‘COMMON’ method filter and an ‘NRTL-RK’ base method have been used
throughout. Again, the process model generated in this body of work,
associated flow rates of digestate liquor and bio-methane from Esholt WWTP
(found in Chapter 3) have been used as primary inputs for the model. The
process flow diagram used throughout this Chapter is illustrated in Figure 5-2.
The SOFC could not be simulated with one module or reactor in Aspen Plus due
to the contrasting roles performed by the anode and cathode of the SOFC. The
anode is where the thermochemical steam reforming (5-2), water-gas-shift
(5-3) and ammonia decomposition (5-4) reactions occur, as well as electro-
chemical hydrogen oxidation (5-5). These cannot be simulated via an
equilibrium-based reactor due to selectivity of hydrogen oxidation at the triple
phase boundary over any other type of oxidation. As such, an ‘RStoic’ reactor
labelled ‘ANODE’ in Figure 5-2 has been used, where reactions and conversions
are specified for the given temperature and pressure. The conversion
efficiencies of reactions 5-2 to 5-4 were all found via analysis in an ‘RGibbs’
reactor at the associated temperature and pressure. The conversion of H2
during reaction 5-5 corresponds to the model’s defined utilisation factor (UF).
0.5O2 + 2e- O2- 5-1
CH4 + H2O 3H2 + CO 5-2
CO + H2O H2 + CO2 5-3
2NH3 3H2 + N2 5-4
H2 + O2- H2O + 2e- 5-5

116
The anode has been fed with compressed biomethane, and according to the
desired S:C ratio as discussed in Chapter 4, the mixture of compressed
recovered ammonia and compressed water, resulting in streams ‘BM1’, ‘CON -
LIQA’ and ‘H2O’ respectively. These streams are combined, pre-heated to 700
°C and fed into the anode via stream ‘AN-IN-2’. As with the other streams
involved with the SOFC, each block passed through undergoes an assumed 3%
pressure drop.
The cathode is simulated via both a ‘Sep’ block labelled ‘CATHODE’ and ‘Heater’
block labelled ‘FC-HEAT’. ‘Sep’ blocks allow the user to partition components of
an incoming stream. Thus, the ‘CATHODE’ block facilitates the simulation of
oxygen ion transport across the electrolyte to the anode triple phase boundary.
With the oxygen utilisation factor set at 20%, the CATHODE passes this quantity
of incoming oxygen to the anode in the stream ‘O’. ‘FC-HEAT’ acts solely as a
representation of the heat transfer across the cell. This is vital because the
overall exothermic nature of the reactions occurring in the anode dictate the
final operating temperature of the fuel cell and the transfer of heat across the
cell must be taken into account.
To ensure the heat transfer across the cell is correctly simulated, a ‘Design Spec’
has been set up that alters the temperature of the incoming air to the cathode
(stream ‘AIR3’) so that heat transfer across the cell fits the energy conservation
expression described in equation 5-6. Equation 5-6 details that the heat duty or
enthalpy change of reactions experienced in the ‘CATHODE’ block is equal to
the power produced (PAC,net), heat transfer across the cell (Qtrans) and SOFC
internal heat loss (QL).
−∆𝐻𝑎𝑛 = 𝑃𝐴𝐶,𝑛𝑒𝑡 + 𝑄𝑡𝑟𝑎𝑛𝑠 + 𝑄𝐿 5-6
Thus, by calculating net power production via the numerical model and with
the assumption that heat loss is 5%, the Design Spec dictates the temperature
of the incoming air in order to alter ‘Qtrans’ accordingly.
The furnace (‘FURN’) is positioned after the fuel cell and receives gases from
both the anode and cathode. These streams contain fuel in the form of

117
unconverted methane, hydrogen and carbon monoxide from the anode and
unused oxygen from the cathode. It has been simulated using an RGibbs reactor,
running at 90% thermal efficiency. The furnace exhaust is separated into two
streams using an FSplit block (SPLIT). One stream (EXH-B1) is used to pre-heat
the cathode inlet via heat exchanger ‘HX4’. The other stream (EXH-A1), is used
to preheat the anode inlet gases via heat exchanger ‘HX5’. The stream, still
containing sufficient thermal energy, is then compressed to 1.1 bar via
‘CMPRS3’ and used as the ammonia stripping gas.
The subsequent ammonia recovery process resembles that detailed in Chapter
4; with the stripping column followed by absorption with water in ‘ABSORP’
block and distillation in the ‘DIST’ block. The distillation bottoms stream is
comprised almost entirely of water and a small amount of ammonia, making it
ideal as the reagent for steam reforming in the SOFC. As such, the stream is split
in two via an FSplit block (SPLIT2). The stream labelled ‘H2O’ is sent to the SOFC
anode at a flow rate that facilitates a feed molar steam to carbon (S:C) ratio of
2.5. The other stream labelled ‘BTMS4’ can be used along with ‘UTILITY 2’ for
plant heating purposes.
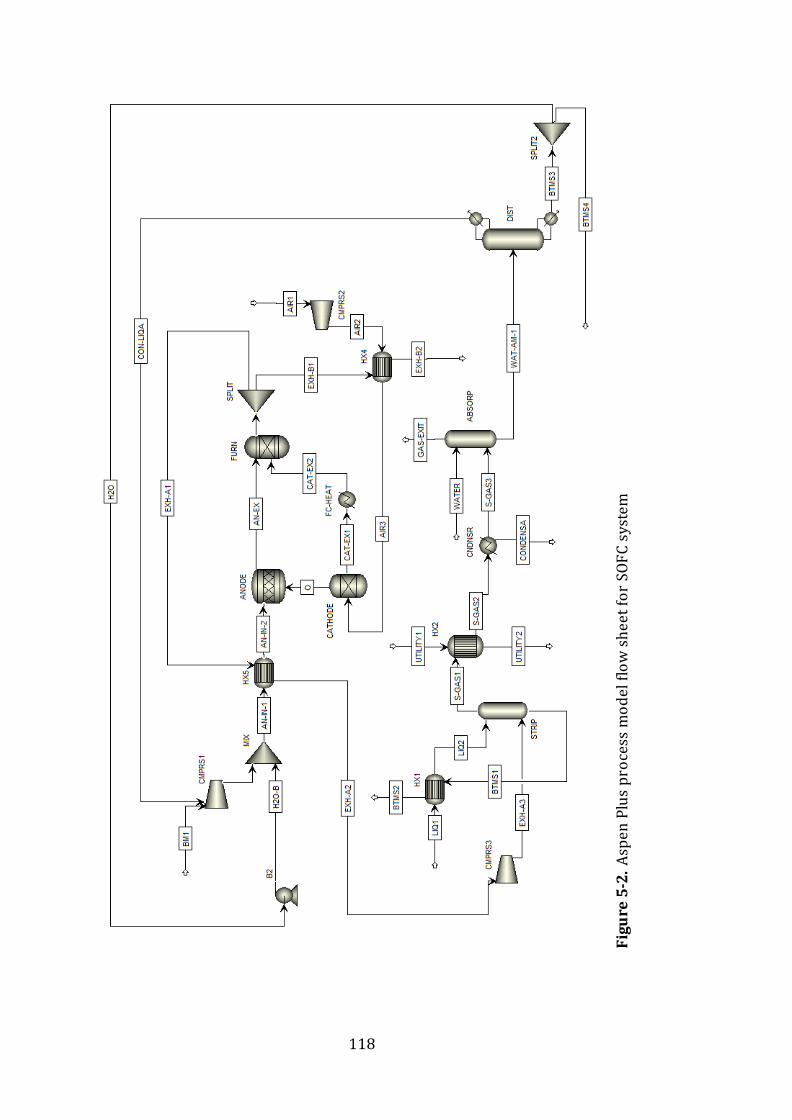
118
Fig
ure
5-2
. A
spen
Plu
s p
roce
ss m
od
el f
low
sh
eet
for
SOF
C s
yste
m

119
Figure 5-2 legend
LIQ1 Digestate liquor representative inlet LIQ2 Preheated digestate liquor EXH-A3 Compressed exhaust gas for inlet to stripper BTMS1 Hot liquid outlet from the stripping column BTMS2 Cooled liquid outlet from the stripping column S-GAS1 Gaseous outlet from the stripper containing desorbed NH3 UTILITY1 Cool water inlet for heat recovery UTILIT2 Hot water stream used as heating utility S-GAS2 Cooled gaseous outlet from stripper CONDENSA Water condensed from the stripper’s gaseous outlet S-GAS3 Dry gaseous inlet to the absorber WATER Water inlet used for NH3 absorption GAS-EXIT Gaseous outlet from absorber WAT-AM-1 Liquid outlet from absorber containing reabsorbed NH3 CON-LIQA Gaseous distillate stream from distiller containing recovered
NH3 BTMS3 Hot liquid outlet from distiller BTMS4 Hot liquid outlet from distiller used for heat recovery H2O Hot liquid outlet from distiller used for internal reforming H2Ob Pressurised hot liquid outlet from distiller used for internal
reforming BM1 Biomethane inlet at ambient temperature and pressure AN-IN-1 Combined stream of biomethane and water AN-IN-2 Pre-heated anode inlet AN-EX Anode exit gases EXH-A1 Exhaust gas from the furnace diverted for stripping EXH-A2 Cooler exhaust gas from the furnace diverted for stripping EXH-B1 Exhaust gas used for heat recovery EXH-B2 Cooled exhaust gas used for heat recovery
5.2.1 Biogas Clean-up System
A review of biogas purification systems has been carried out in Chapter 2 2.3.2.
A clean-up system is essential in order to meet the requirement of the discussed
model and ensure the biomethane contains little to no impurities. The presence
of H2S poisons the nickel-based catalyst which enables the internal reforming,
thus its removal is of the utmost importance. Of all the reviewed purification
technologies, high pressure water scrubbing shows the greatest promise due to
its technical maturity and ability to perform both CO2 and H2S removal. It has
been decided that the negligible (<2%) quantity of CO2 retained in the
biomethane product will have little impact on the operation of the process

120
model developed in Aspen Plus. A study carried out by Barbera et al. [281]
evaluated the installation costs of high pressure water scrubbing technology
for an AD facility with a similar biogas output to Esholt WWTP, at 5000 Nm3 h-
1. As such, cost data and power usage have been inferred using data from this
article. Barbera et al. [281] details that the power consumption during high
pressure water scrubbing (HPS) is 0.27 kWh m-3 and a total installed cost of
€2,647 per m3 h-1.
5.3 Numerical Modelling Method
It should be noted that the methodology for the numerical modelling has been
reproduced from Grasham et al. [282]. The SOFC system modelled in this work
has been based on SPGI’s 120 kW tubular fuel cell, as modelled for example, in
[222]. As discussed in Section 5.1, it consists of three key parts; the anode,
cathode and electrolyte. Methane, ammonia and steam are fed into the anode,
whilst air is fed to the cathode. Oxygen molecules diffuse from the porous
cathode to the cathodic triple phase boundary (TPB) where they reduce to ionic
O2- (reaction 5-1), then through the electrolyte and on to the anodic TPB. At the
anode side, three key reactions occur: (a) steam methane reforming ‘SMR’
(reaction 5-2), (b) water gas shift ‘WGS’ (reaction 5-3) and (c) ammonia
decomposition ‘NH3-DEC’ (reaction 5-4). Hydrogen produced diffuses through
to the anodic TPB where it reacts with oxygen ions to produce steam and
electrons (equation 5-5). The electrons are externally transported via a circuit
to the cathode, generating electrical power.
5.3.1 Cell Voltage
The cell voltage is calculated by subtracting the various potential voltage losses
from the Nernst Potential, shown in equation 5-7:
CV = E – nact – nohm - nconc 5-7

121
Where E is the Nernst voltage potential, nact represents the activation losses,
nohm the ohmic losses and nconc the concentration losses.
5.3.2 Nernst Voltage Potential
The Nernst Potential or the local thermodynamic reversible potential in
equation 5-8 determines the theoretical cell voltage potential under given
thermodynamic conditions and compositions.
𝐸 = 𝐸𝑜 −𝑅𝑇𝑐𝑒𝑙𝑙
𝑛𝐹ln (
𝑝𝐻2𝑂
𝑝𝐻2 . √𝑝𝑂2
) 5-8
where, according to [212,283]:
EO = 1.2723 – (2.7645 × 10⁻⁴ 𝑇𝑐𝑒𝑙𝑙) 5-9
𝐸𝑜 is the ideal voltage or reference voltage for hydrogen electro -chemical
oxidation at ambient pressure at cell reaction sites, and a function of
temperature. R is the universal gas constant, 𝑇𝑐𝑒𝑙𝑙 is absolute cell temperature,
pi is partial pressure of relevant gas species ‘i’ such as H2O, H2 or O2, F is the
Faraday constant and n is the number of electrons participating in the reaction.
In this case there are two participating electrons as shown in (reaction 5-5).
Electrochemical oxidation of CO at the anode is neglected due to the dominance
of H2 over CO in charge transfer kinetics. Other researchers have incorporated
the electrochemical oxidation of CO in numerical models, such as Spallina et al.
[284]. This was found to be valid under certain conditions by experimental
work carried out by Ong et al. [285], but only where high current densities (>1.5
A cm-2) and high CO concentration (>80%) conditions favoured
electrochemical oxidation of CO. However, these conditions do not apply to the
work presented here and so it can be said with a strong degree of certainty that

122
CO mostly contributes to the voltage potential via the production of H2 during
WGS, which also takes place at the anode.
5.3.3 Activation Voltage Loss
Activation polarisation (nact) is obtained via manipulation of the Butler-Volmer
equation 5-10.
𝑗 = 𝑗0 [𝑒𝑥𝑝 (𝛽𝑛𝐹𝑛𝑎𝑐𝑡
𝑅𝑇𝑐𝑒𝑙𝑙) − 𝑒𝑥𝑝 (−(1 − 𝛽)
𝑍𝑛∙𝑛𝑎𝑐𝑡
𝑅𝑇𝑐𝑒𝑙𝑙)] 5-10
nact is determined via the equations 5-11 and 5-12, extrapolated from the
implicit Butler-Volmer equation and utilised by [222].
𝑛𝑎𝑐𝑡,𝑎 =𝑅𝑇𝑐𝑒𝑙𝑙
𝛽𝑛𝐹∙ 𝑠𝑖𝑛ℎ−1 (
𝑗
2∙𝑗0,𝑎),
5-11
𝑛𝑎𝑐𝑡,𝑐 =𝑅𝑇𝑐𝑒𝑙𝑙
𝛽𝑛𝐹∙ 𝑠𝑖𝑛ℎ−1 (
𝑗
2∙𝑗0,𝑐), 5-12
where 𝑗 is the current density (A/m2), 𝑗0 is the exchange current density (A/m2)
and 𝛽 is the apparaent charge transfer coefficient. Electrodes in the anode and
cathode exchange current densities, 𝑗0𝑎 and 𝑗0𝑐 respectively, which are
determined via 5-13 and 5-14:
𝑗0𝑎 = 𝛾𝑎 × 𝑝𝐻2 × 𝑝𝐻2𝑂 × 𝑒𝑥𝑝 (
−𝐸𝑎𝑎
𝑅𝑇𝑐𝑒𝑙𝑙
)
5-13
𝑗0𝑐 = 𝛾𝑐 × 𝑝𝑂20.25 × 𝑒𝑥𝑝 (
−𝐸𝑎𝑐
𝑅𝑇𝑐𝑒𝑙𝑙
)
5-14
𝛾𝑎 and 𝛾𝑐 are activation barrier overpotential coefficients and Eaa and Eac are
activation energies for the anode and cathode respectively, and have each been

123
obtained from literature. 𝛾𝑎 and 𝛾𝑐 values were taken from [222] and Eaa and
Eac from [209].
5.3.4 Ohmic Voltage Loss
Ohmic losses result from contact resistance, the resistance of ions moving
through the electrolyte and electron transfer resistance in electrodes, current
collectors and interconnects. Ohmic voltage losses have been determined using
equations 5-15 and 5-16:
𝑛𝑜ℎ𝑚𝑖𝑐 = 𝑅𝑜ℎ𝑚𝑖𝑐 ∙ 𝑗𝑐𝑒𝑙𝑙 ∙ 𝐴𝑐𝑒𝑙𝑙 5-15
𝑅𝑜ℎ𝑚𝑖𝑐 = 𝜌𝑎𝛿𝑎 + 𝜌𝑐 𝛿𝑐 + 𝜌𝑒𝛿𝑒
5-16
Where 𝐴𝑐𝑒𝑙𝑙 is the area in which the current flows, 𝑅𝑜ℎ𝑚𝑖𝑐 is the global internal
resistance which takes into account specific material resistivity (𝜌) and
component thickness (𝛿). Figures for 𝜌 and 𝛿 have been extrapolated from
[222] and subscripts a, c, and e denote the anode, cathode, and electrolyte
respectively.
5.3.5 Concentration Voltage Loss
Concentration losses at electrodes occur due to mass transport processes or
simplistically where fuel or oxygen is being used by the fuel cell faster than it
can be supplied. The concentration losses at the cathode and anode have been
calculated via the equations detailed in 5-17 and 5-18.
𝑛𝑐𝑜𝑛𝑐 ,𝑎 =
−𝑅𝑇𝑐𝑒𝑙𝑙
𝑛𝑎𝐹∙ ln (1 −
𝑗𝑐𝑒𝑙𝑙
𝑗𝑙,𝑎) +
𝑅𝑇𝑐𝑒𝑙𝑙
𝑛𝑎𝐹∙ ln (1 +
𝑝𝐻2𝑗𝑐𝑒𝑙𝑙
𝑝𝐻2𝑂𝐽𝐿 ,𝑎)
5-17
𝑛𝑐𝑜𝑛𝑐 ,𝑐 = −𝑅𝑇
𝑛𝑐𝐹∙ ln (1 −
𝑗𝑐𝑒𝑙𝑙
𝑗𝑙,𝑐) 5-18

124
𝑗𝑙,𝑎 = 2𝐹∙𝑝𝐻2
∙𝐷𝑎,𝑒𝑓𝑓
𝑅𝑇𝑐𝑒𝑙𝑙 5-19
𝑗𝑙,𝑐 = 2𝐹∙𝑝𝐻2
∙𝐷𝑐 ,𝑒𝑓𝑓
𝑅𝑇𝑐𝑒𝑙𝑙 5-20
𝐷𝑎,𝑒𝑓𝑓 = 1.3103 × 101.5 ∙ 𝑇𝑐𝑒𝑙𝑙1.5 − 0.263382 5-21
𝐷𝑐,𝑒𝑓𝑓 = 𝐷𝑂2∙ (
𝑇𝑐𝑒𝑙𝑙
273)
1.5
∙𝜀
𝜏 5-22
where, 𝑗𝑙,𝑎 and 𝑗𝑙 ,𝑐 are the anode and cathode limiting current densities
respectively and 𝐷𝑎,𝑒𝑓𝑓 and 𝐷𝑐,𝑒𝑓𝑓 are effective diffusivities of H2 and O2
(reactant species) for the anode and cathode respectively. 𝐷𝑂2 is the ordinary
diffusivity of oxygen, 휀 denotes porosity of the electrode and 𝜏 its tortuosity.
5-21 has been provided by [286], whilst 5-22 has been taken from [222].
5.3.6 Efficiency Calculations
The fuel cell voltage as calculated above is based on a 120 kW SOFC using the
required fixed variables from [222]. The current was calculated using the
formula presented in equation 5-23. Due to the fact that each mole of oxidised
hydrogen generates 2 electrons, it is derived that 0.037605 kg H2 h-1 is required
to generate 1 kA of current [56]. Thus, the H2 consumption in each fuel cell was
determined via equation 5-24. The fuel requirement in the cell was calculated
using a fuel utilisation factor (UF), as presented in equation 5-25. A DC/AC
conversion factor of 0.97 was used to provide power outputs as AC electricity.
Net power (PAC,net) was calculated by subtracting the consumption in pumps
and compressors from the AC production. PAC,net was used to calculate net
electrical efficiency as stated in equation 5-26 by dividing net power with LHV
flows from methane and ammonia. Thermal efficiency has been calculated via
5-27 and combined efficiency via equation 5-28 where Qr is the system’s
thermal output.

125
𝐼𝑐𝑒𝑙𝑙 =𝑃𝑔𝑟𝑜𝑠𝑠
𝐶𝑉 5-23
ṁ𝐻2 ,𝑐𝑜𝑛𝑠𝑢𝑚𝑒𝑑 (kg ℎ−1) =
𝐼𝑐𝑒𝑙𝑙 × 0.037605 (kg ℎ−1 k𝐴−1)
5-24
ṁ𝐻2 ,𝑖𝑛 = ṁ𝐻2,𝑐𝑜𝑛𝑠𝑢𝑚𝑒𝑑
𝑈𝐹 5-25
𝜂𝑒𝑙𝑒𝑐 ,𝑛𝑒𝑡 = 𝑃𝐴𝐶 ,𝑛𝑒𝑡
ṁ𝐶𝐻4∙𝐿𝐻𝑉𝐶𝐻4 + ṁ𝑁𝐻3
∙𝐿𝐻𝑉𝑁𝐻3 5-26
𝜂𝑡ℎ𝑒𝑟𝑚 = 𝑄𝑟
ṁ𝐶𝐻4∙𝐿𝐻𝑉𝐶𝐻4 + ṁ𝑁𝐻3
∙𝐿𝐻𝑉𝑁𝐻3 5-27
𝜂𝐶𝐻𝑃,𝑛𝑒𝑡 = 𝑃𝐴𝐶,𝑛𝑒𝑡 + 𝑄𝑟
ṁ𝐶𝐻4∙ 𝐿𝐻𝑉𝐶𝐻4 + ṁ𝑁𝐻3
∙ 𝐿𝐻𝑉𝑁𝐻3
5-28
5.3.7 Sensitivity Analysis methodology
Sensitivity analysis of fuel cell temperature, pressure and WGS efficiency has
been carried out in order to better understand the impacts of such variables on
system efficiency. Operating temperature +/- 90°C, pressure +1bar and WGS
CO conversion efficiency +/- 50% have been analysed and compared to the
reference model. The anode reaction efficiencies and therefore gas
compositions have been assumed the same for temperature and pressure
sensitivities but have been adjusted accordingly for WGS efficiency changes,
including air flow for a constant oxygen utilisation of 20%.
5.4 Economic Analysis Methodology
The economic study in this work has been carried out under a hypothetical
scenario where there is no cogeneration technology in place at Esholt WWTP
or one where it is an end-of-life period for the current cogeneration equipment.
This has been done to simplify the analysis of the technology’s feasibility as an
alternative to the current technology. Cost/benefit analysis could then be
carried out to discuss how it compares to current conventional technology.
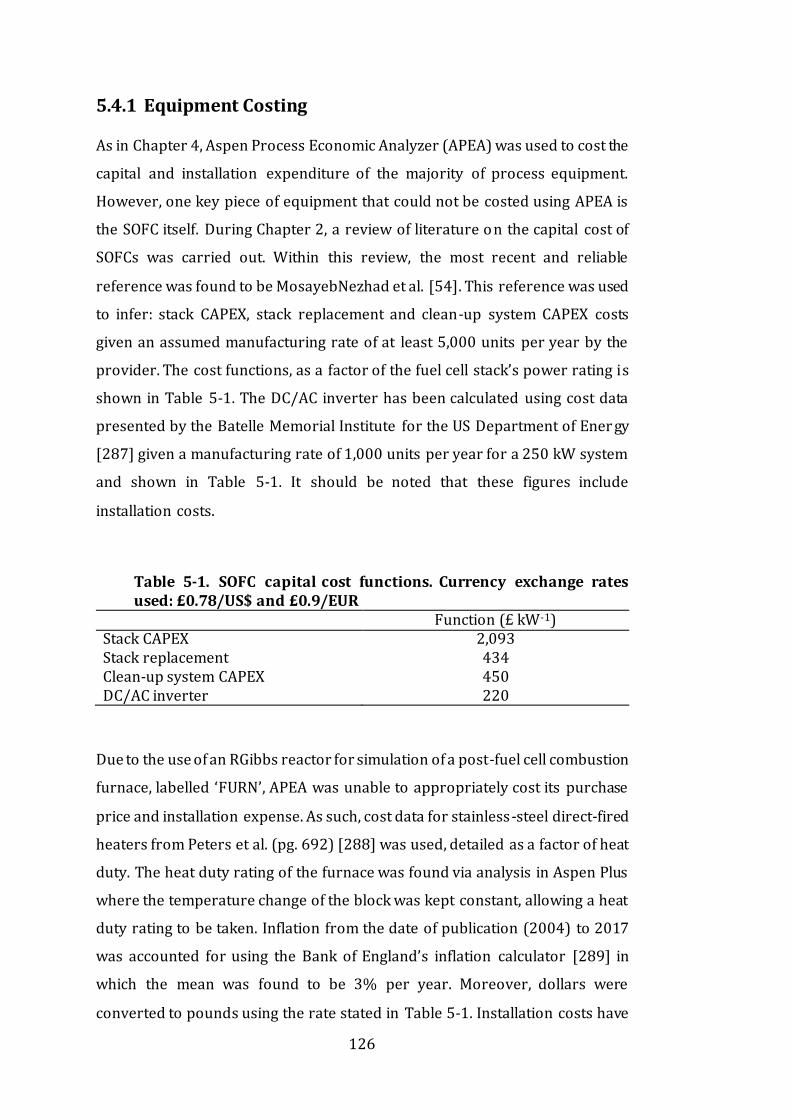
126
5.4.1 Equipment Costing
As in Chapter 4, Aspen Process Economic Analyzer (APEA) was used to cost the
capital and installation expenditure of the majority of process equipment.
However, one key piece of equipment that could not be costed using APEA is
the SOFC itself. During Chapter 2, a review of literature on the capital cost of
SOFCs was carried out. Within this review, the most recent and reliable
reference was found to be MosayebNezhad et al. [54]. This reference was used
to infer: stack CAPEX, stack replacement and clean-up system CAPEX costs
given an assumed manufacturing rate of at least 5,000 units per year by the
provider. The cost functions, as a factor of the fuel cell stack’s power rating is
shown in Table 5-1. The DC/AC inverter has been calculated using cost data
presented by the Batelle Memorial Institute for the US Department of Ener gy
[287] given a manufacturing rate of 1,000 units per year for a 250 kW system
and shown in Table 5-1. It should be noted that these figures include
installation costs.
Table 5-1. SOFC capital cost functions. Currency exchange rates used: £0.78/US$ and £0.9/EUR
Function (£ kW-1) Stack CAPEX 2,093 Stack replacement 434 Clean-up system CAPEX 450 DC/AC inverter 220
Due to the use of an RGibbs reactor for simulation of a post-fuel cell combustion
furnace, labelled ‘FURN’, APEA was unable to appropriately cost its purchase
price and installation expense. As such, cost data for stainless-steel direct-fired
heaters from Peters et al. (pg. 692) [288] was used, detailed as a factor of heat
duty. The heat duty rating of the furnace was found via analysis in Aspen Plus
where the temperature change of the block was kept constant, allowing a heat
duty rating to be taken. Inflation from the date of publication (2004) to 2017
was accounted for using the Bank of England’s inflation calculator [289] in
which the mean was found to be 3% per year. Moreover, dollars were
converted to pounds using the rate stated in Table 5-1. Installation costs have

127
been estimated using the mean of installation costs from Aspen Plus for
Equipment types over £100,000, which stands at 34%.
5.4.2 Economic Feasibility Analysis Methodology
The method of analysis for: operating labour, maintenance costs and net
present value (NPV) are as described in Chapter 4. The ‘product’ in the case of
this process implementation is the generation of heat and power. As such, the
income for the facility is comprised of the financial incentives for the renewable
generation of heat and power and the offset costs of the current usage. Income
from financial incentives have been projected using tariffs from the UK’s
Contracts for Difference (CfD) scheme and the renewable heat incentive (RHI)
scheme for renewable power and heat respectively. The CfD scheme works on
the principle that renewable energy generators should be guaranteed a price
for the power they produce to reduce the uncertainty that comes with market
fluctuations [239,243]. This value is labelled the ‘strike price’ and is indexed
according to inflation, whilst the average market price of electricity is labelled
the ‘reference price’. Under CfD, generators will be paid the difference between
the strike price and the reference price by the government. The strike price
given to generators depends on the technology type employed. The use of the
IR-SOFC in the discussed process would make the operators eligible for an
‘advanced conversion technology’ (ACT) rate. DECC [244] stated an
administrative strike price for ACTs at £140 MWh -1 during the first auction
round. As such, this figure has been utilised in the NPV analysis as the income
for electrical power generation from the SOFC, rather than the cost of abated
electricity use. However, any additions or reductions to the overall plant
demand have been taken into account.
The UK’s non-domestic renewable heat incentive (RHI) provides financial
support for thermal power production from renewable sources [290].
However, unlike the CfD scheme, there are no unique tariff rates for ACTs. As
such, the RHI payments have been based on the tariff rate applied to large
biogas combustion systems at 1.16p per kWhth, the lowest of all RHI tariffs

128
[291]. It has been conservatively estimated that half of the thermal power
generated from the fuel cell system will be used to fulfil the onsite WWTP heat
requirements. As such, this would offset the facility’s need to purchase thermal
energy in the form of natural gas. The price of which has been determined via
the equation 5-29:
𝐸ℎ𝑒𝑎𝑡 =0.5 𝑄𝑟×𝐶𝑁𝐺
ƞ𝑏𝑜𝑖𝑙𝑒𝑟 5-29
where, Eheat is the daily expenditure for heat (£ day-1) Qr is the system’s thermal
output (kWhth day-1), CNG is the price of natural gas (£ kWhth-1) and nboiler is the
standard boiler thermal efficiency at 80%.
5.4.3 Economic Sensitivity Analysis
Sensitivity analysis on the economic study has been carried out to investigate
the system’s feasibility under a number of different scenarios. Six scenarios
have been considered, as detailed in Table 5-2. These scenarios are intended to
represent viable circumstances such as the existence of current cogeneration
technology or biogas purification technology, receiving a lower CfD strike price
or none at all or an over/under projected capital investment cost.

129
Table 5-2. Economic Sensitivity: Scenario descriptions Description
Scenario 1 Plant has existing cogeneration technology in place. - Plant income is based on the economic difference
between the current cogeneration and that of the proposed system.
- CfD is not provided as the onsite electricity savings (£105 MWh-1) outweighs the potential CfD income of £80 MWh-1
- RHI income projected to be equivalent as novel system
- Biogas purification not included in projected current technology
Scenario 2 Plant has existing gas purification technology in place.
- Capital investment for pressure water scrubbing system omitted.
- Additional energy demand also omitted
Scenario 3 CfD strike price reduced to lowest auction price for ACTs - The lowest CfD strike at previous auction: £114
MWh-1.
Scenario 4 CfD unobtainable - There are currently very few ACT schemes that have
been awarded CfDs. - Income based on abated electricity use instead
Scenario 5 10% increase in total installation costs
- This work has an underestimated the investment costs by 10%.
Scenario 6 10% reduction in total installation costs
- This work has overestimated the investment costs by 10%.
5.5 Results and Discussion
5.5.1 Process Modelling Results
5.5.1.1 Ammonia Recovery
Table 5-3 shows the mass flow of various streams involved in the ammonia
recovery process. The stripping gas (EXH-A3), originating from the post-fuel
cell furnace, enters in at 566.8 °C and a total flow-rate of 230.5 kmol h-1. This

130
stream has a marginally higher temperature and lower flow-rate than the
associated stream discussed in Chapter 4’s ‘Combined Process’. This is
highlighted by the average stripper column temperature changing from 64.3°C
to 72.1°C, as shown in Table 5-4. However, all of the stream’s thermal energy
requirements are internally met from the heat generated in the fuel cell and
furnace.
Table 5-3. Ammonia recovery stream results (streams found in Figure 5-2)
BTMS1
BTMS4
CON-LIQA
EXH-A3
H2O LIQ1 LIQ2 S-
GAS1 UTILIT
Y2 WAT-AM-1
CH4 (kg h-1) 0.00 0.00 0.00 0.00 0.00 0.00 0.00 0.00 0.00 0.00
CO (kg h-1) 0.00 0.00 0.00 0.00 0.00 0.00 0.00 0.00 0.00 0.00
CO2 (kg h-1) 7.07 0.00 79.14 265.2
4 0.00 0.00 0.00
258.17
0.00 79.14
H2 (kg h-1) 0.00 0.00 0.00 0.00 0.00 0.00 0.00 0.00 0.00 0.00
H2O (kg h-1) 26197.
83 1504.
98 18.75
474.45
963.09
27537.44
27537.44
1814.06
28824.45
2486.81
N2 (kg h-1) 19.95 0.00 8.90 4644.
03 0.00 0.00 0.00
4624.08
0.00 8.90
NH3 (kg h-1) 0.03 0.01 45.64 0.00 0.01 50.27 50.27 50.25 0.00 45.66
O2 (kg h-1) 10.70 0.00 5.23 1035.
24 0.00 0.00 0.00
1024.55
0.00 5.23
Temperature (°C)
72.91 99.65 59.31 566.8
5 99.6
5 23.00 69.23 71.16 61.55 15.29
Pressure (bar)
1 1 1 1.1 1 1 1 1 1 1
Post-stripping, a lower flow rate of absorption water has been used, calculated
via the line of best fit equation calculated during absorption sensitivity analysis
in Chapter 4 (Figure 4-9). Despite, reduced flow-rates throughout the ammonia
recovery process, the distillate rate of the distillation column required
increasing to 6 kmol h-1 to meet sufficient ammonia recovery. This was due to
the presence of CO2, a volatile gas, originating from the furnace and remaining
throughout the recovery process, alters the required distillate rate in the
distillation column. This has the impact of increasing the heat duty (thermal
energy requirements) of the distiller which increases slightly to 332.8 kW, as
shown in in Table 5-4.

131
Table 5-4. Ammonia recovery block conditions Block STRIP ABSORP DIST
Condenser (°C) 71.2 26.1 59.3
Condenser heat duty (kW) 0 0 -3.7 Reboiler temperature (°C) 72.9 15.3 99.6
Reboiler heat duty (kW) 0 0 332.8
The conditions of the stripping column facilitate the initial recovery of 99.96%
of ammonia held in the digestate liquor and a final recovery of 90.8% after
distillation As shown in Table 5-3, this equates to a flow rate of 45.64 kg h-1.
However, the stream holding the recovered ammonia (CON-LIQA) from the top
of the distillation column also contains CO2. This occurs due to its presence in
the furnace exhaust which is used as the initial stripping gas. This could have
adverse consequences on the operation of the IR-SOFC. For example, it may
alter the power production potential by altering reforming thermodynamics. It
could also lead to greater carbon deposition in the anode of the IR-SOFC which
can impact the lifetime and catalysts of the stack. As such, it may be preferential
in real operation to remove the CO2 prior to stripping or use an alternate source
of stripping gas.
5.5.1.2 SOFC Operation
The mass flow composition of streams involved in the SOFC part of the process
model can be found in Table 5-5. The mass flows of water and biomethane
provides a molar H2O:CH4 (S:M) ratio of 2.5. With the inclusion of the carbon
dioxide in the stream CON-LIQA, the molar H2O:C (S:C) ratio in the SOFC is 2.3.
Inside the anode of the fuel cell, 100% of the methane converts through SMR
(reaction 5-2), 52% of the CO converts via the WGS (reaction 5-3) and 100% of
the ammonia converts via decomposition (reaction 5-4).

132
Table 5-5. SOFC operation stream results
H2O-B BM1 CON-LIQA
AN-IN-2
AIR3 O AN-EX CAT-EX2
EXH-A1
EXH-B1
CH4 (kg h-1) 0 343.0
6 0
343.06
0 0 0 0 0 0
CO (kg h-1) 0 0 0 0 0 0 287.5
1 0 0 0
CO2 (kg h-1) 0 0 79.14 79.14 0 0 568.5
2 0
265.24
754.91
H2 (kg h-1) 0 0 0 0.00 0 0 23.98 0 0 0
H2O (kg h-1) 963.0
9 0 18.75
981.84
0 0 1610.
47 0
474.45
1350.37
N2 (kg h-1) 0 0 0 0 17815
.17 0 46.44
17815.17
4644.03
13217.61
NH3 (kg h-1) 0.01 0 45.64 45.65 0 0 0 0 0 0
O2 (kg h-1) 0 0 0 0 5409.
40 1074.
31 0
4335.09
1035.24
2946.46
Temperature (°C) 100 23 59 700 867 867 910 910 1075 1075
Pressure (bar) 1.1 1 1 1.1 1.1 1.1 1.08 1.08 1 1
The air enters the cathode of the fuel cell at 867°C, dictated by the design
specification discussed in section 5.2. With a 20% oxygen utilisation factor,
1,074.3 kg h-1 of oxygen ions (simulated using O2) transports from the cathode
to the anode via stream ‘O’. This facilitates the electrochemical oxidation of
85% of the hydrogen generated at the anode; leaving an H2 outlet flow from the
anode of 23.98 kg h-1.
This hydrogen, alongside the unconverted carbon monoxide were used as fuels
in the furnace, where combustion takes place using oxygen from the cathode
outlet as the oxidant. The RGibbs reactor determines the exhaust temperature
via the minimisation of Gibbs free energy and considering a 10% thermal loss.
The exhaust, at 1,075°C, has been split into two streams, ‘EXH-A1’ and ‘EXH-
B1’, used to pre-heat the anode inlet and cathode inlet respectively. The former
is also eventually utilised as the stripping gas in the stripping column.
5.5.1.3 Thermal Power Production
There are three streams that are suitable for thermal power contribution to the
plant; ‘EXH-B2’, ‘BTMS4’ and ‘UTILITY2’. Their temperature, composition, flow
rate and power potential can be seen in Table 5-6. Note that the thermal power
potential of each stream has been calculated via a ‘Heater’ block which cools
the stream to 23°C and 1 bar conditions. The resultant heat duty of the ‘Heater’

133
block at 90% thermal efficiency has been inferred as the thermal power
contained in each stream. Table 5-6 also showcases the heat requirement of the
distillation column’s reboiler.
Table 5-6. Thermal power production analysis (positive values indicate net thermal power production, negative indicate consumption)
Composition
(mass %) Flow
(kg h-1) Temperature
(°C)
Thermal power (kW)
EXH-B2
N2 72 % O2 16 % H2O 7 % CO2 4 %
18269 121.54 1133.7
BTMS4 H2O 100 % 1505 99.64 122.9
UTILITY2 H2O 100 % 23960 69.5 1167.8
DIST Reboiler
-332.8
Total 2,091.6
The total heat output from the process model is shown in Table 5-6 as 2,091.6
kW. Given the quantity of methane and ammonia entering the system, this
provides a thermal efficiency of 42% on an LHV basis, calculated via 5-27. This
is slightly less than conventional combustion-based CHP systems which
classically operate at around 50% thermal efficiency. However, there is rarely
a deficit of heat production at wastewater treatment plants and therefore, this
reduction should not be problematic.
An issue that could arise, is the quality of heat generated. Table 5-6 shows that
only one of the three heat streams generated is above 100°C. Most of the heat
required at wastewater treatment plants is for anaerobic digestion and space
heating. As such, this shouldn’t be much of a concern. However, if high quality
heat is required for processes such as thermal hydrolysis, then a form of heat
upgrading should be employed.

134
5.5.2 Numerical Modelling Results
5.5.2.1 Model Validation
The numerical fuel cell model was first validated using data from the operation
of a Siemens-Westinghouse Power Generation Inc (SPGI) 120 kW SOFC, as
found in Williams et al. [292]. The coefficients used during numerical model
calculations and discussed in the methodology (Section 5.3) are detailed in
Table 5-7 and correspond to SPGI’s 120 kW SOFC.
Table 5-7. Coefficients used in SOFC numerical model
NA 2
NC 4
EAA J mol-1 110,000
EAC J mol-1 120,000
ƳA A m-2 3.6 × 10⁸
ƳC A m-2 3.5 × 10⁸
𝝆𝒂 Ω m 2.98 × 10⁻⁵ exp (1392/T)
𝜹𝒂 m 100 × 10-6
𝝆𝒄 Ω m 8.114 × 10⁻⁵ exp (600/T)
𝜹𝒄 m 2.2 × 10⁻³
𝝆𝒆 Ω m 2.94 × 10⁻⁵ exp (10,350/T)
𝜹𝒆 m 40 × 10-6
𝑫𝑶𝟐 m2 s-1 4.6 × 10⁻²
𝜺 0.39
𝝉 5.5
In order to correlate the data, a fuel inlet consisting of 89% H2 and 11% H2O
was used with a fuel utilisation factor of 0.85 and an operating temperature of
1,000 °C. The current density was altered between 1000-4000 A m-2 to produce
a polarisation curve with varying cell voltage. This was plotted against
operational data, as shown in Figure 5-3.

135
Figure 5-3. Polarisation curve showing experimental data of SPGI’s 120 kW SOFC from [292] and model data (from this work) using fuel composition 89% H2 11% H2O, Uf of 0.85 and operating temperature of 1000 °C.
Figure 5-3 illustrates the close match between model and experimental data
with an absolute percentage difference of just 1.15%. As such, it was concluded
with a strong degree of certainty that the results from the numerical model are
robust and representative of its potential real application.
5.5.2.2 Fuel Cell Operation and Power Production
It was found in the process model that the combination of the hydrogen
production reactions occurring in the anode of the IR-SOFC reaction 5-2 to
reaction 5-4 generate 159.85 kg of H2 per hour. This, combined with a fuel
utilisation factor of 0.85, creates a scenario where the partial pressure of
hydrogen at the anode’s TPB (pH2) was 0.678, the partial pressure of the steam
0.4
0.45
0.5
0.55
0.6
0.65
0.7
0.75
0.8
0.85
0.9
500 1000 1500 2000 2500 3000 3500 4000 4500
Cel
l Vol
tage
Current Density (A/m2)
Model Results (This study)
Experimental Data

136
in the anode outlet (pH2O) was 0.765, and the partial pressure of oxygen in the
cathode (pO2) was 0.227.
The resultant operating conditions of the fuel cell numerically modelled can be
found in Table 5-8. At a temperature of 910 °C and 1.08 bar, the current density
was calculated at 1820 A m-2. This provided a cell voltage of 0.74 V and the net
production of 58,111 kWh of AC power per day. Thus, using 5-26, it was
calculated the IR-SOFC would run with a net electrical efficiency (nelec,net) of
48% on an LHV-basis. This is a 37% increase on the efficiency provided by the
current CHP system employed at Esholt WWTP. This demonstrates the vast
improvement on the power production capable with the use of SOFCs at
WWTPs.
Table 5-8. SOFC operating conditions and results
Tcell °C 910
Pcell Bar 1.08
Fuel Utilisation 0.85
Air Utilisation 0.2
Current Density A m-2 1820
Anode Inlet Temp °C 700
Cathode Inlet Temp °C 867
Cell Voltage V 0.74
𝜂𝑒𝑙𝑒𝑐 ,𝑛𝑒𝑡 % 48
The main form of voltage losses occurred from activation polarisation at just
over 0.1 V. This is due to the relatively low current density employed by the fuel
cell which slows the rate of electrochemical reactions and the electrode surface
becomes less active [293]. Concentration losses were found to be just under
0.06 V. Ohmic losses proved to be the lowest form of voltage loss at just 0.001

137
V which is to be expected with the low current density utilised, where ohmic
polarisation is directly proportional to current density.
With 100% of ammonia cracking under reaction 5-4 the latter provides the
generation of a further 8.1 kg h-1 of hydrogen. This equates to 5.07% of the total
and corresponds to 2.95 MWh of electricity generated each day at the facility
via ammonia cracking at the anode’s TPB. Although the decomposition of
ammonia has an impact on the molar production of H2 and therefore overall
power output from the stack, its effect on cell voltage is limited because the
fractional molar concentration of H2 does not alter significantly. For every 3
moles of H2 generated during ammonia decomposition, 1 mole of N2 is also
generated. This helps to regulate the overall molar concentration of H2 at the
anode, which increases by just 0.8% when ammonia decomposition is taken
into account. This, in turn, has a similar minimal impact on the concentration of
H2O produced by the electrochemical oxidation of H2. As such, the introduction
of recovered ammonia has a negligible effect on cell voltage and gross
efficiency, but does impact significantly on the total power production of the
process.
5.5.2.3 Sensitivity Analysis at the SOFC
Various sensitivity analysis was carried out to investigate the impact if a
number of variables were changed. The percentage impact on net electrical,
thermal and CHP efficiency of each change in variable can be seen in Figure 5-4.
Firstly, the conversion of carbon monoxide via the WGS reaction was increased
and decreased by 50% of the original value to firstly understand the role the
WGS reaction has on the fuel cell’s operation and secondly to investigate what
would occur if the equilibrium was not facilitated by the fuel cell’s catalyst at
the anode’s TPB. When the WGS reaction efficiency is increased, as is the
hydrogen generated in the fuel cell. This boosts the electrochemical oxidation
of hydrogen via reaction 5-5 and therefore current generation, hence, the
5.17% increase in net electrical power generation. However, the incr ease in
hydrogen production means more air is required for pre-heating in ‘HX4’ and

138
reducing the availability of heat for export downstream thus lowering the
thermal efficiency by 4.31 %. Importantly, the opposite occurs if the WGS
carbon monoxide conversion efficiency is decreased with a decrease in net
electrical efficiency of 5.18% and increase in thermal efficiency of 4.38%.
Figure 5-4. Relative percentage impact on thermal (ntherm), net electrical (nelect, net) and combined efficiency (nCHP, net).
With the SOFC operating at just over atmospheric pressure, the sensitivity
carried out entailed just increasing it. When the operating pressure is increased
by 1 bar, the cell voltage increases by 17.8%, with the partial pressure of
contributing reactants and products having such an important impact on the
cell voltage. It is important to note that the net electrical efficiency (n elec,net)
accounts for the power required to compress the streams fed in to the SOFC.
Thus, Figure 5-4 showcases that the increase in power from the SOFC
outweighs the power required for compression, resulting in a 3.4% increase in
net electrical efficiency. However, this increased current production means the
fuel cell inlets require more heat to make up for reduction in internal thermal
transport. Resultantly, the thermal efficiency of the system reduces by 4.6%,
contributing to a small reduction in CHP efficiency of 0.2%.
-15% -10% -5% 0% 5% 10%
-90°C
+90°C
+ 1 bar
WGS +50%
WGS -50%
ᶯCHP,net ᶯtherm ᶯelec,net

139
Reducing the operating temperature by 90°C had the largest impact on net
electrical efficiency of all of the altered variables analysed with a reduction of
12.2%. Dropping the temperature causes a drop in the cell voltage and
therefore current and net electrical power. The reduced operating temperature
means considerably less heat is lost in the cell and less heat needs to be
exchanged with the fuel cell inlets. The result of this is a 10.75% increase in the
thermal efficiency of the system. The opposite mechanisms occur when cell
operating temperature is increased by 90 °C but with a less pronounced impact
on electrical efficiency which increases by 3.72% and a more pronounced
impact on thermal efficiency which reduced by 15.38%.
5.5.3 Wastewater Treatment Plant Impact: Energy and GHG
Emissions
Using Esholt WWTP as a representative case study, the modelled process has
the potential to divert 1,095 kg of NH3 each day. The resultant impact on GHG
emissions of doing so can be seen in Table 5-9. In Chapter 3, it was discussed
the estimated N2O emission factor from Esholt lie at 0.012 kg N2O N/ kg
TNinfluent. As such, this diversion of ammonia would decrease nitrous oxide
emissions by 10.81 kg per day. This corresponds to equivalent CO2 savings
(CO2e) of 3,222 kg per day based on a GWP (global warming potential) for N 2O
that is 298 times that of CO2 over a 100 year period. The overall impact of this
would be a 19% reduction in N2O emissions and almost an 8% reduction in
total greenhouse gas emissions due to the diversion of ammonia contained in
the facility’s digestate liquor. It should be noted that studies, such as
Kampschreur et al [17], have found vast variation in nitrous oxide emission
factors and real emission reductions could be far more or far less pronounced
as estimated.

140
Table 5-9. Table of GHG emission impacts due to ammonia diversion
NH3 Diversion (kg day-1) 1,095.49
N2O Reduction (kg day-1) 10.81
CO2e Reduction (kg day-1) 3,221.91
% of current N2O 19.14
% of current total GHGs 7.74
As discussed in Chapter 3, the current electricity demand at Esholt WWTP
stands at 60 MWh per day. 4.57 kWh of electricity is spent pumping air to
oxidise each kg of nitrogen in the facility’s activated sludge process (ASP) [57].
As such, the diversion of just over a tonne of ammonia each day reduces the
plant’s energy demand by a daily 4.12 MWh or just under 7% of its total. The
modelling from this chapter showed that the plant could also transition from
generating 40 MWh to 58.1 MWh on a daily basis. The pressure water scrubbing
unit that has been proposed for implementation at the facility demands 0.27
kWh per Nm3 of biogas. This equates to 5.24 MWh of electricity each day for
Esholt WWTP. As such the facility would transform from requiring 20 MWh of
grid electricity each day to just 3 MWh. The ability to attain this transformation
would be a colossal achievement for Esholt WWTP or other facilities of a similar
size and nature and should not be understated.
The 17 MWh a day of omitted grid electricity further reduces the plant’s carbon
footprint with the lifecycle emissions of GHGs associated with the UK’s
electricity grid. The carbon intensity of the electrical grid stands at 107 gCO2e
per kWh [294]. Thus, for Esholt WWTP, the reduced electricity consumption
would save a total of 1,819 kg CO2e each day. Combined with the GHG emission
savings experienced from the diversion of ammonia, process implementation
of the ammonia recovery/SOFC combined processes would reduce Esholt’s
GHG footprint by a total of 5,041 kg CO2e per day. This equates to 12.12% of the
total or 2.45 kg per year for each person serviced by the facility.

141
5.5.4 Economic Analysis
5.5.4.1 Equipment Cost
A summary of the equipment and total installation costs can be found in Table
5-10. With the 2.66 MW power requirement of the fuel cell, the total installed
cost of the SOFC, including replacement costs and clean-up system, has been
found to be £7.9 million. This equates to £2,970 per kW, which is considerably
more than the total installation costs for a combined-cycle gas turbine system,
as suggested by Leigh Fisher [295] at roughly £500 per kW. The fuel cell
represents the greatest capital cost by a considerable distance, comprising of
56% of the total capital investment.
Table 5-10. Equipment cost for combined ammonia-SOFC process
Name Equipment Cost [£] Installed Cost [£] SOFC 5,567,548.18 Biogas purification 1,926,179.71 Stack replacement costs 1,154,474.87 Stack clean-up system 1,197,036.16 CMPRS2 855,426.00 1,028,508.00 DC/AC converter 585,217.68 CMPRS3 416,286.00 537,030.00 CMPRS1 360,594.00 452,634.00 STRIP-tower 167,934.00 346,476.00 HX2 137,046.00 264,264.00 FURN 170,773.93 229,193.17 HX1 97,110.00 201,552.00 ABSORP-tower 59,358.00 178,464.00 DIST-tower 39,780.00 149,448.00 CNDNSR 12,558.00 84,942.00 DIST-cond acc 12,324.00 76,050.00 THERMOUT 10,062.00 64,038.00 DIST-reb 9,438.00 54,600.00 B2 3,198.00 22,074.00 DIST-reflux pump 3,588.00 21,606.00 HX4 7,058.22 9,472.73 HX5 1,764.36 2,367.92 14,153,176.42
At a total installed cost of just over £1.9 million, the biogas purification system
provides the second highest capital expense for the facility. This equates to

142
13.6% of the total installed cost. For various reasons, process model equipment
blocks FURN, HX4, HX5 and CNDNSR could not be costed using APEA.
Accordingly, the furnace price was determined using data from Peters et al.
[288] estimating a capital cost of £137,046 after inflation adjustments from
2004 levels. Similarly the heat exchangers HX4 and HX5 were costed using
Peters et al. [288]. The installation costs of these blocks was estimated at 34%
of the capital, as found via the mean of the blocks assessed via APEA. The
condenser (CNDNSR) had been simulated using a heater block with a
condensate stream, which APEA could not provide cost data for. As such, a
‘Flash2’ block was set up with the same flow rates to indicate the real cost of
the condenser; providing the figure displayed in Table 5-10.
5.5.4.2 Operational Costs
The combined ammonia recovery and SOFC process model consists of 19
different processing steps. There is an addition of 10 processing steps within
the biogas purification process; meaning the entire process would entail 29
stages. The labour requirement was calculated as in Equation 4-1 (Chapter 4),
providing a figure of the requirement of 16 full time personnel to operate the
equipment. This results in a first year wage expenditure of £607,500, rising
under the expected salary inflation of 2.99%.
Annual maintenance costs are proposed as 3% of the capital expenditure, as
stipulated in Chapter 4, facilitating a first year maintenance cost of £424,595.
The caustic requirements to appropriately basify the digestate liquor are as
proposed in Chapter 4, with a first year expenditure of £737. With the inclusion
of the biogas purification system, the entire electricity usage of the WWTP
increases by 1.11 MWh per day. At a purchasing cost of 10.55 p kWh -1, this
equates to additional maintenance cost of £42,769 in the first year. In total, this
amounts to an initial annual operational cost of £1,075,602, rising by 2.87% per
year under inflation.

143
5.5.4.3 Net Present Value for conventional cogeneration system
replacement
Table 5-11 details data generated during NPV analysis carried out for the
implementation of the discussed process at Esholt WWTP. The ‘income’ is
comprised of three factors: the revenue from the strike price dictated in a
contract for difference scheme (CfD), the abated thermal energy costs and RHI
revenue. This totals to £3,445,380 in the first year with CfD comprising roughly
86% of that, heat cost abatement 8% and RHI 6%.
Table 5-11. Net Present Value analysis for SOFC process integration at Esholt WWTP assuming a 10% discount factor
Annual Expense (£)
Annual Income (£)
Real Net Cash Flow
(£)
Net Present Value
(£)
Yr 0 14,153,176 -14,153,176 -14,153,176
Yr 1 1,075,602 3,445,380 -11,783,398 -11,998,833
Yr 2 1,063,207 3,544,289 -9,302,316 -9,948,352
Yr 3 1,094,475 3,646,037 -6,750,754 -8,031,325
Yr 4 1,126,664 3,750,707 -4,126,711 -6,239,069
Yr 5 1,159,799 3,858,381 -1,428,129 -4,563,462
Yr 6 1,193,909 3,969,146 1,347,108 -2,996,913
Yr 7 1,229,022 4,083,091 4,201,176 -1,532,324
Yr 8 1,265,169 4,200,307 7,136,314 -163,061
Yr 9 1,302,379 4,320,888 10,154,823 1,117,082
Yr 10 1,340,685 4,444,931 13,259,069 2,313,903
Yr 11 1,380,117 4,572,535 16,451,487 3,432,826
Yr 12 1,420,709 4,703,802 19,734,579 4,478,920
Yr 13 1,462,496 4,838,837 23,110,920 5,456,926
Yr 14 1,505,513 4,977,749 26,583,156 6,371,274
Yr 15 1,549,795 5,120,648 30,154,010 7,226,108
Yr 16 1,595,380 5,267,650 33,826,280 8,025,301
Yr 17 1,642,306 5,418,872 37,602,846 8,772,475
Yr 18 1,690,614 5,574,436 41,486,668 9,471,014
Yr 19 1,740,343 5,734,465 45,480,791 10,124,085
Yr 20 1,791,535 5,899,088 49,588,344 10,734,647
The ‘Real Net Cashflow’ shown in Table 5-11 describes the cumulative annual
income minus the cumulative annual expense. It can be used to detail how long

144
the initial capital investment is returned in real terms. This has also been
visually represented by the dotted line in Figure 5-5 and shows that the initial
capital investment would be paid back after 5.5 years. Over the 20 year lifetime
of the plant, a profit of £49.5 million can be expected in real terms.
Figure 5-5. Diagram of Net Cashflow and NPV with a 10% discount factor
Table 5-11 and Figure 5-5 also detail the annual NPV derived during analysis.
With a 10% discount factor, the system would achieve a positive NPV after a
little over 8 years. This means that just after 8 years, the investors will have
achieved an average of 10% annual return on their investment. Over the 20
year lifetime of the discussed plant, the operators will have received £10.7
million more than the required 10% annual return. This indicates that at the
end of lifetime for their current cogeneration system, the implementation of
this process is financially worthwhile.
-20,000,000
-10,000,000
0
10,000,000
20,000,000
30,000,000
40,000,000
50,000,000
0 1 2 3 4 5 6 7 8 9 10 11 12 13 14 15 16 17 18 19 20
Cas
hfl
ow
(£)
Year
Net Cashflow NPV

145
5.5.4.4 Sensitivity Analysis
The net cashflow and NPV results for each simulated scenario have been
illustrated in Figure 5-6. The graph for Scenario 1 clearly shows that if a
wastewater treatment facility, with the properties of Esholt WWTP, already has
cogeneration technology in place, then the introduction of the combined
ammonia recovery and SOFC cogeneration would not be financially viable. In
Scenario 1, neither the net cashflow nor NPV turns a profit over the plant’s 20
year lifetime. Thus, it can be said with a degree of certainty that this technology
should only be introduced to a wastewater treatment facility if at the end of life
period of any current cogeneration process or for a new-build site. However, it
should be recognised that this analysis did not account for any revenue
generated by the sale of current equipment. If a considerable amount of funds
could be generated in order to offset the initial capital investment, then its
feasibility may look more viable.
Occasionally, biogas purification technology is already in place at wastewater
treatment plants, in order to make combustion-based cogeneration a more
efficient and cleaner process or bio-methane production for the purpose of grid
injection. As such, if the discussed process was introduced without the need to
implement biogas purification technology, there would be a significant
reduction in the capital and operating expenditure. The results, as shown in the
Scenario 2 graph of Figure 5-6, indicate that the potential profitability of
process introduction can significantly improve under this scenario. With a pay-
back period reduction of a year and a positive NPV after just 6.5 compared to
the original 8 years.
During the most recent round of CfD allocation, the lowest strike price awarded
to an ACT system was £114 MWh-1. As such, Scenario 3 demonstrates what
impact this strike price would have on the process’ profitability compared to
the referenced strike price of £140 MWh-1. As demonstrated in the scenario 3
diagram of Figure 5-6, there would be a significant reduction in the process’
profitability under these circumstances. For example, the time taken to achieve
a positive NPV increases by roughly four years to the twelfth year of operation.
The end of life profit also reduces by almost £15 million to £35 million.

146
Nevertheless, even under this scenario an argument could still be made that is
financially worthwhile but the investors would require patience before
receiving their demands.
Figure 5-6. Sensitivity analysis: combined cash-flow and NPV diagrams. X-axis in number of years and Y-axis in £. Scenario 1: existing cogeneration technology; Scenario 2: existing biogas purification technology; Scenario 3: CfD contract lowered to £114 MWh-1; Scenario 4: failure to obtain CfD; Scenario 5: 10 % increase in capital expense; Scenario 6 10% decrease in capital expense.
In the case that the operators were unable to secure CfD funding (Scenario 4),
then the power-based income for process implementation would instead be the
offset purchasing of electricity (as it is with the heat production). At 10.55p per
kWh, this would reduce income by £732,000 in the first year. This has the
second greatest impact on the financial forecast of all investigated scenarios.
NPV does turn positive, but only after 14 years. This limits the attractiveness of

147
investing in the project as market uncertainties could turn financers away.
Under this scenario, real profits are still £30 million which equates to £3.2
million above the required average 10% annual return over the 20 year period.
Scenarios 5 and 6 speculate what the financial implications would be if the
capital investment projections were under or over-estimated by 10% (£1.4
million) respectively. As shown in Figure 5-6, the system is still economically
viable if investment costs are boosted. However, NPV takes 1.5 years longer to
turn positive and real payback takes 0.5 years longer. The fact, that the financial
forecast isn’t overly sensitive to a 10% rise in total investment costs should
provide investors with a sense of security. Alternatively, if the investment
figure falls by 10%, which is a plausible scenario in which R&D in SOFCs causes
such a reduction, the financial attractiveness of process implementation is even
greater. Scenario 6 in Figure 5-6 illustrates that the outlook is only slightly
bettered by Scenario 2 of all investigated options under the sensitivity analysis.
5.6 Constraints, Considerations and Further Work
The study carried out in this Chapter has been carried out under the
assumption that there is a continuous flow of biogas/biomethane. However, in
reality there are temporal variations in quantities of biogas generated and
concentrations of methane contained in biogas and ammonia contained in
digestate from AD. There are also periods of down-time where repairs or
cleaning must occur and with any novel process there is likely to be a settling-
in period where operators become accustomed with the system. This hasn’t
been accounted for in the process model, numerical model or financial analysis.
It is suggested that flows of biomethane are controlled as much as possible. This
would require an effective storage unit with enough buffering capability to
handle fluctuating flows. It is projected that the system would still be financially
sound with this addition due to the encouraging nature of economic analysis
shown in Figure 5-5. However, analysis with dynamic modelling is suggested in
any further work.

148
Due to the fledgling nature of SOFC technology, it is suggested that similar
cogeneration efficiencies will be achievable with lower temperature SOFCs in
the future. This could significantly reduce the capital investment expenditure
of process implementation and remove some uncertainty that is inevitable
when making such a considerable investment. When the technology readiness
level of intermediate temperature SOFCs becomes high enough, it is suggested
that the numerical modelling is repeated with updated data inputs.
It is also worth noting that this work has focussed on implementation at one
particular wastewater treatment facility, serving a sizeable population. Due to
the impact of ‘economies of scale’ theory, process implementation will be far
more viable at larger plants than smaller ones. As such, individual assessments
need to be carried out in the future for alternative plants to assess the
feasibility. For example, the same number of people will be required to run the
discussed plant regardless of scale. This would influence the operational
expenses considerably more than the plant’s income and would become far less
feasible.
Furthermore, the GHG emission analysis carried out did not include emissions
associated with the construction or embedded material emissions associated
with process implementation.. As such, it is recommended that future studies
incorporate a thorough lifecycle analysis which incorporates the production
and installation of materials associated with the discussed process.
5.7 Conclusions
In this Chapter, a number of analyses have been synthesised to facilitate a
thorough investigation into the feasibility and impact of implementing a
combined ammonia recovery and biomethane-ammonia fuelled SOFC process
at Esholt WWTP in West Yorkshire. The process modelling carried out in Aspen
Plus, demonstrated the ability to recover 90% of the ammonia initially
contained in the digestate liquor. This ammonia, diverted from the traditional
treatment process, was shown to contribute roughly 5% of the total energy
production and abates the GHG emissions equivalent to 8% of the WWTP’s

149
total. Combined with the saving of GHG emissions associated with the use of UK
grid electricity, implementation of the process is expected to reduce the
facility’s GHG emissions by 12.12% of its total or 2.45 kg per year for each
person serviced by the facility.
The combined ammonia recovery and biomethane-ammonia fuelled SOFC
process generates a net production of 58.1 MWh of electricity per day. The
diversion of ammonia was found to reduce plant energy demand by 4.12 MWh
each day. However, this is eclipsed by the energy demand for biogas
purification required to produce biomethane at 5.24 MWh. As such the total
plant energy consumption under this process implementation would be 61.1
MWh per day. However, the daily net energy consumption would be just 3 MWh
compared to the current 20 MWh.
An economic assessment has been carried out for the implementation of the
process at Esholt wastewater treatment plant, under the assumption that no
current cogeneration technology is in place. Net present value analysis was
performed in order to assess the potential financial attractiveness of process
implementation. The system introduction would require a significant initial
investment of £14.15 million. However, an initial annual ‘income’ of
£3,445,380 (based on energy expense savings and the renewable incentive
schemes of Contracts for Difference and Renewable Heat Incentive) dwarfs any
operational expenses and allows for a payback on investment in 5.5 years.
Additionally, a positive NPV is achieved after 8 years of operation with a
discount rate of 10%.

150
6 Hydrogen Production Process
6.1 Introduction and background
This chapter focusses on the applicability of utilising biomethane alongside the
ammonia recovered via methods discussed in Chapter 4, for the production of
H2. A robust process model has been developed in Aspen Plus to provide mass
flow, heat and power analysis. An economic model has also been developed to
explore the financial viability of process implementation. Thorough sensitivity
analysis has also been carried out to optimise the conditions and illustrate the
influence of uncertainty. Esholt WWTP has again been used as a reference plant
to give the study context and facilitate comparisons with the process
showcased in Chapter 6. There are three key catalytic reactions that occur in
the system that will generate H2; steam methane reforming (SMR), water-gas
shift (WGS) and ammonia decomposition.
6.1.1 Steam Methane Reforming
The SMR reaction is described in reaction 6-1. It is a highly endothermic
reversible equilibrium reaction, shown by its positive reaction enthalpy change
at 298 K (∆H298 ). The endothermicity means higher temperatures help shift the
reaction to the right, favouring H2 and CO production. Reaction 6-1 also details
how the product contains 4 moles of gas, compared to 2 moles on the reactant
side. As such, the forward reaction is also favoured by low pressure conditions.

151
CH4 + H2O 3H2 + CO ∆H298 = +206 kJ 𝑚𝑜𝑙𝐶𝐻4
−1 6-1
Ideally this reaction would be facilitated in a high temperature and low
pressure reactor. However, often in industry pressures of 20-30 bar are used
to allow the gas to pass over packed-bed reactors and the use of long, thin,
tubular reformers (12m, L/D ~100). The reformers, often in their hundreds,
help make the plant economically viable due to the large scale production and
the smaller piping sizes, reactor volumes and compact fluid movers afforded by
the higher pressures [296]. The reformer is typically operated between 800-
1000°C in which industry standard nickel-based catalysts can perform
unhindered [297]. The use of these temperatures and pressures corresponds
to incomplete conversions by steam reforming (60-70%), the unreacted fuel
later re-used after separation from the H2 product as furnace fuel to meet the
heat demand of reaction 6-1.
Another important factor to consider when steam reforming methane is the
quantity of steam used relative to the fuel feed. This is classically characterised
by a feed molar steam : carbon ratio (S:C). In industry, ratios between 2-4 are
used, despite a stoichiometric requirement of 1. This is carried o ut for three key
reasons. Firstly, to keep the SMR reaction equilibrium towards the product side
of reaction 6-1 under the working of Le Chatelier’s principle. As such, a higher
S:C enables increased equilibrium methane conversion and, therefore,
production of hydrogen as illustrated in Figure 6-1.

152
Figure 6-1. Effect of S:C and temperature on equilibrium methane conversions under SMR at 20 bar [136].
Figure 6-1 shows that under 20 bar conditions and a S:C ratio of 5, a
temperature of only 1000 K (727 °C )is required to achieve 70% methane
conversion. However, at the lower S:C of 2 it requires a temperature of over
1125 K (852 °C) in order to reach the same conversion, thus highlighting that
the choice of S:C can be significantly influential on the final yield of hydrogen.
Secondly, the S:C also effects the amount of carbon deposited on the catalyst in
real operation. Carbon deposition can occur via three main reactions: thermal
decomposition of methane (6-2), the bourdouard reaction (6-3) and the
reverse carbon-steam gasification (6-4). By increasing the S:C there will be an
equilibrium preference for the destruction of CH4 and CO from the SMR (6-1)
and WGS (6-5) reactions rather than decomposition via reactions 6-2 and 6-3
respectively. Furthermore, if carbon is deposited, a higher S:C will enable in its
removal via shifting the equilibrium of reaction 6-4 to the left. Thirdly, a higher
S:C allows for additional H2 production via an equilibrium preference for the
WGS reaction (6-5) which will be discussed further in section 6.1.2.
CH4 C + H2 ∆H298 = 75 kJ 𝑚𝑜𝑙𝐶𝐻4
−1 6-2

153
2CO C + CO2 ∆H298 = −172 kJ 𝑚𝑜𝑙𝐶𝑂−1 6-3
CO + H2 C + H2O ∆H298 = −41 kJ 𝑚𝑜𝑙𝐶𝑂−1 6-4
Although there is a clear thermodynamic preference for higher S:C, limitations
exist from a thermal efficiency point of view. If endothermic SMR reactions are
occurring at 800-1000 °C, a lot of energy and heat exchanger infrastructure is
required to get the feedstocks up to temperature and pressure. As such,
systems utilising greater S:C will need to spend more energy and money to
achieve adequate reforming. Thus, a balance must be struck between
thermodynamic and energetic performance of the process for optimal plant
thermal efficiency.
6.1.2 Water-gas Shift
In contrast to the SMR reaction, the WGS is exothermic with a reaction enthalpy
change of -41 kJ molCO-1 at 298 K. As such, to maintain a forward reaction, lower
temperatures are preferred compared to SMR. This is why separate reactors
are used, manipulating the operating conditions to provide a thermodynamic
preference in each reactor.
CO + H2O H2 + CO2 ∆H298 = −41 kJ 𝑚𝑜𝑙𝐶𝑂
−1 6-5
Typically, two reactors are used to achieve this. Firstly a high temperature
catalytic reactor (HT) reactor whereby the feedstock enters between 350°C and
500°C [298]. The exothermic nature of the WGS reaction and the isothermal
operation of the reactor creates a boost in the temperature which limits the
production of products in reaction 6-5. The syngas is then cooled before
entering a low temperature (LT) catalytic reactor between 150°C and 250°C
[298] and maximising H2 generation.

154
6.1.3 Ammonia Decomposition
The decomposition of ammonia can be seen in reaction 6-6 and is the reverse
of the Haber-Bosch ammonia synthesis reaction. The reaction is slightly
endothermic and the 2:4 molar ratio between reactants and products means
the forward reaction also prefers lower pressures.
2NH33H2 + N2 ∆H298𝐾 = +92 kJ 𝑚𝑜𝑙𝑁𝐻3
−1 6-6
A study by Yin et al. [154] showed that at 1 atm and 400 °C the equilibrium will
bring about a 99.1% conversion of ammonia. As such, SMR temperatures
between 800-1000 °C should bring about a high ammonia conversion.
Ammonia is rarely used as a hydrogen production feedstock. However, the
narrative has started changing in recent years with the feasibility of utilising
ammonia as a hydrogen storage medium with low associated carbon emissions
upon release of its H2 [153].
6.1.4 Economics of thermochemical hydrogen production
NERL have developed an economic model for hydrogen production via SMR
technology for a H2 production rate of 1,500 kg day-1 [299]. They have
calculated a total installed cost of $1,238,987 for the process in 2016 prices.
This includes $265,000 for the furnace and reformer, $216,000 for the WGS
reactors and $86,000 for the PSA unit. The NERL model also incorporates a
costing methodology for a refuelling station with capital, fixed and operating
calculations. The process includes units for compression, storage and
dispensing. For the 1,500 kg day-1 reference model, a total installed capital cost
of $4,495,132 was calculated. Labour, operations and maintenance costs were
found to be $0.54 per kg of H2 processed. Electricity use was found to be 2,230
MWh per year.
Moscowiz et al. [300] state that the current production cost of H2 production
via natural gas reforming is between €1 and €2 kg -1. They also state that the

155
cost of H2 produced by electrolysis is €3.50- 5 kg-1. However, Berger’s report
[301] for the Fuel Cells and Hydrogen Joint Undertaking (FCHJU) states that
expected prices for H2 are extremely variable, ranging €2-13 (£1.80-11.70) kg-
1 H2. They continue to state that the average expected H2 price at the “lower
end” of these price ranges would be about €6 (£5.40). Meanwhile, a report by
Reuter et al. [302] for the FCHJU calculated the cost of H2 per kg must be €4-6
(£3.6-5.4) kg-1 H2 in order to be competitive with diesel prices for bus-transport
sector. This showcases how uncertain and variable the market price of H 2 is,
can be and will be in the future with unpredictable levels of market penetration
and technology readiness levels.
6.2 Process Design
A chemical process model has been developed in Aspen Plus v8.8 [23] and
sensitivity analysis has been carried out to provide an energetically efficient
method of NH3 recovery from a low concentration ammonia solution,
representative of digestate liquor produced at the anaerobic digestion unit at a
wastewater treatment plant (as discussed in Chapter 4). This has been
combined in the present chapter with a process simulation for H2 generation
via a combination of the catalytic processes of steam bio-methane reforming,
water-gas-shift and ammonia decomposition. The following assumptions have
been utilised throughout:
Ambient conditions set at 1 bar, 23°C
Air composition assumed 79:21 split of N2:O2 only
Primary flows of biomethane and digestate liquor flows and ammonia
concentrations have been based on data from Esholt WWTP, West Yorkshire,
UK – as detailed in Chapter 3. In Aspen Plus, a ‘COMMON’ method filter with
‘ENRTL-RK’ base method have been used throughout, in line with the process
modelling carried out in Chapters 4 and 5. A short description of this method,

156
the filter and the function of blocks mentioned throughout can be found in
Table 4-1.
The process designed can be seen in Figure 6-2. The liquor enters the system at
LIQ-1 and is pre-heated via exchange with the bottoms outlet of the stripping
column in ‘HX2’, as a novel feature of heat integration between integrated
processes of ammonia recovery and downstream steam reforming/ammonia
cracking. The stripping column (STRIPPER), absorption column (ABSORB) and
distillation column (DIST) are all operationally set up as designed in Chapter 3.
The gaseous outlet from the distiller, carrying the concentrated ammonia, is
pressurised to 31 bar before mixing with a fraction of the distillation bottoms,
that quantity of which is dictated by a pre-determined S:C in the reformer. The
latter represents yet another novel integrated process feature between the
ammonia recovery and the steam reforming/ammonia cracking unit. This
combined stream, labelled ‘CON-LIQC’ is heated via a number of heat
exchangers (HX6, HX5 and HX9) before entering the primary reformer/cracker
(REFORMER) at 25 bar. Here, it meets a flow of pressurised biomethane in an
RGibbs reactor where the minimisation of Gibbs free energy is used to calculate
the product yields and syngas composition. The syngas produced from the
primary reformer expends heat via transfer with the reformer and furnace
inlets via heat exchangers ‘HX1’ and ‘HX4’. The syngas enters the HT-WGS and
LT-WGS reactors (also represented as RGibbs reactors) at 350°C and 205°C
inlet temperatures respectively, for maximum CO conversion to CO2 and
concurrent production of H2 from the water co-reactant. Each reactor operates
adiabatically, meaning there are no heat losses from the reactor and the
exothermic nature of the WGS reaction creates a temperature hike in each
reactor. The syngas is then cooled and dried before a PSA unit generates a pure
H2 product containing 90% of the H2 present in the PSA inlet.
A furnace has been used to generate heat for the process. It has been simulated
via an ‘RGibbs’ reactor and is fuelled by 27.7% of the AD-biomethane product
via the stream ‘CH4-FUEL’ together with any remaining H2, CH4 and CO present
in the PSA offgas (OFFGAS). The furnace then generates an excess of heat that
equates to 110% of the reformer requirements. This fulfils the heating

157
requirements of the reformer and accounts for 20% thermal losses. A 10%
pressure drop is experienced in each of the heat exchangers and reactors where
the inlet pressure is greater than atmospheric.
6.2.1 Calculator Blocks
A series of calculator blocks have been designed to fulfil some of the process
requirements. Equations 6-7 to 6-10 detail the Fortran statements entered in
each of the calculator blocks and describe the air flow required to maintain a
combustion excess air of 10%. These then communicate with the model to meet
the desired output.
In equations 6-7 to 6-10, �̇�𝑥,𝑦 describes the molar flow of species ‘y’ in stream
‘x’. Equation 6-7 details the requirement of an oxygen flow 1.1 times that of the
stoichiometric requirement. This ensures enough oxygen is fed to the furnace
to prevent inefficient combustion reactions and maintain an exhaust
temperature below 1100°C. Equation 6-8 ensure the quantity of N2 in stream
AIR-1 equates to a 79:21 ratio with oxygen. The calculator block described by
equation 6-9 ensures the quantity of water entered to the primary reformer
fulfils the predetermined S:C ratio. Equation 6-10 ensures that the heat
provided by the furnace is 120% that of the primary reformer requirements
(80% heat transfer), where HDFURNACE and HDREFORMER are the heat duties of the
furnace and reformer respectively.
�̇�𝐴𝐼𝑅 −1,𝑂2= 1.1 × (
�̇�𝑂𝐹𝐹𝐺𝐴𝑆,𝐻2+ �̇�𝑂𝐹𝐹𝐺𝐴𝑆,𝐶𝑂
2+2(�̇�𝑂𝐹𝐹𝐺𝐴𝑆,𝐶𝐻4
+ �̇�𝐶𝐻4−𝐹𝑈𝐸𝐿,𝐶𝐻4 )) 6-7
�̇�𝐴𝐼𝑅 −1,𝑁2= �̇�𝐴𝐼𝑅 −1,𝑂2
× 3.791 6-8
�̇�𝐵𝑇𝑀𝑆2 ,𝐻2 𝑂 = (𝑆: 𝐶) × �̇�𝐶𝐻4 −𝐶𝑂𝑀𝑃,𝐶𝐻4 6-9
𝐻𝐷𝐹𝑈𝑅𝑁𝐴𝐶𝐸 = −1.2 × 𝐻𝐷𝑅𝐸𝐹𝑂𝑅𝑀𝐸𝑅 6-10

158
6.2.2 Process Modelling Sensitivity Analysis Methodology
A thorough sensitivity analysis has been carried out to optimise the system and
unit conditions. As discussed in the Introduction, hydrogen generation can be
heightened with increasing reformer temperature and S:C. However, this leads
to a greater heat demand for the furnace and therefore less heat to export for
air stripping. As such, a study has been carried out which investigates the effect
of varying reformer temperature, and heat transfer in HX9 on the heat demand
for air stripping (via AIRHT) and the final production of H2 in stream ‘H2’. The
sensitivity analysis not only highlights the impact of primary reformer
temperature on the system’s production of H2 but indicates whether the
increased hydrogen gas generation is worthwhile, given the potential increase
in heat duty of AIRHT. The sensitivity study will also dictate optimum operating
conditions for each of the proposed S:Cs investigated. The following sensitivity
parameters have been utilised:
Primary reformer temperature: 600-1000°C at 25°C intervals.
‘CON-LIQF’ temperature from ‘HX9’: 700-1000°C at 25°C
‘BOTAIR4’ temperature from ‘HX10’: 200-550°C at 25°C

159
Fig
ure
6-2
. P
roce
ss F
low
shee
t fo
r a
mm
on
ia r
eco
very
-H2
pro
du
ctio
n m
od
el

160
Figure 6-2 Legend
LIQ1 Digestate liquor representative inlet LIQ2 Preheated digestate liquor EXH-A3 Compressed exhaust gas for inlet to stripper BTMS Hot liquid outlet from the stripping column BTMS-OUT Cooled liquid outlet from the stripping column S-GAS1 Gaseous outlet from the stripper containing desorbed NH3 S-GAS2 Cooled gaseous outlet from stripper CONDENSA Water condensed from the stripper’s gaseous outlet S-GAS3 Dry gaseous inlet to the absorber H2O Water inlet used for NH3 absorption EXIT LIQ Liquid outlet from absorber containing reabsorbed NH3 CON-LIQA Gaseous distillate stream from distiller containing
recovered NH3 CON-LIQB Compressed distillate BTMS1 Hot liquid outlet from distiller BTMS2 Hot liquid outlet from distiller used for steam reforming BTMS3 Hot liquid outlet from distiller used for heat recovery BTMS4 Pressurised hot liquid outlet from distiller used for steam
reforming CON-LIQC Combined ammonia and H2O stream UTILITY1 Cool water inlet for heat recovery from syngas UTILIT2 Hot water stream used as heating utility UTILITY3 Cooled utility stream CON-LIQ(D-F) Combined ammonia and H2O stream preheated for BIO-METH Biomethane inlet at ambient temperature and pressure CH4-COMP Split of Bio-CH4 for reforming CH4-HX Compressed Bio-CH4 for reforming CH4-REF Hot and compressed Bio-CH4 and reformer inlet CH4-FUEL Split of Bio-CH4 for furnace AIR-1 Air at ambient conditions for furnace AIR-2 Heated air for furnace inlet EXHAUST Exhaust stream from furnace EXHAUST2 Exhaust stream for heat recovery EXHAUST3 Cooled exhaust stream SYN-1 Syngas from primary reformer SYN-2 Syngas after exchange with biomethane SYN-3 Cool syngas for entrance to HT-WGS reactor SYN-4 Syngas from HT-WGS SYN-5 Syngas for entrance to LT-WGS SYN-(6-8) Syngas from LT-WGS used for various heat exchange SYN-9 Dry syngas for PSA inlet OFFGAS Offgas from PSA H2 High purity H2 product stream from PSA

161
6.3 Economic Analysis Methodology
As in Chapters 3, 4 and 5 most of the equipment base and installation costs have
been determined using Aspen Plus Economic Analyzer (APEA). However, in
order to convert the economic cost of various equipment types that are unable
to be accurately calculated by APEA, a method of cost scaling has been
implemented to convert the model developed by NREL [303] to the process
detailed in this chapter. The calculation to implement the scale estimation, as
detailed in [304] is shown in equation 6-11 and is known as the six-tenths factor
rule:
cost of equipment 𝑎 = (cost of equipment 𝑏) X0.6 6-11
where, cost of equipment a and b are the unknown and known unit cost, X is
the multiplication factor for the known capacity difference between unit a and
unit b (𝑎
𝑏), 0.6 represent the ‘scaling factor’ used as a rule of thumb to
approximate scaling costs. This cost estimation has been used to estimate the
potential equipment costs for the primary reformer, the two WGS reactors, the
PSA and the pre-PSA condenser. The 2016 prices detailed in the NREL model
[303] have been adjusted for 2018 prices using an annual RPI inflation of 2.87%
and a currency conversion of £0.78/US$, as detailed in Chapter 4. Installation
costs for these units have been based on the installation factors from similar
units in APEA.
Furthermore, the NREL model was also used to estimate equipment
replacement costs for each scenario [303]. The NREL model dictates a fixed
replacement cost after 5, 10 and 15 years of operation equivalent to 15%, 50%
and 15% respectively of the initial capital investment. Additionally, the process
model built in Aspen Plus does not account for compression, storage and
dispensing (CSD) of the generated hydrogen. As such the associated costs for
CSD detailed in the NREL model [303] have been scaled appropriately, using
equation 6-11 for the discussed economic analysis. In NREL’s model the
generated H2 is compressed to 700 bar ready for storage and eventual
dispensing to hydrogen-fuelled vehicles.

162
Catalyst costs have been estimated at $0.19 kg-1 H2 as detailed in Kaiwen et al.
[305]. Wage expenditure and maintenance costs have been calculated as in
Chapters 3, 4 and 5. The capital cost of block AIRHT has been estimated using
the cost curve for a stainless steel direct fired heater shown in Peters et al. (pg.
692) [288] adjusted by inflation. The projected market value has been set at
£4.50/kg H2 which is the mean of the values suggested by Reuter et al. [302] for
it to be competitive with diesel prices for bus-transport sector.
The required expenditure for heat has been determined using the requirements
of blocks AIRHT and DIST with a thermal transfer efficiency of 80% at a cost of
2.33 p/kWh as detailed in the BEIS report on gas and electricity prices in the
non-domestic sector [306]. The expenditure on electricity has been estimated
via the power consumption of each compressor and pump simulated in Aspen
Plus, and the power requirement of CSD calculated from the NREL economic
model [303], with the gas clean up system as discussed in Chapter 5, using an
electricity cost of 10.55 p kWh-1 as detailed by BEIS [306]. Renewable heat
incentive (RHI) income has been calculated via the heat generated by
EHAUST3, UTILITY3 and UTILIT5 at a price of 1.16 pence kWh -1. The market
price of hydrogen has been set at £4.50 kg-1 which was determined a reasonable
value based on the review of literature discussed in section 6.1.4. NPV analysis
has also been carried as detailed in Chapters 3, 4 and 5.
Due to the uncertainty of the economic analysis methodology which meshes a
number of techniques and sources, sensitivity analysis has been carried out to
indicate which factors will play an important role in the overall feasibility of
potential process integration. Figures for the hydrogen selling price, overall
annual expense, initial capital investment and catalyst cost have been altered
by +/- 15% to show the prospected impact on the systems overall profitability
in both non-discounted and NPV terms.

163
6.4 Results and Discussion
6.4.1 Sensitivity Analysis
Figure 6-3 shows the results of the sensitivity analysis carried out under S:C 4
conditions. Peak hydrogen production occurs at 1000 °C, generating 117 kg per
hour which is equivalent to 4.6 MW on a HHV basis, as shown in Figure 6-3. At
this reforming temperature, the temperature of CON-LIQF (provided by heat
transfer in HX9) was proved to have minimal effect on the amount of heat
available for air stripping. By increasing the temperature of CON-LIQF, the heat
requirements of the primary reformer decreases, meaning less heat is
demanded from the furnace. However, more heat is transferred from the
furnace exhaust in HX9 meaning approximately an equivalent amount of heat
is left for air stripping.
Figure 6-3. S:C 4 sensitivity analysis data detailing the effect of primary reformer temperature on H2 generation and stripping thermal requirements via AIRHT.
Under the S:C 4 scenario, at 1000 °C reformer temperature, the exhaust from
HX9 only carries enough thermal energy to pre-heat the stripping gas to 185°C.
As such 782 kWth is required in AIRHT to pre-heat BOTAIR4 to 550°C, as shown
in Figure 6-3. However, all of the stripping thermal requirements are met when

164
primary reformer temperatures below or equal to 800°C are used. At 800°C, 94
kg pf H2 per hour is generated from the system. This is 894 kWHHV less than at
the 1000°C reforming temperature scenario, as illustrated in Figure 6-3. Thus,
it can be said that the additional generation of hydrogen at a reformer
temperature of 1000°C is worthwhile as the increase in energy content (HHV -
basis) is superior to the additional energy used for stripping. Further analysis
of the process at this temperature has been shown in section 6.4.2.
Results from the sensitivity analysis under S:C 3 conditions have been
illustrated in Figure 6-4. The final production of H2 peaks at 115 kg per hour
(4.5 MWHHV) with a primary reformer temperature of 1000°C. This is 2 kg h-1
less than the S:C 4 condition at the same temperature; demonstrating the effect
of Le Chatelier’s principle in moving the SMR and WGS reactions forward.
Under the S:C 3 scenario a maximum temperature of 900°C can be transferred
to CON-LIQF via HX9. Above this temperature, not enough heat is left in the
exhaust to effectively pre-heat the gas used for air stripping. However, below
900 °C, the change in thermal energy remaining in the exhaust is negligible.
Under the S:C 3 scenario, the thermal requirements for air stripping are met up
to a primary reformer temperature of 850°C, in which 97 kg h -1 (3.8 MWHHV
equivalent) of H2 is generated from the system. Thus, the primary reformer can
operate at 50°C greater than under the S:C 4 scenario before additional energy
is required for air stripping. This is the case for two key reasons. Firstly, the
additional water/steam in the S:C scenario requires a greater transfer of heat
from the furnace exhaust in HX9. Secondly, the reformer has a larger demand
of heat from the furnace to maintain its operating temperature. As illustrated
in Figure 6-5, this is also demonstrated at a reformer temperature of 1000°C
whereby the additional energy requirement for air stripping via AIRHT is 615
kWth compared to 782 kWth at the same temperature under the S:C 4 scenario.
However, as under the S:C 4 scenario, the additional energy content of H2 of 690
kWHHV generated between 850 °C and 1000 °C outweighs the additional
thermal demand for air stripping at 615 kW th making the use of higher reformer
temperatures acceptable.

165
Figure 6-4. S:C 3 Sensitivity analysis data detailing the effect of primary reformer temperature on H2 generation and stripping thermal requirements via AIRHT.
Results from the sensitivity analysis under S:C 2 conditions have been
illustrated in Figure 6-5. As with the S:C 3 and 4 scenarios, peak hydrogen gas
production occurred at a primary reformer temperature of 1000 °C. This
temperature provided a system output of 108 kg h -1 of H2. This is 7 kg h-1 less
than the S:C 3 scenario and 9 kg h-1 less than the S:C 4 scenario; again
showcasing the impact of H2O flows under the Le Chatelier’s principle in
moving the SMR and WGS reactions forward. Under the S:C 2 scenario at 1000
°C, the effect of CON-LIQF temperature from HX9 on the energy for air stripping
is negligible. At a 1000 °C primary reformer temperature, enough thermal
energy is left in the exhaust to heat the stripping gas to 415 °C, meaning 296
kWth must be supplied at AIRHT. This is the lowest energy input for air
stripping required for all S:C scenarios considered when a primary reformer
temperature of 1000 °C is utilised. Again, this is because less energy from the
furnace and its exhaust gas is required to maintain the operating temperature
and pre-heat the steam inlet.

166
Figure 6-5. S:C 2 Sensitivity analysis data detailing the effect of primary reformer temperature on H2 generation and stripping thermal requirements via AIRHT.
As shown in Figure 6-5, the thermal requirements for air stripping is met up to
a reformer temperature of 925 °C. At this temperature, 101 kg h -1 (3.9 MWHHV
equivalent) of H2 is generated from the system. The 320 kWHHV of additional
hydrogen generated at 1000°C is greater than the 296 kW th energy required for
air stripping. As such, as with the other S:Cs, it has been decided that the higher
reformer temperatures should be used for the final process conditions.
If access to thermal power at the facility was limited and all thermal air
stripping requirements needed to be met internally, then the lower S:Cs would
facilitate a greater production of hydrogen. For example, the greatest H2
production that can be facilitated is 94 kg h -1 at 800°C under S:C 4 conditions,
97 kg h-1 at 850°C under S:C 3 conditions and 101 kg h -1 under S:C 2 conditions.
6.4.2 Final Process Conditions
6.4.2.1 S:C 4 scenario
Table 6-1 shows the stream compositions and mass flow results from Aspen
Plus under S:C 4 conditions with a primary reformer temperature of 1000 °C.
248 kg h-1 (15.45 kmol h-1) of methane enters the primary reformer in stream

167
CH4-REF and 98.9% is destroyed via the SMR reaction (reaction 6-1), exiting
via stream SYN-1. Table 6-1 also shows how 99.5% of the ammonia, entering
the reformer in stream CONC-LF, undergoes decomposition (reaction 6-6).
Furthermore, 32% of the CO generated during SMR reaction is then destroyed
via the WGS reaction (reaction 6-5). The recovered ammonia stream ‘CONC-LF’
contains 9.6 kg h-1 (0.3 kmol h-1) of O2. Each mole of oxygen gas destroys two
moles of H2 generated. The result of this is the generation of 109 kg h -1 of H2
from the primary reformer, as shown in stream SYN-1. 83.7% of this originates
from SMR, 9.1% from WGS and 7.2% from NH3 decomposition.
Table 6-1. H2 production-based stream compositions and mass flows for S:C 4 scenario
Stream CH4-COMP
CH4-REF
CONC-LF
SYN-1 SYN-3 SYN-4 SYN-6 H2
H2O (kg h-1) 0 0 1132 777 777 635 596 0
CH4 (kg h-1) 248 248 0 2.6 2.6 2.6 2.6 0
CO (kg h-1) 0 0 0 289 289 68 6 0
CO2 (kg h-1) 0 0 0 219 219 567 663 0
H2 (kg h-1) 0 0 0 109 109 125 130 117
C (kg h-1) 0 0 0 0 0 0 0 0
O2 (kg h-1) 0 0 9.6 0 0 0 0 0
N2 (kg h-1) 0 0 11.9 48.9 48.9 48.9 48.9 0
N2O (kg h-1) 0 0 0 0 0 0 0 0
NH3 (kg h-1) 0 0 45.3 0.25 0.25 0.25 0.25 0
NO (kg h-1) 0 0 0 0 0 0 0 0
NO2 (kg h-1) 0 0 0 0 0 0 0 0
Temperature (°C)
23 995 1000 1000 350 427 228 38
Pressure (bar) 1 25 25 22.5 18 16 13 13 Total mass flow (kg h-1)
248 248 1199 1446 1446 1446 1446 117
The syngas is cooled to 350 °C before it enters the HT-WGS reactor in stream
‘SYN-3’. 221 kg h-1 of the 289 kg h-1 (76%) of CO generated in the primary
reformer is destroyed in the HT-WGS via reaction 6-5. This produces an
additional 15.9 kg h-1 (7.9 kmol h-1) of hydrogen. The exothermic nature of this

168
reaction acts to increase the syngas temperature from 350 °C to 427 °C, as
shown in stream SYN-4 in Table 6-1. The syngas is cooled to 205 °C before
entering the LT-WGS. Here a further 4.4 kg h-1 (2.19 kmol h-1) of H2 is generated
from the conversion of 91% of the incoming CO to the LT-WGS. The syngas from
this block (SYN-6), then contains a flow of 130 kg h-1 of H2. The PSA is able to
retain 90% of this, producing a final output of 117 kg h -1 (57.9 kmol h-1) of H2.
Table 6-2 showcases the composition and mass flows of key streams
surrounding the furnace block (FURN) under the S:C 4 scenario. AIR-1 is
preheated to 610 °C containing the oxygen to be used as an oxidising agent for
combustion of CH4, H2, CO and NH3 from streams ‘OFFGAS’ and ‘CH4-FUEL’. The
combustion facilitates an exhaust temperature of 1025 °C and direct heat for
the primary reformer. The exhaust is able to pre-heat air stripping gas to just
185 °C, which leads to a 782 kWth requirement in AIRHT to reach a stripping
temperature of 550 °C.
Furthermore, the model has shown that under these furnace conditions, 0.7 kg
h-1 and 0.002 kg h-1 of NO and NO2 respectively. Collectively termed as NOx,
they are known air pollutants, causing smog, ozone and acid rain [307]. It was
found via a brief sensitivity analysis, that when H2 was omitted from the stream
‘OFFGAS’, the quantity of NOx formed drops by 75%. This could be the case
because the presence of hydrogen increases the operating temperature of the
furnace, facilitating increased NOx formation. The generation of NOx contained
in the exhaust is just 0.02% on a molar basis and should be deemed acceptable.
However, the furnace has been simulated by an RGibbs reactor which uses the
minimisation of Gibbs free energy to calculate the product yields. NOx
formation tends to be kinetically, rather than thermodynamically (equilibrium)
determined. Thus, NOx emissions could be greater or lower than what has been
predicted by the RGibbs reactor under real operating conditions. Thus, further
analysis could deserve attention in future work to better understand the
operating conditions required to keep NOx emissions down.

169
Table 6-2. Furnace-based stream compositions for S:C 4 scenario Stream AIR-1 AIR-2 OFFGAS CH4-
FUEL EXHAUST EXHAUST2
H2O (kg h-1) 0 0 0.1 0 336 336
CH4 (kg h-1) 0 0 2.6 95.2 0 0
CO (kg h-1) 0 0 6.1 0 0.0004 0.0004
CO2 (kg h-1) 0 0 663 0 941 941
H2 (kg h-1) 0 0 13.0 0 0 0
C (kg h-1) 0 0 0 0 0 0
O2 (kg h-1) 546 546 0 0 49 49
N2 (kg h-1) 1802 1802 48.9 0 1851 1851
N2O (kg h-1) 0 0 0 0 0 0
NH3 (kg h-1) 0 0 0.2 0 0 0
NO (kg h-1) 0 0 0 0 0.7 0.7
NO2 (kg h-1) 0 0 0 0 0.002 0.002
Temperature (°C) 23 803 38 23 1158 270
Pressure (bar) 1 1 13 1 1 1
Total mass flow (kg h-1)
2348 2348 734 95 3178 3178
Table 6-3 shows the sources and sinks of heat in the process. Together, the
heater used to pre-heat the stripping gas to 550 °C (AIRHT) and the distillation
column’s reboiler require 1.08 MW of heat. The three streams ‘EXHAUST3’,
‘UTILITY3’ and ‘UTILITY5’ provide the potential for heat export from the
system. Their potential heat production have been simulated by cooling them
to 23 °C and 1 bar via Heater blocks in Aspen Plus. The respective results shown
in Table 6-3 detail the heat duty results from these heater blocks with a 90%
efficiency factor. The consequence of this is the potential production of 1.55
MW of heat but a net genearation of 400.9 kW th or 9.6 MWhth per day.

170
Table 6-3. Heat consumption and production for S:C 4 scenario Heat Demand (kWth) Blocks AIRHT 781.6 DIST Reboiler 365.5 Streams EXHAUST3 -280.4 UTILITY3 -405.3 UTILITY5 -862.3
Net Total (kWth) -400.9 Net Total (kWhth day-1) -9,621.69
Despite producing a reasonable quantity of net heat, the quality of the heat is of
a low calibre. Exhaust 3 holds the highest temperature of 120°C under the S:C
4 scenario but holds the lowest quantity of heat, limiting its potential
application. UTILITY3 and UTILITY5 are at 95 and 63°C respectively. However,
it is proposed that these streams would be suitable for AD and space heating
purposes. The AIRHT and distillation column’s reboiler will require higher
quality heat streams in order to meet their requirements.
Table 6-4 shows the system’s power consumption via each compressor and
pump. CMPR3 requires the greatest amount of power at 70.5 kW in order to
compress the biomethane for reforming to 27.8 bar. Naturally, the pump used
for liquid water pumping from the distillation bottoms has the lowest power
demand at 3.2 kW. This process produces a product in H2 gas, rather than CHP
as in Chapter 5. As such, the process’ power demand will have to be met using
grid electricity, simultaneously increasing system operating costs.
Table 6-4. Power consumption for S:C 4 scenario Blocks Power Demand (kW) CMPRS1 64.7 CMPRS2 24.5 CMPRS3 70.5 B10 3.2 Total (kW) 162.8 Total (kWh day-1) 3907

171
6.4.2.2 S:C 3 scenario
Table 6-5 shows the stream compositions and mass flow results from Aspen
Plus under S:C 3 conditions with a primary reformer temperature of 1000 °C.
248 kg h-1 (15.45 kmol h-1) of methane enters the primary reformer in stream
CH4-REF and 97.9% of it is destroyed via SMR (reaction 6-1), exiting via SYN-
1. The lower flow of steam in the S:C 3 scenario means its role in shifting the
equilibrium of reaction 6-1 to the right is slightly less pronounced. Thus,
methane’s conversion is slightly less than the S:C 4 scenario’s 98.9%.
Furthermore, the effect of the lower S:C has a more significant impact on the
role of the WGS reaction (6-5) in the primary reformer. In the S:C 3 scenario,
25% of the CO generated from SMR is converted to hydrogen compared to 32%
under S:C 4 conditions. However, the conversion of ammonia is very similar to
S:C 4, at 99.4%. The greater concentration of hydrogen in the product syngas,
compared to S:C 4 conditions, means the equilibrium of reaction 6-6 is shifted
marginally to the left.
The combination of these reactions result in the production of 53.1 kmol h-1 of
H2 in the primary reformer. 85.4% from SMR, 7.2% from WGS and 7.5% from
NH3 decomposition. The S:C has a much more pronounced impact on SMR and
WGS, thus ammonia decomposition has a greater percentage contribution to
the H2 generated than under the S:C 4 scenario. Again, the O2 contained in
stream CON-LIQF acts to destroy 0.6 kmol h-1 of H2 via combustion, reducing
the final output of H2 from the reformer to 52.5 kmol h-1 or 106 kg h-1 as shown
in Table 6-5.

172
Table 6-5. H2 production-based stream compositions and mass flows for S:C 3 scenario
Stream CH4-COMP
CH4-REF
CONC-LF
SYN-1
SYN-3
SYN-4
SYN-6
H2
H2O (kg h-1) 0 0 854 523 523 387 329 0
CH4 (kg h-1) 248 248 0 5.2 5.2 5.2 5.2 0
CO (kg h-1) 0 0 0 317 317 105 14 0
CO2 (kg h-1) 0 0 0 168 168 501 643 0
H2 (kg h-1) 0 0 0 106 106 121 128 115
C (kg h-1) 0 0 0 0 0 0 0 0
O2 (kg h-1) 0 0 10 0 0 0 0 0
N2 (kg h-1) 0 0 12 49 49 49 49 0
N2O (kg h-1) 0 0 0 0 0 0 0 0
NH3 (kg h-1) 0 0 45 0.27 0.27 0.27 0.27 0
NO (kg h-1) 0 0 0 0 0 0 0 0
NO2 (kg h-1) 0 0 0 0 0 0 0 0
Temperature (°C)
23 995 900 1000 350 438 244 38
Pressure (bar)
1 25 25 23 18 16 13 13
Total mass flow (kg h-1)
248 248 920 1168 1168 1168 1168 115
After cooling to 350 °C before entrance to the HT-WGS reactor, 67% of the 317
kg h-1 contained in the primary reformer outlet are destroyed in the HT-WGS
reactor via reaction 6-5. This creates additional 15 kg h-1 of H2 and leaves a 105
kg h-1 flow of CO to the LT-WGS reactor, whilst increasing the syngas
temperature to 438 °C. In the LT-WGS reactor, 86% of the incoming CO are
converted to H2 and CO2, boosting the flow of H2 to 128 kg h-1. These
conversions are lower than under the S:C 4 scenario because the decreased
flow of water negatively impacts the placement of equilibrium under the WGS
reaction (6-5). This results in the retention of 14 kg h-1 of unconverted CO
compared to 6 kg h-1 under S:C 4 conditions. Furthermore, the final output of
H2 from the PSA is 115 kg h1- compared to 117 kg h-1 in the S:C 4 scenario.
Table 6-6 showcases the composition and mass flows of key streams
surrounding the furnace block (FURN) under S:C 3 conditions. AIR-1 is

173
preheated to 641 °C in HX4. The combustion of CH4, H2, CO and NH3 from
streams ‘OFFGAS’ and ‘CH4-FUEL’ results in an exhaust temperature of 1039 °C
and enough heat to meet the demands of the primary reformer. The exhaust is
able to preheat stripping gas to 265 °C in HX10, 80 °C greater than under the
S:C 4 scenario. This is the case because the lower flow of water required under
S:C 3 conditions means less heat is needed to pre-heat CON-LIQE and maintain
primary reforming temperature.
Table 6-6. Furnace-based stream compositions for S:C 3 scenario
Stream AIR-1 AIR-2 CH4-FUEL
OFFGAS EXHAUST EXHAUST2
H2O (kg h-1) 0 0 0 0.1 340 340
CH4 (kg h-1) 0 0 95.2 5.2 0 0
CO (kg h-1) 0 0 0 14 0 0
CO2 (kg h-1) 0 0 0 643 941 941
H2 (kg h-1) 0 0 0 12.8 0 0
C (kg h-1) 0 0 0 0 0 0
O2 (kg h-1) 552 552 0 0 41 41
N2 (kg h-1) 1822 1822 0 49 1871 1871
N2O (kg h-1) 0 0 0 0 0 0
NH3 (kg h-1) 0 0 0 0.3 0 0
NO (kg h-1) 0 0 0 0 0.3 0.3
NO2 (kg h-1) 0 0 0 0 0.001 0.001
Temperature (°C) 23 641 23 38 1039 454
Pressure (bar) 1 1 1 13 1 1
Total mass flow (kg h-1)
2374 2374 95 725 340 340
Table 6-6 also illustrates how the model predicts the generation of 0.3 and
0.001 kg h-1 of NO and NO2 respectively in the exhaust gas. It is suggested that
this less than under the S:C 4 because the furnace is operating at a lower
temperature than under the previously discussed scenario, thus dropping the
formation of NOx. However, as discussed under S:C 4 conditions, it is

174
questionable whether this prediction of NOx generation is reliable due to NOx
formation being kinetically, rather than thermodynamically determined.
Table 6-7 shows the sources and sinks of heat in the process under the S:C 3
scenario. The thermal requirements in AIRHT is 166.2 kW th less than under the
S:C 4 scenario. This is because comparatively more heat is carried in the
exhaust gas so the stripping gas is warmer when entering AIRHT. The
distillation column’s heat demand is constant and irrespective of the S:C. Again,
the potential heat production from streams ‘EXHAUST3’, ‘UTILITY3’ and
‘UTILITY5’ have been simulated by cooling them to 23 °C and 1 bar via Heater
blocks in Aspen Plus with a 90% efficiency factor. As shown in Table 6-7,
‘EXHAUST3’, ‘UTILITY3’ and ‘UTILITY5’ could produce 250, 292 and 862 kW of
thermal power respectively. The result of this is the net generation of 423 kWth
or 10.1 MWh day-1 of thermal power, 5.4% more than under the S:C 4 scenario.
Table 6-7. Heat consumption and production for S:C 3 scenario Heat Demand (kWth)
Blocks AIRHT 615.4 DIST Reboiler 365.5
Streams EXHAUST3 -249.8 UTILITY3 -291.6 UTILITY5 -862.3
Net Total (kWth) -422.8 Net Total (kWhth day-1) -10,147
As under the S:C 4 scenario, the quality of the heat generated is not of the
highest calibre. ‘EXHAUST3’, ‘UTILITY3’ and ‘UTILITY5’ hold temperatures of
just 88 °C, 75° and 63 °C respectively. As such, they are not of high enough
quality to meet the demands of blocks AIRHT and DIST. As such, an external
source of high quality heat may be required to meet these demands. However,
it is proposed that these streams would be adequate for AD and space heating
at the wastewater treatment facility. Thus, suitable for an additional income
under the RHI scheme. The system’s electrical power requirements are

175
identical as under the S:C 4 scenario, shown in Table 6-4, totalling at 162.8 kW.
Thus the process will still require 3.9 MWh of grid electricity per day.
6.4.2.3 S:C 2 scenario
Table 6-8 shows the stream compositions and mass flow results from Aspen
Plus under S:C 2 conditions with a primary reformer temperature of 1000 °C.
In the primary reformer, 94.8% of the 248 kg h -1 of incoming methane is
destroyed via SMR (reaction 6-1). This, again, showcases the influence of the
lower flows of steam in moving the SMR reaction forward via the influence of
Le Chatelier’s principle when compared to the methane conversions of 99.5%
and 97.9% under the S:C 4 and S:C 3 scenarios respectively.
The lower S:C ratio also has a significant impact on the WGS reaction (6-5) in
the primary reformer. Under S:C 3 conditions, just 16% of the CO produced via
SMR is converted to H2 and CO2 via WGS compared to 32% and 25% under the
S:C 4 and S:C 3 scenarios respectively. The S:C ratio has a more pronounced
impact on the WGS reaction compared to the SMR reaction in the primary
reformer because the reaction is exothermic, the equilibrium shifts leftwards
under high temperatures. Thus, at 1000 °C, the S:C ratio has a greater impact
on pushing the equilibrium back right. The conversion of ammonia under the
decomposition reaction (6-6) in the primary reformer remains high at 99.3%.
It is expected that the conversion is very slightly less than under S:C 4 and S:C
3 scenarios because the higher concentration of hydrogen in the syngas pushed
reaction 6-6 marginally to the left.
The combination of reactions 6-1-6-6 produces 50.2 kmol h-1 of H2 in the
primary reformer under S:C 2 conditions. Of this, 87.5% originates from SMR,
4.7% from WGS and 7.9% from NH3 decomposition. However, the O2 contained
in stream CON-LIQF destroys 0.6 kmol h-1 of H2 via combustion, resulting in a
release of 49.7 kmol h-1 or 100 kg h-1 of H2. This is considerably less than under
S:C 4 (109 kg h-1) and S:C 3 (106 kg h-1) conditions. The recovered ammonia has
a greater impact on the production of H2 because SMR and WGS reactions are
impacted so significantly.

176
Table 6-8. H2 production-based stream compositions and mass flows for S:C 2 scenario
Because of the limited impact of the WGS reaction in the primary reformer
under S:C 2 conditions, a comparatively large flow of unconverted CO enters
the HT-WGS reactor (344.7 kg h-1). 50.7% of this is destroyed in the HT-WGS
block, generating 12.6 kg h-1 of H2 and 274.3 kg h-1 of CO2 via reaction 6-5. 66%
of the CO entering the LT-WGS are then destroyed, topping the H2 generation
in the syngas to 120.8 kg h-1, leaving a remaining CO flow of 57.4 kg h-1. This is
a significantly greater quantity of CO than under the S:C 3 scenario at 14 kg h -1
and the S:C 4 scenario at 6 kg h-1. This again demonstrates the significance of
S:C ratios on reactions 6-1 and 6-5. The PSA with the ability to recover 90% of
the incoming H2 facilitates a final production of 108.7 kg h -1.
Stream CH4-COMP
CH4-REF
CONC-LF
SYN-1 SYN-3 SYN-4 SYN-6 H2
H2O (kg h-1) 0 0 575.2 279.8 279.8 167.5 95.0 0
CH4 (kg h-1) 247.9 247.9 0 12.9 12.9 12.9 12.9 0
CO (kg h-1) 0 0 0 344.7 344.7 170.1 57.4 0
CO2 (kg h-1) 0 0 0 103.2 103.2 377.5 554.5 0
H2 (kg h-1) 0 0 0 100.1 100.1 112.7 120.8 108.7
O2 (kg h-1) 0 0 9.6 0 0 0 0 0
N2 (kg h-1) 0 0 11.9 48.8 48.8 48.8 48.8 0
N2O (kg h-1) 0 0 0 0 0 0 0 0
NH3 (kg h-1) 0 0 45.2 0.3 0.3 0.3 0.3 0
NO (kg h-1) 0 0 0 0 0 0 0 0
NO2 (kg h-1) 0 0 0 0 0 0 0 0
C (kg h-1) 0 0 0 0 0 0 0 0
Pressure (bar)
1 25 25 22.5 18.2 16.4 13.3 38
Temperature (°C)
23 995 700 1000 350 439 265 13
Total mass flow (kg h-1)
247.9 247.9 641.8 889.7 889.7 889.7 889.7 108.7
177
Table 6-9. Furnace-based stream compositions for S:C 2 scenario Stream AIR-1 AIR-2 CH4-FUEL EXHAUST EXHAUST2 OFFGAS
H2O (kg h-1) 0 0 0 351.15 351.15 0.1
CH4 (kg h-1) 0 0 95.2 0 0 12.9
CO (kg h-1) 0 0 0 0 0 57.4
CO2 (kg h-1) 0 0 0 941.10 941.10 554.5
H2 (kg h-1) 0 0 0 0 0 12.1
O2 (kg h-1) 579.5 579.5 0 19.33 19.33 0
N2 (kg h-1) 1912.2 1912.2 0 1961.21 1961.21 48.8
N2O (kg h-1) 0 0 0 0 0 0
NH3 (kg h-1) 0 0 0 0 0 0.3
NO (kg h-1) 0 0 0 0.22 0.22 0
NO2 (kg h-1) 0 0 0 0.0005 0.0005 0
C (kg h-1) 0 0 0 0 0 0
Pressure (bar)
1 1 1 1 1 12.96
Temperature (°C)
23 460 23 1038 751 38
Total mass flow (kg h-1)
2492 2492 95.2 3273.0 3273.0 686
Table 6-9 details key stream compositions and mass flows surrounding the
system’s furnace under the S:C 2 scenario. Air-1 is pre-heated to 460°C in HX4,
enabling the combustion of fuels contained in streams ‘CH4-FUEL’ and
‘OFFGAS’. The exhaust gas, exiting at 1038°C is capable of preheating the
stripping gas to 415 °C, 150 °C more than under S:C 3 conditions and 230 °C
greater than under S:C 4 conditions. This highlights that although the lower S:C
ratios have a negative impact on H2 generation, there is a far greater ability to
retain heat due to the extra demand required for pre-heating water and
maintaining its temperature in the primary reformer.
Table 6-10 shows the heat sources and sinks in the process under S:C 2
conditions. The thermal requirements of the AIRHT heater is considerably less
than under the other two S:C scenarios at 296.4 kW th which is 38% that of its
heat demand under the S:C 4 scenario. The potential heat production from
streams ‘EXHAUST3’, ‘UTILITY3’ and ‘UTILITY5’ have been simulated by

178
cooling them to 23 °C and 1 bar via Heater blocks in Aspen Plus with a 90%
efficiency factor. The sum of these three heat streams equates to 1.3 MW th,
resulting in a system net production of 627 kW th or 15 MWhth per day. This is
48% greater than under S:C 3 conditions and 56% more than under the S:C 4
scenario.
Table 6-10. Heat consumption and production for S:C 2 scenario Heat Demand (kWth)
Blocks AIRHT 296.4 DIST Reboiler 365.5 Streams EXHAUST3 -237.3 UTILITY3 -189.1 UTILITY5 -862.3 Net Total (kWth) -626.8 Net Total (kWhth day-1) -15,043
However, as under the other S:C scenarios, the quality of the heat available for
export is of fairly low quality. Despite the S:C 2 scenario generating a greater
quantity of heat than S:C 3 and 4 scenario, the quality is lower with ‘EXHAUST3’,
‘UTILITY3’ and ‘UTILITY5’ hold temperatures of just 65 °C, 57 °C and 63 °C
respectively. These are not of high enough to meet the demands of the AIRHT
and distiller’s reboiler. However, they are not without use and could be utilised
for space and AD heating at the wastewater treatment facility and therefore
eligible for RHI income. The system’s electrical power requirements are
identical as under the S:C 4 scenario, shown in Table 6-4, totalling at 162.8 kW.
6.4.3 Economic Analysis
6.4.3.1 Steam:Carbon 4 scenario
Table 6-11 shows the total installed costs for each equipment block modelled
in the discussed Aspen Plus process model along with the estimated cost of gas
clean-up and CSD technology under the S:C 4 scenario. It requires the highest

179
initial capital investment of each S:C scenario at £13,293,229. The additional
expense is attributed to the handling of greater flows of steam and H2 product
which require additional material. The highest single unit cost is for the
CMPRS2 block at £990,054. The investment for the compression, storage and
dispensing system is estimated to make up over 40% of the total installed cost
at £5,395,711.
Table 6-11. Total installed cost breakdown for S:C 4 scenario Equipment block Installed Cost (£) Equipment
block Installed Cost (£)
CSD 5,395,711 PSA 173,768
CMPRS2 990,054 HX4 110,526
CMPRS3 988,416 COND1 84,942
Gas Clean Up 933,688 HX5 83,304
AIRHT 761,707 HX10 82,758
CMPRS1 577,902 COND2 74,150
REFORMER 557,643 HX7 58,734
HT 462,953 B10 57,486
LT 462,953 HX8 49,374
STRIPPER 348,348 HX9 49,017
DIST 306,072 HX6 44,694 HX3 204,126 HX1 27,708
HX2 200,382 FURNACE 26,086 ABSORP 180,726
Total 13,293,229
Figure 6-6 illustrates the temporal change in net cashflow and NPV over the 20 year lifetime of the process under S:C 4 conditions. The full economic breakdown can be seen in Appendix B, Table A 3 H2 production process economic study data for S:C 4
. The first year yields an income of £4.6 million from the sale of compressed H2,
along with an abated energetic expense of £158,650 from the diversion of
ammonia from the activated sludge process and £157,303 from the RHI.
Against a total (first year) expense of £2,978,009, allows for a return on
investment during the 8th year of operation in real terms and the 15th year in
discounted (NPV) terms.

180
Figure 6-6. SC 4 cash flow and NPV over plant lifetime
After the designated 20 year plant lifetime, a non-discounted profit of £27.2
million can be realised. The NPV analysis has shown that the process could
provide £2.8 million more than the desired 10% annual return on investment.
Figure 6-7 shows the sensitivity of these profits to changes in a number of
model variables. The cost of catalysts, cost of the initial capital investment, the
total annual expenditure and the market value of H2 have all been altered +/-
15% in an attempt to showcase scenarios that represent the uncertainty
resulting from the economic analysis methodology.
Figure 6-7 illustrates the impact of altering the market value of H2 has the most
pronounced bearing on the overall profitability and feasibility of process
implementation. By decreasing the price of hydrogen by 15% (from £4.50 to
£3.83), the non-discounted profit over the plant lifetime decreases by almost
£19 million (69%). However, the % impact on the NPV is even more
pronounced with a reduction of £7.35 million (261%). Under this scenario, NPV
would not turn positive during the plant’s 20 year lifetime. In this case, it would
be impossible to attract the investors with the knowledge they would not
receive their average 10% annual return on investment. Increasing the H2 value
by 15% (to £5.18) has a similar, but reversed, impact increasing the system’s
profitability by 67% and 254% in non-discounted and NPV terms respectively.
This shows how strongly influenced the attractiveness of the process is by the

181
price of H2. However, not only is the hydrogen price the most influential
variable, it is also the most uncertain one. As discussed previously, the market
value could be anywhere between £1.80-11.70 kg-1 H2.
Figure 6-7. Tornado graph showing the results of the sensitivity analysis performed by changing a number of variables by +/- 15 % under S:C 4 process conditions.
Figure 6-7 also shows the total annual expenditure could have considerable
influence on the financial viability of process implementation. With a 15%
increase in annual costs, the £5.2 million reduction in NPV would mean a
positive NPV would not occur during the plant’s 20 year lifetime. This would
mean investors would not receive the average 10% return dictate in the NPV
analysis; considerably reducing the attractiveness of the process. However, if
annual expenditure has been overestimated by 15%, then the associated 150%
increase in NPV after 20 years of operation would significantly increase the
financial outlook. A 15% increase in the estimated initial capital cost would
reduce the 20 year NPV by 114% and would not become positive during the
plant’s lifetime. Meanwhile, a change in the estimated catalyst cost would have
a minimal impact on lifetime profitability.

182
6.4.3.2 Steam:Carbon 3 scenario
Under the S:C 3 scenario, the initial capital investment is £13.01 million,
£361,337 less than under the S:C 4 scenario. Figure 6-8 shows the cash flow and
annual NPV over the 20 year plant lifetime under S:C 3 conditions. With a
slightly lower production of H2 than under the S:C 4 scenario, the income from
compressed H2 sales drops to £4.5 million in the first year. However, this is
countered by a lower total annual expenditure of £2,901,213 (first year) and an
RHI income of £142,644 and an equal electricity abatement to the S:C 4
scenario.
Figure 6-8. S:C 3 cash flow and NPV over plant lifetime
As illustrated in Figure 6-8, the result of the discussed income and expenditure
values is a total non-discounted profit of £27.6 million and an NPV of £3.1
million after 20 years of operation. This is over £355,000 more in real terms
and £304,000 more in discounted terms compared to the S:C 4 scenario. Figure
6-8 also shows that the payback on the initial investment would occur during
the 8th year and would receive a 10% returns on the initial investment (i.e. a
positive NPV) during the 14th year; analogous to the S:C 4 scenario.

183
Figure 6-9. Tornado graph showing the results of the sensitivity analysis performed by changing a number of variables by +/- 15 % under S:C 3 process conditions.
Figure 6-9 shows the sensitivity carried out on the economic model for the S:C
3 scenario. The % impact on the profit and NPV is very similar to the associated
sensitivity carried out in the S:C 4 scenario. With a H2 value reduction and
annual expense, capital expenditure and catalyst price increase of 15%
resulting in a 226%, 163%, 100% and 7% reduction in 20 year NPV
respectively. As such, if the estimated value of hydrogen reduces from £4.50 to
£3.83, annual expense increases 15% or capital investment increases 15%,
then an average annual 10% return on investment cannot be achieved over the
20 year lifetime and would diminish the financial viability of implementing the
discussed process.
6.4.3.3 Steam:Carbon 2 scenario
The initial installed cost of the S:C 2 process is the lowest of all three options at
£12.53 million. The 952 tonnes of H2 produced annually under the S:C 2
scenario yield a first year income from sales of £4.28 million. The projected
income from RHI has been calculated at £147,468 and electricity abatement
equivalent to the other two scenarios. The total (first year) annual expense has
been determined as £2,714,393 which is also the lowest of all three considered

184
scenarios. The result of this is the cash flow and NPV detailed in Figure 6-10
over the plant’s lifetime.
Figure 6-10. S:C 2 cash flow and NPV over plant lifetime
As shown in Figure 6-10, the plant under S:C 2 conditions is projected to end
with a final real profit of £26.5 million and an NPV of £3.01 million. Thus,
demonstrating the lowest profitability and financial attractiveness of all three
scenarios. The plants operating in profit during its 7 th year and achieves a
positive NPV during the 14th year of operation, as with S:C scenarios 3 and 4.
The sensitivity analysis carried out on the S:C 2 financial model showed very
similar effects as under the S:C 3 and S:C 4 scenarios with it unable to achieve a
positive NPV if the projected H2 price is lowered, the total annual expense or
the initial investment is increased by 15%.
6.4.3.4 Economic analysis general discussion
One of the key outcomes from the economic sensitivity analysis is the influence
the market value of H2 will have on the financial viability of process
implementation. Under this uncertainty, it is proposed that it will be difficult to
attract investors when a crash in the H2 market value would diminish the
potential for a return on their investment. As such, if ‘green hydrogen’ is going

185
to have a significant impact on the UK’s transition to a low carbon economy, a
controlled market value may need to be put in place akin to the contracts for
difference scheme implemented for renewable electricity.
Furthermore, sensitivity analysis carried out on the level of initial capital
investment also showed to have a significant effect on the economic feasibility
of process implementation. However, a significant proportion (>40%) of the
capital investment could be attributed to compression, storage and dispensing
(CSD) technology which would facilitate an onsite refuelling station for H2
fuelled vehicles. As such, there could be an alternative option implemented in
the CSD’s stead, which would reduce the level of capital investment and
improve the financial outlook. It is suggested that this is one area that could be
focussed on during future work to clarify whether there are alternative and
superior options.
6.5 Wastewater treatment plant energy and GHG emission
impacts
The economic analysis has demonstrated that the S:C 3 scenario provides the
greatest NPV over the 20 year lifetime of the plant. It is this scenario that will
be used for comparative analysis moving forward and has been used to
demonstrate the impact on energy and GHG emissions at the reference WWTP.
Table 6-12 shows details a breakdown of the power and heat consumption
resulting from the proposed introduction of the process at Esholt WWTP.
Table 6-12. Process power and heat consumption for S:C 3 scenario
Consumption (kWh day-1)
Aspen process power consumption 3,888
CSD power consumption 11,234
Gas Clean Up power consumption 5,239
Power abatement from N-diversion -4,120
Net Power use 16,242
External Heat requirement: 16,071

186
Table 6-12 shows that although the diversion of ammonia from the ASP
facilitates an abatement of 4.1 MWh day-1 of electricity. However, this is not
enough to counteract the consumption from the process simulated in Aspen
Plus, the biogas clean-up and CSD systems. The result of this is the net
electricity usage of 16,242 kWh day-1 on top of the facility’s current power
consumption at 60 MWh day-1. The system’s external heat requirement is
23,543 kWh day-1, as detailed in Table 6-7 and shown in Table 6-12.
Table 6-13 shows the GHG emissions associated with the potential process
introduction at Esholt WWTP. In Chapter 3, it was discussed the estimated N 2O
emission factor from Esholt lie at 0.012 kg N2O N/ kg TNinfluent. The abatement
of emissions from the facility’s ASP enabled from the diversion of ammonia
totals at 3,222 kg day-1, using an N2O GWP emission factor of 298 times that of
CO2 over a 100 year period. If the H2 is to be used as a bus transportation fuel,
the abated emissions are also shown in Table 6-13. Calculated via a H2
requirement of 9 kg per 100 km [308] and an emission factor of 1,193 g per km
travelled [309].
Table 6-13. System GHG emissions for the S:C 3 scenario
Emissions (kg CO2e day-1)
ASP abatement -3,222
Electricity lifecycle emissions 1,738
Heat lifecycle emissions 4,944
Bus transport emission abatement -14,056
Total (kg CO2e day-1) -10,596
As shown in Table 6-13, the additional use of grid electricity with a carbon
intensity of 107 gCO2e kWh-1 [294], is expected to increase the lifecycle
emissions of the plant by 1,738 kg CO2e day-1. Whilst, the net heat requirement,
with a carbon intensity of 210 gCO2e kWh-1 [310], is estimated to contribute an
extra 4,944 kg CO2e day-1 to the lifecycle GHG emissions of a plant of Esholt’s
size. This would result in a net emission of 3,460 kg CO2e day-1 which is

187
equivalent to 1.25 kg CO2e per kg of H2 produced. Therefore, until the gas and
electricity grids in the UK are decarbonised, the production of hydrogen via this
method will not be entirely ‘green’. However, the abatement of CO2 emissions
from bus transport would be 14,056 kg CO2 per day. As such, Esholt WWTP’s
associated lifecycle emissions would reduce by 10,596 kg CO2 day-1.
6.6 Conclusions
In this Chapter thorough process modelling and economic analysis studies have
been performed to demonstrate the technical and financial feasibility of
implementing this novel method of H2 production at Esholt WWTP. The
sensitivity analysis carried out on the operating temperature of the primary
reformer has detailed the effect on both H2 production potentials and
systematic thermal transport to meet the demands of the air stripping unit. It
was found that it was worthwhile committing to the maximum temperature of
1,000 °C under each of the S:C 2, 3 and 4 scenarios which, although meant
spending external energy to meet the air stripper’s heat demand, this was
trumped by the additional production of hydrogen from a chemical energy
point of view.
Further process modelling analysis detailed the contribution of ammonia
decomposition to hydrogen production from the primary reformer at 7.2%,
7.5% and 7.9% under S:C 4, S:C 3 and S:C 2 scenarios respectively. It also
detailed the overall impact of S:C ratio on system hydrogen production with
higher S:C ratios providing a greater H2 production potential at 117 kg h-1, 115
kg h-1 and 109 kg h-1 for S:C scenarios 4, 3 and 2 respectively. On the other hand,
it was also shown that the system’s net production of heat had an inverse
relationship with the S:C ratio at 9.6 MWh day-1, 10.1 MWh day-1 and 15 MWh
day-1 for S:C scenarios 4, 3 and 2 respectively.
The economic analysis showed that the S:C 3 scenario resulted in the greatest
return for investors with a positive NPV of over £3.1 million after 20 years of
operation. This showcases the balance struck between H2 production potential
and the additional energetic cost of its facilitation. The economic sensitivity

188
analysis carried out demonstrated the overwhelming impact of the market
price of H2 on the financial viability of process implementation. It showed that
with just a 15% reduction on the quoted market value of £4.50 kg -1 H2 led to a
bleak economic outlook for the process implementation. On the other hand, a
15% increase on the proposed market value more than doubled the end-of-life
NPV.
The production of hydrogen via the discussed process was found to have a
significant potential impact on the electricity consumption of the referenced
WWTP, increasing it by 16.2 MWh day-1 or 20% of its current use. Much of this
power demand can also be attributed to the operation of CSD equipment.
Meanwhile the proposed introduction of the process was also found to increase
the facility’s heat demand by 16 MWh day-1. It was also found that the
introduction of the process would decrease lifecycle GHG emissions by 10,596
kg CO2 day-1.

189
7 Experimental Feasibility of Bio-H2 Production
from AD-generated NH3 and CH4 using
combined catalytic cracking and steam
reforming.
7.1 Background and Introduction
This chapter focusses on the experimental analysis of the potential for
combined steam methane reforming (SMR) and ammonia decomposition in a
single packed-bed reactor. In Chapter 6, the production of H2 was studied from
a theory-based equilibrium stand-point. The work carried out in this chapter,
however, assesses whether equilibrium yields and conversions can be
replicated under experimental conditions, or how close practical outputs come
to their predicted counterparts.
Catalytic ammonia decomposition occurs via an initial adsorption of ammonia
onto the catalyst’s active site surface. The ammonia can then undergo
successive N-H bond cleavage, releasing hydrogen atoms which combine to
make H2 [153,154]. The final mechanistic stage is the rate-limiting
recombinative desorption of nitrogen adatoms to molecular N2 [153]. Ni-based
catalysts (in their reduced metallic form) are generally considered the second
most effective (active) catalysts for ammonia decomposition, bettered only by
Ruthenium (Ru) [153,154]. However, Ru is an extremely expensive and rare
transition metal, making Ni a far more attractive option commercially, if used
in fixed bed configuration.

190
Industrial catalytic steam reforming of hydrocarbons has been carried out for
decades to produce hydrogen, ironically, often with the aim of ammonia
synthesis [311]. Ru – based catalysts have also been promoted as having the
highest activity for steam methane reforming [312]. However, inexpensive Ni
catalysts are the most popular in industry, often supported on alumina (Al2O3),
ceramic magnesium aluminate (MgAl2O4), cerium oxide, (CeO2), zirconium
oxide (ZrO2) and silicon dioxide (SiO2) [297].
As far as this author is aware, there has been no prior experimental work using
packed-bed reactors that combine the decomposition of ammonia with the
steam reforming of methane. However, there are a number of researchers that
have combined the two processes using anodes of solid oxide fuel cells such as
Wang et al. [156] and Xu et al. [157]. However, Rollinson et al. [313] examined
the use of a urea solution and of aqueous ammonia in a packed-bed reactor that
simultaneously reformed the urea and cracked the intermediate or feed
ammonia.
7.2 Experimental Rig and Equipment Description
Figure 7-1 and Figure 7-2 show the bench-scale rig used for the combined
ammonia decomposition and steam methane reforming experiments. Three
forms of compressed gases are connected to the rig: methane, nitrogen gas and
a 5 vol.% H2/95 vol.% N2 mix. The flow of each gas is controlled by MKS (US)
mass flow controllers. They work via a fast response proportio ning valve which
adjusts to the required flow depending on the feedback from internal thermal
sensors. The gases are passed through electrical pre-heaters before entrance
into the reactor. Liquid feedstock (water or aqueous ammonia) is supplied to
the system via a 20 ml BD Plastipak (US) syringe with a stainless steel Luer lock
needle via a New Era Pump System Inc (US) (model NE-1000). The liquid also
passes through a second preheater set at 150°C to vaporise before entrance to
the reactor. Heating tape has been used to aid the maintenance of temperature
between the base of the preheaters and the reactor. Much of the rig has been
insulated to prevent thermal losses as much as possible.

191
Figure 7-1 Schematic of experimental rig
Figure 7-2. Image of rig set up
Pump
Pico-logger
Flow Controller
Micro GC
Condensate trap Temperature Controller
Pre-heater
Furnace & reactor

192
Figure 7-3 Diagram of reactor internal layout. Internal diameter 9.8 mm, length 250 mm.
The reactor is made of a 316 stainless steel tube with an internal diameter of
9.8 mm. The reactor is positioned inside an electric tube furnace (Elite Thermal
Systems (UK) TSV10/20/85) which provides the resistive heating to reach the
desired reactor temperature. The internal temperature is monitored via a
thermocouple connected to a pico-logger console in communication with a PC.
Figure 7-3 shows the internal layout of the reactor tube. The thermocouple
reaches roughly half way up the tube and provides a support in which a bed of
4 µm quartz wool sits. The quartz wool, in turn, provides a semi-permeable and
non-reactive platform in which the powder catalyst can sit.
The outlet from the reactor is fed into a stainless steel condenser which cools
the product using a counter-flow of (30 vol. %) ethylene glycol/(70 vol. %)
water cooling liquid originating from a Fisher Scientific (US) 3016S chiller set
at -2°C. A stainless steel condensate trap is located after the condenser and can
be detached in order to remove and store any condensate generated.
9.8 mm
250 mm

193
Downstream of the condenser, a stainless steel moisture trap, filled with silica
gel beads, facilitates the removal of all moisture from the syngas to ensure only
a dry gas enters the micro gas chromatograph (GC).
The micro GC utilised is a Varian (US) CP 4900 and provides compositional
analysis of the dry product gas from the reactor. It contains two thermal
conductivity detectors (TCD) and two columns. The first is a Molecular Sieve
5A plot column and is calibrated to detect the following gases: H2, O2, N2, CH4
and CO. The second is a Pora Plot Q column which is calibrated for
measurement of CO2, CH4, C2H6, C2H4, C3H8 and C3H6 gas concentrations. The
micro GC utilises argon as its carrier for both columns. The comparatively fast
run-time of just over 3 minutes makes it more appropriate for continuous
sampling than many other conventional multi-species gas analysers.
The micro GC directly communicates with GalaxieTM chromatography data
system software from Varian, Inc. The program facilitates shifts between
Shutdown, Backflush and Conditioning in a safe and gradual manner. During
sampling, the Backflush method operates with a column temperature of 100°C
and a pressure of 100 kPa. Over short periods without use (e.g. overnight) the
conditioning method is used and increases the column temperature to 180°C,
which removes any moisture that may have entered and aids column
preservation. For longer periods of time the ‘shut-down’ method is used and
slowly cools the column temperature to ambient ones. The Galaxie program is
also operated for calibration of the micro GC. Calibration plots for known gas
compositions are loaded so that unknown gas compositions can be accurately
measured. The known gas mixtures used for calibration can be seen in Table
7-1. Furthermore, chromatograms are generated in the Galaxie program to be
downloaded and prepared for analysis.
Table 7-1 Calibration gas mixtures used for GC calibration in mol %

194
Mixture 1 CH4 2.02 CO 4.93 CO2 15.04 H2 29.24 N2 48.77
% % % % %
Mix 2 CO 5.1 N2 94.9
% %
Mix 3 H2 79.5 N2 20.5
% %
Mix 4 CH4 5.04 CO 10.00 CO2 4.79 H2 10.22 N2 69.95
% % % % %
7.3 Catalyst Preparation
A commercial grade 18 wt% NiO/α-Al2O3 obtained from Twigg Scientific &
Technical Ltd (UK) has been used for each experiment reported in this chapter.
In order to prepare for the packed-bed reactor, the pellets were crushed using
a pestle and mortar and sieved to a diameter range between 150-250 µm.
Figure 7-4 18wt% NiO/AL2O3 catalyst before (left), after crushing (middle) and spent catalyst (right)

195
7.4 CHN analysis
In order to assess the amount of carbon deposition occurring on the catalyst for
each experiment, analysis was carried out using a Thermo Scientific (US) Flash
2000 Elemental Analyzer. The equipment contains a thermal conductivity
detector (TCD) which is able to determine elemental weight % of carbon,
hydrogen and nitrogen. As such, it is colloquially termed ‘CHN’. Spent catalysts
were prepared by crushing to make a homogenous sample, weighed to between
15-18 mg, duplicated and placed in small tin capsules. The tin capsules were
folded to remove trapped air. The samples were then dropped into the
analyser’s high temperature furnace (1000-1800 °C). The oxygen-rich
atmosphere facilitates the combustion of any carbon, hydrogen and nitrogen to
CO2, H2O, and NOx which are swept through the furnace via a helium carrier
gas. The combustion gases are separated in a gas chromato graphy column
before the TCD measures the mass fraction of C, H and N. High quality
calibration using known standards provides assurances on the quality of the
output data.
Samples were tested in duplicate and the raw CHN data was converted to
usable data by taking the mean of the duplicates. The data is read as a wt% of
solid sample so were converted to mass of deposited carbon using the mass of
catalyst used in the experiment. A carbon deposition rate per hour could then
be calculated using the total duration of the experiment (texp) and knowledge of
feed rate of carbon from the CH4 source.
7.5 Ammonia analysis
Condensate ammonium analysis was carried out using a Hach (US) AP3900
Laboratory Robot with Hach (US) LCK 303 ammonium calorimetry cuvettes.
The analysis was able to measure concentrations within the range of 2-47 mg l-
1. The LCK 303 test works by the principle that ammonium ions react at pH 12.6
with hypochlorite ions and salicylate ions in the presence of sodium
nitroprusside as a catalyst to form indophenol blue. Calorimetry analysis is

196
then performed to determine the extent of indophenol blue generation and
therefore the implied ammonium concentration of the sample.
Some initial tests were carried out to show the required dilution of samples for
concentrations to fall within the detection range. It was found that runs at
molar feed steam to carbon ratios (S:Cs) of 2 and 3 in the reformer required a
dilution factor of 100 and S:C 4 runs needed a dilution of 10. Sample dilution
and preparation was carried out in a fume cupboard where pipettes were used
to create 1:9 volume ratios of condensate : deionised water. At this point, the
samples obtained from S:C 4 reformer runs were ready with a dilution factor of
10. However, the already diluted samples from S:C 2 and S:C 3 runs underwent
another 1:9 volume dilution to facilitate an overall dilution factor of 100.
Samples were prepared in duplicate. The automated AP3900 Laboratory Robot
proceeded with sample analysis under an automated function, eliminating the
chance of human error.
The raw data from the cuvette tests were reported as NH4-N mg l-1 and
reconverted to an undiluted concentration via multiplication of their respective
dilution factors. The concentrations were then converted to a molar flow of NH3
using the equations 7-1 to 7-3:
�̇�𝑁𝐻3 −𝑁,𝑐𝑜𝑛𝑑𝑒𝑛𝑠𝑎𝑡𝑒 = MNH3(
𝜌𝑁𝐻3−𝑁,𝑐𝑜𝑛𝑑𝑒𝑛𝑠𝑎𝑡𝑒 × �̇�𝐻2𝑂 ,𝑐𝑜𝑛𝑑𝑒𝑛𝑠𝑎𝑡𝑒 × 𝑡𝑒𝑥𝑝
𝑚𝑁𝐻3 −𝑁
) 7-1
�̇�𝐻2 𝑂,𝑐𝑜𝑛𝑑𝑒𝑛𝑠𝑎𝑡𝑒 =MH2 O(�̇�𝐻2𝑂,𝑖𝑛 − �̇�𝐻2 𝑂,𝑑𝑒𝑠𝑡𝑟𝑢𝑐𝑡𝑒𝑑 )
1000 7-2
�̇�𝐻2 𝑂,𝑑𝑒𝑠𝑡𝑟𝑢𝑐𝑡𝑒𝑑 = �̇�𝐶𝑂,𝑜𝑢𝑡 + 2�̇�𝐶𝑂2,𝑜𝑢𝑡 7-3
where, �̇�𝑁𝐻3 −𝑁,𝑐𝑜𝑛𝑑𝑒𝑛𝑠𝑎𝑡𝑒 is the calculated molar flow (mol h-1) of NH3 in the
experiment’s condensate; MNH3 is the molar mass of NH3 (g mol-1);
𝜌𝑁𝐻3 −𝑁,𝑐𝑜𝑛𝑑𝑒𝑛𝑠𝑎𝑡𝑒 is the mass concentration of NH3-N from the Hach (US) LCK
303 analysis (dilution adjusted) (g l-1); �̇�𝐻2 𝑂,𝑐𝑜𝑛𝑑𝑒𝑛𝑠𝑎𝑡𝑒 is the expected volume
flow of water in the condensate (l h-1); 𝑡𝑒𝑥𝑝 is the duration of the experiment

197
(h) or ‘time on stream’; MH2 O is the molar mass of H2O (g mol-1); �̇�𝐻2𝑂,𝑖𝑛 is molar
flow of water into the reactor (mol h-1); �̇�𝐻2 𝑂,𝑑𝑒𝑠𝑡𝑟𝑢𝑐𝑡𝑒𝑑 is the molar destruction
rate of H2O via the SMR and WGS reactions (mol h-1); �̇�𝐶𝑂,𝑜𝑢𝑡 is the molar flow
of CO produced as determined from the micro GC (mol h -1) and �̇�𝐶𝑂2 ,𝑜𝑢𝑡 is the
molar flow of CO2 produced as determined from the micro GC (mol h -1). The
calculation table of results from the ammonia analysis can be seen in Appendix
C, Table A 5.
7.6 Experimental Procedure
Each experiment began with switching on the chiller, set to -2°C and flushing
the rig with N2. Crushed catalysts were weighed out to a weight hourly space
velocity (WHSV) of 2 h-1. WHSV is defined as the mass rate of feed to the reactor
per hour divided by the mass of catalyst (including support). 0.09 g of quartz
wool was weighed and placed in the reactor on top of the thermocouple, as
shown in Figure 7-3. The distance of the top of the quartz wool plug from the
top of the reactor was measured before the catalyst was placed in the reactor.
The distance of the top of the catalyst bed from the top of the reactor was then
measured so that the gas hourly space velocity (GHSV) could be determined.
GHSV is defined as the total volumetric flow rate under standard conditions
(25°C and 1 atm) divided by the volume of catalyst bed (including inter particle
and pore voids).
The rig was tested for leaks by flowing 200 ml min -1 of N2 through the system
and checking the flow rate downstream at various points using an Agilent
Technologies (US) ADM1000 flowmeter. When the chiller reached the desired
temperature, the furnace was switched on and the temperature adjusted until
the reactor’s internal temperature reached 650 °C, whereby the catalyst could
be later reduced upon switching the N2 flow to a reducing flow. The furnace
temperature needed to be set roughly at 50 °C greater than the desired reactor
temperature due to heat loss between the reactor and furnace walls. Catalyst
reduction achieving the conversion of catalytically inert NiO to the catalytically
active Ni form was then carried out by switching the N2 flow to 200 ml min-1 of

198
a 5/95 vol% H2/N2 mixture. The micro GC was used to monitor the gaseous
outlet and informed on the end of the reduction process when H2 concentration
reached the initial 5 vol%. After catalyst reduction, the system was flushed with
N2 until no traces of H2 were read by the micro GC.
The furnace temperature was then adjusted to reach the desired experiment
temperature and the pre-heaters switched on. The flow of the ammonia
solution was set to the desired flow at the syringe pump and 40 ml min-1 of N2
and 21.6 ml min-1 of methane were set. The ammonia solution was prepared
using a 25 wt% ammonia solution from Fischer Scientific, diluted with
deionised water in the ratios displayed in Table 7-2. The amount of ammonia
required for S:C ratios 2, 3 and 4 was dictated by ammonia recovery potentials
discovered during Aspen Plus process modelling. The quantity is slightly
different to those reported in Chapters 3, 4 and 5 as the data were taken from
previous models that were improved upon. The samples were prepared in a
fume cupboard using pipettes and measured via mass displacement using an
analytical balance. The ammonia solution had a density of 0.91 g ml-1 which was
used to calculate the volume flow required for the prepared ammonia solution.
Table 7-2. Required flow of ammonia solution and deionised water S:C Ammonia solution
mass flow (g hr-1) Required
additional water (g h-1)
Total liquid flow rate
(ml hr-1)
2 0.505 1.531 2.086 3 0.529 2.468 3.049 4 0.559 3.400 4.014
The syringe pump was turned on before the methane feed to prevent methane
decomposition occurring. Real time thermocouple data indicated when the
ammonia solution entered the reactor because a slight drop in temperature
could be seen. At this point, the methane feed was turned on and analysis
begun.
After around 50 micro GC sample runs, the experiment was stopped and
everything turned off except for the chiller and the N2 flow, which was

199
increased to 200 ml min-1 in order to flush the rig of all syngas. After two hours,
the condensate could be removed and stored in a 10 ml glass vial and placed in
the refrigerator to help preserve any remaining ammonium. The reactor was
then dismantled and spent catalyst from each experiment was placed in a 10 ml
glass vial for CHN analysis.
Equations 7-4 to 7-8 detail the key reactions involved in the experiments. The
reader should be familiar with reactions 7-4, 7-5 and 7-8 which detail the SMR,
WGS and ammonia decomposition reactions respectively. Reactions 7-6 and
7-7 describe the two main methods in which carbon formation can occur during
steam reforming of methane; namely methane decomposition and the
Boudouard reaction respectively.
CH4 + H2O CO + 3H2 ∆𝐇𝟐𝟗𝟖 = +𝟐𝟎𝟔 𝐤𝐉 𝐦𝐨𝐥−𝟏 7-4.
CO + H2O CO2 + H2 ∆𝐇𝟐𝟗𝟖 = −𝟒𝟏 𝐤𝐉 𝐦𝐨𝐥−𝟏 7-5.
CH4 C + 2H2 ∆𝐇𝟐𝟗𝟖 = 𝟕𝟓 𝐤𝐉 𝐦𝐨𝐥−𝟏 7-6.
2CO C + CO2 ∆𝐇𝟐𝟗𝟖 = −𝟏𝟕𝟐 𝐤𝐉 𝐦𝐨𝐥−𝟏 7-7.
2NH3 3H2 + N2 ∆𝐇𝟐𝟗𝟖 = +𝟗𝟐 𝐤𝐉 𝐦𝐨𝐥−𝟏 7-8.
At the temperature profile utilised in the experiments discussed in this chapter
(700-800 °C), given the reaction enthalpy and kinetics discussed in literature
such as Hou & Hughes [314] any carbon formed on the catalyst is expected to
arise via methane decomposition (reaction 7-6) but reaction 7-7 may occur in
the flow prior to contacting with the catalyst in the lower temperature regions
of the reactor.
7.7 Output analysis
The micro GC produces compositional results in specie molar fractions.
Ordinarily, the known flow of inert N2 into the rig would act as a reference so

200
that flows of other product gases can be inferred. However, although the mole
fraction of N2 is measured, because the decomposition of ammonia also
generates N2, the output flow of N2 is unknown as it requires knowledge of the
total gaseous molar outflow. It was also found that the quantity of ammonia
held in the initial feedstock did not remain constant, volatilising over time. As
such a method of ‘contribution analysis’ was employed to determine product
yields using equation 7-9 representing the nitrogen elemental balance:
�̇�𝑥(𝑜𝑢𝑡) =�̇�𝑁2 (𝑖𝑛) + �̇�𝑁2(𝑠𝑝𝑒𝑐𝑢𝑙𝑎𝑡𝑖𝑣𝑒 𝑁𝐻3 𝑑𝑒𝑐𝑜𝑚𝑝)
𝑦𝑁2(𝑜𝑢𝑡)
× 𝑦𝑥(𝑜𝑢𝑡) 7-9
where, �̇�𝑥(𝑜𝑢𝑡) is the molar flow of specie x from the reactor, �̇�𝑁2 (𝑖𝑛) is the known
molar flow of N2 into the reactor, �̇�𝑁2 (𝑠𝑝𝑒𝑐𝑢𝑙𝑎𝑡𝑖𝑣𝑒 𝑁𝐻3 𝑑𝑒𝑐𝑜𝑚𝑝) is the speculative
quantity of N2 arising from ammonia decomposition, 𝑦𝑁2(𝑜𝑢𝑡) is the mole
fraction of N2 given by the micro GC and 𝑦𝑥(𝑜𝑢𝑡) is the mole fraction of specie x
given by the GC.
The speculative quantity of NH3 decomposition was altered between 5% and
100% of its potential to provide hypothetical specie molar flows via equation
7-9. It was put forward that three key reactions were occurring in the reactor:
SMR (7-4), WGS (2-14) and NH3 decomposition (2-18). Stoichiometry dictates
that for each mole of CO generated there would be three moles of H 2 and for
every mole of CO2 generated there would be 4 moles of H2; stipulating equation
7-10 for the production of H2 from SMR and WGS reactions:
�̇�𝐻2 (𝑆𝑀𝑅 & 𝑊𝐺𝑆 𝑐𝑜𝑛𝑡𝑟𝑖𝑏𝑢𝑡𝑖𝑜𝑛) = 3�̇�CO + 4�̇�𝐶𝑂2 7-10
H2 production via the contribution of SMR and WGS (�̇�𝐻2(𝑆𝑀𝑅& 𝑊𝐺𝑆 𝑐𝑜𝑛𝑡𝑟𝑖𝑏𝑢𝑡𝑖𝑜𝑛 ))
was calculated for runs with and without ammonia. Doing this enabled the
difference in H2 produced from SMR and WGS reactions to be calculated
between runs with and without ammonia present (∆�̇�𝐻2 (𝑐𝑜𝑛𝑡𝑟𝑖𝑏𝑢𝑡𝑖𝑜𝑛)). Equation
7-11 essentially normalises the difference in H2 production so that the

201
contribution of ammonia decomposition to H2 production can be inferred.
Equation 7-11 makes the assumption that the contribution to H2 production via
methane decomposition (reaction 7-6) is negligible in comparison to those of
reactions 7-4 and 7-5. This assumption will be checked retrospectively upon
quantification of the carbon measured on the catalyst and expressed as amount
of solid carbon product per amount of carbon fed as CH4.
�̇�H2 (NH3 𝑑𝑒𝑐𝑜𝑚𝑝) = ∆�̇�H2(𝑜𝑢𝑡) − ∆�̇�𝐻2 (𝑐𝑜𝑛𝑡𝑟𝑖𝑏𝑢𝑡𝑖𝑜𝑛) 7-11
∆�̇�H2(𝑜𝑢𝑡) describes the difference between �̇�H2(𝑜𝑢𝑡) with and without the
presence of ammonia. Resultantly, �̇�H2(NH3𝑑𝑒𝑐𝑜𝑚𝑝) describes the speculated
quantity of H2 generated from ammonia decomposition (equation 7-11).
During ammonia decomposition, for every mole of N2 generated, 3 moles of H2
are produced. As such, the true �̇�H2(NH3𝑑𝑒𝑐𝑜𝑚𝑝) was determined from the
sensitivity analysis when it equalled three times that of ∆�̇�N2(out) .
7.8 Equilibrium Modelling
Equilibrium modelling was carried out in Aspen Plus V8.8 with equivalent
inputs as carried out experimentally. A single equilibrium (RGibbs) reactor was
employed to replicate the lab set up. The pressure was set to 1 atm and the
temperature was varied between 200°C and 900°C. The inputs can be seen in
Table 7-3.

202
Table 7-3. RGibbs reactor inputs in moles h-1 Description H2O
(moles h-1) NH3
(moles h-1) CH4
(moles h-1) N2
(moles h-1)
S:C 2 no NH3 0.108 - 0.054 0.100
S:C 2 with NH3 0.108 0.0076 0.054 0.100
S:C 3 no NH3 0.162 - 0.054 0.100
S:C 3 with NH3 0.162 0.0081 0.054 0.100
S:C 4 no NH3 0.216 - 0.054 0.100
S:C 4 with NH3 0.216 0.0087 0.054 0.100
Figure 7-5 displays the syngas output from equilibrium modelling of H2 and CH4
with and without NH3 in the feed, under S:C 2, 3 and 4 reforming conditions. H2
yields peaked at 780°C, 725°C and 695°C for S:C of 2, 3 and 4 respectively. This
provides adequate justification of the chosen temperature range examined in
the laboratory between 700 °C and 800 °C. Figure 7-5 also shows the methane
conversion is influenced by the presence of ammonia at lower temperatures,
much more than at higher temperatures. This is because at lower temperatures
ammonia decomposition is thermodynamically stronger than SMR. As such, the
H2 from ammonia decomposition shifts the SMR equilibrium backwards,
limiting CH4 conversion.
Furthermore, equilibrium modelling indicated that at 200 °C, over 90% of the
ammonia would convert to H2 under decomposition at equilibrium. Between
700 °C and 800 °C, over 99% of ammonia decomposed in each equilibrium
simulation. The influence of this can be seen in Figure 7-5 with the greater
yields of H2 yields compared to runs in the absence of ammonia. Equilibrium
modelling indicated no solid carbon as equilibrium product in the conditions
monitored. Further results from the equilibrium modelling will be detailed
later in the chapter with reference to the experimental results.

203
Figure 7-5 (a-c). Graphs detailing the equilibrium syngas flows of H2 and CH4 between temperatures 200°C and 900°C and runs with ammonia (labelled ‘Comb’ for ‘combined’) and without (labelled ‘SMR’). a) S:C 2 conditions, b) S:C 3 conditions, c) S:C 4 conditions
a)
b)
c)

204
7.9 Experimental Results and Discussion
7.9.1 Syngas Composition
Figure 7-6 illustrates an example of the raw micro GC data over time with
results from a SMR test at 700°C and a S:C ratio of 4. It shows that the SMR
reaction occurs quickly with a rapid increase of CO and H2 in mole fraction at
the start of the experiment. However, it takes over 10 consecutive sample
detections for the mole fraction of CO2 to increase to a point where it is
relatively stable (steady state). This analysis has been carried out for each
experiment so that an average for the specie mole fraction can be taken from
when the steady state was reached.
Figure 7-6. Raw GC data example a run without ammonia at S:C 4 and 700°C
Figure 7-6 also illustrates the very slight variation occurring over time in the
production of H2, CO2 and CO. It is speculated that this occurs due to the
intermittent flow of water from the syringe. This happens because the
relatively low flow-rate causes the outlet from the syringe to drip, rather than
flow continuously. As such, there are periods when there is slightly more and
periods where there is slightly less steam in the reactor to facilitate SMR and
WGS reactions. However, the standard deviation of H2 and CO from run 13 (of
the experiment displayed in Figure 7-6) is just 0.006 and 0.004 respectively. As
0
0.05
0.1
0.15
0.2
0.25
0.3
0.35
0.4
0.45
0.5
0.55
0.6
0 5 10 15 20 25 30 35 40 45 50
Mol
e F
ract
ion
Run no.
H2
CO2
CO

205
such, it can be stated that the flow intermittency does not have a significant
impact on the results. Over three hours of standard operation there were no
key signs of catalyst deactivation for any of the experiments. Each experimental
condition underwent two experiments and the most stable of each was chosen
for further analysis.
7.9.1.1 Hydrogen production and reactants conversion at S:C 2
Figure 7-7 presents the mean flow rates of key species in the syngas when
comparing runs with and without ammonia, both experimentally, alongside the
calculated equilibrium equivalent. The most obvious differences that can be
seen are with H2 production rates between the experimental (lower) and
equilibrium data (higher). This is the case for a number of reasons. Foremost,
the experimental methane conversion was not as significant as predicted via
equilibrium investigation. For example, at 700 °C the equilibrium model yielded
unconverted-CH4 flow rates in the syngas of 0.0026 mol h-1 and 0.0028 mol h-1
for runs without and with ammonia respectively compared to 0.0041 mol h -1
and 0.0049 mol h-1 respectively in the experimental runs. As such,
comparatively less H2 was generated via the SMR reaction.
Figure 7-7 also shows that the CO2 generation during the experiments was
23.6% and 13.9% less than the equilibrium equivalent during runs without and
with feed ammonia respectively. This also explains the comparative lower
production of H2 generated via WGS experimentally. On average, there was
17% less H2 generated experimentally under S:C 2 conditions than predicted
by equilibrium analysis.

206
Figure 7-7(a-c). Comparison of dry syngas specie flow from equilibrium modelling and experiments at a S:C ratio of 2. Where ‘SMR’ describes runs without the presence of ammonia and ‘Comb’ describes runs with the presence of ammonia. a) 700 °C, b) 750 °C, c) 800 °C
a)
b)
c)

207
What is clear, however, is that the experimental results follow closely with the
general selectivity of products detailed under equilibrium. For example, both
experimental and equilibrium investigations detailed that at a S:C of 2, H2
production should increase with temperature and CO2 production via the WGS
reaction should decrease. This was generally found as shown in Figure 7-8.
However, one discrepancy is at 800 °C without feed ammonia (labelled SMR),
which had a slightly lower average production of H2 compared to the 750 °C
equivalent. As discussed considerably in Chapter 6, the equilibrium of the
forward WGS reaction prefers lower temperatures and higher S:C ratios. The
WGS reaction was found to be so limited at 800 °C under S:C 2, that it forced the
overall H2 generation to lower than at 750 °C. For example, the CO2 generation
at 800 °C was just 12.4% of that at 750 °C.
Figure 7-8. Results of H2 production at S:C 2, 700 °C, 750 °C and 800 °C from experimental and equilibrium studies.

208
Figure 7-9. Difference in CH4 flow from the reactor between runs with and
without ammonia at S:C 2 (∆�̇�𝑪𝑯𝟒= �̇�𝒘𝒊𝒕𝒉,𝑪𝑯𝟒
− �̇�𝒘𝒊𝒕𝒉𝒐𝒖𝒕 ,𝑪𝑯𝟒).
Equilibrium investigation showed that at lower temperatures, the presence of
ammonia reduces methane conversion more so than at higher temperatures.
This was another trend that was reproduced in experiments carried out at a S:C
2, as shown by the square plots in Figure 7-9. However, the impact was shown
to be far more significant experimentally at temperatures 700 °C and 750 °C,
shown by the triangular plots in Figure 7-9. At 800 °C, the runs with ammonia
present in the feed, in fact, saw a higher conversion of methane than runs
without.
When analysed in detail, the 800 °C S:C 2 SMR experiments resulted in lower
than expected methane conversion. Figure 7-10 shows the raw GC data from
the more stable of the two experiments carried out with S:C 2 at 800 °C. It
illustrates the considerable variability in the syngas composition for H2, CO2
and CH4. This highlights that the SMR and WGS reactions were not proceeding
as they should. The cause of this is unknown, but it is speculated that there was
an issue with the pump-syringe system (which happened from time to time due
to gradual loosening of the Luer lock needle) meaning the flow of water was
more inconsistent than usual. As such, it is hypothesized that this was the cause
of the higher methane conversions with the presence of ammonia in the feed,
rather than a catalytic forcing.
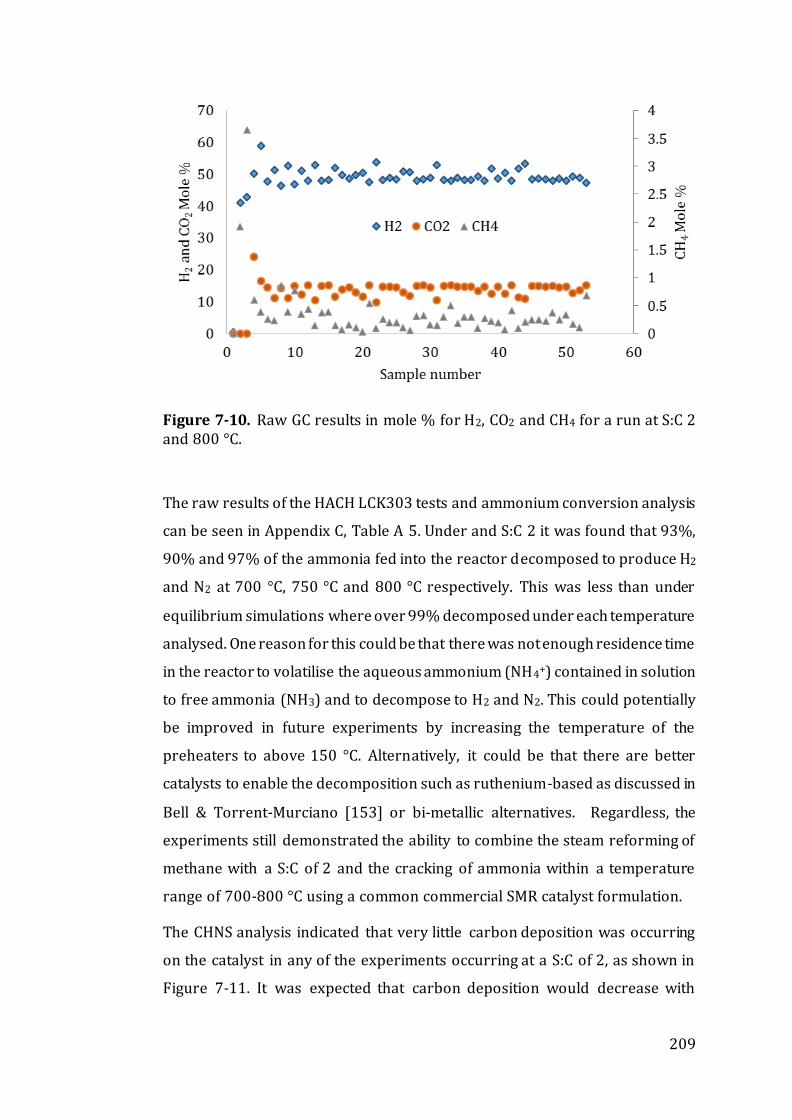
209
Figure 7-10. Raw GC results in mole % for H2, CO2 and CH4 for a run at S:C 2 and 800 °C.
The raw results of the HACH LCK303 tests and ammonium conversion analysis
can be seen in Appendix C, Table A 5. Under and S:C 2 it was found that 93%,
90% and 97% of the ammonia fed into the reactor decomposed to produce H2
and N2 at 700 °C, 750 °C and 800 °C respectively. This was less than under
equilibrium simulations where over 99% decomposed under each temperature
analysed. One reason for this could be that there was not enough residence time
in the reactor to volatilise the aqueous ammonium (NH4+) contained in solution
to free ammonia (NH3) and to decompose to H2 and N2. This could potentially
be improved in future experiments by increasing the temperature of the
preheaters to above 150 °C. Alternatively, it could be that there are better
catalysts to enable the decomposition such as ruthenium-based as discussed in
Bell & Torrent-Murciano [153] or bi-metallic alternatives. Regardless, the
experiments still demonstrated the ability to combine the steam reforming of
methane with a S:C of 2 and the cracking of ammonia within a temperature
range of 700-800 °C using a common commercial SMR catalyst formulation.
The CHNS analysis indicated that very little carbon deposition was occurring
on the catalyst in any of the experiments occurring at a S:C of 2, as shown in
Figure 7-11. It was expected that carbon deposition would decrease with

210
increasing temperatures [315]. As illustrated in Figure 7-11, the runs with
ammonia followed this trend. However, the SMR experiments at 800 °C
displayed the highest average carbon deposition of all runs carried out at a S:C
of 2. This correlates with the lower than expected methane conversion in this
run highlighted in Figure 7-9 and Figure 7-10. As aforementioned, it is
proposed that these runs experienced some form of human error that
prevented effective steam reforming; forcing up the carbon formation.
Figure 7-11. Graph showing the molar % of methane depositing as solid C on the catalyst for S:C 2 experiments
Given the very low selectivity to solid carbon obtained in all the experimental
runs (less than 0.2% of carbon feed), the assumption that H2 production via
reaction 7-6 was negligible was verified and thus corroborated the
methodology for a H2 production rate caused by the contributions of SMR, WGS
and NH3 decomposition. It was stipulated by Wang et al. [156] that the presence
of ammonia during steam methane reforming leads to a suppression of carbon
deposition on Ni/Al2O3 catalysts due to the occupation of acidic sites by
ammonia. However, the results from the S:C 3 runs indicated lower carbon
deposition on just 2 of the three temperatures analysed. The investigation

211
carried out by Wang et al. [156] utilised far higher ammonia concentrations
than in this Chapter. As such, further work is required in order to conclude
whether the presence of ammonia has much of an impact on carbon deposition
at this S:C ratio.
7.9.1.2 Hydrogen production and reactants conversion at S:C 3
Figure 7-12 illustrates the flow rate of syngas species from experimental and
equilibrium data at S:C 3 and temperatures 700 °C, 750 °C and 800°C. As with
the S:C 2 conditions, the trends and general product selectivity strongly
resemble their equilibrium equivalent, with the highest difference being that of
H2 production. Again, this can be mainly attributed to the fact that the methane
conversion was not as high as predicted via equilibrium investigation. Figure
7-12 shows the impact of S:C ratios on the WGS reaction, whereby the flow of
CO2 has increased notably from the runs at S:C 2 and are now close to the
equilibrium values.
a)

212
Figure 7-12 Comparison of dry syngas specie flow from equilibrium modelling and experiments at a S:C ratio of 3. Where ‘SMR’ describes runs without the presence of ammonia and ‘Comb’ describes runs with the presence of ammonia. a) 700°C, b) 750°C, c) 800°C
Another notable finding can be seen with closer inspection of Figure 7-12 (b)
and Figure 7-12 (c), where the increase in H2 with ammonia in the feed is far
less notable from the experimental data than from the equilibrium tests. It was
discussed earlier that over time ammonia volatilised from the bottle of the
aqueous ammonium solution in which it was stored. Despite attempting to
minimise this as much as possible via opening it for the shortest amount of time,
the losses proved inevitable. By the time the S:C 3 750 °C and 800 °C
b)
c)

213
experiments were carried out, just over 40% of the ammonia had volatilised
from solution, thus altering the quantity of H2 produced via the decomposition
of ammonia. Via condensate analysis, it was found that, of the ammonia that
that was fed into the reactor, 90%, 86% and 92% underwent decomposition at
temperatures 700 °C, 750 °C and 800 °C respectively.
Figure 7-13. Molar % of methane depositing as solid C on the catalyst for S:C 3 experiments
One reason for the lower ammonia conversion could be that there was a higher
deposition of carbon during the S:C 3 and 750°C run with ammonia than any
other experiment described in this chapter at 0.095% of the initial methane
feed, as shown in Figure 7-13. However, there was no definitive correlation
between carbon deposition and ammonia conversion amongst the entire
dataset, as shown by Figure 7-18. This figure shows a negative regression
trend-line (as would be expected) but with an R2 of just 0.1476 and was found
to fail an F-test.
Figure 7-14 illustrates that equilibrium tests with an S:C of 3, the difference
between methane conversions with and without ammonia in the feed were
much less pronounced than under S:C 2 conditions. The relationship shown

214
with the experimental data (green markers in Figure 7-14) is not nearly as clear
as with the equilibrium study. This is most obviously represented at 750 °C
where the outflow of methane in the syngas was -0.00013 mol h-1 less with
ammonia in the feed than without. However, this can almost certainly be
attributed to the additional carbon deposition, as shown in Figure 7-13 via
methane decomposition (reaction 7-6).
Figure 7-14. Difference in CH4 flow from the reactor between runs with
ammonia in the feed and runs without at S:C 3 (∆�̇�𝑪𝑯𝟒= �̇�𝒘𝒊𝒕𝒉,𝑪𝑯𝟒
−
�̇�𝒘𝒊𝒕𝒉𝒐𝒖𝒕 ,𝑪𝑯𝟒).
7.9.1.3 Hydrogen Production and reactants conversion at S:C 4
The syngas produced in the experiments carried out under S:C 4 conditions
demonstrated the closest resemblance to equilibrium flow rates, as illustrated
in Figure 7-15. It is speculated that the higher flow of water required for S:C 4,
meant that the flow from the syringe was less intermittent, which helped
maintain steady state. S:C 4 also experienced the lowest average GHSV at 4014
compared to 4235 and 4024 for S:C 2 and 3 respectively. The lower the WHSV,
the higher the volume ratio of catalyst to gases. This means there is a greater
residence time in the reaction bed, helping reactions to reach conditions closer
to equilibrium. The equilibrium study showed that at a reactor temperature of
700 °C under a S:C ratio of 4 the highest production of H2 for runs with and
without ammonia in the feed were facilitated. This was also the case for the

215
experimental work with a hydrogen production rate of 0.161 mol h -1 and 0.168
mol h-1 for SMR and combined runs respectively. However, this was still 14.8%
and 16.5% less than predicted under equilibrium investigation.
a)
b)

216
Figure 7-15. (a-c) Comparison of dry syngas specie flow from equilibrium modelling and experiments at a S:C ratio of 3. Where ‘SMR’ describes runs without ammonia and ‘Comb’ describes runs with ammonia in the feed. a) 700 °C, b) 750 °C, c) 800 °C
Unlike the other S:C conditions analysed (2 and 3), the methane conversion
achieved experimentally at S:C 4 resembles, much more closely, that of the
equilibrium. However, the micro GC results for the outlet flow of methane was
less than shown via equilibrium studies. For, example at 800 °C the GC
exhibited a zero flow of methane in the syngas, whereas equilibrium predicted
that there should be a small quantity of CH4 remaining. One potential reason for
this is that the carbon deposited on the catalyst originated from methane
decomposition, reducing the final outflow of methane in syngas. Another
potential explanation of this could be that the micro GC’s detection accuracy at
these small concentrations is inhibited. Nonetheless, experiments carr ied out
with a S:C 4 facilitated the highest methane conversion, as hypothesised using
equilibrium analysis.
Figure 7-15 indicates that there was a slightly lower generation of CO2
experimentally than in equilibrium with each of the S:C 4 experiments. This
again highlights how the experimental set-up was unable to facilitate the WGS
reaction (2-18) at a high enough rate to match equilibrium. This would also
have contributed to the lower H2 yields shown by the laboratory experiments
compared to the equilibrium study, as shown in Figure 7-15.
c)

217
Figure 7-16 details the amount of carbon deposited on the catalyst as a molar
% of methane fed into the rig. Runs without ammonia in the feed (labelled
‘SMR’) showcase the hypothesised trend of reducing carbon deposition with
temperature. Conversely, the experiment with ammonia at 700 °C experienced
a lower carbon deposition compared to the run at 750 °C.
Figure 7-16. Molar % of methane depositing as solid C on the catalyst for S:C 4 experiments with (‘Comb’) and without (‘SMR’) NH3 in the feed.
7.9.2 Overall ammonia contribution
Figure 7-17 details the increase in H2 calculated via the determined destruction
of ammonia alongside the real difference in H2 flows for runs with and without
ammonia in the feed. It also details the calculated % of the expected flow of
ammonia that entered the reactor due to loss via volatilisation. It was expected
that the real difference in H2 generation would be less than the contribution of
ammonia due to the negative equilibrium effects of introducing ammonia on
the SMR and WGS reactions. However, this was found to be the case in just 5
out of the 9 conditions analysed experimentally.

218
Figure 7-17. Diagram showing the calculated H2 difference between runs with
and without the addition of ammonia (∆�̇�H2 (𝑜𝑢𝑡)) the H2 generated from
contribution of ammonia decomposition (�̇�H2(NH3 𝑑𝑒𝑐𝑜𝑚𝑝)) as calculated in
equation 7-11. Also shown as diamond plots are the % flow of ammonia on
expected (due to volatilisation).
Nonetheless, it was found that each experiment with ammonia in the feed
increased the flow of H2 generated in the syngas. It was also found that the
conversion of ammonia ranged between 86 % and 98 %. With an average
conversion of 91.3%. The conversion followed an increasing trend with
temperature with an average conversion of 89.2%, 89.5% and 95.2% for
temperatures at 700 °C, 750 °C and 800 °C. This was less than the equivalent
equilibrium predictions which predicted conversions over 99%. It is speculated
that this occurred because ammonia was fed into the rig in solution and not all
of the ammonia had to time to volatilise and decompose. As such, if a gaseous
inlet was used instead, the conversions may have been greater.
One potential reason that not all of the experiments resulted with a lower
∆�̇�H2(𝑜𝑢𝑡) than �̇�H2 (NH3𝑑𝑒𝑐𝑜𝑚𝑝) could be the influence of ammonia on the
deposition of carbon as shown by Figure 7-18. It shows that there is a slight

219
negative trend between the % of ammonia decomposition and the deposition
of carbon. Showing that at higher rates of ammonia decomposition, there
appears to be less carbon deposited on the catalyst, as stipulated by Wang et al.
[156]. However, the trend-line displayed in Figure 7-18 has an R2 of just 0.1476
and the relationship failed an associated F-test. Thus, it is not possible to
determine conclusively whether this relationship exists or not.
Figure 7-18. Relationship of carbon deposition and ammonia conversion
7.10 Methodological flaws and further work
There was one methodological flaw that affected the results presented in this
chapter more than any other; namely the volatilisation of ammonia from
prepared solution prior to feed in the reactor. By the end of all of the
experiments, the Fischer Scientific ammonia solution had lowered from 25
wt% ammonia to 13.25 wt%; losing over half of its ammonia content. A liquid
feed of ammonium solution was required in place of a gaseous flow, as the latter
was deemed unsafe for use due to its highly toxic nature if inhaled.
Unfortunately, this meant that each time the bottle of 25 wt% ammonia
solution was opened, some ammonia was lost due to volatilisation. A gaseous
flow would have been preferential as the flow of ammonia could have been

220
better controlled and its impacts on product yields, decomposition extent and
carbon deposition more easily and conclusively determined.
Another issue arose because N2 was used as the inert carrier/reference gas but
it was also generated via the ammonia decomposition reaction, meaning the
total outflow of N2 had to be determined via proxy calculations. In future
experiments, another inert carrier gas could be used instead, such as Helium
(He). However, the chromatograms generated via the micro GC utilised in this
work resulted in H2 and He peaks extremely close to each other, which could
make unique determination difficult.
Furthermore, the experimental work discussed in this chapter utilised just one
WHSV (2). As such, its impact on product yields and conversions could not be
determined and any further work should assess the impact of multiple WHSVs.
Furthermore, by keeping the WHSV constant, the GHSV altered between 4014
and 4235. This may have had an impact on the product yields and extent of
reactions. Therefore, any future work should employ examination of varying
GHSV.
It was discussed by Yin et al. [154] and Bell & Torrente-Murciano [153] that Ru
– based catalysts are superior for ammonia decomposition than Ni – based
catalysts, as used in this chapter. Furthermore, Jones et al. [312] found that Ru
catalysts are also superior to Ni catalysts for SMR. As such, it could be worth
carrying out a similar experimental procedure as done in this Chapter but with
Ru or Ru-Ni catalysts to determine the difference in effectiveness. It may also
be worth investigating the use of different supports such as monolith catalysts
instead of powdered ones, which is also a technology direction being taken in
solid oxide fuel cell anode research [316] and would make an interesting
bookend to the work carried out in Chapter 5.
7.11 Conclusions
In this chapter, experimental analysis of combined steam methane reforming
and ammonia decomposition was carried out in a packed bed reactor using a
commercially formulated 18wt% Ni/Al2O3 catalyst with a WHSV of 2, for S:C

221
ratios of 2, 3 and 4 and temperatures 700 °C, 750 °C and 800 °C. It was proved
that the combined reactions were possible with respectable conversions of
both methane and ammonia. Although general product selectivity was close to
equilibrium equivalents, the extent of ammonia decomposition, SMR and WGS
reactions did not reach equilibrium comparisons in most cases. For example,
ammonia decomposition ranged between 89.2% and 95.2% compared to an
expected (equilibrium) conversion of over 99%. Furthermore, H2 production
ranged between 14.8% and 18.3% less in relative terms than expected under
equilibrium studies.
It was expected that the presence of ammonia and its decomposition would
have a negative impact on the conversion of methane via SMR. However, this
was found to be the case in just five of the 9 experimental conditions and no
specific trend could be inferred. Fortunately there was very little carbon
accumulation found on the catalysts in any of the experiments carried out. It
was expected that carbon accumulation would reduce with ammonia
conversion due to the theorised occupation of acidic spaces on the catalyst.
Despite a trend shown via regression analysis, a very weak relationship was
found and was therefore proved inconclusive.
There were multiple methodological issues that were exposed during the
experiments reported in this Chapter, the most glaring being the volatilisation
of ammonia from the solution sample prior to feed into the reformer. Over half
of the originally contained ammonia was lost, which affected syngas
compositions and the ability to make assured conclusions as to the relationship
of ammonia decomposition with the contributions of other reactions and extent
of carbon deposition. A number of suggestions have been made as to potential
improvements in the experimental procedure which should be carried out if
further experimental work is to be carried out in this field.

222
8 Conclusions and Future Work
Action on climate change is the most important responsibility humanity has
ever experienced. However, innovation, development and uptake requires time
and no sector can be left behind, including the wastewater treatment sector.
Although the large-scale introduction of anaerobic digestion at WWTPs has
much improved their overall sustainability of operation, there is further work
to do. Esholt WWTP, the reference facility used throughout this thesis, recovers
2/3 of the energy it consumes, via the combination of anaerobic digestion (AD)
and conventional combined heat and power (CHP) technology. This means that
1/3 of its energy is provided by a (mostly) non-renewable electricity grid and
the digestate liquor it recycles back into the treatment process, considerably
augments the facility’s energy consumption and its emission of GHGs with the
associated release of N2O. This begs the question: are there undiscovered
methods in which the GHG footprint of the facility can be reduced and/or the
generation of power increased?
This thesis has attempted to answer this question with multidisciplinary and
multifaceted analysis of the feasibility for the novel utilisation of biogas and
recovered ammonia from digestate liquor. This has included the development,
optimisation and interpretation of process models that investigate ammonia
recovery via air stripping, absorption and distillation with associated economic
studies. These have been bookended by experimental work that act as anchor
points for the process and economic models. The characterisation of Esholt
wastewater treatment plant streams, discussed in Chapter 3, acts as a tangible
foundation for the rest of thesis, informing on ammonia concentrations, energy

223
use and emission of GHGs. The lab-scale generation and analysis of H2-rich
syngas from combined ammonia decomposition and steam methane reforming
is discussed in Chapter 7, which evaluates how closely equilibrium model
feedstock conversions can be replicated during real operation.
8.1 Ammonia recovery
A review of literature found that the current primary justification for ammonia
recovery from digestate liquor is for the generation of fertiliser. However, the
fertilisers produced from digestate liquor are inferior to commercial
alternatives. This makes it difficult to acquire the profit necessary for wide -
scale roll out. In Chapter 4, Aspen Plus process simulation software was used
to replicate the conventional initial stage of ammonia recovery informed from
literature, air stripping. Sensitivity analysis carried out on the operational
conditions of the air stripper detailed the requirements to facilitate a minimum
95% recovery of ammonia and showcased the least energy intensive conditions
to use.
After air stripping, the method of ammonia recovery splits from the
conventional and a novel process has been developed. The second stage is an
absorption step using water, as opposed to sulphuric acid, which would poison
downstream catalysts used for thermochemical conversions. Again, sensitivity
analysis was performed to determine the most effective and least energy
intensive conditions. The final stage utilises a distillation column in which a
final recovery of 91% of the ammonia originally found in the digestate liquor is
facilitated. At Esholt WWTP, this would provide an annual diversion of 400.7
tonnes of ammonia from the activated sludge process. It was calculated that
this quantity was enough to reduce the facility’s GHG emissions by 12.12% of
its total or 2.45 kg per year for each person serviced by the facility. It was also
enough to reduce the plant’s energy consumption by 8%.
The associated economic study of the process developed in Aspen Plus, detailed
a capital investment requirement of £1.7 million. An NPV analysis, with a 10%

224
discount rate, indicated that the diverted ammonia would need to have a value
of £1.87 per kg for it to be financially attractive to Esholt WWTP. This was found
to be more than the equivalent market price of its fertiliser competitor but its
added value to the facility as a feedstock for a solid oxide fuel cell (SOFC) stack
or H2 production showed promise.
8.2 SOFC operation
A combination of numerical and process modelling methods were used in
Chapter 5 to investigate the production of heat and power from a high
temperature, internally reforming SOFC. A review of literature had shown that
the combined use of ammonia and methane in a SOFC had been the subject of
experimental investigation before. However, the whole-system development
and modelling of a process that combines the recovery of ammonia from a
renewable source for direct use in a SOFC stack was entirely novel and
facilitated the publication of Grasham et al. [282].
The developed process model incorporated the ammonia recovery procedure
proposed in Chapter 4 with the simulation of the described SOFC. The material
flows of digestate liquor and biomethane as discussed in Chapter 3 were used
as inputs for the model so that impacts for process introduction at Esholt
WWTP could be thoroughly assessed. A numerical model was built that detailed
its ability to operate at a net electrical efficiency of 48%, facilitating a
production of 58.1 MWhel per day; equivalent to an increase of 45% of the site’s
current production total. Of the power produced from the SOFC, it was
calculated that the ammonia’s contribution was roughly 5%.
The associated economic study found that the process introduction at Esholt
WWTP would require a significant initial capital investment of £14.15 million.
However, energy expense savings and income from Contracts for Difference
and Renewable Heat Incentive schemes would facilitate a payback on
investment in just 5.5 years of operation and enable a positive NPV after 8 years
(based on a 10% discount rate).

225
8.3 H2 production
Thorough sensitivity analysis was performed in order to combine the discussed
ammonia recovery process with the thermochemical production of H2. Three
scenarios were analysed for feed molar steam to carbon ratios at the steam
reformer (S:C) of 2, 3 and 4 so that a cost-benefit analysis could be performed
for determining whether achieving higher yields of H2 from greater S:Cs can be
justified energetically and economically. It was shown that if implemented at
Esholt WWTP; 117 kg h-1, 115 kg h-1 and 109 kg h-1 of H2 could be produced
using S:Cs of 4, 3 and 2 respectively. Net production of heat had an inverse
relationship with the S:C at 9.6 MWh day-1, 10.1 MWh day-1 and 15 MWh day-1
for S:C scenarios 4, 3 and 2 respectively.
Ultimately, the economic NPV analysis detailed that the S:C 3 scenario would
be the most profitable; striking a balance between energetic efficiency and H2
production potential. Using a speculated H2 market value of £4.50 kg-1, it was
calculated that an NPV of £3.1 million could be achieved after 20 years of
operation. However, the profitability was found to be highly dependent on the
market value of H2. With the penetration of H2-based infrastructure expected
over the coming years, fluctuations in H2 value are to be expected. As such,
without governmental incentive schemes, it may be difficult to attract investors
to back the initial investment of £13.01 million, with the current status of
uncertainty.
It was also found that the introduction of the H2 production process at Esholt
WWTP would decrease its lifecycle GHG emissions by 10,596 kg CO2e day-1 if
the H2 was to be used as a bus transportation fuel, displacing emissions
associated with combustion of diesel fuel. However, it should be noted that the
compression, storage and dispensing system suggested in Chapter 6 has a
significant impact on the sustainability and feasibility of the process
introduction. Future work should explore alternatives such as grid injection,
which would coincide well with the research trend exemplified by H21 Leeds
Citygate [33] and HyDeploy [34].
-Al2O3 catalyst was used in a packed-bed reactor
with a WHSV of 2 to perform experimental analysis of combined ammonia

226
decomposition and steam methane reforming (SMR). S:Cs of 2, 3 and 4 and
temperatures of 700 °C, 750 °C and 800 °C were analysed. Ammonia
decomposition efficiency varied between 89.2% and 95.2% with a slight
positive relationship with temperature. However, this was less than the 99%
projected via equilibrium investigation. SMR and water-gas shift (WGS)
reaction efficiencies were also shown to be less than equilibrium projections,
facilitating H2 production yields between 14.8% and 18.3% less than expected
under equilibrium.
However, there are multiple areas in which the experimental procedure could
be improved upon; with particular emphasis on the use of a gaseous ammonia
inlet rather than an aqueous one. The aqueous feedstock used in the
experiments experienced considerable volatilisation of ammonia over time
which affected the ability to draw strong and defined conclusions from the
work. Regardless, it was showcased that using a catalyst of commercial
formulation, enabled combined ammonia decomposition and SMR and
facilitated respectable conversions of both ammonia and methane feedstocks.
8.4 Comparison of process routes
One overarching objective of the thesis was to discover whether via novel
utilisation of recovered ammonia it would be possible to reduce GHG emissions
at wastewater treatment plants. Of the two processes discussed, the H2
production system showcased the greatest potential reduction in lifecycle
emissions at 10,596 kg CO2e day-1 compared to 3,221.91 kg CO2e day-1 for the
SOFC process. This was the case due to the significant savings achieved via CO2
abatement if the H2 generated was to be used as a bus transportation fuel in
replacement of fossil diesel fuel.
However, the SOFC process was shown to be the more financially attractive and
viable option of the two, with a payback period of 5.5 years compared to 7 years
for the H2 production system and a 20 year NPV of £10.7 million compared to
£3.1 million. With the considerable lifecycle emission improvements under the

227
H2 production process, if associated carbon emission reduction incentives can
be rolled out, its potential profitability could be much improved.
8.5 Future direction
In this thesis, chemical process modelling has been an invaluable tool in
developing integrated systems and analysing their overarching feasibility. This
‘whole systems’ approach has enabled the development of processes that could
be installed into wastewater treatment plants tomorrow, if desired. Despite its
virtues, this big picture approach also has its weaknesses in that real-life
operation rarely identically mirrors that of a model – as highlighted in Chapter
7 with experimental H2 production.
As such, there are a number of modelling activities that should be replicated in
an experimental environment to determine their true viability in any future
work. For example, the ammonia recovery process detailed in Chapters 4, 5 and
6 use a proxy digestate liquor composition, containing just water and ammonia.
However, there are many other components that, in real life, could affect the
efficiency of recovery. Furthermore, packing material used in the stripping
column is known to become contaminated if solids are not effectively removed
beforehand and, therefore, would be another interesting area of focus. In
conclusion, experimental ammonia recovery data is one particular area where
communication with the process model could have a significant impact on
results.
There also was no experimental work carried out on SOFC operation. Although
combined ammonia and methane feeds have been physically demonstrated
before, it would still be interesting to analyse any differences using the inlet
compositions described in this thesis. Furthermore, SOFC research is still a
fledgling topic, with systematic and material improvements continually
transpiring. For example, intermediate temperature (IT) SOFCs are showing
the potential to both reduce material costs and maintain high efficiencies.
Accordingly, future study in this area may want to focus on analysis of IT-SOFCs
rather than the higher temperature stacks discussed in this body of work.

228
This thesis utilised the operational framework of a singular wastewater
treatment plant. Its relatively large size makes for a favourable site in which to
implement extensive process additions due to workings of economies of scale.
Accordingly, studies into the viability of process integration at other
wastewater treatment plants of different sizes and nature should be carried
out. Furthermore, normal AD facilities or biorefineries could also be host to the
discussed processes and investigation into implementation feasibility in other
such industries would make for interesting comparisons.
Both H2 production and SOFC process routes showcased abilities to markedly
reduce GHG emissions at WWTPs. However, with the introduction of carbon
capture and storage (CCS) technology, further improvements could be made.
Within both discussed processes an exhaust stream containing a considerable
quantity of carbon is generated; making them perfectly suited for CCS
technology. If financial incentives for CCS are introduced in the UK, its addition
to the processes discussed in this thesis could make the wastewater treatment
industry a spearhead in the fight against climate change and is, therefore, worth
investigation.

229
9 References
[1] NOAA (National Oceanic and Atmospheric Administration). Global
Climate Report - Annual 2017 | State of the Climate | National Centers for
Environmental Information (NCEI) 2018.
https://www.ncdc.noaa.gov/sotc/global/201713 (accessed May 31,
2018).
[2] WMO (World MeteorologicalOrganisation). The state of the global
climatein 2018. 2018.
[3] United Nations. Rio Declaration on Environment and Development.
1992. doi:10.1017/S037689290003157X.
[4] UNFCCC. Finale COP21 2015. http://newsroom.unfccc.int/unfccc-
newsroom/finale-cop21/ (accessed March 21, 2016).
[5] Climate Change Act. Climate Change Act 2008: Chapter 27. 2008.
[6] DECC (Department of Energy and Climate Change). The Carbon Plan:
Delivering our low carbon future. London: Stationary Office; 2011.
[7] DfT, DECC D. UK Bioenergy Strategy. London: Stationary Office; 2012.
[8] DEFRA & DECC. Anaerobic Digestion Strategy and Action Plan. London:
2011.
[9] Alves HJ, Bley Junior C, Niklevicz RR, Frigo EP, Frigo MS, Coimbra-Araújo
CH. Overview of hydrogen production technologies from biogas and the
applications in fuel cells. Int J Hydrogen Energy 2013;38:5215–25.
doi:10.1016/j.ijhydene.2013.02.057.
[10] Ofwat. Water 2020: Appendix 2 Moving beyond waste - further evidence
and analysis 2016. doi:10.1016/j.celrep.2017.09.058.
[11] BEIS (Department of Business Energy & Industrial Strategy). Renewable
electricity and capacity generation. 2018.
[12] Lofrano G, Brown J. Wastewater management through the ages: A history
of mankind. Sci Total Environ 2010;408:5254–64.

230
doi:10.1016/j.scitotenv.2010.07.062.
[13] Ludzack FJ, Ettinger MB. Controlling operation to minimize activated
sludge effluent nitrogen. Water Pollut Control Vederation 1962;34:920–
31.
[14] Barnard JL. Biological nutrient removal without the addition of
chemicals. Water Res 1975;9:485–90. doi:10.1016/0043-
1354(75)90072-X.
[15] CEC – Council of the European Communities. Directive concerning urban
waste water treatment (91/271/EEC). Off J Eur Communities
1991;L135:40-52 (30 May).
[16] CEC – Council of the European Communities. Directive establishing a
framework for Community action in the field of water policy
(2000/60/EC). Off J Eur Communities 2000;L327:1-72 (22 December).
[17] Kampschreur MJ, Temmink H, Kleerebezem R, Jetten MSM, van
Loosdrecht MCM. Nitrous oxide emission during wastewater treatment.
Water Res 2009;43:4093–103. doi:10.1016/j.watres.2009.03.001.
[18] Maurer M, Schwegler P, Larsen T. Nutrients in urine: energetic aspects of
removal and recovery. Water Sci Technol 2003;48:37–46.
[19] Fux C, Siegrist H. Nitrogen removal from sludge digester liquids by
nitrification/denitrification or partial nitritation/anammox:
environmental and economical considerations. Water Sci Technol
2004;50:19–26.
[20] Vaneeckhaute C, Lebuf V, Michels E, Belia E, Vanrolleghem PA, Tack FMG,
et al. Nutrient Recovery from Digestate: Systematic Technology Review
and Product Classification. Waste and Biomass Valorization 2016:1–20.
doi:10.1007/s12649-016-9642-x.
[21] Errico M, Fjerbaek Sotoft L, Kjærhuus Nielsen A, Norddahl B. Treatment
costs of ammonia recovery from biogas digestate by air stripping
analyzed by process simulation. Clean Technol Environ Policy 2017:1–
11. doi:10.1007/s10098-017-1468-0.

231
[22] Fuchs W, Drosg B. Assessment of the state of the art of technologies for
the processing of digestate residue from anaerobic digesters. Water Sci
Technol 2013;67:1984–93. doi:10.2166/wst.2013.075.
[23] Drosg B, Fuchs W, Al Seadi T, Madsen M, Linke B, Seadi T Al, et al. Nutrient
Recovery by Biogas Digestate Processing. IEA Bioenergy 2015:40.
[24] Yuan MH, Chen YH, Tsai JY, Chang CY. Removal of ammonia from
wastewater by air stripping process in laboratory and pilot scales using
a rotating packed bed at ambient temperature. J Taiwan Inst Chem Eng
2015;60:488–95. doi:10.1016/j.jtice.2015.11.016.
[25] Lebuf V, Accoe F, Van Elsacker S, Vaneeckhaute C, Michels E, Meers E, et
al. Techniques for nutrient recovery from digestate: inventory 2013:26.
[26] Bousek J, Scroccaro D, Sima J, Weissenbacher N, Fuchs W. Influence of the
gas composition on the efficiency of ammonia stripping of biogas
digestate. Bioresour Technol 2016;203:259–66.
doi:10.1016/j.biortech.2015.12.046.
[27] Valera-Medina A, Xiao H, Owen-Jones M, David WIF, Bowen PJ. Ammonia
for power. Prog Energy Combust Sci 2018;69:63–102.
doi:10.1016/j.pecs.2018.07.001.
[28] Klerke A, Christensen CH, Nørskov JK, Vegge T. Ammonia for hydrogen
storage: Challenges and opportunities. J Mater Chem 2008.
doi:10.1039/b720020j.
[29] Gondal IA, Masood SA, Khan R. Green hydrogen production potential for
developing a hydrogen economy in Pakistan. Int J Hydrogen Energy
2018;43:6011–39. doi:10.1016/j.ijhydene.2018.01.113.
[30] Karolyte R. Hydrogen with CCS for decarbonised heat in the Scottish
context 2017:1–14.
[31] Demirbas A. Future hydrogen economy and policy. Energy Sources, Part
B Econ Plan Policy 2017;12:172–81.
doi:10.1080/15567249.2014.950394.
[32] Brandon NP, Kurban Z. Clean energy and the hydrogen econo my. Philos

232
Trans R Soc A Math Eng Sci 2017;375:20160400.
doi:10.1098/rsta.2016.0400.
[33] Northern Gas Networks. H21 Leeds City Gate. Leeds City Gate 2016.
[34] HyDeploy. About HyDeploy 2018. https://hydeploy.co.uk/about/
(accessed May 24, 2018).
[35] Valverde L, Rosa F, Bordons C, Guerra J. Energy Management Strategies
in hydrogen Smart-Grids: A laboratory experience. Int J Hydrogen Energy
2016;41:13715–25. doi:10.1016/j.ijhydene.2016.05.279.
[36] Wolf E. Chapter 9 – Large-Scale Hydrogen Energy Storage. Electrochem.
Energy Storage Renew. Sources Grid Balanc., 2015, p. 129–42.
doi:10.1016/B978-0-444-62616-5.00009-7.
[37] Gabriel García Clúa J, Battista H, Mantz RJ, Gallegos NG. Stabilisation of
grid assistance for a renewable hydrogen generation system by min-
projection strategy. IET Control Theory Appl 2016;10:183–9.
doi:10.1049/iet-cta.2014.1327.
[38] ITM POWER. RWE Power-to-Gas Energy Storage System Launched 2015.
http://www.itm-power.com/news-item/rwe-power-to-gas-energy-
storage-system-launched (accessed June 19, 2018).
[39] Agency for Natural Resources and Energy. Compilation of the Revised
Version of the Strategic Roadmap for Hydrogen and Fuel Cells 2016.
http://www.meti.go.jp/english/press/2016/0322_05.html (accessed
May 1, 2018).
[40] Air Resources Board. Fuel Cell Electric Vehicle Deployment and
Hydrogen Fuel Station Network Development. Calif Environ Prot Agency
2017.
[41] Department for Transport. New greener police cars to run on hydrogen -
GOV.UK 2018. https://www.gov.uk/government/news/new-greener-
police-cars-to-run-on-hydrogen (accessed May 24, 2018).
[42] Department for Transport and Office for Low Emission Vehicles. £23
million boost for hydrogen-powered vehicles and infrastructure -

233
GOV.UK 2017. https://www.gov.uk/government/news/23-million-
boost-for-hydrogen-powered-vehicles-and-infrastructure (accessed
May 24, 2018).
[43] ADBA. Anaerobic Digestion Market report July 2015. 2015.
[44] Tram VO P, Ngo HH, Guo W, Zhou JL, Nguyen PD, Listowski A, et al. A mini-
review on the impacts of climate change on wastewater reclamation and
reuse. Sci Total Environ 2014;494–495:9–17.
doi:10.1016/j.scitotenv.2014.06.090.
[45] Guest JS, Skerlos SJ, Barnard JL, Beck MB, Daigger GT, Hilger H, et al. A
new planning and design paradigm to achieve sustainable resource
recovery from wastewater. Environ Sci Technol 2009;43:6126–30.
doi:10.1021/es9010515.
[46] McCarty PL, Bae J, Kim J. Domestic wastewater treatment as a net energy
producer - can this be achieved? Environ Sci Technol 2011;45:7100–6.
doi:10.1021/es2014264.
[47] Chudoba P, Sardet C, Palko G, Guibelin E. Main factors influencing
anaerobic digestion of sludge and energy efficiency at several large
WWTP in central Europe. J Residuals Sci Technol 2011;8:89–96.
[48] Larsen TA, Alder AC, Eggen RIL, Maurer M, Lienert J. Source separation:
Will we see a paradigm shift in wastewater handling? Environ Sci
Technol 2009;43:6121–5. doi:10.1021/es803001r.
[49] Silva C, Rosa MJ. Energy performance indicators of wastewater
treatment: a field study with 17 Portuguese plants. Water Sci Technol
2015;72:510–9. doi:10.2166/wst.2015.189.
[50] Schaubroeck T, De Clippeleir H, Weissenbacher N, Dewulf J, Boeckx P,
Vlaeminck SE, et al. Environmental sustainability of an energy self-
sufficient sewage treatment plant: improvements through DEMON and
co-digestion. Water Res 2015;74:166–79.
doi:10.1016/j.watres.2015.02.013.
[51] Siegrist H, Salzgeber D, Eugster J, Joss A. Anammox brings WWTP closer

234
to energy autarky due to increased biogas production and reduced
aeration energy for N-removal 2008.
[52] WERF. Energy Management Exploratory Team Report Executive
Summary 2011.
[53] Trendewicz AA, Braun RJ. Techno-economic analysis of solid oxide fuel
cell-based combined heat and power systems for biogas utilization at
wastewater treatment facilities. J Power Sources 2013;233:380–93.
doi:10.1016/j.jpowsour.2013.01.017.
[54] MosayebNezhad M, Mehr AS, Gandiglio M, Lanzini A, Santarelli M.
Techno-economic assessment of biogas-fed CHP hybrid systems in a real
wastewater treatment plant. Appl Therm Eng 2018;129:1263–80.
doi:10.1016/j.applthermaleng.2017.10.115.
[55] Gandiglio M, Torino P, Lanzini A, Torino P, Torino P. Industrial Size
Biogas SOFC System in a Wastewater Treatment Plant. Proc. ASME 2016
14th Int. Conf. Fuel Cell Sci. Eng. Technol., Charlotte, North Carolina:
2016.
[56] EG&G Technical Services I. Fuel Cell Handbook. Fuel Cell 2004;7
Edition:1–352. doi:10.1002/zaac.200300050.
[57] Garrido JM, Fdz-Polanco M, Fdz-Polanco F. Working with energy and
mass balances: a conceptual framework to understand the limits of
municipal wastewater treatment. Water Sci Technol 2013;67:2294.
doi:10.2166/wst.2013.124.
[58] IPCC IPOCC. Climate Change 2007 - The Physical Science Basis: Working
Group I Contribution to the Fourth Assessment Report of the IPCC.
Science (80- ) 2007:1009. doi:volume.
[59] Law Y, Ye L, Pan Y, Yuan Z. Nitrous oxide emissions from wastewater
treatment processes. Philos Trans R Soc Lond B Biol Sci 2012;367:1265–
77. doi:10.1098/rstb.2011.0317.
[60] Hajjaji N, Martinez S, Trably E, Steyer J-P, Helias A. Life cycle assessment
of hydrogen production from biogas reforming. Int J Hydrogen Energy

235
2016;41:6064–75. doi:10.1016/j.ijhydene.2016.03.006.
[61] Reinders M, Beckhaus P, Illing F, Misz U, Riße H, Schröder M, et al. Biogas
as a source for producing hydrogen at wastewater treatment plants –
EuWaK – A pilot project. Int J Hydrogen Energy 2015;40:8601–6.
doi:10.1016/j.ijhydene.2015.05.042.
[62] Zin RM, Ross a B, Jones JM, Dupont V. Hydrogen from ethanol reforming
with aqueous fraction of pine pyrolysis oil with and without chemical
looping. Bioresour Technol 2015;176:257–66.
doi:10.1016/j.biortech.2014.11.034.
[63] Ni M, Leung DYC, Leung MKH. Mathematical modeling of ammonia-fed
solid oxide fuel cells with different electrolytes. Int J Hydrogen Energy
2008;33:5765–72. doi:10.1016/j.ijhydene.2008.07.021.
[64] Yang J, Akagi T, Okanishi T, Muroyama H, Matsui T, Eguchi K. Catalytic
influence of oxide component in Ni-based cermet anodes for ammonia-
fueled solid oxide fuel cells. Fuel Cells 2015;15:390–7.
doi:10.1002/fuce.201400135.
[65] Wojcik A, Middleton H, Damopoulos I, Van Herle J. Ammonia as a fuel in
solid oxide fuel cells. J Power Sources 2003;118:342–8.
doi:10.1016/S0378-7753(03)00083-1.
[66] Ma Q, Peng R, Tian L, Meng G. Direct utilization of ammonia in
intermediate-temperature solid oxide fuel cells. Electrochem Commun
2006;8:1791–5. doi:10.1016/j.elecom.2006.08.012.
[67] Mulder A. The quest for sustainable nitrogen removal technologies.
Water Sci Technol 2003;48:67–75.
[68] Heathwaite AL, Johnes PJ, Peters NE. Trends in nutrients. Hydrol Process
1996;10:263–93. doi:10.1002/(SICI)1099-
1085(199602)10:2<263::AID-HYP441>3.0.CO;2-K.
[69] Cooper P, Day M, Thomas V. Process Options for Phosphorus and
Nitrogen Removal from Wastewater. Water Environ J 1994;8:84–92.
doi:10.1111/j.1747-6593.1994.tb01096.x.

236
[70] Ravishankara AR, Daniel JS, Portmann RW. Nitrous oxide (N2O): the
dominant ozone-depleting substance emitted in the 21st century.
Science 2009;326:123–5. doi:10.1126/science.1176985.
[71] Forster CF. Wastewater Treatment and Technology. London: Thomas
Telford; 2003.
[72] Clay S, Hodgkinson A, Upton J, Green M. Developing acceptable sewage
screening practices. Water Sci Technol 1996;33:229–34.
doi:10.1016/0273-1223(96)00477-5.
[73] Gerardi M. Nitrification and denitrification in the activated sludge
process. New York: John Wiley & Sons, Inc; 2003.
[74] Eckinfelder WW, Argaman Y. Principles of Biological and
Physical/Chemical Nitrogen Removal. In: Sedlak RI, editor. Phosphorus
Nitrogen Remov. from Munic. Wastewater Princ. Pract., vol. 7. 2nd ed.,
Boca Raton, Florida: CRC Press; 1991, p. 3–42.
[75] Wu G, Zheng D, Xing L. Nitritation and N2O Emission in a Denitrification
and Nitrification Two-Sludge System Treating High Ammonium
Containing Wastewater. Water 2014;6:2978–92.
doi:10.3390/w6102978.
[76] Colliver BB, Stephenson T. Production of nitrogen oxide and dinitrogen
oxide by autotrophic nitrifiers. Biotechnol Adv 2000;18:219–32.
doi:10.1016/S0734-9750(00)00035-5.
[77] U.S. Environmental Protection Agency (EPA). Manual: Nitrogen Control
EPAl625/R-93/010. Cincinnati; Washington: Office of Research and
Development Center for Environmental Research Information Risk
Reduction Engineering Laboratory; Office of Wastewater Enforcement
and Compliance; 1993.
[78] Strous M, Heijnen JJ, Kuenen JG, Jetten MSM. The sequencing batch
reactor as a powerful tool for the study of slowly growing anaerobic
ammonium-oxidizing microorganisms. Appl Microbiol Biotechnol
1998;50:589–96. doi:10.1007/s002530051340.

237
[79] Van Dongen UG., Jetten MSM, Van Loosdrecht MCM. The SHARON®-
Anammox® process for treatment of ammonium rich wastewater. Water
Sci … 2001;44:153–60.
[80] Hauck M, Maalcke-Luesken FA, Jetten MSM, Huijbregts MAJ. Removing
nitrogen from wastewater with side stream anammox: What are the
trade-offs between environmental impacts? Resour Conserv Recycl
2016;107:212–9. doi:10.1016/j.resconrec.2015.11.019.
[81] Li Y, Park SY, Zhu J. Solid-state anaerobic digestion for methane
production from organic waste. Renew Sustain Energy Rev
2011;15:821–6. doi:10.1016/j.rser.2010.07.042.
[82] Ziemiński K, Frąc M. Methane fermentation process as anaerobic
digestion of biomass: Transformations, stages and microorganisms.
African J Biotechnol 2014;11:4127–39. doi:10.4314/ajb.v11i18.
[83] Buswell AM, Mueller HF. Mechanism of Methane Fermentation. Ind Eng
Chem 1952;44:550–2. doi:10.1021/ie50507a033.
[84] Nayono SE. Anaerobic Digestion of Organic Solid Waste for Energy
Production. KIT Scientific Publishing; 2010.
[85] Weiland P. Biogas production: current state and perspectives. Appl
Microbiol Biotechnol 2010;85:849–60. doi:10.1007/s00253-009-2246-
7.
[86] Niesner J, Jecha D, Stehlík P. Biogas upgrading technologies: State of art
review in european region. Chem. Eng. Trans., vol. 35, Italian Association
of Chemical Engineering - AIDIC; 2013, p. 517–22.
doi:10.3303/CET1335086.
[87] Appels L, Baeyens J, Degrève J, Dewil R. Principles and potential of the
anaerobic digestion of waste-activated sludge. Prog Energy Combust Sci
2008;34:755–81. doi:10.1016/j.pecs.2008.06.002.
[88] Dewil R, Appels L, Baeyens J. Energy use of biogas hampered by the
presence of siloxanes. Energy Convers Manag 2006;47:1711–22.
doi:10.1016/j.enconman.2005.10.016.

238
[89] Abatzoglou N, Boivin S. A review of biogas purification processes.
Biofuels, Bioprod Biorefining 2009;3:42–71. doi:10.1002/bbb.117.
[90] Awe OW, Zhao Y, Nzihou A, Minh DP, Lyczko N. A Review of Biogas
Utilisation, Purification and Upgrading Technologies. Waste and Biomass
Valorization 2017;8:267–83. doi:10.1007/s12649-016-9826-4.
[91] Daniela Thrän EB, Tobias Persson, Mattias Svensson , Jaqueline Daniel-
Gromke, Jens Ponitka MS, Baldwin J. Biomethane Status and Factors
Affecting Market Development and Trade. IEA Bioenergy 2014:1–92.
http://www.iea-biogas.net/files/daten-
redaktion/download/Technical.
[92] Patterson T, Esteves S, Dinsdale R, Guwy A. An evaluation of the policy
and techno-economic factors affecting the potential for biogas upgrading
for transport fuel use in the UK. Energy Policy 2011;39:1806–16.
doi:10.1016/j.enpol.2011.01.017.
[93] Starr K, Gabarrell X, Villalba G, Talens L, Lombardi L. Life cycle
assessment of biogas upgrading technologies. Waste Manag
2012;32:991–9. doi:10.1016/j.wasman.2011.12.016.
[94] Muñoz R, Meier L, Diaz I, Jeison D. A review on the state-of-the-art of
physical/chemical and biological technologies for biogas upgrading. Rev
Environ Sci Biotechnol 2015;14:727–59. doi:10.1007/s11157-015-
9379-1.
[95] Persson M, Jonsson O, Wellinger A. Biogas Upgrading to Vehicle Fuel
Standards and Grid Injection Task 37 -Energy from Biogas and Landfill
Gas. IEA Bioenergy 2006.
[96] Muñoz R, Meier L, Diaz I, Jeison D. A review on the state-of-the-art of
physical/chemical and biological technologies for biogas upgrading. Rev
Environ Sci Bio/Technology 2015;14:727–59. doi:10.1007/s11157-015-
9379-1.
[97] De Arespacochaga N, Valderrama C, Peregrina C, Mesa C, Bouchy L,
Cortina JL. Evaluation of a pilot-scale sewage biogas powered 2.8
kW<inf>e</inf> Solid Oxide Fuel Cell: Assessment of heat-to-power ratio

239
and influence of oxygen content. J Power Sources 2015;300:325–35.
doi:10.1016/j.jpowsour.2015.09.086.
[98] Ryckebosch E, Drouillon M, Vervaeren H. Techniques for transformation
of biogas to biomethane. Biomass and Bioenergy 2011;35:1633–45.
doi:10.1016/j.biombioe.2011.02.033.
[99] EC (European Comission). Report from the Commission to the Council
and the European Parliament on the implementation of community
waste legislation for the period 2001–2003. COM 406 Final Eur
Commision, Brussels 2006.
[100] Smith SR, Alcock RE, Sweetman A, Jones KC, Aranda JM, O’Connor GA, et
al. Organic contaminants in sewage sludge (biosolids) and their
significance for agricultural recycling. Philos Trans A Math Phys Eng Sci
2009;367:4005–41. doi:10.1098/rsta.2009.0154.
[101] BSI. PAS 110:2014 Specification for whole digestate, separated liquor
and separated fibre derived from the anaerobic digestion of source-
segregated biodegradable materials. London: British Standards
Institution; 2014.
[102] ADBA. Digestate. Pract. Guid. to AD, London: Anaerobic Digestion &
Biogas Association; 2013, p. 81–91.
[103] Al Seadi T, Fuchs W. Biogas Digestate Quality and Utilisation. In:
Wellinger A, Murphy JD, Baxter D, editors. Biogas Handb. Sci. Prod. Appl.,
Cambridge, Philadelphia, Delhi: Woodhead Publishing; 2013, p. 267–301.
doi:10.1533/9780857097415.2.191.
[104] Dungait JAJ, Cardenas LM, Blackwell MSA, Wu L, Withers PJA, Chadwick
DR, et al. Advances in the understanding of nutrient dynamics and
management in UK agriculture. Sci Total Environ 2012;434:39–50.
doi:10.1016/j.scitotenv.2012.04.029.
[105] Ott C, Rechberger H. The European phosphorus balance. Resour Conserv
Recycl 2012;60:159–72. doi:10.1016/j.resconrec.2011.12.007.
[106] Jones DL, Cross P, Withers PJA, DeLuca TH, Robinson DA, Quilliam RS, et

240
al. REVIEW: Nutrient stripping: the global disparity between food
security and soil nutrient stocks. J Appl Ecol 2013;50:851–62.
doi:10.1111/1365-2664.12089.
[107] Drosg B, Fuchs W, Al Seadi T, Madsen M, Linke B. Nutrient Recovery by
Biogas Digestate Processing. IEA Bioenergy 2015.
[108] Bauer A, Mayr H, Hopfner-Sixt K, Amon T. Detailed monitoring of two
biogas plants and mechanical solid–liquid separation of fermentation
residues. J Biotechnol 2009;142:56–63.
doi:10.1016/j.jbiotec.2009.01.016.
[109] US EPA & US ED. Energy STAR performance ratings. Technical
methodology for wastewater treatment plants 2007.
[110] Lidkea TR. Energy use by sewage treatment plants 2007.
[111] Fenu A, Roels J, Wambecq T, De Gussem K, Thoeye C, De Gueldre G, et al.
Energy audit of a full scale MBR system. Desalination 2010;262:121–8.
doi:10.1016/j.desal.2010.05.057.
[112] Jonasson M. Energy Benchmark for Wastewater Treatment Processes: A
comparison between Sweden and Austria. Lund University, Sweden,
2007.
[113] Perry RH, Green DW. Perry’s Chemical Engineers’ Handbook. 8th ed. New
York: McGraw-Hill; 2008. doi:10.1036/0071511334.
[114] Brown & Caldwell. Evaluation of Combined Heat and Power
Technologies for Wastewater Facilities. EPA 2012;832-R-10–0.
[115] Kahlbaum GWA, Darbishire FV, editors. Letters of Faraday and
Schoenbein 1836-1862. London: Williams and Norgate; 1899.
[116] Ni M, Leung M, Sumathy K, Leung D. Potential of renewable hydrogen
production for energy supply in Hong Kong. Int J Hydrogen Energy
2006;31:1401–12. doi:10.1016/j.ijhydene.2005.11.005.
[117] Hacatoglu K, Rosen MA, Dincer I. Comparative life cycle assessment of
hydrogen and other selected fuels. Int J Hydrogen Energy 2012;37:9933–
40. doi:10.1016/j.ijhydene.2012.04.020.

241
[118] Holladay JD, Hu J, King DL, Wang Y. An overview of hydrogen production
technologies. Catal Today 2009;139:244–60.
doi:10.1016/j.cattod.2008.08.039.
[119] Ball M, Wietschel M. The future of hydrogen – opportunities and
challenges☆. Int J Hydrogen Energy 2009;34:615–27.
doi:10.1016/j.ijhydene.2008.11.014.
[120] Ramachandran R. An overview of industrial uses of hydrogen. Int J
Hydrogen Energy 1998;23:593–8. doi:10.1016/S0360-3199(97)00112-
2.
[121] Bockris JOM. A hydrogen economy. Science (80- ) 1972;176:1323.
[122] Rosen MA. The Prospects for Hydrogen as an Energy Carrier: An
overview of Hydrogen Energy and Hydrogen Energy Systems. In:
Honnery DR, Moriarty P, editors. Hydrog. Prod. Prospect. Process., New
York: Nova Science Publishers; 2012.
[123] Rigas F, Amyotte P. Hydrogen Safety. Boca Raton, Florida: CRC Press,
Taylor & Francis Group; 2013.
[124] Crowl DA, Jo Y-D. The hazards and risks of hydrogen. J Loss Prev Process
Ind 2007;20:158–64. doi:10.1016/j.jlp.2007.02.002.
[125] DeLuchi MA. Hydrogen vehicles: an evaluation of fuel storage,
performance, safety, environmental impacts, and cost. Int J Hydrogen
Energy 1989;14:81–130. doi:10.1016/0360-3199(89)90001-3.
[126] Louthan MR. The Hindenburg and the hydrogen economy. Adv Mater
Process 2005;163:42.
[127] Edwards PP. Our fear of hydrogen fuel stations. The TImes 2008.
[128] Ricci M, Bellaby P, Flynn R. What do we know about public perceptions
and acceptance of hydrogen? A critical review and new case study
evidence. Int J Hydrogen Energy 2008;33:5868–80.
doi:10.1016/j.ijhydene.2008.07.106.
[129] Yetano Roche M, Mourato S, Fischedick M, Pietzner K, Viebahn P. Public
attitudes towards and demand for hydrogen and fuel cell vehicles: A

242
review of the evidence and methodological implications. Energy Policy
2010;38:5301–10. doi:10.1016/j.enpol.2009.03.029.
[130] Muradov NZ. Production of Hydrogen from Hydrocarbons. In: Gupta RB,
editor. Hydrog. Fuel Prod. Transp. Storage, Boca Raton, Florida: CRC
Press, Taylor & Francis Group; 2008.
[131] Ersoz A, Olgun H, Ozdogan S. Reforming options for hydrogen production
from fossil fuels for PEM fuel cells. J Power Sources 2006;154:67–73.
doi:10.1016/j.jpowsour.2005.02.092.
[132] Sircar S, Golden TC. Purification of Hydrogen by Pressure Swing
Adsorption. Sep Sci Technol 2006.
[133] Ross J. Heterogeneous Catalysis - Fundamentals and Applications.
Amsterdam & Oxford: Elsevier; 2012.
[134] Rostrup-Nielsen J, Hansen JHB. CO2-Reforming of Methane over
Transition Metals. J Catal 1993;144:38–49. doi:10.1006/jcat.1993.1312.
[135] Beurden P Van. On the catalytic aspects of steam-methane reforming.
ECN 2004:1–27.
[136] Twigg M V., editor. Catalyst Handbook. 2nd ed. London: Wolfe; 1989.
[137] Sehested J, Gelten JAP, Remediakis IN, Bengaard H, Nørskov JK. Sintering
of nickel steam-reforming catalysts: effects of temperature and steam
and hydrogen pressures. J Catal 2004;223:432–43.
doi:10.1016/j.jcat.2004.01.026.
[138] Lakhapatri SL, Abraham MA. Deactivation due to sulfur poisoning and
carbon deposition on Rh-Ni/Al2O3 catalyst during steam reforming of
sulfur-doped n-hexadecane. Appl Catal A Gen 2009;364:113–21.
doi:10.1016/j.apcata.2009.05.035.
[139] Rodriguez JA. The chemical properties of bimetallic surfaces: Importance
of ensemble and electronic effects in the adsorption of sulfur and SO2.
Prog Surf Sci 2006;81:141–89. doi:10.1016/j.progsurf.2006.02.001.
[140] Samorjai GA. Introduction to Surface Chemistry and Catalysis. New York:
Wiley Interscience; 1994.

243
[141] Trimm DL. Coke formation and minimisation during steam reforming
reactions. Catal Today 1997;37:233–8. doi:10.1016/S0920-
5861(97)00014-X.
[142] Song C, Ma X. New design approaches to ultra-clean diesel fuels by deep
desulfurization and deep dearomatization. Appl Catal B Environ
2003;41:207–38. doi:10.1016/S0926-3373(02)00212-6.
[143] Hoguet J-C, Karagiannakis GP, Valla JA, Agrafiotis CC, Konstandopoulos
AG. Gas and liquid phase fuels desulphurization for hydrogen production
via reforming processes. Int J Hydrogen Energy 2009;34:4953–62.
doi:10.1016/j.ijhydene.2008.11.043.
[144] Ursua A, Gandia LM, Sanchis P. Hydrogen Production From Water
Electrolysis: Current Status and Future Trends. Proc IEEE
2012;100:410–26. doi:10.1109/JPROC.2011.2156750.
[145] National Academy of Science. The Hydrogen Economy: Opportunities,
Costs, Barriers, and R&D Needs. Washington D.C.: National Academies
Press; 2004. doi:10.5860/CHOICE.42-3447.
[146] Winter C-J. Hydrogen energy — Abundant, efficient, clean: A debate over
the energy-system-of-change. Int J Hydrogen Energy 2009;34:S1–52.
doi:10.1016/j.ijhydene.2009.05.063.
[147] Ntaikou I, Antonopoulou G, Lyberatos G. Biohydrogen Production from
Biomass and Wastes via Dark Fermentation: A Review. Waste and
Biomass Valorization 2010;1:21–39. doi:10.1007/s12649-009-9001-2.
[148] De Gioannis G, Muntoni A, Polettini A, Pomi R. A review of dark
fermentative hydrogen production from biodegradable municipal waste
fractions. Waste Manag 2013;33:1345–61.
doi:10.1016/j.wasman.2013.02.019.
[149] Hallenbeck PC, Ghosh D. Advances in fermentative biohydrogen
production: the way forward? Trends Biotechnol 2009;27:287–97.
doi:10.1016/j.tibtech.2009.02.004.
[150] Thauer RK, Jungermann K, Decker K. Energy conservation in

244
chemotrophic anaerobic bacteria. Bacteriol Rev 1977;41:100–80.
[151] Holladay JD, Hu J, King DL, Wang Y. An overview of hydrogen production
technologies. Catal Today 2009;139:244–60.
doi:10.1016/j.cattod.2008.08.039.
[152] Premier GC, Kim JR, Massanet-Nicolau J, Kyazze G, Esteves SRR,
Penumathsa BKV, et al. Integration of biohydrogen, biomethane and
bioelectrochemical systems. Renew Energy 2013;49:188–92.
doi:10.1016/j.renene.2012.01.035.
[153] Bell TE, Torrente-Murciano L. H2 Production via Ammonia
Decomposition Using Non-Noble Metal Catalysts: A Review. Top Catal
2016;59:1438–57. doi:10.1007/s11244-016-0653-4.
[154] Yin SF, Xu BQ, Zhou XP, Au CT. A mini-review on ammonia decomposition
catalysts for on-site generation of hydrogen for fuel cell applications.
Appl Catal A Gen 2004;277:1–9. doi:10.1016/j.apcata.2004.09.020.
[155] Schüth F, Palkovits R, Schlögl R, Su DS. Ammonia as a possible element in
an energy infrastructure: catalysts for ammonia decomposition. Energy
Environ Sci 2012;5:6278–89. doi:10.1039/C2EE02865D.
[156] Wang W, Ran R, Su C, Guo Y, Farrusseng D, Shao Z. Ammonia-mediated
suppression of coke formation in direct-methane solid oxide fuel cells
with nickel-based anodes. J Power Sources 2013;240:232–40.
doi:10.1016/j.jpowsour.2013.04.014.
[157] Xu L, Dong F, Zhuang H, He W, Ni M, Feng SP, et al. Energy upcycle in
anaerobic treatment: Ammonium, methane, and carbon dioxide
reformation through a hybrid electrodeionization–solid oxide fuel cell
system. Energy Convers Manag 2017;140:157–66.
doi:10.1016/j.enconman.2017.02.072.
[158] Shiga H, Shinda K, Hagiwara K, Tsutsumi A, Sakurai M, Yoshida K, et al.
Large-scale hydrogen production from biogas. Int J Hydrogen Energy
1998;23:631–40.
[159] Appari S, Janardhanan VM, Bauri R, Jayanti S, Deutschmann O. A detailed

245
kinetic model for biogas steam reforming on Ni and catalyst deactivation
due to sulfur poisoning. Appl Catal A Gen 2014;471:118–25.
doi:10.1016/j.apcata.2013.12.002.
[160] Chattanathan SA, Adhikari S, McVey M, Fasina O. Hydrogen production
from biogas reforming and the effect of H2S on CH4 conversion. Int J
Hydrogen Energy 2014;39:19905–11.
doi:10.1016/j.ijhydene.2014.09.162.
[161] Cruz PL, Navas-Anguita Z, Iribarren D, Dufour J. Exergy analysis of
hydrogen production via biogas dry reforming. Int J Hydrogen Energy
2018;43:11688–95. doi:10.1016/j.ijhydene.2018.02.025.
[162] Wheeldon I, Caners C, Karan K, Peppley B. Utilization of biogas generated
from Ontario wastewater treatment plants in solid oxide fuel cell
systems: A process modeling study. Int J Green Energy 2007;4:221–31.
doi:10.1080/15435070601015585.
[163] Gao Y, Jiang J, Meng Y, Yan F, Aihemaiti A. A review of recent
developments in hydrogen production via biogas dry reforming. Energy
Convers Manag 2018;171:133–55.
doi:10.1016/j.enconman.2018.05.083.
[164] Abdullah B, Abd Ghani NA, Vo DVN. Recent advances in dry reforming of
methane over Ni-based catalysts. J Clean Prod 2017;162:170–85.
doi:10.1016/j.jclepro.2017.05.176.
[165] Lin C-Y, Lay C-H, Sen B, Chu C-Y, Kumar G, Chen C-C, et al. Fermentative
hydrogen production from wastewaters: A review and prognosis. Int J
Hydrogen Energy 2012;37:15632–42.
doi:10.1016/j.ijhydene.2012.02.072.
[166] Kadier A, Simayi Y, Abdeshahian P, Azman NF, Chandrasekhar K, Kalil MS.
A comprehensive review of microbial electrolysis cells (MEC) reactor
designs and configurations for sustainable hydrogen gas production.
Alexandria Eng J 2016;55:427–43. doi:10.1016/j.aej.2015.10.008.
[167] Zou S, He Z. Efficiently “pumping out” value-added resources from
wastewater by bioelectrochemical systems: A review from energy

246
perspectives. Water Res 2018;131:62–73.
doi:10.1016/j.watres.2017.12.026.
[168] Khan MZ, Nizami AS, Rehan M, Ouda OKM, Sultana S, Ismail IM, et al.
Microbial electrolysis cells for hydrogen production and urban
wastewater treatment: A case study of Saudi Arabia. Appl Energy
2017;185:410–20. doi:10.1016/j.apenergy.2016.11.005.
[169] Cotterill SE, Dolfing J, Jones C, Curtis TP, Heidrich ES. Low Temperature
Domestic Wastewater Treatment in a Microbial Electrolysis Cell with 1
m2Anodes: Towards System Scale-Up. Fuel Cells 2017;17:584–92.
doi:10.1002/fuce.201700034.
[170] Liu L, Pang C, Wu S, Dong R. Optimization and evaluation of an air-
recirculated stripping for ammonia removal from the anaerobic
digestate of pig manure. Process Saf Environ Prot 2015;94:350–7.
doi:10.1016/j.psep.2014.08.006.
[171] Collivignarelli C, Bertanza G, Baldi M, Avezzu F. Ammonia stripping from
MSW landfill leachate in bubble reactors: process modeling and
optimization. Waste Manag Res 1998;16:455–66.
doi:10.1177/0734242X9801600508.
[172] Larsen T a., Udert KM, Lienert J. Source Separation and Decentralization
for Wastewater Management. IWA Publ 2013:491.
doi:10.1017/CBO9781107415324.004.
[173] Jardin N, Thöle D, Wett B. Treatment of sludge return liquors:
Experiences from the operation of full-scale plants. Weftec 2006
2006;1991:5237–55.
[174] Bonmatí A, Flotats X. Air stripping of ammonia from pig slurry:
Characterisation and feasibility as a pre- or post-treatment to mesophilic
anaerobic digestion. Waste Manag 2003;23:261–72. doi:10.1016/S0956-
053X(02)00144-7.
[175] Lide D, editor. CRC Handbook of Chemistry and Physics. A Ready-
reference Book of CHemical and Physical Data. Boca Raton: CRC Press;
1993.

247
[176] Hidalgo D, Corona F, Martín-Marroquín JM, del Álamo J, Aguado A.
Resource recovery from anaerobic digestate: struvite crystallisation
versus ammonia stripping. Desalin Water Treat 2016.
doi:10.1080/19443994.2014.1001794.
[177] Siegrist H, Laureni M, Udert KM. Transfer into the gas phase: ammonia
stripping. In: Larsen TA, Udert KM, Lie, editors. Source Sep.
Decentralization Wastewater Manag. 1st ed., London: IWA Publishing;
2013, p. 337–50.
[178] Lei X, Sugiura N, Feng C, Maekawa T. Pretreatment of anaerobic digestion
effluent with ammonia stripping and biogas purification. J Hazard Mater
2007;145:391–7. doi:10.1016/j.jhazmat.2006.11.027.
[179] Collings GH. Commercial Fertilizers. 5th ed. New Delhi: Tata McGraw-
Hill; 1955.
[180] Heffer P, Prud’homme M. Global Nitrogen Fertiliser Demand and Supply:
Trend, Current Level and Outlook. Int Fertil Assoc 2016.
[181] Perry RH, Green DW. Chemical Engineers’ Handbook Seventh. 7th ed.
New York: McGraw-Hill; 1997. doi:10.1021/ed027p533.1.
[182] Metcalf & Eddy Inc. Wastewater Engineering: Treatment and Reuse. 4th
ed. Boston: McGraw-Hill; 2003.
[183] Huang J, Shang C. Air stripping. Adv Physicochem Treat Process
2006;4:47–79. doi:10.1016/S0166-1116(08)70529-6.
[184] Kinidi L, Ai I, Tan W, Binti N, Wahab A, Fikri K, et al. Recent Development
in Ammonia Stripping Process for Industrial Wastewater Treatment. Int
J Chem Eng 2018;2018.
[185] Saracco G, Genon G. High temperature ammonia stripping and recovery
from process liquid wastes. J Hazard Mater 1994;37:191–206.
doi:10.1016/0304-3894(94)85048-8.
[186] Liu B, Giannis A, Zhang J, Chang VWC, Wang JY. Air stripping process for
ammonia recovery from source-separated urine: Modeling and
optimization. J Chem Technol Biotechnol 2015;90:2208–17.

248
doi:10.1002/jctb.4535.
[187] RVT. Ammonia recovery Removal from liquids and gases 2015.
http://www.rvtpe.net/wp-
content/uploads/prospekte/RVT_Ammonia_Recovery_120529.pdf
(accessed September 14, 2018).
[188] SSM (Solids Sewage Manure). ANAStrip Technology 2009.
http://www.ssm-technology.com/ (accessed February 11, 2019).
[189] ACWA. Air Stripping 1996. http://www.acwa.co.uk/air_stripping
(accessed February 11, 2019).
[190] Anaergia. Nutrients and Digestate Management n.d.
https://www.anaergia.com/what-we-do/wastewater-resource-
recovery/nutrient-recovery-and-biosolids-management (accessed
February 11, 2019).
[191] Monroe Environmental. Air Strippers. 2018.
[192] Branch Environmental Corp. Ammonia Strippers 2018.
https://www.branchenv.com/ammonia-stripper/ (accessed February
11, 2019).
[193] CECO-HEE Environmental Engineering. Air Stripped Tower Model HAST.
2018.
[194] Nijhuis Industries. NIJHUIS AECO-NAR Efficient ammonia removal from
digestate and production of green fertilizer. 2017.
[195] Colsen. AMFER - Removal of ammonia from digestate and waste water.
2015.
[196] CMI. Expert of AIR STRIPPING SOLUTIONS. 2016.
[197] Teichgräber B, Stein A. Nitrogen elimination from sludge treatment
reject water – comparison of the steam-stripping and denitrification
processes. Water Sci Technol 1994;30:41–51.
[198] Zeng L, Mangan C, Li X. Ammonia recovery from anaerobically digested
cattle manure by steam stripping. Water Sci Technol 2006;54:137–45.

249
doi:10.2166/wst.2006.852.
[199] Mondor M, Masse L, Ippersiel D, Lamarche F, Massé DI. Use of
electrodialysis and reverse osmosis for the recovery and concentration
of ammonia from swine manure. Bioresour Technol 2008;99:7363–8.
doi:10.1016/j.biortech.2006.12.039.
[200] McCutcheon JR, McGinnis RL, Elimelech M. Desalination by ammonia-
carbon dioxide forward osmosis: Influence of draw and feed solution
concentrations on process performance. J Memb Sci 2006;278:114–23.
doi:10.1016/j.memsci.2005.10.048.
[201] Reeves TG. Nitrogen removal: a literature review. Water Pollut Control
Fed Water Environ Fed 1972;44:1895–908.
[202] Maurer M, Pronk W, Larsen TA. Treatment processes for source-
separated urine. Water Res 2006;40:3151–66.
doi:10.1016/j.watres.2006.07.012.
[203] Cath TY, Childress AE, Elimelech M. Forward osmosis: Principles,
applications, and recent developments. J Memb Sci 2006;281:70–87.
doi:10.1016/j.memsci.2006.05.048.
[204] Xie M, Shon HK, Gray SR, Elimelech M. Membrane-based processes for
wastewater nutrient recovery: Technology, challenges, and future
direction. Water Res 2016;89:210–21.
doi:10.1016/j.watres.2015.11.045.
[205] Zarebska A, Nieto DR, Christensen K V., Norddahl B. Ammonia recovery
from agricultural wastes by membrane distillation: Fouling
characterization and mechanism. Water Res 2014;56:1–10.
doi:10.1016/j.watres.2014.02.037.
[206] Thygesen O, Hedegaard MAB, Zarebska A, Beleites C, Krafft C. Membrane
fouling from ammonia recovery analyzed by ATR-FTIR imaging. Vib
Spectrosc 2014;72:119–23. doi:10.1016/j.vibspec.2014.03.004.
[207] Ellamla HR, Staffell I, Bujlo P, Pollet BG, Pasupathi S. Current status of fuel
cell based combined heat and power systems for residential sector. J

250
Power Sources 2015;293:312–28. doi:10.1016/j.jpowsour.2015.05.050.
[208] Hajimolana SA, Hussain MA, Daud WMAW, Soroush M, Shamiri A.
Mathematical modeling of solid oxide fuel cells: A review. Renew Sustain
Energy Rev 2011;15:1893–917. doi:10.1016/j.rser.2010.12.011.
[209] Nagel FP, Schildhauer TJ, Biollaz SMA. Biomass-integrated gasification
fuel cell systems - Part 1: Definition of systems and technical analysis. Int
J Hydrogen Energy 2009;34:6809–25.
doi:10.1016/j.ijhydene.2009.05.125.
[210] Park J, Li P, Bae J. Analysis of chemical, electrochemical reactions and
thermo-fluid flow in methane-feed internal reforming SOFCs: Part i -
Modeling and effect of gas concentrations. Int J Hydrogen Energy
2012;37:8512–31. doi:10.1016/j.ijhydene.2012.02.110.
[211] Lee AL, Zabransky RF, Huber WJ. Internal reforming development for
solid oxide fuel cells. Ind Eng Chem Res 1990;29:766–73.
doi:10.1021/ie00101a009.
[212] Lisbona P, Corradetti A, Bove R, Lunghi P. Analysis of a solid oxide fuel
cell system for combined heat and power applications under non-
nominal conditions. Electrochim Acta 2007;53:1920–30.
doi:10.1016/j.electacta.2007.08.046.
[213] Ni M, Leung MKH, Leung DYC. Ammonia-fed solid oxide fuel cells for
power generation - A review. Int J Energy Res 2009;33:943–59.
doi:10.1002/er.
[214] Lin Y, Ran R, Guo Y, Zhou W, Cai R, Wang J, et al. Proton-conducting fuel
cells operating on hydrogen, ammonia and hydrazine at intermediate
temperatures. Int J Hydrogen Energy 2010;35:2637–42.
doi:10.1016/j.ijhydene.2009.04.019.
[215] Gao H, Scherson YD, Wells GF, Rockstrom J, Steffen W, Noone K, et al.
Towards energy neutral wastewater treatment: methodology and state
of the art. Environ Sci Process Impacts 2014;16:1223.
doi:10.1039/c4em00069b.

251
[216] Gandiglio M, Lanzini A, Soto A, Leone P, Santarelli M. Enhancing the
Energy Efficiency of Wastewater Treatment Plants through Co-digestion
and Fuel Cell Systems. Front Environ Sci 2017;5:1–21.
doi:10.3389/fenvs.2017.00070.
[217] Qadir Z. DEMOSOFC: Turning waste into energy in Turin, Italy |
Sustainable Gas Institute. Sustain Gas Inst 2018.
https://www.sustainablegasinstitute.org/demosofc-turning-waste-
into-energy-in-turin-italy/ (accessed September 17, 2018).
[218] Vakouftsi E, Marnellos GE, Athanasiou C, Coutelieris F. CFD modeling of a
biogas fuelled SOFC. Solid State Ionics 2011;192:458–63.
doi:10.1016/j.ssi.2010.05.051.
[219] Zakrzewska B, Pianko-Oprych P, Jaworski Z. Multiscale Modeling of Solid
Oxide Fuel Cell Systems. Chemie Ing Tech 2014;86:1029–43.
doi:10.1002/cite.201400022.
[220] Beale SB. Numerical models for planar solid oxide fuel cells. In: Sundén
B, Faghri M, editors. Transp. Phenom. fuel cells, vol. 10, Southampton, UK:
WIT Press; 2005. doi:10.2495/1-85312-840-6/02.
[221] Perna A, Minutillo M, Jannelli E, Cigolotti V, Nam SW, Yoon KJ.
Performance assessment of a hybrid SOFC/MGT cogeneration power
plant fed by syngas from a biomass down-draft gasifier. Appl Energy
2017:1–13. doi:10.1016/j.apenergy.2017.08.077.
[222] Minutillo M, Perna A, Jannelli E. SOFC and MCFC system level modeling
for hybrid plants performance prediction. Int J Hydrogen Energy
2014;39:21688–99. doi:10.1016/j.ijhydene.2014.09.082.
[223] Costamagna P, Selimovic A, Del Borghi M, Agnew G. Electrochemical
model of the integrated planar solid oxide fuel cell (IP-SOFC). Chem Eng
J 2004;102:61–9. doi:10.1016/j.cej.2004.02.005.
[224] Ameri M, Mohammadi R. Simulation of an atmospheric SOFC and gas
turbine hybrid system using Aspen Plus software. Int J Energy Res
2013;37:412–25. doi:10.1002/er.

252
[225] Wiranarongkorn K, Im-Orb K, Ponpesh P, Patcharavorachot Y,
Arpornwichanop A. Design and evaluation of the sorption enhanced
steam reforming and solid oxide fuel cell integrated system with anode
exhaust gas recirculation for combined heat and power generation. Chem
Eng Trans 2017;57:97–102. doi:10.3303/CET1757017.
[226] Doherty W, Reynolds A, Kennedy D. Process simulation of biomass
gasification integrated with a solid oxide fuel cell stack. J Power Sources
2015;277:292–303. doi:10.1016/j.jpowsour.2014.11.125.
[227] Bao C, Wang Y, Feng D, Jiang Z, Zhang X. Macroscopic modeling of solid
oxide fuel cell (SOFC) and model-based control of SOFC and gas turbine
hybrid system. Prog Energy Combust Sci 2018;66:83–140.
doi:10.1016/j.pecs.2017.12.002.
[228] Colantoni A, Giuseppina M, Buccarella M, Cividino S, Vello M. Economical
Analysis of SOFC System for Power Production. Comput. Sci. Its Appl. -
ICCSA, Santander, Spain: 2011, p. 270–6.
[229] Wei M, Smith SJ, Sohn MD. Analysis of Fuel Cell Markets in Japan and the
US : Experience Curve Development and Cost Reduction Disaggregation.
ERNEST ORLANDO LAWRENCE BERKELEY Natl Lab 2016.
[230] Siefert NS, Litster S. Exergy & economic analysis of biogas fueled solid
oxide fuel cell systems. J Power Sources 2014;272:386–97.
doi:10.1016/j.jpowsour.2014.08.044.
[231] Ammermann H, Hoff P, Atanasiu M, Ayloor J, Kaufmann M, Tisler O.
Advancinng Europe’s energy systems: Stationary fuel cells in distributed
generation: A study for the Fuel Cells and Hydrogen Joint Undertaking.
Luxemberg: Publications Office of the European Union; 2015.
[232] Arsalis A. Thermoeconomic modeling and parametric study of hybrid
SOFC – gas turbine – steam turbine power plants ranging from 1 . 5 to 10
MWe. J OfPower Sources 2008;181:313–26.
doi:10.1016/j.jpowsour.2007.11.104.
[233] Cheddie DF. Integration of A Solid Oxide Fuel Cell into A 10 MW Gas
Turbine Power Plant 2010:754–69. doi:10.3390/en3040754.

253
[234] Naja B, Shirazi A, Aminyavari M, Rinaldi F, Taylor RA. Exergetic ,
economic and environmental analyses and multi-objective optimization
of an SOFC-gas turbine hybrid cycle coupled with an MSF desalination
system 2014;334:46–59. doi:10.1016/j.desal.2013.11.039.
[235] Farooque M, Daly J, Leo T, Pais C, Venkataraman R, Wang J-Y, et al. Direct
Fuel Cell Experience on Renewable Biogas. ECS Trans 2011;30:261–70.
doi:10.1149/1.3562481.
[236] Gabrielli P, Gazzani M, Mazzotti M. Electrochemical conversion
technologies for optimal design of decentralized multi-energy systems:
Modeling framework and technology assessment. Appl Energy
2018;221:557–75. doi:10.1016/j.apenergy.2018.03.149.
[237] Lanzini A, Madi H, Chiodo V, Papurello D, Maisano S, Santarelli M, et al.
Dealing with fuel contaminants in biogas-fed solid oxide fuel cell (SOFC)
and molten carbonate fuel cell (MCFC) plants: Degradation of catalytic
and electro-catalytic active surfaces and related gas purification
methods. Prog Energy Combust Sci 2017;61:150–88.
doi:10.1016/j.pecs.2017.04.002.
[238] Newbery DM. Towards a green energy economy? The EU Energy Union’s
transition to a low-carbon zero subsidy electricity system – Lessons from
the UK’s Electricity Market Reform. Appl Energy 2016.
doi:10.1016/j.apenergy.2016.01.046.
[239] Garton G, Grimwood, Ares E. Energy : The Renewables Obligation
Briefing paper. London: 2016.
[240] Wood G, Dow S. What lessons have been learned in reforming the
Renewables Obligation? An analysis of internal and external failures in
UK renewable energy policy. Energy Policy 2011;39:2228–44.
doi:10.1016/j.enpol.2010.11.012.
[241] Ofgem. Feed-in Tariffs: Essential guide to closure of the scheme 2018.
[242] BEIS. The Future for Small-scale Low-carbon generation - a call for
evidence. 2018.

254
[243] DECC. Electricity market reform: policy overview. 2012.
doi:10.1109/CONECCT.2013.6469293.
[244] DECC. CFD Auction Allocation Round One 2015.
[245] Department of Energy & Climate Change. National Renewable Energy
Action Plan for the United Kingdom Article 4 of the Renewable Energy
Directive. 2009. doi:1st July 2010.
[246] Ofgem. Tariffs and payments: Non-Domestic RHI 2019.
https://www.ofgem.gov.uk/environmental-programmes/non-
domestic-rhi/contacts-guidance-and-resources/tariffs-and-payments-
non-domestic-rhi (accessed February 14, 2019).
[247] Carrère H, Dumas C, Battimelli A, Batstone DJ, Delgenès JP, Steyer JP, et
al. Pretreatment methods to improve sludge anaerobic degradability: A
review. J Hazard Mater 2010;183:1–15.
doi:10.1016/j.jhazmat.2010.06.129.
[248] APHA. Standard Methods for the Examination of Water & Wastewater.
21st ed. Washington D.C.: American Public Health Association; 2005.
[249] Yorkshire Water. Green Apple Award for Esholt Waste Water Treatment
Works 2016. https://www.yorkshirewater.com/about-us/newsroom-
media/green-apple-award-2016 (accessed July 30, 2018).
[250] Mininni G, Laera G, Bertanza G, Canato M, Sbrilli A. Mass and energy
balances of sludge processing in reference and upgraded wastewater
treatment plants. Environ Sci Pollut Res Int 2015;22:7203–15.
doi:10.1007/s11356-014-4013-2.
[251] Baker G. Email to Oliver Grasham, 23 August. 2016.
[252] Baker G. Email to Oliver Grasham, 13 September. 2016.
[253] Ramirez Sosa DR. Resource recovery from co-digestion of organic waste
with surplus activated sludge via the carboxylate platform. University of
Leeds, 2017.
[254] Yorkshire Water. Thermal Hydrolysis Project 2013.
https://yorkshirewater.com/sites/default/files/downloads/Thermal

255
Hydrolysis.pdf.
[255] Abu-Orf M, Goss T. Comparing Thermal Hydrolysis Processes (CAMBITM
and EXELYSTM) For Solids Pretreatmet Prior To Anaerobic Digestion.
Proc Water Environ Fed 2012;2012:1024–36.
doi:10.2175/193864712811693272.
[256] Baker G. Email to Oliver Grasham, 19 December. 2016.
[257] Renewables-UK. Project Details from OFGEM: Esholt STW CHP 2018.
http://renewables-
uk.co.uk/subscriber/details_ofgem.asp?ofgemid=G01258SGEN
(accessed August 15, 2018).
[258] Guerrini A, Romano G, Indipendenza A. Energy efficiency drivers in
wastewater treatment plants: A double bootstrap DEA analysis. Sustain
2017;9:1–13. doi:10.3390/su9071126.
[259] Parravicini V, Svardal K, Krampe J. Greenhouse Gas Emissions from
Wastewater Treatment Plants. Energy Procedia 2016;97:246–53.
doi:10.1016/j.egypro.2016.10.067.
[260] Daelman MRJ, Van Voorthuizen EM, Van Dongen LGJM, Volcke EIP, Van
Loosdrecht MCM. Methane and nitrous oxide emissions from municipal
wastewater treatment - Results from a long-term study. Water Sci
Technol 2013;67:2350–5. doi:10.2166/wst.2013.109.
[261] IPCC. Climate Change 2013: The Physical Science Basis 2013.
[262] Aspen Plus. Aspen Technology. Inc, Version, 88 2015.
[263] Boul PJ, Langez KE, Conger B, Anderson M. Air Stripping Designs and
Reactive Water Purification Processes for the Lunar Surface. Am Inst
Aeronaut Astronaut 2010.
[264] Aspen-HYSYS. Aspen HYSYS - Aspen Physical Property System 2001.
[265] Aspen Plus Economic Analyzer. Aspen Technology. Inc, Version, 10 2017.
[266] Aspen Technology. Aspen Capital Cost Estimator: User Guide 2017.
[267] Alkhayat WA, Gerrard AM. Estimating Manning Levels for Process Plants.

256
Trans. Am. Assoc. Cost Eng., Montreal, Canada: 1984, p. 1.2.1-1.2.4.
[268] Turton R, Bailie RC, Whiting WB, Shaeiwitz JA. Estimation of
Manufacturing Costs. In: Turton R, Bailie RC, Whiting WB, Shaeiwitz JA,
editors. Anal. Synth. Des. Chem. Process. 3rd ed., Upper Saddle River, N.J.:
Prentice Hall; 2008.
[269] Glass Door. Salary: Process Engineer 2018.
https://www.glassdoor.co.uk/Salaries/process-engineer-salary-
SRCH_KO0,16.htm (accessed November 27, 2018).
[270] Office for National Statistics (ONS). Wages and salaries annual growth
rate % 2018.
https://www.ons.gov.uk/economy/grossdomesticproductgdp/timeseri
es/kgq2/qna (accessed November 27, 2018).
[271] Rotunno P, Lanzini A, Leone P. Energy and economic analysis of a water
scrubbing based biogas upgrading process for biomethane injection into
the gas grid or use as transportation fuel. Renew Energy 2017;102:417–
32. doi:10.1016/j.renene.2016.10.062.
[272] Office for national statistics (ONS). RPI All Items: Percentage change over
12 months n.d.
https://www.ons.gov.uk/economy/inflationandpriceindices/timeserie
s/czbh/mm23 (accessed December 4, 2018).
[273] ICIS. ICIS Pricing: Caustic Soda (Europe). 2014.
[274] Agriculture & Horticulture Development Board (ADHB). UK Fertiliser
Price Market Update Monthly average prices for October 2018. 2018.
[275] Locher C, Meyer C, Steinmetz H. Operating experiences with a molten
carbonate fuel cell at Stuttgart-Möhringen wastewater treatment plant.
Water Sci Technol 2012;65:789–94. doi:10.2166/wst.2012.463.
[276] Mehr AS, Gandiglio M, MosayebNezhad M, Lanzini A, Mahmoudi SMS, Yari
M, et al. Solar-assisted integrated biogas solid oxide fuel cell (SOFC)
installation in wastewater treatment plant: Energy and economic
analysis. Appl Energy 2017;191:620–38.

257
doi:10.1016/j.apenergy.2017.01.070.
[277] Singhal SC. Solid oxide fuel cells for stationary, mobile, and military
applications. Solid State Ionics 2002;152–153:405–10.
doi:10.1016/S0167-2738(02)00349-1.
[278] Krishnan VV. Recent developments in metal-supported solid oxide fuel
cells. Wiley Interdiscip Rev Energy Environ 2017;6.
doi:10.1002/wene.246.
[279] Borello D, Del Prete Z, Marchegiani A, Rispoli F, Tortora E. Analysis of an
Integrated PEMFC/ORC Power System Using Ammonia for Hydrogen
Storage. Vol 3 Cycle Innov Educ Electr Power; Fans Blowers; Ind Cogener
2012;3:143. doi:10.1115/GT2012-68599.
[280] Alvarado L, Chen A. Electrodeionization: Principles, strategies and
applications. Electrochim Acta 2014;132:583–97.
doi:10.1016/j.electacta.2014.03.165.
[281] Barbera E, Menegon S, Banzato D, D’Alpaos C, Bertucco A. From biogas to
biomethane: a process simulation-based techno-economic comparison
of different upgrading technologies in the Italian context. Renew Energy
2018;135:663–73. doi:10.1016/j.renene.2018.12.052.
[282] Grasham O, Dupont V, Camargo-Valero MA, García-Gutiérrez P, Cockerill
T. Combined ammonia recovery and solid oxide fuel cell use at
wastewater treatment plants for energy and greenhouse gas emission
improvements. Appl Energy 2019;240:698–708.
doi:10.1016/j.apenergy.2019.02.029.
[283] Campanari S, Iora P. Definition and sensitivity analysis of a finite volume
SOFC model for a tubular cell geometry. J Power Sources 2004;132:113–
26. doi:10.1016/j.jpowsour.2004.01.043.
[284] Spallina V, Mastropasqua L, Iora P, Romano MC, Campanari S.
Assessment of finite volume modeling approaches for intermediate
temperature Solid Oxide Fuel Cells working with CO-rich syngas fuels. Int
J Hydrogen Energy 2015;40:15012–31.
doi:10.1016/j.ijhydene.2015.08.101.
258
[285] Ong KM, Lee WY, Hanna J, Ghoniem AF. Isolating the impact of CO
concentration in syngas mixtures on SOFC performance via internal
reforming and direct oxidation. Int J Hydrogen Energy 2016;41:9035–47.
doi:10.1016/j.ijhydene.2016.03.107.
[286] Lee TS, Chung JN, Chen YC. Design and optimization of a combined fuel
reforming and solid oxide fuel cell system with anode off-gas recycling.
Energy Convers Manag 2011;52:3214–26.
doi:10.1016/j.enconman.2011.05.009.
[287] Batelle Memorial Institute. Manufacturing Cost Analysis of 100 and 250
kW Fuel Cell Systems for Primary Power and Combined Heat and Power
Applications. Columbus, OH: U.S. Departmentof Energy; 2017.
[288] Peters MS, Timmerhaus KD, West RE. Heat-Transfer Equipment - Design
and Costs. Plant Des. Econ. Chem. Eng. 5th ed., New York: McGraw-Hill;
2004, p. 642–754. doi:10.1080/00137915908965075.
[289] Bank of England. Inflation calculator | Bank of England 2018.
https://www.bankofengland.co.uk/monetary-
policy/inflation/inflation-
calculator?number.Sections%5B0%5D.Fields%5B0%5D.Value=150000
&start-year=736.5&end-year=1075 (accessed January 11, 2019).
[290] Ofgem. About the Non-Domestic RHI 2019.
https://www.ofgem.gov.uk/environmental-programmes/non-
domestic-rhi/about-non-domestic-rhi (accessed February 1, 2019).
[291] Ofgem. Tariffs and payments: Non-Domestic RHI 2019.
https://www.ofgem.gov.uk/environmental-programmes/non-
domestic-rhi/contacts-guidance-and-resources/tariffs-and-payments-
non-domestic-rhi (accessed February 1, 2019).
[292] Williams MC, Strarkey JP, Singhal SC. US distributed generation fuel cell
program. In: Brandon N, Thompsett D, editors. Fuel Cells Compend. 1st
ed., Oxford, UK: Elsevier Ltd; 2005, p. 4.
[293] Kaur G. Cell Voltages , Polarisations and Performances. Solid Oxide Fuel
Cell Components, Cham: Springer; n.d. doi:10.1007/978-3-319-25598-9.

259
[294] BEIS, Department for Business E& IS. Updated Energy and Emissions
Projections 2017 2018.
[295] Leigh Fisher. Electricity Generation Costs and Hurdle Rates. 2016.
[296] Ogden JM. Review of Small Stationary Reformers for Hydrogen
Production. Environ Stud 2001:63. doi:IEA/H2/TR-02/002.
[297] Iulianelli A, Liguori S, Wilcox J, Basile A. Advances on methane steam
reforming to produce hydrogen through membrane reactors technology:
A review. Catal Rev - Sci Eng 2016;58:1–35.
doi:10.1080/01614940.2015.1099882.
[298] Chen WH, Lin MR, Jiang TL, Chen MH. Modeling and simulation of
hydrogen generation from high-temperature and low-temperature
water gas shift reactions. Int J Hydrogen Energy 2008;33:6644–56.
doi:10.1016/j.ijhydene.2008.08.039.
[299] Melaina M, Penev M. Hydrogen Station Cost Estimates. 2013.
[300] Moscoviz R, Trably E, Bernet N, Carrère H. The environmental
biorefinery: State-of-the-art on the production of hydrogen and value-
added biomolecules in mixed-culture fermentation. Green Chem
2018;20:3159–79. doi:10.1039/c8gc00572a.
[301] Roland B. Fuel Cells and Hydrogen for Green Energy in European Cities
and Regions. 2018.
[302] Reuter B, Faltenbacher M, Schuller O, Whitehouse N, Whitehouse S. New
Bus ReFuelling for European Hydrogen Bus Depots: High-Level Techno-
Economic Project Summary Report. 2017.
[303] Penev M, Saur G, Hunter C, Zuboy J. H2A Hydrogen Production Model :
Version 3 . 2018 User Guide (DRAFT ). NREL 2018.
[304] Peters M, Timmerhaus KD, West RE. Analysis of Cost Estimation. Plant
Des. Econ. Chem. Eng. 5th ed., New York: McGraw-Hill; 2004, p. 226–78.
[305] Kaiwen L, Bin Y, Tao Z. Economic analysis of hydrogen production from
steam reforming process: A literature review. Energy Sources, Part B
Econ Plan Policy 2018;13:109–15.

260
doi:10.1080/15567249.2017.1387619.
[306] BEIS. Gas and electricity prices in the non-domestic sector 2018.
https://www.gov.uk/government/statistical-data-sets/gas-and-
electricity-prices-in-the-non-domestic-sector (accessed March 8, 2019).
[307] Clean Air Technology Center. Nitrogen Oxides ( NOx ), Why and How
They Are Controlled. Epa-456/F-99-006R 1999:48. doi:EPA 456/F-99-
006R.
[308] Willmann V. Aberdeen Hydrogen Bus Project. LowCVP Low Emiss Bus
Work Glas 08/03/2018 2018.
[309] Hill N, Bonifazi E, Bramwell R, Karagianni B, Harris B. 2018 Government
GHG Conversion Factors For Company Reporting: Methodology paper for
emission factors: final report 2018:141.
[310] Parliamentary Office of Science and Technology. Carbon Footprint of
Heat Generation. Postnote Updat 2016;523:1–6.
[311] Rostrup-Nielsen J. Steam reforming of hydrocarbons. A historical
perspective. Stud Surf Sci Catal 2007;147:121–6. doi:10.1016/s0167-
2991(04)80038-7.
[312] Jones G, Jakobsen JG, Shim SS, Kleis J, Andersson MP, Rossmeisl J, et al.
First principles calculations and experimental insight into methane
steam reforming over transition metal catalysts. J Catal 2008;259:147–
60. doi:10.1016/j.jcat.2008.08.003.
[313] Rollinson AN, Rickett GL, Lea-Langton A, Dupont V, Twigg M V. Hydrogen
from urea–water and ammonia–water solutions. Appl Catal B Environ
2011;106:304–15. doi:10.1016/j.apcatb.2011.05.031.
[314] Hou K, Hughes R. The kinetics of methane steam reforming over a Ni /
alpha -Al2O3 catalyst. Chem Eng J 2001;82:311–28.
doi:http://dx.doi.org/10.1016/S1385-8947(00)00367-3.
[315] Saberimoghaddam A, Nozari A. A kinetic and statistical model for carbon
deposition on Ni/Al2O3 catalyst in the steam methane reforming. Res
Chem Intermed 2018;44:201–15. doi:10.1007/s11164-017-3098-x.

261
[316] Yamaguchi T, Shimizu S, Suzuki T, Fujishiro Y, Awano M. Design and
fabrication of a novel electrode-supported honeycomb SOFC. J Am Ceram
Soc 2009;92. doi:10.1111/j.1551-2916.2008.02688.x.

262
10 Appendices
10.1 Appendix A
Data referenced in Chapter 3
Table A 1. Characterisation from various Esholt WWTP streams
a) Raw wastewater
Date Tem
p (°C)
pH TSS (mg L-1)
VSS (mg L-1)
COD (mg L-1)
TKN (mg L-1)
TAN (mg L-1)
NO3-N
(mg L-1)
TP (mg L-1)
PO43-P
(mg L-1)
Oct-14 18.0 6.97 200 168 1373 24.6 15.7 2.0 0.9 0.9
Nov-14 22.5 7.59 216 180 140 21.3 14.6 1.9 2.8 1.9
Dec-14 15.0 7.75 394 262 276 42.6 24.6 0.2 8.2 6.3
Jan-15 7.5 7.65 206 180 408 34.7 21.3 0.5 5.4 4.3
Feb-15 9.0 7.69 266 232 741 53.8 29.1 0.5 6.2 5.4
Mar-15 10.0 7.67 276 194 1071 59.4 33.6 0.2 7.1 7.1
Jul-15 10.0 6.81 298 252 680 35.3 21.3 ND 5.3 5.8
Oct-15 8.5 7.13 528 458 968 49.3 30.8 0.3 7.1 2.8
Nov-15 16.5 7.34 552 442 507 44.8 14.6 1.5 6.3 4.0
Dec-15 12.0 7.19 148 102 16.2 5.0 2.0
Jan-16 18.5 7.40 192 154 1221 48.2 18.5 0.5 3.8 1.9
Feb-16 13.0 7.62 416 360 1172 54.9 28.8 0.7 7.2 4.4
Mar-16 14.2 7.77 500 422 63.3 34.2 0.6 9.2 5.8
Apr-16 14.8 7.81 284 234 956 59.4 31.9 0.1 7.4 4.8
May-16
8.2 6.90 358 318 732 66.1 39.8 ND 8.0 4.1
Mean 13.2 7.4 322.3 263.9 788.1 44.9 24.2 0.9 6.1 4.2
Min 8.2 6.8 148.0 102.0 507.2 16.2 5.0 0.1 3.8 1.9
Max 18.5 7.8 552.0 458.0 1221 66.1 39.8 2.0 9.2 7.1
STDEV 4.4 0.3 130 112 381 15.6 9.5 0.7 2.3 1.8
b) Primary Clarifier
Date Tem
p (°C)
pH TSS
(mg L-
1)
VSS (mg L-
1)
COD (mg L-1)
TKN (mg L-
1)
TAN (mg L-1)
NO3
-N (mg L-1)
TP (mg L-1)
PO43
-P (mg L-1)
Oct-14 18.0 6.74 60 52 242 17.1 7.8 2.8 0.1 0.4 Nov-14 22.0 7.46 142 114 154 14.6 3.4 1.8 1.9 1.2 Dec-14 14.5 7.41 178 94 241 26.0 15.1 0.3 3.3 1.8 Jan-15 7.0 7.46 102 78 143 21.8 9.0 0.5 2.8 1.4 Feb-15 9.0 7.13 136 114 370 38.1 26.3 0.0 2.4 2.2 Mar-15 9.5 7.42 42 22 402 38.1 23.0 0.3 2.2 2.2 Jul-15 9.0 6.98 116 106 354 33.0 24.6 ND 2.5 2.1 Oct-15 7.5 7.39 128 110 500 45.9 34.2 0.4 4.5 2.1 Nov-15 16.0 7.42 64 58 123 12.3 5.6 2.2 0.5 0.2 Dec-15 13.0 7.17 92 84 15.4 9.0 1.0 Jan-16 18.5 7.34 84 52 198 20.7 11.8 0.8 ND 0.8

263
Feb-16 12.5 7.30 60 60 258.0 24.6 14.8 1.0 0.6 0.6 Mar-16 14.5 7.30 90 88 37.8 17.9 0.9 1.7 1.4 Apr-16 14.5 7.25 120 110 449 35.3 19.6 0.9 2.8 2.1 May-
16 8.1 6.94 80 80 171 31.4 20.7 ND 1.2 0.7 Mean 12.9 7.2 99.6 81.5 277.3 27.5 16.2 1.0 2.0 1.4 Min 7.5 6.9 42.0 22.0 123.2 12.3 5.6 0.0 0.5 0.2 Max 18.5 7.4 136.0 114.0 500.0 45.9 34.2 2.2 4.5 2.2
STDEV 4.5 0.2 37 28 125 10.4 8.7 0.8 1.2 0.7
c) ASP inlet
Date Temp (°C)
pH TSS (mg L-1)
VSS (mg L-1)
COD (mg L-1)
TKN (mg L-1)
TAN (mg L-1)
NO3-N
(mg L-1)
TP (mg L-1)
PO43-P
(mg L-1)
Feb-15 9.0 7.18 496 396 696 53.2 33.6 0.0 3.0 2.9
Mar-15 12.5 6.76 3566 2734 4643 183.7 6.2 0.5 18.9 13.6
Jul-15 10.0 6.86 706 570 1224 101.9 28.0 ND 11.8 10.0
Oct-15 9.5 7.35 692 528 1129 81.8 38.6 ND 12.9 8.9
Nov-15 16.5 7.46 488 390 4058 39.2 10.6 2.1 6.3 3.0
Dec-15 14.5 7.24 300 242 34.2 11.2 0.7 Jan-16 18.5 7.24 446 328 763 50.4 11.8 0.7 5.2 1.1
Feb-16 12.5 7.21 636 510 1094 57.1 14.8 1.1 10.4 3.5
Mar-16 14.1 7.37 736 588 76.7 17.4 0.7 12.2 4.5
Apr-16 15.2 7.28 694 564 1103 59.4 17.9 0.3 11.0 4.2 May-16 7.9 6.91 582 492 244 70.6 23.5 ND 11.3 1.6
Mean 12.7 7.2 849.3 667.5 1662 73.5 19.4 0.8 10.3 5.3
Min 7.9 6.8 300.0 242.0 243.9 34.2 10.6 0.0 3.0 1.1
Max 18.5 7.5 736.0 588.0 4058 101.9 38.6 2.1 12.9 10.0
STDEV 3.4 0.2 142 116 1164 20.6 9.9 0.7 3.5 3.1
d) ASP outlet
Date Tem
p (°C)
pH TSS (mg L-1)
VSS (mg L-1)
COD (mg L-1)
TKN (mg L-1)
TAN (mg L-1)
NO3-N
(mg L-1)
TP (mg L-1)
PO43-P
(mg L-1)
Feb-15 9.0 6.49 3594 2736 3704 173.6 4.5 1.9 2.8 1.3
Mar-15 10.5 6.69 3490 2640 5357 148.4 1.7 1.6 18.3 13.8
Jul-15 10.0 6.49 4174 3222 1361 249.8 2.5 ND 27.0 15.6
Oct-15 10.0 6.82 3442 2626 2419 184.8 3.4 9.3 41.0 15.5
Nov-15 16.5 6.81 3930 2916 5072 217.3 2.8 4.9 30.8 13.2
Dec-15 14.0 6.75 3622 2690 298.2 1.7 2.1 Jan-16 19.0 6.54 4408 3312 5344 305.2 11.2 2.3 60.8 11.0
Feb-16 13.0 6.55 4168 3114 7031 280.0 3.1 8.0 69.3 18.5
Mar-16 15.4 6.65 4374 3346 312.2 2.2 2.7 73.3 19.0
Apr-16 15.3 6.55 3766 2922 6618 288.4 2.2 3.8 70.9 16.9

264
May-16 8.7 6.68 3246 2580 1626 310.8 1.7 1.7 72.2 2.3
Mean 12.9 6.6 3838 2919 4281 251.7 3.4 3.8 46.6 12.7
Min 8.7 6.5 3246 2580 1361 148.4 1.7 1.6 2.8 1.3
Max 19.0 6.8 4408 3346 7031 312.2 11.2 9.3 73.3 19.0
STDEV 3.4 0.1 398 288 2101 60.6 2.7 2.7 25.9 6.3
e) Secondary Clarifier
Date Temp (°C)
pH TSS (mg L-1)
VSS (mg L-1)
COD (mg L-1)
TKN (mg L-1)
TAN (mg L-1)
NO3-N
(mg L-1)
TP (mg L-1)
PO43-P
(mg L-1)
Oct-14 19.5 6.09 22 22 85 2.0 2.1 5.5 0.0 0.0
Nov-14 22.5 6.89 84 76 71 7.0 2.1 7.2 0.3 0.0
Dec-14 14.0 6.83 112 42 41 1.4 1.8 1.9 0.4 0.3
Jan-15 7.0 6.98 16 12 7 4.5 0.7 1.3 0.4 0.2
Feb-15 11.0 6.61 24 20 74 1.7 1.4 2.4 0.1 0.2
Mar-15 9.0 6.72 34 28 54 3.1 1.4 2.0 0.2 0.1
Jul-15 9.0 6.74 16 14 27 2.0 0.6 1.0 0.1 0.1
Oct-15 9.0 7.06 20 20 105 3.4 0.8 15.1 ND 0.1
Nov-15 17.0 6.90 26 26 43 2.2 0.6 7.1 0.1 0.1
Dec-15 15.0 6.72 48 48 3.6 0.6 4.6 Jan-16 18.5 6.74 46 26 53 3.9 1.1 3.8 ND ND
Feb-16 13.0 6.65 10 10 31 2.2 0.3 9.4 ND 0.1
Mar-16 14.3 6.75 42 42 3.1 1.1 5.6 ND 0.1
Apr-16 14.3 6.70 16 16 59 4.5 1.1 6.2 ND 0.1 May-
16 7.9 6.54 22 22 57 4.5 1.1 5.2 ND 0.0
Mean 13.4 6.73 35.8 28 54 3.3 1.1 5.2 0.2 0.1
Min 7.0 6.1 10.0 10.0 6.8 1.4 0.3 1.0 0.0 0.0
Max 22.5 7.1 112.0 76.0 104.8 7.0 2.1 15.1 0.4 0.3
STDEV 4.6 0.2 28 17 26 1.5 0.6 3.7 0.1 0.1
d) Whole digestate
Date Temp (°C)
pH TSS (mg L-1)
VSS (mg L-1)
COD (mg L-1)
TKN (mg L-1)
TAN (mg L-1)
NO3-N
(mg L-1)
TP (mg L-1)
PO43-P
(mg L-1)
Oct-14 27.0 7.10 46500 28500 10457
5 2475.2 1523.2
4.56129
80.6 3.8
Nov-14 23.0 8.15 45300 23250 69930 3427.2 1456.0 ND 247.7 29.8
Dec-14 17.5 7.82 52000 31500 68966 4032.0 2284.8 ND 334.8 40.3
Jan-15 12.5 7.68 44125 24275 34014 3348.8 1489.6 ND 354.3 15.9
Feb-15 13.0 7.58 52965 33995 74074 3796.8 1355.2 0.4 210.9 18.8
Mar-15 17.0 7.79 35815 11760 26786 2251.2 1500.8 ND 248.0 18.4
Jul-15 13.0 7.97 37500 22500 27211 2772.0 1540.0 ND 262.1 56.1

265
Oct-15 12.0 7.90 44500 28000 48387 3332.0 1680.0 ND 189.5 ND
Nov-15 22.5 7.85 40500 26000 50725 3108.0 1372.0 ND 238.3 18.4
Dec-15 22.0 6.62 33615 19750 2926.0 1232.0 ND
Jan-16 21.5 7.45 38000 23500 22901 2604.0 1232.0 ND 275.4 0.0
Feb-16 14.0 7.58 8000 5000 7812 1736.0 1162.0 0.1 177.5 5.8
Mar-16 17.4 7.51 50000 28000 3486.0 1540.0 ND 537.2 12.4
Apr-16 18.0 7.59 51500 29080 72059 3612.0 1596.0 ND 853.3 11.5
May-16
18.9 8.18 1396 1072 5344 4424.0 1568.0 ND 43.4 5.5
Mean 18.0 7.7 38781 22412 47137 3155.4 1502.1 1.7 289.5 18.2
Min 12.0 6.6 1396.0 1072.0 5343.5 1736.0 1162.0 0.1 43.4 0.0
Max 22.5 8.2 52965 33995 74074 4424.0 1680.0 0.4 853.3 56.1
STDEV 4.5 0.4 15149 9480 29609 710 262 2.5 201.0 15.8
e) Digestate Liquor
Date
Temp
(°C)
pH TSS (mg L-1)
VSS (mg L-1)
COD (mg L-1)
TKN (mg L-1)
TAN (mg L-1)
NO3-N
(mg L-1)
TP (mg L-1)
PO43-P
(mg L-1)
Oct-14 408 372 11765 1702.4 1523.2 4.6 7.4 3.8
Nov-14 21.0 8.06 540 470 4895 1612.8 1456.0 ND 38.4 29.8
Dec-14 21.5 7.86 492 402 6897 1792.0 2284.8 ND 46.3 40.3
Jan-15 22.0 7.79 656 496 2041 1612.8 1489.6 ND 27.4 15.9
Feb-15 20.0 7.59 396 350 2963 1433.6 1355.2 0.4 18.2 18.8
Mar-15 24.0 7.90 282 246 2679 1624.0 1500.8 ND 28.0 18.4
Jul-15 16.0 8.09 268 252 680 1652.0 1540.0 ND 64.1 56.1
Oct-15 11.0 7.88 336 310 2419 1876.0 1680.0 ND 22.1 ND
Nov-15 27.0 7.95 360 310 3623 1568.0 1372.0 ND 24.2 18.4
Dec-15 23.5 7.65 308 288 1442.0 1232.0 ND
Jan-16 23.5 7.53 210 160 2290 1232.0 1232.0 ND 7.2 0.0
Feb-16 27.0 7.71 174 174 2344 1176.0 1162.0 0.1 10.7 5.8
Mar-16 24.4 7.62 308 274 1638.0 1540.0 ND 16.5 12.4
Apr-16 22.3 7.69 352 302 3824 1708.0 1596.0 ND 15.5 11.5
May-16 16.1 8.02 150 144 2927 1904.0 1568.0 ND 9.9 5.5
Mean 21.4 7.8 349.3 303.3 3795.8 1598.2 1502.1 1.7 24.0 18.2
Min 11.0 7.5 150.0 144.0 680.3 1176.0 1162.0 0.1 7.2 0.0
Max 27.0 8.1 396.0 350.0 3823.5 1904.0 1680.0 0.4 64.1 56.1
STDEV 4.4 0.2 137 104 2830 207 262 2.5 16.3 15.8
f) Final Effluent
Date Temp (°C)
pH TSS (mg L-1)
VSS (mg L-1)
COD (mg L-1)
TKN (mg L-1)
TAN (mg L-1)
NO3-N
(mg L-1)
TP (mg L-1)
PO43-P
(mg L-1)

266
Oct-14 19.0 6.15 14 14 85 3.6 0.0 4.8 0.2 0.3
Nov-14 22.5 7.21 58 58 49 8.7 0.6 7.8 0.7 0.6
Dec-14 14.0 7.07 94 22 28 1.4 1.1 1.8 1.3 1.6
Jan-15 7.0 7.07 14 10 7 1.7 0.6 1.3 0.6 0.7
Feb-15 11.0 7.11 30 22 44 1.7 2.5 2.7 2.2 2.2
Mar-15 9.5 7.02 24 22 80 1.4 1.1 9.3 0.3 0.5
Jul-15 11.0 6.92 8 8 27 1.4 1.1 1.9 1.2 1.3
Oct-15 7.5 7.47 14 14 56 3.1 1.7 13.4 2.6 2.2
Nov-15 17.0 7.23 12 12 36 2.2 1.1 7.3 0.4 0.6
Dec-15 14.5 6.95 3.1 4.5 4.5
Jan-16 18.0 7.15 64 30 69 2.2 1.7 3.8 1.1 2.2
Feb-16 13.0 7.07 68 68 55 2.2 0.8 7.7 4.5 4.1
Mar-16 14.5 7.08 46 46 3.1 0.6 6.7 0.3 0.5
Apr-16 14.5 6.99 36 36 81 5.0 1.1 6.6 0.5 0.3
May-16
8.5 6.52 30 30 57 4.5 0.6 5.6 ND 0.2
Mean 13.4 7.0 36.6 28.0 51.9 3.0 1.3 5.7 1.2 1.2
Min 7.0 6.2 8.0 8.0 6.8 1.4 0.0 1.3 0.2 0.2
Max 22.5 7.5 94.0 68.0 85.0 8.7 4.5 13.4 4.5 4.1
STDEV 4.5 0.3 26 18 23 1.9 1.1 3.3 1.2 1.1

267
10.2 Appendix B.
Data referred to in Chapter 6
Wag
e Ex
pend
iture
/yr
(£)
Mai
nten
ance
Rep
lace
men
t Cos
tsH
eat C
osts
Elec
tric
ity c
osts
Ope
ratin
g Co
st o
f C&
SCa
taly
st C
ost
Ann
ual E
xpen
seCu
mul
ativ
e To
tal (
£)In
com
e H
2 Sa
les
Inco
me
abat
ed e
lec
RH
I inc
ome
Cash
flow
Cum
Cas
hflo
wN
et C
ashf
low
Dis
coun
ted
Cash
Flo
wCu
mul
ativ
e D
CFN
PV
Yr 0
13
,293
,228
.57
13
,293
,228
.57
-
13
,293
,228
.57
-
Yr 1
644,
130.
05
39
8,79
6.86
293,
103.
45
791,
288.
51
69
9,23
3.33
15
1,45
6.96
2,
978,
009.
16
16,2
71,2
37.7
2
4,59
8,89
5.60
158,
650.
90
157,
303.
31
1,
936,
840.
66
1,93
6,84
0.66
11,3
56,3
87.9
1-
1,76
0,76
4.23
1,
760,
764.
23
11
,532
,464
.33
-
Yr 2
663,
389.
53
41
0,24
5.39
301,
517.
77
814,
004.
58
71
9,30
6.71
15
5,80
4.94
3,
064,
268.
93
19,3
35,5
06.6
5
4,73
0,91
9.28
163,
205.
40
161,
819.
13
1,
991,
674.
88
3,92
8,51
5.54
9,36
4,71
3.03
-
1,
646,
012.
30
3,40
6,77
6.53
9,88
6,45
2.04
-
Yr 3
683,
224.
88
42
2,02
2.59
310,
173.
65
837,
372.
77
73
9,95
6.34
16
0,27
7.74
3,
153,
027.
98
22,4
88,5
34.6
4
4,86
6,73
3.06
167,
890.
65
166,
464.
58
2,
048,
060.
31
5,97
6,57
5.84
7,31
6,65
2.72
-
1,
538,
738.
02
4,94
5,51
4.55
8,34
7,71
4.01
-
Yr 4
703,
653.
30
43
4,13
7.89
319,
078.
02
861,
411.
81
76
1,19
8.78
16
4,87
8.95
3,
244,
358.
76
25,7
32,8
93.3
9
5,00
6,44
5.73
172,
710.
40
171,
243.
39
2,
106,
040.
78
8,08
2,61
6.62
5,21
0,61
1.95
-
1,
438,
454.
19
6,38
3,96
8.74
6,90
9,25
9.83
-
Yr 5
724,
692.
54
44
6,60
0.98
328,
238.
01
886,
140.
96
78
3,05
1.04
16
9,61
2.24
3,
338,
335.
78
29,0
71,2
29.1
7
5,15
0,16
9.24
177,
668.
52
176,
159.
40
2,
165,
661.
38
10,2
48,2
77.9
9
3,04
4,95
0.57
-
1,
344,
705.
33
7,72
8,67
4.06
5,56
4,55
4.50
-
Yr 6
746,
360.
85
45
9,42
1.87
1,99
3,98
4.28
33
7,66
0.97
91
1,58
0.02
805,
530.
63
174,
481.
42
5,42
9,02
0.04
34
,500
,249
.21
5,
298,
018.
71
18
2,76
8.98
18
1,21
6.53
232,
984.
17
10
,481
,262
.17
2,
811,
966.
40-
131,
513.
49
7,
860,
187.
56
5,
433,
041.
01-
Yr 7
768,
677.
03
47
2,61
0.81
347,
354.
44
937,
749.
38
82
8,65
5.56
17
9,49
0.38
3,
534,
537.
59
38,0
34,7
86.8
0
5,45
0,11
2.60
188,
015.
85
186,
418.
83
2,
290,
009.
69
12,7
71,2
71.8
6
521,
956.
71-
1,
175,
137.
06
9,03
5,32
4.62
4,25
7,90
3.94
-
Yr 8
791,
660.
48
48
6,17
8.38
357,
326.
18
964,
670.
00
85
2,44
4.35
18
4,64
3.13
3,
636,
922.
51
41,6
71,7
09.3
2
5,60
6,57
2.76
193,
413.
35
191,
770.
49
2,
354,
834.
09
15,1
26,1
05.9
5
1,83
2,87
7.38
1,
098,
547.
48
10,1
33,8
72.1
0
3,15
9,35
6.46
-
Yr 9
815,
331.
13
50
0,13
5.43
367,
584.
19
992,
363.
45
87
6,91
6.06
18
9,94
3.81
3,
742,
274.
07
45,4
13,9
83.3
8
5,76
7,52
4.52
198,
965.
80
197,
275.
78
2,
421,
492.
04
17,5
47,5
97.9
8
4,25
4,36
9.42
1,
026,
949.
01
11,1
60,8
21.1
1
2,13
2,40
7.46
-
Yr 1
083
9,70
9.53
514,
493.
17
37
8,13
6.68
1,
020,
851.
91
902,
090.
29
195,
396.
66
3,85
0,67
8.24
49
,264
,661
.63
5,
933,
096.
84
20
4,67
7.65
20
2,93
9.11
2,49
0,03
5.36
20
,037
,633
.34
6,
744,
404.
78
960,
016.
42
12
,120
,837
.53
1,
172,
391.
03-
Yr 1
186
4,81
6.84
529,
263.
08
6,
646,
614.
28
388,
992.
12
1,05
0,15
8.22
92
7,98
7.22
20
1,00
6.04
10
,608
,837
.81
59
,873
,499
.43
6,
103,
422.
36
21
0,55
3.48
20
8,76
5.02
4,08
6,09
6.95
-
15,9
51,5
36.4
0
2,65
8,30
7.83
1,
432,
152.
05-
10
,688
,685
.48
2,
604,
543.
09-
Yr 1
289
0,67
4.87
544,
457.
00
40
0,15
9.18
1,
080,
305.
84
954,
627.
60
206,
776.
46
4,07
7,00
0.94
63
,950
,500
.38
6,
278,
637.
53
21
6,59
7.98
21
4,75
8.19
2,63
2,99
2.75
18
,584
,529
.15
5,
291,
300.
58
838,
952.
63
11
,527
,638
.11
1,
765,
590.
45-
Yr 1
391
7,30
6.04
560,
087.
11
41
1,64
6.83
1,
111,
318.
92
982,
032.
75
212,
712.
54
4,19
5,10
4.19
68
,145
,604
.57
6,
458,
882.
73
22
2,81
6.01
22
0,92
3.40
2,70
7,51
7.94
21
,292
,047
.09
7,
998,
818.
52
784,
271.
50
12
,311
,909
.62
98
1,31
8.95
-
Yr 1
494
4,73
3.49
576,
165.
91
42
3,46
4.26
1,
143,
222.
33
1,01
0,22
4.64
218,
819.
02
4,31
6,62
9.66
72
,462
,234
.23
6,
644,
302.
34
22
9,21
2.54
22
7,26
5.60
2,78
4,15
0.82
24
,076
,197
.91
10
,782
,969
.34
733,
153.
93
13
,045
,063
.54
24
8,16
5.02
-
Yr 1
597
2,98
1.03
592,
706.
31
43
5,62
0.94
1,
176,
041.
60
1,03
9,22
5.86
225,
100.
81
4,44
1,67
6.55
76
,903
,910
.78
6,
835,
044.
93
23
5,79
2.70
23
3,78
9.87
2,86
2,95
0.95
26
,939
,148
.86
13
,645
,920
.29
685,
367.
70
13
,730
,431
.24
43
7,20
2.68
Yr 1
61,
002,
073.
16
609,
721.
54
1,
993,
984.
28
448,
126.
61
1,20
9,80
3.04
1,
069,
059.
64
23
1,56
2.94
6,
564,
331.
21
83,4
68,2
42.0
0
7,03
1,26
3.30
242,
561.
77
240,
501.
44
94
9,99
5.29
27,8
89,1
44.1
5
14,5
95,9
15.5
8
20
6,74
6.65
13,9
37,1
77.8
9
643,
949.
33
Yr 1
71,
032,
035.
15
627,
225.
24
46
0,99
1.29
1,
244,
533.
69
1,09
9,74
9.87
238,
210.
58
4,70
2,74
5.82
88
,170
,987
.82
7,
233,
114.
64
24
9,52
5.16
24
7,40
5.68
3,02
7,29
9.65
30
,916
,443
.80
17
,623
,215
.24
598,
935.
10
14
,536
,112
.99
1,
242,
884.
43
Yr 1
81,
062,
893.
00
645,
231.
43
47
4,22
5.29
1,
280,
261.
38
1,13
1,32
1.16
245,
049.
05
4,83
8,98
1.30
93
,009
,969
.12
7,
440,
760.
67
25
6,68
8.45
25
4,50
8.12
3,11
2,97
5.94
34
,029
,419
.74
20
,736
,191
.18
559,
896.
09
15
,096
,009
.08
1,
802,
780.
51
Yr 1
91,
094,
673.
50
663,
754.
53
48
7,83
9.20
1,
317,
014.
73
1,16
3,79
8.77
252,
083.
84
4,97
9,16
4.59
97
,989
,133
.71
7,
654,
367.
74
26
4,05
7.38
26
1,81
4.46
3,20
1,07
5.00
37
,230
,494
.74
23
,937
,266
.18
523,
401.
34
15
,619
,410
.42
2,
326,
181.
85
Yr 2
01,
127,
404.
24
682,
809.
39
50
1,84
3.94
1,
354,
823.
19
1,19
7,20
8.75
259,
320.
59
5,12
3,41
0.10
10
3,11
2,54
3.81
7,
874,
106.
97
27
1,63
7.86
26
9,33
0.55
3,29
1,66
5.29
40
,522
,160
.03
27
,228
,931
.46
489,
285.
07
16
,108
,695
.49
2,
815,
466.
92
Ta
ble
A 3
H2 p
rod
uct
ion
pro
cess
eco
no
mic
stu
dy
dat
a fo
r S:
C 4
Ta
ble
A 2
. H2 p
rod
uct
ion
pro
cess
eco
no
mic
stu
dy
dat
a fo
r S:
C 3
Wa
ge
Ex
pe
nd
itu
re/
yr
(£)
Ma
inte
na
nce
Re
pla
cem
en
t C
ost
sHea
t C
ost
sE
lect
rici
ty c
ost
sO
pe
rati
ng
Co
st o
f C
&S
Cat
aly
st C
ost
An
nu
al E
xp
en
seC
um
ula
tiv
e T
ota
l (£
)Inco
me
H2
Sa
les
Inco
me
ab
ate
d e
lec
RH
I in
com
eC
ash
flo
wC
um
Cas
hfl
ow
Ne
t C
ash
flo
wD
isco
un
ted
Cas
h F
low
Cu
mu
lati
ve
DC
FN
PV
Yr
0
13
,01
1,3
85
.70
1
3,0
11
,38
5.7
0-
1
3,0
11
,38
5.7
0-
Yr
16
44
,13
0.0
5
3
90
,34
1.5
7
2
50
,64
7.7
5
7
84
,07
6.8
6
6
82
,79
5.2
1
14
9,2
21
.69
2,9
01
,21
3.1
2
1
5,9
12
,59
8.8
2
4,5
31
,02
2.9
7
15
8,6
50
.90
1
42
,64
4.5
6
1
,93
1,1
05
.32
1,9
31
,10
5.3
2
11
,08
0,2
80
.39
-
1,7
55
,55
0.2
9
1
,75
5,5
50
.29
11
,25
5,8
35
.41
-
Yr
26
63
,38
9.5
3
4
01
,54
7.3
8
2
57
,84
3.2
7
8
06
,58
5.9
0
7
02
,39
6.6
8
15
3,5
05
.50
2,9
85
,26
8.2
6
1
8,8
97
,86
7.0
8
4,6
61
,09
8.1
9
16
3,2
05
.40
1
46
,73
9.5
6
1
,98
5,7
74
.89
3,9
16
,88
0.2
1
9,0
94
,50
5.4
9-
1,6
41
,13
6.2
8
3
,39
6,6
86
.56
9,6
14
,69
9.1
4-
Yr
36
83
,22
4.8
8
4
13
,07
4.8
8
2
65
,24
5.3
5
8
29
,74
1.1
2
7
22
,56
0.8
7
15
7,9
12
.29
3,0
71
,75
9.3
8
2
1,9
69
,62
6.4
7
4,7
94
,90
7.5
6
16
7,8
90
.65
1
50
,95
2.1
1
2
,04
1,9
90
.94
5,9
58
,87
1.1
5
7,0
52
,51
4.5
5-
1,5
34
,17
8.0
2
4
,93
0,8
64
.58
8,0
80
,52
1.1
2-
Yr
47
03
,65
3.3
0
4
24
,93
3.3
0
2
72
,85
9.9
3
8
53
,56
1.0
7
7
43
,30
3.9
3
16
2,4
45
.59
3,1
60
,75
7.1
2
2
5,1
30
,38
3.5
9
4,9
32
,55
8.2
9
17
2,7
10
.40
1
55
,28
5.6
0
2
,09
9,7
97
.18
8,0
58
,66
8.3
3
4,9
52
,71
7.3
7-
1,4
34
,18
9.7
3
6
,36
5,0
54
.31
6,6
46
,33
1.4
0-
Yr
57
24
,69
2.5
4
4
37
,13
2.1
6
2
80
,69
3.1
1
8
78
,06
4.8
4
7
64
,64
2.4
7
16
7,1
09
.02
3,2
52
,33
4.1
4
2
8,3
82
,71
7.7
2
5,0
74
,16
0.6
6
17
7,6
68
.52
1
59
,74
3.4
9
2
,15
9,2
38
.54
10
,21
7,9
06
.87
2,7
93
,47
8.8
4-
1,3
40
,71
7.2
5
7
,70
5,7
71
.56
5,3
05
,61
4.1
5-
Yr
67
46
,36
0.8
5
4
49
,68
1.2
1
1
,95
1,7
07
.86
2
88
,75
1.1
6
9
03
,27
2.0
5
7
86
,59
3.5
9
17
1,9
06
.34
5,2
98
,27
3.0
6
3
3,6
80
,99
0.7
8
5,2
19
,82
8.1
0
18
2,7
68
.98
1
64
,32
9.3
6
2
68
,65
3.3
8
10
,48
6,5
60
.25
2,5
24
,82
5.4
6-
15
1,6
47
.83
7
,85
7,4
19
.38
5,1
53
,96
6.3
2-
Yr
77
68
,67
7.0
3
4
62
,59
0.5
2
2
97
,04
0.5
4
9
29
,20
2.9
1
8
09
,17
4.8
7
17
6,8
41
.37
3,4
43
,52
7.2
6
3
7,1
24
,51
8.0
3
5,3
69
,67
7.3
2
18
8,0
15
.85
1
69
,04
6.8
8
2
,28
3,2
12
.79
12
,76
9,7
73
.04
24
1,6
12
.67
-
1,1
71
,64
9.1
8
9
,02
9,0
68
.56
3,9
82
,31
7.1
4-
Yr
87
91
,66
0.4
8
4
75
,87
0.4
3
3
05
,56
7.8
9
9
55
,87
8.1
8
8
32
,40
4.4
2
18
1,9
18
.08
3,5
43
,29
9.4
8
4
0,6
67
,81
7.5
1
5,5
23
,82
8.3
6
19
3,4
13
.35
1
73
,89
9.8
2
2
,34
7,8
42
.06
15
,11
7,6
15
.10
2,1
06
,22
9.4
0
1,0
95
,28
5.6
5
1
0,1
24
,35
4.2
1
2,8
87
,03
1.4
9-
Yr
98
15
,33
1.1
3
4
89
,53
1.5
7
3
14
,34
0.0
4
9
83
,31
9.2
4
8
56
,30
0.8
3
18
7,1
40
.53
3,6
45
,96
3.3
3
4
4,3
13
,78
0.8
4
5,6
82
,40
4.7
3
19
8,9
65
.80
1
78
,89
2.0
8
2
,41
4,2
99
.29
17
,53
1,9
14
.38
4,5
20
,52
8.6
8
1,0
23
,89
8.5
8
1
1,1
48
,25
2.7
9
1,8
63
,13
2.9
1-
Yr
10
83
9,7
09
.53
50
3,5
84
.89
32
3,3
64
.02
1,0
11
,54
8.0
6
88
0,8
83
.25
1
92
,51
2.9
0
3
,75
1,6
02
.65
48
,06
5,3
83
.49
5
,84
5,5
33
.46
2
04
,67
7.6
5
18
4,0
27
.66
2,4
82
,63
6.1
2
2
0,0
14
,55
0.5
1
7
,00
3,1
64
.80
9
57
,16
3.7
0
12
,10
5,4
16
.49
9
05
,96
9.2
1-
Yr
11
86
4,8
16
.84
51
8,0
41
.65
6,5
05
,69
2.8
5
33
2,6
47
.05
1,0
40
,58
7.2
7
90
6,1
71
.37
1
98
,03
9.5
0
1
0,3
65
,99
6.5
5
58
,43
1,3
80
.03
6
,01
3,3
45
.23
2
10
,55
3.4
8
18
9,3
10
.67
3,9
52
,78
7.1
7-
1
6,0
61
,76
3.3
4
3
,05
0,3
77
.64
1
,38
5,4
27
.79
-
10
,71
9,9
88
.70
2
,29
1,3
97
.00
-
Yr
12
89
0,6
74
.87
53
2,9
13
.43
34
2,1
96
.58
1,0
70
,46
0.1
3
93
2,1
85
.46
2
03
,72
4.7
6
3
,97
2,1
55
.23
62
,40
3,5
35
.27
6
,18
5,9
74
.50
2
16
,59
7.9
8
19
4,7
45
.35
2,6
25
,16
2.5
9
1
8,6
86
,92
5.9
2
5
,67
5,5
40
.22
8
36
,45
7.7
0
11
,55
6,4
46
.40
1
,45
4,9
39
.30
-
Yr
13
91
7,3
06
.04
54
8,2
12
.15
35
2,0
20
.26
1,1
01
,19
0.5
7
95
8,9
46
.36
2
09
,57
3.2
3
4
,08
7,2
48
.60
66
,49
0,7
83
.87
6
,36
3,5
59
.55
2
22
,81
6.0
1
20
0,3
36
.04
2,6
99
,46
2.9
9
2
1,3
86
,38
8.9
1
8
,37
5,0
03
.21
7
81
,93
8.2
7
12
,33
8,3
84
.67
6
73
,00
1.0
3-
Yr
14
94
4,7
33
.49
56
3,9
50
.05
36
2,1
25
.95
1,1
32
,80
3.2
1
98
6,4
75
.49
2
15
,58
9.5
9
4
,20
5,6
77
.79
70
,69
6,4
61
.66
6
,54
6,2
42
.66
2
29
,21
2.5
4
20
6,0
87
.22
2,7
75
,86
4.6
3
2
4,1
62
,25
3.5
4
1
1,1
50
,86
7.8
4
7
30
,97
1.9
1
13
,06
9,3
56
.59
5
7,9
70
.89
Yr
15
97
2,9
81
.03
58
0,1
39
.76
37
2,5
21
.75
1,1
65
,32
3.3
8
1,0
14
,79
4.9
3
2
21
,77
8.6
7
4
,32
7,5
39
.51
75
,02
4,0
01
.17
6
,73
4,1
70
.18
2
35
,79
2.7
0
21
2,0
03
.51
2,8
54
,42
6.8
8
2
7,0
16
,68
0.4
3
1
4,0
05
,29
4.7
2
6
83
,32
7.1
0
13
,75
2,6
83
.69
7
41
,29
7.9
9
Yr
16
1,0
02
,07
3.1
6
59
6,7
94
.23
1,9
51
,70
7.8
6
38
3,2
15
.98
1,1
98
,77
7.1
2
1,0
43
,92
7.3
5
2
28
,14
5.4
3
6
,40
4,6
41
.13
81
,42
8,6
42
.29
6
,92
7,4
92
.66
2
42
,56
1.7
7
21
8,0
89
.64
98
3,5
02
.94
2
8,0
00
,18
3.3
7
1
4,9
88
,79
7.6
7
2
14
,03
8.9
0
13
,96
6,7
22
.59
9
55
,33
6.8
8
Yr
17
1,0
32
,03
5.1
5
61
3,9
26
.82
39
4,2
17
.23
1,2
33
,19
1.2
5
1,0
73
,89
6.0
9
2
34
,69
4.9
5
4
,58
1,9
61
.49
86
,01
0,6
03
.78
7
,12
6,3
64
.99
2
49
,52
5.1
6
22
4,3
50
.49
3,0
18
,27
9.1
5
3
1,0
18
,46
2.5
2
1
8,0
07
,07
6.8
2
5
97
,15
0.4
4
14
,56
3,8
73
.02
1
,55
2,4
87
.32
Yr
18
1,0
62
,89
3.0
0
63
1,5
51
.24
40
5,5
34
.30
1,2
68
,59
3.3
2
1,1
04
,72
5.1
7
2
41
,43
2.5
0
4
,71
4,7
29
.53
90
,72
5,3
33
.32
7
,33
0,9
46
.48
2
56
,68
8.4
5
23
0,7
91
.08
3,1
03
,69
6.4
7
3
4,1
22
,15
8.9
9
2
1,1
10
,77
3.2
9
5
58
,22
7.0
9
15
,12
2,1
00
.12
2
,11
0,7
14
.41
Yr
19
1,0
94
,67
3.5
0
64
9,6
81
.62
41
7,1
76
.25
1,3
05
,01
1.7
1
1,1
36
,43
9.2
8
2
48
,36
3.4
7
4
,85
1,3
45
.83
95
,57
6,6
79
.15
7
,54
1,4
01
.04
2
64
,05
7.3
8
23
7,4
16
.55
3,1
91
,52
9.1
4
3
7,3
13
,68
8.1
4
2
4,3
02
,30
2.4
4
5
21
,84
0.5
2
15
,64
3,9
40
.63
2
,63
2,5
54
.93
Yr
20
1,1
27
,40
4.2
4
66
8,3
32
.48
42
9,1
52
.42
1,3
42
,47
5.5
9
1,1
69
,06
3.8
3
2
55
,49
3.4
2
4
,99
1,9
21
.96
10
0,5
68
,60
1.1
1
7
,75
7,8
97
.26
2
71
,63
7.8
6
24
4,2
32
.24
3,2
81
,84
5.3
9
4
0,5
95
,53
3.5
3
2
7,5
84
,14
7.8
3
4
87
,82
5.4
1
16
,13
1,7
66
.04
3
,12
0,3
80
.34

268
Wag
e E
xpen
dit
ure
/yr
(£)
Mai
nte
nan
ceR
ep
lace
men
t C
ost
sH
eat
Co
sts
Ele
ctri
city
co
sts
Op
erat
ing
Co
st o
f C
&S
Cat
aly
st C
ost
An
nu
al E
xpen
seC
um
ula
tiv
e T
ota
l (£
)In
com
e H
2 S
ale
sIn
com
e ab
ated
ele
cR
HI
inco
me
Cas
hfl
ow
Cu
m C
ash
flo
wN
et C
ash
flo
wD
isco
un
ted
Cas
h F
low
Cu
mu
lati
ve
DC
FN
PV
Yr
0
12
,53
0,0
90
.07
1
2,5
30
,09
0.0
7-
1
2,5
30
,09
0.0
7-
Yr
16
44
,13
0.0
5
37
5,9
02
.70
1
69
,12
5.2
0
75
9,8
05
.85
62
4,3
27
.43
1
41
,10
2.0
0
2,7
14
,39
3.2
3
15
,24
4,4
83
.31
4
,28
4,9
54
.00
15
8,6
50
.90
1
30
,94
9.7
1
1,8
60
,16
1.3
8
1,8
60
,16
1.3
8
10
,66
9,9
28
.70
-
1,6
91
,05
5.8
0
1,6
91
,05
5.8
0
10
,83
9,0
34
.28
-
Yr
26
63
,38
9.5
3
38
6,6
94
.00
1
73
,98
0.3
9
78
1,6
18
.12
64
2,2
50
.43
1
45
,15
2.7
1
2,7
93
,08
5.2
0
18
,03
7,5
68
.51
4
,40
7,9
65
.14
16
3,2
05
.40
1
34
,70
8.9
7
1,9
12
,79
4.3
2
3,7
72
,95
5.6
9
8,7
57
,13
4.3
8-
1,5
80
,82
1.7
5
3,2
71
,87
7.5
4
9,2
58
,21
2.5
3-
Yr
36
83
,22
4.8
8
39
7,7
95
.09
1
78
,97
4.9
7
80
4,0
56
.58
66
0,6
87
.96
1
49
,31
9.7
1
2,8
74
,05
9.1
9
20
,91
1,6
27
.70
4
,53
4,5
07
.65
16
7,8
90
.65
1
38
,57
6.1
6
1,9
66
,91
5.2
6
5,7
39
,87
0.9
5
6,7
90
,21
9.1
2-
1,4
77
,77
2.5
5
4,7
49
,65
0.0
9
7,7
80
,43
9.9
8-
Yr
47
03
,65
3.3
0
40
9,2
14
.87
1
84
,11
2.9
3
82
7,1
39
.19
67
9,6
54
.79
1
53
,60
6.3
4
2,9
57
,38
1.4
2
23
,86
9,0
09
.12
4
,66
4,6
82
.90
17
2,7
10
.40
1
42
,55
4.3
6
2,0
22
,56
6.2
5
7,7
62
,43
7.2
0
4,7
67
,65
2.8
8-
1,3
81
,43
9.9
6
6,1
31
,09
0.0
5
6,3
99
,00
0.0
2-
Yr
57
24
,69
2.5
4
42
0,9
62
.49
1
89
,39
8.3
8
85
0,8
84
.44
69
9,1
66
.11
1
58
,01
6.0
2
3,0
43
,11
9.9
8
26
,91
2,1
29
.10
4
,79
8,5
95
.18
17
7,6
68
.52
1
46
,64
6.7
6
2,0
79
,79
0.4
8
9,8
42
,22
7.6
8
2,6
87
,86
2.3
9-
1,2
91
,38
6.2
6
7,4
22
,47
6.3
1
5,1
07
,61
3.7
6-
Yr
67
46
,36
0.8
5
43
3,0
47
.35
1
,87
9,5
13
.51
1
94
,83
5.5
7
87
5,3
11
.37
71
9,2
37
.55
1
62
,55
2.3
0
5,0
10
,85
8.5
0
31
,92
2,9
87
.60
4
,93
6,3
51
.77
18
2,7
68
.98
1
50
,85
6.6
5
25
9,1
18
.90
10
,10
1,3
46
.58
2,4
28
,74
3.4
9-
14
6,2
65
.86
7,5
68
,74
2.1
7
4,9
61
,34
7.9
0-
Yr
77
68
,67
7.0
3
44
5,4
79
.14
2
00
,42
8.8
5
90
0,4
39
.54
73
9,8
85
.20
1
67
,21
8.8
0
3,2
22
,12
8.5
7
35
,14
5,1
16
.17
5
,07
8,0
63
.04
18
8,0
15
.85
1
55
,18
7.4
0
2,1
99
,13
7.7
2
12
,30
0,4
84
.30
22
9,6
05
.77
-
1,1
28
,50
5.3
7
8,6
97
,24
7.5
5
3,8
32
,84
2.5
2-
Yr
87
91
,66
0.4
8
45
8,2
67
.82
2
06
,18
2.7
0
92
6,2
89
.08
76
1,1
25
.60
1
72
,01
9.2
6
3,3
15
,54
4.9
5
38
,46
0,6
61
.12
5
,22
3,8
42
.51
19
3,4
13
.35
1
59
,64
2.4
7
2,2
61
,35
3.3
9
14
,56
1,8
37
.69
2,0
31
,74
7.6
2
1
,05
4,9
38
.05
9
,75
2,1
85
.60
2
,77
7,9
04
.48
-
Yr
98
15
,33
1.1
3
47
1,4
23
.63
2
12
,10
1.7
3
95
2,8
80
.70
78
2,9
75
.76
1
76
,95
7.5
4
3,4
11
,67
0.4
9
41
,87
2,3
31
.62
5
,37
3,8
06
.98
19
8,9
65
.80
1
64
,22
5.4
4
2,3
25
,32
7.7
3
16
,88
7,1
65
.42
4,3
57
,07
5.3
5
9
86
,16
5.9
5
1
0,7
38
,35
1.5
5
1,7
91
,73
8.5
3-
Yr
10
83
9,7
09
.53
4
84
,95
7.1
1
21
8,1
90
.69
9
80
,23
5.7
1
8
05
,45
3.1
9
18
2,0
37
.58
3
,51
0,5
83
.81
4
5,3
82
,91
5.4
2
5,5
28
,07
6.5
7
2
04
,67
7.6
5
16
8,9
39
.97
2
,39
1,1
10
.39
1
9,2
78
,27
5.8
1
6
,74
8,1
85
.74
92
1,8
76
.57
11
,66
0,2
28
.11
8
69
,86
1.9
6-
Yr
11
86
4,8
16
.84
4
98
,87
9.1
1
6,2
65
,04
5.0
4
22
4,4
54
.44
1
,00
8,3
76
.02
8
28
,57
5.8
9
18
7,2
63
.46
9
,87
7,4
10
.80
5
5,2
60
,32
6.2
2
5,6
86
,77
4.8
9
2
10
,55
3.4
8
17
3,7
89
.85
3
,80
6,2
92
.57
-
1
5,4
71
,98
3.2
4
2
,94
1,8
93
.16
1,3
34
,08
2.3
3-
10
,32
6,1
45
.79
2
,20
3,9
44
.29
-
Yr
12
89
0,6
74
.87
5
13
,20
0.7
8
23
0,8
98
.01
1
,03
7,3
24
.16
8
52
,36
2.3
9
19
2,6
39
.36
3
,71
7,0
99
.57
5
8,9
77
,42
5.7
9
5,8
50
,02
9.0
8
2
16
,59
7.9
8
17
8,7
78
.96
2
,52
8,3
06
.44
1
8,0
00
,28
9.6
8
5
,47
0,1
99
.61
80
5,5
96
.35
11
,13
1,7
42
.13
1
,39
8,3
47
.94
-
Yr
13
91
7,3
06
.04
5
27
,93
3.5
9
23
7,5
26
.55
1
,06
7,1
03
.35
8
76
,83
1.7
5
19
8,1
69
.60
3
,82
4,8
70
.88
6
2,8
02
,29
6.6
7
6,0
17
,96
9.9
1
2
22
,81
6.0
1
18
3,9
11
.29
2
,59
9,8
26
.33
2
0,6
00
,11
6.0
1
8
,07
0,0
25
.94
75
3,0
77
.08
11
,88
4,8
19
.22
6
45
,27
0.8
6-
Yr
14
94
4,7
33
.49
5
43
,08
9.3
5
24
4,3
45
.39
1
,09
7,7
37
.42
9
02
,00
3.5
6
20
3,8
58
.59
3
,93
5,7
67
.81
6
6,7
38
,06
4.4
8
6,1
90
,73
1.9
4
2
29
,21
2.5
4
18
9,1
90
.96
2
,67
3,3
67
.63
2
3,2
73
,48
3.6
4
1
0,7
43
,39
3.5
7
70
3,9
81
.25
12
,58
8,8
00
.47
5
8,7
10
.39
Yr
15
97
2,9
81
.03
5
58
,68
0.1
9
25
1,3
59
.99
1
,12
9,2
50
.93
9
27
,89
8.0
0
20
9,7
10
.90
4
,04
9,8
81
.03
7
0,7
87
,94
5.5
1
6,3
68
,45
3.5
7
2
35
,79
2.7
0
19
4,6
22
.19
2
,74
8,9
87
.43
2
6,0
22
,47
1.0
8
1
3,4
92
,38
1.0
0
65
8,0
85
.74
13
,24
6,8
86
.20
7
16
,79
6.1
3
Yr
16
1,0
02
,07
3.1
6
57
4,7
18
.61
1
,87
9,5
13
.51
2
58
,57
5.9
5
1,1
61
,66
9.1
2
95
4,5
35
.81
2
15
,73
1.2
1
6,0
46
,81
7.3
7
76
,83
4,7
62
.88
6
,55
1,2
77
.18
24
2,5
61
.77
2
00
,20
9.3
5
94
7,2
30
.92
26
,96
9,7
01
.99
14
,43
9,6
11
.92
2
06
,14
5.0
5
1
3,4
53
,03
1.2
5
92
2,9
41
.17
Yr
17
1,0
32
,03
5.1
5
59
1,2
17
.45
2
65
,99
9.0
7
1,1
95
,01
7.9
6
98
1,9
38
.34
2
21
,92
4.3
6
4,2
88
,13
2.3
2
81
,12
2,8
95
.20
6
,73
9,3
49
.22
24
9,5
25
.16
2
05
,95
6.8
9
2,9
06
,69
8.9
6
29
,87
6,4
00
.95
17
,34
6,3
10
.87
5
75
,07
4.8
9
1
4,0
28
,10
6.1
4
1,4
98
,01
6.0
7
Yr
18
1,0
62
,89
3.0
0
60
8,1
89
.94
2
73
,63
5.2
9
1,2
29
,32
4.1
7
1,0
10
,12
7.5
2
22
8,2
95
.29
4
,41
2,4
65
.21
8
5,5
35
,36
0.4
1
6,9
32
,82
0.3
9
2
56
,68
8.4
5
21
1,8
69
.44
2
,98
8,9
13
.07
3
2,8
65
,31
4.0
2
2
0,3
35
,22
3.9
5
53
7,5
82
.29
14
,56
5,6
88
.43
2
,03
5,5
98
.36
Yr
19
1,0
94
,67
3.5
0
62
5,6
49
.67
2
81
,49
0.7
3
1,2
64
,61
5.2
3
1,0
39
,12
5.9
5
23
4,8
49
.13
4
,54
0,4
04
.20
9
0,0
75
,76
4.6
0
7,1
31
,84
5.6
6
2
64
,05
7.3
8
21
7,9
51
.72
3
,07
3,4
50
.57
3
5,9
38
,76
4.5
9
2
3,4
08
,67
4.5
2
50
2,5
33
.73
15
,06
8,2
22
.16
2
,53
8,1
32
.08
Yr
20
1,1
27
,40
4.2
4
64
3,6
10
.63
2
89
,57
1.6
8
1,3
00
,91
9.4
1
1,0
68
,95
6.8
6
24
1,5
91
.10
4
,67
2,0
53
.91
9
4,7
47
,81
8.5
1
7,3
36
,58
4.4
9
2
71
,63
7.8
6
22
4,2
08
.62
3
,16
0,3
77
.06
3
9,0
99
,14
1.6
5
2
6,5
69
,05
1.5
8
46
9,7
69
.91
15
,53
7,9
92
.07
3
,00
7,9
02
.00
Ta
ble
A 4
H2 p
rod
uct
ion
pro
cess
eco
no
mic
stu
dy
dat
a fo
r S:
C 2

269
10.3 Appendix C.
10.4 Data referred to in Chapter 7
Table A 5. Ammonium analysis results
Temp
S:C CO CO2 moles
H2O
mole
H2O in
mole
H2O out
run time
/hr
total
moles out
mass out Litres mg/L N out mg/L NH3
out
g NH3 out g adjusted
NH3 in
%
conversion
700 2 0.031 0.012 0.056 0.106 0.050 3.730 0.186 3.346 0.003 829.500 10085.719 0.034 0.448 92.461
750 2 0.036 0.010 0.056 0.111 0.055 3.180 0.174 3.139 0.003 522.500 6352.970 0.020 0.221 90.972
800 2 0.039 0.010 0.059 0.108 0.050 3.330 0.165 2.981 0.003 224.000 2723.570 0.008 0.400 97.968
700 3 0.027 0.019 0.066 0.160 0.094 3.120 0.293 5.274 0.005 569.500 6924.433 0.037 0.371 90.162
750 3 0.031 0.018 0.066 0.162 0.097 3.250 0.314 5.656 0.006 527.000 6407.684 0.036 0.258 85.940
800 3 0.032 0.016 0.064 0.162 0.098 3.350 0.327 5.898 0.006 301.500 3665.876 0.022 0.266 91.863
700 4 0.023 0.026 0.074 0.217 0.142 3.100 0.441 7.950 0.008 406.000 4936.470 0.039 0.260 84.906
750 4 0.024 0.025 0.073 0.216 0.143 3.100 0.443 7.978 0.008 207.500 2522.950 0.020 0.238 91.554
800 4 0.032 0.018 0.068 0.215 0.147 3.220 0.473 8.527 0.009 169.000 2054.836 0.018 0.428 95.902