assessment of shrinkage-induced cracks in restrained...
TRANSCRIPT

Construction and Building Materials 131 (2017) 371–380
Contents lists available at ScienceDirect
Construction and Building Materials
journal homepage: www.elsevier .com/locate /conbui ldmat
Assessment of shrinkage-induced cracks in restrained and unrestrainedcement-based slabs
http://dx.doi.org/10.1016/j.conbuildmat.2016.11.0360950-0618/� 2016 Elsevier Ltd. All rights reserved.
⇑ Corresponding author.E-mail address: [email protected] (A.N. Ababneh).
Ayman N. Ababneh a,⇑, Rajai Z. Al-Rousan a,b, Mohammad A. Alhassan a, Mashal A. Sheban c
aDepartment of Civil Engineering, Jordan University of Science and Technology, Irbid, JordanbDepartment of Civil and Infrastructure Engineering, American University of Ras Al Khaimah, Ras Al Khaimah, United Arab EmiratescDepartment of Civil Engineering, Hadhramout University, Mukalla, Hadhramout, Yemen
h i g h l i g h t s
� Shrinkage-induced cracking incement-based slabs is investigatedand quantified.
� Measurements of crack length, width,and density were performed.
� Drying shrinkage developed few,randomly distributed cracks inunrestrained specimens.
� Restrained slabs developedperpendicular cracks with respect tothe drying surface.
� Cracks widths increase and newbranches grew up with furtherdrying.
g r a p h i c a l a b s t r a c t
a r t i c l e i n f o
Article history:Received 7 October 2015Received in revised form 14 October 2016Accepted 10 November 2016
Keywords:Cement-based slabsDrying shrinkageDegradationCrack quantificationImage analysis
a b s t r a c t
Concrete slabs and bridge decks experience early ages cracks mainly due to volumetric changes associatedwithmoisture and temperature variations. These cracks have no immediate effect on their safety, but theyhave detrimental effects on their durability and long-term performance. This paper presents an experi-mental investigation on quantification of shrinkage-induced cracks in slabs made from differentcement-based materials. An experimental test setup was used to simulate the shrinkage-induced damageof restrained slabs. Vacuum pressure impregnation with ultra-low viscosity epoxy was used for the prepa-ration of concrete samples for image analysis. Crackmeasurements in terms of crack length, width, densitywere performed on the concrete samples. Crack orientation was recorded and shown in a radar diagram.The results showed that drying of unrestrained specimens develop few and randomly distributed cracks,neither connected to each other nor to the specimen surface, with short extensions into the slab depth.Therefore, they had no significance effect on the transport properties. On the other hand, restrained slabsdeveloped localized cracks, oriented perpendicular to the drying surface and extending through the wholedepth of the slab. Further drying, increases the crack width and new branches grew up on the vertical basiccracks. Understanding crack patterns and their effect on the concrete transport properties, allows for moreaccurate prediction of the long-term performance of concrete slabs and bridge decks.
� 2016 Elsevier Ltd. All rights reserved.
1. Introduction
Concrete structures experience drying shrinkage when exposedto dry ambient conditions. As concrete dries, it shrinks and

Table 1Course and fine aggregate properties.
Properties Value Type of test
Course aggregateMoisture content 0.09% ASTM C566 [13]Bulk specific gravity (SSD) 2.393 ASTM C127 [13]Oven dry bulk specific gravity 2.361 ASTM C127 [13]Absorption capacity 1.38% ASTM C127 [13]Dry rodded unit weight 1594.6 kg/m3 ASTM C29 [13]
Fine aggregateFineness modulus 2.54 ASTM C136 [13]Moisture content 0.08% ASTM C566 [13]Bulk specific gravity (SSD) 2.648 ASTM C127 [13]Oven dry bulk specific gravity 2.621 ASTM C127 [13]Absorption capacity 1.05% ASTM C127 [13]
372 A.N. Ababneh et al. / Construction and Building Materials 131 (2017) 371–380
consequent shrinkage strains developed in it. If concrete isrestrained (prevented from shrinking freely), internal tensile stres-ses will develop. As the tensile stress reaches to the tensilestrength of concrete, micro-cracks are initiated. In restrained con-crete structures, the development of cracks and damage of con-crete can cause a significant degradation in the concreteproperties such as strength and modulus of elasticity.
There are different types of restraints in structural concrete, andthey can be divided into two main groups: external restraining andinternal restraining. External restraining is achieved using compo-nents that are not part of the concrete member such as joints con-necting a member to adjoining member with high stiffness.Internal restraining is achieved by elements that are part of thematerial of the concrete member such as the aggregates that havehigher stiffness than the cement paste matrix. Also, restrainingmay be imposed by alien bodies acting on the concrete material,such as reinforcing bars inside the member. The volumetric changegradient across a member or a specimen may cause it to serve as arestraint, which is called self-restraint.
Majority of the previous studies addressed the creep, shrinkageand cracking of high performance restrained concrete as well asthe impact of aggregate size and paste volume on drying shrinkagemicro-cracking in cement-based composites using methods suchas image analysis, a modified Weibull function, and scanning elec-tron microscopy [1–8]. Although some researchers studied thetype of shrinkage cracks for unrestrained cement paste or concretesamples, their tests were under very dry conditions, which rarelyoccur in concrete structures [4,9–10]. When unrestrained concretesamples were tested under 21 �C (stepwise: 93% RH? 55% RH),micro-cracks were significantly much less extensive compared tosamples dried at 50 �C and 105 �C [11].
Yoo et al. [5] studied the effect of expansive admixture andshrinkage-reducing admixture on the cracking and shrinkagebehaviors of restrained six full scale ultra-high-performancefiber-reinforced concrete slabs with three different thicknesses of40, 60, and 80 mm. Also, Shadravan et al. [6] investigated the fullscale behavior of concrete slabs on ground in a controlled environ-ment in terms of different concrete materials properties and theevaluating their performance as real slabs which exposed to thecontrolled environment and ground moisture from the top andbottom, respectively. But the shape or morphology of shrinkagecracks were not studied. The AASHTO ring specimen method hasnow been adopted by a number of researchers [7,8] due to its sym-metry, simplicity and reproducibility, and others [8] introducedsome modification to that test such as the restrained eccentric ringtest method (RERTM) and the restrained squared eccentric ring testmethod (RSERTM). However, all these tests still have limitationsregarding capturing the growth and shape of the drying cracks inconcrete slabs.
A major goal of this study was to develop a scale testmethod to simulate the behavior of restrained slabs. With thisrestraining, the crack types, width, growth, orientation, andtheir effect on the moisture transport are studied using differ-ent image analysis methods. Also, this test may simulate astructural element with low volume to surface area ratio, suchas building slabs and bridge decks that are more exposed todrying shrinkage. To meet this goal, scale slabs were cast andrestrained on all edges. Also, both external restrained and unre-strained conditions were explored. For the restrained specimens,an experimental test setup was used to simulate the shrinkage-induced damage behavior of structural element with low vol-ume to surface area ratio when exposed to dry environment.This setup allows for studying the crack growth and patternsinside the restrained slabs. A brief description of the setup ispresented in this paper; complete details about the setup canbe found in Sheban [12].
2. Research significance
Review of previous studies on the drying shrinkage crackgrowth and patterns of cement-based slabs with external restrain-ing shows a shortage of reliable data in this area. Accordingly, thisstudy is conducted to investigate the crack length, width, density,and orientation due to drying shrinkage for cement-based slabswith and without external restraining. The availability of suchimportant data is essential for accurate understating of the effectof drying shrinkage-induced damage on the concrete transportproperties and also to allow for accurate modeling of the dryingshrinkage damage.
3. Testing program
An experimental program was developed to evaluate the effectof the drying shrinkage-induced damage on cement-based slabs(cement paste, mortar and concrete). The properties and propor-tions of each slab specimen, drying procedure, and dimensionsfor both restrained and unrestrained specimens are presented inthe following sections.
3.1. Materials properties
Crushed stone with a maximum size of 9 mm was used ascoarse aggregate as shown in Table 1. The coarse aggregates metthe standard gradation requirements as specified in ASTM C33[13]. Table 1 presents the Graded river sand, which was used asa fine aggregate with standard gradation according to ASTM C33[13]. Commercially available Type I/II Portland cement was usedfor all mixtures described in this study. The cement specific gravityis 3.2 and the compound composition is: C3S = 51% and C3A = 8%.Table 2 provides a summary of the cement composition as suppliedby the manufacturer.
3.2. Mixture proportions
Three mixtures were cast including: cement paste, mortar, andconcrete. The ingredient ratio and water-cement ratio are listed inTable 3. Cubes 50 � 50 � 50 mm were used for testing the cementpaste and mortar strength, and cylinders 100 � 200 mm were usedfor testing the concrete strength. The dimensions of slabs andprisms are presented in the following section. Then, the specimenswere covered with a thin plastic film, maintained at standard roomtemperature, and kept for 24 h before de-molding.
3.3. Drying condition
The specimens were cured in tap water saturated with calciumhydroxide according to ASTM C511 [13]. Compressive strength

Table 2Chemical composition of cement.
Silica (SiO2) 20.60%Alumina (Al2O3) 5.00%Iron oxide (Fe2O3) 3.10%Calcium oxide (CaO) 62.4%Magnesium (MgO) 3.80%Sulfur Trioxide (SO3) 2.90%Loss of ignition 1.3%Insoluble residue 0.39%Equivalent alkali (as Na2O) 0.58%
Table 3Mix proportioning ratio by dry weight.
Phase Cement paste Mortar Concrete
Coarse aggregate – – 2.0Fine aggregate – 2.0 2.0Cement 1.0 1.0 1.0Water 0.50 0.50 0.55
Table 4Compressive strength results.
Cementitious specimens 7 days strength, MPa 28 days strength, MPa
Cement paste 18 32Mortar 20 35Concrete 19 21
A.N. Ababneh et al. / Construction and Building Materials 131 (2017) 371–380 373
tests for cylinders and cubes were conducted at 7 and 28 days andthe results are shown in Table 4. All slabs and prisms were curedfor 6 days in tap water saturated with calcium hydroxide accordingto ASTM C511 [13]. Upon removal from the curing bath, all speci-mens weights (SSD) were recorded, and then two prisms and twounrestrained slabs were oven-dried to a constant weight at 105 �Cto determine their initial moisture content. The drying processstarted after 6 days of curing, where the specimens were exposedto a constant relative humidity of 30% ± 5% and at a constant roomtemperature inside a humidity-controlled chamber. The weightloss was measured, and crack width was monitored at various agesusing optical microscopes.
Fig. 1. External restrained slab specimen geometry
Table 5External restrained and unrestrained slab specimen designation.
Specimen Type Dimension,
CoERS1 and CoURS1 Concrete 150 � 150 �MoERS1 and MoURS1 Mortar 150 � 150 �MoERS2 and MoURS2 Mortar 150 � 150 �CeERS1 and CeURS1 Cement paste 150 � 150 �CeERS2 and CeURS2 Cement paste 150 � 150 �
Notes: Co = Concrete, Mo = Mortar, and Ce = Cement paste; ER = external restrained, UR =
3.4. Concrete specimens’ details and test variables
Two main categories of specimens were prepared to study thepatterns and effects of drying shrinkage cracks with and withoutexternal restraint. Two shapes of specimens with no externalrestraining were cast: prism and slab specimens. An experimentaltest was developed to assess damage in concrete slabs with exter-nal restraint. Drying was permitted from the top and bottom sur-faces with an area of 150 � 150 mm. Two 12.5 mm thick steelplates (top and bottom plates) were used to provide rigidity tothe setup frame. To ensure axial and horizontal restraint, coarse-threaded bars were attached to the edge plates before castingthereby allowing the fresh concrete to harden around them.Fig. 1 shows the dimensions and setup of the external restrainedslab specimen. Table 5 shows the name and drying durations offive different specimens that were cast including: one concrete,two mortar and two cement paste specimens with the mix propor-tion ratios listed in Table 3.
In order to compare the results of the externally restrainedslabs, two shapes of specimens with no external restraint werecast: prism and slab specimens (the symbol URP is used to nameunrestrained prism specimens; the symbol URS is used to nameunrestrained slab specimens). The prism specimen dimensionswere 150 � 30 � 30 mm, and drying was permitted from top andbottom surfaces with each surface area equal to 150 � 30 mm asshown in Fig. 2. The other four sides of the prism were sealed withduct tape to ensure that only uniaxial moisture diffusion wouldtake place during the drying process. The slabs dimensions weresimilar to the externally restraint slabs but without restraining asmentioned in Table 5. Also, the small sides of the slabs were sealedwith duct tape to ensure that diffusion would occur from the topand bottom surfaces only.
3.5. Samples preparation for crack quantification
Preparation of concrete samples is a critical issue and a prereq-uisite to obtain images from microscopic instruments. Severaltechniques are used in the past. The vacuum pressure impregna-tion that is used with ultra-low viscosity epoxy is the best methodof sample preparation to study the damage due to drying shrinkage[4,9,14]. The cutting and polishing are done after impregnation and
and setup apparatus (all dimensions in mm).
mm Drying duration, days Degree of drying
30 128 77%20 74 47%20 30 47%20 28 52%20 3 21%
unrestrained, and S = slab specimen.

nemicepsbals)b(snemicepsmsirp)a(
Fig. 2. Unrestrained specimens.
374 A.N. Ababneh et al. / Construction and Building Materials 131 (2017) 371–380
setting of the epoxy. The sampling procedure was done directlyafter removing the specimens from the humidity-controlledchamber.
3.6. Image analysis procedure
Image analysis is a powerful tool for gathering information. Itwas used previously to assess the morphological characteristicsof micro-cracks in concrete [15], detection of micro-cracks [1,16]hydration processes of cement-based slabs [17], orientation offiber reinforcement [18], and the cracks microstructure [1,4,9,14].The quantification of cracks in the prepared samples passedthrough three steps of image analysis: 1) image acquisition andsample of full crack sequences images as shown in Fig. 3 and
Fig. 3. Image acquisition configuration setup.
Fig. 4, respectively, 2) image processing (Fig. 5), and 3) crack mea-surements (Fig. 6).
3.7. Crack measurements
The crack measurements were done by National InstrumentsVision Assistance version 8.0 after adding the pixel scale calibra-tion. The measured parameters were: the total crack length(TCL), which is the summation length of all cracks on the cross-section; maximum crack depth (MCD), which is the maximumpenetration depth of the crack pattern on the cross-section; crackmouth opening (CMO), which is the maximum crack mouth open-ing at the surface of the sample; crack density (CD%), which is thepercent of the total crack area per total cross-section area; and rackmean width (CMW), which is the mean width of the cracks in thecross-section defined as the total crack area divided by TCL.
Fig. 4. Capture of sequences images for the full crack.

(a) Original image (b) After threshold function
(c) After image Filtering (d) Final cleaning
Fig. 5. Image processing procedure.
Fig. 6. Crack on section 1 of external restrained mortar slab (MoERS1).
A.N. Ababneh et al. / Construction and Building Materials 131 (2017) 371–380 375

Table 6Angle orientation groups.
Group # Description
Group 0� (180�) If angle orientation <15� or >165�Group 30� If 15�< angle orientation <45�Group 60� If 45�< angle orientation <75�Group 90� If 75�< angle orientation <105�Group 120� If 105�< angle orientation <135�Group 150� If 135�< angle orientation <165�
0200400600800
1000120014001600
270
300
330
0
30
60
90
120
150
180
210
240
(a) – MoERS1
01020304050607080
270
300
330
0
30
60
90
120
150
180
210
240
(c) MoURS1 and MoURP1
0
200
400
600
800270
300
330
0
30
60
90
120
150
180
210
240
(e) CeURS1
Fig. 7. Radar diagrams show the orienta
376 A.N. Ababneh et al. / Construction and Building Materials 131 (2017) 371–380
Also, the orientation of the micro-cracking on the cross-sectionwas recorded and shown in a radar diagram. In constructing theradar diagram, the actual cracks divided into linear segments,and the length and orientation of each linear segment was deter-mined. Then the linear segments were divided into angle groupsbased on the angle orientation as shown in Table 6. The length ofall linear segments with the same angle group are summed andshowed in a radar diagram averaged for each sample. The radar
0200400600800
100012001400
270
300
330
0
30
60
90
120
150
180
210
240
(b) MoERS2
0500
100015002000250030003500
270
300
330
0
30
60
90
120
150
180
210
240
(d) CeERS1
0
500
1000
1500
2000
2500270
300
330
0
30
60
90
120
150
180
210
240
(f) CeURP1
tion and segment length of cracks.
A.N. Ababneh et al. / Construction and Building Materials 131 (2017) 371–380 377
diagrams show the segments and orientation of the cracks in across-section. If the cracks have a random orientation, then itsradar diagram will be a round shape. Otherwise, the radar diagramwill be elongated for localized cracks oriented perpendicular todrying surface. The radar diagram is drawn for 360� orientationwith two symmetric parts. All segment lengths shown in the radardiagrams in this study are in micrometer unit.
4. Experimental results
4.1. Crack quantification results
The focus of this research was to study the drying shrinkagecrack patterns of cement-based slabs (concrete, mortar, andcement paste) with and without external restraining. The concreterestrained specimen did not show any cracks, and this could bebecause the thickness of the specimen was small, and the maxi-mum size of aggregate was large. This size of aggregates affectsthe restraining support, which was provided by the coarse-threaded screws, and the aggregates introduced discontinuitybetween the concrete and the restraining support. Some research-ers [11] used a ratio of thickness to maximum size aggregate (t/
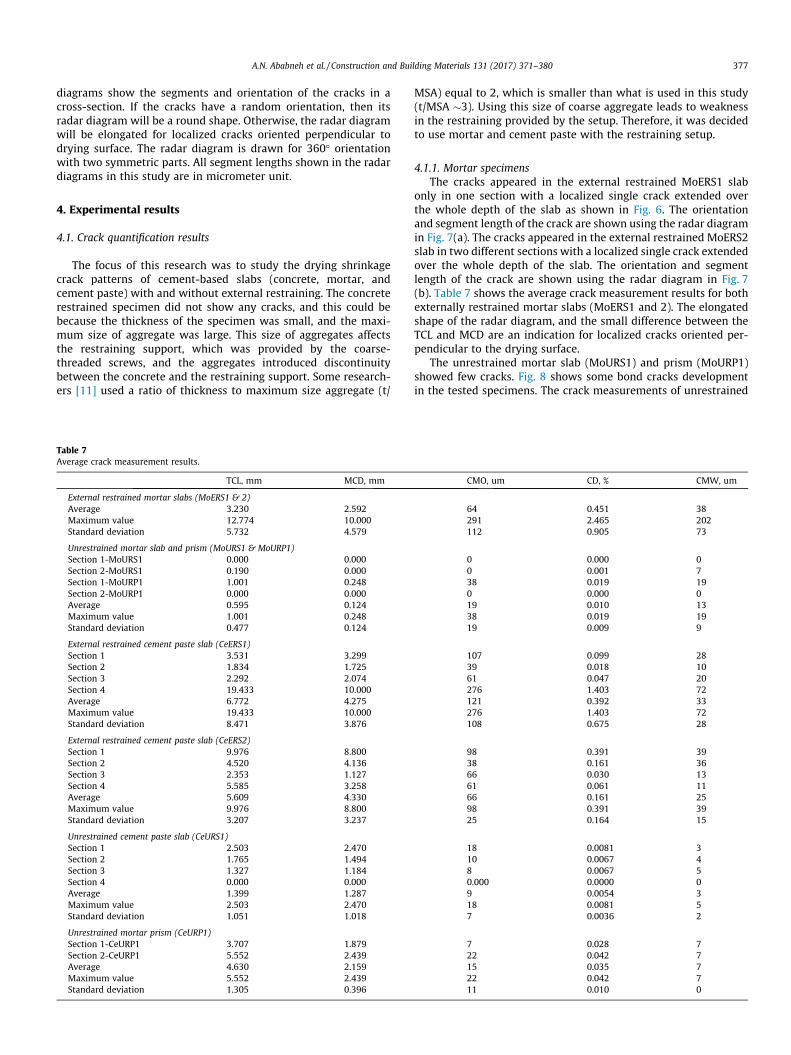
Table 7Average crack measurement results.
TCL, mm MCD, mm
External restrained mortar slabs (MoERS1 & 2)Average 3.230 2.592Maximum value 12.774 10.000Standard deviation 5.732 4.579
Unrestrained mortar slab and prism (MoURS1 & MoURP1)Section 1-MoURS1 0.000 0.000Section 2-MoURS1 0.190 0.000Section 1-MoURP1 1.001 0.248Section 2-MoURP1 0.000 0.000Average 0.595 0.124Maximum value 1.001 0.248Standard deviation 0.477 0.124
External restrained cement paste slab (CeERS1)Section 1 3.531 3.299Section 2 1.834 1.725Section 3 2.292 2.074Section 4 19.433 10.000Average 6.772 4.275Maximum value 19.433 10.000Standard deviation 8.471 3.876
External restrained cement paste slab (CeERS2)Section 1 9.976 8.800Section 2 4.520 4.136Section 3 2.353 1.127Section 4 5.585 3.258Average 5.609 4.330Maximum value 9.976 8.800Standard deviation 3.207 3.237
Unrestrained cement paste slab (CeURS1)Section 1 2.503 2.470Section 2 1.765 1.494Section 3 1.327 1.184Section 4 0.000 0.000Average 1.399 1.287Maximum value 2.503 2.470Standard deviation 1.051 1.018
Unrestrained mortar prism (CeURP1)Section 1-CeURP1 3.707 1.879Section 2-CeURP1 5.552 2.439Average 4.630 2.159Maximum value 5.552 2.439Standard deviation 1.305 0.396
MSA) equal to 2, which is smaller than what is used in this study(t/MSA �3). Using this size of coarse aggregate leads to weaknessin the restraining provided by the setup. Therefore, it was decidedto use mortar and cement paste with the restraining setup.
4.1.1. Mortar specimensThe cracks appeared in the external restrained MoERS1 slab
only in one section with a localized single crack extended overthe whole depth of the slab as shown in Fig. 6. The orientationand segment length of the crack are shown using the radar diagramin Fig. 7(a). The cracks appeared in the external restrained MoERS2slab in two different sections with a localized single crack extendedover the whole depth of the slab. The orientation and segmentlength of the crack are shown using the radar diagram in Fig. 7(b). Table 7 shows the average crack measurement results for bothexternally restrained mortar slabs (MoERS1 and 2). The elongatedshape of the radar diagram, and the small difference between theTCL and MCD are an indication for localized cracks oriented per-pendicular to the drying surface.
The unrestrained mortar slab (MoURS1) and prism (MoURP1)showed few cracks. Fig. 8 shows some bond cracks developmentin the tested specimens. The crack measurements of unrestrained
CMO, um CD, % CMW, um
64 0.451 38291 2.465 202112 0.905 73
0 0.000 00 0.001 738 0.019 190 0.000 019 0.010 1338 0.019 1919 0.009 9
107 0.099 2839 0.018 1061 0.047 20276 1.403 72121 0.392 33276 1.403 72108 0.675 28
98 0.391 3938 0.161 3666 0.030 1361 0.061 1166 0.161 2598 0.391 3925 0.164 15
18 0.0081 310 0.0067 48 0.0067 50.000 0.0000 09 0.0054 318 0.0081 57 0.0036 2
7 0.028 722 0.042 715 0.035 722 0.042 711 0.010 0

Fig. 8. Cracks development in the tested specimens.
378 A.N. Ababneh et al. / Construction and Building Materials 131 (2017) 371–380
mortar slabs are shown in Table 7, and the orientation and seg-ment length of the crack are shown using the radar diagram inFig. 7(c). The rounded shape of the radar diagram is an evidenceof random orientation cracks.
4.1.2. Cement paste specimensLong thin cracks were observed in the sections of the external
restrained cement paste slab (CeERS1). One of these cracksextended over the whole depth of the section, the others extendedup to one third of the section depth. Samples of these cracks areshown in Fig. 8. The crack measurements of CeERS1 slab are shownin Table 7, and the orientation and segment length of the crack areshown using the radar diagram in Fig. 7(d). The clear elongatedshape of the radar diagrams indicates localized cracks orientedperpendicular to the drying surface. Similar to CeERS1 slab, longthin cracks were observed in the sections of the externallyrestrained cement paste slab (CeERS2). One of them extendedapproximately through the entire depth of the section; othersextended up to half the depth. The crack measurements of CeERS1slab are listed in Table 7.
The unrestrained cement paste slab CeURS1 showed few shortcracks extended up to 2.5 mm from the surface. Samples of thesecracks are shown in Fig. 8. The crack measurements of unre-strained cement paste slab are listed in Table 7, and the orientationand segment length of the crack are shown on the radar diagram inFig. 7(e). The elongated shape of the radar diagram and the smalldifference between the TCL and MCD are evidence for localizedcracks oriented perpendicular to the drying surface. The unre-strained cement paste prism CeURP1 showed few cracks as shownin Fig. 8. The crack measurements of unrestrained cement pasteprism CeURP1 are listed in Table 7, and the orientation and seg-ment length of the crack are shown on the radar diagram inFig. 7(f). The unrestrained cement paste prism CeURP2 showedfew cracks similar to CeURP1.
4.2. Surface cracks and moisture loss results
The surface cracks observed daily using crack detection pocketmicroscope with 40x magnification with 0.02 mm smallest divi-sion that can be measured. The maximum surface crack width
was recorded for each specimen. The progress of drying for allspecimens was monitored by weight measurements on two differ-ent electronic balances. The mass losses of the prism specimenswere measured with a balance having a resolution of 0.1 g and amaximum capacity of 400 g. The mass losses of the slab specimenswere measured with a balance having a resolution of 4.5 g and amaximum capacity of 45 kg. The moisture loss results of the spec-imens were normalized relative to initial moisture content andexpressed as percentage of the initial moisture content.
4.2.1. Concrete specimensBoth restrained and unrestrained concrete specimens did not
show any surface cracks as mentioned earlier.
4.2.2. Mortar specimensOn both restrained surfaces, the crack initiated at one corner of
the slab with a 45� angle. Then, with time, other cracks developedat other corners of the slab. The maximum width of the cracks isshown in Fig. 9. No surface cracks observed in the unrestrainedmortar slab and prisms. Fig. 9 shows the moisture losses for theexternally restrained specimens. Specimen MoERS2 shows an ear-lier crack initiation that led to faster drying compared with speci-men MoERS1.
4.2.3. Cement paste specimensOn both restrained specimens’ surfaces, the crack initiated at
one corner of the slab with a 45� angle. Then, with time, othercracks developed and intersected at the mid of the surface slab,and randomly distributed over the surface. The maximum widthof the cracks is shown in Fig. 10. In the unrestrained cement pasteslabs, random hairline cracks appeared on the slab surface with amaximum width less than 0.01 mm. For the cement paste prisms,the maximum crack width reached 0.04 mm. The moisture lossesof cement paste specimens with time are shown in Fig. 10. Thesame trend of drying process was observed in the cement pastespecimens as in the mortar specimens with differences in the crackwidth and percentage of moisture losses. Fig. 10 shows the mois-ture losses for the externally restrained specimens, SpecimenCeERS1 showed an earlier crack initiation that led to a faster dryingcompared with specimen CeERS2.

0.0
10.0
20.0
30.0
40.0
50.0
60.0
0.00 10.00 20.00 30.00 40.00 50.00 60.00 70.00 80.00Drying Time (days)
Moi
stur
e lo
sses
(Wim
c%)
MoERS2
MoERS1
Cracks initiated
max width=0.12 mm
max width=0.14mm
Cracks initiated
max width= 0.08 mm
max width= 0.1 mm
Fig. 9. Drying curves for the externally restrained mortar specimens normalized to initial moisture content.
0.0
10.0
20.0
30.0
40.0
50.0
60.0
0.00 5.00 10.00 15.00 20.00 25.00 30.00
Drying Time (days)
Moi
stur
e lo
sses
(Wim
c%)
CeERS1
CeERS2
max width=0.02 mm
max width=0.28 mmmax width=0.5 mm
max width=0.06 mm
max width=0.1 mm
Fig. 10. Drying curves for the externally restrained cement paste specimens normalized to initial moisture content.
A.N. Ababneh et al. / Construction and Building Materials 131 (2017) 371–380 379
5. Discussion and comparison
The external restraining developed cracks extended over theentire slab depth. The pattern of the restraining cracks was local-ized (single crack for mortar or few cracks for cement paste) andmainly cracks oriented perpendicular to the drying surface. Also,the localization of crack in the restrained mortar specimens wasclear by the observation of crack in one section only. The cracks ini-tiated early and extended very fast as seen in Fig. 9. These resultssuccessfully duplicate the results typically observed in the field.For example, early age cracks appear on concrete bridge decksdue to volumetric changes in concrete. These cracks may initiatesoon after construction, and they start from the bottom face ofthe bridge deck and extend through the deck’s depth to the topsurface [19–21].
The initiation of cracks and the extension through the entiredepth occurred very fast (less than 3 days) and with less than20% of degree of drying (Fig. 10 and Table 7). However, as thedegree of drying increased, the crack width and branches increasedas shown in Fig. 8. Thus, the CD %, CMO, and CMW increased(Table 7). Also, the crack branches that grew up as the degree of
drying increased showed an inclination angle different than thevertical basic crack.
The both bond and mortar cracks in the unrestrained mortarspecimens (Fig. 8) were in agreement with the findings of otherresearchers [4,10,22]. Since they were very few and not con-nected, it is believed that they had no effect on the moisturetransport properties [22]. The drying shrinkage cracks appearedonly at extreme cases such as oven dry case, which does notrepresent the actual environmental conditions concrete struc-tures normally experience. The crack density, width, and lengthof the restrained specimens were higher than the unrestrainedspecimens.
The cracks in the unrestrained cement paste specimens weremicro-cracks randomly distributed over the surface with shortextension into the slab depth. The cracks extended inside the slabperpendicular to the surface. These cracks developed due to self-restraining resulted from the differential shrinkage in the speci-mens caused by the moisture gradient developed during the dryingprocess. The restrained cement paste specimens showed uniformrandom distributed cracks, and these cracks were wider andextending through the entire depth of the slab.
380 A.N. Ababneh et al. / Construction and Building Materials 131 (2017) 371–380
Comparison of the average TCL and MCD between the mortarand cement paste restrained slabs at similar degree of drying(around 50%) shows lower values for the mortar slabs (Table 7).This could be attributed to the lower amount of cement in themortar specimen. This is also the reason why no surface crackswere developed in the unrestrained mortar paste specimens ashappened in the unrestrained cement paste specimens. The effectof localized cracks that developed in the restrained mortar slabsraises a concern about the effect of the localized cracks on thedrying process of the further slab parts. The authors believe thatthe damage is localized in a special zone, and its effect is dominantin that zone. The damage effects disappear far away from thedamage zone.
6. Conclusions
The drying shrinkage crack patterns of cement-based slabs withexternal restraining have been investigated herein in terms ofcrack length, width, density, and orientation in order to overcomethe shortage of data in this area. Knowing the crack patterns allowsfor better understating of the effect of drying shrinkage-induceddamage on the concrete transport properties, and better modelingof the drying shrinkage-induced damage. Based on the findings ofthis study, the following conclusions are drawn:
1. The drying shrinkage in cementitious restrained slabsdevelops localized cracks oriented perpendicular to the dryingsurface and extending through the entire depth of the slab.After that, as the degree of drying increases, the crack widthincreases and new branches grow up on the vertical basiccracks.
2. The drying shrinkage in unrestrained mortar specimens devel-oped few cracks neither connected to each other nor to thespecimen surface. Therefore, they had no significance effecton the moisture transport properties.
3. The drying shrinkage in unrestrained cement paste specimensdeveloped micro-cracks randomly distributed on the dryingsurface with short extensions into the slab depth. The exten-sions of these cracks through the depth were perpendicular tothe specimen surface due to self-restraining resulted from thedifferential shrinkage in the specimen caused by the moisturegradient developed during the drying process.
4. Additional experimental investigation is needed to verify theauthors’ belief of the existence of damage in a localized zoneand disappearing away from this zone by embedding humiditysensors inside the slab at different locations.
References
[1] C. Qi, W.J. Weiss, J. OleK, Characterization of plastic shrinkage cracking in fiberreinforced concrete using image analysis and a modified Weibull function,Mater. Struct. 36 (1) (2003) 386–395.
[2] J.P. Ollivier, A non destructive procedure to observe the micro-cracks ofconcrete by scanning electron microscopy, Cem. Concr. Res. 15 (6) (1985)1055–1060.
[3] V. Sicard, R. Francois, E. Ringot, G. Pons, Influence of creep and shrinkage oncracking in high strength concrete, Cem. Concr. Res. 22 (1) (1992) 159–168.
[4] J. Bisschop, L. Pel, J. Van Mier, Effect of aggregate size and paste volume ondrying shrinkage microcracking in cement-based composites, in: F.-J. Ulm, Z.P.Bazant, F.H. Wittmann (Eds.), Creep, Shrinkage and Durability Mechanics ofConcrete and other Quasi-Brittle Materials, 2001, pp. 75–80.
[5] D. Yoo, K. Min, J. Lee, Y. Yoon, Shrinkage and cracking of restrained ultra-high-performance fiber-reinforced concrete slabs at early age, Constr. Build. Mater.73 (2014) 357–365.
[6] S. Shadravan, C. Ramseyer, T. Kang, A long term restrained shrinkage study ofconcrete slabs on ground, Eng. Struct. 102 (2015) 258–265.
[7] I. Ray, Z. Gong, J. Davalos, A. Kar, Shrinkage and cracking studies of highperformance concrete for bridge decks, Constr. Build. Mater. 28 (2012) 244–254.
[8] H. Zhu, H. Li, X. Zhu, On concrete restrained eccentric ring and squaredeccentric ring shrinkage test methods, Constr. Build. Mater. 84 (2015) 239–244.
[9] J. Bisschop, J. Van Mier, How to study drying shrinkage micro-cracking incement-based materials using optical and scanning electron microscopy?, CemConcr. Res. 32 (1) (2002) 279–287.
[10] N. Hearn, Effect of shrinkage and load-induced cracking on water permeabilityof concrete, ACI Mater. J. 96 (2) (1999) 234–241.
[11] Z. Wu, H.S. Wong, N.R. Buenfeld, Influence of drying-induced microcrackingand related size effects on mass transport properties of concrete, Cem. Concr.Res. 68 (2015) 35–48.
[12] M.A. Sheban, Durability assessment of concrete materials under the effect ofshrinkage-induced damage and Benzotriazole corrosion protection system(Ph.D. dissertation), Clarkson University, NY, USA, 2007.
[13] ASTM Book of Standards, Construction: Concrete and Aggregates, AmericanSociety for Testing Materials, Ann Arbor; MI, 2005 (V. 04–05).
[14] J. Bisschop, J. Van Mier, Effect of aggregates on drying shrinkage microcrackingin cement-based composites, Mater. Struct. 35 (1) (2002) 453–461.
[15] A. Ammouche, J. Riss, D. Breysse, J. Marchand, Image analysis for theautomated study of microcracks in concrete, Cem. Concr. Compos. 23 (2–3)(2001) 267–278.
[16] V.S. Shah, Detection of microcracks in concrete cured at elevated temperature(Ph.D. Dissertation), University of Florida, 2004.
[17] M. Mouret, E. Ringot, A. Bascoul, Image analysis: a tool for the characterisationof hydration of cement in concrete - metrological aspects of magnification onmeasurement, Cem. Concr. Compos. 23 (2–3) (2001) 201–206.
[18] Y. Akkaya, J. Picka, S.P. Shah, Spatial distribution of aligned short fibers incement composites, Constr. Build. Mater. 12 (3) (2000) 272–279.
[19] P.D. Krauss, E.A. Rogalla, Transverse Cracking in Newly Constructed BridgeDecks. Rep. No. NCHRP Report 380. 1997, Transportation Research Board,National Research Council, Washington, D.C., 1997.
[20] F. Fanous, H. Wu, J. Pape, Impact of Deck Cracking on Durability, Center forTransportation Research and Education, Iowa State University, Ames, IA, 2000.
[21] M.A. Saadeghvaziri, R. Hadidi, Cause and Control of Transverse Cracking inConcrete Bridge Decks. Rep. No. FHWA-NJ-2002-19, Federal HighwayAdministration, U.S. Department of Transportation, Washington, D.C., 2002.
[22] H. Samaha, K.C. Hover, Influence of microcracking on the mass transportproperties of concrete, ACI Mater. J. 89 (4) (1992) 416–424.