assessment of spatio-temporal variations in water...
TRANSCRIPT
Journal of Geoscience and Environment Protection, 2017, 5, 1-26 http://www.scirp.org/journal/gep
ISSN Online: 2327-4344 ISSN Print: 2327-4336
DOI: 10.4236/gep.2017.51001 January 5, 2017
Assessment of Spatio-Temporal Variations in Water Quality of Shailmari River, Khulna (Bangladesh) Using Multivariate Statistical Techniques
Md. Muhyminul Islam1, Olaf K. Lenz2, Abul Kalam Azad3, Mosummath Hosna Ara4, Masudur Rahman3, Nazia Hassan3
1Tropical Hydrogeology and Environmental Engineering, TU Darmstadt, Schnittspahnstrasse, Germany 2Institut für Angewandte Geowissenschaften, Angewandte Sedimentgeologie, TU Darmstadt, Schnittspahnstrasse, Germany 3Environmental Science Discipline, Khulna University, Khulna, Bangladesh 4Chemistry Discipline, Khulna University, Khulna, Bangladesh
Abstract Surface water has become one of the most vulnerable resources on the earth due to deterioration of its quality from diverse sources of pollution. Under-standing of the spatiotemporal distribution of pollutants and identification of the sources in the river systems is a prerequisite for the protection and sus-tainable utilization of the water resources. Multivariate statistical techniques such as Principal Component Analysis (PCA) and Factor Analysis (FA) were applied in this study to investigate the temporal and spatial variations of water quality and appoint the major factors of pollution in the Shailmari River sys-tem. Water quality data for 14 physicochemical parameters from 11 monitor-ing sites over the year of 2014 in three sampling seasons were collected and analyzed for this study. Kruskal-Wallis test showed significant (p < 0.01) temporal and spatial variations in all of the water quality parameters of the river water. Principal component analysis (PCA) allowed extracting the con-tributing parameters affecting the seasonal water quality in the river system. Scatter plots of the PCs showed the tidal and spatial variation within river system and identified parameters controlling the behavior in each case. Factor analysis (FA) further reduced the data and extracted factors which are signifi-cantly responsible for water quality variation in the river. The results indicate that the parameters controlling the water quality in different seasons are re-lated with salinity, anthropogenic pollution (sewage disposal, effluents) and agricultural runoff in pre-monsoon; precipitation induced surface runoff in monsoon; and erosion, oxidation or organic pollution (point and non-point
How to cite this paper: Islam, Md.M., Lenz, O.K., Azad, A.K., Ara, M.H., Rah-man, M. and Hassan, N. (2017) Assessment of Spatio-Temporal Variations in Water Quality of Shailmari River, Khulna (Ban-gladesh) Using Multivariate Statistical Tech- niques. Journal of Geoscience and Envi-ronment Protection, 5, 1-26. http://dx.doi.org/10.4236/gep.2017.51001 Received: December 20, 2016 Accepted: January 2, 2017 Published: January 5, 2017 Copyright © 2017 by authors and Scientific Research Publishing Inc. This work is licensed under the Creative Commons Attribution International License (CC BY 4.0). http://creativecommons.org/licenses/by/4.0/
Open Access

Md. M. Islam et al.
2
sources) in post-monsoon. Therefore, the study reveals the applicability and usefulness of the multivariate statistical methods in assessing water quality of river by identifying the potential environmental factors controlling the water quality in different seasons which might help to better understand, monitor and manage the quality of the water resources.
Keywords Water Quality Variation, Wastewater, Multivariate Statistical Analysis, Monsoon, Bangladesh
1. Introduction
The quality of river waters has become one of prime concerns nowadays because of its multiple use in drinking, irrigation and industrial sectors around the world. Rivers carry significant load of matters in dissolved and particulate forms from natural sources like precipitation inputs, weathering of crustal materials, erosion etc. and from the anthropogenic sources like urban and industrial wastewater discharge into the water bodies, agricultural runoffs etc. The quality of river water in a region is, therefore, influenced by both of these anthropogenic and natural processes [1] [2] [3] and industrial sources are discharging waste-water as constant polluting sources whereas surface runoff is a non-point source of pollution, predominantly affected by climate and topography of the watershed area [4] [5]. Moreover, river water used for irrigation can affect productivity de-pending on type and quantity of dissolved salts present in the irrigation that pose a potential threat to irrigated agriculture [6] [7]. Therefore, an assessment of the river water is essential for the reliable estimation of the water quality. This requires interpretation of complex data sets comprising of a large number of physico-chemical parameters [8] [9]. Application of different multivariate statis-tical techniques and exploratory data analysis help interpret these complex data matrices and provide a better understanding of spatiotemporal variation in sur-face water quality due to anthropogenic or natural activity coupled with seaso-nality [10] [11] [12] [13]. Being an agrarian country, Bangladesh depends largely on the surface water sources especially of the river water for irrigation. 60% of the country’s agricultural production depends on the irrigation water from dif-ferent sources. Due to rapid urbanization, indiscriminate dumping of industrial and municipal wastes the situation has become more severe. The problem is more aggravated by the upward withdrawal of fresh water in the upstream in the dry period and subsequent encroachment of saline water towards the upstream from the Bay of Bengal [14] [15]. The southwest coastal city Khulna is extremely affected by climate change and its extreme impacts for last several years. Batiag-hata is one of the most populated upazillas of Khulna and is a major agricultural area of the southwest coastal part of the country. Agricultural practice in this area is done all through the year in different scale. Rice cultivation besides

Md. M. Islam et al.
3
shrimp farming is very commonly seen in this area. But the adverse climatic sit-uation has affected this region nowadays in greater extent [16]. Natural and anthropogenic inputs from point and non-point sources affect the water quality which shows temporal variability in the river. Besides, different pollutant trans-port pathways those carry the inputs into the river like storm and agricultural runoff, discharges from the ponds, and canals, aquifer leakage, subsurface leach- ing and atmospheric depositions are highly seasonal dependent [17]. Therefore, in this study, multivariate statistical analyses were applied to assess the seasonal variation of water quality of the Shailmari River and its connected channel in pre-monsoon (March-May), monsoon (June-September) and post-monsoon (October-November) with a view to identify the factors responsible for the spa-tio-temporal variation in water quality of this river system [18]. Identification of seasonal change on water quality of this river and determination of the relevant factors would help find the probable remedial measures for this region and, thus, can contribute to the development of the agriculture, agricultural community, and national economy by ensuring environmental sustainability.
2. Materials and Methods 2.1. Study Area
Prior to study area selection, a reconnaissance survey was conducted to concep-tualize the context of the seasonal and spatial influences of this region on the Shailmari River. The Shailmari River basin is located in the Southwest coastal part of Bangladesh and flows through BatiaghataUpazilla of Khulna. The 15 km long river with its 10 km of connected channel is confined between the Longi-tude 89˚31'18.6" and 89˚28'31.9" East and the Latitude 22˚44'45.1" and 22˚46'23.8" North (Figure 1). Originating from the Rupsha-Kazibacha River system near Batiaghata, River Shailmari flows over it and falls into to the Bhadra River in the south near Dacope. The connected channel is a cut off of the tribu-taries of Shailmari River and is controlled by a regulator constructed on the mouth of the channel near KoyaGhat to restrict the frequent entry of the tidal water into it. The climate of the river basin is humid, sub-tropical monsoon. Summer is the highest tempered period with a maximum of 40˚C in April and winter is the coldest with a minimum of 2˚C in January. Highest precipitation (80% of annual rainfall) occurs during the monsoon with a maximum of 1000 - 1220 mm between July and August and minimum is in winter ranging from 0 - 10 mm in December-January [18]. Ganges deltaic deposits from late Holocene to recent age forms the study area. Tidal deltaic deposits, deltaic silt deposits and mangrove swamp deposits characterize the surface lithology of the area [19]. Va-ried proportion of sand, silt and clay with lesser amount of coarse sand compose the litho-stratrigraphic units of this area [20]. Land-use pattern in the river basin is highly distributed among agriculture, livestock, pasture, fish farms, dairies, poultry industries, housing, industrial and commercial activities. Extensive agri- cultural practices in the river basin area put runoff from disperse sources into the river. Brick manufacturing, paper packaging and food processing industries

Md. M. Islam et al.
4
Figure 1. Location and the sampling stations of the study area.
Md. M. Islam et al.
5
delineate the major point source pollution sources along the river sides through their direct discharge of untreated effluents into the river. Wastewater produced from households and commercial sites is also discharged directly and through its connecting channels into the river as no proper wastewater and sewage system is built in the area. Diurnal average change in the water level is about 2.5 m due to tidal effects in the river but the connected channel observes no or very less tidal cycle because of the regulator built on it. Beside agriculture, the channel also receives heavy pollution loads from the commercial area, household sewage dis-posals and small industries built along both banks of it. The coupling effect of the municipal activities and extreme coastal climate controls the river and its connected channel hydrology and this is influenced by the seasonality as well.
2.2. Sampling Methods
Water sampling sites were selected from 11 locations of the river and its con-nected channel based on the typical land use pattern and discharge points in the river. The sampling of river water was accomplished in each high tide and its corresponding low tidal periods at the same sampling station. River water sam-ples were collected from the midstream of the sampling station of the river and its adjacent channels using engine boat following the standard method [21]. Samples were collected separately for cations and anions in two 500 ml polye-thylene plastic bottles. Before collection, the sampling bottles were cleaned with metal free soap, rinsed well with distilled water, then soaked into 10% nitric acid for 24 h and finally rinsed with deionized water. Water samples were collected at a depth 30 cm from the surface of the river water after washing the sampling bottles for three times with sampling site water. After collection, samples for ca-tionic analysis were acidified with HCl to pH ~ 2 while the bottles with anionic sample analysis were kept unacidified.
Then, sample bottles were sealed well to avoid aeration, stored in insulated ice container and delivered to laboratory on the same day to keep it at 4˚C before starting of analysis [21] [22]. The sampling was conducted for three times from each sampling locations in the three consecutive agricultural seasons namely— pre-monsoon (May, 2014), monsoon (August, 2014) and post-monsoon (Octo-ber, 2014) following the above motioned sampling procedure. Considering the tidal variation, from each sampling location two samples were collected. There-fore, each individual sampling was consisted of 22 samples and total number of samples were 66 (22 × 3). The names and numbers of eleven sampling stations with typical scenario and sample ID are listed in Table 1.
2.3. Analytical Methods
Prior to on-site measurement, sampling devices and beakers were rinsed twice with the water of respective sampling sites. pH, Dissolved Oxygen (DO), Total Dissolved Solid (TDS), and Electrical Conductivity (EC) were measured imme-diately after collecting the samples by using a portable pH meter, DO meter (HACH sensION156 portable) and EC/TDS meter (HANNA H1-9635) after

Md. M. Islam et al.
6
Table 1. Location and salient features of the sampling site.
St. No. Sampling locations River system Features of the stations Longitude (N) Latitude (E)
01. Mixing point River Agriculture, Commercial, Fish farm 89˚31'18.6" 22˚44'30.9"
02. Batiaghata Bridge River Agriculture, Fish farm, Household 89˚30'38.6" 22˚44'55.9"
03. Bodnakandi River Agriculture, Fish farm 89˚30'22.8" 22˚44'13.4"
04. Hatbati River Agriculture, Brick field 89˚30'22.8" 22˚44'39.9"
05. Mondirtola River Agriculture, Grave yard, Fish farm 89˚30'20.3" 22˚44'04.6"
06 Tiabunia River Agriculture, Fish farm 89˚29'53.5" 22˚44'04.8"
07. Chokshailmari River Agriculture, Food Industry 89˚28'41.1" 22˚46'10.7"
08. Koyaghat Channel Household, Agriculture, Brick field 89˚28'15.6" 22˚46'08.6"
09 Regulator Channel Household, Agriculture, Brick field 89˚28'38.8" 22˚46'47.2"
10 Koya Bazar Channel Household, Commercial, Industries 89˚28'43.9" 22˚46'47.6"
11 Brick Field Channel Household, Agriculture, Brick field 89˚28'31.9" 22˚46'23.8"
Source: Field survey, 2014.
calibration in field [21]. Major cations (Na+, K+, Ca2+, Mg2+) and major anions ( 3HCO− , Cl−, 3NO− , 2
4SO − and 34PO − ) were analysed following the standard
guidelines and procedures of Standard Methods [21] [23]. Sodium (Na+) and potassium (K+) were measured using GENWAY flame photometer (Model No. PEP 7 and PEP 7/C). Calcium (Ca2+), magnesium (Mg2+) and Chloride (Cl−) were determined titrimetrically while concentration of bicarbonate ( 3HCO− ) was determined by potentiometric titration method using hydrochloric acid on the sampling day. UV-visible spectrophotometer was used for analyses of Sulphate ( 2
4SO − ), ortho-phosphate ( 34PO − ) and Nitrate ( 3NO− ) in the water samples [21].
Data quality of the analytical measurement was ensured through careful stan-dardization, procedural blank measurements, spiked and duplicate samples [24]. The precision of the analysis was checked by calculating the ionic balance errors and was eventually found within ±5% [25].
2.4. Data Treatment
Statistical methods are useful analytical methods to interpret and assess the quality of the surface water from the large environmental datasets and help to appoint the significant factors (anthropogenic and natural) that control the wa-ter quality of the river linked to seasonal variability [13] [26]. The Shapiro-Wilk (W) statistics were applied first to test the normal distribution of datasets of all seasons [4]. The test appeared that most of the water quality variables (parame-ters) were not normally distributed. Therefore, the non-parametric Kruskal- Wallis test was performed to analyse the significant spatial and temporal differ-ences (p < 0.05). Spearman’s rank correlation coefficient, as a non-parametric measure of correlation between the variables of a non-normally distributed da-tasets, was used to measure the correlation coefficient between the variables [27]. Principle component analysis (PCA) and factor analysis (FA) were performed on

Md. M. Islam et al.
7
normalized datasets to avoid misclassification which may arise because of the wide differences in data dimensionality [5] [13] [28]. Statistical packages Mini-tab 16, PAST 8.0 and Microsoft Office Excel 2013 were used for the statistical analysis of the datasets.
2.4.1. Principal Component Analysis Principal component analysis is a multivariate statistical tool that helps extract-ing the information on the most meaningful latent parameters from a complex dataset through data reduction with a minimal information loss on original in-formation [10]. It is a pattern analysing technique that transforms the variables of the original dataset into new, uncorrelated variables (axes) and describes as the principal component (PCs). These PCs shows linear combination with the original variables and the new axes lie along the directions of maximum variance [4]. Eigenvalue is a measure of the finding of significant principal components in PCA where values of 1.0 or >1.0 are considered as significant. Scree plots are used for different datasets to identify the number of PCs to be extracted from the set of PCs in order to explain the underlying datasets [29]. Component loading shows the extent of the original variable in the form of PC-coefficient into the different PCs. This explains the relative importance of a particular variable (pa-rameter) as compared to other variable in a PC without reflecting the impor-tance of the component itself [17]. The principal component (PC) is expressed as Equation (1):
1 1 2 2 ij i j i j im mjz pc x pc x pc x= + + + (1)
where z is the component score, pc is the component loading, x is the measured value of the variable, i is the component number, j is the sample number and m is the total number of variables.
2.4.2. Factor Analysis Factor Analysis (FA) is performed based on PCA. PCA helped to determine the number and possible combination of the parameters in each PCs but was ambi-guous to distinguish the particular factors controlling the quality of the water in three different seasons. Therefore, varimax rotated FA was applied on the PCs to identify the factors that control the characteristic nature of the water in each sampling season by reducing the contribution of less significant parameters ob-tained from PCA [5]. Vega et al. [13] mentioned that a rotation of PCs can attain a simpler but more identical meaningful representation of the observed factors by decreasing the contribution to PCs of variables with lesser significance and increasing the more significant ones. A factor may include unobservable, latent, hypothetical variables which enable detecting variation between water quality variables and help further interpreting the data [4] [10] [30]. In principal, each extracted factor is preventative of each of the sources affecting water quality of the samples [31]. The principle of FA can be expressed as Equation (2):
1 1 2 2 ji f i f i fm mi fiz a f a f a f e= + + + + (2)
where z is the measured value of a variable, a the factor loading, f the factor

Md. M. Islam et al.
8
score, e the errors or other sources of variation (residuals), i the sample number, j the variable number, and m the total number of factors.
3. Results and Discussion 3.1. General Hydro-Chemical Pattern
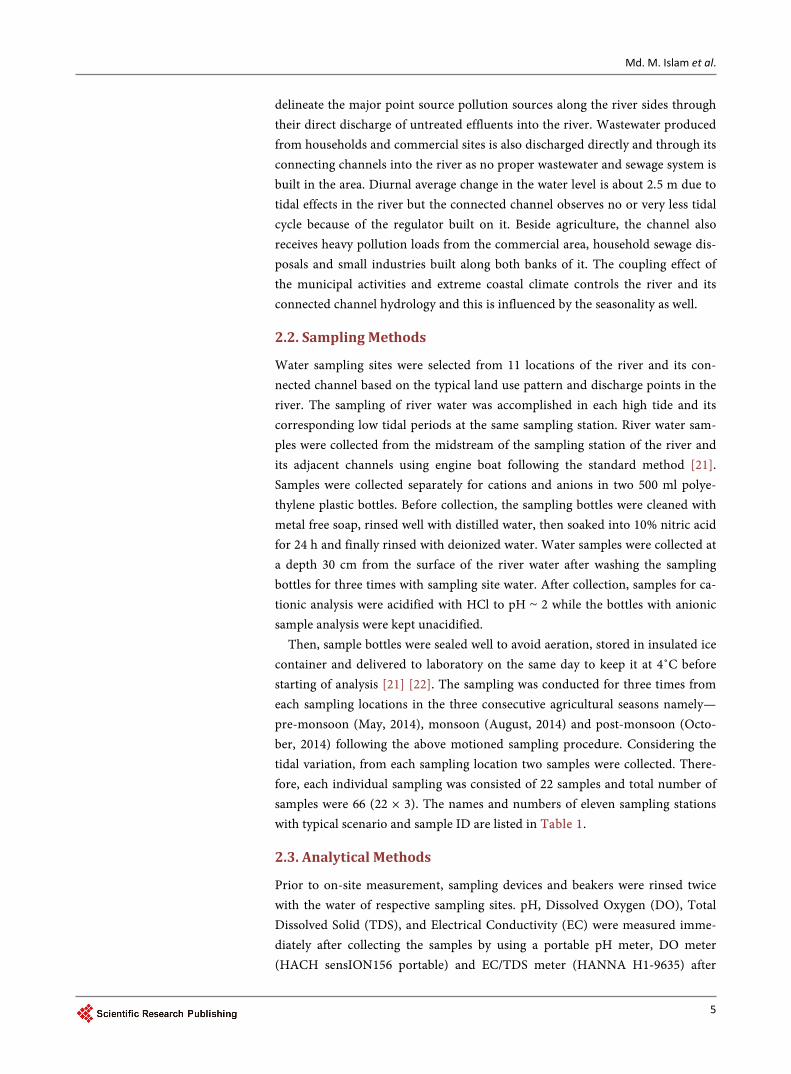
Temporal variations of the 14 water quality parameters were illustrated by box- and-whisker plots and presented in Figure 2. Large whiskers and outliers indi-cate the wide variation in elemental concentration of each parameter which might significantly affect the mean concentrations of the individual parameters due to extreme low or high values. Therefore, median was used to indicate the central tendency of the dataset in the diagram [32]. Kruskal-Wallis test was per-formed to estimate the temporal variability of water quality parameters in the river [33]. The water samples of the three different sampling seasons, namely pre-monsoon, monsoon and post-monsoon of eleven sampling stations on the study river and its connected channel showed significant (p < 0.01) variation in their physical properties and chemical compositions. Significant variation be-tween the two tidal periods were also observed for Na+, Ca2+, K+, 3
4PO − , Cl−, EC and TDS in pre-monsoon. However, the diurnal tidal variations were not found significant during the monsoon and post-monsoon. Maximum concentrations of most of the parameters without pH, DO and 3
4PO − were observed in pre- monsoon while these were highest during the monsoon. Minimum concentra-tions were observed in monsoon for 3HCO− , 2
4SO − , 34PO − , Cl−, EC and TDS
while K+, Ca2+, Mg2+, 3NO− and DO were found lowest in post-monsoon. No prominent variation was observed in the sequential order of the cations and anions following the tidal cycle in the river. In relation to spatial distribution, the regulated channel of the river showed higher concentrations in all physico- chemical parameters in monsoon and post-monsoon over the water chemistry of the main river which were might be reasons of the outskirts and the wide inter- quartile ranges of the box-plot diagrams (Figure 2).
3.2. Seasonal Correlation of Water Quality Parameters
Spearman’s rank correlation was performed to find the associations among the parameters in each sampling season (Tables 2-4). Results of the correlation ma-trices show that EC had a strong, positive correlation with salinity (r > 0.90) through all sampling seasons. Moderately strong correlation between EC and Na+, Ca2+, Mg2+ and 3
4PO − were observed during the pre-monsoon. In mon-soon, strong associations were observed between EC and Na+, K+, 3HCO− and Cl− while Mg2+ and 2
4SO − were moderately correlated with EC. Significant (p < 0.05) strong correlations were observed between EC and salinity, K+, Mg2+,
24SO − and Cl− in post-monsoon while Na+, Ca2+, 3HCO− and 3
4PO − showed moderate correlation with EC in this season. These moderate to strong associa-tions of the ions with EC indicate that EC is significantly contributed by these ions and affected by the tidal mixing of high saline water in dry summer and by the dilution of the water by wet summer or monsoon precipitation [28] [34]. DO

Md. M. Islam et al.
9
showed moderate to strong, negative correlations with salinity, Na+, Mg2+, Ca2+ and Cl− in pre-monsoon (r= −0.54 to −0.74). In monsoon, significant negative (r = −0.53 to −0.83) correlations were observed between DO and salinity, Na+, K+, Mg2+, Ca2+, 3HCO− , 2
4SO − and Cl− which sustained through post-monsoon along with 3
4PO − (r = −0.58 to −0.84) indicating an anti-correlation with the
Md. M. Islam et al.
10
Figure 2. Temporal variation of water quality parameters in three sampling seasons in the Shailmari River and its channel where HT = High Tide and LT = Low Tide. Table 2. Correlation coefficients and respective probability values of the analyzed parameters in pre-monsoon.
EC DO pH Salinity Na⁺ K⁺ Ca2+ Mg2+ 3HCO− 3NO− 34PO − 2
4SO − Cl−
EC 0.00 0.00 0.00 0.00 0.02 0.00 0.00 0.37 0.00 0.00 0.13 0.00
DO −0.70 0.05 0.00 0.00 0.12 0.00 0.01 0.57 0.02 0.06 0.80 0.00
pH −0.63 0.43 0.00 0.07 0.31 0.00 0.15 0.54 0.01 0.09 0.16 0.06
Salinity 0.96 −0.68 −0.61 0.00 0.03 0.00 0.00 0.32 0.00 0.00 0.19 0.00
Na⁺ 0.61 −0.66 −0.39 0.63 0.00 0.00 0.09 0.47 0.03 0.00 0.68 0.00
K⁺ 0.51 −0.34 −0.23 0.47 0.71 0.00 0.38 0.90 0.11 0.00 0.86 0.05
Ca2+ 0.65 −0.70 −0.61 0.62 0.62 0.61 0.12 0.24 0.04 0.02 0.62 0.00
Mg2+ 0.70 −0.54 −0.32 0.71 0.37 0.20 0.34 0.75 0.00 0.06 0.43 0.06
3HCO− 0.20 0.13 −0.14 0.22 0.16 0.03 −0.26 0.07 0.19 0.59 0.09 0.30
3NO− −0.81 0.50 0.55 −0.80 −0.47 −0.35 −0.45 −0.78 −0.29 0.03 0.05 0.06 34PO − 0.65 −0.41 −0.37 0.64 0.70 0.80 0.50 0.41 0.12 −0.48 0.73 0.01 24SO − 0.33 −0.06 −0.31 0.29 0.09 0.04 0.11 0.18 0.37 −0.43 0.08 0.33
Cl− 0.58 −0.74 −0.41 0.65 0.74 0.42 0.65 0.41 −0.23 −0.41 0.55 −0.22
Note: Lower left triangle r-values for Spearmen's rank correlation, upper right triangle probability (p) values.

Md. M. Islam et al.
11
Table 3. Correlation coefficients and respective probability values of the analyzed parameters in monsoon.
EC DO pH Salinity Na⁺ K⁺ Ca2+ Mg2+ 3HCO− 3NO− 34PO − 2
4SO − Cl−
EC 1.00 0.00 0.94 0.00 0.00 0.00 0.01 0.00 0.00 0.14 0.18 0.00 0.00
DO −0.77 0.97 0.00 0.00 0.00 0.01 0.01 0.00 0.12 0.17 0.00 0.00
pH −0.02 0.01 0.92 0.95 0.46 0.02 0.85 0.52 0.34 0.00 0.57 0.72
Salinity 0.92 −0.83 0.02 0.00 0.00 0.00 0.00 0.00 0.23 0.17 0.00 0.00
Na⁺ 0.93 −0.83 −0.02 0.90 0.00 0.00 0.00 0.00 0.03 0.20 0.00 0.00
K⁺ 0.83 −0.70 −0.17 0.83 0.85 0.04 0.00 0.00 0.14 0.44 0.00 0.00
Ca2+ 0.54 −0.53 0.49 0.65 0.60 0.44 0.01 0.00 0.44 0.00 0.00 0.02
Mg2+ 0.72 −0.56 0.04 0.80 0.75 0.80 0.57 0.00 0.14 0.17 0.00 0.00
3HCO− 0.85 −0.73 0.14 0.82 0.84 0.80 0.67 0.68 0.36 0.12 0.00 0.00
3NO− 0.33 −0.34 −0.21 0.27 0.46 0.33 0.17 0.33 0.20 0.74 0.13 0.19 34PO − 0.30 −0.30 0.63 0.30 0.29 0.17 0.75 0.30 0.34 0.08 0.02 0.34
24SO − 0.66 −0.72 0.13 0.79 0.70 0.72 0.78 0.70 0.70 0.33 0.51 0.00
Cl− 0.84 −0.70 −0.08 0.84 0.88 0.92 0.50 0.82 0.79 0.29 0.21 0.62
Note: Lower left triangle r-values for Spearmen’s rank correlation, upper right triangle probability (p) values.
Table 4. Correlation coefficients and respective probability values of the analyzed parameters in post-monsoon.
EC DO pH Salinity Na⁺ K⁺ Ca2+ Mg2+ 3HCO− 3NO− 34PO − 2
4SO − Cl−
EC 0.00 0.73 0.00 0.00 0.00 0.00 0.00 0.00 0.47 0.00 0.00 0.00
DO −0.82 0.62 0.00 0.00 0.00 0.00 0.00 0.00 0.50 0.00 0.00 0.00
pH 0.08 0.11 0.68 0.85 0.71 0.22 0.68 0.61 0.06 0.58 0.59 0.29
Salinity 0.97 −0.84 0.09 0.00 0.00 0.00 0.00 0.00 0.28 0.00 0.00 0.00
Na⁺ 0.69 −0.79 0.04 0.70 0.00 0.01 0.00 0.00 0.15 0.02 0.00 0.00
K⁺ 0.89 −0.76 0.08 0.90 0.73 0.00 0.00 0.00 0.15 0.00 0.00 0.00
Ca2+ 0.74 −0.59 0.27 0.74 0.52 0.69 0.02 0.00 0.17 0.00 0.00 0.00
Mg2+ 0.81 −0.82 0.09 0.82 0.87 0.83 0.50 0.00 0.21 0.01 0.00 0.00
3HCO− 0.63 −0.65 0.11 0.70 0.72 0.63 0.80 0.64 0.11 0.00 0.00 0.00
3NO− 0.16 −0.15 0.41 0.24 0.32 0.31 0.31 0.28 0.35 0.71 0.46 0.13
34PO − 0.65 −0.58 0.12 0.65 0.48 0.62 0.75 0.55 0.61 0.09 0.01 0.00 24SO − 0.86 −0.81 0.12 0.87 0.81 0.88 0.66 0.79 0.63 0.16 0.54 0.00
Cl− 0.81 −0.76 0.24 0.81 0.79 0.77 0.72 0.84 0.77 0.33 0.73 0.78
Note: Lower left triangle r-values for Spearmen’s rank correlation, upper right triangle probability (p) values.
parameters which is may be an indication of continuous pollution source acting on the water quality of the river through all seasons. Na+ was moderately corre-lated (r = 0.62 to 0.74) with K+, Ca2+, 3
4PO − and Cl− in pre-monsoon. Strong correlation (r = 0.84 to 0.88) was observed between Na+ and K+, Cl− and 3HCO− in monsoon, whereas, Ca2+, Mg2+ and 2
4SO − showed a moderately strong cor-relation (r = 0.60 to 0.75) with Na+.

Md. M. Islam et al.
12
Moderate to strong associations (r = 0.52 to 0.87) were observed between the similar alkali earth metals and other ions ( 2
4SO − , Cl− and 3HCO− ) in the post- monsoon. These associations in the respective seasons reveal that monsoon pre-cipitation and subsequent chemical weathering processes might have an influ-ence on the solute loads in the river and its associated channel while tidal cycle bring additional ions into the river during the high tides [34] [35]. However, in the three different sampling seasons it was observed that there exist a similarity in the correlation of Na+ and Cl−. The strong correlation between Na+ and Cl− might indicate that the ions are derived from the same natural or anthropogenic source into this river all over the sampling seasons [36]. Among other ions, K+ showed moderate correlation with Ca2+ in pre-monsoon and post-monsoon. The association of K+ with 3
4PO − was strong in pre-monsoon while it was strong with Ca2+, Mg2+ and Cl− in monsoon and Mg2+, 2
4SO − and Cl− in post- monsoon. Ca2+ showed significant (p < 0.01) correlation with 2
4SO − and 34PO −
in monsoon and post-monsoon. The moderate to high correlation among the parameters indicate that the ions in the river system may have derived from Carbonate or Silicate weathering of carbonates and carbonates minerals or or-ganic minerals [35] while the association of 2
4SO − and 34PO − with Cl− in post-
monsoon can be explained by the relevant higher concentration of the ions in the respective season which can be attributed to the anthropogenic sources like agricultural fields, shrimp farming or brick building industries near the river banks and their subsequent run-offs into the river system.
3.3. Seasonal and Spatial Variation of Water Quality Parameter
PCA was applied on the datasets of three different seasons to compare the sea-sonal composition of the river water and to find the influencing factor for each season that dominates the water quality in the river and its associated channel. Scree plots of the three different seasons show pronounced change in the slope after the 3rd eigenvalue for pre-monsoon and 2nd eigenvalue for monsoon and post-monsoon and all of the PCs up to and including the first one after the break were extracted so that significant information could be explained by the va-riances in the underlying dataset (Figure A1) [13] [37]. Therefore, the first four PCs in pre-monsoon and three PCs for monsoon and post-monsoon were con-sidered in the present study that could be used for further interpretations. These PCs with eigenvalue greater or close to 1 explained about 99.84%, 99.99% and 99.96% of the total variances in the water-quality datasets for pre-monsoon, monsoon and post-monsoon respectively. The component loadings of the first two retained principal components for each season are presented in Figures 3-5.
In pre-monsoon, the principal component 1 (PC1) explains 50.7% of the total variance and is characterised positively contributed by physical parameters of EC, TDS, Salinity and dissolved inorganic ions of Na+, Cl− and 3
4PO − at the positive side of the axis whereas DO, pH and inorganic nutrient 3NO− nega-tively affect this component. Therefore, it can be assumed that this component reflects the contribution of high ionic loads with high salinity over physical

Md. M. Islam et al.
13
Figure 3. Component loadings for first (PC1) and the second components (PC2) in pre-monsoon. parameters (DO, pH) and inorganic nutrient ( 3NO− ) on the water quality of the river in this season. The lesser loading coefficients of 3HCO− and 2
4SO − also indicate that they have poor influence on the water quality of the river in this season. PC2 explains 15.08% of the total variance of the datasets. It is positively affected by 3HCO− , 2
4SO − and DO and negatively by Ca2+, Cl− and 3NO− . This component is indicative of weathering or natural erosional deposits into the riv-er over the industrial or anthropogenic influences on the quality of the river wa-ter in pre-monsoon [35].
The PC1 in monsoon explains 76.44% of the total variance and is largely and positively characterized by most of the physical and chemical parameters (EC, TDS, salinity, Na+, K+, Ca2+, Mg2+, Cl−, 3HCO− , 3
4PO − , 24SO − ) whereas DO af-
fects the component negatively (Figure 4). The association of different water quality parameters in PC1 of the monsoon varied largely from that of the com-bination of the parameters in PC1 of the pre-monsoon. This indicates that most of the parameters in this season are deriving from the same sources and thus controlling the water quality of the river which is distinguishable from the pre-monsoon as well. PC2 explains 10.08% of the total variance in this season

Md. M. Islam et al.
14
Figure 4. Component loadings for the first (PC1) and second components (PC2) in monsoon. and is positively and largely attributed by DO, pH and 3
4PO − and negatively af-fected by 3NO− which might reflect that the impact was associated with mostly agricultural runoffs over domestic discharges into the river.
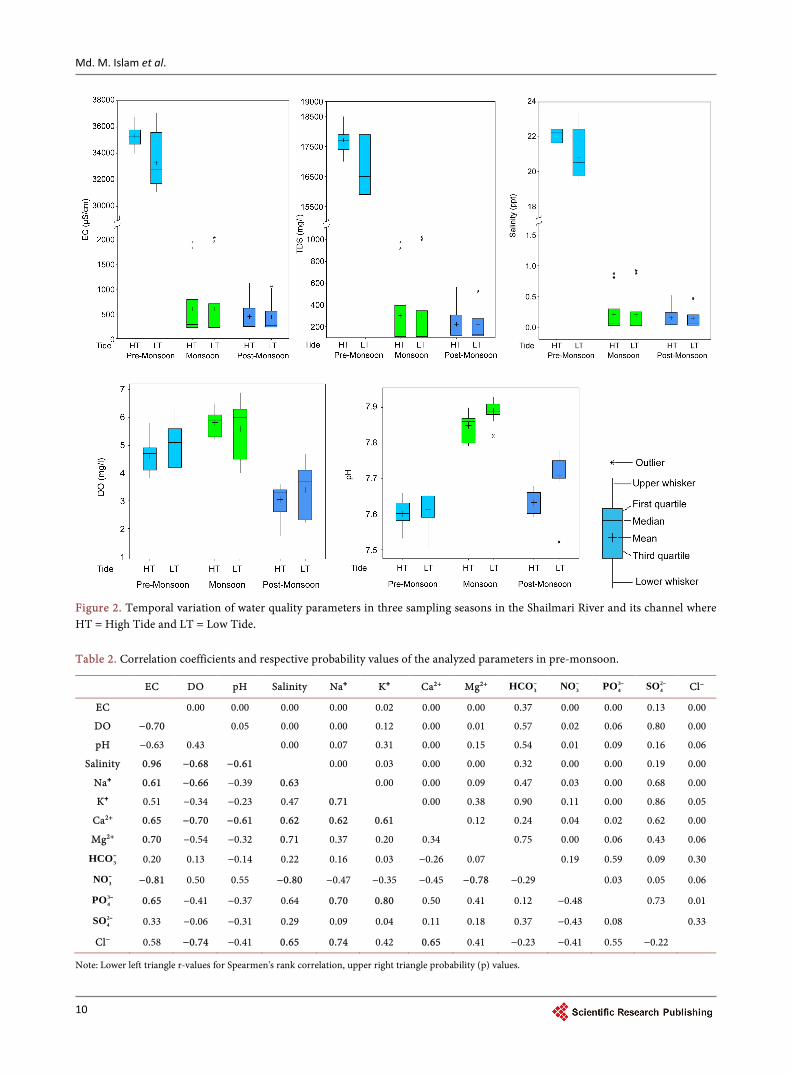
In post-monsoon, PC1 shows a similar pattern of component loadings com-pared to the monsoon (Figure 5). PC1 explains 76.92% of total variance and is positively contributed by most of the physico-chemical parameters (EC, TDS, salinity, Na+, K+, Ca2+, Mg2+, 3HCO− , 3
4PO − , 24SO − , Cl−) while DO contributes
the component negatively. PC2 explains 10.20% of the total variance and is op-positely loaded to that of the monsoon by contributing parameters showing a seasonal variation from monsoon. This component is positively and largely dominated by the pH and domestic inputs ( 3NO− ) and is negatively contributed by the agricultural input ( 3
4PO − ) in post-monsoon. The river exhibited distinct tidal fluctuation and the spatial variability in dif-
ferent sampling seasons. Scatter plots of the extracted PCs from the PCA show
Md. M. Islam et al.
15
Figure 5. Component loadings for the first (PC1) and second components (PC2) in post- monsoon. clustering and relationship among the variables defining the sample characteris-tics in each season. Figure 6 shows that in pre-monsoon, low tidal water samples were characterized by high load of 3NO− , pH and DO whereas high tidal water showed strong loading of EC, TDS, salinity, Na+, Ca2+, Cl−, 3
4PO − . Interestingly, the scatter plot also identifies the spatial differences in the river system by de-marking samples of the cut-off channel from those of the river in different group (S8HT-S11HT; S8LT, S9LT and S11LT) which lacks tidal variability. This group showed high load of all parameters without pH, DO and 3NO− which reflects the influence of anthropogenic pollution on surface water as it receives direct discharge and runoff from the surrounding industries, commercial sites and agricultural fields in this season.
In monsoon, though the samples showed very low loadings of all major phy-sico-chemical parameters, the tidal variation was still prominent in the scatter plot (Figure 7). From the diagram it was observed that low tide water samples (except S7LT-S9LT) were characterized by high load of DO while most of the high tide water samples were highly loaded with 3NO− . Exception such as

Md. M. Islam et al.
16
Figure 6. The loadings of variables and scores of the sampling stations (LT = Low tide; HT = High tide) for the first two PCs in pre-monsoon.
Figure 7. The loadings of variables and scores of the sampling stations (LT = Low tide; HT = High tide) for the first two PCs in monsoon.
samples S1HT and S2HT might be due to the shorter time gap during sampling between the tidal periods. However, spatial difference between the water samples of river and controlled-channel was marked by the higher load of EC, TDS, sa-linity, pH and other major cations-anions in the channel than in the river water.
A similar pattern of tidal distribution was observed in post-monsoon where low tide water samples showed high loading on DO (Figure 8). Without show-ing tidal variation, in post-monsoon, the channel and the river water samples

Md. M. Islam et al.
17
Figure 8. The loadings of variables and scores of the sampling stations (LT = Low tide; HT = High tide) for the first two PCs in post-monsoon.
showed distinguishable characteristics that could define the spatial variation between these water sources as similar to other seasons where the samples showed high load of the studied parameters without only DO.
3.4. Identification of the Important Seasonal Water Quality Parameter
All 14 physico-chemical variables (parameters) were used for factor analysis in this study. Corresponding factors, eigenvalues, variable loadings and explained variance are incorporated in Tables 5-7. Factors with eigenvalues close to 1 were extracted and more than 1 were explained only as they contain the most signifi-cant information. The factor loadings were classified following the guidelines of Liu et al., [28] marking the absolute loading values of >0.75 as “strong”, (0.75 - 0.50) as “moderate” and (0.50 - 0.40) as “weak”.
The consecutive five factors explain about 89% of the total variance, which is sufficient to interpret the data structure in pre-monsoon (Table 5). Factor 1, which explained 30.4% of the total variance, has strong (>0.75) positive loadings on EC, TDS, salinity and Mg2+ and a strong negative loading on 3NO− . Heavy ionic load with high salinity might be indicative of influence of sea water en-croachment while agricultural runoff and domestic sewage disposal might com-prehend the high nitrate load in the river during this season. Reduced freshwater inflow from upstream enables upward movement of seawater from the south and causes to increase the river water salinity in pre-monsoon [14] [15] [38]. The Effluent condition of the river might led to receive nitrate also from the aquifers into the river by groundwater leaching [4]. Therefore, this factor could be interpreted as the mixed effect of “salinity-anthropogenic input” factor.
Factor 2 explaining 21.9% of the total variance has strong positive loadings on

Md. M. Islam et al.
18
Table 5. Varimax rotated factor loadings and communalities of water variables in pre-monsoon.
Variable Factor 1 Factor 2 Factor 3 Factor 4 Factor 5 Communality
EC 0.783 0.370 −0.376 0.134 −0.204 0.950
TDS 0.747 0.439 −0.339 0.139 −0.234 0.940
DO −0.597 −0.709 −0.079 −0.141 −0.107 0.896
pH −0.430 −0.226 0.082 −0.220 0.801 0.933
Salinity 0.779 0.358 −0.367 0.111 −0.257 0.949
Na⁺ 0.410 0.652 −0.491 0.054 0.026 0.838
K⁺ 0.236 0.374 −0.787 −0.039 0.192 0.853
Ca2+ −0.130 0.895 −0.055 −0.091 −0.197 0.868
Mg2+ 0.863 −0.091 0.036 −0.284 0.012 0.836
3HCO− −0.077 −0.295 −0.733 0.173 −0.450 0.863
3NO− −0.801 −0.082 0.323 −0.268 0.187 0.859
34PO − 0.322 0.101 −0.856 0.062 −0.114 0.864
24SO − 0.069 −0.127 −0.091 0.947 −0.159 0.951
Cl− 0.434 0.750 −0.131 −0.306 −0.038 0.863
Eigenvalue 7.01 2.21 1.46 1.13 0.65
Variance 4.2495 3.0682 2.6694 1.3069 1.1684 12.4623
% Var 0.304 0.219 0.191 0.093 0.083 0.890
Table 6. Varimax rotated factor loadings and communalities of water variables in monsoon.
Variable Factor 1 Factor 2 Factor 3 Communality
EC 0.982 0.141 −0.109 0.996
TDS 0.982 0.140 −0.110 0.995
DO −0.529 −0.638 −0.063 0.690
pH 0.163 −0.069 −0.969 0.971
Salinity 0.982 0.136 −0.110 0.995
Na⁺ 0.959 0.130 −0.096 0.947
K⁺ 0.983 0.128 −0.091 0.991
Ca2+ 0.964 0.119 −0.174 0.973
Mg2+ 0.982 0.096 −0.071 0.978
3HCO− 0.971 0.132 −0.052 0.963
3NO− −0.026 0.928 0.047 0.864 34PO − 0.740 −0.070 −0.346 0.672
24SO − 0.866 0.393 −0.161 0.931
Cl− 0.979 0.105 −0.106 0.981
Eigenvalue 10.70 1.41 0.83
Variance 10.177 1.575 1.194 12.946
% Var 0.727 0.112 0.085 0.925

Md. M. Islam et al.
19
Table 7. Varimax rotated factor loadings and communalities of water variables in post-monsoon.
Variable Factor 1 Factor 2 Factor 3 Communality
EC 0.987 −0.091 0.027 0.984
TDS 0.987 −0.091 0.027 0.984
DO −0.844 −0.303 0.202 0.846
pH 0.118 −0.920 −0.271 0.934
Salinity 0.987 −0.086 0.025 0.981
Na⁺ 0.949 −0.055 −0.138 0.922
K⁺ 0.990 −0.081 −0.007 0.986
Ca2+ 0.929 −0.177 0.043 0.896
Mg2+ 0.971 −0.025 0.023 0.943
3HCO− 0.954 −0.030 −0.019 0.912
3NO− 0.007 −0.251 −0.918 0.906
34PO − 0.840 −0.135 0.249 0.786 24SO − 0.891 −0.011 −0.186 0.829
Cl− 0.984 −0.096 −0.050 0.980
Eigenvalue 10.77 1.43 0.69
Variance 10.713 1.095 1.080 12.888
% Var 0.765 0.078 0.077 0.921
Ca2+ and Cl− with moderate loading on Na+ which might be indicative of natural weathering processes and cation-exchange processes at subsurface with input of salt (NaCl) containing domestic and industrial sewage discharges into the river [22] [30] [35]. Moderate negative loading of DO indicates the effect of organic pollution load in the river which gets oxidized at the expense of oxygen and thus get DO decreased in its concentration in the river [22] [39]. Therefore, this fac-tor could be termed as the “weathering-oxidization” related factor.
Factor 3 explains 19.1% of the total variance and has a strong negative loading on 3
4PO − and K+ and a moderate loading on 3HCO− . Farmers use phosphate and potassium containing fertilizers and manures in the agricultural field along the river while bicarbonate might be leached from the fish farms, food pro- cessing industries or domestic waste into the river. This factor, therefore, could be referred as “agricultural runoff” factor.
Factor 4, which explains only 9.3% of the total variance, is strongly loaded with 2
4SO − and might be representative of the effect of coal burnt brick indus-tries along the river. This factor could be termed as “point-source pollution” factor.
In monsoon, the first two factors describe 83.9% of the total variance while Factor 1 only explains 72.7% of the total variance (Table 6). This factor is highly participated by most of the physico-chemical parameters containing EC, TDS, salinity, Na+, K+, Ca2+, Mg2+, Cl−, 3HCO− , 2
4SO − along with moderate loading

Md. M. Islam et al.
20
on 34PO − which might indicate the common source of these minerals during
this season. The heavy monsoonal precipitation and overland flooding induced weathering, mostly carbonate weathering, control the hydrochemistry of the river systems in this region [35]. Besides, precipitation poses a dilution effect on the ionic composition of the water that causes to reduce the EC and TDS values of the water during this season [22] [34]. Moderate load of phosphate is an indi-cation of the presence of predominant anthropogenic pollution which could be interpreted as the influence of fertilizer run-off, sewage disposal or industrial ef-fluents of the food processing and other industries on the water quality parame-ters of the river [13] [40]. Therefore, this factor could be termed as “monsoon precipitation-surface runoff” factor.
Factor 2 explains 11.2% of the total variance and has a strong positive loading on 3NO− and moderate negative loading on DO. Intensive agricultural applica-tion (use of Nitrogen fertilizers and manure) is practiced in this season along the riversides. Strong loading of nitrate in monsoon could be explained as the con-tribution of diffusive pollution from agricultural runoff, sanitary leaching or point source pollution of sewage disposal and industrial effluents [4] [34]. Sur-face runoff and sewage disposal supplies more organic load into the river which consumes the DO and get oxidized during the oxidation process [5]. Thus, this factor represented the influence of “diffuse source pollution” during the mon-soon season.
Among the three extracted factors, Factor 1 in post-monsoon comprises 76.5% of the total variance with strong positive loading on EC, TDS, salinity, Na+, K+, Ca2+, Mg2+, Cl−, 3HCO− , 3
4PO − and 24SO − (Table 7). The erosion of
the alluvial sediment and the overbank tidal deltaic deposits of monsoon by the tidal water and rainfall in post-monsoon might explain the source of these ions in this season [20] [35] [41]. Strong negative loading of DO might be because of the consumption of oxygen by the organic pollutants coming with erosional products, run-off from the agricultural and peri-urban land areas and sewage disposals from the domestic and industrial sites [34]. Therefore, this factor could be termed as the “erosion-oxidation related” factor during this season. Factor 2 explains 7.8% of the total variance and has strong negative loading on pH. The river receives a load of organic pollutants from the number of fish farms, food processing, paper packaging and coal-burnt brick manufacturing industries. This produces ammonia and other organic acids undergoing sequential oxida-tion and anaerobic fermentation reactions. Hydrolysis of these acids might lead to decrease the pH of the water in the river and, hence, this could be described as the “organic pollution” factor [13] [40]
The results indicate that the river shows a temporal variation in terms of tidal cycles and seasons. Collectively, from the scatter diagram of the three sampling seasons, prominent temporal variation was observed among the seasons which are statistically significant (p < 0.05) in their varied composition (Figure 9). Spatially, water quality of the regulated channel differs from the composition of the main river water with higher load of the water quality parameters. Water

Md. M. Islam et al.
21
Figure 9. The loadings of variables and scores of the samples for the first two PCs showing the seasonal grouping of the samples.
quality of the river and the connected channel was highly saline with additional load of pollutant/nutrient ions ( 3NO− , 3
4PO − and 24SO − ) in pre-monsoon.
Pollution occurred mainly from point sources associated with fish farming, do-mestic and commercial sewages, packaging industries and brick manufacturing industries. Water quality problem gets more diffusive in monsoon because of agricultural non-point source pollution ( 3NO− , 3
4PO − pollution) in the mon-soon period while the post-monsoon is affected by coupling effect of erosion- oxidation and organic pollution occurring from surface runoff and industrial discharges. However, monsoon and post-monsoon precipitation had a dilutive effect on the water quality of the river system in these seasons. Being the agri-cultural dominant region, crop production is at a stake because of high salinity and associated ions (Na+, Cl−) in the river water in pre-monsoon. Therefore, taking into consideration the finding of the present study, suitable management strategies should be taken to compete this situation. Reservoiring of the non- saline monsoon and post-monsoon water, establishment of municipal wastewa-ter treatment plant (WTP), monitoring of industrial discharges into the river and channel, safe storage and disposal of coal and burnt residues from the brick industries would be some possible alternatives and management measures to control the seasonal variation in water quality due to pollution in the river and its associated channel within the study area. A more detailed, long-term study would detect the absolute timing of change of salinity in the river based on sea-sonality and provide useful information for the better understanding of the wa-ter chemistry of the river system which is an urge of the study area because of its high socio-economic importance in the Khulna region.
Md. M. Islam et al.
22
4. Conclusions
In the present case study, multivariate statistical methods (PCA, FA) were used to assess the spatio-temporal variation in the water quality of the Shailmari River and its associated channel.
1) Correlation matrices of the season-parameters and Kruskal-Wallis test show significant (p < 0.01) seasonal variation in the water quality parameters among the three seasons. Most of the parameters tended to display maximum concentration in pre-monsoon while pH, DO and 3
4PO − were the highest in monsoon. Minimum concentrations were observed in monsoon ( 3HCO− , 2
4SO − , 34PO − , Cl−, salinity, EC and TDS) and post-monsoon (K+, Ca2+, Mg2+, 3NO− and
DO) while pH was lowest in pre-monsoon. 2) PCA and plotting of the PCs in scatter diagrams identify the latent para-
meters controlling the water chemistry of the river system on temporal (in terms of tides and seasons) and spatial basis. Scatter plots helped to identify the spatial differences between the river and its connected channel while higher load of all parameters was observed in the regulated channel and grouped together beyond the influence of the tidal cycle in each sampling season.
3) FA favored to extract and identify the factors responsible for the seasonal variation in the river water quality in three different seasons. Results of the FA show that salinization (EC, Mg2+, salinity), anthropogenic inputs (domestic se-wage, industrial effluents), and agricultural run-off are the potential factors for water quality variation in pre-monsoon while precipitation induced surface ru-noff, agricultural activities, organic pollution coupled with natural weathering and erosion processes are the dominating factors for the temporal changes in the water quality of the river system in monsoon and post-monsoon seasons.
4) Thus, different multivariate statistical methods are useful in this environ-mental study to analyse and interpret the water quality dataset and help to un-derstand the spatio-temporal variation by appointing the latent factors or sources responsible for such variations which are believed to be helpful for the proper management of the quality and the environmental sustainability of this river system and its associated resources.
Acknowledgements
The authors would like to thanks the University Grants Commission (UGC) of Bangladesh for providing the financial support for this research work. The au-thors also acknowledge the Environmental Science Discipline and Chemistry Discipline of Khulna University, Bangladesh for assisting during the laboratory analysis. Anonymous referee of the journal are also thanked for their comments to improve the content of the paper.
References [1] Bricker, O.P. and Jones, B.F. (1995) Main Factors Affecting the Composition of
Natural Waters. CRC Press, Boca Raton, 1-5.
[2] Carpenter, S.R., Caraco, N.F., Correll, D.L., Howarth, R.W., Sharpley, A.N. and

Md. M. Islam et al.
23
Smith, V.H. (1998) Nonpoint Pollution of Surface Waters with Phosphorus and Ni-trogen. Ecological Applications, 8, 559-568. https://doi.org/10.1890/1051-0761(1998)008[0559:NPOSWW]2.0.CO;2
[3] Jarvie, H.P., Whitton, B.A. and Neal, C. (1998) Nitrogen and Phosphorus in East Coast British Rivers: Speciation, Sources and Biological Significance. Science of the Total Environment, 210-211, 79-109. https://doi.org/10.1016/S0048-9697(98)00109-0
[4] Shrestha, S. and Kazama, F. (2007) Assessment of Surface Water Quality Using Multivariate Statistical Techniques: A Case Study of the Fuji River Basin, Japan. En-vironmental Modelling & Software, 22, 464-475. https://doi.org/10.1016/j.envsoft.2006.02.001
[5] Singh, K.P., Malik, A., Mohan, D. and Sinha, S. (2004) Multivariate Statistical Tech-niques for the Evaluation of Spatial and Temporal Variations in Water Quality of Gomti River (India)—A Case Study. Water Research, 38, 3980-3992. https://doi.org/10.1016/j.watres.2004.06.011
[6] Ayers, R.S. and Westcot, D.W. (1985) Water Quality for Agriculture. FAO Irriga-tion and Drainage Paper 29 Rev. 1., FAO, Rome.
[7] Bouksila, F., Bahri, A., Berndtsson, R., Persson, M., Rozema, J. and Van der Zee, S. (2013) Assessment of Soil Salinization Risks under Irrigation with Brackish Water in Semiarid Tunisia. Environmental and Experimental Botany, 92, 176-185. https://doi.org/10.1016/j.envexpbot.2012.06.002
[8] Chapman, D. (1992) Water Quality Assessment. Chapman & Hall, London.
[9] Dixon, W. and Chiswell, B. (1996) Review of Aquatic Monitoring Program Design. Water Research, 30, 1935-1948. https://doi.org/10.1016/0043-1354(96)00087-5
[10] Helena, B., Pardo, R., Vega, M., Barrado, E., Fernandez, J. and Fernandez, L. (2000) Temporal Evolution of Ground Water Composition in an Alluvial Aquifer (Pisuer-ga River, Spain) by Principal Component Analysis.. Water Research, 34, 807-816. https://doi.org/10.1016/S0043-1354(99)00225-0
[11] Massart, D.L., Vandeginste, B., Deming, S.N., Michotte, Y. and Kaufman, L. (1988) Chemometrics: A Textbook. Elsevier, Amsterdam.
[12] Reisenhofer, E., Adami, G. and Barbieri, P. (1998) Using Chemical and Physical Parameters to Define the Quality of Karstic Freshwaters (Timavo River, North- Eastern Italy): A Chemometric Approach. Water Research, 32, 1193-1203. https://doi.org/10.1016/S0043-1354(97)00325-4
[13] Vega, M., Pardo, R., Barrado, E. and Debán, L. (1998) Assessment of Seasonal and Polluting Effects on the Quality of River Water by Exploratory Data Analysis. Water Research, 32, 3581-3592. https://doi.org/10.1016/S0043-1354(98)00138-9
[14] Gain, A.K. and Giupponi, C. (2014) Impact of the Farakka Dam on Thresholds of the Hydrologic: Flow Regime in the Lower Ganges River Basin (Bangladesh). Water, 6, 2501-2518. https://doi.org/10.3390/w6082501
[15] Mondal, M.S., Jalal, M.R., Khan, M.S.A., Kumar, U., Rahman, R. and Huq, H. (2013) Hydro-Meteorological Trends in Southwest Coastal Bangladesh : Perspec-tives of Climate Change and Human Interventions. American Journal of Climate Change, 2, 62-70. https://doi.org/10.4236/ajcc.2013.21007
[16] Shamsuddoha, M. and Chowdhury, R.K. (2007) Climate Change Impact and Disas-ter Vunerablities in the Coastal Areas of Bangladesh. 17.
[17] Ouyang, Y., Nkedi-Kizza, P., Wu, Q.T., Shinde, D. and Huang, C.H. (2006) Assess-ment of Seasonal Variations in Surface Water Quality. Water Research, 40, 3800- 3810. https://doi.org/10.1016/j.watres.2006.08.030

Md. M. Islam et al.
24
[18] FAO (2011) Irrigation in Southern and Eastern Asia in Figures. Rome.
[19] Alam, M. (1990) Bangladesh in World Regional Geology. Columbia University Press, New York.
[20] Roy, M.K., Datta, D.K., Adhikari, D.K., Chowdhury, B.K. and Roy, P.J. (2005) Ge-ology of the Khulna City Corporation. Journal of Life and Earth Science, 1, 57-63.
[21] APHA (1999) Standard Methods for the Examination of Water and Wastewater. 541.
[22] Huang, J., Huang, Y. and Zhang, Z. (2014) Coupled Effects of Natural and Anthro-pogenic Controls on Seasonal and Spatial Variations of River Water Quality during Baseflow in a Coastal Watershed of Southeast China. PLoS ONE, 9, e91528. https://doi.org/10.1371/journal.pone.0091528
[23] Ramesh, R. and Anbu, M. (1996) Chemical Methods for Environmental Analysis: Water and Sediment. Macmillan, London.
[24] Voutsa, D., Zachariadis, G., Samara, C. and Kouimtzis, T. (1995) Evaluation of Chemical Parameters in Aliakmon River/Northern Greece. Part II: Dissolved and Particulate Heavy Metals. Journal of Environmental Science and Health Part A, 30, 1-13. https://doi.org/10.1080/10934529509376180
[25] Hounslow, A. (1995) Water Quality Data: Analysis and Interpretation. CRC Press, Boca Raton.
[26] Simeonov, V., Stratis, J.A., Samara, C., Zachariadis, G., Voutsa, D., Anthemidis, A., Sofoniou, M. and Kouimtzis, T. (2003) Assessment of the Surface Water Quality in Northern Greece. Water Research, 37, 4119-4124. https://doi.org/10.1016/S0043-1354(03)00398-1
[27] Alberto, W.D., Del Pilar, D.M., Valeria, M., Fabiana, P.S., Cecilia, H. and Los An-geles, B.M. (2001) Pattern Recognition Techniques for the Evaluation of Spatial and Temporal Variations in Water Quality. A Case Study: Suquía River Basin (Cordo-ba-Argentina). Water Research, 35, 2881-2894. https://doi.org/10.1016/S0043-1354(00)00592-3
[28] Liu, C.W., Lin, K.H. and Kuo, Y.M. (2003) Application of Factor Analysis in the Assessment of Groundwater Quality in a Blackfoot Disease Area in Taiwan. Science of the Total Environment, 313, 77-89. https://doi.org/10.1016/S0048-9697(02)00683-6
[29] Jackson, J.E. (1991) A User’s Guide to Principal Components. John Wiley & Sons, New York, 43. https://doi.org/10.1002/0471725331
[30] Varol, M., Gökot, B., Bekleyen, A. and Şen, B. (2012) Spatial and Temporal Varia-tions in Surface Water Quality of the Dam Reservoirs in the Tigris River Basin, Turkey. Catena, 92, 11-21. https://doi.org/10.1016/j.catena.2011.11.013
[31] Olmez, I., Beal, J.W. and Villaume, J.F. (1994) A New Approach to Understanding Multiple-Source Groundwater Contamination: Factor Analysis and Chemical Mass Balances. Water Research, 28, 1095-1101. https://doi.org/10.1016/0043-1354(94)90195-3
[32] Pekey, H., Karakas, D. and Bakoglu, M. (2004) Source Apportionment of Trace Metals in Surface Waters of a Polluted Stream Using Multivariate Statistical Ana-lyses. Marine Pollution Bulletin, 49, 809-818. https://doi.org/10.1016/j.marpolbul.2004.06.029
[33] Mendiguchia, C., Moreno, C. and Garcia-Vargas, M. (2007) Evaluation of Natural and Anthropogenic Influences on the Guadalquivir River (Spain) by Dissolved Heavy Metals and Nutrients. Chemosphere, 69, 1509-1517. https://doi.org/10.1016/j.chemosphere.2007.05.082

Md. M. Islam et al.
25
[34] Li, S. and Zhang, Q. (2009) Geochemistry of the Upper Han River Basin, China. 2: Seasonal Variations in Major Ion Compositions and Contribution of Precipitation Chemistry to the Dissolved Load. Journal of Hazardous Materials, 170, 605-611. https://doi.org/10.1016/j.jhazmat.2009.05.022
[35] Datta, D.K. and Subramanian, V. (1997) Nature of Solute Loads in the Rivers of the Bengal Drainage Basin, Bangladesh. Journal of Hydrology, 198, 196-208. https://doi.org/10.1016/S0022-1694(96)03294-5
[36] Hem, J.D. (1985) Study and Interpretation of the Chemical Characteristics of Natu-ral Water. US Geological Survey, Water Supply Paper 2254.
[37] Cattell, R.B. and Jaspers, J. (1967) A General Plasmode (No. 30-10-5-2) for Factor Analytic Exercises and Research. Multivariate Behavioral Research Monographs.
[38] Gain, A.K., Uddin, M.N. and Sana, P. (2008) Impact of River Salinity on Fish Diver-sity in the South-West Coastal Region of Bangladesh. International Journal of Ecology and Environmental Sciences, 34, 49-54.
[39] Kannel, P.R., Lee, S., Kanel, S.R., Khan, S.P. and Lee, Y.S. (2007) Spatial-Temporal Variation and Comparative Assessment of Water Qualities of urban River System: A Case Study of the River Bagmati (Nepal). Environmental Monitoring and As-sessment, 129, 433-459. https://doi.org/10.1007/s10661-006-9375-6
[40] Bu, H., Tan, X., Li, S. and Zhang, Q. (2010) Temporal and Spatial Variations of Water Quality in the Jinshui River of the South Qinling Mts., China. Ecotoxicology and Environmental Safety, 73, 907-913. https://doi.org/10.1016/j.ecoenv.2009.11.007
[41] Sarin, M.M., Krishnaswami, S., Dilli, K., Somayajulu, B.L.K. and Moore, W.S. (1989) Major Ion Chemistry of the Ganga-Brahmaputra River System: Weathering Processes and Fluxes to the Bay of Bengal. Geochimica et Cosmochimica Acta, 53, 997-1009. https://doi.org/10.1016/0016-7037(89)90205-6

Md. M. Islam et al.
26
Appendix
(a)
(b)
(c)
Figure A1. Scree plots of the eigenvalues of principal components in pre-monsoon (a), monsoon (b) and post-monsoon (c).

Submit or recommend next manuscript to SCIRP and we will provide best service for you:
Accepting pre-submission inquiries through Email, Facebook, LinkedIn, Twitter, etc. A wide selection of journals (inclusive of 9 subjects, more than 200 journals) Providing 24-hour high-quality service User-friendly online submission system Fair and swift peer-review system Efficient typesetting and proofreading procedure Display of the result of downloads and visits, as well as the number of cited articles Maximum dissemination of your research work
Submit your manuscript at: http://papersubmission.scirp.org/ Or contact [email protected]