lmtf.orglmtf.org/folm/plans/water/pucreports/lmjuly6ltrwattachments.pdfhach sension156 do probe hach...
TRANSCRIPT


GAVIN NEWSOM MAYOR E. DENNIS NORMANDY PRESIDENT ROBERT J. COSTELLO VICE PRESIDENT ANN MOLLER CAEN ADAM WERBACH RYAN L. BROOKS PATRICIA E. MARTEL GENERAL MANAGER ANDREW F. DeGRACA BUREAU MANAGER
W A T E R Q U A L I T Y B U R E A U 1657 Rollins Road, Burlingame, CA 94010 • Tel. (650) 652-3100 • Fax (650) 652-3142
MEMORANDUM DATE: June 8, 2004 TO: Greg Bartow, Planning THRU: B. Carlomagno FROM: Brandon Grissom CC: A. R. Wong M. Boozarpour K. Miller G. Lam A. Navarret D. Dingman
K. Barry M. Barrow R. Yee HL Chang A. Shum D. Temple
RE: Lake Merced Pump Station Dechlorination Project:
Sodium Bisulfite and Ascorbic Acid Bench Tests – May 2004
Executive Summary Sodium bisulfite (NaHSO3) and ascorbic acid (C5H5O5CH2OH) are dechlorination agents to be evaluated for use at Lake Merced Pump Station (LMPS) to treat potable water discharges flowing into Lake Merced. Bench level jar testing was conducted under various dosages to identify reaction times, impact on total chlorine, free ammonia, pH, and dissolved oxygen. Source water was collected from Sunset Supply Line at Baden with 2.0 ppm total chlorine. Tests were conducted during May 2004. It is important to note that these findings may vary due to seasonal conditions and changes in treated water. For sodium bisulfite, 1.63 mg/L of sodium bisulfite must be added to reduce 1 mg/L of total chlorine [stoichiometric concentration of 1.11 (mol/mol)]. At design flow rate of 5 MGD, 54.4 gal/day (0.037393 gpm) of sodium bisulfite is required for 2 mg/L total chlorine1. At current pricing levels of $2.01 per gal, costs are $108 per day (dosing for 5 MGD at 2.0 ppm total chlorine for 24 hours). For ascorbic acid, 3.02 mg/L of ascorbic acid must be added to reduce 1 mg/L of total chlorine [stoichiometric concentration of 1.22 (mol/mol)]. At design flow rate 1 At 4 MGD and 2 mg/L total chlorine, the current chemical feed rate spreadsheet from LMPS for sodium bisulfite gives flow of 0.02991 gpm or 43.07 gal/day in comparison to 43.49 gal/day based on results from this experiment giving a 1% difference.
LMPS Bench Test Results (04-06-08 v1).doc 7/13/2004

Sodium Bisulfite and Ascorbic Acid Bench Tests, May 2004 CDD Support Workgroup Water Quality Engineering of 5 MGD, if 1 box (25 kg) of ascorbic acid is mixed in 1000 gal tank (6600 mg/L ascorbic acid concentration), then 4574 gal/day (3.18 gpm) or 4.6 boxes/day of ascorbic acid is required. At current pricing levels of $500 per box, costs are $2300 per day at 3.18 gpm (dosing for 5 MGD at 2.0 ppm total chlorine for 24 hours). There is a nearly instantaneous reaction rate for both dechlorinating agents (<10 sec). In all tests, the total chlorine concentrations immediately dropped upon addition of the dechlorinating agent. At lower stoichiometric% (<5x), sodium bisulfite has greater effect on pH than ascorbic acid. At lower stoichiometric% (<5x), sodium bisulfite is greater oxygen scavenger than ascorbic acid.
1Based on SFPUC target of 8.5 and results from jar testing 2Two 1000 gal tanks filled independently
Bench Test Results Dechlorinating
Agent LMPS Water Flow
(MGD)
LMPS Nominal Residual
(mg/L)
Chemical Dose Requirement
(gpm)
Current Storage Capacity
(Day)
Cost/Day ($/day)
PH discharge1
(units)
Dissolved O2
3 (mg/L)
Sodium Bisulfite
5 2.00 0.037 3.71 $110 7.4 8.5
Ascorbic Acid 5 2.00 3.18 0.432 $2300 7.5 9.1
3Based on 9.5 mg/L as tested from SSL Baden, May 2004 Based on results from this experiment, both sodium bisulfite and ascorbic acid are effective dechlorinating agents and rapidly remove Cl2. However, sodium bisulfite is superior based on quantities required and costs. One 200 gal tank of sodium bisulfite will last over three days at 5 MGD and 2 ppm total chlorine. One 1000 gal tank of ascorbic acid will last only 5 hours. Neither sodium bisulfite nor ascorbic acid reduced dissolved oxygen levels below 8.5 mg/L (dissolved oxygen was elevated due to mixing). Additional environmental testing and analysis is out of the scope of this testing. Full-scale testing should be completed to verify bench test results.
LMPS Bench Test Results (04-06-08 v1).doc 7/13/2004

Sodium Bisulfite and Ascorbic Acid Bench Tests, May 2004 CDD Support Workgroup Water Quality Engineering
Introduction Sodium bisulfite (NaHSO3) and ascorbic acid (C5H5O5CH2OH) are reducing agents commonly used in potable water to remove chlorine residuals. These alternate dechlorination agents were evaluated for use at Lake Merced Pump (LMPS). The dechlorination agent will be used to treat potable water discharges flowing into Lake Merced. Evaluation identified dosing and reaction times, impact on total chlorine, free ammonia, pH, and dissolved oxygen. Recent SFPUC experience with calcium thiosulfate at Pulgas Station rules out its use at Lake Merced for consistency with SFPUC operations. Calcium thiosulfate requires 6x stoichiometric amounts for dechlorination and is cost prohibitive. Consequently, calcium thiosulfate was not evaluated in these tests. Since sodium bisulfite and ascorbic acid reactions with chloramines have not been found in literature2, the stoichiometry will be based on reactions with free chlorine.
Sodium Bisulfite: HClNaHSOOHClNaHSO 24223 +→++ Ascorbic Acid: HClOHCHOHCClOHCHOHC 2253522555 +→+
Method The following analytical instruments and analytical methods were used for these tests. A testing plan was developed and documented with a memo to Brian Carlomagno on 5/10/04 “Lake Merced Dechlorination Bench Test Protocol.”
Materials and Methods Table Instrument Method Hach DR/890 with vials and powder pillows Total Chlorine (high range, 0 to 5.00 mg/L Cl2), Method 10070
Free Ammonia (0 to 0.50 mg/L NH3-N), Method 10045 Hach SensION156 DO Probe Hach SensION156 PH and Conductivity Probes Automatic Titration (0.02N H2SO4) (WQB Laboratory) Total Alkalinity (Expressed in terms of mg/L CaCO3) Stock Chemical Properties Preparation Sodium Bisulfite (NaHSO3), BCS
25% (w/w), SG=1.2, MW=104.058 g/mol 1 mg/mL solution was prepared by adding 3.33 mL of stock solution to 1 L of deionized water
Ascorbic Acid (C5H5O5CH2OH), BCS
Solid, MW=176.12 g/mol 1 mg/mL solution was prepared by adding 1 g of stock chemical to 1 L of deionized water
2 Since chloramine is commonly reported in units of mg/L as Cl2, the stoichiometric equations for dechlorinating chloramine may be the same as that for dechlorinating free chlorine.
LMPS Bench Test Results (04-06-08 v1).doc 7/13/2004
Sodium Bisulfite and Ascorbic Acid Bench Tests, May 2004 CDD Support Workgroup Water Quality Engineering
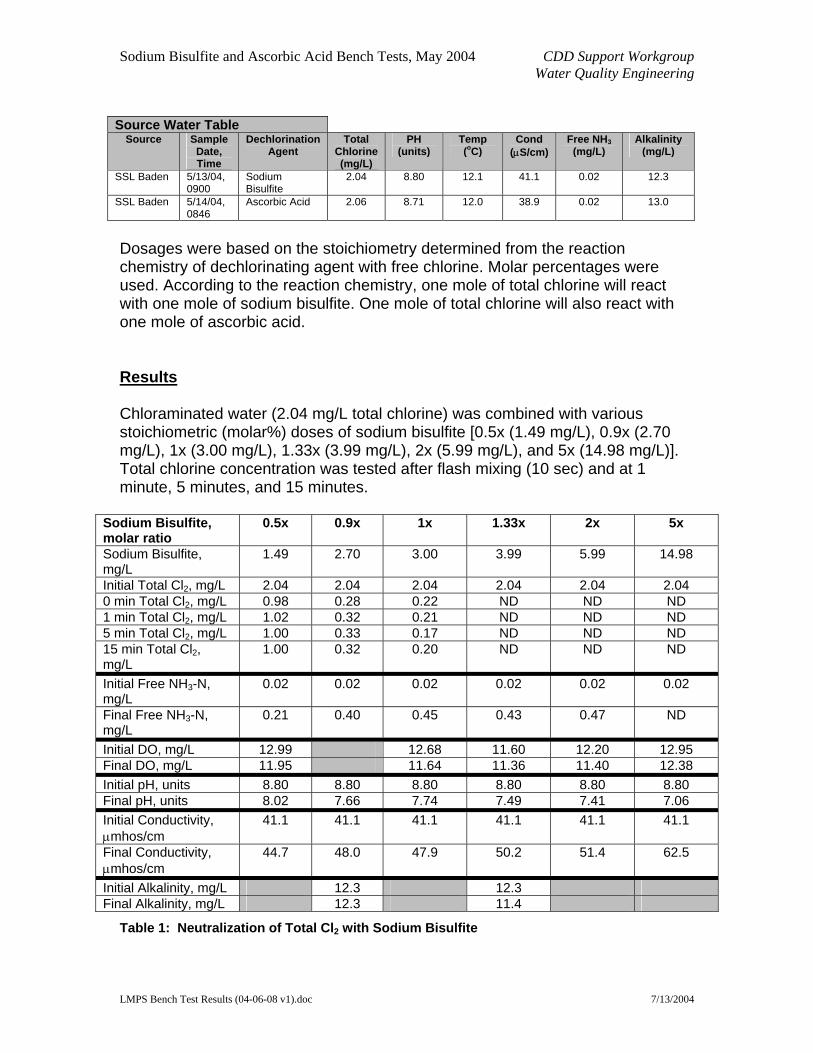
Source Water Table Source Sample
Date, Time
Dechlorination Agent
Total Chlorine (mg/L)
PH (units)
Temp (oC)
Cond (µS/cm)
Free NH3(mg/L)
Alkalinity (mg/L)
SSL Baden 5/13/04, 0900
Sodium Bisulfite
2.04 8.80 12.1 41.1 0.02 12.3
SSL Baden 5/14/04, 0846
Ascorbic Acid 2.06 8.71 12.0 38.9 0.02 13.0
Dosages were based on the stoichiometry determined from the reaction chemistry of dechlorinating agent with free chlorine. Molar percentages were used. According to the reaction chemistry, one mole of total chlorine will react with one mole of sodium bisulfite. One mole of total chlorine will also react with one mole of ascorbic acid. Results Chloraminated water (2.04 mg/L total chlorine) was combined with various stoichiometric (molar%) doses of sodium bisulfite [0.5x (1.49 mg/L), 0.9x (2.70 mg/L), 1x (3.00 mg/L), 1.33x (3.99 mg/L), 2x (5.99 mg/L), and 5x (14.98 mg/L)]. Total chlorine concentration was tested after flash mixing (10 sec) and at 1 minute, 5 minutes, and 15 minutes.
Sodium Bisulfite, molar ratio
0.5x 0.9x 1x 1.33x 2x 5x
Sodium Bisulfite, mg/L
1.49 2.70 3.00 3.99 5.99 14.98
Initial Total Cl2, mg/L 2.04 2.04 2.04 2.04 2.04 2.04 0 min Total Cl2, mg/L 0.98 0.28 0.22 ND ND ND 1 min Total Cl2, mg/L 1.02 0.32 0.21 ND ND ND 5 min Total Cl2, mg/L 1.00 0.33 0.17 ND ND ND 15 min Total Cl2, mg/L
1.00 0.32 0.20 ND ND ND
Initial Free NH3-N, mg/L
0.02 0.02 0.02 0.02 0.02 0.02
Final Free NH3-N, mg/L
0.21 0.40 0.45 0.43 0.47 ND
Initial DO, mg/L 12.99 12.68 11.60 12.20 12.95 Final DO, mg/L 11.95 11.64 11.36 11.40 12.38 Initial pH, units 8.80 8.80 8.80 8.80 8.80 8.80 Final pH, units 8.02 7.66 7.74 7.49 7.41 7.06 Initial Conductivity, µmhos/cm
41.1 41.1 41.1 41.1 41.1 41.1
Final Conductivity, µmhos/cm
44.7 48.0 47.9 50.2 51.4 62.5
Initial Alkalinity, mg/L 12.3 12.3 Final Alkalinity, mg/L 12.3 11.4
Table 1: Neutralization of Total Cl2 with Sodium Bisulfite
LMPS Bench Test Results (04-06-08 v1).doc 7/13/2004

Sodium Bisulfite and Ascorbic Acid Bench Tests, May 2004 CDD Support Workgroup Water Quality Engineering Chloraminated water (2.06 mg/L total chlorine) was combined with various stoichiometric (molar%) dose of ascorbic acid [0.5x (2.52 mg/L), 0.9x (4.61 mg/L), 1x (5.12 mg/L), 2x (10.24 mg/L), and 5x (25.51 mg/L)]. Total chlorine concentration was tested after flash mixing (10 sec) and at 1 minute, 5 minutes, and 15 minutes. Ascorbic Acid, molar ratio
0.5x 0.9x 1x 2x 5x
Ascorbic Acid, mg/L 2.52 4.61 5.12 10.24 25.61 Initial Total Cl2, mg/L 2.06 2.06 2.06 2.06 2.06 0 min Total Cl2, mg/L 1.11 0.37 0.40 ND ND 1 min Total Cl2, mg/L 1.24 0.52 0.30 ND ND 5 min Total Cl2, mg/L 1.16 0.50 0.37 ND ND 15 min Total Cl2, mg/L 1.26 0.49 0.44 ND ND Initial Free NH3-N, mg/L 0.02 0.02 0.02 0.02 0.02 Final Free NH3-N, mg/L 0.09 0.15 0.17 0.36 0.09 Initial DO, mg/L 10.18 10.02 9.79 9.68 9.25 Final DO, mg/L 9.84 9.69 9.32 9.18 8.56 Initial pH, units 8.71 8.71 8.71 8.71 8.71 Final pH, units 8.01 7.93 7.88 7.57 6.89 Initial Conductivity, µmhos/cm
38.9 38.9 38.9 38.9 38.9
Final Conductivity, µmhos/cm
40.2 40.8 41.0 42.3 43.4
Initial Alkalinity, mg/L 13.0 13.0 Final Alkalinity, mg/L 12.2 8.6 Table 2: Neutralization of Total Cl2 with Ascorbic Acid Discussion The sodium bisulfite reaction with chlorine is nearly instantaneous as shown in Figure 1.
LMPS Bench Test Results (04-06-08 v1).doc 7/13/2004

Sodium Bisulfite and Ascorbic Acid Bench Tests, May 2004 CDD Support Workgroup Water Quality Engineering
Figure 1. Total Cl2 concentrations after addition of Sodium Bisulfite (SB)
0
0.5
1
1.5
2
2.5
0 5 10 15 20Time (min)
Tota
l Cl 2
(mg/
L)
1.49 mg/L SB2.70 mg/L SB3.00 mg/L SB3.99 mg/L SB5.99 mg/L SB14.98 mg/L SB
Initial ConditionsSource: SSL BadenTotal Cl2=2.04 mg/LpH=8.80Cond=41.1 µS/cmTemp=12.1oC
Based on these tests, a molar NaHSO3 to Cl2 ratio of 1.11 (mol/mol) of the stoichiometric dose should be applied to reduce total chlorine to zero. This corresponds to a NaHSO3 to Cl2 (w/w) ratio of 1.63. For every 1.00 mg/L of total chlorine in source water, 1.63 mg/L of sodium bisulfite must be added.
Figure 2. Total Cl2 concentrations after additionof stiochiometric ratios of Sodium Bisulfite (SB)
0.00
0.20
0.40
0.60
0.80
1.00
1.20
0 1 2 3 4 5 6Molar Stoichiometric Ratio of
Sodium Bisulfite to Total Chlorine (mol/mol)
Tota
l Cl 2
(mg/
L)
StoichiometricRatio(SB:TotalChlorine)
Initial ConditionsSource: SSL BadenTotal Cl2=2.04 mg/LpH=8.80Cond=41.1 µS/cmTemp=12.1oC
LMPS Bench Test Results (04-06-08 v1).doc 7/13/2004

Sodium Bisulfite and Ascorbic Acid Bench Tests, May 2004 CDD Support Workgroup Water Quality Engineering The ascorbic acid reaction with chlorine is nearly instantaneous as shown in Figure 3.
Figure 3. Total Cl2 concentrations after addition of Ascorbic Acid (AA)
0
0.5
1
1.5
2
2.5
0 2 4 6 8 10 12 14 16Time (min)
Tota
l Cl (
mg/
L)
2.52 mg/L AA4.61 mg/L AA5.12 mg/L AA10.24 mg/L AA25.61 mg/L AA
Initial ConditionsSource: SSL BadenTotal Cl2=2.06 mg/LpH=8.71Cond=38.9 µS/cmTemp=13.0 oC
Based on these tests, a molar C5H5O5CH2OH to Cl2 ratio of 1.21 (mol/mol) of the stoichiometric does should be applied. This corresponds to a C5H5O5CH2OH to Cl2 (w/w) ratio of 3.02. For every 1.00 mg/L of total chlorine in source water, 3.02 mg/L of ascorbic acid must be added.
Figure 4. Total Cl2 concentrations after addition of stiochiometric ratios of Ascorbic Acid (AA)
0.00
0.20
0.40
0.60
0.80
1.00
1.20
0 1 2 3 4 5 6Molar Stoichiometric Ratio of
Ascorbic Acid to Total Chlorine (mol/mol)
Tota
l Cl 2
(mg/
L)
StoichiometricRatio(AA:TotalChlorine)
Initial ConditionsSource: SSL BadenTotal Cl2=2.06 mg/LpH=8.71Cond=38.9 µS/cmTemp=13.0 oC
LMPS Bench Test Results (04-06-08 v1).doc 7/13/2004

Sodium Bisulfite and Ascorbic Acid Bench Tests, May 2004 CDD Support Workgroup Water Quality Engineering Due to the production of hydrochloric acid as a byproduct of the reaction, pH drop is expected. This is shown in Figure 5.
Figure 5. Final pH and pH change after addition of stiochiometric ratios of Ascorbic Acid/Sodium Bisulfite
6.2
6.4
6.6
6.8
7
7.2
7.4
7.6
7.8
8
8.2
0.5 0.9 1 2 5
Molar Stoichiometric Ratio of Sodium Bisulfite/Ascorbic Acid to Total Cl2 (mol/mol)
Fina
l pH
(Uni
ts)
-2
-1.8
-1.6
-1.4
-1.2
-1
-0.8
-0.6
-0.4
-0.2
0
pH C
hang
e (U
nits
)
Sodium Bisulfite Final pHAscorbic Acid Final pHSodium Bisulfite pH ChangeAscorbic Acid pH Change
Initial Conditions-Sodium BisulfiteSource: SSL BadenTotal Cl2=2.04 mg/LpH=8.80Cond=41.1 µS/cmTemp=12.1oCInitial Conditions-Ascorbic AcidSource: SSL BadenTotal Cl2=2.06 mg/LpH=8.71Cond=38.9 µS/cmTemp=13.0 oC
According to the “Guidance Manual for the Disposal of Chlorinated Water,” sodium bisulfite is a good oxygen scavenger and ascorbic acid is not known as an oxygen scavenger. Results support this as shown in Figure 6. At applied dosing levels (2.0 ppm total chlorine), sodium bisulfite has more oxygen demand.
Figure 6. Final DO and DO change after addition of stiochiometric ratios of Ascorbic Acid/Sodium Bisulfite
0
2
4
6
8
10
12
14
0.5 1 2 5
Molar Stoichiometric Ratio of Sodium Bisulfite/Ascorbic Acid to Total Cl2 (mol/mol)
Fina
l DO
(mg/
L)
-1.2
-1
-0.8
-0.6
-0.4
-0.2
0
DO
Cha
nge
(mg/
L)
Sodium Bisulfite Final DOAscorbic Acid Final DOSodium Bisulfite DO ChangeAscorbic Acid DO Change
Initial Conditions-Sodium BisulfiteSource: SSL BadenTotal Cl2=2.04 mg/LpH=8.80Cond=41.1 µS/cmTemp=12.1oCInitial Conditions-Ascorbic AcidSource: SSL BadenTotal Cl2=2.06 mg/LpH=8.71Cond=38.9 µS/cmTemp=13.0 oC
LMPS Bench Test Results (04-06-08 v1).doc 7/13/2004

Sodium Bisulfite and Ascorbic Acid Bench Tests, May 2004 CDD Support Workgroup Water Quality Engineering Conclusions and Recommendations
1. As shown by Figures 1 and 3, there is a nearly instantaneous reaction rate for both dechlorinating agents (<10 sec). In all samples tested, the total chlorine concentrations immediately dropped upon addition of the dechlorinating agent.
2. For every 1 mg/L of total chlorine, 1.63 mg/L of sodium bisulfite must be
added to reduce total chlorine residual to zero. Sodium bisulfite stoichiometric ratio of 1.11 (mol/mol) or 1.63 (w/w) is required to reduce total chlorine concentration to zero. At maximum designed flow rate of 5 MGD, 27.2 gal/day of sodium bisulfite is required for every 1 mg/L of total chlorine.
3. For sodium bisulfite, at a Sunset Supply Line normal operating level of 2
mg/L of total chlorine at 5 MGD, then 2*27.2 or 54.4 gal/day (0.037393 gpm) of sodium bisulfite is required.
4. For sodium bisulfite, at current CDD pricing levels of $2.01 /gal, costs are
$108 per day at a sodium bisulfite flow rate of 0.037393 gpm (dosing for 5 MGD at 2.0 ppm total chlorine for 24 hours).
5. At 4 MGD and 2 mg/L total chlorine, the current chemical feed rate
spreadsheet from LMPS for sodium bisulfite gives flow of 0.02991 gpm or 43.07 gal/day. This compares to 43.49 gal/day based on results from this experiment giving a 1% difference. The results from this experiment closely match the current feed rates.
6. For every 1 mg/L of total chlorine, 3.02 mg/L of ascorbic acid must be
added to reduce total chlorine residual to zero. Ascorbic acid stoichiometric ratio of 1.22 (mol/mol) or 3.02 (w/w) is required to reduce total chlorine concentration to zero. At maximum designed flow rate of 5 MGD, if 1 box (25 kg) of ascorbic acid is mixed in 1000 gal tank (6600 mg/L ascorbic acid concentration), then 2287 gal/day (3.18 gpm) or 2.3 boxes/day of ascorbic acid is required for every 1 mg/L of total chlorine.
7. For ascorbic acid, at an operating level of 2 mg/L of total chlorine at 5
MGD, then 2*2.3 or 4.6 boxes/day of ascorbic acid is required.
8. For ascorbic acid, at current pricing levels of $500 per box, costs are $2300 per day at an ascorbic acid flow rate of 3.18 gpm (dosing for 5 MGD at 2.0 ppm total chlorine for 24 hours).
9. As shown by Figure 5, at lower stoichiometric% (<5x), sodium bisulfite has
greater effect on pH. This is expected due to the hydrochloric acid product of the reaction.
LMPS Bench Test Results (04-06-08 v1).doc 7/13/2004
Sodium Bisulfite and Ascorbic Acid Bench Tests, May 2004 CDD Support Workgroup Water Quality Engineering
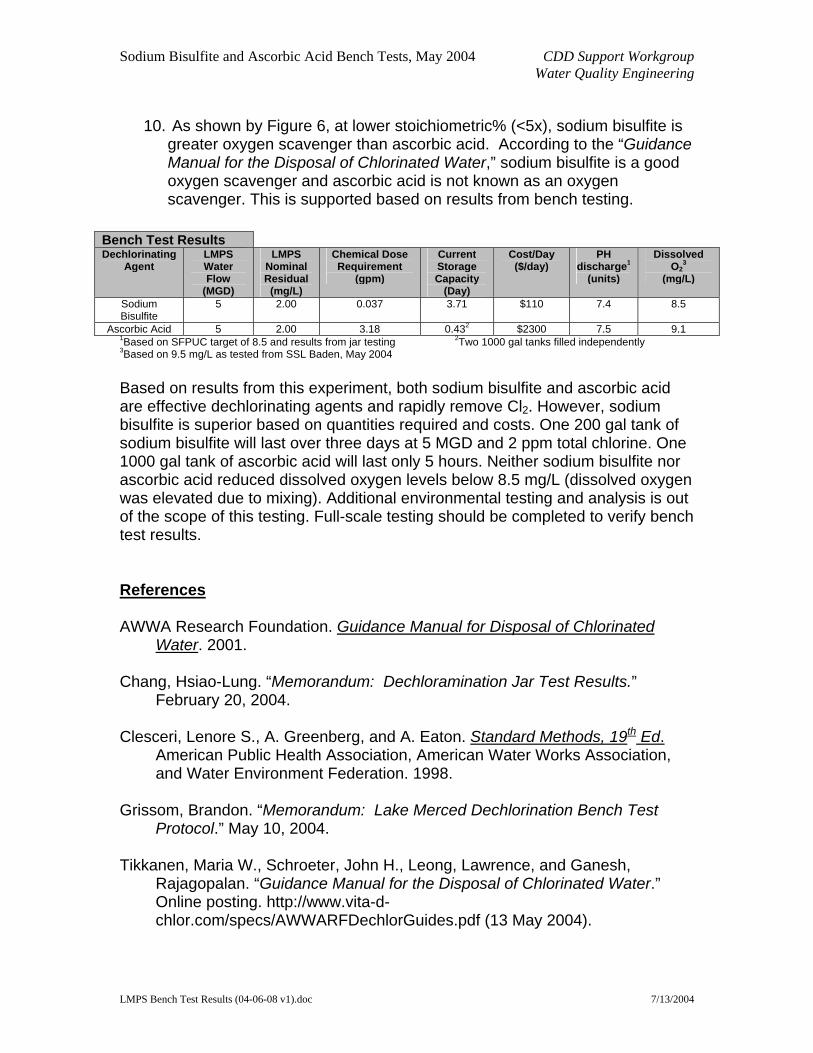
10. As shown by Figure 6, at lower stoichiometric% (<5x), sodium bisulfite is greater oxygen scavenger than ascorbic acid. According to the “Guidance Manual for the Disposal of Chlorinated Water,” sodium bisulfite is a good oxygen scavenger and ascorbic acid is not known as an oxygen scavenger. This is supported based on results from bench testing.
1Based on SFPUC target of 8.5 and results from jar testing 2Two 1000 gal tanks filled independently
Bench Test Results Dechlorinating
Agent LMPS Water Flow
(MGD)
LMPS Nominal Residual
(mg/L)
Chemical Dose Requirement
(gpm)
Current Storage Capacity
(Day)
Cost/Day ($/day)
PH discharge1
(units)
Dissolved O2
3 (mg/L)
Sodium Bisulfite
5 2.00 0.037 3.71 $110 7.4 8.5
Ascorbic Acid 5 2.00 3.18 0.432 $2300 7.5 9.1
3Based on 9.5 mg/L as tested from SSL Baden, May 2004 Based on results from this experiment, both sodium bisulfite and ascorbic acid are effective dechlorinating agents and rapidly remove Cl2. However, sodium bisulfite is superior based on quantities required and costs. One 200 gal tank of sodium bisulfite will last over three days at 5 MGD and 2 ppm total chlorine. One 1000 gal tank of ascorbic acid will last only 5 hours. Neither sodium bisulfite nor ascorbic acid reduced dissolved oxygen levels below 8.5 mg/L (dissolved oxygen was elevated due to mixing). Additional environmental testing and analysis is out of the scope of this testing. Full-scale testing should be completed to verify bench test results. References AWWA Research Foundation. Guidance Manual for Disposal of Chlorinated
Water. 2001. Chang, Hsiao-Lung. “Memorandum: Dechloramination Jar Test Results.”
February 20, 2004. Clesceri, Lenore S., A. Greenberg, and A. Eaton. Standard Methods, 19th Ed.
American Public Health Association, American Water Works Association, and Water Environment Federation. 1998.
Grissom, Brandon. “Memorandum: Lake Merced Dechlorination Bench Test
Protocol.” May 10, 2004. Tikkanen, Maria W., Schroeter, John H., Leong, Lawrence, and Ganesh,
Rajagopalan. “Guidance Manual for the Disposal of Chlorinated Water.” Online posting. http://www.vita-d-chlor.com/specs/AWWARFDechlorGuides.pdf (13 May 2004).
LMPS Bench Test Results (04-06-08 v1).doc 7/13/2004
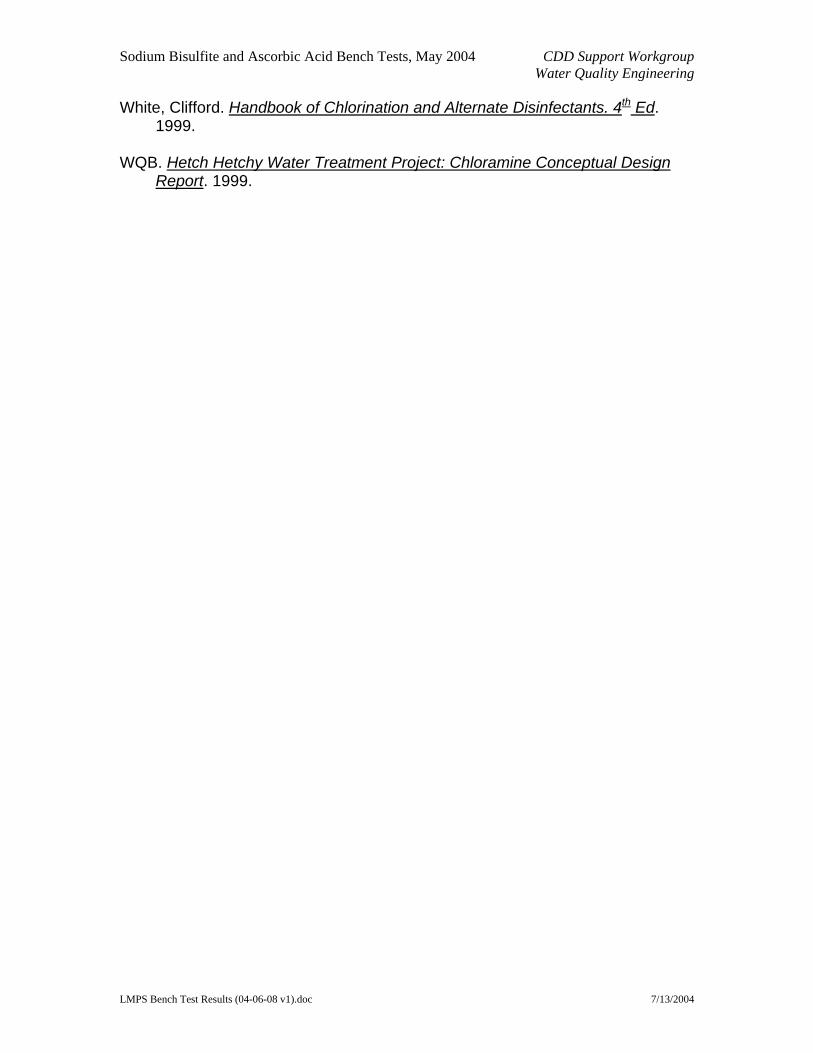
Sodium Bisulfite and Ascorbic Acid Bench Tests, May 2004 CDD Support Workgroup Water Quality Engineering White, Clifford. Handbook of Chlorination and Alternate Disinfectants. 4th Ed.
1999. WQB. Hetch Hetchy Water Treatment Project: Chloramine Conceptual Design
Report. 1999.
LMPS Bench Test Results (04-06-08 v1).doc 7/13/2004

Sodium Bisulfite and Ascorbic Acid Bench Tests CDD Support Workgroup Water Quality Engineering
Sodium Bisulfite Feed Rate Sheet
LMPS Bench Test Results (04-06-08 v1).doc 7/13/2004

Sodium Bisulfite and Ascorbic Acid Bench Tests CDD Support Workgroup Water Quality Engineering
Ascorbic Acid Feed Rate Sheet
LMPS Bench Test Results (04-06-08 v1).doc 7/13/2004

WATER QUALITY GOALS FOR INORGANIC CONSTITUENTS 1
FRESHWATER AQUATIC LIFE - TOTAL AMMONIA
Fish Early Life Stage Present- Criteria Continuous Concentration, 30-day Average (mg-N/L) 2
Results from Lake Merced SamplingpH 0 14 16 18 20 22 24 26 28 30 1999-20046.5 6.67 6.67 6.06 5.33 4.68 4.12 3.62 3.18 2.8 2.466.6 6.57 6.57 5.97 5.25 4.61 4.05 3.56 3.13 2.75 2.42 Key:6.7 6.44 6.44 5.86 5.15 4.52 3.98 3.5 3.07 2.7 2.37 Lowest pH and Temp.6.8 6.29 6.29 5.72 5.03 4.42 3.89 3.42 3 2.64 2.326.9 6.12 6.12 5.56 4.89 4.3 3.78 3.32 2.92 2.57 2.25 Highest pH and Temp.7.0 5.91 5.91 5.37 4.72 4.15 3.65 3.21 2.82 2.48 2.187.1 5.67 5.67 5.15 4.53 3.98 3.5 3.08 2.7 2.38 2.09 Average pH and Temp.7.2 5.39 5.39 4.9 4.31 3.78 3.33 2.92 2.57 2.26 1.997.3 5.08 5.08 4.61 4.06 3.57 3.13 2.76 2.42 2.13 1.87 UCL 90% pH and Temp.7.4 4.73 4.73 4.3 3.78 3.32 2.92 2.57 2.26 1.98 1.747.5 4.36 4.36 3.97 3.49 3.06 2.69 2.37 2.08 1.83 1.61 Range of Lake pH and Temp:7.6 3.98 3.98 3.61 3.18 2.79 2.45 2.16 1.9 1.67 1.47 SFPUC Water pH and Temp7.7 3.58 3.58 3.25 2.86 2.51 2.21 1.94 1.71 1.5 1.327.8 3.18 3.18 2.89 2.54 2.23 1.96 1.73 1.52 1.33 1.177.9 2.8 2.8 2.54 2.24 1.96 1.73 1.52 1.33 1.17 1.038.0 2.43 2.43 2.21 1.94 1.71 1.5 1.32 1.16 1.02 0.8978.1 2.1 2.1 1.91 1.68 1.47 1.29 1.14 1 0.879 0.7738.2 1.79 1.79 1.63 1.43 1.26 1.11 0.973 0.855 0.752 0.6618.3 1.52 1.52 1.39 1.22 1.07 0.941 0.827 0.727 0.639 0.5628.4 1.29 1.29 1.17 1.03 0.906 0.796 0.7 0.615 0.541 0.4758.5 1.09 1.09 0.99 0.87 0.765 0.672 0.591 0.52 0.457 0.4018.6 0.92 0.92 0.836 0.735 0.646 0.568 0.499 0.439 0.386 0.3398.7 0.778 0.778 0.707 0.622 0.547 0.48 0.422 0.371 0.326 0.2878.8 0.661 0.661 0.601 0.528 0.464 0.408 0.359 0.315 0.277 0.2448.9 0.565 0.565 0.513 0.451 0.397 0.349 0.306 0.269 0.237 0.2089.0 0.486 0.486 0.442 0.389 0.342 0.3 0.264 0.232 0.204 0.179
1 Reference: U.S. Environmental Protection Agency, Office of Water, National Recommended Water Quality Criteria 2002 , EPA 822-R-02-047 (November 2002), <http://www.epa.gov/waterscience/standards/wqcriteria.html.> --From "A Compliation of Water Quality Goals", California Environmental Protection Agency, Regional Water Quality Control Board (August 2003)2 In addition, the highest four-day average within the 30-day period should not exceed 2.5 times the Criteria Continuous shown in the above table.
DATA SUMMARYData Source: SFPUC Limnology Sampling by Water Quality Bureau at Lake Merced.
Location: Lake Merced South Across From Police RangeTEMP pH(deg C) (pH units)
MIN: 10.6 7.42AVG: 15.8 8.06
Upper 90%: 18.6 8.5MAX: 21.1 8.63
Location: Lake Merced South Across From Pump StationTEMP pH(deg C) (pH units)
MIN: 10.9 7.31AVG: 16.0 8.10
Upper 90%: 19.1 8.54MAX: 21.6 8.70
Temperature (oC)
The concentration of total ammonia in SFPUC water is 0.5 mg/L . Therefore, the chronic criteria would only be exceeded by 0.02 mg/L based on the highest pH and Temp. recorded from 1999-2004.

