assessment of subsurface transporter
TRANSCRIPT

0 . 13 3
ASSESSMENT OF SUBSURFACE TRANSPORTERSYSTEM FOR THE PROPOSED REPOSITORY AT
YUCCA MOUNTAIN
Prepared for
U.S. Nuclear Regulatory CommissionContract NRC-02-02-012
Prepared by
M. LesherA. Ghosh
B. Dasgupta
Center for Nuclear Waste Regulatory AnalysesSan Antonio, Texas
August 2003
0 *
ABSTRACT
To comply with the requirements for preclosure safety analysis in 10 CFR 63.112, theU.S. Department of Energy (DOE) is required to identify and conduct a systematic evaluation ofnatural and human-induced hazards and initiating events that may result in radiological releaseto the public and workers at the proposed geologic repository operations area at YuccaMountain, Nevada. The waste package transporter train will bring the waste packages from thesurface facilities to the emplacement area in the underground facility through the North Rampfor a distance of approximately 2 km [1.25 mi]. The North Ramp has approximately a 2-percentdowngrade. Civilian Radioactive Waste Management System Management & OperatingContractor (CRWMS M&O) (1 997a,b, 2000) identified the waste package transporter trainsystem as a potential source of radiation release in case of a runaway (uncontrolled descent)event and evaluated the potential hazards associated with the transporter system. CRWMSM&O (2000) evaluated the postulated runaway scenarios and determined that the maximumspeed of a runaway transporter would exceed the tip-over speed. In the event of a tip-over, thetransporter would impact the tunnel wall, potentially causing damage to the waste package suchthat a radiological release may occur. Using data from mining and rail transport accidents, inaddition to fault tree analysis, CRWMS M&O (1 997a) concluded that runaway is a credibleevent. Consequently, CRWMS M&O (2000) if additional safety features would lower thefrequency of occurrence to less than the Category 2 frequency limit (1 chance in 10,000 orgreater of occurring before permanent closure). Additionally, CRWMS M&O (2000) concludedthat the transporter would derail in runaway situations if the rails and wheels were extremelyworn from lack of proper maintenance.
This report documents the staff review of the analyses used to estimate the runaway frequencyof the transporter system, including derailment and tip-over onto the drift wall during transportoperations. This review is based on Section 2.1.1.3, Identification of Hazards and InitiatingEvents, of the Yucca Mountain Review Plan (NRC, 2003). The staff review also involved limitedindependent fault tree analyses using alternate scenarios. As a result of this independentanalysis, staff identified a few credible scenarios that DOE should investigate further.Additionally, effects of uncertainties in the failure rate data used in the frequency estimateshould also be analyzed, according to the requirement of Acceptance Criterion 3 of Section2.1.1.3.3 of NRC (2003).
CRWMS M&O. ANL-WER-ME-000001, "Subsurface Transporter Safety Systems Analysis."Rev. 01. Las Vegas, Nevada: CRWMS M&O. 2000.
- . "DBE/Scenario Analysis for Preclosure Repository Subsurface Facilities."BCAOOOOOO-01717-0200-00017. Rev 00. Las Vegas, Nevada: CRWMS M&O. 1997a.
. "Application of Logic Diagrams and Common-Cause Failures to Design Basis Events."BCAOOOOOO-01717-0200-00018. Rev. 00. Las Vegas, Nevada: CRWMS M&O. 1997b.
NRC. NUREG-1804, "Yucca Mountain Review Plan." Final Report. Washington, DC:NRC. 2003.
ii
1
CONTENTS
Section Page
FIGURES ........... vTABLES ...................... viiACRONYMS ........................ ixACKNOWLEDGMENTS ................... xiEXECUTIVE SUMMARY ................. xiii
1 INTRODUCTION .. 1-11.1 Background .1-11.2 Objectives and Scope .1-11.3 Organization of this Report .1-2
2 OVERVIEW OF SUBSURFACE TRANSPORTATION SYSTEM .2-1
3 DERAILMENT AND TIP-OVER CONDITIONS ..... 3-13.1 Introduction . . . .3-13.2 Overview of DOE Analysis . . . .3-1
3.2.1 Maximum Runaway Speed . . .3-13.2.1.1 Runaway Scenarios .. 3-13.2.1.2 Frictionless Condition for Upper Bound Limit of
Runaway Speed . .3-23.2.1.3 Frictional Rolling Conditions . .3-2
3.2.1.3.1 Rolling and Curve Resistance EstimationMethodology .3-2
3.2.1.3.2 Tip-Over Speed .3-33.2.1.3.3 Transporter Runaway Speed .3-3
3.2.2 Standard and Dynamic Braking Conditions . .3-43.2.3 Analysis of Derailment Conditions . . .3-4
3.3 Staff Evaluation . . . .3-53.3.1 Maximum Runaway Speed . . .3-53.3.2 Standard and Dynamic Braking Conditions . ............. 3-63.3.3 Derailment Conditions . . .3-6
4 RUNAWAY FREQUENCY ESTIMATES USING FAULT TREE ANALYSIS .. 4-14.1 Introduction . . . .4-14.2 Overview of DOE Analysis . . . .4-14.3 Fault Tree Analysis with Additional Design Features .... 4-34.4 Staff Evaluation of Runaway Fault Tree Analyses .4-5
4.4.1 Methodology . . .4-54.4.2 Concerns on Fault Tree Analyses and Staff's Independent
Assessment. ...................................... 4-54.4.2.1 Speed Controller Induced Runaway .4-64.4.2.2 Communications Link Failure Probability . . 4-64.4.2.3 Additional Staff Analyses . .4-7
4.4.2.3.1 Potential Common Cause Failures ofSupplemental Brake System .4-7
iii
* * d93
CONTENTS, continued
Section Page
4.4.2.3.2 Supplemental Hydraulic Brake Control SystemReliability ......... .................... 4-8
4.4.2.3.3 Automatic Speed Detector Failure Probability . 4-84.4.3 Conclusions of Independent Runaway Fault Tree Analysis .... .... 4-8
5 Additional Safety Considerations .................... ........................ 5-15.1 Impact Limiters ................................................ 5-15.2 Normal Operating Speed of Transporters ............................ 5-15.3 Uncontrolled Descent Mitigation ................................... 5-1
6 SUMMARY AND CONCLUSIONS ........................................... 6-1
7 REFERENCES .......................................................... 7-1
iv

FIGURES
Figure Page
3-1 Yucca Mountain Site Layout Showing Most Likely Runaway Sites ..... ........ 3-2
4-1 Top Level Fault Tree for Runaway Transporter ............................ 4-24-2 Fault Tree Depicting Speed Controller Initiated Runaway Event ..... .......... 4-74-3 Revised Fault Tree Showing the Effect of Communication Link Failure .... ..... 4-8
V

* t ;/~~~~~~33
TABLES
Table Page
2-1 Transporter Equipment Characteristics .......... ........................ 2-1
3-1 Derived Final Velocities for Scenarios 1, 2, 3, and 4 ........................ 3-5
4-1 Effects of Safety Features to Runaway Initiated Fault Tree ..... ............. 4-34-2 Effects of Safety Features to Failure to Apply Brakes After Runaway
Initiation Fault Tree .4-44-3 Estimated Runaway Frequency for Different Safety Feature Combinations in
Runaway Occurs on North Ramp Top Event .............................. 4-54-4 Results of Staff Analysis of the Effects of Communication Link Failure .... ..... 4-9
vi

-7
ACKNOWLEDGMENTS
This report was prepared to document work performed by the Center for Nuclear WasteRegulatory Analyses (CNWRA) for the U.S. Nuclear Regulatory Commission (NRC) underContract No. NRC-02-97-009. The activities reported here were performed on behalf of theNRC Office of Nuclear Material Safety and Safeguards, Division of Waste Management. Thereport is an independent product of the CNWRA and does not necessarily reflect the views orregulatory position of the NRC.
The authors would like to thank D. Gute and G. Ofoegbu for the technical review and B. Sagarfor the programmatic review of this report. The authors also appreciate C. Patton for providingword processing support and C. Cudd and A. Woods for editorial support in preparation of thisdocument.
QUALITY OF DATA, ANALYSES, AND CODE DEVELOPMENT
DATA: No CNWRA generated original data are contained in this report. Data used in thisreport are primarily equipment failure rate actuarial data derived from other sources. Each datasource is cited in this report. The work presented in this report is documented in ScientificNotebook 544.
ANALYSES AND CODES: Fault Tree analyses presented in this report were conducted usingSAPHIRE, Version 6.7 [Idaho National Engineering and Environmental Laboratory(INEEL), 1998]. This is an acquired software and is under CNWRA configuration control. Thespreadsheet calculations were accomplished using Microsoft Excels' 2000 (MicrosoftCorporation, 2000).
References
Idaho National Engineering Laboratory. "Systems Analysis Programs for Hands-on IntegratedReliability Evaluations (SAPHIRE), Version 6.0." SAPHIRE Reference Manual. Idaho Falls,Idaho: Idaho National Engineering Laboratory. 1998.
Microsoft Corporation. "Microsoft.Excele 2000." Redmond, Washington: MicrosoftCorporation. 2000.
vii

1 INTRODUCTION
1.1. Background
The proposed geologic repository at Yucca Mountain would include both surface andsubsurface facilities (DOE, 2001). Surface facilities will be constructed for receiving, preparing,and packaging nuclear waste received at the site into waste packages before transporting themunderground for disposal. The underground disposal facility will be constructed approximately320 m [1,050 ft] beneath the Earth's surface for permanent disposal of the waste packages inemplacement drifts. The waste package transporter system will transport the waste packagesfrom the surface facilities to the emplacement area by way of the North Ramp. The transportersystem is currently envisioned as a rail-based system.
Demonstration of compliance with the preclosure performance objectives of 10 CFR 63.111requires a safety analysis of the waste package transport system that meets the preclosuresafety requirements specified in 10 CFR 63.112. Proper identification of hazards and initiatingevents is critical for demonstrating compliance with the preclosure objectives duringemplacement operations, as identified in 10 CFR 63.21 (c)(5). Civilian Radioactive WasteManagement System Management & Operating Contractor (CRWMS M&O) (1997a,b, 2000)presented the results of a preliminary evaluation of potential hazards involving the wastepackage transportation system. Staff reviewed the reports to assess completeness andappropriateness of the analysis to identify the hazards associated with the waste packagetransporter system to the extent it can be determined based on the current preliminary designconcept. It should be noted that the design of the proposed repository and associatedtransporter system is preliminary, and significant changes are anticipated. This report presentsthe assessment made by the staff.
1.2 Objectives and Scope
The staff evaluation of hazards and initiating events concerning transportation of wastepackages from the surface facility to the underground emplacement drifts is based on the reviewguidance documented in U.S. Nuclear Regulatory Commission (NRC) (2002, Section 2.1.1.3)for identification of hazards and initiating events. This report uses the reievant ;eview mrrethodsand acceptance criteria in Sections 2.1.1.3.1 through 2.1.1.3.3 (NRC, 2003). The overallobjectives of this report include:
* Review the tip-over and derailment analyses of the transporter for additional potentialhazards.
* Systematically evaluate the baseline probability data, runaway speed, and runawayprobability analyses presented, including identified failure modes and initiating events,for appropriateness to the proposed waste package transport system, taking intoconsideration current knowledge of the conceptual transporter design.
1-1
/-33
* Review the failure modes, analysis techniques, and potential safety enhancements ofthe transporter system.
* Conduct limited independent analyses, as warranted, to support staff assessment.
1.3 Organization of This Report
Chapter 2 of this report provides an overview of the subsurface transportation system.Chapter 3 reviews the method used to determine the maximum runaway speed of thetransporter, including derailment and tipover analyses. Staff assessment has also beenpresented, including an independent analysis of the runaway speed. Chapter 4 providesa review of the fault tree analysis of the runaway event probability presented byCRWMS M&O (2000). Staff review and an independent assessment are also presented in thischapter. Chapter 5 presents additional safety features, proposed by CRWMS M&O (2000) forthe transporter system. Chapter 6 summarizes the staff assessment of the analyses presentedby CRWMS M&O (1 997a,b, 2000).
1-2

0 0 1~~~~~~~~~33
2 OVERVIEW OF SUBSURFACE TRANSPORTATION SYSTEM
The transporter train, as has been envisioned in CRWMS M&O (2000), comprises two electriclocomotives and a custom-designed transporter. The two locomotives will be powered by anoverhead electric trolley and will be identical except that the primary locomotive will bepermanently coupled to the transporter. The secondary locomotive will be frequently coupledand decoupled to the transporter. The permanently coupled locomotive will stay in place duringtransfer of the waste package into the emplacement drift. The train may be operated eitherremotely from the centralized control room via radio signals or by an on-board manual control.The transporter and both locomotives will be equipped with multiple brake systems(e.g., dynamic service brake, emergency brake, and parking brake).
The transporter car includes a self-contained, shielded enclosure for storing the waste packageduring transport from the waste handling building to the emplacement drifts. The characteristicsof the transporter are given in Table 2-1.
I Table 2-1. Transporter Equipment Characteristics (CRWMS M&O, 2000)
Transporter Length 22.065 m [65.8 ft]
Transporter Width 2.94 m [9.65 ft]
Transporter Height 4.337 m [14.4 ft]
Transporter Weight (with waste package) 400 MT [441 ton] maximum
Transporter Weight (without waste package) 302.4 MT [ 333.33 ton] maximum
Locomotive Weight 45.36 MT [50 ton]
Waste Package Weight 85 MT [93.70 ton] maximum
Maximum Operating Speed 8.0 km/hr [5.0 mph] or 2.23 m/s [7.33 ft/s]
Rate of Emplacement 524 waste packages per year based on amaximumn emplacement schedule
During the emplacement phase of the repository operation, the transporter train(two locomotives and a transporter) will be driven from the Waste Handling Building on thesurface to the North Ramp and Access Main, and then to the turnout of the destinationemplacement drift under onboard operator control (DOE, 2001; CRWMS M&O, 1997a).The track extends from the exit of the Waste Handling Building to the North Portal and into theNorth Ramp and throughout the Access Main and turnouts. There will be many track switchesto accommodate operations, such as coupling and decoupling, of locomotives to the transporterand reorientation of the transporter as necessary in the drifts. Each track switch will beremotely operated and instrumented for remote position indication.
2-1
* * S1/
3 DERAILMENT AND TIP-OVER CONDITIONS
3.1 Introduction
Waste packages will be transported from the surface through the North Ramp to theemplacement drifts. The North Ramp is more than 2 km [1.24 mi] long at a slope greater than-2 percent (CRWMS M&O, 2000). This long downward slope of the North Ramp is a primarysource of concern for loss of braking and subsequent runaway of the transporter train leading toa derailment or tip-over situation. Inability of the rails to maintain the appropriate gauge andalignment between rail segments are potential contributors to derailment. In addition, failures inthe instrumentation, control, and remote communications systems; failures in the controlsoftware; and potential human actions may all contribute to the likelihood of derailment.
CRWMS M&O (2000) considered three hazardous conditions that could potentially damage thewaste package during transportation that could lead to a radiological release. These hazardsconditions include: (i) tip-over, (ii) standard braking, and (iii) derailment. The goal of theanalysis presented by CRWMS M&O (2000) was to determine the hazard potential of thetransporter system by establishing the maximum speed the transporter train could achievewithin the proposed repository under runaway conditions. The maximum transporter runawayspeed was subsequently used to determine the potential for derailment at the curves and beforethe transporter reaches the access main tunnel in the emplacement horizon.
Staff reviewed the analysis of potential derailment and tip-over conditions followingNUREG-1804 (NRC, 2003, Section 2.1.1.3). The review addressed if the analysis usedappropriate methodology, data, and assumptions to evaluate a hazard potential of a transporterrunaway event. In addition, the focus of the staff review of transporter tip-over potential was toverify the maximum speed estimated in the analysis (CRWMS M&O, 2000). Staff performed asensitivity analysis to determine the extent by which any change in the parameter values couldcontribute to faster runaway speeds and, thereby, further increasing the potential for damage tothe waste package.
3.2 Overview of DOE Analysis
3.2.1 Maximum ;2unaway Speed
3.2.1.1 Runaway Scenarios
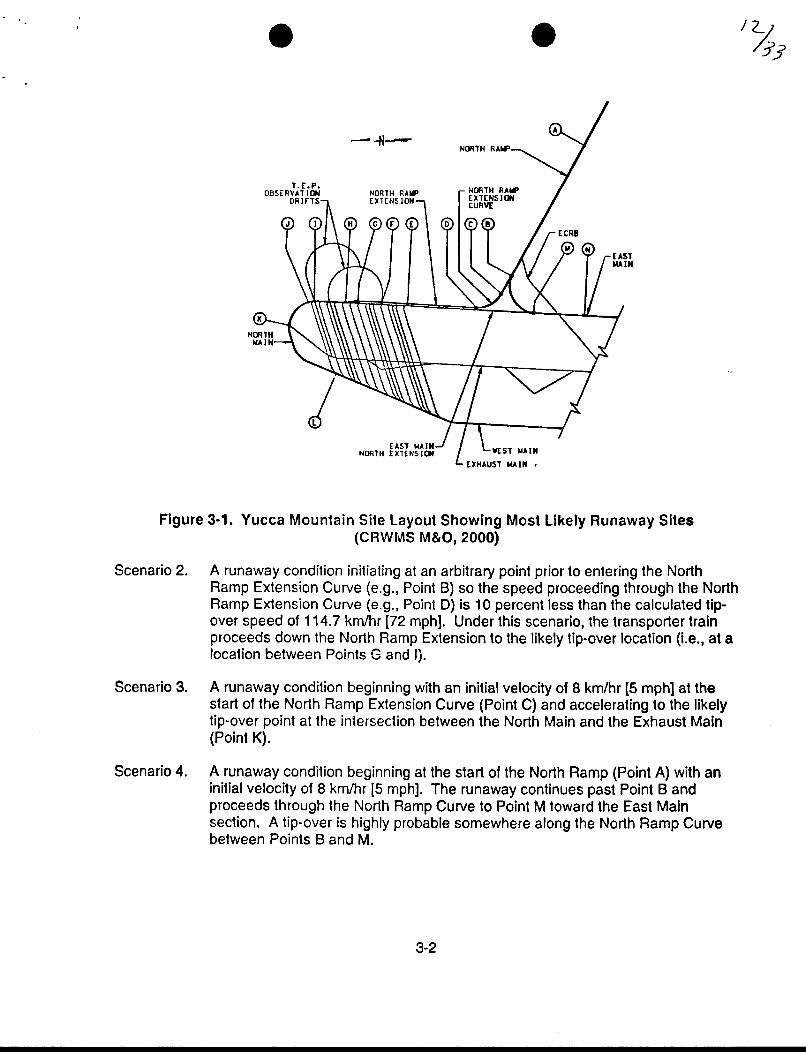
CRWMS M&O (2000) considered maximum runaway speeds under three track conditions:(i) frictionless, (ii) standard rolling resistance, and (iii) standard braking conditions. A partiallayout of the facility, as given in CRWMS M&O (2000), is shown in Figure 3-1 to assist in theinterpretation of these runaway scenarios. The runaway speed was calculated for the followingfour different scenarios. Referring to Figure 3-1, the four scenarios are as follows:
Scenario 1. A runaway condition beginning at the entrance of the North Ramp (Point A) withan initial speed of 8 km/hr [5.0 mph] and accelerating through the North RampExtension Curve to Point D. A tip-over at Point D is highly likely.
3-1
0 0 /4]
-EASTMAIN
Figure 3-1. Yucca Mountain Site Layout Showing Most Likely Runaway Sites(CRWMS M&O, 2000)
Scenario 2.
Scenario 3.
Scenario 4.
A runaway condition initiating at an arbitrary point prior to entering the NorthRamp Extension Curve (e.g., Point B) so the speed proceeding through the NorthRamp Extension Curve (e.g., Point D) is 10 percent less than the calculated tip-over speed of 114.7 km/hr [72 mph]. Under this scenario, the transporter trainproceeds down the North Ramp Extension to the likely tip-over location (i.e., at alocation between Points Ad and I).
A runaway condition beginning with an initial velocity of 8 km/hr [5 mph] at thestart of the North Ramp Extension Curve (Point C) and accelerating to the likelytip-over point at the intersection between the North Main and the Exhaust Main(Point K).
A runaway condition beginning at the start of the North Ramp (Point A) with aninitial velocity of 8 km/hr [5 mph]. The runaway continues past Point B andproceeds through the North Ramp Curve to Point M toward the East Mainsection. A tip-over is highly probable somewhere along the North Ramp Curvebetween Points B and M.
3-2

0 0 1J33
3.2.1.2 Frictionless Condition for Upper Bound Limit of Runaway Speed
Runaway speeds for the transporter system were calculated for the four scenarios withfrictionless conditions in CRWMS M&O (2000). The frictionless condition was considered todetermine the upper bound limit of the maximum runaway speed. Only the track grade andlength are needed to determine the ultimate speed with frictionless conditions. Speed is not afunction of mass for this condition. Fundamental Newtonian equations for motion of a bodyunder constant acceleration (gravity) were used to develop the equation for the frictionlesscondition (Avallone and Baumeister, 1987). Additionally, final speed of the transporter iscalculated to be 119.4 km/hr [74.20 mph] and 119.7 km/hr [74.37 mph] at Point D, depending onthe initial speed of 0 or 8 km/hr [5 mph], respectively (CRWMS M&O, 2000); therefore, finalspeed is not quite sensitive to the initial speed.
3.2.1.3 Frictional Rolling Conditions
Assumption of frictionless rolling condition is not a realistic scenario. CRWMS M&O(2000, Sections 3.1.2.1 through 3.1.2.3) used two formulas to determine total rolling resistance:the first formula determines the track resistance caused by bearing resistance and aerodynamicdrag, and the second formula accounts for curve resistance. Since railroad wheels are fixed oneach axle, additional rolling resistance occurs where curves are encountered along the trackbecause the outer wheel must travel a greater distance than the inner wheel and, therefore,must slip because it is fixed by the axle to the inner wheel. Aerodynamic drag, created as anadditional resistance that increases with velocity as the air tries to flow around the narrow spacebetween the train and tunnel wall was deemed negligible because the frontal area ofthe transporter is only approximately one third of the total cross-sectional area of the tunnel(CRWMS M&O, 2000).
3.2.1.3.1 Rolling and Curve Resistance Estimation Methodology
CRWMS M&O (2000) used empirical equations to develop the maximum runaway speeds forthe transporter. The analysis is based on the most widely accepted formula for calculatingrolling resistance, including aerodynamic drag, developed by W.J. Davis (Air BrakeAssociation, 1975). An equation, based on the Davis formula, was taken from Avallone andBaumeister (1987) and used in the analysis for calculating rolling resistance. According toAvallone and Baumeister (1987), the Davis formula has been used extensively for calculatingfreight train resistance on straight track at speeds up to 64.4 km/hr [40.2 mph]. Staff confirmedthat this formula is cited exactly in this form in a more recent edition of Avallone and Baumeister(1996). CRWMS M&O (2000) also considered another simpler technique, the Goodmantechnique (Goodman Equipment Corporation, 1971), for calculating the rolling resistance. TheGoodman technique results in much higher values of rolling resistance than the Davis formulaand does not account for aerodynamic drag. For instance, within a speed of 8 to 64 km/hr[5 to 50 mph], the Davis formula returns rolling resistance values for the transporter aloneranging from 4,286 to 7,818 N [963.5 to 1,757.5 lb] while the Goodman technique returns aconstant value (regardless of speed) of 39,233 N [8,819.6 lb]. The Davis formula for rollingresistance was considered the most accurate for calculation of runaway transporter rollingresistance by CRWMS M&O (2000). In addition, CRWMS M&O (2000) considered two otherequations that can be used to compensate for lower observed resistance values at increasedspeeds above 64 km/hr [40 mph]. These equations are known as the Tuthill equation(Avallone and Baumeister, 1987, Eq. 11.2.12) and the Canadian National Railway equation,
3-3
(Avallone and Baumeister, 1987, Eq. 11.2.13). These equations are expected to result in lessrolling resistance than the Davis formula; however, the resulting velocities derived from theseequations were not provided in CRWMS M&O (2000).
CRWMS M&O (2000) derived a value for curve resistance based on a general formula from AirBrake Association (1975). Note that all curves in the proposed site, where a tip-over wasconsidered likely, have a 305-m [1,000.6-ft] curve radius. CRWMS M&O (2000) derived acurve resistance value of 28.1 N/MT 15.73 lb/ton] for a 305-m [1,000.6-ft] curve radius.CRWMS M&O (2000) also estimated the general curve resistance based on a formuladeveloped by Goodman Equipment Corporation (1 971 a), which produces a curve resistance of11.8 N/MT [2.40 lb/ton]. This result (which is intended to be combined with the Goodmanequation for rolling resistance) is much lower for specific curve resistance than the Air BrakeAssociation results. CRWMS M&O (2000) combined the Davis rolling resistance with the AirBrake Association's curve resistance into a total resistance formula and, thereafter, referred to itas standard resistance.
3.2.1.3.2 Tip-Over Speed
To calculate the speed at which the transporter would tip-over, the tip-over moments, which acton the transporter while traversing a curve, were summed by determining the centrifugal forceapplied to the center of gravity of all transporter components. According to CRWMS M&O(2000), the tip-over speed of the transporter was derived as 114.67 km/hr [71.25 mph) based ona curve radius of 305 m 11,000.6 ft]. Note that a smaller radius of curvature would result inreduced tip-over speeds. CRWMS M&O (2000) considered any speed within 10 percent of thecalculated tip-over speed is sufficient to cause a tip-over.
3.2.1.3.3 Transporter Runaway Speed
After estimating the total train rolling and curve resistance, a stepwise integration technique wasused to derive the final speed for the transporter train in each runaway scenario, as provided inTable 3-1. Note that final speed points shown were considered to be the point of maximumrunaway speed for each scenario.
CRWMS M&O (2000) only provided runaway speeds based on standard resistanceassumptions. No values for final speed with Goodman and frictionless conditions for thesescenarios were provided. Results of this analysis using standard resistance assumptionsindicate there is a potential hazard of a tip-over during a runaway transporter train in theNorth Ramp.
3-4

Table 3-1. Derived Final Velocities for Scenarios 1, 2, 3, and 4 (CRWMS M&O, 2000)
Scenario 1 2 3 4
Final velocity point along ramp(Refer Figure 3-1) D G K M
Maximum final velocity 111 .0 km/hr 128.2 km/hr 102.5 km/hr 110.4 km/hr(standard resistance) [68.94 mph] [79.6 mph] [63.7 mph] [68.6 mph]
Velocity compared to tip-over speed Within Less than Withinof 114.67 km/hr [71.25 mph] 3 percent Greater 11 percent 4 percent
Tip-over potential Yes Yes No Yes
3.2.2 Standard and Dynamic Braking Conditions
CRWMS M&O (2000) used Newtonian analysis to determine the likelihood of a wheel locking upon the transporter train. Any locking up of wheels would significantly increase the stoppingdistance. Wheel lock-up is a concern because it could be an initiator for a runaway situation. Atthe tip-over speed of 114.67 km/hr [71.25 mph], the transporter train would require a distance of2,518 m [8,261 ft] at 13-percent brake ratio and 321 m [1,053 ft] at 60-percent brake ratio, tostop after applying of the emergency brake. A supplemental brake system, such asaxle-mounted supplemental disk brakes (a redundant safety feature), was not considered in thisanalysis because the design of the transporter system is evolving. If a supplemental brakesystem is included in the transporter system as the design evolves, effects of this brake systemshould be evaluated.
3.2.3 Analysis of Derailment Conditions
CRWMS M&O (2000) discussed various suboptimal track conditions that may lead toderailment, such as twisted track, track misalignment, track hunting, and rail integrity failures(Blader, 1990). Track hunting is caused by harmonic, oscillatory motions of the train wheels asthey pass down the tracks at speeds that induce harmonic motions of the train cars, such asswaying, twisting, or roliing dc.n the tracks. This cyclic stress loading !eads to long-term railintegrity failures caused by crack growth and propagation from internal defects in the rails. TheFederal Railroad Administration has studied the causes for railcar harmonic motion(U.S. Department of Transportation, 1998) and has found that cars with a relatively high centerof gravity riding on half-staggered, bolt-jointed rails can exhibit this motion at relatively lowspeeds of 16 to 32 km/hr [10 to 20 mph]. CRWMS M&O (2000) suggested that the transportershould avoid operations in the speed range of 16 to 32 km/hr [10 to 20 mph]. Normal operatingspeed of the transporter is limited to 8 km/hr [5 mph]. Therefore, track hunting is not a crediblecause for derailment.
CRWMS M&O (2000) gave details of a mathematical evaluation of the possibility of wheelderailments using the Nadal criterion (Blader, 1990). The Nadal criterion assumes a simplifiedset of equilibrium forces at the wheel-rail interface, which can be calculated based onobservable physical properties of the system. Using the Nadal criterion, CRWMS M&O (2000)found no derailment potential for runaway Scenarios 1 through 4, as previously described.
3-5

a90 ":&133
Therefore, CRWMS M&O (2000) suggests the transporter would only derail in runawayconditions when the rails and wheels are extremely worn from lack of proper maintenance.
3.3 Staff Evaluation
3.3.1 Maximum Runaway Speed
Staff consider the runaway scenarios analyzed in CRWMS M&O (2000) to be reasonablebecause they encompass the steepest and longest portions of the North Ramp, which are morethan 2 km [1.24 mi] long and have a downward grade of greater than -2 percent. Staff alsoconsiders the likely tip-over locations to be well founded and well defined. Additionally, theanalysis methodology used is consistent with industry practice.
Staff evaluated the methodology used by CRWMS M&O (2000) for calculating the transportertip-over speed and found it to be consistent with accepted industry and engineering practices.Data used by CRWMS M&O (2000) in analyzing the tip-over speed are reasonable. The factthat CRWMS M&O (2000) considered the transporter train to be a rigid body for thesecalculations is reasonable because the design is still evolving. A spring suspension may or maynot increase the estimated tip-over speed depending on its design. Additionally, considerationof the suspension system of the transporter system would considerably complicate the tip-overcalculations. Staff agree that it is reasonably conservative to assume a tip-over would occur atrunaway speeds within 10 percent of the calculated tip-over speed.
Staff independently verified the calculated maximum transporter speed, as given inCRWMS M&O (2000). Staff also investigated the effects of using Tuthill and Canadian NationalRailway rolling resistance formulas to estimate the rolling resistance instead of the Davisformula. Although use of these equations produces higher runaway speeds, the difference isless than 3.5 percent and, therefore, negligible. Additionally, staff investigated use of 448 tonne[441 ton] as the weight of the transporter instead of the design weight of 434 tonne [427 ton].Lower weight would tend to decrease curve resistance and, as a result, increase the runawayspeed and tip-over potential for all four scenarios. In addition, staff also analyzed the effect ofhigher {0.5 kg/MT/degree [1 lb/ton/degree]) curve resistance used by CRWMS M&O (2000),instead of 3.9226 N/MT/degree [0.8 lb/ton/degree] given in Avallone and Baumeister (1996), onrunaway speed. Lower curve resistance would increase the runaway speed in curved areas oithe track by only approximately 1 percent. Combined effects of lower transporter weight andhigher curve resistance assumed in CRWMS M&O (2000) result in an insignificant increase ofspeed by only 0.2 km/hr [0.1 mph]. Therefore, staff conclude that the analysis presented inCRWMS M&O (2000) is robust. Although the DOE analysis (CRWMS M&O, 2000) did notinclude results for Goodman and frictionless resistance, the staff's independent analysis showsthat the standard resistance results lie reasonably between these boundary conditions.
Based on the previous observations, staff conclude that assumptions used in identifying thetransporter train runaway hazard are defensible, well defined, and have adequate technicalbases, in accordance with Acceptance Criterion 1 of Section 2.1.1.3.3 of NRC (2003).Additionally, methods used to identify potential runaway situations are adequately quantified.However, CRWMS M&O (2000) did not consider seismic activity as an initiating event fortransporter tip-over. A seismic event during the emplacement period may damage thesupporting structures, such as the rail track, which could lead to increased probability ofderailments or tip-over. Similarly, an onsite power failure may result in derailment or tip-over of
3-6

* */-7.
the transporter. Department of Energy (DOE) should consider initiating events, such as seismicactivity or power failures, as contributing factors to tip-over conditions in future analysis.
3.3.2 Standard and Dynamic Braking Conditions
CRWMS M&O (2000) used analysis techniques for calculating the braking distances anddetermining the braking ratios and net braking forces, as specified in Association of AmericanRailroads (1 999). Additionally, emergency braking conditions and brake characteristics werebased on information provided in Air Brake Association (1975, p. 11-13) and Avallone andBaumeister (1987, p. 11-35). The data and analysis techniques used were appropriate todetermine the transporter stopping distances for normal and emergency braking conditions.Brake ratios were taken from relevant industry data. However, a reevaluation of brakingdistance may be needed once the transporter design is complete. Stopping under suboptimaltrack conditions (worn track) and stopping with less than a full complement of operationalprimary brake shoes should also be considered when the design and operational aspects of thetransporter system are complete.
3.3.3 Derailment Conditions
The analysis given in CRWMS M&O (2000) used relevant data for determination of derailmentconditions. Appropriate industry standard techniques (i.e., the Nadal criterion) were used in theanalysis. The derailment forces calculated for the four runaway scenarios were below thoserequired to cause an actual derailment. CRWMS M&O (2000) noted, however, that the Nadalcriterion does not take into account dynamic effects, such as track hunting, sway, or otherdynamic phenomenon that may increase the likelihood of a derailment. However, as discussed,track hunting will not be a credible hazard if the transporter train is operated at a speed notexceeding 8 km/hr [5 mph]. Additionally, as discussed before, CRWMS M&O (2000) did notconsider any natural events, such as an earthquake or power failure. These potentialderailment conditions should be considered when the transporter design is mature.Additionally, the operational procedures for the transporter system should include anappropriate track maintenance plan to prevent excessive wear or misalignment conditions thatcould lead to a derailment.
3-7

?3
4 RUNAWAY FREQUENCY ESTIMATES USING FAULT TREE ANALYSIS
4.1 Introduction
This chapter deals with the review of determination of the probability of a runaway transportertrain or an uncontrolled descent along the North Ramp, as given in CRWMS M&O (2000). Theconsequence of an uncontrolled runaway transporter would be derailment or partial tip-over(with wall impact). Both accident scenarios can potentially damage the waste package.CRWMS M&O (2000) used the fault tree analysis technique to determine the probability of atransporter runaway. Also, CRWMS M&O (2000) evaluated the capability of certain additionalsafety features to reduce the probability of a runaway situation. Staff reviewed the informationpresented in CRWMS M&O (2000) and other relevant documents (CRWMS M&O, 1997a,b)using the review method delineated in Section 2.1.1.3.3 of NRC (2003). This review focused onthe use of appropriate methodology and data associated with evaluating the probability of arunaway event. In addition, staff independently reviewed the fault tree analysis to confirm theresults and to determine the sensitivity of the output to alternate situations not considered in theanalysis. The assessment by the staff is summarized beiow.
4.2 Overview of DOE Analysis
CRWMS M&O (2000) revised and expanded previous fault tree studies (CRWMS M&O,1 997a,b) to determine the transporter runaway probability after incorporating several safetyfeatures. One of the goals of the analysis presented in CRWMS M&O (2000) is to reduce theannual frequency of occurrence below than 10-6 events (i.e., Category 2 frequency limitassuming 100 year as the preclosure period) so that a runaway event can be eliminated fromfurther consideration.
CRWMS M&O (1 997a) used actuarial data from accidents involving commercial railway andmine locomotives to develop four different estimates of the transporter runaway probability. Theestimated probabilities ranged from 7.75 x 10⁻⁵ to 4.71 x 10⁻³ events per year with a median of6.04 x 10-4 events per year. An analysis of causal factors show that approximately half of therunaway accidents in both commercial railway and mine haulage databases could be attributedto human-initiated events (48 percent in commercial railway and 68E percePnt in mine haulage).Therefore, CRWMS M&O (2000) investigated additional saiety ieaures that could reduce thelikelihood of operator error.
Objectives of the fault tree analysis presented in CRWMS M&O (2000) are to
* Determine if the transporter system, as currently envisioned, will pose an unacceptablehazard of a sustained runaway event (wherein the operator fails to recover afterinitiation) with a probability of greater than Category 2 frequency limits
* Select design features that could be added to the transporter to reduce the probabilityof initiation of a runaway event and to determine the extent that these features mayreduce the probability of the initiation of a runaway event
4-1
* Determine the design features that could be added to the transporter to help theoperator recover control/braking after the initiation of a runaway event and to quantifythe extent to which these features improve the likelihood of operator recovery
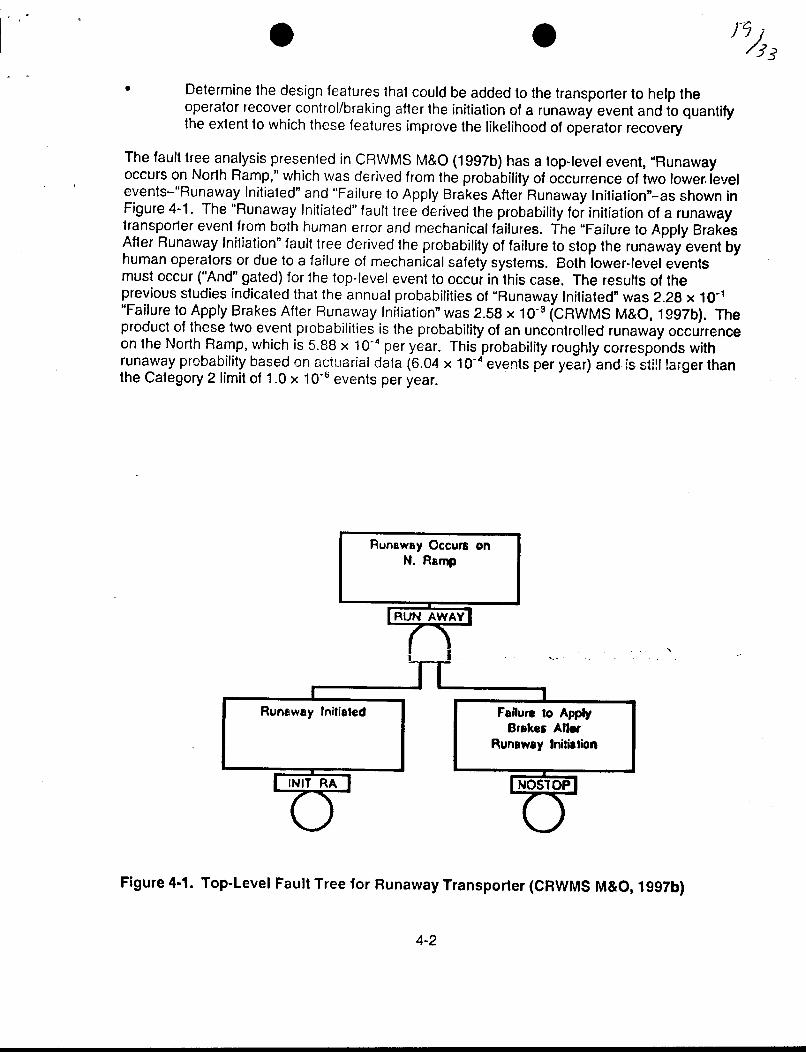
The fault tree analysis presented in CRWMS M&O (1997b) has a top-level event, "Runawayoccurs on North Ramp," which was derived from the probability of occurrence of two lower levelevents-"Runaway Initialed" and "Failure to Apply Brakes After Runaway Initiation"-as shown inFigure 4-1. The "Runaway Initiated" fault tree derived the probability for initiation of a runawaytransporter event from both human error and mechanical failures. The "Failure to Apply BrakesAfter Runaway Initiation" fault tree derived the probability of failure to slop the runaway event byhuman operators or due to a failure of mechanical safety systems. Both lower-level eventsmust occur ("And" gated) for the top-level event to occur in this case. The results of theprevious studies indicated that the annual probabilities of "Runaway Initiated' was 2.28 x 10-"Failure to Apply Brakes After Runaway Initiation" was 2.58 x 10⁻³ (CRWMS M&O, 1997b). Theproduct of these two event probabilities is the probability of an uncontrolled runaway occurrenceon the North Ramp, which is 5.88 x 1 0-4 per year. This probability roughly corresponds withrunaway probability based on actuarial data (6.04 x 10⁻⁴ events per year) and is still larger thanthe Category 2 limit of 1.0 x 1 0-6 events per year.
Figure 4-1. Top-Level Fault Tree for Runaway Transporter (CRWMS M&O, 1997b)
4-2

;1334.3 Fault Tree Analysis With Additional Design Features
CRWMS M&O (2000) provided additional fault tree analyses to demonstrate the extent to whichthe transporter runaway probability could be reduced by adding supplemental design and safetyfeatures to the basic transporter design. The safety-enhancing features investigated to reducethe frequency of the "Runaway Initiated" fault tree are (CRWMS M&O, 2000)
* An electronic interlock to ensure the dynamic brakes are engaged before the operatorcan start the train down the North Ramp.
* An alarm to alert the operator when the train speed exceeds the normal rangeduring descent.
* A control system to automatically actuate the service brakes during normal descent(speed controller), with human operators providing backup actuation.
CRWMS M&O (2000) evaluated the effects of each of these safety enhancements andcombinations of them by modifying the fault trees "Runaway Initiated" and "Failure to ApplyBrakes After Runaway Initiation" presented in CRWMS M&O (1 997b). Table 4-1 shows theeffect of the safety features for reducing the probability of runaway initiation in the fault treetitled "Runaway Initiated".
Table 4-1. Effects of Safety Features for "Runaway Initiated" Fault Tree(CRWMS M&O, 2000)
"Runaway Initiated" ProbabilityDesign Feature for Aiding Operator (events per year)
Manual control (baseline transporter design) 2.28 x 10-'
Speed controller 2.28 x 10-'
Speed alarm 4.47 x 10⁻⁴
Dynamic brake interlock 4.02 x 10⁻⁴
Alarm and interlock 4.01 x 10⁻⁴
Alarm and speed controller 4.56 x 10⁻⁵
Interlock and speed controller 7.53 x 10⁻⁷
Interlock, alarm, and speed controller 7.37 x 10.10
The last three safety feature combinations listed in Table 4-1 have sufficiently low probabilitythat, when they are "And" gated with the original probability for "Failure to Stop", the resultingtop level probability for a runaway transporter is less than 1.0 x 10'6 events per year.
CRWMS M&O (2000) also evaluated the effects of safety features added to the baselinefault tree of "Failure to Apply Brakes After Runaway Initiation" that had been derived inCRWMS M&O (1997b). The safety enhancing design features investigated to reduce the
4-3

143
frequency of "Failure lo Apply Brakes After Runaway Initiation" fault tree are(CRWMS M&O, 2000)
* A device to automatically actuate the emergency brakes during excessive speed.
* A redundant and diverse brake system on the transporter and locomotives that wouldinclude an additional set of hydraulic disk brakes applied to the wheel axles. Thissystem would provide redundant backup to the transporter's locomotive air brakes.
The automatic emergency brake adds controls to sense a runaway situation and automaticallyapply the emergency brakes. The redundant brake system would consist of a hydraulicallycontrolled disk brake system that supplements the standard air brake system in case of airbrake failure. Effects of adding these systems are shown in Table 4-2.
Table 4-2. Effects of Safety Features for "Failure to Apply Brakes After RunawayInitiation" Fault Tree (CRWMS M&O, 2000)
"Failure to Apply Brakes After RunawayInitiation" Probability
Design Feature for Applying Brakes (events per year)
Manual actuation air brake (baseline) 2.58 x 10⁻³
Automatic emergency brake 8.10 x 10-
Redundant (Diverse) braking system 2.50 x 10⁻³
Automatic emergency brake and 4.20 x 10⁻⁷redundant (Diverse) braking system
Note that because the "Failure to Apply Brakes After Runaway Initiation" probability isdominated by the probability of a human failure to apply the brake, use of a redundant brakingsystem alone does not improve the probability of failing to stop during a runaway situation.Addition of an automatic emergency brake, however, reduces the probability of human errorand. as such, significantly improves the chances of stopping during a runaway situation. In Adscase where both safety features are added to the transporter, the "Failure to Apply Brakes AfterRunaway Initiation" probability is less than Category 2 frequency limit.
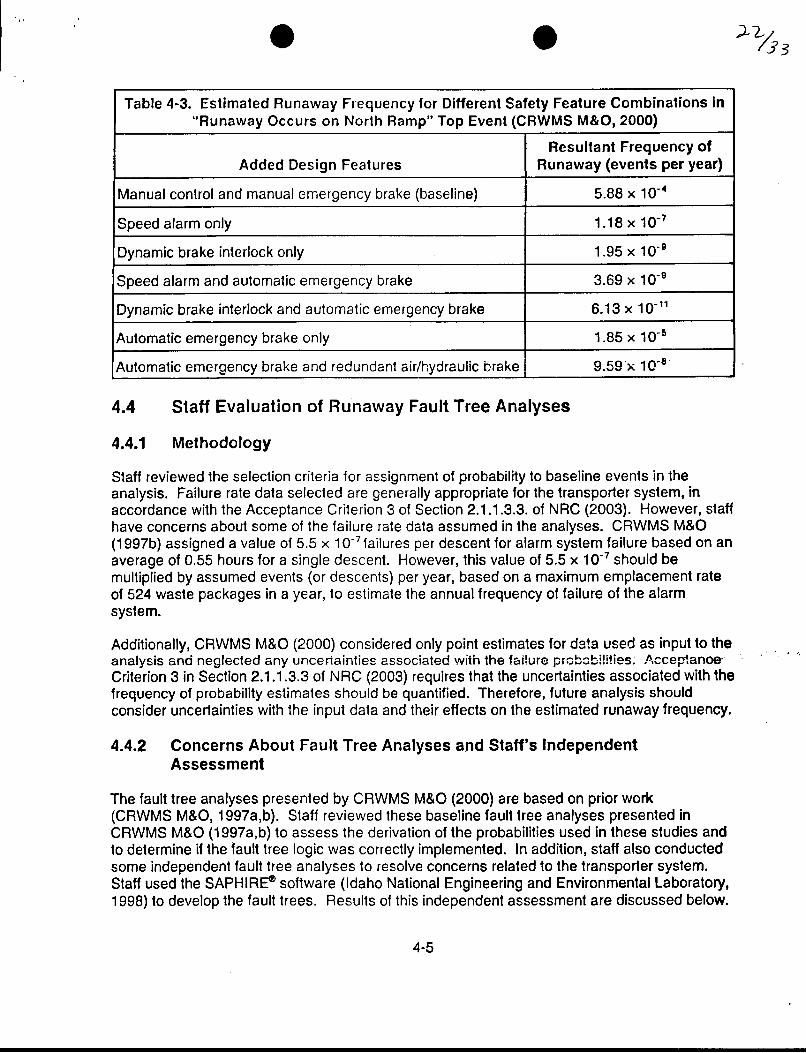
There are a variety of combinations of the safety features described above that could beincorporated into the transporter system to reduce the probability of a runaway event on theNorth Ramp to below Category 2 limits. Table 4-3 shows the results of a variety ofcombinations of added transporter safety features for both reduction of runaway initiation anddecreasing the probability of "Failure to Apply Brakes After Runaway Initiation" after initiation.A speed alarm alone is apparently very effective at lowering the probability of runaway becauseit directly decreases the probability of human error, which dominates the failure probabilitycalculation. Ultimate selection and incorporation of these features will be decided as specificdesign details of the transporter system are developed.
4-4
* * /33
Table 4-3. Estimated Runaway Frequency for Different Safety Feature Combinations in"Runaway Occurs on North Ramp" Top Event (CRWWMS M&O, 2000)
Resultant Frequency ofAdded Design Features Runaway (events per year)
Manual control and manual emergency brake (baseline) 5.88 x 10⁻⁴
Speed alarm only 1.18 x 10⁻⁷
Dynamic brake interlock only 1.95 x 10⁻⁹
Speed alarm and automatic emergency brake 3.69 x 10-i
Dynamic brake interlock and automatic emergency brake 6.13 x 10`1
Automatic emergency brake only 1.85 x 10-
Automatic emergency brake and redundant air/hydraulic brake .5 x 108
4.4 Staff Evaluation of Runaway Fault Tree Analyses
4.4.1 Methodology
Staff reviewed the selection criteria for assignment of probability to baseline events in theanalysis. Failure rate data selected are generally appropriate for the transporter system, inaccordance with the Acceptance Criterion 3 of Section 2.1.1.3.3. of NRC (2003). However, staffhave concerns about some of the failure rate data assumed in the analyses. CRWMS M&O(1 997b) assigned a value of 5.5 x 10⁻⁷ failures per descent for alarm system failure based on anaverage of 0.55 hours for a single descent. However, this value of 5.5 x 10⁻⁷ should bemultiplied by assumed events (or descents) per year, based on a maximum emplacement rateof 524 waste packages in a year, to estimate the annual frequency of failure of the alarmsystem.
Additionally, CRWMS M&O (2000) considered only point estimates for data used as input to theanalysis and neglected any uncertainties associated with the fai!ure probabilities. Acceptanoe-Criterion 3 in Section 2.1.1.3.3 of NRC (2003) requires that the uncertainties associated with thefrequency of probability estimates should be quantified. Therefore, future analysis shouldconsider uncertainties with the input data and their effects on the estimated runaway frequency.
4.4.2 Concerns About Fault Tree Analyses and Staff's IndependentAssessment
The fault tree analyses presented by CRWMS M&O (2000) are based on prior work(CRWMS M&O, 1997a,b). Staff reviewed these baseline fault tree analyses presented inCRWMS M&O (1 997a,b) to assess the derivation of the probabilities used in these studies andto determine if the fault tree logic was correctly implemented. In addition, staff also conductedsome independent fault tree analyses to resolve concerns related to the transporter system.Staff used the SAPHIREO software (Idaho National Engineering and Environmental Laboratory,1998) to develop the fault trees. Results of this independent assessment are discussed below.
4-5

4.4.2.1 Speed Controller Induced Runaway
In CRWMS M&O (2000), a runaway event initiated by a hardware failure is "And" gated with afailure of the automatic speed controller. Although staff could not find any data specific tospeed controllers for locomotives, automotive accidents have been reported in which the speedcontroller had initiated a runaway condition, leading to an accident (Anderson, 2003). Staffestimated the probability for a speed control initiated runaway based on a National HighwayTraffic Safety Administration study on data collected from 1979 to 1987 for a population of4.7 million cars and 2,782 accidents caused by sudden cruise-control acceleration during thattime period (Anderson, 2003):
(2,782 accidents) / (9 year period) x (4.7 million cars) = 6.56 x 10⁻⁵ accidents per year
The probability for speed controller initiated runaway is now included in this fault tree, as shownin Figure 4-2, and is "And" gated with the possibility of human operator not responding to thissituation from the fault tree analysis. This scenario was evaluated using the SAPHIREprogram. The resultant top-level event probability tor this fauit tree is 7.30 x 10⁹ (one order ofmagnitude greater than the CRWMS M&O probability of 7.36 x 10⁻¹⁰ estimated by CRWMSM&O, 2000). Also, note that the speed control runaway is "And" gated with the probability of theoperator failing to respond to a speed alarm, which further lowers the runaway probability.Consequently, staff feel that DOE should look into the possibility that a failure of a speedcontroller can initiate a runaway event and, therefore, investigate the possibility that it should be"Or" gated instead of "And" gated, as shown in Figure 4-1.
4.4.2.2 Communications Link Failure Probability
Staff have concerns about the zero probability assigned to a communications link failure eventin the "Failure to Apply Brakes After Runaway Initiation" fault tree (CRWMS M&O, 1997a).CRWMS M&O (2000) assumed that the communications link would remain operablethroughout the descent because the train would not proceed into the proposed repository unlessthe communications link was operational at the beginning of the trip. CRWMS M&O (1997a),however, stated that if a spurious signal in the communication system initiated a runaway event["Runaway Initiated by Malfunction in Communication System" on Page 1 of Attachment I ofCRWMS M&O (1997b)], the conditional probability of 1.0 i night be appropriate for the "Failure ofCommunications Link: Main Control Room to Train" event (CRWMS M&O, 1997a).CRWMS M&O (1997a) used a probability of zero for the "Failure of Communications Link: MainControl Room to Train" event in all the analyses. There is a possibility, however, thatsafety-critical information may be transmitted through the link, either to the operator or directly toone of the safety systems, during descent through the North Ramp. Therefore, the possibilityfor communications link failure during descent should be considered in the fault tree analysis.
To address the concern about the communications link failure, staff used SAPHIRE"software todevelop the original "Failure to Apply Brakes After Runaway Initiation" fault tree and confirmedthat the top-level failure frequency is 2.58 x 10⁻³ events per year. Staff conducted anotheranalysis with the failure rate of the communications link changed from 0.0 to 1.0 events perdemand because the failure of the communications link could initiate a runaway event bysending spurious communication signals. Results of the staff analysis are given in Table 4-4,and the fault tree is shown in Figure 4-3.
4-6

OP-ALAWRtM srPLI
uIOF.-J 2.5r.J
INtCONTu INrrClOMMf IMM.FrC-T
5.OE- I
Figure 4-2. Fault Tree Depicting Speed Controller Initiated Runaway Event
4-7

K) 5.OE-2
CR0OPFAILU ) 1.OE+O
COP&.CRLOCO
Figure 4-3. Revised Fault Tree Showing the Effect of Communication Link Failure
4-8

0 U
Table 4-4. Results of Staff Analysis of the Effects of Communications Link Failure
Failure FrequencyEvent (events per year)
Runaway initiated (baseline) (CRWMS M&O, 2000) 2.28 x 10⁻¹
Runaway initiated (with alarm and interlock) (CRWMS M&O, 2000) 4.01 x 10⁻⁴
Failure to apply brakes after runaway initiation (baseline with 2.58 x 10⁻³communication link failure probability = 0.0) (CRWMS M&O, 2000)
Failure to apply brakes after runaway initiation (with communications 5.25 x 10⁻²link failure probability = 1.0)
Runaway occurs (baseline) (CRWMS M&O, 2000) 5.88 x 10⁻⁴
Runaway occurs (with alarm and interlock, communications link failure 1.03 x 10⁻⁶probability = 0.0)
Runaway occurs (with alarm and interlock, communications link failure 2.10 x 10⁻⁵probability = 1.0)
Staff assume a speed alarm and a brake interlock will probably be added to the transportersystem as safety features to address the high probability of human initiated runaway. Withincorporation of these two features, the probability of a runaway initiation drops from 2.28 x 10-'to 4.01 x 10⁻⁴ events per year. In addition, the probability of the top event, "Runaway Occurs"is now dominated by hardware instead of human failures. Note that the probability for "Failureto Apply Brakes After Runaway Initiation" fault tree increases by one order of magnitude whenthe communication failure probability is increased to 1.0. Possibility of communication failureduring descent increases the overall probability of a runaway event to above the Category 2level of 1 x 10⁻⁶ per year even if an alarm and an interlock are included in the transporter.Therefore, staff conclude that the effects of the failure of the communications link should beconsidered for further investigation.
4.4.2.3 Additiona! Staff Analyses
As part of the review, staff conducted additional independent fault tree analyses with alternatescenarios. The top event frequency using these alternate scenarios, however, do not changesignificantly to be considered a credible hazard. These analyses are described briefly.
4.4.2.3.1 Potential Common Cause Failures of Supplemental Brake System
Staff investigated whether some common cause failure mode(s) between the supplementalhydraulic brake and the air brake systems may need to be accounted for in the analysis. Staffaddressed this concern by using the SAPHIRE° software to modify the original fault tree toinclude a common cause failure mode for the hydraulic brakes 'And" gated with the hydraulicbrake basic failure rate. A D factor of 0.1 was used for the common cause failure mode of thehydraulic system as commonly assigned to redundant components within redundant systems,such as the transporter brake systems (CRWMS M&O, 1 997b). It was found that the top levelfailure probability was not substantially different from the fault tree without the common cause
4-9

* w V-brake failure mode. This is caused by the predominance of the human error failure rate, whichoverwhelms the failure rate contribution of the hardware. When a similar modification wasapplied to the fault tree with added safety features, as presented in CRWMS M&O (2000), thetop event probability did not increase beyond the Category 2 frequency limit. Therefore, thestaff conclude that common cause failure modes between the diverse braking systems do notcontribute significantly to the hazard.
4.4.2.3.2 Supplemental Hydraulic Brake Control System Reliability
Staff are concerned that the assumption of [Assumption 5.12 of CRWMS M&O (2000)] that thesupplemental hydraulic brake system control valve having the same failure rate as the primaryair brake system control valve may not be necessarily valid. Staff investigated documentedfailure rates in Denson, et al. (1995) to determine to what extent they may be similar and towhat extent the difference may affect the probability outcome.
The reliability data indicated a 50-percent lower failure rate for a pneumatic valve in groundmobile service and a 20-percent lower failure rate for a pneumatic valve in ground fixed service.While these numbers may at first seem significant, they have little impact on the top-level failurerate of the "Failure to Apply Brakes After Runaway Initiation" fault tree. This logic is dominatedby human errors, and any changes to the failure probability of the hydraulic brake system of thismagnitude would have minimal impact on the lop-level outcome. When a similar modificationwas applied to the fault tree with added safety features, as presented in CRWMS M&O (2000),the top event probability did not increase beyond the Category 2 frequency limit. Therefore,staff conclude that the failure rate of the primary air brake system control valve would not have asignificant effect on the top event probability.
4.4.2.3.3 Automatic Speed Detector Failure Probability
CRWMS M&O (2000) assumed that a supplemental automatic speed detection/brake actuationsystem has the same failure probability as the service brake control for locomotive #1 and thetransporter. Currently, design details for such a supplemental safety system are unknown, soCRWMS M&O (2000) used the failure probability of the service brake system because it is likelythat both systems would be of similar complexity. Although both are 2-channel redundantsystems, they are not necessarily similar. If an automatic sreed detsctionubraking system isincluded in the transporter system, a fault tree analysis should be conducted for the speeddetection system.
4.4.3 Conclusions of Independent Runaway Fault Tree Analysis
Staff review and independent analyses found that CRWMS M&O (1997a,b, 2000) usedappropriate methods to identify potential hazards and initiating events, in accordance withAcceptance Criterion 1 of Section 2.1.1.3.3 of NRC (2003). As discussed preciously, the staffdetermined that the failure rate assigned to the alarm system is not appropriate. Additionally, azero probability for the communications link failure is not appropriate because spurious signalsin the communication system may initiate a runaway event. In addition, DOE should investigatewhether failure of the speed controller would initiate a runaway event. Staff also found that theprobability of events used in the analysis are generally well defined based on the referencematerials. The analysis did not quantify, however, the uncertainties associated with thefrequency of probability estimates, in accordance with Acceptance Criterion 3 of
4-10

0 0
Section 2.1.1.3.3 of NRC (2003). The analysis presented in CRWMS M&O (2000, 1997a,b)considered only point estimates for data used in the analyses. Future analyses should considerinput data uncertainties to determine the sensitivity of top-level events to these uncertainties.
Although probabilities associated with human-induced hazards and initiating events were valid,supportable, and conservative, the human error probabilities were based on nuclear power plantoperations (Swain and Gultman, 1983). It is unknown at this time how well the failure rate datafrom the nuclear power plants would be applicable to the proposed repository at YuccaMountain. DOE should have a plan 1o update the assumed failure rates once site-specificinformation is available.
4-11

/435 Additional Safety Considerations
CRWMS M&O (2000) briefly described three additional features that were considered toaugment the safety of the transporter system. These features include impact limiters attachedto the waste package transporter, limiting the maximum speed of the transporter based onwaste package impact specifications, and supplementary speed retarders to limit runawayspeeds in an emergency situation.
5.1 Impact Limiters
CRWMS M&O (2000) suggests that a crushable, energy-absorbing material should beincorporated into the radiological shield inside the transporter as protection for the wastepackage against impacts from all directions. Although this crushable layer design wouldincrease the overall size of the transporter shielding, it would provide substantial protection forthe waste package, whereas standard impact limiters would provide limited protection.
Staff agree that the use of a crushable impact absorbing layer as part of the transportershielding would provide increased defense-in-depth for potential collision scenarios; however,more information about this system would be necessary if this feature is to be incorporated intothe design of the transporter system.
5.2 Normal Operating Speed of Transporters
Goodman Equipment Corporation (1971) and Balco (1998), two mining equipmentmanufacturers in the United States, limit the operational speeds of locomotives within the rangeof 8 and 16 km/hr [5 and 10 mph] for safety concerns. Mining industry standard proceduresspecify 16 km/hr [10 mph] as a maximum standard operating speed within a mine (Code ofFederal Regulations 30 CFR 75,1998). The speed at which derailments or tip-overs wouldoccur was previously shown (in Section 3.2.2) to be far in excess of these speeds. CRWMSM&O (2000) assessed the maximum upper bound of impact speed based on the waste packagespecification, which states that the waste package must be capable of withstanding a 2.0-m[6.6-ft] drop onto its ends, or a 2.4-m [7.9-ft) drop on its side. CRWMS M&O (2000) determinedthat the terminal velocity at the end of a 2.0-m [6.6-ft] drop as 22.5 km/hr [14 mph] and a 2.4-m.[7.9-fti drop as 24.7 km/hr [16.3 mphl. Based on these results, and assuming a frontal impact, atransporter speed of 8 km/hr [5 mph] provides a safety factor of 2.82, based on a 2-m [6.6-fl]drop height. Therefore, CRWMS M&O (2000) suggested that a maximum operational speed tobe limited to approximately 8 km/hr [5 mph]. Staff agree that a maximum operational speed ofapproximately 8 km/hr (5 mph) is acceptable for the existing transporter design.
5.3 Uncontrolled Descent Mitigation
CRWMS M&O (2000) discussed the possible use of two systems to slow down or stop thetransporter in the event of an uncontrolled descent. Speed retarders are commonly used in railyards to slow down the descent of individual cars. One type of retarder consists of small,hydraulic piston actuators (similar to a shock absorber) that are mounted in sets directly to thetracks. As the train car wheels roll over the units, the piston is retracted, and a resistance forceis applied to the wheels to slow cars moving above a speed set by the manufacturer. Anothertype of speed retarder consists of pneumatically actuated braking shoes that grab the car
5-1
wheels when they are actuated. Additionally, magnetic track brakes are capable of decelerationrates of 2.46 to 3.58 m/s2 [8.07 to 11.75 fWs2], as cited in Air Brake Association (1975, p. V-22).During an uncontrolled situation, magnetic force is applied by permanent magnets orelectromagnets to slow the railcar as it passes over the unit. The principal limitations of speedcontrol units are that power may be required in the form of compressed air (pneumatic actuatedunits) or electricity (electromagnetic units) and they are complex systems that require regularmaintenance. CRWMS M&O (2000) concluded that either magnetic or hydraulic piston types ofretarders could be installed in the ramps to help prevent uncontrolled runaway descents.
Staff review shows that the speed retarder would provide additional safety for the transportersystem; however, an analysis of the failure modes and effects of a speed retarder systemshould be performed if this feature is to be included in the final design.
5-2

* V 3//33
6 SUMMARY AND CONCLUSIONS
CRWMS M&O (1 997a,b, 2000) presented the results of a preliminary evaluation of the potentialhazards of a tip-over and derailment of a transporter train while descending the North Ramp.CRWMS M&O (1 997a,b) used actuarial data for accidents involving commercial railway andmine locomotives to estimate the runaway probability of a transporter. The estimatedprobabilities ranged from 7.75 x 10⁻⁵ to 4.71 x 10⁻³ events per year with a median of 6.04 x10⁻⁴ events per year. Additionally, CRWMS M&O (1 997b) carried out a fault tree analysis toprovide an estimate of the runaway probability independent of the actuarial data. Moreover, amethodology to examine the design and operational features of the transporter system that canprevent or mitigate a runaway event was also demonstrated. The fault tree analysis produced arunaway frequency close to that the actuarial data. Additionally, the probability of a runawayevent is largely dominated by operator error. Therefore, CRWMS M&O (2000) investigatedadditional safety features that could reduce the likelihood of operator error.
Staff review found that the technical basis and methods used for the analysis are justifiable andappropriate for the transporter system and are consistent with industry standards.CRWMS M&O (2000) has used appropriate bounding values of the parameters used todetermine the speed of the transporter. Defensible technical bases have been provided.Bounding calculations are adequate for runaway speed analysis because the design of thetransporter system is still evolving. Potential human errors while operating the transportersystem have been adequately identified. Additionally, probability estimates of human reliabilityused in the analysis were adequately justified.
Independent staff analyses demonstrated that additional scenarios should be investigatedfurther by DOE. These scenarios are enumerated below:
1. DOE should investigate whether spurious signals in the communication system caninitiate a runaway event of the transporter train while descending the North Ramp.
2. DOE should investigate whether failure of the speed controller could potentially initiatea runaway condition of the transporter train.
3. DOE should address uncertainties associated with the Taiiure rnios and pronagate theuncertainties through the fault tree analysis.
4. DOE should consider any other events that may initiate a potential derailment orrunaway of the transporter train, such as a seismic event or a power failure. Theseevents may increase the likelihood of a derailment.
It is currently unknown if failure data (e.g., failures of the locomotive electrical orcommunications systems) from the nuclear power plants would be directly applicable to theproposed repository at Yucca Mountain. DOE should have a plan to collect site-specific failuredata and update the assumed values, if necessary.
6-1
** 32x
133
7 REFERENCES
Air Brake Association. "Engineering Design of Railway Brake System." Chicago, Illinois: AirBrake Association. 1975.
Anderson, A. "A Note on Automobile Cruise Control Faults and Sudden Acceleration, Section 6,Frequency of Sudden Acceleration Incidents and Alleged Examples." Version 1.1, March 2003.www.antony-anderson.com/cruise/6-freq.htm
Association of American Railroads. "Railroads. Manual of Standards and RecommendedPractices: Section E-Brakes and Brake Equipment." AAR 1999 Standard S-401-9, Section 4.0.Washington DC: Association of American Railroads. 1999.
Avallone, E.A. and Baumeister, T., Ill, eds. Marks' Standard Handbook for MechanicalEngineers. gth Edition. New York, New York: McGraw-Hill. 1987.
Marks' Standard Handbook for Mechanical Engineers. 1 th Edition. New York, NewYork: McGraw-Hill. 1996.
Balco, Inc. 60 Ton Trolley/Battety Locomotive. Blairsville, Pennsylvania: Balco, Inc. 1998.
Blader, F.B. "A Review of Literature and Methodologies in the Study of Derailments Caused byExcessive Forces at the Wheel/Rail Interface." R-717. Chicago, Illinois: Association ofAmerican Railroads. 1990.
Code of Federal Regulations. "Mineral Resources: Mandatory Safety Standards. UndergroundCoal Mines." 30 CFR Part 75. Washington, DC: U.S. Government Printing Office. 1998.
CRWMS M&O. "Subsurface Transporter Safety Systems Analysis." ANL-WER-ME-000001.Rev. 01. Las Vegas, Nevada: CRWMS M&O. 2000.
. "DBE/Scenario Analysis for Preclosure Repository Subsurface Facilities."BCAOOQOOO-01717-0200-00017. Rev 00. Las Vegas; Nevadz: CRWMS M&O. 1997a.
"Application of Logic Diagrams and Common-Cause Failures to Design Basis Events."BCAOOOOOO-01717-0200-00018. Rev. 00. Las Vegas, Nevada: CRWMS M&O. 1997b.
Denson, W., G. Chandler, W. Crowell, A. Clark, and P. Jaworski. "Nonelectronic Parts ReliabilityData-1 995." NPRD-95. Rome, New York: Reliability Analysis Center. 1995.
DOE. "Engineering Report Technical Information Site Recommendation Consideration."DOE/RW-0539. Las Vegas, Nevada: DOE. 2001.
Goodman Equipment Corporation. Goodman Mining Machine Sales Manual - LocomotiveGeneral Data Trolley Locomotive Calculations. Section 4068. Bedford Park, Illinois: GoodmanEquipment Corporation. 1971.
7-1
V - 33/3.~~~~~~~~~~~~~~~~~~~~ 3/
Idaho National Engineering and Environmental Laboratory. "Systems Analysis Programs forHands-on Integrated Reliability Evaluations (SAPHIRE) Version 6.0, Saphire ReferenceManual." Idaho Falls, Idaho: Idaho National Engineering Laboratory. 1998.
NRC. NUREG-1804. "Yucca Mountain Review Plan." Final Report. Washington, DC: NRC.2003.
Swain, A.D. and H.E. Gultman. "Handbook of Human Reliability Analysis with Emphasis onNuclear Power Plant Applications: Final Report." NUREG/CR-1278, SAND-0200.Albuquerque, New Mexico: Sandia National Laboratories. 1983.
U.S. Department of Transportation. "Improving Railroad Safety and Rail Passenger Technologythrough Targeted Research and Demonstrations, 1992-1997, Draft." DOT/FRA/ORD-98.Washington DC: U.S. Department of Transportation. 1998.
7-2