assessment of the impacts of industrial effluent ... of the impacts of industrial effluent...
TRANSCRIPT

IOSR Journal of Environmental Science, Toxicology and Food Technology (IOSR-JESTFT)
e-ISSN: 2319-2402,p- ISSN: 2319-2399.Volume 8, Issue 7 Ver. I (July. 2014), PP 80-98 www.iosrjournals.org
www.iosrjournals.org 80 | Page
Assessment of the Impacts of Industrial Effluent Discharges on
the Water Quality of Asa River, Ilorin, Nigeria.
*Ogundiran, Mathew Akinloye and Fawole, Olatunde Olubanjo, Environmental Biology Unit, Pure and Applied Biology Department, P. M. B. 4000,
Ladoke Akintola University of Technology, Ogbomoso, Nigeria Email of Corresponding Author:- *[email protected]
Abstract: The present study was carried out to investigate the impact of industrial effluent discharges on the
water quality of Asa River, Ilorin, Nigeria. Sections of Asa River along its course were studied over the period
of twenty four months (between April, 2011 and March, 2013) to determine the effects of effluents discharges on
water qualities in term of its physical and chemical parameters, and heavy metal. Water samples were collected
and analyzed monthly from three different sites along the river course for physical, chemical and heavy metals
using standard laboratory procedures and Atomic Absorption Spectrophotometer (AAS). The results revealed
that the level of pollution varied greatly with sampling sites and season, and that the water quality was fairly
acceptable at sampling site A and became grossly impaired at the two other sampling sites (B and C), indicating
significant pollution from nearby Agricultural, Industrial and domestic premises. Statistically, virtually all the
physical, chemical and heavy metal parameters analyzed were found to be significant when compared with the control water sample from sampling site A. Also, there were series of deviations in the obtained values from
World Health Organization,National Industrial Standard and National Environmental Standards and
Regulations Enforcement Agency’s standards. Therefore, the results suggested that the water in the river was
polluted and not good for human consumption. It is then, recommended that the careless disposal of such
contaminants should be discouraged with strict enforcement of existing legislation and, vigilance.
Key words:Industrial Effluent, Human Consumption, Heavy Metals, Water Quality, Water, Physico-chemical,
Pollution, Asa River, Anthropogenic, Nigeria.
I. Introduction
Asa River is a major river that almost divides Ilorin city into two halves. The river has a total surface area of about 303 hectares (Olayemi, 1994; Eleta et al., 2005). This river is highly prone to contamination due to
its proximity to industrial congestion which makes the river to be exposed to abuse, such as effluent receptacle
leading to contamination. Regularly, it receives wastes from industries located along its course apart from
domestic wastes and other activities carried out along it that contributes to its pollution. Despite the fact that the
river is not good aesthetically, rapid growth of water hyacinth could be observed downstream of the effluent
discharge point. It is also noticed that people living along the course of the river use the water for some domestic
chores including drinking, nursing vegetables, washing cars and other home utilities, when portable water is not
readily available.
Anthropogenic influences (urban, industrial and agricultural activities, increasing consumption of water
resources) as well as natural processes (such as, changes in precipitation inputs, erosion, weathering of crustal
materials) degrade surface waters and impair their use for drinking, industrial, agricultural, recreational or other purposes (Carpental et al., 1998). Urban streams are common features of contemporary landscapes, and the
effects of urbanization on aquatic/stream ecosystems are complex, with many physical, chemical and biological
consequences (Suren, 2000). Increased impervious surfaces due to development of roads and car parks,
substantially affects urban stream flow regimes, reducing ground water recharge due to lack of precipitation
infiltration, and leads to increasing run off during rainfall (Paul and Meyer, 2001). In addition, urban runoffs can
detrimentally alter stream chemistry, bringing with it suspended sediments such as nitrogen and phosphorus as
well as heavy metals, polycyclic aromatic hydrocarbons (PAH’s), and other pollutants that accumulates during
times of low rainfall on roads and car parks (Beasley and Kneale, 2002). These are some of the ubiquitous
consequences of urban development all of which can ultimately reduce stream health and biological diversity.
Risks of water- borne diseases are therefore a major public health concern in Ilorin city.
The industrial, domestic and agricultural wastes that are discharged into this river contains harmful
chemicals such as heavy metals, oil, settle able solids, nutrients and ammonia which may affect the resident species in receiving water body. In addition, plants and animals inhabiting the water body are not spared as their
normal functioning and population dynamics is affected by pollution. All these effects will go back to man as its
insatiable consumption of fresh water resources remains unending. Thus, man may be facing the physiological
threat. Many people in developing countries like Nigeria do not have easy access to safe and clean drinking

Assessment of the Impact of Industrial Effluent Discharges on the Water Quality of Asa River......
www.iosrjournals.org 81 | Page
water or to adequate amount of water for basic hygiene. In 2004, the World Health Organization reported that
about 1.1 billion people representing 17% of the global population were without safe drinking water. Substantial
number of these people lives in China, India, Africa and Middle East. The report also had it that 42% of Sub-SaharaAfrica lacks drinking water. By the end of 2008, an estimated 884 million people in the world lacked
access to improved sources of drinking water and 2.6 billion people lack access to improved sanitation facilities
(RADWQ, 2010). Forecast has shown that more than 47% of the global population will face severe water
hardship by the year 2030 (Robert, 2008). Despite increasing public sensitization, water pollution continues to
generate unpleasant implication for health and community development. The protection of water quality and
aquatic ecosystem as a vulnerable resource essential sustainable development is of utmost important to prevent
water pollution and degradation of fresh water resources in this region. It is important to continually investigate
the quality of surface water to check the influence of the teaming growing population, urbanization and
industrialization on it. This study therefore is aimed at investigating water qualities in three different sampling
sites along the course of Asa Riverand its tributaries, using different analytical techniques.
II. Materials And Methods
Description of the Study Area
This study involves three water bodies:Asa River (AS) and two of its tributaries known as Okun
Stream (OKS) and Osere Stream (OSS), they are situated in Ilorin, Kwara State, North-Central, Nigeria. These
water bodies are the major source of water supply to the general populace of the area. But recently, the water
bodies were noted to receive effluents Industries and some other domestic units of operations. The three
sampling locations as described in Figure 1 chosen for this work were the same with little modification as those
described by Olayemi et al., (2003) on the observed possibility of heavy metals contamination. Asa River has a
surface area of 302 hectares with a maximum depth of 14m and is located approximately 4km south of Ilorin Township (Adekeye, 2004). The river lies between latitude 80281 and 80521N and longitude 40351 and 40451East.
The river is very significant to the socio-economic growth of Ilorin and supplies the basic water needs of Ilorin
city and its environs after treatment. It also serves as their major source of water for agricultural activities such
as irrigation of farmland and most importantly fishing. The river provides fresh fish to the town and serves as
water source for both industrial and domestic uses (Adekeye, 2004). Major industries in the town are sited along
its bank or its tributaries. The river is also being used for recreational purposes, serving as a tourist attraction
center (particularly the Asa dam).
Three sampling sites (A, B & C) were selected in this study in relation to the industrial, agricultural and
domestic effluents that enter the stream (Figure 1; Plates 1- 3). Site A (SP1) is upstream popularly called Osere
stream which is about 1.5km from the effluent discharge point (point B). It receives refuse and sewage from
homes, cassava processing units and run-offs from agricultural and poultry farms. Site B (SP2) is midstream at
which soap and detergent, flour mills and pharmaceutical effluents are discharge along Okun stream. It also receives run-off water from agricultural, poultry farms lands, cassava processing units and refuse dumps from
homes including laundering activities. Site C (SP3) is the downstream about 1km from the point of discharged
(that is sampling Point B). The stream receives effluents from some soft drinks plants (CocaCola and 7up),
cassava processing units, agricultural, poultry wastes, and run-offs from diffuse sources. Therefore, the choice
of the afore-mentioned sampling points was based on the accessibility, the rate at which they receives effluents
from different sources, the extent of their pollution and their distances from the industrial premises.

Assessment of the Impact of Industrial Effluent Discharges on the Water Quality of Asa River......
www.iosrjournals.org 82 | Page
GAMBARI
B.ALUKO
ADEWOLE
UNIVERSITY
(MINI CAMPUS)
OLOYE
R.ABATA
ROAD F
ROM IB
ADAN
G R A
U B APOLICE STATION
R.ODOTA
ODOTA
ASA
DAM
TATE AND LYLE
MATCHO
R.AGBA
AGBA
DAM
GAA AKANBI
R.ATIKEKE
COCA
COLA
PEPSI-
MAP OF NIGERIA
SHOWING ILORIN
ILORIN
8°30'N
8°26'N
4°35'N
RO
AD T
O K
ADUNA
NIGERIA RIVER BASIN
HEADQUATERS
8°30'N
8°26'N
4°35'N
1 0 1 2 KmSCALE
SP2
SP1
FSP1
FSP2
SP3
COCA-COLA
PEPSI-COLA
DEPOT
OKUN RIVER
ROADS RIVERS DAMS
N
OSE
RE R
IVER
AA
SA
RIV
ER
AABA DAM ROAD
TUYIL
PHARMACEUTICALS
DANGOTE
FLOUR
INDUSTRY
VITAFOAM
INDUSTRY
DOYIN SOAP
AND
DETERGENT
SP1 SP2 SP3 FSP1Sample Point A Sample Point B Sample Point C Fish Sampling
Point A (upstream)FSP2 Fish Sampling
Point B
(downstream)
LOCATIONS
BRIDGE
UNITY AREA
Figure 1: Map Showing Asa River and all the Sampling Sites
Plate 1: The plate showing Water and Sediment Sampling SiteA; Plate 2: The plate showing Water and
Sediment Sampling Site B; Plate 3: The plate showing Water and Sediment Sampling Site C

Assessment of the Impact of Industrial Effluent Discharges on the Water Quality of Asa River......
www.iosrjournals.org 83 | Page
Sample Collection and Analyses
Water samples were collected from three sampling sites at various distances from the source of waste
discharge over a twenty four month period. The polyethylene bottles used for sample collection were washed, rinsed with dilute nitric acid solution, and rinsed two to three times with some of the water been sampled.
Composite samples were prepared and analyzed for some cations and anions. Results obtained were statistically
analyzed and compared with recommended standards. Samples were refrigerated prior to analyses; Atomic
Absorptive Spectrophotometer (AAS) was used for cations determination, gravimetric method was used to
evaluate SO4 2+ levels, spectrophotometry method was used to determine PO4
3+ and NO3 while argentiometric
titration was used to determine the Cl- in the water samples.
The pH was determined using a pH meter (model E512). 50ml of water samples from the three
sampling points were transferred into a beaker for pH measurements. The pH meter was standardized by buffer
of pH 7 and 9 just before use, each time it was engaged in pH determinations (A.P.H.A, 1985). The Dissolved
Oxygen was determined by the method of A.P.H.A (1985). Water samples were collected in 300ml reagent
bottles. Two milliliters (2ml) each of manganese sulphate solution and alkali iodide-oxide solution were added to each sample below the surface and the bottles were stoppered carefully to prevent air bubbles. The content of
the bottle was mixed by rapidly inverting it twenty times. The bottle was allowed to stand until a precipitate
settles to the bottom half of the bottle. This was mixed again by inverting the bottle several times and the
precipitate allowed settling. Two milliliters (2ml) of concentrated sulphuric acid was added. The bottle was
stoppered and inverted several times to dissolve the precipitate. One hundred milliliters (100ml) of the resulting
solution was measured into a 250ml conical flask and titrated with standard sodium thiosulphate solution to a
pale straw color. Eight drops of starch indicator solution were added to the solution and titrated until the blue
color disappeared. The volume of the thiosulphate used was recorded. The dissolved oxygen content was
calculated using the formula of Boyd (1981) i.e.
100
(1000) (8) N titrant (ml )(mglOxygen Dissolved 1-
Electrical Conductivity of the samples was determined by measuring 50ml into a beaker for
conductivity measurements. This was achieved with a conductometer (model cm 25) that had been previously
standardized by dipping the electrode into distilled water. (WHO, 1988).Biological Oxygen Demand (BOD)was
determined in order to measure the dissolved oxygen consumed by microorganisms. Two reagent bottles were
used for the BOD analysis. 250cm3 of distilled water was measured and 250cm3 of the water samples were
poured into each reagent bottle and titrated with 10ml of 1.4ml tetra oxosulphate (vi) acid and 10ml of 0.1
potassium permanganate was also added. The solutions were incubated for 5 days after which they were titrated
with 0.0125M sodium thioshuphate solution with starch as indicator (WHO, 1988).Total Suspended Solids
(TSS) was analyzed by placing a Pre weighed filter paper on a holder and washed with distilled water. 100ml of
each water sample were filtered and dried through the filter papers. The filter papers were subsequently dried to constant weight for one hour at 1050C. They were then cooled in a desiccator and weighed (WHO 1988). The
TSS values were calculated using the formula:
fittered sample of Volume
paperfitter on solids of Mass )(mgl TSS 1-
Nitrate (N03) was determined by measuring ten millimeters (10ml) of water samples from each sampling site
into Nessler tubes. 10ml of distilled water was also measured into another Nessler tubes and 0.5ml of brucine
and 10ml of concentrated H2SO4 were then added to each tube. Drops of potassium nitrate was later added to
the Nessler tubes with distilled water until its colour match with the colour of the water samples in the Nessler
tube (WHO 1988). The concentration of nitrate was then calculated as:
sample of ml
1000 .10 KNO of ml )(mgl NO 31-
3
Chloride was determined usingArgentometric method in which the water sample is titrated against
standard AgNo3 titrant was used for the estimation of chloride. A 25 ml well mixed water sample was diluted to
50ml with distilled water to which was added same volume of 0.02 N H2SO4, followed by 2 to 4 drops of
potassium chromate (K2CrO4) which changed the colorto a pinkish yellow. Amount of chloride present was
calculated from the amount of silver nitrate used as a titrant.Sulphate: To 2 ml of sample, the same volume of
0.02 N HCl solution was added that was equal to the volume of 0.02 N H2SO4 used, followed by 5ml 0.02M
BaCl2 while boiling. The mixture was cooled to room temperature, to which was then added 1ml 0.02 M Mg Cl2
+2 to 4ml ammonia-amonium chloride buffer pH 10(67.5g NH4Cl in 570ml concentrated NH4OH and diluted to
1 litre) and a few drops of eriochrome Blank – T (EBT) indicator and titrated against 0.01M EDTA until color changed from red to violet blue.Blank containing only 25ml distilled water instead of sample without adding
HCl was also titrated against EDTA. Well-mixed water sample (25ml) was diluted to 50ml with distilled water

Assessment of the Impact of Industrial Effluent Discharges on the Water Quality of Asa River......
www.iosrjournals.org 84 | Page
to which was added 2-4ml of KOH buffer pH 12.5 [20%(w/u) KOH solution] and 0.2g of murexide indicator
(0.2g of murexide per 100g of NaCl). The resultant reddish color solution in the flask was titrated against 0.01M
EDTA with continuous stirring until the reddish colour changed to bluish purple (violet).Magnesium Hardness:Well-mixed water sample (25ml) was diluted to 50ml with distilled water in a flask. To this flask, 2 to
4ml buffer pH (1067.5g NH4Cl in 570ml concentrated NH4OA and diluted to 1 litre), and 2 to 3 drops of
eriochrome black – T 10.5g sodium salt of 1-(1-hydroxy-2-naphthy lazo)-5-nitro-2-naphthanol-4-sulfonic acid
dye in 100g triethanolamine indicator were added and slowly titrated against 0.01M EDTA with continuous
stirring until the last reddish color changed to bluish purple.
Heavy Metal Analysis
Heavy metals like lead, zinc, magnesium, manganese, copper, cadmium and arsenic were determined
in both water. 100ml of water sample was measured into a 250 ml volumetric flask was acidified with 5ml of
HNO3 (55%) and evaporated on hot plate to about 20ml. 5ml additional HNO3 (55%), 10ml perchloric acid
(70%) and a few glass heads were added to prevent bumping. The mixture was evaporated until brown fumes change into dense white fumes of perchloric acid (HCLO4). The sample were removed from the hot plate,
cooled to room temperature and diluted to 100ml with distilled water in a 100ml volumetric flask. The solution
was then aspirated into flame atomic absorption spectrophotometer (AAS) for the determination of heavy
metals.
Data collected were collated and analyzed using descriptive statistics (mean standard error and
percentage). Level of significance of differences in the values of the parameters was assessed using student’s t-
test. Variability in the data was evaluated using the co-efficient of variation and the F ratio test. Analysis of
variance (ANOVA) and Duncan multiple range test as well as bar charts using SPSS statistical package 17.0,
2007 were used in the comparison of data – where values of P < 0.05 were considered significant and graphs
were plotted using Microsoft Excel 2007.
III. Results And Discussion
Water Analyses
Water samples from Oseere Stream (site A), Okun River (site B) and Asa River (site C) were analyzed
and compared statistically among the three sampling sites and also with the World Health Organization (WHO),
National Environmental Standards and Regulations Enforcement Agency (NESREA) and National Industrial
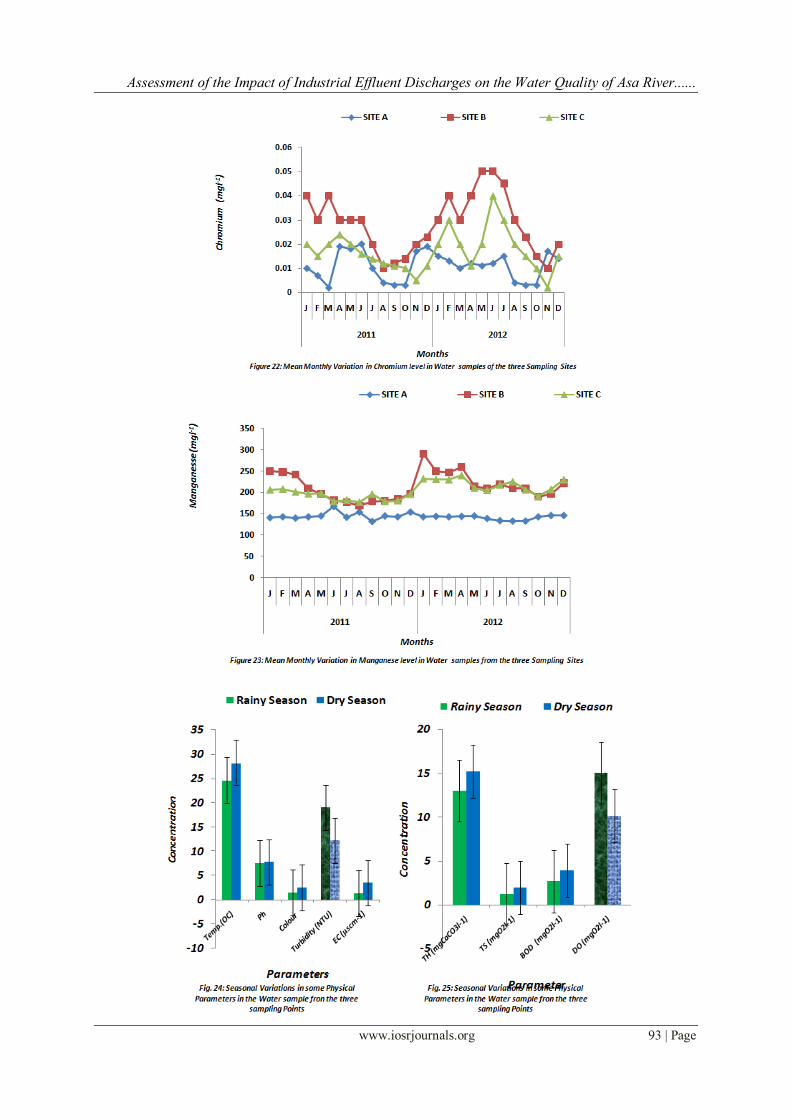
Standards (NIS). Water samples were collected during rainy (April to September) and dry (October to March)
season. The samples collected were analyzed for various physical, chemical and heavy metals parameters to
determine the extent of pollution in the area. The studied physical and chemical parameters analyzed includes
water temperature, pH, dissolved oxygen (DO), electrical conductivity (EC), turbidity, total solids (TS),
Biological Oxygen Demand (BOD), total hardness, calcium hardness, magnesium hardness, sodium, chloride, nitrate, sulphate and manganese. Among heavy metals analyzed are Chromium (Cr3+), Zinc (Zn2+), Nickel
(Ni2+), Copper (Cu2+), Lead (Pb2+), Iron (Fe), Cadmium (Cd) and Mercury (Ag).
Water samples from the three sampling sites were analyzed and the results of the mean monthly values
of each of the parameters are presented in Table 1 and figures 2 to 25 for physical, chemical and heavy
metals: The water samples at site A had temperature range of 20.450C – 28.200C with a mean value of
25.040.110C, site B had a range of 24.700C – 31.550C with a mean value of 30.130.090C; while site C had a
range of 26.200C and 30.000C with a mean value of 28.600.080C. The mean temperature for rainy and dry
seasons were between 28.220.96 – 24.600.21 respectively. The Hydrogen ion concentration (pH) of the water
samples from all the three sampling sites was in the range of 6.30 – 7.70 with a mean value of 7.130.01 for site
A, site B recorded a range of 7.20 – 8.51 and mean of 7.920.06 and sites C had a range of 7.25 – 7.80 having a
mean value of 7.560.05. Mean values of 7.300.06 and 7.500.10 were recorded in the dry and rainy seasons
respectively. Color ranged between the value of 1.71 – 2.52pt.co with a mean value of 2.022.19 for site A; 1.22
– 2.46pt.co with a mean value of 2.082.14 for site B, while site C had between 1.85 – 2.00pt.co with a mean
value of 2.032.00, having a mean value of 2.500.82 for dry season and 1.550.02 for rainy season.
Turbidity had between the value of 11.95 – 15.95NTU with a mean value of 14.210.40; 18.00 –
22.30NTU with a mean value of 19.950.20 for sites B while site C had 15.40 – 18.70NTU with a mean value
of 17.150.62; dry season recorded 18.961.01 and 12.220.01 for rainy season. Electrical conductivity had
between 1.50 – 1.55μscm-1 with a mean value of 1.524.01 for site A; 2.04 – 2.40μscm-1 with a mean value of
2.195.51 for site B and 1.45 – 2.15μscm-1
with a mean value of 2.013.95 for site C; dry season had 3.510.25
and rainy season had 1.350.88. Total hardness had between 11.29 – 15.46mgCaCO3l-1 with a mean value of
14.560.98 for sampling site A; site B had 57.40 – 74.35mgCaCO3l-1 with a mean value of 67.120.58 and site
C ranged between 58.05 – 73.60mgCaCO3l-1 with a mean value of 65.710.97 while dry season had a mean
value of 15.210.01 and rainy season with 13.000.21.

Assessment of the Impact of Industrial Effluent Discharges on the Water Quality of Asa River......
www.iosrjournals.org 85 | Page
Amongst chemical parameters analyzed for the three sampling points are; Total solid which recorded
values between the range of 1.30 – 1.60mgO2l-1 with a mean value of 1.375.00 for site A; 1.31 – 1.59mgO2l
-1
with a mean value of 1414.21 for site B; 1.31 – 2.50mgO2l-1 with a mean value of 1.440.92 for site C; while
dry season recorded 1.960.00 and rainy season with 1.210.01. Biological Oxygen Demand (BOD) had 2.50 –
3.55mgO2l-1 with a mean value of 3.030.06 for site A; 5.50 – 7.60mgO2l
-1 with mean value of 6.770.17 for
site B; 4.60 – 7.20 mgO2l-1 with mean value of 5.660.68 for site C while the dry season value was 3.910.02
and 2.660.05 for rainy season. Dissolved Oxygen (DO) had 11.00 – 16.50mgO2l-1 with a mean value of
13.670.50 for site A; 9.00 – 11.50mgO2l-1 with a mean value of 9.460.61 for site B; 8.50 – 10.50mgO2l
-1 with
a mean value of 9.540.41 for site C while the mean value of obtained for dry season and rainy season were
15.100.02 and 10.010.02 respectively. Sulphate ranged from 11.15 – 14.40mgl-1 with a mean value of
12.950.10 for site A; 14.15 – 21.75mgl-1 with a mean value of 20.170.19 for site B; 17.30 – 18.65mgl-1 with
mean value of 18.090.21 for site C while 15.050.26 and 12.020.01 were recorded for rainy and dry season
respectively. Nitrate values for site A ranged from 1.20 – 1.85mgl-1 with a mean value of 1.490.21; site B had
between 2.01 – 3.01mgl-1 with a mean value of 2.680.28; site C had between 2.03 – 2.71mgl-1 with a mean
value of 2.410.11 while mean values of 2.551.01 and 1.350.00 was obtained for rainy and dry seasons
respectively. Chloride value of between 9.56 – 11.71mgl-1 with a mean value of 10.830.54 for site A; site B
had between 12.68 – 15.98mgl-1 with a mean value of 14.761.17; site C had between 10.56 – 14.15mgl-1 with a
mean value of 12.460.96 while both rainy and dry season had 11.582.25 and 9.010.06 respectively. Sodium
ranged between the value of 2.40 and 3.65mgl-1 with a mean values of 2.940.30 for site A; 13.15 – 15.40mgl-1
with a mean value of 14.600.25 for site B; 5.45 – 8.20mgl-1 with a mean value of 7.130.05 for site C; while
dry and rainy season had 3.520.11 and 2.400.96 respectively. Calcium had between the values of 17.11 –
21.10mgl-1 with a mean value of 19.510.51 for site A; 25.50 – 37.50mgl-1 with a mean value of 31.610.66 for
site B; 21.57 – 26.36mgl-1 with a mean value of 22.881.11 for site C; while dry and rainy season had between
the values of 24.100.01 and 21.000.21 respectively. Heavy metals at the three sampling stations showed varied degree of concentrations; Lead had 0.01 –
0.02mgl-1 with a mean value of 0.010.00 for site A; 0.01 – 0.04mgl-1 with a mean value of 0.020.01 for site B;
0.01 – 0.02mgl-1 with a mean value of 0.010.00 for site C while dry and rainy seasons have the mean values of
2.211.21 and 1.010.20 respectively. Copper had between 0.46 – 0.73mgl-1 with a mean value of 0.660.01
for site A; 1.02 – 1.58mgl-1 with a mean value of 1.360.04 for site B; 0.98 – 1.95mgl-1 with a mean value of
1.210.00 for sampling site C while dry and rainy season had between the mean value of 2.010.01 and
0.210.00 respectively. Zinc is the next with average values between 0.01 – 0.02mgl-1 with a mean value of
0.010.00 for site A; 0.01 – 0.03mgl-1 with an average mean value of 0.020.01 for site B; 0.01 – 0.02mgl-1 with
a mean value of 0.020.01 for site C while both dry and rainy season had the values of 0.050.22 and 0.030.01
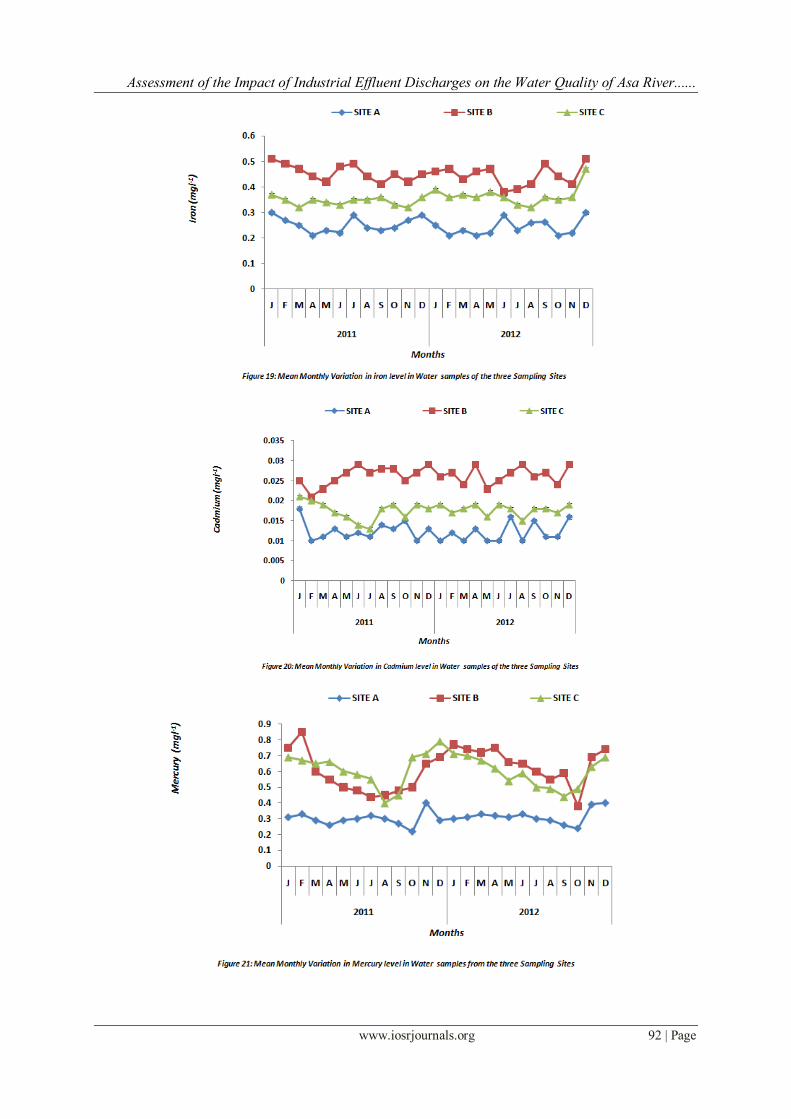
respectively. Iron had between 0.31 – 0.63mgl-1 with a mean value of 0.310.04 for site A; 0.46 – 0.75mgl-1
with a mean value of 0.610.02 for site B; 0.40 – 0.74mgl-1 with a mean value of 0.630.03 for site C while dry
season had a mean value of 5.050.05 and rainy season had 3.012.01. Cadmium ranged between 0.21 –
0.28mgl-1 with a mean value of 0.220.01 for site A; 0.15 – 0.59mgl-1 with a mean value of 0.450.03 for site B;
0.15 – 0.30mgl-1
with a mean value of 0.200.00 for site C while dry and rainy season had a mean value each of
0.261.21 and 0.110.10 respectively. Mercury had between the values of 0.01 – 0.02mgl-1 with a mean value
of 0.010.00 for site A; 0.01 – 0.08mgl-1 with a mean value of 0.050.02 for site B; 0.01 – 0.06mgl-1 with a
mean value of 0.030.01 for site C while 2.110.01 and 1.010.00 was obtained for dry and rainy season
respectively. Chromium had between 0.01 – 0.05mgl-1 with a mean value of 0.050.02 for site A; 0.03 –
0.09mgl-1 with a mean value of 0.080.11 for site B; 0.01-0.06mgl-1 with a mean value of 0.720.00 for site C
while both dry and rainy season had a mean value each of 5.010.55 and 2.110.11. Manganese had between
the values of 0.21 – 0.25mgl-1 with a mean value of 0.250.01 for site A; 0.26 – 0.63mgl-1 with a mean value of
0.480.00 for site B; 0.34 – 0.54mgl-1 for site C with a mean value of 0.340.03 while both dry and rainy season
had the mean values of 1.660.01 and 1.010.00 respectively. Statistically, all the physical, chemical and heavy metal parameters were found significant when
compared with the control water sample (sample from sampling sites A). Also, series of deviation in values
from World Health Organization (WHO), NIS (National Industrial Standard) and (NESREA) National
Environmental Standards and Regulations Enforcement Agency’s standard was observed; temperature, pH,
turbidity, electrical conductivity, total hardness, BOD, sulphate, nitrate, sodium, calcium, Magnesium,
Manganese, Iron and Cadmium were found within the permissible limit for effluent discharge into all categories
of water while total solids, Dissolved oxygen, chloride, Lead, Copper, Zinc, Mercury and Chromium were found
to exceed FEPA, (1999) standard (Table 1).

Assessment of the Impact of Industrial Effluent Discharges on the Water Quality of Asa River......
www.iosrjournals.org 86 | Page
Table 1: Mean Values Of Physicochemical Characteristics And Heavy MetalConcentrations Of Water
Samples From The Sampling Sites(April, 2011 to March, 2013)
*Mean of parameter in the same row having different superscripts is significantly different (P 0.05)
EC: Electrical Conductivity BOD: Biological Oxygen Demand
DO: Dissolved Oxygen WHO: World Health Organisation
NIS: Nationa Industrial Standard

Assessment of the Impact of Industrial Effluent Discharges on the Water Quality of Asa River......
www.iosrjournals.org 87 | Page

Assessment of the Impact of Industrial Effluent Discharges on the Water Quality of Asa River......
www.iosrjournals.org 88 | Page

Assessment of the Impact of Industrial Effluent Discharges on the Water Quality of Asa River......
www.iosrjournals.org 89 | Page

Assessment of the Impact of Industrial Effluent Discharges on the Water Quality of Asa River......
www.iosrjournals.org 90 | Page

Assessment of the Impact of Industrial Effluent Discharges on the Water Quality of Asa River......
www.iosrjournals.org 91 | Page
Assessment of the Impact of Industrial Effluent Discharges on the Water Quality of Asa River......
www.iosrjournals.org 92 | Page
Assessment of the Impact of Industrial Effluent Discharges on the Water Quality of Asa River......
www.iosrjournals.org 93 | Page

Assessment of the Impact of Industrial Effluent Discharges on the Water Quality of Asa River......
www.iosrjournals.org 94 | Page
IV. Discussion
Physical and Chemical Parameter in Water
The physical and chemical parameters investigated in this work have been widely used to assess the
water quality of African lakes, ponds, reservoir, freshwater and marine waters (Nhiwatiwa and Marshall, 2007).
These parameters along the stretch of Asa River revealed different level of variations across the three sampling
sites and as well as within the two seasons of the sampling years. Higher values were mostly encountered at
sites B and during the dry season of the sampling periods. The temperature recorded in sampling sites A, B & C
was in the order of 25.04 0C, 30.130C and 28.600C respectively, with an average value of 28.220C and 24.600C
for dry and rainy seasons respectively. The temperature values varied significantly in the two seasons and
between the three sampling sites. High temperature was recorded in the months of November, December,
January and February which coincided with the period of dry season. Significantly high (P<0.05) temperature
recorded at sampling sites B and C were found to be seasonal dependent. The low values obtained in the months of June, July, August and September (which is the months that corresponded with late rainy season) could be
attributed to the cooling and diluting effects of the rain water. The average temperature values for all the three
sampling sites were <400C depicting temperature range that is supportive of good surface water quality (NIS,
2007; WHO, 2011).
Generally, the variation in water temperature obtained in this work is a direct reflection of low depth of
the water bodies and the irregular slow movement which does not ensured a complete mixing of the entire water
phase. This observation agreed with the submission of Ajao, (1990) and on the temperature profile of Lagos
Lagoon. This is also in line with the temperature range of 24.50C to 31.50C reported by Eleta et al., (2005) from
Asa River. There were significant differences between the three values obtained for the three sampling sites and
between the two seasons of the year.
The pH values are expressed as the negative logarithm of hydrogen ion concentration. For acidic water, pH varies from 0 t0 7 and for alkaline water pH varies from 7 to 14. It determines the solubility of chemical
nature of most of substances. Medium values are favorable for biological production. The pH values recorded in
this work are indicative of good water quality which was within the acceptable limits (NIS, 2007; WHO, 2011).
The high values of pH (7.92±0.06 and 7.56±0.05) recorded at sampling sites B and C respectively could have
been due to the influx of industrial effluent and the synergistic effects of these effluents on the water bodies. A
slight alkaline pH value recorded may be due to the alkaline treatment given to the effluents before discharging
into the river (Amao, 1998). Eleta et al., (2005), that influx of effluent in alkaline form into water could affect
the pH. The fluctuations observed in the surface pH indicated the buffering capacity of total alkalinity, high
water volume, greater water retentions and good buffering capacity of total alkalinity may have been the reason
why pH was in neutral or moderate alkaline medium during the rainy season and for most part of this study.
Using the pH as a water quality index, Asa River and its tributaries has good water quality with the mean pH of
7.13, 7.92 and 7.56 for point A, B & C respectively; since most natural waters have pH between 6.5 and 8.5 (Tepe et al., 2005) and such pH values will also allow the survival of aquatic organisms and its use as drinking
water. In this present situation, the maximum pH of 7.80 ± 0.06 was recorded in the dry season and this may be
linked to the decreased volume of water by evaporation; the minimum value of 7.50 ± 0.10 obtained during the
rainy season may be attributed to shorter day length and decrease in photosynthetic activity (Salve and Hiware,
2006).
The water samples from the three sampling sites were more turbid by physical examination with 14.21
TNU, 19.95 TNU and 17.15TNU recorded for sites A, B & C respectively. Sampling site B has the highest
value followed by site C while site A has the minimum value. The highest value recorded by sampling site B
may be linked with the land use within these steep areas dominated by intensive small scale farming activities
where majorly food crops and vegetables are grown. The same area occur in the flood plains with very high
human and livestock population density coupled will heavy industrial effluent discharges at sampling site B which flows down to Site C. Conductivity is a numerical expression of the ability of water to carry on electric
current, which in ionic strength as conductivity is a measure of total ions. The ionic strength of a sample
depends on the ionization of solutes and other substances dissolved in it. The electrical conductivity of the three
sampling sites in this work was found to be statistically high at the point of discharge (Site B) of industrial
effluents to downstream (Site C) compared to upstream (Site A). Sampling site A which is less impacted sub-
catchments had lower concentrations as compared to stations located in areas with high human activities like
agricultural practices and industrial activities (Sites B and C). Low electrical conductivity experienced at site A
might be responsible for soft nature of the water; while high conductivities may be due to high aggregation of
total solids recorded in Sites B and C and this observation conformed with the report of Mustapha (2008) and
Adewoye, (2007) on Oyun River and Asa River respectively. Asa River and its tributaries can be classified to be
soft waters based on the range of mean total hardness (11.29 – 15.46mgCaCO3-1) recorded which fell within the
NESREA, (2007) hardness scale classification for soft waters. This range will support aquatic fauna and is ideal for drinking water supply (APHA, 1995). This result is in contrary to the findings of Adewoye, (2007) who

Assessment of the Impact of Industrial Effluent Discharges on the Water Quality of Asa River......
www.iosrjournals.org 95 | Page
recorded 87.61 and 130.94. The influx of industrial, domestic and agricultural discharges into sites B and C may
be traced to high total hardness recorded in these two sites. Seasonal variation in the conductivity may be due to
the increased concentration of salts because of discharge of domestic effluents and organic matter from the nearby residential areas into the water bodies. High level of conductivity reflects the pollution status as well as
tropic levels of the aquatic body (Anitha, 2002). In this present work, high value of conductivity was recorded in
the dry season and low during the rainy season; Chandrashekhar and Kodarkar, (1996) also reported similar
observations in Saroonagar Lake, Hygerabad.
Total suspended solids are the cause of suspended particles into the water body, it influences turbidity
and transparency. The high value of total solids recorded in sampling sites B and C in the dry season compared
to that of rainy season may be attributed to low volume of water experienced during the dry season while the
dilutions of ionic substances as a result of large volume of water in the area could be the main reasons for lower
level of total solids encountered in the rainy season. Also, high value of total solids observed in sites B and C
during the dry season, could also be as a result of influx of effluents from industrial premises, thereby bringing
about increase in the level of conducting ions, electrical conductivities and turbidity of the affected water bodies. It could also be due to siltation, deterioration and heavy precipitation. These observations’ agreed with
the findings of Fagade et al., (1993) on River Ogunpa and Ona; Rabaru and Okeyo –Owuor, (2002) on River
Nyando, Lake Victoria Basin in Kenya, and Ayoola and Kuton, (2009) on Lagos Lagoon in Nigeria. The level
of total solids were higher at sites B down to C during dry season compared to low value for rainy season, this is
in agreement with the observation of Ajao (1990) that effluents can introduce some reaction which precipitate
more solid in the solution, leading to high total solids which can decrease downstream due to natural filtration.
This situation observed in this work also conformed to the submission of Khabade et al., (2002) which
submitted maximum suspended solids in monsoom, moderate in summer and minimum in winter.
The high BOD recorded in sites B and C in the dry season could be as a results of accumulation
patterns of organic materials due to continuous influx of industrial effluents into the water bodies which may
eventually results in reduction of oxygen content; this observation conformed with the reports of Manson,
(1991), Rabaru and Okeyo –Owuor, (2002), Ayoola and Kuton, (2009), and that when organic matter is abnormally high in an aquatic phase, the biological oxygen demand level reduces and this may eventually
disrupt the behavioural responses of the organisms and reduces the fitness of a natural population of fish. The
BOD pattern observed in this work indicate considerable level of nutrients and this conforms with the report of
Van Note et al., (1980) that rivers with high BOD have high nutrient levels in the water where organisms
consumes most of the oxygen. Naturally, unpolluted waters will have BOD of small or less and this negates
what was obtained in this work where sites B and C had 6.77 ± 0.17mgl-1 and 5.66 ± 0.69mgl-1 respectively.
High amount of BOD recorded during the rainy season can be attributed to increased effect of surface run-off,
soil erosion and effluents discharges into these receiving water bodies and this conforms, considerably to the
submission of Oyewo, et al., (1999).
The dissolved oxygen observed in this study was higher than the 6.0 recommended level by NESREA,
2007; NIS, 2007. Oyewo, et al., (1999) also reported that the desired range for the culture of warm water fish is 5mgl-1 and above but not more than 12mgl-1. Lower value of DO was also obtained for dry season in this work,
and this may be due to low level of dilution rate and water volume during dry season with little self-purification
process of the pollutants. The DO level obtained for sites B and C fell below the 10mgO2l-1 recommended for
unpolluted waters (WHO, 1988), but far greater than 6.0 recommended value documented by NIS, 2007 and
WHO, 2011. The continuous influx of industrial discharge into the water might likely support the growth of
aquatic weeds and formation of flocks on the surface of the water, hence a reduction in the dissolution of
oxygen into water. Morrison et al., (2001) however stressed that the depletion of dissolved oxygen in a water
body could be due to common practice of dumping of wastes into such water body. Sulphate is the most
abundant form of sulphur, which exist as anion sulphate. Sulphate is ecologically important for growth of plants
and its short supply may inhibit the development of plankton. Sulphur is also very important in protein
metabolism. Nitrogen is less soluble in water than oxygen. But as it constitutes 78% of the atmosphere, it still
account for 65% of the dissolved gases at equilibrium. Nitrogen is important as it is a necessary element in the structure of protein, chlorophyll, RNA and DNA and so on. It is essentially required by all living organisms,
being a necessary element of biochemical substances.
There was a marked seasonal variation on the nutrients level of the sampling sites with the lowest value
at sampling site A while sites B and C had higher values while dry and rainy seasons recorded lower and higher
values respectively. The high concentrations of sulphate nitrate and chloride could have resulted from leaching
and run-off of sulphate fertilizers from nearby farm lands and sulphate rich effluents from nearby industrial
premises. The concentrations of these ions were higher during the rainy season, because the period is usually the
peak of agricultural activities around the river area. Probably, this could also have resulted from washing of
Pens, cow dung, bathing and washing of cars and home appliances with phosphate based detergents and soaps
into the water, which could have also caused the high level concentrations of these ions. These events can lead

Assessment of the Impact of Industrial Effluent Discharges on the Water Quality of Asa River......
www.iosrjournals.org 96 | Page
to eutrophication of the water bodies with subsequent bloom in algae and changes to water quality. Carpenter et
al., (1998) and Carignan et al., (2000) reported that non-point source of nutrient inputs from watershed are
leading cause of eutrophication and water quality problems while Armengol et al., (1999) implicated sulphate in the eutrophication of water bodies. Eutrophication was more pronounced in both sites B and C probably due to
its shallowness Ekholm et al., (1997) and this could affect water quality by giving rise to unpleasant taste, odor
and color, and affects the dissolution of other gases, most especially dissolved oxygen as a result of algae
bloom. It could also pose a threat to fish population in rivers, because it may destroy food web, decrease
biodiversity at higher trophic level (Hanson and Butler, 1994) leads to disappearance of population and induces
changes in yield and species composition (Miranda, 2008). In any Fresh water where calcium is the dominating
cation (Golterman and Koowe, 1980), the ionic composition of the such water usually exhibit variations in the
values obtained for sodium and calcium hardness, and this may be attributed to chemical denudation due to
dilution from heavy rain coupled with the rivers circulation and weathering from rock, and run-offs from
surrounding water shed. An irregular pattern of sodium and calcium hardness recorded in this work might be
traced to heavy down pour of rain resulting in flood, which might have contained a high concentration of magnesium and this could be the reason for the significant difference in the concentration of ion between the
two seasons. Then, the presence of this ion in moderate levels classified the sampling sites B and C as eutrophic
which will support diverse plant and animal life including fish; except for the additive effects of such ions,
physical parameters and heavy metals that may limit their population. According to Adeniyi and Yusuf (2007)
waters with calcium levels of < 10 mg-1 are usually oligotrophic, while those above 20 mg-1 are said to be
eutrophic and this is a reflection of what was observed in this work, that both sampling sites B and C could be
said to be Eutrophic while site A could be regarded as oligotrophic. A trend that could be traced to the rate of
influx of effluents into each segment of the river.
Heavy Metal Concentrations in the Water Samples
Asa River and its tributaries were exposed to heavy metals containing contaminating materials, capable
of initiating the impairment of the water quality. This present investigations has revealed the concentrations of certain heavy metals such as Pb, Cu, Zn, Fe, Cd, Hg, Cr and Mn which were generally high in sampling site B
followed by site C and A (B > C > A). The values obtained in Table 1 for surface water heavy metal
concentrations could be adduced to anthropogenic activities going on around the sampling sites and because of
its exposure to domestic, agricultural and industrial influences. This is similar to the report of Adeniyi et al.,
(2007) based on their research at Agboyi crack segment near the Lagoon with high surrounding human
population density recorded higher levels of metals in sediment and water samples. Of all the three sampling
sites; sampling site B were noticed to produced high concentration of heavy metal and this may not been
unconnected to continuous discharged of industrial effluents at this point and dense agricultural activities
centered on this portion of the river; Site C is next to B in terms of heavy metals concentration while A had the
lowest. All the heavy metals concentrations obtained in this work were found to be higher than those reported
previously by Eleta et al., (2003); Eletta and Adekola, (2005); Adewoye, (2008). The concentration of Pb in Site B was significantly higher than that of Sites C and A. value obtained
from the sampling site B was also found to be higher than maximum permissible limits of 0.01 mg/L set by
WHO, (2011) and NIS, (2007). This is an indication that lead is ubiquitous in our environment with diverse
pollution source. The same trend was observed in the case of all other heavy metals measured; and, this is in
consonance with the work of Mohd et al., (2007) in their work on heavy metals in meretrixroding, water and
sediments from Estuaries in Sabah, North Borneo. Nevertheless, low level of metals concentrations in surface
water might not necessarily reflect that such areas were pollution free. The additive effects of these heavy
metals among each other and with physical and chemical parameters is capable of forming toxic compounds that
create large surface area for decomposition of such compounds; this process tends to lower the oxygen content
of the water which is enough to lower the population of valuable aquatic faunas and floras. Also, the biotas
living in such areas might have accumulated the metals from water continuously and this situation stand the
chance of disrupting a functioning food chain or web. Of all the metals measured, Pb, Cu, Zn and Hg were found to exceed the permissible limits for any categories of water bodies. Seasonal variations were also
observed in the collated data in this work. Higher values were obtained in the dry season than in the rainy
season. This situation is expected in view of the reduction in the pollution load in the rainy season arising from
increase in dilution and water flow. It is to be noted that the river is at its highest volume and flow in the rainy
season. Generally, water samples from sampling site B and C recorded higher metal values than that of site A
and the cumulative metal contamination is in the order of site B > site C > site A with the metal pollution index
of Cu>Fe>Mn>Hg>Cr>Zn>Pb with respect to sampling site B.
Assessment of the Impact of Industrial Effluent Discharges on the Water Quality of Asa River......
www.iosrjournals.org 97 | Page
V. Conclusions
This study complements previous studies on the impact of industrial, agricultural and domestic
discharges on the limnological parameters of aquatic environment. The study however revealed the following:
The industries, agricultural fields and domestic usages in the vicinity of Asa River discharges their
wastes containing high physical, chemical and heavy metal components into the river, thus raising the level of
these parameters beyond the recommended levels of World Health Organization and National Industrial
Standard’sguidelines. Virtually all the measured parameters still remained higher even in the downstream part of
the river water showing sub-lethal concentrations of contaminants in the water. The volume of these discharges
into Asa River was already overtaxing their capacity for self-purification and the prevailing practice of
unregulated and uncontrolled discharge of such wastes into water bodies constitutes serious abuse and portends
serious danger to the resident species and beneficial use to the municipality. It could be seen in this study that
Asa River water was grossly polluted and the level of pollution decreased downstream and it was much higher during the dry season and relatively lower during the peak of rainy season. These wastes, apart from making the
river water unsightly, it also render the water dangerous to the consumers and caused undesirable effects on the
biotic community, especially the fishes. Therefore, proper treatment is imperative for the river to be appropriate
for portable, domestic and industrial purposes.
Acknowledgement
The authors are thankful to God Almighty for everything. Also our gratitude goes to the entire staffs of
the Nigeria Institute of Science Laboratory Technology, Ibadan for providing laboratory and library facilities for
the realization of this study. Our sincere gratitude equally goes to the entire staff of the Central Research Laboratory,Ladoke Akintola University of Technology, Ogbomoso, Nigeria, for their kind assistance.
References [1]. Adekeye, A. O. (2004): Feasibility report for ECOWAS fund loan for accelerated fish production project. A paper presented at
ministry of Agricultural and natural resources (M.A.N.R), Kwara State Nigeria.
[2]. Adeniyi, A. A. and Yusuf, K.A. (2007): Determination of heavy metals in fish tissues, water and bottom sediments from Epe and
Badagry Lagoons, Lagos, Nigeria. Environ. Monitor. Assess,37: 451-458.
[3]. Adewoye, S. O. (2007). Effects of Detergent Effluents on Asa River and its Toxicity on Juvenile of Clarias Gariepinus. Ph.D
Thesis. University of Ilorin, Nigeria. 274pp.
[4]. Ajoa, E. A. (1990): The influence of domestic and industrial effluents on populations of sessile and benthic organisms in Lagos
lagoon. Ph.D Thesis. University of Ibadan, Nigeria. 413pp.
[5]. Amao, F. T. (1998): “Genealogy and Economic consideration of water pollution” B. Eng. Thesis. Federal University of
Technology, Minna, Nigeria. pp. 1-18.
[6]. Anitha G. (2002): Hydrography in relation to benthic macro invertebrates in Mir Alam Lake Hyderabad, A.P. Indian Ph.D. Thesis
submitted to Osmania University, Hyderabad.
[7]. APHA (1985): American Public Health Association. Standard Methods for the examination of water and waste water 15th
edition. Pp 476.
[8]. Armengol, J., Garcia, J. C., Comerme, M., Romero, M., Dolz, J., Roura, M., Han, B. H., Vidal, A. and Simek, K. (1999):
Longitudinal processes in Canyon type Reservoirs: The case of Sau (N.E. Spain). In: J.G. Tundisi and M. Straskraba
(Eds.), Theoretical Reservoir Ecology and its Applications. IIE, Backhuys Publishers, Brazilian Academy of Science: 313-345.
[9]. Ayoola, S. O. and Kuton, M. P. (2009): Seasonal variation in fish abundance and physico-chemical parameters of Lagos lagoon,
Nigeria. African Journal of Environmental Science & Technology. Vol. 3(5). Pp 149-156.
[10]. Beasley, G. and Kneale, P. (2002): reviewing the impact of metals and PAHs on macroinvertebrates in urban water courses. Prog.
Geog. 26: 236-270.
[11]. Boyd, C. E. (1981): Water quality in warm water fish ponds.Craft masters printers, inc. Opeikaa. Alaba. 369 pp.
[12]. Carignan, R., D’Arcy, P. and Lamonangne, S. (2000): Comparative impacts of fire and forest harvesting on water quality in Boreal
Shield lakes.Canadian Journal of Fish and Aquatic Sciences, 57(2): 105-117.
[13]. Carpenter, S. R. Caaraco, N. F. and Smith, V. H. (1998): Non-point pollution of surface waters with phosphorous and nitrogen.
Ecol. Appl. 8: 559- 568
[14]. Chandrasekhar S. V. A. and Kodarkar M. S. (1996): Biodiversity of zooplankton in saroor nagar lake, Hyderabad. J. Aqua, Biol. ,
9(1and2):30-33.
[15]. Ekholm, P., Malve, O. and Kirkkala, T. (1997): Internal and external loading as regulators of nutrient concentrations in
agriculturally loaded Lake Pyhajarvi (Southwest Finland). Hydrobiologia, 345(1): 3-14.
[16]. Elleta, O. A. A. and Adekola, F. A. (2005): studies of the physical and chemical properties of Asa river water, Kwara State,
Nigeria. Science Focus 10(1) pp 72-76.
[17]. Golterman, H. L. and Kouwe, F. A. (1980): Chemical budgets and nutrients pathways. In: E.D Lecren, and R.H. Lowe
McConnel (Eds.), the functioning of ecosystems. Internet. Biol. Programme 22. Cambridge Univ. Press, London: 85-140.
[18]. Hanson, M. A. and Buttler, M. G. (1994): Responses to food web manipulation in shallow waterfowl lake. Hydrobiologia, 280: 457-
466.
[19]. Khabade, S. K., Mule, M. B. and Sathe, S. S. (2002). Studies on Physicochemical parameters of Lodhe water reservoir
from Tasgaon Teshil (Maharastra): Indian J. Environ and Ecoplan. 6(2):301-304
[20]. Miranda, L. E. (2008): Extending the Scale of Reservoir Management. In: M. Allen and S. Sammons (Eds.). Balancing fisheries
management and water uses for impounded river systems. American Fisheries Society. Bethesda, Maryland, U.S.A (In Press).
[21]. Mohd I. I., Khairul, O., Ong, H. K, Nurhaslina, H., Ezlan, E., Kaswandi, M. A., Ahmad, R. G., Jamaludin, M. and Baharudin, O.
(2007): Accelerating Chrysomya megacephala maggots growth for forensic entomology cases. J. Sains Kesihatan
Malaysia 5: 17-26.

Assessment of the Impact of Industrial Effluent Discharges on the Water Quality of Asa River......
www.iosrjournals.org 98 | Page
[22]. Morrison, G., Fatoki, O. S., Person, L. and Ekberg, A., (2001): Assessment of the impact of Sitesource pollution from the
keiskammahoek sewage treatment plant on the keiskamma River - PH, electrical conductivity, oxygen demanding substance and
nutrients, Water SA, 27(4), 475-480.
[23]. Mustapha1, M. K. (2008): Assessment of the Water Quality of Oyun Reservoir, Offa, Nigeria, Using Selected Physico-Chemical
Parameters Turkish Journal of Fisheries and Aquatic Sciences 8: 309-319 (2008)
[24]. NESREA, (2007): National Environmental Standards and Regulations Enforcement Agency (establishment) act, 2007
[25]. Nhiwatiwa, T. and Marshall, B. E. (2007): Water quality and plankton dynamics in two small dams in Zimbabwe. African Journal
of Aquatic Science, 32(2): 139-151.
[26]. NIS (Nigerian Industrial Standard), (2007): Nigerian Standard for Drinking Water Quality. NIS554:2007, ICS 13.060.20, Approved
by the Standard Organization of Nigeria (SON) Governing Council,pp;14 – 18
[27]. Olayemi A. O., Eniola K. I. T., Awe, S. and Kayode- Ishola, T. M. (2003): Distribution of bacteria in three detergent effluent
polluted water bodies in Ilorin Nigeria NISEB Journal 3 (3): 79- 6.
[28]. Olayemi, A. B. (1994): Bacteriological water assessment of an urban river in Nigeria. Intern. J. Environ. Health Res. 4:156-164.
[29]. Oyewo, E. O. (1999): Industrial Sources and Distribution of Heavy Metals in Lagos Lagoon and Biological Effect on
Estuarine Animals. Ph.D Thesis. University of Ibadan p. 279.
[30]. Paul, M. J. and Meyer, J. L. (2006): Streams in the urban landscape. Annu. Rev. Ecol. Syst. 32: 333-365
[31]. Raburu, P. O. and Okeyo-Owuor, J. B. (2002): Impact of agro-indusrial activities on the water quality of the River Nyando, Lake
Victoria Basin, Kenya. In Odada et al. (eds.) Proceedings of the11th World Lakes Conference. 31st Oct. - 4th Nov. 2005,
Nairobi, Kenya, 2: 307-313.
[32]. RADWQ (2010): Rapid Assessment of Drinking Water Quality in the Federal Republic of Nigeria Country Report 2004-
2005. WHO and UNICEF, 79pp
[33]. Robert, C. (2008): Editor’s Log: Underground Construction Magazine: Oildom Publishing Company. Tx USA. 63:2
[34]. Salve, B. S. and Hiware, C. J. (2006): Studies on water quality of Wanparakalpa Reservoir, Nagapur, near Parli Vaij inath, dist.
Beed, Marathwada reigion. J. Aqua. Biol., 22(1):105-109.
[35]. Suren, A. M. (2000): Effects of Urbanization. In: Collier K. J. Wintenbourn, M. J. (eds) New Zealand and Limnological Society.
Christchurch, New Zealand. pp. 260-288.
[36]. Tepe, Y., Turkmen, A., Mutlu, E. and Ates, A. (2005): Some physico-chemical Characteristics of Yarselli Lake, Turkey. Turkish
Journal of Fisheries and Aquatic Sciences, 5: 35-42.
[37]. WHO (World Health Organization), (2011): Guideline for Drinking Water Quality. 4th edn., NLM Classification: WA 675, World
Health Organization, Geneva, Switzerland, pp:307-433, ISBN: 978 924 1548151.
[38]. WHO, (World Health organization) (1988): International standards for drinking water 3rd
edition. World Health organization,
Geneva.