investigating industrial effluent impacts on …
TRANSCRIPT
INVESTIGATING INDUSTRIAL EFFLUENT IMPACTS ON MUNICIPAL
WASTEWATER TREATMENT PLANT
by
EUNICE CHIZUBE ILOMS
Student no: 50841289
Submitted in accordance with the requirements for the degree of
Master of Science
In the subject
Environmental Science
at the
UNIVERSITY OF SOUTH AFRICA
Supervisor : Dr O. O. Ololade
Co-supervisor : Dr R. Selvarajan
July 2018
ii
DECLARATION I declare that the work presented in this dissertation is to the best of my knowledge
and belief original except as acknowledged in the text and that the material has not
been submitted, either in whole or in part, for a degree at this or other universities. I
also certify that I have complied with the rules, requirements, procedures and policies
of the university.
Candidate : ILOMS EUNICE CHIZUBE
Student Number : 50841289
Signature : …………………….. Date: 2018

iii
ACKNOWLEDGEMENTS My first gratitude goes to God Almighty because of his grace in my life throughout this
period of my studies and the supernatural strength he bestowed on me throughout my
sleepless nights of putting this thesis together.
I wish to acknowledge the support and guidance of my supervisors Dr Olusola Ololade
for her patience and dedication to see that this thesis is a success and my co
supervisor Dr Ramganash Selvaranjan for his assistance throughout my laboratory
work, I pray that God will bless you both.
I want to specially thank my friend Kalu Chimdi Mang whom I no longer see as a friend
but a brother. I believe our coming together was divinely ordained by God. You are
truly God sent and your tireless effort and sleepless night you spent proof reading and
inputting in my work just to make sure that my work is always on per and is well
appreciated. Your labor of love will never be forgotten. Also to my friend Grace Ijoma
who is like a sister to me, who just like Kalu was there throughout to proof read my
proposal and to make sure that it is in order, may God bless you.
I also want to thank my spiritual best friend Lebo Lekotoko and my pastor, Pastor
Simon Okoye, and his family for their prayers, moral, emotional and spiritual support
throughout my research work. Furthermore, I appreciate those who has supported me
in different ways through advice, material provision for my laboratory work, emotional
and moral support especially when I was devastated in the laboratory (Dr Tim Sibanda,
Prof Khaya, Dr Stephen Taylor, Ishmail, Ntabaleng, Mpho. Late Taboga Mathiba,
MaryAnn, Martha Shupping, Ogugua, Ebere,), Brandon my ex learner who helped to
draw my proposal maps.
Also, I will like to acknowledge Dr Fred Kanu for his tireless support especially in my
chapter 4 when it seems all hope was lost. To all those whose names I am unable to
mention, who directly or indirectly has contributed to the success of my research, thank
you. Also to Department of Education District D16 that approved my study leave
through my principal Mr J. Motshitela, thank you all for helping me realised my dream
My thanks also goes to my kids Onyinye, Kosi, Divine, and Favour Iloms. Also to my
older kids Kene Modebelu and Promise Ebuzeme and my sister inlaw Mrs G
Ebuzeme. You are all indeed my joy and pride. Thank you all for being there for me
especially in the most difficult times and for your patience and perseverance
iv
throughout my study. My prayer is that God will help me to repay you all for all the
sacrifices you made throughout the period of my studies. To my mom Mrs Patience
Onyedum and my 4 brother and 4 sisters especially Mrs Peace Modebelu for their
support and prayers, most appreciated.
To my one and only darling and sweetheart Mr Chris Anayo Iloms, you are my
heartbeats, my life line, and a rare gem, my reason for completing this masters
because you stood by me through thick and thin, tough and difficult time. You were
there to support me morally, emotionally, spiritually, financially and otherwise. I truly
lack words to thank you for all your care, comfort and love you have shown me, I will
never be able to pay you back, for you superseded diamond. My prayer is that God
will keep us together till eternity, I love you unconditionally.
I will like to finally acknowledge the fund provider, University of South Africa, under the
Emerging Researchers Support Programme.
Publications
A portion of this work has been presented in an international conference
Iloms E, Ololade O.O, Ramganesh S. 2018. Investigating Industrial Effluent Impacts
on Municipal Wastewater Treatment Plant. In Burke ., Maphanga, R, van Rensburg
J.J, Bogaers A, Das S. Proceedings of the 2018 International Women in Science
Without Borders (WISWB) – Indaba Johannesburg First Edition, ISBN: 978-0-620-
78656-0, pp. 87-88.
https://researchspace.csir.co.za/dspace/bitstream/handle/.../Burke_20974_2018.pdf?

v
DEDICATION This research work is dedicated to God Almighty. I also dedicate it to my husband Mr
Anayo Chris Iloms who stood by me tirelessly throughout this study in all areas and to
my late father Mr. Michael Onyedum who loved education so much and said his joy
will be to see me become a professor.
vi
TABLE OF CONTENT
DECLARATION ........................................................................................................... ii
ACKNOWLEDGEMENTS .......................................................................................... iii
DEDICATION ............................................................................................................. v
TABLE OF CONTENT ................................................................................................ vi
LIST OF ACRONYMS ................................................................................................ x
LIST OF FIGURES ..................................................................................................... xi
LIST OF TABLES ..................................................................................................... xiii
ABSTRACT ............................................................................................................... xv
CHAPTER 1: INTRODUCTION .................................................................................. 1
1.1 Background Information .................................................................................... 1
1.2 Problem Statement ........................................................................................... 3
1.3 Rationale of the Study ....................................................................................... 4
1.4 Significance of Study ........................................................................................ 5
1. 5 Research Questions ........................................................................................ 5
1.6 Aim and Objectives ........................................................................................... 5
1.6.1 Aim ............................................................................................................. 5
1.6.2 Objectives ................................................................................................... 5
1.7 Thesis Outline ................................................................................................... 6
CHAPTER 2: LITERATURE REVIEW ........................................................................ 7
2.1 Introduction ....................................................................................................... 7
2.2 Wastewater Treatment Plant: The Global View ................................................ 8
2.2.1 Wastewater treatment in Africa ................................................................. 13
2.2.2 Wastewater treatment plant: Southern Africa development community .... 16
2.2.3 Wastewater treatment/water quality in the Vaal ........................................ 21
2.3 Treatment of Sewage ...................................................................................... 24
2.4 Composition of Sewage .................................................................................. 27
vii
2. 4.1 Heavy metals ........................................................................................... 28
2.4.2 Sources of heavy metals........................................................................... 29
2.4.3 Overview of selected heavy metals for present study ............................... 31
2.4.4 Bioaccumulation of heavy metals ............................................................. 32
2.4.5 Effects of heavy metal pollution ................................................................ 33
2.5 The Impact of Industrial and Domestic Effluents ............................................. 35
2.5.1 Environmental effect ................................................................................. 35
2.5.2: Effect on human health ............................................................................ 37
2.6 Laws that Exist In South Africa on Protection of Rivers .................................. 38
2.6.1 National Water Act, Act No 36 Of 1998 .................................................... 38
2.6.2 National Environmental Management: Air Quality Act, 2004 (Act No. 39 of
2004) ................................................................................................................. 38
2.6.3 Public Health Act of the Union of South Africa, 1919 (Act No.36 of 1919) 39
2.6.4 Water Act, 1956 (Act No.54 of 1956) ........................................................ 39
2.7 Heavy Metal Removal Techniques ................................................................. 39
2.7.1 Physical and chemical techniques of heavy metal removal ...................... 39
2.7.2 Microbial method of heavy metal removal ................................................ 40
CHAPTER 3: STUDY AREA AND METHODOLOGY............................................... 44
3.1: Introduction .................................................................................................... 44
3.2 Study Area ...................................................................................................... 44
3.2.1. General description of study area ............................................................ 44
3.3 Methodology ................................................................................................... 47
3.3.1 Sample collection ...................................................................................... 47
3.4 Experimental Methods .................................................................................... 50
3.4.1 Determination of physico-chemical parameters ........................................ 50
3.4.1.1 Heavy Metal Determination/Analysis .................................................. 50
3.4.1.3. Biological oxygen demand measurement (BOD). .............................. 52
3.4.2 Microbiological analysis ............................................................................ 52
viii
3.4.2.1 Isolation of bacteria (pure culture) from sample.................................. 52
3.4.2.2 Gram Staining..................................................................................... 53
3.4.2.3 Molecular techniques: extraction of DNA from bacteria isolates ......... 53
3.4.2.4. Amplification of 16S rDNA genes by polymerase chain reaction (PCR)
and analysis of the PCR products. ................................................................. 54
3.4.2.5 Phylogenetic analysis ......................................................................... 54
3.5 Heavy Metal Screening Test ........................................................................... 55
3.6 Statistical Analysis .......................................................................................... 55
CHAPTER 4: RESULT AND DISCUSSION ............................................................. 57
4.1 Introduction ..................................................................................................... 57
4.2 Heavy Metals and Physico-Chemical Parameters in Effluents from Industries
and Leeuwkuil Wastewater Treatment Plant (Inflow and Final Effluent) Around Vaal
Area ...................................................................................................................... 60
4.2.1 Industrial effluents as a point source of heavy metals pollution in the Vaal
Areas and Leeuwkuil Plant ................................................................................ 60
4.2.2 Physico-chemical characteristics of effluents from industries and Leeuwkuil
Wastewater Treatment Plant ............................................................................. 64
4.2.3 Correlation coefficient analysis of the heavy metals and physico-chemical
parameters of effluents from industries and the Leeuwkuil Wastewater Treatment
Plant .................................................................................................................. 73
4.3 Heavy Metals and Physico-Chemical Parameters in Upstream and Downstream
(Vaal River) and Potable Water around the Vaal Area .......................................... 84
4.3.1 Heavy metal analysis of samples from Vaal River and Potable water ...... 84
4.3.2 Physico-chemical characteristics of samples from Vaal River and Potable
water .................................................................................................................. 89
4.3.3 Correlation coefficient of heavy metals and physico-chemical parameters of
samples from Vaal River and Potable water ...................................................... 93
4.4. Identification of Microbial Presence and their Resistance to Heavy Metals . 104
4.4.1 Microbiological characterisation .............................................................. 104
4.4.1.1 Culture morphology .......................................................................... 104
ix
4.4.1.2 Screening for resistant microbial isolates towards high heavy metal
concentration ................................................................................................ 104
4.4.1.3 Gram staining of bacterial isolates .................................................... 107
4.4.2 Molecular characterisation ...................................................................... 108
4.5. Evaluation of the Effectiveness of the Leewkuil Treatment Plant ................. 111
4.6 Conclusions .................................................................................................. 112
CHAPTER 5: SUMMARY, RECOMMENDATIONS AND CONCLUSION .............. 113
5.1 Summary ....................................................................................................... 113
5.1.1 Heavy metals and physico-chemical parameters of the effluents and water
samples ........................................................................................................... 113
5.1.2 Identification and characterisation of heavy metal resistant bacteria ...... 114
5.1.3 Correlation between the quality of potable water and the effectiveness of
treatment plants in Vaal area ........................................................................... 114
5.2 Recommendations ........................................................................................ 115
5.3 Recommendations for further research ......................................................... 115
5.4 Conclusion .................................................................................................... 116
REFERENCE ......................................................................................................... 117
x
LIST OF ACRONYMS WHO-------------------------World Health Organization
SAGES------------------------South African General Effluent Standard
SANS-------------------------South African National Standards
ICP-OES---------------------- Inductively Coupled Plasma Optical Emission Spectrometry
WWTW------------------------Wastewater Treatment Work
PCR---------------------------Polymerase Chain Reaction
TDS----------------------------Total Dissolved Solids
BOD----------------------------Biological Oxygen Demand
COD----------------------------Chemical Oxygen Demand
EC------------------------------Electrical Conductivity
DO-----------------------------Dissolved Oxygen
MENA-------------------------Middle East and North Africa
KVIP--------------------------Kumasi Ventilated Improved pit
USEPA----------------------United State Environmental Protection Agency
WWTP-----------------------Wastewater Treatment Plant
BLAST------------------------Basic Local Alignment Search Tool
xi
LIST OF FIGURES
Figure 3.1A: Map of South Africa showing Gauteng Province.
https://www.google.com/search?q=insert+of+South+African+maps+showing+Gauten
g+province ............................................................................................................... 46
Figure 3.1B: Location of study area within Emfuleni Local Municipality ................... 47
Figure 3.2: Maps Showing Sampling Points ............................................................. 49
Figure 4.1: Linear regression graph to predict the physico-chemical parameters in the
seven effluent samples. Pearson’s correlation between copper and aluminium (A),
Lead and copper (B) during summer for the effluent samples are strong................. 78
Figure 4.2: Linear regression graph to predict the physico-chemical parameters in the
seven effluent samples. Pearson’s correlation between zinc and electrical conductivity
(A), Lead and copper (B) during autumn for the effluent samples are strong (r-value is
between 0.8 to 1) and are represented with linear regression equation ................... 79
Figure 4.3: Linear regression graph to predict the physico-chemical parameters in the
seven effluent samples. Pearson’s correlation between electrical conductivity and
total dissolved solids (A), Lead and copper (B) during winter for the effluent samples
are strong (r-value is between 0.8 to 1) and are represented with linear regression
equation ................................................................................................................... 80
Figure 4.4: Linear regression graph to predict the physico-chemical parameters in the
seven effluent samples. Pearson’s correlation between electrical conductivity and
total dissolve solids (A), Lead and copper (B), zinc and salinity (C) zinc and chemical
oxygen demand (D) during spring for the effluent samples are strong and are
represented with linear regression equation ............................................................. 81
Figure 4.5: Linear regression graph to predict the physico-chemical parameters
(copper, aluminium, lead) in upstream, downstream and potable water samples.
Pearson’s correlation between copper and aluminium (A), lead and aluminium (B),
lead and copper (C) during summer for water samples are strong (with value 1) and
are represented with linear regression equation. ..................................................... 95
xii
Figure 4.6: Linear regression graph to predict the physico-chemical parameters
(electrical conductivity, total dissolved solids, copper, aluminium,) in upstream,
downstream and potable water samples. Pearson’s correlation between electrical
conductivity and total dissolved solids (A), and copper and aluminium (B), lead and
aluminium (B), during winter for water samples are strong (with value 1) and are
represented with linear regression equation. .......................................................... 100
Figure 4.7: Two samples of gram stained bacterial isolates from the sampling points.
Gram negative rod (A) (bacteria take up safranin pigment and turn reddish pink) and
gram positive rod (B) (bacteria take up the crystal violet and turn purple).............. 107
Figure 4.8: Phylogenetic tree showing the relationship among the screened bacterial
species with similarities based on 16S rDNA gene sequences (ML, 1000 rounds
bootstrap replications) ............................................................................................ 111
xiii
LIST OF TABLES Table 2.1: Application of Heavy Metals, uses and their toxic effects (Lakherwa, 2014,
Rajendran et al., 2003). ............................................................................................ 31
Table 2.2: Advantages and disadvantages of heavy metal removal techniques (Ghazy
et al., 2008; Dhokpande and Kaware, 2013). ........................................................... 40
Table 3.1: Emfuleni Local Municipality Wastewater Risk Abatement Plan. .............. 45
Table 3.2: Description of sampling points ................................................................ 48
Table 3.3: Standard wavelength and deletion limits for heavy metals and plasma
viewing position on the PerkinElmer optima 5300DV ............................................... 51
Table 4.1A: Elemental concentrations (ppm) in potable water, water from the Vaal
River, Leeuwkuil Plant, and industries in the Vaal areas. Values (M±S.E.) followed by
dissimilar letters in a column are significantly different at p≤0.05 and separated by
different letters ......................................................................................................... 58
Table 4.1B: Elemental concentrations (ppm) in potable water, waters from the Vaal
River, Leeuwkuil Plant, and industries in the Vaal areas. Values (M±S.E.) followed by
dissimilar letters in a column are significantly different at p≤0.05 and separated by
different letters ......................................................................................................... 59
Table 4.2 : Characterisation of industrial and Leeuwkuil Treatment Plant effluents
during the seasons and their compliance with physico-chemical parameters standards
................................................................................................................................. 68
Table 4.3: Pearson’s correlation coefficients of physico-chemical parameters for the
effluents samples during summer ............................................................................ 74
Table 4. 4: Pearson’s correlation coefficients of physico-chemical parameters for the
effluents samples during winter ................................................................................ 75
xiv
Table 4.5: Pearson’s correlation coefficients of physico-chemical parameters for
effluents samples during autumn ............................................................................. 76
Table 4.6: Pearson’s correlation coefficients of physico-chemical parameters for
effluents samples during spring ................................................................................ 77
Table 4.7: Characterisation of receiving water and potable water during the seasons
and their compliance with standards ........................................................................ 86
Table 4.8: Pearson Correlation of physico-chemical parameters of samples from
Upstream, Downstream and Potable Water 1 & 2 during summer ........................... 94
Table 4.9: Linear-regression equations to predict water quality of samples from
upstream, downstream and potable water during summer ....................................... 96
Table 4.10: Pearson Correlation of physico-chemical parameters of samples from
upstream, downstream and potable water 1 & 2 during autumn .............................. 97
Table 4.11: Linear-regression equations to predict water quality of samples from
upstream, downstream and potable water during autumn ........................................ 98
Table 4.12: Pearson Correlation of physico-chemical parameters of samples from
upstream, downstream and potable water 1 & 2 during winter ................................. 99
Table 4.13: Linear-regression equations to predict water quality variable of samples
from upstream, downstream and potable water during winter ................................ 101
Table 4.14: Pearson Correlation of physico-chemical parameters of samples from
upstream, downstream and potable water 1 & 2 during spring .............................. 102
Table 4.15: Heavy metal resistance for pre-screening test of bacterial isolates ..... 105
Table 4.16: Characterisation of bacterial isolates collected from study sites .......... 110
xv
ABSTRACT
Industrial effluents with high concentrations of heavy metals are widespread pollutants
of great concerns as they are known to be persistent and non-degradable. Continuous
monitoring and treatment of the effluents become pertinent because of their impacts
on wastewater treatment plants. The aim of this study is to determine the correlation
between heavy metal pollution in water and the location of industries in order to
ascertain the effectiveness of the municipal waste water treatment plant. Heavy metal
identification and physico-chemical analysis were done using Inductively Coupled
Plasma Optical Emission Spectrometry (ICP-OES) and multi-parameter probe
respectively. Correlation coefficients of the measured values were done to investigate
the effect of the industrial effluents on the treatment plants. Heavy metal resistant
bacteria were identified and characterised by polymerase chain reaction and
sequencing. Leeuwkuil wastewater treatment plants were effective in maintaining
temperature, pH, and chemical oxygen demand within South Africa green drop and
SAGG Standards whereas the purification plant was effective in maintaining the values
of Cu, Zn, Al, temperature, BOD, COD, and TDS within the SANS and WHO standard
for potable water. This findings indicated the need for the treatment plants to be
reviewed.The industrial wastewater were identified as a point source of heavy metal
pollution that influenced Leeuwkuil wastewater treatment plants and the purification
plants in Vaal, Vereenining South Africa. Pseudomonas aeruginosa, Serratia
marcescens, Bacillus sp. strain and Bacillus toyonensis that showed 100% similarity
were found to be resistant to Al, Cu, Pb and Zn. These identified bacteria can be
considered for further study in bioremediation.
Key words: Industrial effluent, waste water, treatment plants, heavy metals, physico-chemical parameters, heavy metal resistant bacteria
1
CHAPTER 1: INTRODUCTION
1.1 Background Information Water is important for all life because it is needed to sustain life on earth. Its crucial
role in our economy, food production, health, and environment cannot be over
emphasised (Halder and Islam, 2015). Humans can withstand food starvation for
several weeks but may not withstand water deficiency because it is constantly required
for effective functioning of cells, tissues and organs in the body (Murray et al., 2000,
Chinedu et al., 2011). Safe drinking water is vital for improvement and public health
because of the association of water to a significant number of diseases (Prüss et al.,
2002). The finite nature of water means that it is hydrologically recycled continuously
through the atmosphere (Naidoo and Olaniran, 2014). According to the World Water
Organisation (TWWO 2010), this limitation poses terrible implications for nearly 7
billion of the world’s population with dire consequences globally. However despite this
understanding the trend of pollution has continued unabated.
The increased rate of industrialisation in the world is believed to contribute to drastic
pollution of water resources and South Africa is not an exception (Kamika and Momba,
2013). It is estimated that every day approximately two million tons of industrial and
domestic wastes are disposed into waterbodies worldwide (Pacific Institute 2010; UN
WWAP, 2003). This is as a result of the increasing industrialisations of most
developing countries which have contributed significantly to water and land pollution
(Alam, 2010; Kraemer et al., 2001).
Industrial wastewater pollution is a notable problem in South Africa, where fresh water
resources is in short supply. With just over 1200 m3 of fresh water provided per person
in a year for a population closed to 50 million, the country is on the verge of being
classified as water stress according to internationally definition (Savenije and Van der
Zaag, 2000).
Effluents generated from both industrial and domestic activities occupy the second
position with respect to sources of water. Presently, the above mentioned activities
are believed to contribute to chemical and microbial pollution of South Africa’s sources
of water (Van Vuuren, 2009; Momba et al., 2009; Kamika and Momba, 2013).
2
Most of the research conducted globally focus on the impact of industrialisation within
the developed countries. However, many studies are now pointing out the impacts of
environmental pollution in developing nations showing how pollution has contributed
annually to the deaths and disabilities of millions of people especially in heavily
populated urban areas (Mills-Knapp et al.,, 2012).
The rapid growth in the population of the world, and urbanisation including the
expanding intensity of food production has taken its toll on water resources. Water
abstraction for agricultural, mining, industrial, and domestic use has led to decline in
the quality and quantity of water that affect organisms in the water bodies and also
potable water available for human consumption (UNEP, 2008).
It has been realised that release of incompletely treated or untreated wastes loaded
with non-biodegradable organics, heavy metals , algal nutrients and other toxicants
will accelerate the decline of the quality of receiving water bodies (Olaniyi et al, 2012).
Chindah et al. (2004) also affirm this finding by stating that poor water quality is
principally caused by inadequate waste disposal methods used by most industries and
untreated effluents from industries being discharged carelessly. The problem is
compounded by the increased rate of unregulated and illegal discharge of effluents
that contaminate water across national borders (Corcoran et al., 2010). Therefore,
there exist the need to treat wastewaters before discharging them into the environment
in order to reduce pollution.
Many developing countries are faced with huge debts, population explosion, and ever-
increasing premature urbanisation due to increased industrialisation which have
resulted to the understanding of the relationship between the environment, public
health, and pollution (Adebisi and Fayemiwo, 2010). While most pollution and
production of waste are caused by activities of the industries, high environmental
pollution results from industries with little or no control to pollution and lack of facilities
for treating generated waste (WHO, 1982). Water treatment facilities that is supposed
to treat effluents produce from these industries are not efficient and improved upon
due to technical and financial constraints (Snyman et al., 2006; Ujang and Buckley,
2002). Leeuwkuil Wastewater Treatment Plant in Vereenining, South Africa, cannot
be exempted, as treated wastewater has not been tested to ascertain quality standard
from June to September 2016 due to financial constrains by the municipality. In view
3
of satisfying the increasing demands of the people, individuals have no alternative but
to rely primarily on water of poor quality that are not considered safe for use. This
situation at Vaal is in accordance with what is reported by Okonkwo (2010),
Markandya (2004) and Aina and Adedipe (1996) in the case where there are
insufficient resources to treat wastewater with the aim of providing quality drinking
water needed by the people; resulting in their dependence on poor quality water for
survival.
1.2 Problem Statement There are several notable incidences in South Africa of direct discharge of industrial
effluent into water bodies leading to pollution and in some cases heavy metal
contamination (Ahmad et al., 2012; Akpor et al., 2014, Ntuli, 2012). Even in cases
where the effluent water passes through the waste water treatment facilities, these
treatment plants are ill-equipped to remove large quantities of biodegradable waste
and recalcitrant heavy metals (Ntuli 2012; Mema, 2010; Morrison et al., 2001).
The occurrence of heavy metals in the soil and water is observably a recurrent problem
with potential high toxicity to flora and fauna (Fonseca et al., 2006). Heavy metals are
both carcinogenic and toxic (Krishnani et al., 2008). Despite the harmfulness of heavy
metals to both macro and micro-organisms at high concentration, they have proved to
accumulate over time, unlike other organic pollutants that can be degraded chemically
or biologically (Fonseca et al., 2006).
The Vaal Triangle is notably a major industrial region of South Africa with industries
such as the Iron and Steel, petroleum and coal oil companies, and gold mine
industries. These industries fall under the catchment areas of the Leeuwkuil waste
water treatment facility (Mahlaka, 2015; Tempelhoff et al., 2007). All these industries
use chemicals in their industrial processes that can be considered to be persistent and
non-biodegradable. The Vaal triangle is historical known as a heavily polluted region
as a result of significantly large quantity of industries sited in this region (Tempelhoff
et al., 2007) which informed its choice as the study area for this research. There is no
sufficient studies to show the correlation between heavy metal pollution in water and
the location of the industries.
The persistence occurrence of heavy metals in municipal effluent and their ability to
bio-accumulate after treatment, emphasises the need for easy, cost-effective and

4
biological methods to determine and control toxicity levels of industrial effluents and
help minimise domestic households receiving polluted water. It is on the basis of the
above reason that this study will be carried out to investigate the correlation between
an increase in heavy metal pollution in water and the location of industries and to
ascertain the effectiveness of the municipal water treatment.
1.3 Rationale of the Study Industrial pollution is a continuous source of environmental degradation that affects
land, water and air (Adebisi and Fayemiwo, 2010). Some industries often deliberately
discharge untreated effluents into water bodies without adequate treatment
(Akaninwor et al., 2007). In other cases their reliance on waste water treatment
facilities has proved ineffective. In both cases the effects are the same on water bodies
and the end-users are affected by the consequences of industrial pollution.
It has become imperative that routine analysis for heavy metal presence and
development of protocols that can readily determine the occurrence of recalcitrant
heavy metals and other non-biodegradable compounds, be prioritise to enhance the
tests for quality of water so as to ensure that end-users of water are provided with safe
potable drinking water (Longe and Omole, 2008). For this reason this research is
proposed as a means to, not only highlight the limitations of the wastewater treatment
facilities in the removal of persistent heavy metals but also to elucidate the presence
of the metals as a direct consequence of industrial pollution and to offer empirical data
that can lead to changes being made to the existing treatment processes.
It has become necessary to ascertain regularly the quality of water because of the
growing trend of poor individuals in the society locating informal settlements and farm
steads along the river banks and downstream (Matowanyika, 2011; Chikoto, 2009).
This is applicable in Leeuwkuil Treatment Plant where the final treated water from final
effluent is used as a water source for animals in the farm as an alternative. It is obvious
that any pollution of these water bodies directly impacts first-hand on these individuals
living close to the polluted river (Matowanyika, 2011). The Vaal River is no exception
although the final effluent is used for agricultural purposes including small scale
farming and cattle rearing, the bioaccumulation of heavy metals within crops and
livestock cannot be ignored as ultimately such produce will be consumed by people
(Bhagirath and Ratna, 2002).
5
1.4 Significance of Study This study will enhance the knowledge of the influence of industrial pollution on surface
water, wastewater treatment plant and possible impacts on human health, especially
in developing countries. Furthermore, it serves as a point of reference for industries with the aim of remedying problems of water pollution and provide effective ways of
treating waste in their respective industries especially in South Africa industries.
1. 5 Research Questions i. Do waste water released by the industries have an impact on municipal
wastewater treatment plants effluent quality in the Vaal area?
ii. Is there a correlation between the quality of potable water and the effectiveness
of treatment plants in the Vaal area?
1.6 Aim and Objectives
1.6.1 Aim The aim is to determine the correlation between heavy metal pollution in water and the
location of industries in order to ascertain the effectiveness of the municipal
wastewater treatment plant.
To achieve this goal, the following specific objectives will be pursued:
1.6.2 Objectives Identify and quantify the presence of heavy metals and physico-chemical
parameters in effluents from the Leeuwkuil Plant and Industries in the Vaal
area.
Identify and quantify the presence of heavy metals and physico-chemical
parameters from Vaal River and potable water samples from the Vaal areas.
Compare the results of heavy metal and physico-chemical parameters obtained
from the effluents, Vaal River and potable water samples to current national
and international standards.
Isolate and characterise bacteria resistant to heavy metals found in the
effluents, river and potable water samples from the Vaal area.
Determine the correlation between the quality of potable water and the
effectiveness of the Wastewater Treatment Plants in the study area.
6
1.7 Thesis Outline This study investigated industrial effluent impacts on Leeuwkuil Municipal Wastewater
Treatment Plant and identified the presence of heavy metals in effluent, potable water
and five (5) industries that discharges effluent into Leeuwkuil Sewage Plant using
physico-chemical and microbiological assessments. Also, to isolate and characterise
bacteria resistant to heavy metals found in different effluent, river and potable water in
the Vaal areas.
Chapter one covers the background study, problem statement, justification of the
study, aim and objectives of the study.
Chapter two review relevant literature to the study aim from the global to the local
context.
Chapter three explains methods and procedures employed in conducting this study
the effect of effluent discharged on surface water quality is evaluated in terms of
physico-chemical study, microbiological and molecular characterisation. It also contain
the identification and quantification of the presence of heavy metals in the effluent from
five (5) industries that discharges at Leeuwkuil Sewage Plant in the Vaal areas which
were analysed using spectrophotometric techniques and supported by microbiological
analysis of heavy metal resistant bacteria test.
Chapter four presents results of all the test carried out including physico-chemical,
microbial and molecular characterisation in form of tables and graphs to ascertain the
effectiveness of the water treatment strategy used in the study area and determine the
underlying factors/causes that may lead to failure of the Vaal Municipal Water
Treatment Plant.
Chapter five which is the final chapter, includes the summary, significance of the study,
future research and conclusion.
7
CHAPTER 2: LITERATURE REVIEW
2.1 Introduction Water resources on the planet have been affected greatly over the past few years as
a consequence of human activities, which have affected basic water supply and
drinking water quality globally (Martin, 2009; Jaishankar et al., 2014). The faster
deterioration of water quality mostly results from the discharge of ever increasing
quantities of untreated or partially treated effluent that contains different contaminants
resulting to water pollution (Baloyi et al, 2014; Morrison et al., 2004). Polluted water
affects different uses such as household water use, recreation, fishing, transportation,
and commerce. Most health problems and diseases in different parts of the world are
believed to be caused by untreated or inadequately treated wastewater discharged
into water bodies resulting in the spread of diseases, and death of fishes and other
forms of aquatic life (Sibeya, 2016).
The population of the world in urban centres are experiencing high rate of increments.
This increment is intense in developing countries, where over 2 billion people are
anticipated to inhabit by 2030 (United Nations 2012; Mateo-Sagasta et al., 2015). The
cities found in those developing countries are believed to produce billions of tons of
waste every year with sludge and wastewater inclusive. Wastewater from industrial
and domestic activities in the world’s view are regarded as the major sources of
effluents due to high rate of industrialisation, and increase in the number of people
(Akpor et al., 2014). Sewage discharges and industrialisation could be considered a
main source of water pollution in both developed and developing countries as they
contribute to eutrophication (Keller, 2012; Water Pollution Guide, 2008). The problem
is more predominant in areas that use simple, inefficient and ineffective wastewater
treatment systems. Eutrophication potential which results from the presence of
nutrients in the effluent has been considered to be a relatively important environmental
issue when performing an environmental evaluation of wastewater treatment plants
(WWTPs) (Sibeya, 2016). Wastewater Treatment Plants discharge directly into water
bodies and are therefore considered point sources of possible pollution. Therefore,
regulating effluent is important as water pollution results to negative effect on the
environment as a whole, including its effects on biotic and abiotic organisms. Naidoo
and Olaniran (2014) pointed out that wastewater treatment plants are experiencing
difficulties in treating wastewater resulting in the discharge of improperly treated
8
effluents into the waterbodies. They further suggested the need to develop strict
methods for monitoring effluents discharged into the water bodies. Hence water need
to be treated in order to be free of microorganisms and chemical substances that can
cause disease. Water purification is an important linkage between the promotion of
public health and safety. The purification process consists of different stages and the
stages are dependent on the kinds of contaminants present in the raw source of water.
Sedimentation, flocculation, filtration and disinfection are the crucial stages involved
in water purification. Generally, Municipal Wastewater Treatment Plants undergo
stages of wastewater treatment and purification so as to ensure that clean and safe
drinking water is provided to the population.
2.2 Wastewater Treatment Plant: The Global View
Waste from industries, domestic activities, storm water runoff, and commercial
activities carried by water is termed wastewater. The number of people, and the
combination of industrial and domestic activities determines the quantity and nature of
wastewater generated (Naidoo and Olaniran, 2014). Naidoo and Olaniran (2014)
further indicated that these activities affect their patterns of discharge and the chemical
constituents of the wastewater. Treatment of wastewater has been in existence since
the knowledge of humans and it is continuously under improvement (Angelakis and
Snyder, 2015). Furthermore, the use of household wastewater on land is an ancient
practice that has undergone different developmental stages. This has contributed to a
better understanding of process, treatment methods and technology and the eventual
development of better treatment methods resulting to good water quality
(Paranychianakis et al., 2015; Angelakis and Snyder, 2015).
Natural cycling was the predominantly used method of waste treatment by the first
human communities as the waste produced by them were returned to the land and
decomposed naturally (Lofrano and Brown, 2010). There were little disposal problems
simply because they were small communities of nomads scattered over wide areas.
The permanent settlements of people about 10,000 years signalled the establishment
of a new era where agrarian way of life accompanied by ecological impacts were
adopted (Lofrano and Brown, 2010). During the early civilisation, the use of dug holes
as means of waste disposal were the prevailing means of waste disposal however, the
health implications were not determined.
9
In Europe, 71% of most of the waste water produced are treated as a result of public
health awareness, protection law governing the environment, advancement in
technology, and most importantly, because most treatment plant were funded by most
government (United Nation, 2012). Furthermore, the laws governing water and
wastewater management plays essential role in enhancing treatment of wastewater in
these regions for this laws are well structured and functional unlike in many parts of
the world were implementation is a struggle (Sato et al, 2013).
In Russia Federations, the volume of wastewater treated in a year is about 14 Km3
(UNDESA-DSD, 2004). About 28% of the treated wastewater were done in compliance
to regulations that were in place while the rest is discharged into waterbodies when
they were not properly treated. Sato et al. (2013) pointed out that poor management
(60% of the treatment plants are overloaded), and dilapidated facilities (38% have
been in operation for about 30 years and need rehabilitation) are the major factors for
low efficiency of wastewater treatment plants. Inadequate water and wastewater
management, and old wastewater treatment systems, are the major contributing factor
to severe water pollution in Ukraine, Georgia (UNECE, 2003), and Caspian Sea
(Stolberg et al., 2006). Financial provision and resource dissemination are essential
for adequate management and updating of wastewater collection and treatment
facilities in these regions.
The original approach adopted in the United States to dispose wastewater from urban
homes was through septic tank or cesspools with underground tiles that drains
wastewater into the ground via percolation (USEPA, 1992). This resulted in the
pollution of groundwater used for water supply to the populace. In order to control the
pollution, sewerage systems were constructed to drain wastewater from houses and
other buildings into the water bodies that is at close proximity (USEPA, 1992).
Sewerage lines, drainage systems and other infrastructure were constructed by the
local governments for the removal of wastewater. In the mid-1880, broad sewerage
systems were constructed across the United State to enhance the drainage of waste
water into water bodies. The systems were beneficial to the country in the removal of
waste water from homes, however, it created nuisance and health hazards in the
receiving water bodies. USEPA (1992) said that receiving waters often played the
roles of food and drinking water sources, and recreation centre, as a result, there was
10
a need to pre-treat wastewater before discharge will be initiated. The first treatment of
wastewater involves channelling them to the farm with the sole purpose of restoring
nutrient to the soil. In the 20th century, the facilities used in the first treatment were
called sewage farms.
Increase urban growth which resulted to the production of large quantities of
wastewater that is required to be treated, made only sedimentation not to be sufficient,
hence various improvements on wastewater treatment were introduced. Chemical
precipitation was one of the improvements employed to boost sedimentation, however,
creation of sludges was its drawback (USEPA, 1992). Biological treatment with
trickling filters was also introduced after sedimentation to enhance the treatment of
wastewater (USEPA, 1992). Various treatment methods involving biological
processes were introduced with the sole purpose of reducing cost and space
requirement, and increasing their efficiency. Current biological processes and
activated sludge remove between 95 to 98% organic matter, bacteria and suspended
solids (USEPA, 1992).
Secondary treatment was made a requirement in the United States for all treatment
plants (passage of the Clean Water Acts in 1972). As a result of this decision by the
state, Federal Construction Grant Program was introduced to provide additional funds
as an incentive for innovative practices. The grant from the state became a motivating
factor for the construction of wastewater treatment plants. However, secondary
treatment was also observed to be insufficient in sustaining receiving water for
swimming and fishing purposes (as stipulated by Clean Water Act in 1972), therefore,
larger elimination of exact constituents such as phosphorus and nitrogen was then
required which is termed as “advanced treatment”. Tertiary treatments which adds
sand filtration process was also introduced in many states to enhance better treatment
of wastewater. The United State Environmental Protection Agency recommend tertiary
treatment followed by chlorine disinfection under the safe Drinking Water Act and
Clean Water Act (USEPA, 1992). United States has more drinking water system than
public wastewater systems. Approximately 19,739 wastewater pipe systems and
14,780 wastewater treatment facilities since 2008 were available. In 2002, 98% of
treatment plants were owned by municipalities, while access to centralised treatment
plants is general, the state of many of these plants is also bad, with old pipes and
11
inefficient capacity leading to a release of about 900 billion gallons of untreated
sewage per year.
In Asia, the percentage of treated wastewater is about 32. This is due to inadequate
treatment facilities in several countries in the region (WEPA-IGES, 2012). Financial
resources is the major drawback to the success of wastewater treatment in Asia,
alongside the lack of distinct policies and the deficiency of qualified personnel in the
field of wastewater management (UN, 2000). In China for example, prior to 1800s,
outdoor privy was the main means of disposing human excrement (Topare et al., 2011;
Abbasi et al., 2016). In earliest twentieth century, cistern was discovered at Yangshao
Culture Ruins. Subsequently, these techniques have been used in China for
thousands of years until the1970s (Angelakis and Snyder, 2015). Industrialisation and
urbanisation together with increased economic growth have created great burdens on
the environment, with resulting damage to natural resources including water in China
(Sarah Edmonds, 2008). Maintaining an effective and efficient management of water
is a difficult goal to realise in China, as the country must concomitantly fight water
scarcity, increase the quality of treatment, and improve access to wastewater
coverage. Lieu (2009) indicated that realising the wastewater treatment goals of the
central government is challenging as discharge of wastewater has increased over the
past years.
Water bodies’ pollution worsen water scarcity problem. Water in most important river
basins is heavily polluted, making it unfit for drinking, agriculture and use in industrial
processes. Furthermore, half of the groundwater wells are also polluted, making it unfit
for human use. The source of this pollution is mostly agriculture and industries.
Treatment of industrial wastewater is often not sufficient to comply with water quality
standards, or completely absent (Global Water Partnership (2015). Example of this
industrial pollution is seen with the pollution of Huangpu River in China. This river is
not only important for tourism, navigation, receiving wastewater and fishery but also
provides water for almost 13 million people within Shanghai metropolitan. In mid -
1980s, partially treated or untreated domestic and industrial wastewater discharged
directly through municipal sewers to the Huangpu River constitutes 70% of the
effluents produced in the area. This is the principal factor contributing to the pollution
of the river. The urban section of Huangpu River turned black and anoxic for about
12
100 days in early 1980s because of the pollution of the river and escalated to more
than 200 days in the 1990s (WHO/UNEP, 1997).
The Government of Shanghai Municipal since 1979 gave much consideration to
combine pollution control of Huangpu River by establishing environmental legislation
and standards to control water quality and effluent discharge. Also, different bodies
that enforce laws were also created to ensure standards are maintained.
Environmental laws were specified for water quality and effluent in the late 1970s to
the early 1980s. Institutions for implementation were also made to monitor wastewater
treatment and to ensure that wastewater is properly treated and disposed (Helmer and
Hespanhol, 1997).
The increasing rate of water pollution and the need to protect the environment have
driven China to develop various technologies to ensure efficient treatment of
wastewater (Abbasi et al., 2016). The first large scale municipal wastewater treatment
plant was constructed and operated two decades ago (China Environmental
Protection Industry, 2008). Sewage treatment systems only emerged after scientists
discovered that, water borne bacteria were the causes of many infectious diseases.
Chinese government enforced the cities in China to build wastewater treatment plants.
The most common treatment method used in China is secondary biological treatment
processes which are usually used to treat wastewater in most plants found in
municipalities, particularly in the bigger plants. The stages of treatment involves
screening, primary sedimentation, conventional activated sludge, and secondary
sedimentation. China has also adopted several new wastewater treatment
technologies. The newer wastewater treatment technologies in China that are also
used to solve problem of inadequate wastewater treatment include anaerobic-aerobic
activated sludge process, absorption-biodegrading process, anaerobic-anoxic-aerobic
activated sludge process, sequencing batch reactor, and cyclic activated sludge
system. Now China is recorded to possess the world's second largest sewage
treatment capacity immediately after United State of America. Oxidation ditch,
anaerobic and sequencing batch reactor (SBR) are the most widely used processes
for wastewater treatment which account for about 80% of the total treatment quantity
and capacity of 29.21%, 25.45% and17.90%, (Abbasi et al., 2016).
13
Japan has employed a broad approach for treating wastewater used in the country
(Funamiu et al., 2008). Furthermore, 0.2 km3 of treated wastewater in 2009 were used
in the country. Out of the volume of the treated wastewater used in the country, 27%
was used for landscape irrigation, 2% for recreation, and 29% river maintenance
(World Bank, 2012; WRDLWB, 2012). Wastewater use in agriculture, industry, and
toilet flushing is not extensive. It accounted for 7%, 1%, and 3% of the treated
wastewater respectively (World Bank, 2012). Japan’s use of wastewater policy is
slightly unique, as it is aimed at meeting needs of water in urban areas, instead of only
providing water mainly for agricultural uses (USEPA, 2004).
In Pakistan, about 32,500 ha are irrigated with wastewater (Ensink et al., 2004). Van
der Hoek (2004) pointed out that most of the wastewater are not treated and yet there
are no clear laws in Pakistan regulating the use of the water on crops. This scenario
is also observed in India where untreated wastewater is commonly used and in 1985,
about 73,000 ha were irrigated with it (Strauss and Blumenthal, 1990). Since then, the
volume of wastewater used for irrigation have increased significantly (USEPA, 2004).
Van der Hoek (2004) further observed that large volumes of untreated wastewater are
discharged into Musi River and about 40,000 ha of the land in the area are irrigated
with the water from the river posing health risk to the populace that may eat the
produce. Jamatia et al. (2014) evaluated the physiochemical characteristics of effluent
discharged into a water body in India by a rubber industry and observed that the
industry produces large volumes of wastewater during the processing stages. They
further indicated that the processes of rubber production causes drastic water pollution
because of the large effluent disposed into inland surface water thereby causing
damage to the water resources.
2.2.1 Wastewater treatment in Africa Africa is also known to be a dry continent and second to Australia in terms of dryness.
According to Corcoran et al.(2010), African global renewable water resources that can
support 15% of the global population is about 9%. Wang et al. (2013) pointed out that
inadequate treatment of wastewater increased the deficiency of water in Africa. In
Africa, wastewater treatment is reduced, as purchase of facilities for treatment is
limited coupled with tenacious increase in population resulting in the increase of
wastewater in many countries. Thus, large volume of the wastewater produced is not
treated, with a large portion of it used for irrigation by many subsistence farmers with
14
little effort to improve the quality of the wastewater received (Sato et al, 2013; Bahri et
al., 2008). Africa and other cities in many developing countries presently have no
sewerage system (JMP, 2013). However, the countries with the systems, provides
services to only a small minority of the population. This deficiency of suitable sanitation
systems is now a huge challenge and will likely increase because untreated
wastewater from urban areas is contaminating sources of water thereby changing
irrigation with freshwater into irrigation with wastewater in and around most cities in
Africa. Often the poor rural masses depend on the resource for their means of survival
by preventing food scarcity. But this sometimes has dare consequences in terms of
their health and the environment (Bahri et al., 2008). For example, in Senegal,
specifically Dakar, irrigations are done using untreated wastewater (Faruquiet et al.,
2004), Nairobi in Kenya (Cornish and Kielen, 2004) and about 11,900 ha of land in
Kumasi, Ghana (Keraita et al., 2002).
Limited sewer collection system, inadequate operation and maintenance process is
still a very big problem for wastewater treatment in most Africa countries because it
result in poor sanitation and water quality standard. For example, in Addis Ababa
(Ethiopia), the treatment plant in Kaliti was intended to meet the need of 50 000 people
in 1982 (Wang et al., 2013) however, after 30 years of advancement, the population
whose needs were met amounts to 13 000 people. Inadequate connection of houses
to municipal sewerage pipelines is one of the major reasons why the target proposed
could not be met. The speed at which connections is done is very slow and has not
improved since 1993 (Wang et al., 2013). Another example is found in the Kisumu
district in Kenya, where Sunset Hotel, Kendu Bay, and Mumias road that makes up
the three pumping stations in the area are worn-out and result in the run-off of sewage
at manholes upstream of the pump stations, leading to undeviating release of sewage
into Lake Victoria hence causing water pollution (Parkman et al., 2008; Wang et al.,
2013).
In Ghana, Keraita and Drechsel (2004) reports that infrastructure for urban sanitation
is inadequate with less than 5% of the population possessing sewerage networks and
only a trivial portion of the wastewater is treated. Furthermore, 20% of households
have no access to any kind of toilet facility; about 31% depend on community toilets,
while 22% has access to pit latrines. Kumasi ventilated improved pit are used by about
7% of households with only 9% having access to water closets. There are generally
15
improved access to water in the rural and urban regions which causes a corresponding
increase in the release of faecal sewage and wastewater leading to more waterlogging
and stagnant pools of water in many towns and cities in Ghana because of lack of
drains. Poor quality of water and inadequate sanitation has a consequential effect on
public health and contributes to 70% of the diseases in Ghana (Water Aid, 2001). Also,
in sub-Saharan Africa, wastewater goes untreated causing water contamination that
activates the spread of waterborne diseases such as diarrhoea and cholera (WHO,
2007; 2008).The projected volume of wastewater released per year in the Middle East
and North Africa (MENA) region is 22.3 km3, of which 11.4 km3 is treated (Sato et al.,
2013). In the MENA region, the efficiency of wastewater treatment is extremely
inconsistent and a lot of treatment plants have limitations to treat a mixture of domestic
and industrial wastewater. Furthermore, the treatment plants do not have the ability to
put up with large capacities of wastewater as a result of increase in urban populations.
The retention times for treatment of wastewater in some plants have become too little
to be effective (Qadir et al., 2007).
The use of treated wastewater is important in the water threatened MENA region to
solve the problem of water scarcity. Presently, about 51% of treated wastewater is
used for irrigation. FAO (2005) projected that 217,527 ha are irrigated with treated
wastewater in Egypt whereas in Syria, 9000 ha are irrigated with treated wastewater
while 40,000 ha received untreated wastewater. Similar situation was observed in
Morocco where 8000 ha were irrigated with untreated or partially treated wastewater
(USEPA, 2004; Sato et al., 2013). In Tunisia, 240 mm3 of wastewater is collected
annually. 187 mm3 (78%) of the 240 mm3 are treated volume obtained from 61
treatment plants. 41 of the 61 treatment plants have capacity per day of less than 3500
m3, 10 of them have capacity per day of 10 000 m3, and the rest with the largest
capacity of 120 000 m3/d. Many of the people living in the large urban centres are
privileged to have good sanitation system and adequate facilities for treating
wastewater. The sanitation coverage for the entire population is 85% whereas the
urban and rural areas have a coverage of 96% and 65% respectively. Industries have
to follow the standards established by the Tunisian government (INNORPI, 1989)
before discharging their wastewater into the sewerage system. Furthermore, subsidies
were given to the industries in their purchase of equipment used for pre-treating their
waste before releasing into the sewerage system. Many treatment plants are
16
positioned along the shoreline to safeguard coastal resorts and prevent pollution of
waterbodies. The majority of wastewater generated in the municipality is from
domestic sources (88%). The wastewater obtained in the areas is subjected to
secondary biological treatment in oxidation ditches and stabilisation ponds. In many
of the towns, several master plans for the sanitation processes are being established
to enhance the treatment of wastewater and the safety of the populace.
The monitoring of water quality is often very poor and inadequate in most Africa
countries (Re et al., 2011; Wang et al, 2013). Most laboratories found in water works
or WWTPs are not well equipped hence limiting them to testing few water quality
parameter like temperature, turbidity, pH and alkalinity. This is exemplified in Nairobi
(Kenya), where only few water works monitors overall organic carbon due to lack of
infrastructure. In Kampala, many industries discharge their effluent illegally. Despite
the fact that environmental agencies are conscious of the illegal discharge they cannot
monitor these industries as a result of inadequate effective monitoring system. Another
reason for poor monitoring in most Africa countries is inadequate monetary support
from the government for continuous advancement and maintenance of wastewater
treatment facilities. Example, the use of jar tester made since 1938 is still in practise
in Nairobi. Finally, lack of power supply is also a hindrance to the treatment of waste
in Africa because electricity is needed as source of energy for most plant (Wang et al.,
2013).
2.2.2 Wastewater treatment plant: Southern Africa development community In Africa, about 300 million and 313 million people lack access to clean water and good
sanitation respectively, and these are the root cause of many diseases (African
Development Bank Group, 2015). Uncontrolled and direct reuse of wastewater is a
known practice in most African countries due to limited wastewater treatment.
Southern Africa is not an exception because the sanitation coverage in Southern Africa
has increased from 28% to 36% in 1980 and 1990 respectively (Snyman, 2006). The
number of people measured in percentage that has access to collect and dispose
wastewater either in treated or untreated form is referred to as sanitation coverage.
According to Snyman (2006), about 35% of the people have access to collect and
dispose excreta. The methods of excreta disposal is mainly individual based
comprising of septic tank system and simple latrines. Conventional and small bore
17
sewers constituting the communal systems are scarce and accessible only in few
urban high income areas (UNEP – IETC, 2002).
Zimbabwe, a semi-arid country is dependent on steady rain with their average yearly
rainfall as low as 657mm that varies with locations. The country has a good sanitation
coverage of 97% in their main towns making it possible for wastewater to be used as
a water resource (Thebe and Mangore, 2012). Conventional sewerage systems are
used for the collection and transportation of sewage to the treatment plants. The
quantification of industrial and domestic effluents are made difficult because of the
inter-connected sewer drains. Zimbabwe government do not allow the use of combine
sewers (Nhapi and Gijzen, 2002). This implies that storm water flows unswervingly
into rivers, streams, and reservoirs in the juxtaposition of the cities. Among the137
wastewater treatment plants in Zimbabwe, 101 are waste stabilisation ponds
(Madyiwa, 2006). The largest volume of sewage in Harare and Bulawayo is treated by
improved activated sludge systems with biological nutrient removal followed by the
conventional trickling filter system. These systems are used to make sure that most
plants conform to effluent discharge regulations (Thebe and Mangore, 2012). In
Zimbabwe, the municipalities in the urban areas are charged with the responsibility of
treating wastewater. Some industries and wastewater treatment plants release
partially treated or untreated wastewater directly into the storm drains leading to the
immediate pollution of reservoirs and streams with wastewater. The rate of wastewater
treatment sometimes fails to comply with the standards stipulated as a result of
malfunctioning facilities at the treatment plants. The councils in urban regions have
been financing the rehabilitation of existing treatment plants instead of constructing
new plants. The major limitation is financial deficiency in the replacement of old
wastewater collection and treatment facilities and improper disposal systems since
treated wastewater is disposed directly on farmland. This is the reason behind the
non-adherent of wastewater disposal guidelines specified in the Statutory Instrument
6/2007 of the Environmental Management Act of Zimbabwe since wastewater is
applied excessively on land (Chiris et al., 2017; Thebe and Mangore, 2012).
Namibia is one of the most arid countries in the world bordered by two deserts (the
Namib Desert in the west and Kalahari Desert in the east). The rainfall per year in
Windhoek is almost 370 mm (Department of Water Affairs, 1988). Soon after the
18
independence of Namibia in 1990, the Water Act of 1956 was reviewed (Sibeya,
2016). The subdivisions of the revised Water Act of 2013 that address the release of
industrial wastewater include Section 21(1), which states that the treatment of
wastewater shall form an integral part of water usage. It goes further to specify that
treated wastewater shall comply with the General Standard Quality restrictions
(Sibeya, 2016). In addition, this Section 21(2) stipulates that treated wastewater be
discharged as close as possible to the original water (Sibeya, 2016). In 2013, Namibia
reviewed the then existing Water Act of 1956, and catered for the prohibition of release
into the sewerage system, of any industrial effluents from tannery, abattoir, brewery,
dye-house or any other intolerable industrial waste which might constrain the biological
activity of the wastewater treatment facility of a local authority (Sibeya, 2016). This led
to industries being made responsible for treating the wastewater they produced, (on
their premises) before releasing effluent into the environment (Lahnsteiner and
Lempert, 2005).
Botswana is a landlocked country with water scarcity that is severe. The average
rainfall is about 450 mm/year. In Botswana, the main source of water supply is
groundwater which serve about 80% of the masses. The restrictive water resource in
Botswana has put a strain on efficiency of water (Opelo and little, 2004). Conventional
wastewater treatment (ponds, biofilters and activated sludge) is used to treat
wastewater before discharging into the environment. Ponds are used for the small
centres because of the ease and cost of operating them while the more compact
activated sludge is used in the main centres. It was noted that pond systems evaporate
or waste more water that the more compact activated sludge process and it was
encouraged that these systems should be considered where and when re-use is
expanded (Opelo and Little, 2004).
South Africa has between 40 to 60% water stress as a result of low average rainfall
per year and high rate of evaporation (Eberhard and Robinson, 2003; Adewumi et al.,
2010). In South Africa, a lot of communities struggle to have access to reliable and
acceptable quantities of potable water for various water requirements. This is against
the backdrop of declining availability of freshwater and water demand increase.
Presently, the interest in the wastewater reuse for non-drinking water requirements is
increasing (Adewumi et al., 2010).Most WWTPs in South Africa are relatively small
19
systems and there are about 51 plants within the eight provinces processing waste
between <500 m3/day – 10000 m3/day depending on the size of the plant. It is believed
that for any wastewater plant to function effectively, it must be upgraded or maintained
continuously by competent operations staff to avoid unnecessary breakdown that may
cause pollution to water bodies leading to outbreak of water borne diseases.
Morrison et al. (2001) in their study investigated the physicochemical properties of
receiving water bodies versus treated wastewater final effluents in rural areas, and it
revealed that the Keiskammahoek treatment plant in the Eastern Cape has poor water-
borne sanitation. Their investigation showed that the levels of biological oxygen
demand (BOD) and dissolved oxygen (DO), surpassed EU standards for the safety of
the aquatic ecosystem and that the river Keiskamma located in the Eastern Cape
where the treated water is discharged is eutrophic as a consequence. Igbinosa and
Okoh (2009) did a study on a water treatment plant within the rural community in the
Eastern Cape and observed that the effluents after treatment did not meet the required
standard in terms of organic waste, dissolved oxygen, COD, orthophosphate, nitrates
and nitrites critical for the provision of water that is clean and safe. These research
revealed that effluent generated from the treatment used in the studies represent a
significant health and environmental hazard to rural communities who are dependent
on the receiving waterbodies as their source of domestic water use.
The lack of effective treatment would not only affect the health of humans but also be
detrimental to aquatic organisms. Therefore there is a need for constant regulation of
pollution of the surface waters in rural Eastern Cape Province. It was recommended
that provincial government and all environmental agencies should have measures to
certify that released wastewater after treatment conform with standard rules and
regulations (Igbinosa and Okoh, 2009). Similar investigation was carried out by Mema
(2010) in which he identified poor operations and maintenance as an underlying cause
of inadequate effluent treatment in four municipalities used in his case studies which
included the waste water treatment plants found in the Eastern Cape, Western Cape
and Kwa Zulu Natal. Mema (2010) emphasised that such discharges and
consequential leachates into ground water has led to several disease outbreaks in the
different provinces that can be directly linked to inadequate waste water treatment.
20
Several researchers have asserted that industries can be regarded as a major
contributor to water and land pollution due to the magnitude of environmental
degradation they cause in the environment, (Dan’ azumi and Bichi, 2010; Asia and
Ademoroti, 2001; Amoo et al., 2004). However, the existence of these industries is
inevitable and indispensable. Industrial wastewaters have a hazardous impact on
quality of water, quality of habitat, soil and flowing waters (Ibrahim and Tayel 2005;
Ethan et al., 2003), which if not properly controlled, will put human health and the
environment in serious danger (Odjegba and Bamgbose, 2008). These wastes and
emissions produced from most of these industries comprise of both hazardous and
toxic substances that are detrimental to health of humans once they enter the food
chain (Rajaram and Ashutost, 2008; Jimena et al., 2008; Ogunfowokan et al., 2005;
Setyorini and Ipinmoroti, 2001). Of these hazardous substances, heavy metals (e.g.
Pb, Cd and Hg), and toxic organic chemicals (e.g. pesticides, PCBs, dioxins,
polyaromatic hydrocarbons (PAHs), petrochemical and phenolic compound) have
been highly reported (Gbadebo et al., 2010; Njoku et al., 2009).
Bhagirath and Ratna (2002) stated the association between the development of
industry and the changes in the local surrounding could cause harm to animal
husbandry, crops and humans. Bhagirath and Ratna (2002) reported the links between
industrial development and changes in the micro (local) environment that caused
damage to crops, humans and animal husbandry. A community within the patancheru
industrial belt was used in their study. These authors found out that most people in the
village suffered from various diseases arising from water pollution. Some of these
diseases include diarrhoea, skin infection, abdominal pain, joint pain, defective vision
and respiratory diseases.
A study by Ntuli (2012) on industries located in South Africa which included industrial
sectors such as tanning, textile finishing and food processing industries (edible oil and
sugar refinery industries) demonstrated the inadequacy of the effluent treatment
processes that produced treated water that was within the toxic range. This study
highlighted that the best method for monitoring industrial effluent discharges should
be systematic and automated using water meter reading devices (Ntuli, 2012).
Sandeep and Shweta (2008) also noted that the high exploration and recharging rate,
unsuitable dumping of both liquid and solid wastes combined with the lack of firm
implementation of law and loose governance have immensely contributed to the
21
worsening of the quality of ground water not only in southern Africa but globally. The
alternative method of effluent waste disposal that relies on spillage on land areas has
the detrimental effect of polluting ground water due to seepage as soils generally have
maximum absorption capacities. Such strategies if continued unrelenting could cause
severe challenges in the future (Mukherjee and Nelliyat, 2006).
2.2.3 Wastewater treatment/water quality in the Vaal The Vaal River is the most vital river in South Africa because it is the ever busy river
that forms the backbone of economy in South Africa since it provides services to the
economic hub of South Africa, the Gauteng Province (Tempelhoff, 2006). Quality of
water in the Vaal River alongside with some tributaries to the river is extremely affected
as a result of mines, farmers, urban and dense settlements, and industrial users.
Tempelhoff et al. (2007) pointed out that Vaal River is seemingly under pollution threat.
The major source of water pollution especially in the Vaal according to Mamabolo
(2012) include poor wastewater treatment works management, uncontrolled sewage,
chemical discharges from different industries, leakage and spillage of petroleum, old
mines and pits waste dumping, human settlements, and agrochemicals that are
washed off or seep down from farm fields.
According to Water wheel (2009), many wastewater treatment works (WWTW)
situated in Vaal area do not comply with the stipulated standard by the present
legislation that addresses appropriate treatment of water. This results in diverse issues
affecting the quality of water in this catchment. Department of Water and
Environmental Affairs (DWEA, 2009), stated that poor wastewater treatment works
management, and uncontrolled sewage in the Vaal is due to the absence of skilled
contractors who render services and meagre construction of treatment plant that
reduces the life expectancy of facility; shortage of municipal staff to operate and
maintain water services facilities; and absent or weak municipal systems for the
management of facilities.
This is true as this situation is also applicable in Leeuwkuil Wastewater Treatment
Works where this research was carried out. Rand Water Analytical Laboratory were
contracted to carry out all their analytical test, monitor treatment process through daily
supervision and give full report on compliance of Leeuwkuil plant. However, their
contract were no longer effective from June 2016 due to lack of finance leading to non-
22
compliance by the municipality. This affected the quality of water discharged to the
Vaal River since no laboratory test was carried out from June last year to ascertain
water/effluent standard conformity. Secondly, disinfection with chlorine also stopped
one month before the exit of Rand water contract due to broken/damage equipment
that is used to dose the treated effluent. This caused increase in the level of physico-
chemical parameter of final effluent before discharge into the Vaal River and the
pollution of the river’s downstream.
According to Mema (2010), many studies discovered that the reason for untreated
sewage and poor quality wastewater discharges is poor operation and maintenance.
In addition, poor plant designs, faulty equipments of municipal WWTWs and
overloaded capacity of wastewater also contribute to poor quality wastewater
discharge. This is the case in Leeuwkuil Wastewater Treatment Work. The
infrastructure is designed to treat about 36 Ml/day but instead it treats 42 Ml/day in
summer (the increase is partly due to storm water from rain and increasing population
in the area) and 39 Ml/day in winter (decrease is partly due to the new water
restriction/regulation implemented in the area during the day). Overloading of this
infrastructure may be one of the reason for improper wastewater treatment leading to
noncompliance in terms of discharge of treated wastewater. This has also
affected/damaged the bio-filters and core screen that is supposed to be used to
remove solid particles hence resulting to using mechanical/ manual bar screen which
takes more time and in some case does not remove all the solid causing more damage
by blocking the effluent flow passage (Mema, 2010).
The release of wastewater that was not properly treated results in algal blooms. Based
on that, most rivers in South Africa are faced with the threat of eutrophication (de
Villiers and Thiart, 2007). According to the Mamabolo (2012) eutrophication is caused
by runoff from agricultural and urban activities, septic tank leak, and municipal and
industrial wastewater. All these contribute to accumulation of phosphorus and nitrogen
compounds especially in surface water causing eutrophication. Eutrophication has
been considered to be a relatively important environmental issue when performing an
environmental evaluation of WWTPs (Sibeya, 2016). Wastewater treatment plants
discharge directly into water bodies and are therefore considered point sources of
possible eutrophic pollution based on previous studies according to Mamabolo (2012).
Akpo and Muchie (2011) said that the reduction in dissolved oxygen (DO) caused by
23
eutrophication increases fish mortality and results in the most frequent occurrence of
toxic phytoplankton. The continuing reductions in DO levels may bring about changes
in the composition of species and eventually lead to their death. Through direct contact
and consumption of contaminated water, humans may also be exposed to toxins.
Animals and humans are affected by toxins at a molecular level affecting cells, tissues,
and organs. Other researcher who studied eutrophication in the Vaal are Mostert
(2009) and De Villiers (2009) who conducted research to identify variation in the costs
associated with eutrophication in the Vaal River System. Similarly, Sibanda (2014) in
his research reiterated the economic impact on agriculture and water treatment that
eutrophication had. Gray (1997) and Seanego (2014) stated that the death of algae
leads to increase in organic waste causing reduction in oxygen levels by
decomposition. This causes a decline of aquatic ecosystem diversity.
Mamabolo (2012) is another researcher who carried out a study in the upper Vaal
water management area (WMA) to find out the effect of cooperative governance in the
sewage treatment works. He found out that the problem faced by the upper Vaal WMA
is acid mine drainage (AMD). For more than 130 years, this basin is been mined with
some of the companies not existing presently, yet they are responsible for costly
environmental and socioeconomic impacts. Mamabolo (2012) said since the
government cannot trace the owners of this mines which poses health risk to both
human and the environment, then they should take measures to remedy the pollution.
Department of water affairs and forestry (DWAF, 2004) observed the threat faced by
the water quality of the Grootdraai Dam (in the Vaal) as a result of current mining
activities. Therefore, regulating effluent is important as water pollution has a serious
effect on the environment as a whole, including effects on biotic and abiotic organisms
(Okoh et al., 2007).
Leeuwkuil Wastewater Treatment Plant discharges their final effluent to the Vaal River
which in some case do not comply with the standard of discharging wastewater. Inspite
of the important role played by the Vaal River in providing water to the South African
economic centre, the river remain polluted, hence the reason for this research at
Leeuwkuil to find out reasons for some of the inefficiencies in the treatment of
wastewater.
24
Due to the pollution of the Vaal River, the routine valuation of water and wastewater
quality is very vital in the Vaal in order to safeguard public health safety, aquatic
organism and the surroundings (Okoh et al., 2007). However, water quality data on
fresh and marine waters in South Africa are still infrequent and uncoordinated. As a
result, there exist a need to provide a good and effective wastewater treatment
process locally and globally.
2.3 Treatment of Sewage Treatment Efficiency (TE) refers to the measure of effectiveness to which a treatment
plant reduces concentrations of pollutants in wastewater, also known as removal
efficiency (Khanijo, 2002). The performance of wastewater treatment plants is vital and
needs consistent monitoring due to the fact that the water bodies where the treated
effluent is discharged support life. The effectiveness of sewage treatment plants are
usually measured by evaluating the level of pollution in the influent and the effluent at
the plant discharging into the environment (Sukumaran et al., 2015).
The effectiveness of treatment and qualities of its parameters in terms of the specified
standards determines the performance of each treatment phase. Therefore, WWTP
performance is dependent on state of WWTP's facilities and the strength of treatment
of each treatment units (Qasem, 2011). Environmental regulations are continuously
focussed on the quality of the effluent released from treatment plants. These
regulations include sets of restrictions on the effluent quality that must be adhered to
by any WWTP. There is daily and seasonal variation that exist between wastewater
treatment properties of various WWTP making standardisation of assessment
procedures for all plants very challenging. Base on this, special attention is needed to
evaluate the environmental influences of existing facilities of wastewater treatment
(Kumar and Pinto, 2010).
There are three principal methods of wastewater treatment applicable in most
countries: The first being the preliminary treatment of wastewater involving the
removal of large solid materials that can hamper the easy movement of sewage
through the plants or damage the equipment. Examples of these large solid materials
are wood, heavy grit particles, rags and faecal materials. According to Tebbutt (1983),
most of the huge floating materials can be sieved using bars that are spaced at 20-60
mm and the sieved solid materials are collected from the bars at particular intervals.
25
Grit and silt are made to settle at the bottom of the plant through the reduction of the
velocity of flow to a range of 0.2-0.4 m/s while the organic matters are left in
suspension (Gray, 1997)
Primary treatment involves pumping and containment where the water is directed from
the source through the necessary pipes to the holding container. The water in the
holding container is screened using mechanical coarse grid to eliminate bulky debris
like garbage, leaves, papers, sticks and other particles that are capable of interfering
with the next treatment step. The screened water can be stored in the appropriate
storing containers for a few days to allow natural biological purification to take place.
The water in the storage container is subjected to a pre-conditioning process where
the water that has a lot of hardness causing salt is treated with sodium carbonate to
precipitate the calcium carbonate. Finally, pre-chlorination is done to reduce the
growth of foul producing organisms on the pipe-work and tanks (Metcalf and Eddy,
1972; United State Environmental Protection Agency, 2004). Removal of pathogens
during primary treatment varies with different rates of removal for different pathogens
(Gray, 1997; IAWPRC study group, 1991). The commonly used method of treatment
in the United States before the implementation of the Clean Water Act in 1972 was
primary wastewater treatment however the Act enforced the application of secondary
treatment.
Secondary treatment involves pH adjustment where the acidic water is treated with
soda ash or lime to raise the pH. This process enhances coagulation and flocculation.
Coagulation, being the next process in this stage involves the use of chemicals
(aluminium sulfate also known as alum) to glue or stick with the small suspended
particles causing them to settle at the granular media filter. Flocculation is the joining
of the particles to form large settable particles which can be settled out. This is done
in a flocculation basin and water leaving this basin flows into the clarification or settling
basin. The settling basin is a huge tank with low flow rate which allows the floc or large
particles to settle at the bottom. This process is followed by filtration which is the last
step in the secondary treatment where the floc is separated from the water (USEPA,
1992). The major aim of secondary treatment is to decrease the biological oxygen
demand caused by reducing organic matters (USEPA, 1992). To achieve this, a great
quantity of biological unit operations are made accessible which consists of bacteria
that cannot manufacture their own food and make use of the organic materials for
26
energy production and development in aerobic environments. These operations are
classified into fixed film processes based on the microbial population. Fixed film
reactors consists of biofilms adhered to a fixed surface where organic matters are
adsorbed and broken down aerobically. In suspended growth reactors, the organisms
mixed freely with the sewage and are maintained in suspension by mechanical
agitation or mixing by air diffusers (Horan, 1990). Several studies have shown that
biological oxidation systems can remove more than 90% of pathogenic bacteria from
sewage. However, there is a variation in the removal of viruses and the major
mechanism for removing viruses is by adsorption (Gray, 1997; IAWPRC study group,
1991; Kott et al., 1974; Lloyd and Morris, 1983). Historically, the first trickling filter used
in secondary treatment was fixed at Salford near Manchester, England in the year
1895. Since that year, many other filters were installed and used in the treatment of
wastewater (Stanbridge, 1976).
The next stage of treatment after secondary treatment is the tertiary treatment in the
municipal water treatment plant which involve the disinfection of the filtered water
using chlorine a process called chlorination or ozone or ultraviolet radiation (United
State Environmental Protection Agency, 2004; Metcalf and Eddy, 1972). Increase in
the development of industries in the world has resulted in drastic water pollution and
South Africa is not an exception. This can be traced to increase in a high load of waste
water the treatment plants are receiving. This increase can also impact negatively on
the municipal water treatment plants because there will be an increase demand for
resources needed to buy equipment and relevant chemical for the purification of water.
In the situation where the resources are not provided, there exists a possibility of
discharging incomplete treated water to the citizenry and water bodies. This will result
in water pollution which can be devastating (Kamika and Momba, 2013; Yi et al., 2011).
Leeuwkuil Wastewater Treatment Plant also has three treatment methods consisting
of firstly primary treatment involving the removal of materials such as rags, plastics,
sand, metal particles using mechanical screens. The second one is secondary
treatment which involves an organic and inorganic solids removal by sedimentation
while floatable material are removed by skimming. Also 25-50% COD reduction, 50-
70% of suspended solids and 65% of oil and grease is achieved by the use of
microorganisms to decompose sewage and break it down to simpler organic and
inorganic form. It means separation of solids and water takes place at this stage. The
27
final stage is the treatment at the tertiary level involving the disinfection of effluents
that are treated with chlorine before discharging the supernatant/clear water into the
river.
Biological sewage treatment is among the advance techniques of sewage treatment
involving microorganism application in the breakdown of pollutants (Abraham et al.,
1997) and this method is also applicable in Leeuwkuil WWTP. This is a secondary
process but Leeuwkuil treat up to tertiary level. This method of wastewater treatment
process is directed towards the highest reduction of BOD of wastewater with a minimal
reduction of biological solids. According to Abraham et al. (1997), the reduction in the
BOD of wastewater is attained by eliminating materials with high demand for oxygen
from the system through the metabolic activities of the microorganisms, elimination of
surplus microorganisms from the system, microorganisms collection and recycling in
the system, and the separation and settling of activated sludge solids to make an
acceptable quality of wastewater effluents. This biological treatment of wastewater is
divided into on-site and off-site treatment system. On-site treatment of wastewater
involves treating wastewater from home or business and returning of the treated
wastewater back into receiving environment. Off-site treatment of wastewater involves
the treatment of wastewater that has been conveyed using sewerage system. The
treatment methods adopted in treating sewage by the wastewater treatment plants
also depends on the composition of sewage in the treatment plant.
2.4 Composition of Sewage Wastewater and other forms of waste which can be carried in a liquid medium that are
produced by industries in most countries are channelled mostly to municipal water
treatment plants where they are treated for recycling purposes (Gray, 1997; Tebbutt,
1983). The composition of wastewater reflects the way of life of people and the
technologies applied in the community (Gray, 1997). A typical example of the
wastewater obtained from domestic activities is sewage. Sewage is a composite
mixture of inorganic and natural organic substances. Most of the organic compound in
sewage occurs as fats, protein, amino acids, volatile acids and carbohydrates. The
mineral components of sewage include Ca, K, Mg, Na, S, Cl, phosphate, ammonium
salts, bicarbonates and heavy metals (Tebbutt, 1983; Horan, 1990; Lim et al., 2010).
Sewage also consists of a wide range of organisms like viruses, bacteria and protozoa.
Most of these organisms are believed to be mild in their action and can also be applied
28
in biological treatment of sewage. However, sewage also comprises of harmful
microorganisms which are released by sick individuals and symptomic carriers
(Tebbutt, 1983).
Heavy metal concentrations in drinking water are higher than some internationally
accepted standards in most parts of the world. The presence of heavy metal in drinking
water and its bioaccumulation in the food chain are of serious concern, thus routine
environmental monitoring and tracking of such contamination is of utmost importance
to researchers (Martin, 2009; Jaishankar et al., 2014). Research has shown that there
are a million individuals with unending heavy metal poisoning which has become a
global public health problem, while about 2 million children die every year from
infections for which polluted drinking water is the main cause (US Department of
Health and Human Services, 2008). Heavy metals in drinking water have been found
to cause negative impacts on the health of human through food chain contamination.
It has been proven that heavy metal toxicity is a major threat with several health risks
associated with it. The major risks to human wellbeing from heavy metals are linked
to lead, cadmium, mercury and arsenic contact. These metals have been broadly
examined and their adverse consequences frequently audited by worldwide bodies,
such as the World Health Organisation (WHO, 1982). Heavy metals are being
discussed extensively in this study based on their impact in the environment (Naidoo
and Olaniran, 2014).
2. 4.1 Heavy metals The term “heavy metals” refers to any metalloids or metallic elements with high density
that is greater than 5 g/cm3 and are said to be toxic at minute concentration (Lenntech,
2004). These metals collectively account for less than 1% of the composition of the
earth’s crust (Ogunleye and Izuagie, 2013) and occur in dissolved form in water,
particulate and colloidal phases (Adepoju-Bello et al., 2009).Their existence in water
can be traced to mineral erosion within sediments, ore deposits leaching and
volcanism extruded products, domestic effluents, harbour channel dredging, solid
waste disposal and industrial effluents. These are believed to be the anthropogenic
origin of heavy metals in water bodies (Marcovecchio et al., 2007).
Heavy metals are broken down into essential metals such as copper, manganese,
zinc, and iron, and non-essential metals such as cadmium, lead, and mercury (Fazli
29
et al., 2015). Copper (Cu), Zn, and Ni at low concentrations have been reported to
perform an essential role in several physiological functions of living being by providing
vital co-factors for metallo-proteins and enzymes (Fazli et al., 2015). Furthermore,
according to Adepoju-Bello et al. (2009), manganese, cobalt, copper, iron,
molybdenum and zinc are required at minimal levels as catalyst for enzymatic
functions. However, there is the likelihood of toxic reaction in the instance of excessive
exposure of these metals to organisms. The complex formation of these metals with
the proteins in the organisms which involves the carboxylic acid (–COOH), amine (–
NH2), and thiol (–SH) functional groups of the proteins enhances the production of
toxic effects by the metals. These reactions between the metals and the proteins
results in the formation of modified biological molecules which have lost their ability to
function effectively resulting in the malfunctioning of the cells and consequently, the
death of the cells. The binding of these metals to the functional groups of these
proteins have the tendency to affect the protein structure and inactivate important
enzymatic systems that is connected to the catalytic attributes of the enzymes. There
is a possibility of this type of toxin resulting in the production of radical, dangerous
chemicals, capable of causing oxidation of biological molecules (Fazli et al., 2015).
Olafisoye et al. (2013) reported that human beings exposed to these heavy metals
either by consuming food or drinking of liquid substances (ingestion) infested with
these metals experienced harmful effects over time as a result of the metals
accumulation in the body. It has been observed that people living or working in an
industrialised area that utilises these heavy metals and their compounds, and disposal
sites where these metals are not properly disposed or incinerated where applicable,
have higher risk of exposure with significant effects thereafter (Martin and Griswold,
2009). Based on the environmental and human impact of these heavy metals, a brief
discussion of their sources, biological importance and negative effect of over exposure
becomes necessary in this study.
2.4.2 Sources of heavy metals Heavy metals consists of single metals or compounds which are natural components
of the environment, but their uncontrolled use for human purposes has altered their
geochemical cycles and biochemical balance (Martin and Griswold, 2009). Heavy
metals can be released into the environment by either anthropogenic or natural
causes. They occur as natural components on the earth’s crust, making them
30
tenacious environmental pollutants because they cannot be degraded or destroyed.
They enter the body system via food, air, and water and bio-accumulate over a period
of time (Lenntech, 2004; UNEP/GPA, 2004). In rocks, they occur as ores in diverse
chemical state, from which they are recovered as minerals. Some exist and can be
recovered as both sulphide and oxide ores such as iron, copper and cobalt (Duruibe
et al., 2007).
Anthropogenic sources of heavy metal pollution include those connected to fuel from
fossils and burning of coal, wastewater from industries, disposal of solid waste,
fertilisers, mining, sewage discharge and metal processing (Hutton and Symon,
1986).The major cause of emission for the anthropogenic sources specifically is
mining operations (Hutton and Symon, 1986; Battarbee et al., 1988; Nriagu, 1989). In
some cases, even long after mining activities have ceased, the emitted metals
continue to persist in the environment. Peplow (1999) reported that hard rock mines
are operated between 5-15 years until the minerals are depleted. However, metal
contamination that occurs as a consequence of hard rock mining persists for hundreds
of years after the cessation of mining operations.
In the last decade (January 1, 2000 – December 31, 2009), there has been an increase
in both industrial activities and urbanisation in Africa. This has led to upsurge in the
amount of various waste including heavy metal discharged into the environment in all
parts of the continent leading to potential heavy metal pollution. Studies carried out by
Alo and Olanipekun (2004) confirms mining activities as heavy metal sources of
contamination in Africa. Example, arsenic in Namibia and South Africa, mercury in
Algeria, tin in Nigeria and Zaire and copper in the Zambia (Alo and Olanipekun, 2004).
These led to excessive discharge of metal-rich mine tailings and metal smelting which
subsequently led to pollution. It has been pointed out that there could be other sources
of environmental pollution in African region such as leather tanning, electroplating,
emission from vehicles car exhaust, production of fuel and energy, rigorous agriculture
and sludge deposition. Crude oil and hydrocarbon exploration and exploitation also
pollute the surroundings with large amount of toxic metal. However, mining activities
still take the first priority in heavy metal discharge into the environment. These
activities result in excess release of heavy metals such as Mercury (Hg), Cadmium
(Cd), Arsenic (As), Chromium (Cr), Lead (Pb,), Nickel, (Ni), Cobalt (Co), Zinc (Zn),
Copper (Cu), Iron (Fe), and Manganese (Mn) into the soil and waterbodies. Persistent
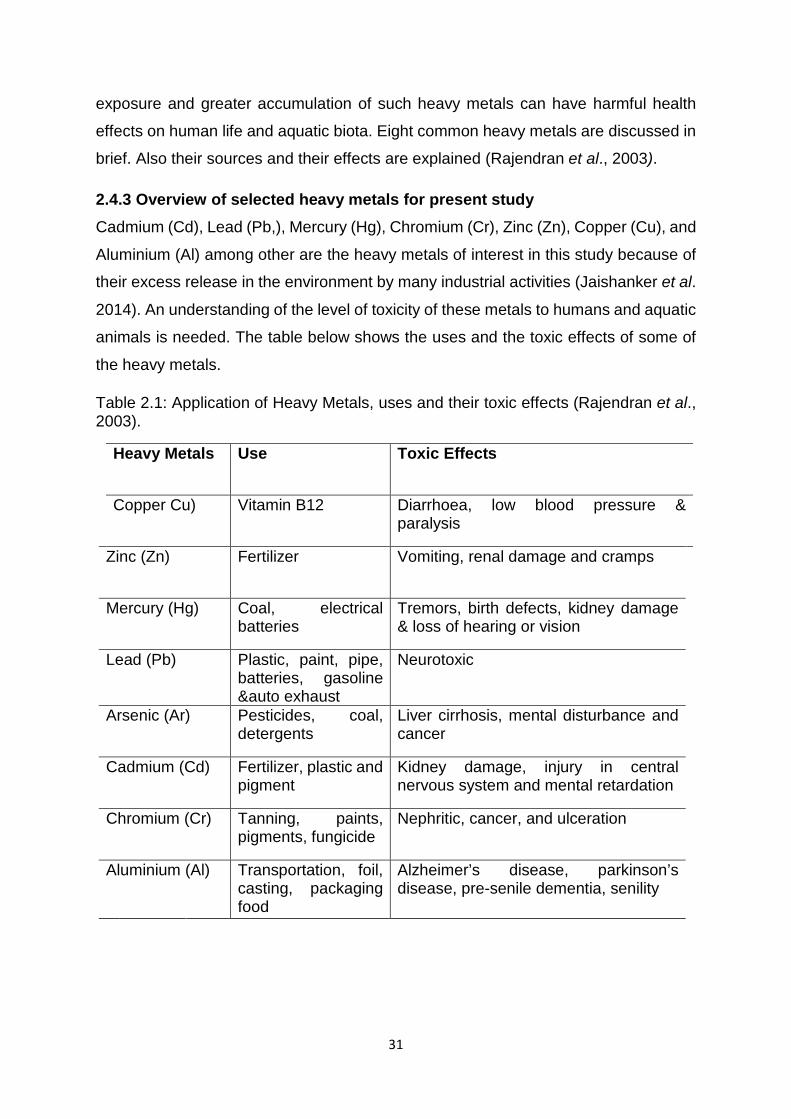
31
exposure and greater accumulation of such heavy metals can have harmful health
effects on human life and aquatic biota. Eight common heavy metals are discussed in
brief. Also their sources and their effects are explained (Rajendran et al., 2003).
2.4.3 Overview of selected heavy metals for present study Cadmium (Cd), Lead (Pb,), Mercury (Hg), Chromium (Cr), Zinc (Zn), Copper (Cu), and
Aluminium (Al) among other are the heavy metals of interest in this study because of
their excess release in the environment by many industrial activities (Jaishanker et al.
2014). An understanding of the level of toxicity of these metals to humans and aquatic
animals is needed. The table below shows the uses and the toxic effects of some of
the heavy metals.
Table 2.1: Application of Heavy Metals, uses and their toxic effects (Rajendran et al., 2003).
Heavy Metals Use Toxic Effects
Copper Cu) Vitamin B12 Diarrhoea, low blood pressure & paralysis
Zinc (Zn) Fertilizer Vomiting, renal damage and cramps
Mercury (Hg) Coal, electrical batteries
Tremors, birth defects, kidney damage & loss of hearing or vision
Lead (Pb) Plastic, paint, pipe, batteries, gasoline &auto exhaust
Neurotoxic
Arsenic (Ar) Pesticides, coal, detergents
Liver cirrhosis, mental disturbance and cancer
Cadmium (Cd) Fertilizer, plastic and pigment
Kidney damage, injury in central nervous system and mental retardation
Chromium (Cr) Tanning, paints, pigments, fungicide
Nephritic, cancer, and ulceration
Aluminium (Al) Transportation, foil, casting, packaging food
Alzheimer’s disease, parkinson’s disease, pre-senile dementia, senility
32
2.4.4 Bioaccumulation of heavy metals Bioaccumulation is described as an increase in the level of chemical substances
present in organisms over time when compared to the level of the substances in the
environment (Valavanidis and Vlachogianni, 2010; Lenntech, 2008).The contaminants
that bio accumulate are mostly substances that cannot dissolve in polar solvent like
water but can dissolve in fats and oils, such as polychlorinated biphenyls (PCBs) and
dioxins. These pollutants can be found in fatty tissues, such as the liver, instead of
muscle tissues (Jakimska et al., 2011; Shun-Xing et al., 2007). The introduction of
toxins into the food web can result to the transfer of the toxin from one predator to
another leading to higher levels of pollution in the top predators as they accumulate
those toxins in their tissues (Uaboi-Egbenni et al., 2010; Ahmad et al., 2012).
Alinnor and Obiji (2010) carried out an investigation on heavy metal content of fish
samples in Nworie River in Nigeria to demonstrate the effect of bioaccumulation of
heavy metals. The results demonstrated that some elemental toxicants such as Iron
(Fe), Cadmium (Cd), and Manganese (Mn) were identified in fresh fish species, Tilapia
guineensis. It was also noteworthy that the same research highlighted the presence
of industries in the vicinity that discharged untreated waste products into the water
body as such the bioaccumulation of these heavy metals can be attributed to the
presence of these pollutants released by those industries. Furthermore, these
elemental toxicants will most likely be transferred to humans upon consumption of the
fish from this area thereby posing a health hazard due to cumulative effects in the
body (Odoemelam, 2005, Obodo, 2004; Burger et al., 2002).
A study carried out by Olowu et al. (2009) investigated the level of heavy metals in
crabs and prawns in Ojo River, Lagos, Nigeria. The result of this investigation revealed
that these crabs accumulated chromium and cadmium concentration that exceeded
the National Agency for Food and Drug Administration and Control, Nigeria (NAFDAC)
and WHO standards for consumable food. The increased quantities of cadmium are
associated with inhibition of enzymes in humans who consume such contaminated
crabs (Binning and Baird, 2001). Danis et al. (2006) demonstrated that the impacts of
consuming heavy metals are not immediate but rather become visible only after a few
years. Their persistent presence and ability to bio-accumulate emphasises the need
for easy, cost-effective treatment and biological methods to determine and control
toxicity levels of industrial effluents and help minimise domestic households receiving
33
polluted water. However, it is necessary to initially identify the presence of heavy
metals and their effects in water bodies (Ajao et al., 2012).
2.4.5 Effects of heavy metal pollution Water is South Africa’s most scarce natural resource due to high temperatures and
seasonal rainfall (Strydom et al., 1997) and has been under increasing danger of
contamination in current years. Its status as an emerging economy has meant that it
has experienced in the past decade a rapid trend of industrialisation (Du Plessis and
Smit, 2005; Ayres, 1992) with the novel pattern of industrial areas becoming integrated
with domestic areas of human habitation. The vital impact of industrialisation on the
growth and advancement of the country cannot be underscored. However, the fast
growing industrialisation has its own direct and indirect harmful effects on the
surrounding. According to Nasrullah et al. (2006), the development of industries is
through the establishment of new industries or development of already prevailing
industries. These establishments have led to the production of industrial effluents
capable of causing air, water and soil pollution. Furthermore, spatially small scale
cottage industries have the tendency of releasing untreated effluents into the
environment and possibly cause air, water and soil pollution (Naidoo and Olaniran,
2014). The major cause of deterioration of our surroundings that affects the water we
use, the air we breathe and the soil could be attributed to the pollution caused by the
industries. However, water pollution is undoubtable the major threat to human
wellbeing within the South African context (Du Plessis and Smit, 2005). Several
industries including the Vaal area are involved in metal and coal mining processes
which utilise chemical reactions that involve heavy metals as derivatives and by-
products. These industries exploit fresh water usage in their industrial processes and
discharge effluents that contain heavy metals such as Gold (Au), Copper. Lead, Zinc
and Nickel Lead (Pb), Nickel (Ni), Copper (Cu) and Zinc (Zn) and discharge from
tailings and waste rock impoundments (Banza et al., 2009). Increasingly, these mining
activities threaten the water sources on which humans depend on.
Researchers have found a strong link between individuals residing near industrial
sites, prolong contact to heavy metals and some idiopathic diseases (Duruibe et al.,
2007; Ayres, 1992). A study done in Malaysia found patients with skin cancer
symptoms after a long exposure to arsenic-contaminated well water in Malaysia
(Jaafar et al., 1993). Another study conducted in the Democratic Republic of Congo
34
showed about 43 % increment in cadmium, cobalt, lead and uranium concentration in
the urine of human subjects in the mining regions (Banza et al., 2009). In eastern
Nigeria, a study done by Ibeto and Okoye (2010) in which blood samples were
collected from 240 people living in the urban vicinity were analysed for heavy metals
and showed values that were significantly higher than WHO limits for nickel,
manganese and chromium. The study area in the research is dominated by chemical
and agricultural industries that specialises in the production of herbicides, pesticides,
food additives and halogenated polycyclic hydrocarbons. These sample population of
ordinary people showed a prevalence of heavy metal pollution most likely from this
industries in eastern Nigeria. In a similar study done in different provinces in South
Africa, the degree of pollution by heavy metal was established by evaluating the
concentrations of heavy metals in maternal and umbilical cord blood from people living
in areas ranging from rural, urban, industrial, inland, coastal, fishing and mining sites
(Rollin et al., 2009). High concentrations of lead, mercury, selenium and cadmium
were found in the umbilical cord blood samples of babies indicating the risks of heavy
metal pollution in unborn babies and not just adult alone. It also emphasises that the
dangers of heavy metal pollution is not an isolated incident and judging by the results
of these studies, it would be dangerous to ignore the potential harm to humans.
There is a tendency for heavy metals to enter into the food chain, through food and
water and accumulate through a process called bioaccumulation, causing anaemia,
disorder of kidney, nervous system failure, high blood pressure and others. These
heavy metals do not only damage human tissues and organs but plant tissues as well
(Muneer, et al., 2010; Hanif et al., 2010).Works done by researchers have
demonstrated that most of the heavy metals are often associated with metal poisoning
in humans since most of the metals play no significant function biologically in living
organisms while some of them such as Cu and Zn are essential at minute quantities
but harmful when increased beyond the permissible limit (Ahmad et al., 2012).
There is no doubt that industries contribute enormously to the economic development
of any country in both developed and developing countries. However, their industrial
practices have also produced adverse health effect and environmental consequences
because they have contributed to the pollution level of our surface water and ground
water aquifers. In fact, many aquatic organisms have gone into extinction because of
rapid industrialisation and urbanisation which led to increase in heavy metals in the
35
surroundings as a result of waste being disposed without any appropriate treatment
(Santona et al., 2006). The annual reports of Mills-Knapp et al.(2012)stated that large
number of people in developing countries are more susceptible to harmful pollution
from industrial processes. This is often because small-scale industries lack the
knowledge of the best methods that can reduce waste being generated in their
operations or may not have the knowledge of the used chemical toxicity. Poor
communities where the small-scale industries are regularly located, have minute
capability, either financially or culturally, to take measures to reduce potential
exposure to these chemicals. Additionally, these communities have little or no health
care facilities that can salvage the health effects that arises from the exposure to these
toxic chemicals. Due to low overall standards of health in these poor communities,
such as poor nutrition, which exacerbate the health risks arising from the impacts of
the toxic substance they are exposed to, with children being the most affected because
they accumulate heavy metal pollutants in their tissues twice as fast as adults (Mills-
Knapp et al., 2012). The negative effect caused by these heavy metals has resulted
to untreated wastewater impacting negatively on the surroundings and consequently
human health.
2.5 The Impact of Industrial and Domestic Effluents
2.5.1 Environmental effect Water, a part of the environment, is vital for the survival of all forms of life. It is a unique
substance, because it can be renewed naturally and cleanse itself, by permitting
contaminants to settle out (by sedimentation) break down, or by diluting the
contaminants to a point where they are not present in toxic levels (Mann et al., 2014).
However, this process of nature takes time, and it is hampered when considerably
large amounts of dangerous pollutants are introduced into the water (Akaninwor et al.,
2007). The release of energy, elements, or compounds into the environment at a level
that has the potential to influence biological functions negatively or that present risk at
unacceptable levels to human beings or other organisms that live and survive in the
environment is termed pollution (Fernández-Luqueño et al., 2013). When the released
compounds, elements and energy find their way into our water bodies through
households or industrial activities, it leads to pollution of water. Water pollution is
defined as the addition of contaminants into the water bodies such as lakes, rivers,
oceans, and groundwater to a certain degree that it cannot be used for specific needs
36
such as drinking, bathing or cooking (Owa, 2014). United States Environmental
Protection Agency (1997) defined water pollution as any human-caused contamination
that reduces the quality of water to human beings and other naturally existing
organisms. Despite the huge importance of water, its susceptibility to human impacts
such as contamination from run-off and dumping of waste from human industrial
activities has devastating consequences that affects the economy and impacts human
and livestock health in addition to damaging the aquatic habitat and destroying marine
life. A good example is the bioaccumulation of non-biodegradable compounds and
heavy metals in fish and shellfish which is considered lethal to humans when
consumed in large quantities (Owa, 2014; Dan’azumi and Bichi, 2010).
Water pollution occurs when pollutants such as herbicides, fertilisers, pesticides, and
hazardous chemicals make their way directly or indirectly into water bodies due to
inadequate treatment to remove harmful pollutants (US EPA, 1997). Among types of
water body contaminations, ground water contamination is the most difficult to
rehabilitate globally (Vodela et al., 1997). Water pollution is a major hazard to living
organisms that live both on land and in aquatic environment with humans the most
affected (Mann et al., 2014; Adjegba and Bamgbose, 2012; Tyagi, et al., 2007). The
major effect of this water pollution (caused by the release of these households and
industrial effluents into our water bodies) is reduction in the level of dissolved oxygen.
This occurs due to the activities of organisms in the effluents and their competition for
oxygen with the flora and fauna of the water bodies. Therefore, water may be called
polluted when the physical, chemical and biological parameters reach beyond a stated
level of a particular water use. The physical parameters include temperature, pH,
colour, odour, salinity, total dissolved solids, turbidity, taste, and electrical conductivity
which are good indicators of contamination. The biological parameters comprise of
algae, fungi, viruses, protozoa and bacteria among others. The chemical parameters
include sulphates, carbonates, chlorides, nitrates, fluorides, and metal ions.
The excessive nutrients discharged into the water bodies can result to eutrophication
and reduction in the available oxygen that ultimately alters the biotic community
structure and function. Wakelin et al. (2008) also reported that excess discharge of
turbid effluents can cause sand and grit deposition into the aquatic system, disruption
of sediment characteristics and impede the flow of natural water. Furthermore, the
total physico-chemical and hydrological environment is always influenced by the
37
introduction of poorly treated effluents affecting numerous micro and macro fauna
present in the waterbodies. This can lead to the death of the vulnerable micro and
macro fauna and the survival of the tolerant ones. The situation can lead to
discrepancy among the cluster of organisms present and the total alterations to the
surroundings in the form of light and oxygen contents, food sources in addition to loss
of habitat, and nutrient modification (Wakelin et al., 2008).
Hydrocarbons, detergents, pesticides, nitrogen, phosphorus, and heavy metal are the
major chemical contaminants of wastewater. Larsdotter (2006) reported that nitrogen
and phosphorus are known to be nutrient limiting and the occurrence of nitrogen in the
discharged wastewater can be unpleasant due to its ecological and public health
impact. Nitrogen occurs mainly in organic form and their occurrence is linked to
municipal sewage disposals and application of fertilizer to agricultural crops (Hurse
and Connor, 1999). The excess nitrogen in water bodies as a result of municipal
sewage disposal and fertilization application can result to the formation of ammonia
which is poisonous to fish and exert an oxygen demand on receiving waterbodies by
nitrifiers (Jenkins et al., 2003).The presence of nitrogen and other chemical
contaminants have the tendency to cause algal bloom. Algal bloom disrupts the
inherent composition and diversity of organisms in the aquatic communities hindering
large-scale fishing and posing a problem for treatment of water.
2.5.2: Effect on human health People dwelling near municipal sewage outfalls or polluted water sources are at a risk
of being exposed to diseases as a result of increased pathogenic microorganism and
worsening physico-chemical parameters (Wakelin et al., 2008). The recreational users
of waterbodies often experience dangerous situation as a result poor visibility caused
by extreme turbid effluent discharged into the waterbodies and the development of
algal blooms. Furthermore, if these waterbodies are used for contact-recreational
activities it can serve as a media of several diseases contracted either through body
contact or ingestion of the polluted water (Department of Water Affairs and Forestry,
1996). However, the severity of the infection depends on the physical health of the
individual concerned and the type of water borne disease. Odjadjare and Okoh (2010)
reported that the discharge of effluents that are not properly treated often results to an
38
increase in the microbial load of the waterbodies and consequently results to a range
of water borne diseases such as giardiasis and gastroenteritis.
2.6 Laws that Exist In South Africa on Protection of Rivers Effluent standards refer to restrictions imposed relating to quantities, rates, and
concentrations of materials in wastewater discharge (World Bank, 2012). Regulating
effluent is important as water pollution has a severe effect on the environment,
including biotic and abiotic organisms. Many countries of the world have developed
laws that help to monitor the discharge of these effluents into the water bodies thereby
controlling water pollution and reducing untreated wastewater impacts. South Africa is
not an exception. The country has developed many Acts and policies with respect to
the control of water pollution.
The laws that exist in South Africa to protect our water resources are as follows
2.6.1 National Water Act, Act No 36 Of 1998 This Act ensures that the water resources of the nation are protected,
developed, controlled, used, managed and conserved in a way that it considers
the following factors: promoting fair and impartial access to water;
meeting the rudimentary needs of human for present and future generations;
promoting the beneficial, sustainable and efficient use of water in the public
interest;
facilitating economic and social growth;
redressing the outcomes of past gender and racial discrimination;
meeting international obligation;
promoting dam safety;
preventing and reducing contamination and dilapidation of water resources;
providing for growing demand for water use;
managing floods and droughts;
protecting aquatic and associated ecosystems and their biological diversity.
2.6.2 National Environmental Management: Air Quality Act, 2004 (Act No. 39 of 2004) The purpose of this Act is to ensure that the environment and natural resources are
secured and managed in such a way that the continuity of the resources is conserved
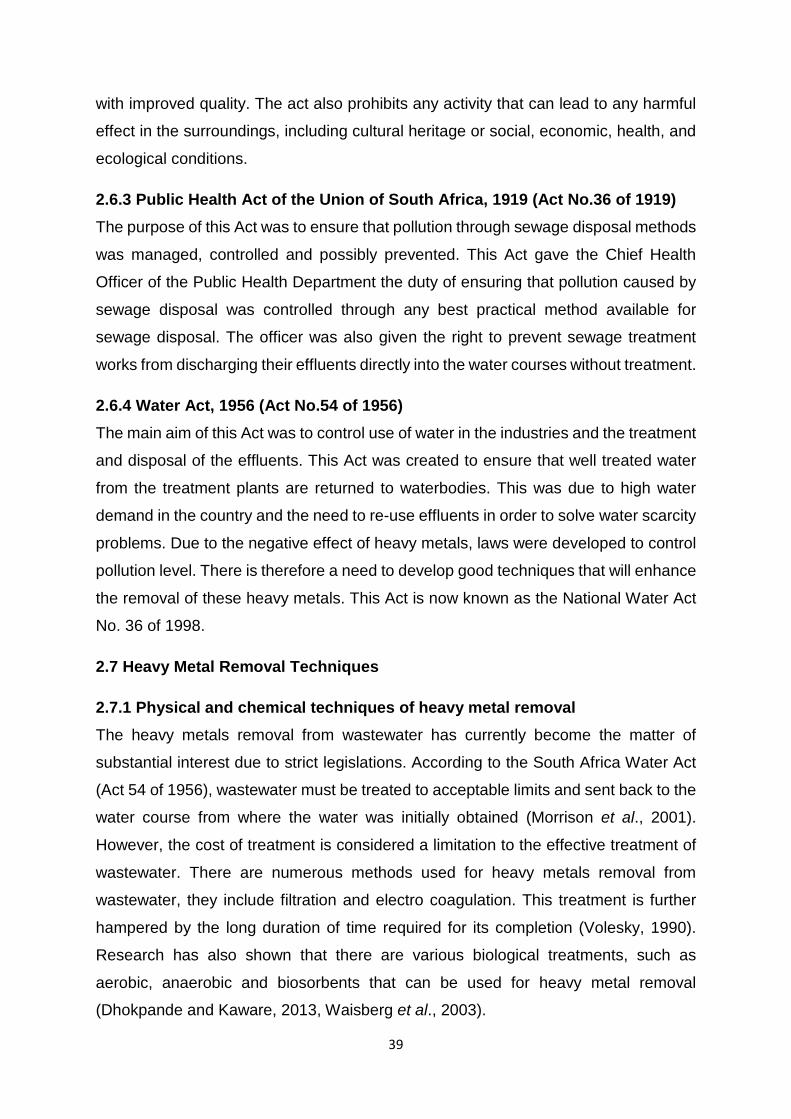
39
with improved quality. The act also prohibits any activity that can lead to any harmful
effect in the surroundings, including cultural heritage or social, economic, health, and
ecological conditions.
2.6.3 Public Health Act of the Union of South Africa, 1919 (Act No.36 of 1919) The purpose of this Act was to ensure that pollution through sewage disposal methods
was managed, controlled and possibly prevented. This Act gave the Chief Health
Officer of the Public Health Department the duty of ensuring that pollution caused by
sewage disposal was controlled through any best practical method available for
sewage disposal. The officer was also given the right to prevent sewage treatment
works from discharging their effluents directly into the water courses without treatment.
2.6.4 Water Act, 1956 (Act No.54 of 1956) The main aim of this Act was to control use of water in the industries and the treatment
and disposal of the effluents. This Act was created to ensure that well treated water
from the treatment plants are returned to waterbodies. This was due to high water
demand in the country and the need to re-use effluents in order to solve water scarcity
problems. Due to the negative effect of heavy metals, laws were developed to control
pollution level. There is therefore a need to develop good techniques that will enhance
the removal of these heavy metals. This Act is now known as the National Water Act
No. 36 of 1998.
2.7 Heavy Metal Removal Techniques
2.7.1 Physical and chemical techniques of heavy metal removal The heavy metals removal from wastewater has currently become the matter of
substantial interest due to strict legislations. According to the South Africa Water Act
(Act 54 of 1956), wastewater must be treated to acceptable limits and sent back to the
water course from where the water was initially obtained (Morrison et al., 2001).
However, the cost of treatment is considered a limitation to the effective treatment of
wastewater. There are numerous methods used for heavy metals removal from
wastewater, they include filtration and electro coagulation. This treatment is further
hampered by the long duration of time required for its completion (Volesky, 1990).
Research has also shown that there are various biological treatments, such as
aerobic, anaerobic and biosorbents that can be used for heavy metal removal
(Dhokpande and Kaware, 2013, Waisberg et al., 2003).
40
Solvent extraction, chemical precipitation, reverse osmosis, ion exchange, membrane
filtration, electro dialysis, evaporation, oxidation and activated carbon adsorption are
examples of conventional methods used in heavy metal removal (Volesky, 1990,
Volesky and Naja, 2007) as summarised in Table 2.1
Table 2.2: Advantages and disadvantages of heavy metal removal techniques (Ghazy et al., 2008; Dhokpande and Kaware, 2013).
Method Disadvantage Advantages
Chemical precipitation
For high concentration, generates sludge, difficult separation
Simple, cheap.
Ion exchange Sensitive to particles, expensive
Effective metal recovery
Reverse Osmosis High pressure membrane scaling, expensive.
Pure effluent
Chemical Oxidation/reduction electrochemical
Chemicals required for high concentrations, expensive
Mineralisation, metal recovery
Evaporation Expensive, generates sludges
Pure effluent
Hybrid Methods (floatation filtration)
Further research required Low operating costs, high membrane fluxes
2.7.2 Microbial method of heavy metal removal Microbes are good indicators of pollution because the extent of their pollution reduction
can be evaluated using simple methodology, which is relatively rapid and the materials
required for testing are readily available (Maila and Cloete, 2005). It is also regarded
as an efficient method of metal removal because of its low cost, high efficiency and
ecological friendly nature and method for metal clean-up (Haferburg and Kothe, 2010;
Milner and Kochian, 2008; Pulford and Watson, 2003) unlike the conventional physico-
chemical techniques that are expensive and may not be very effective (Hookoom and
Puchooa, 2013). This physico-chemical analysis is not only complex, costly and
laborious but also lacks information on the additive, antagonistic or synergistic effects
of several chemicals on the biotic community in aquatic ecosystem (Tyagi et al., 2007)
41
and does not take into consideration the bioavailability of the contaminants present
(Bielská, 2013).
Biological treatment methods are more appealing as a result of their cost effectiveness
and environmental friendliness as well as the various metabolic pathways and
versatility of microorganisms (Pandey et al., 2012; Ajao et al., 2012) when compared
with chemical oxidation and reduction electrochemical processes which are expensive
due to large amount of chemicals required, although the metals are usually recovered
at the end of the process (Volesky and Naja, 2007). Industrial effluent especially mine
water is mostly characterised by extreme pH (acidity or alkalinity), high salinity, high
concentrations of SO42-, Al and several other toxic metals such as Fe, Cd, Co, Cu, Mo,
Zn, Ni, V. The detection of microorganisms in severe surroundings of pH and metal
concentrations has provided some knowledge on the understanding of microbial
biosynthetic processes which enhance the bioremediation of contaminated areas
(Oarga, 2009).
Studies carried out on the diversity bacteria in sites contaminated with heavy metal
have shown a high diversity of microorganisms (Hookoom and Puchooa, 2013). They
are native organisms that have grown and modify the environment (Hookoom and
Puchooa, 2013). Microorganisms have a diverse methods to deal with high levels of
heavy metals and often are specific to one or a few metals (Mejare and Bulow, 2001;
Nies, 2003; Piddock, 2006). Microbes have developed methods to deal with the metals
either through efflux, complexation, or reduction of metal ions or to use them as
terminal electron acceptors in anaerobic respiration (Haferburg and Kothe, 2010).
Most mechanisms described involve the efflux of metal ions outside the cell, and
genes for tolerance methods which have been found on both chromosomes and
plasmids. Bacteria that are resistant to and grow on metals play an important role in
the biogeochemical cycling of those metal ions (Appenroth, 2010).
Recent works have been done by different researchers to understand metal –
microbes’ interaction, their application for metal accumulation, detoxification and their
removal property (Haferburg and Kothe, 2010; Appenroth, 2010; Hookoom and
Puchooa, 2013). llhan et.al. (2004) investigated the removal of chromium, lead and
copper ions by microorganisms from industrial wastewater. The effect of pH,
temperature, initial concentration on the metal removal was investigated. The optimum
42
pH values were observed to be 2, 3.5, and 4.5 respectively for these three metals. At
the optimised conditions the biosorption values were found to be 88.66, 100 and 44.94
mg/l respectively. It was concluded that Staphylococcus saprophytics was appropriate
mainly for lead and chromium.
Another study on isolation, identification and characterisation of heavy metal resistant
bacteria was carried out by Raja et al. (2008). Wastewater samples across Madurai
district in India were collected then bacteria were isolated and characterised to help
evaluate ideal growth conditions. The minimum inhibitory concentration was also
determined. The sewage isolates showed optimum growth at 30 °C and pH 7.0 for 5
days. They observed that the growth rate of the sewage bacteria in the presence of
heavy metals was consistently slower than the control (Raja et al., 2008).
Sharma et al. (2003) attempted the removal of zinc biologically using Aspergillus sp.
They established the fungal strain in 100 ml conical flask. The initial pH was 5.6, at a
temperature of 30oC. They carried out the experiments using sugar levels of 10, 15
and 20 g/l at dilution rates of 0.08, 0.04 and 0.02 per hour. They detected that there
was no significant increase in the specific zinc uptake with increase in sugar level. The
specific zinc uptake was found to be 120 mg/g of dry biomass at 10 g/l sugar level.
Subhashini et al. (2003) also conducted research on heavy metal removal from
aqueous solution using Schizosaccharomyces pombo in free and alginate immobilised
cells. Batch studies were performed by changing parameters such as pH, temperature
and metal concentration. The optimal temperature was 25oC with a pH of 4. The
maximum removal of 73 % was observed at the initial concentration of 100 ppm with
inoculums concentration of 1%. Their investigation gave an indication that
immobilisation beads are a better metal removal method than free beads.
It is evident from the literature reviewed that many studies carried out on removal of
heavy metals using microbes have shown consistency within bench phases. However,
it cannot be ascertained if these methods will be viable in large scale heavy metal
removal. It is also noteworthy that the effluents of most industrial plants meet all
physico-chemical regulations and more often than not the microbiological standards
are also met; however, their toxicity remains questionable and could still negatively
impact on the receiving water (Movahedian and Asghari, 2005). It is imperative that
concerted measures are needed to test for toxicity of discharge effluent. However, this
43
is a luxury very few industrial plants and wastewater treatment plants can afford in
most developing countries. Equally important is the need to increase capacity to
remove these persisted non-biodegradable toxicants. The major factor contributing to
this impediment is costs. Thus it is a limiting factor to the overall improvement of the
water quality that reaches the end users. Prioritising the determination of the presence
of recalcitrant heavy metals is essential. It is possible that even with financial
constraints when the levels of heavy metal pollution are determined, crucial measures
that are not costly can be taken to ameliorate the problem. Hence microbiological
analysis could be a simpler and cheaper method that helps identify the presence of
heavy metals.
This chapter summarises information pertaining to wastewater treatment and the
treatment approach and effectiveness adopted by treatment plants. The impact of
improperly treated waste water and the laws instituted by South Africa to ensure that
waste water is properly treated are also highlighted. Discussion on the composition of
sewage and the different types of waste water treatment (primary, secondary and
tertiary treatment) found in Leeuwkuil Wastewater Treatment Plant was also included.
44
CHAPTER 3: STUDY AREA AND METHODOLOGY
3.1: Introduction
In this chapter, methods, and procedures employed in this study are described. The
effect of effluent discharged on surface water quality is evaluated in terms of physico-
chemical study, microbiological and molecular characterization. The identification and
quantification of heavy metals from five different industries that discharge their effluent
at a Leeuwkuil sewage plant in the Vaal areas were also analyzed using modern
spectrophotometric techniques and supported by microbiological assays of heavy
metal resistant bacteria.
Description of laboratory analysis carried out on samples collected from the Vaal
River, Leeuwkuil Sewage Treatment Works, potable water sources and the effluent
discharged from five different industries are given and the results are compared with
Green Drop certification and South African General Effluent Standard (SAGES), South
Africa National standards (SANS-241) and the World Health Organisation (WHO)
benchmark for the required standards for discharge into rivers and potable water as
specified by some regulatory bodies.
3.2 Study Area
3.2.1. General description of study area Vereeniging is a city located in the southern part of Gauteng province, South Africa as
shown in Figure 3.1A and 3.1B. This city is very close to Vanderbijlpark (to the west),
Three Rivers (east), Meyerton (north) and Sasolburg (south) as shown in Figure
3.1.The climate of Vereeniging is the same with that of Johannesburg (both cities are
located in Gauteng province) and is mostly influenced by altitude. Although the
province is at a subtropical latitude, the climate is relatively cooler, especially in
Johannesburg, at 1,700 m (5,577 ft) above sea level. Precipitation occurs as brief
afternoon thunderstorms and winter is cool and dry with frost occurring frequently in
the southern areas (Emfuleni Local Municipality, 2013). The minimum and maximum
temperature in summer is 15 °C and 30°C and in winter is between -2°C and 20°C
respectively.
The city is presently one of the main industrial manufacturing centres in Gauteng, with
its principal products being iron, steel, pipes, bricks, tiles and processed lime (Emfuleni
45
Local Municipality, 2013). Vereeniging is under Sedibeng District Municipality which is
positioned on the southern tip of Gauteng Province and strategically located on the
border of three provinces, such as Mpumalanga, North West and Free State
(Sedibeng District Municipal, 2010). Sedibeng district comprises of three
municipalities namely Emfuleni, Midvaal and Lesedi and it is regarded as the fourth-
largest contributor to Gauteng economy because of high-level metal and chemicals
production. (Sedibeng District Municipality, 2010, Haji, 2011). Leeuwkuil Wastewater
Treatment Works (WWTW) is located in Vereeniging within Emfuleni Local
Municipality as shown in figure 3.1. This municipality falls under Sedibeng District and
it offers effluent treatment services to the community. The water resources profile of
the municipality fall under Upper Vaal Water Management Area which is towards the
centre of the country with major rivers being the Vaal River (Emfuleni Local
Municipality, 2013).
The study areas (upstream and downstream) is a part of the Vaal River and is towards
the centre of the country while the inflow and final effluent are located within the
premises of Leeuwkuil wastewater care works as shown in Figure 3.1 and 3.2
respectively. The waste effluent from Leeuwkuil comes from both domestic and
industries which include battery industries, farmland, abattoir, galvanized industry,
wire industry, iron and steel industries and many more from which the five industries
used in this study was selected (Emfuleni Local Municipality, 2013). These industries
produce a large number of effluents which contains toxic waste and high load of
organic matter, which needs to be treated by Leeuwkuil Treatment Plant before their
final disposal/discharge to Vaal River.
Emfuleni Local Municipality owns three conventional activated sludge wastewater
treatment works (WWTW) with varying design capacities and treatment systems +48
as shown in Table 3.1 below.
Table 3.1: Emfuleni Local Municipality Wastewater Risk Abatement Plan.
Name of Wastewater Treatment Works
Design Capacity (Mℓ/d)
Type of Treatment Process
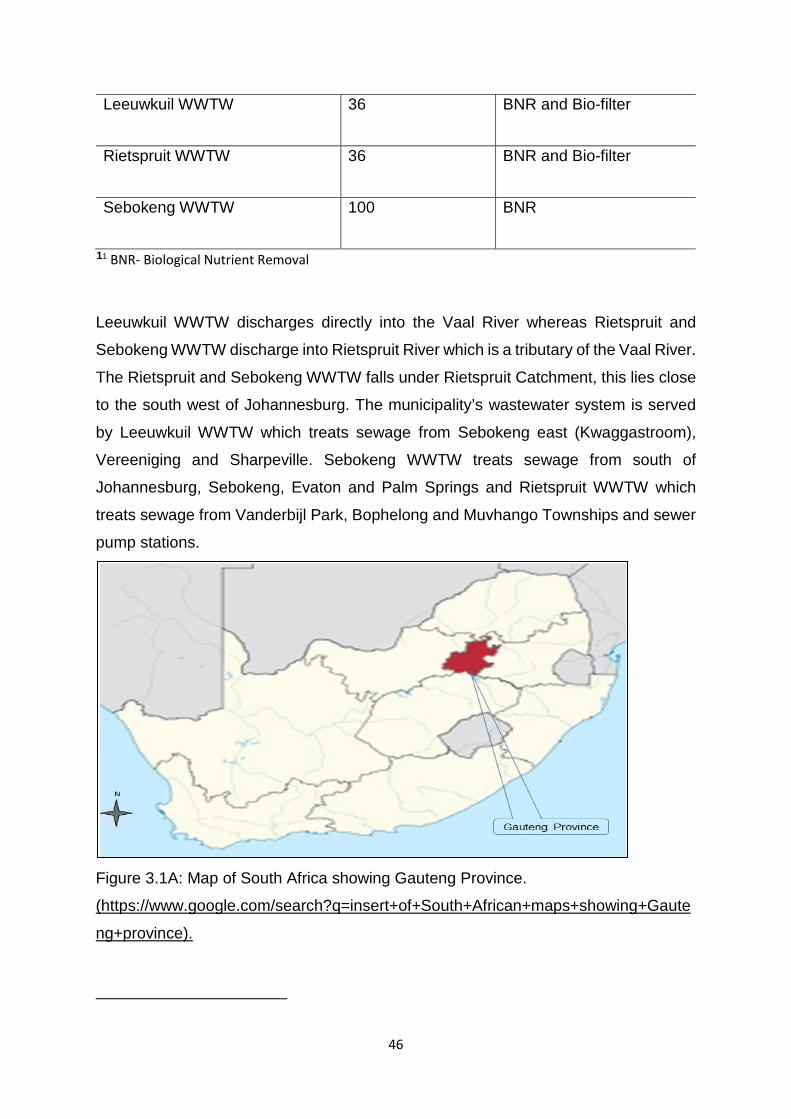
46
Leeuwkuil WWTW 36 BNR and Bio-filter
Rietspruit WWTW 36 BNR and Bio-filter
Sebokeng WWTW 100 BNR
11 BNR- Biological Nutrient Removal
Leeuwkuil WWTW discharges directly into the Vaal River whereas Rietspruit and
Sebokeng WWTW discharge into Rietspruit River which is a tributary of the Vaal River.
The Rietspruit and Sebokeng WWTW falls under Rietspruit Catchment, this lies close
to the south west of Johannesburg. The municipality’s wastewater system is served
by Leeuwkuil WWTW which treats sewage from Sebokeng east (Kwaggastroom),
Vereeniging and Sharpeville. Sebokeng WWTW treats sewage from south of
Johannesburg, Sebokeng, Evaton and Palm Springs and Rietspruit WWTW which
treats sewage from Vanderbijl Park, Bophelong and Muvhango Townships and sewer
pump stations.
Figure 3.1A: Map of South Africa showing Gauteng Province.
(https://www.google.com/search?q=insert+of+South+African+maps+showing+Gaute
ng+province).
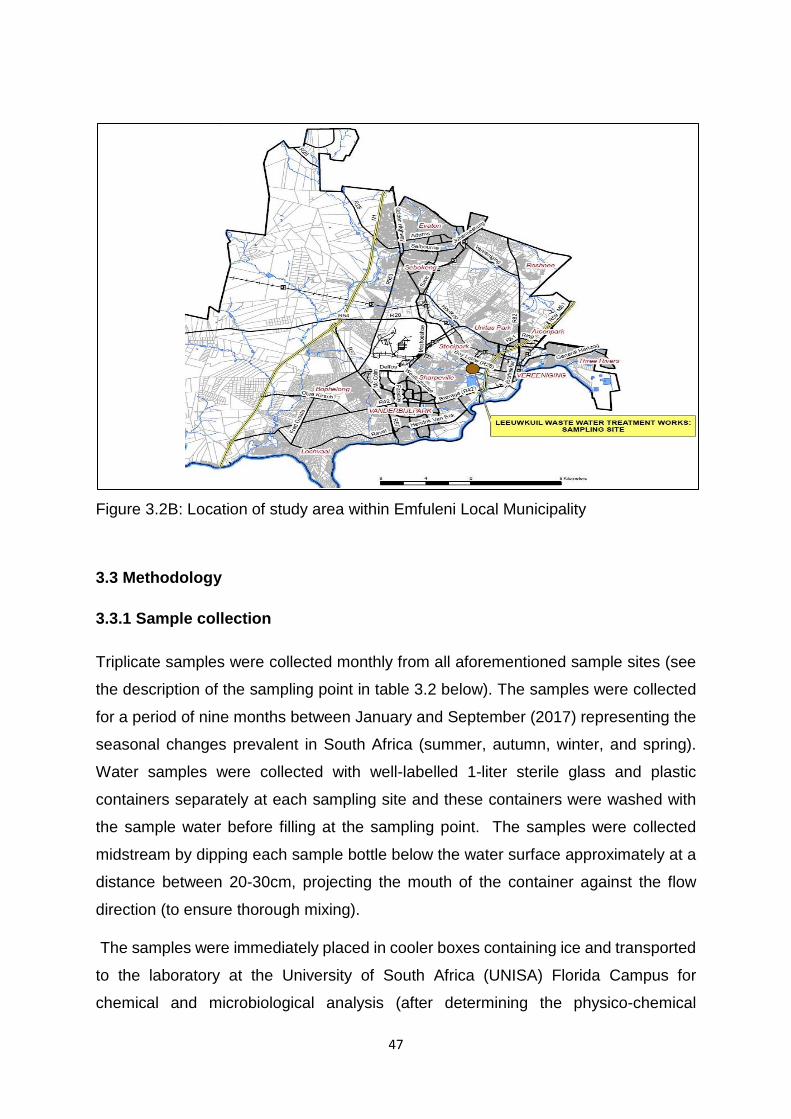
47
Figure 3.2B: Location of study area within Emfuleni Local Municipality
3.3 Methodology
3.3.1 Sample collection
Triplicate samples were collected monthly from all aforementioned sample sites (see
the description of the sampling point in table 3.2 below). The samples were collected
for a period of nine months between January and September (2017) representing the
seasonal changes prevalent in South Africa (summer, autumn, winter, and spring).
Water samples were collected with well-labelled 1-liter sterile glass and plastic
containers separately at each sampling site and these containers were washed with
the sample water before filling at the sampling point. The samples were collected
midstream by dipping each sample bottle below the water surface approximately at a
distance between 20-30cm, projecting the mouth of the container against the flow
direction (to ensure thorough mixing).
The samples were immediately placed in cooler boxes containing ice and transported
to the laboratory at the University of South Africa (UNISA) Florida Campus for
chemical and microbiological analysis (after determining the physico-chemical
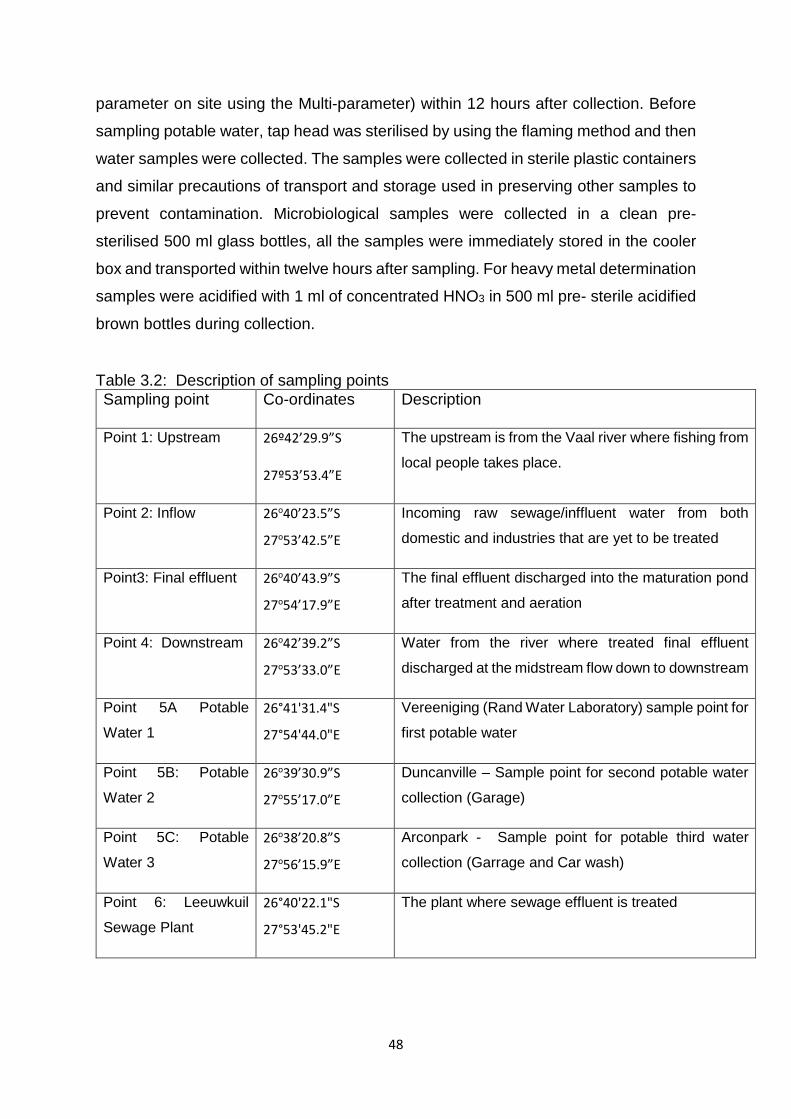
48
parameter on site using the Multi-parameter) within 12 hours after collection. Before
sampling potable water, tap head was sterilised by using the flaming method and then
water samples were collected. The samples were collected in sterile plastic containers
and similar precautions of transport and storage used in preserving other samples to
prevent contamination. Microbiological samples were collected in a clean pre-
sterilised 500 ml glass bottles, all the samples were immediately stored in the cooler
box and transported within twelve hours after sampling. For heavy metal determination
samples were acidified with 1 ml of concentrated HNO3 in 500 ml pre- sterile acidified
brown bottles during collection.
Table 3.2: Description of sampling points Sampling point Co-ordinates Description
Point 1: Upstream 26º42’29.9”S
27º53’53.4”E
The upstream is from the Vaal river where fishing from
local people takes place.
Point 2: Inflow 26o40’23.5”S
27o53’42.5”E
Incoming raw sewage/inffluent water from both
domestic and industries that are yet to be treated
Point3: Final effluent 26o40’43.9”S
27o54’17.9”E
The final effluent discharged into the maturation pond
after treatment and aeration
Point 4: Downstream 26o42’39.2”S
27o53’33.0”E
Water from the river where treated final effluent
discharged at the midstream flow down to downstream
Point 5A Potable
Water 1 26°41'31.4"S
27°54'44.0"E
Vereeniging (Rand Water Laboratory) sample point for
first potable water
Point 5B: Potable
Water 2 26o39’30.9”S
27o55’17.0”E
Duncanville – Sample point for second potable water
collection (Garage)
Point 5C: Potable
Water 3 26o38’20.8”S
27o56’15.9”E
Arconpark - Sample point for potable third water
collection (Garrage and Car wash)
Point 6: Leeuwkuil
Sewage Plant 26°40'22.1"S
27°53'45.2"E
The plant where sewage effluent is treated
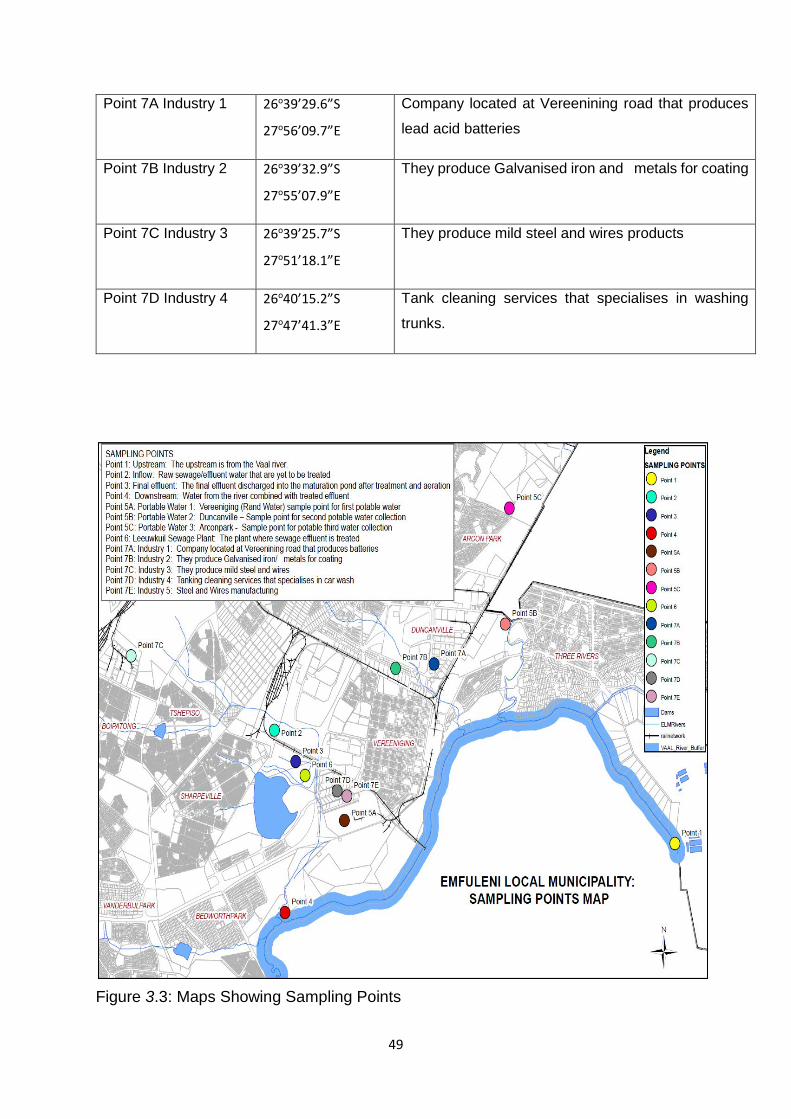
49
Point 7A Industry 1 26o39’29.6”S
27o56’09.7”E
Company located at Vereenining road that produces
lead acid batteries
Point 7B Industry 2 26o39’32.9”S
27o55’07.9”E
They produce Galvanised iron and metals for coating
Point 7C Industry 3 26o39’25.7”S
27o51’18.1”E
They produce mild steel and wires products
Point 7D Industry 4 26o40’15.2”S
27o47’41.3”E
Tank cleaning services that specialises in washing
trunks.
Figure 3.3: Maps Showing Sampling Points
50
3.4 Experimental Methods The experimental work of the water analyses was conducted in two parts:
Field work which included the infield (onsite) measurement of some physico-
chemical parameters such as temperature (oC), pH, conductivity (μS/cm)
salinity (PSU), dissolved oxygen (mg/l), and total dissolved solids (mg/l)
Laboratory analysis which include biological oxygen demand (BOD) (mg/l),
Chemical oxygen demand (COD) (mg/l), heavy metal analysis (ICP-OES),
microbial analysis(Isolation, purification, counting of colony, Gram staining,
DNA Extraction and polymerase chain reaction PCR).
3.4.1 Determination of physico-chemical parameters Onsite analysis of water samples included temperature, pH, electrical conductivity,
salinity, total dissolved solids (TDS), and dissolved oxygen (DO) were measured using
a multi-parameter ion specific meter (Hanna instruments, version HI9828, SN
08334776). The probe was initially rinsed with distilled water, and then followed by
several rinses so as to optimize each water samples before actual reading was taken
by immersing the probe into the water samples. All the measurements were taken in
triplicates for the proper mean values
3.4.1.1 Heavy Metal Determination/Analysis
Elemental concentrations of aluminium (Al), Copper (Cu), Zinc (Zn), Manganese (Mn)
and Lead (Pb) in the water samples and industrial effluent were analyzed using
Inductively Coupled Plasma Optical Emission Spectrometry (ICP-OES) (PerkinElmer
Optima 5300 DV).
Collected samples were digested using concentrated HNO3. The essence of the
digestion before analysis was to reduce organic matter interference and convert the
metal to a form that can be analyzed by Inductively coupled argon plasma
spectroscopy (ICP – OES) (Chinedu et al., 2011). All digested samples were filtered
using 0.45 μm filter paper, prior to ICP-OES analysis. The target elements were
analyzed by direct aspiration into the ICP-OES, data inclusion was based on
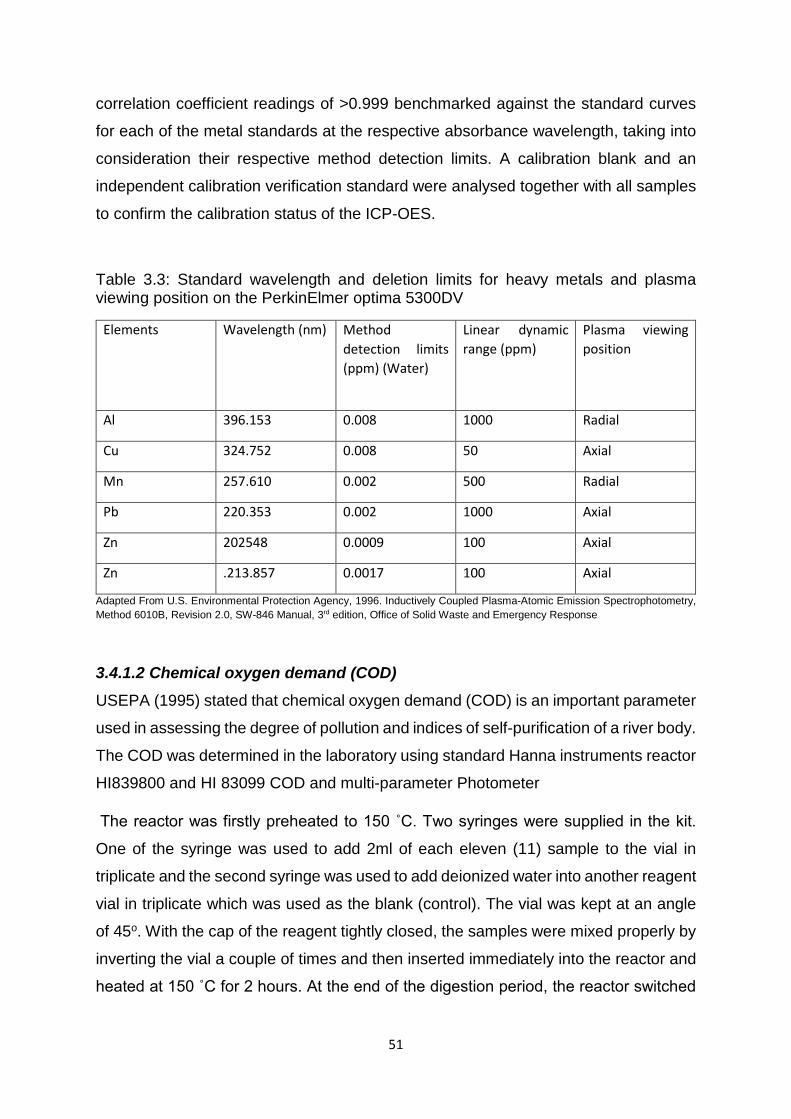
51
correlation coefficient readings of >0.999 benchmarked against the standard curves
for each of the metal standards at the respective absorbance wavelength, taking into
consideration their respective method detection limits. A calibration blank and an
independent calibration verification standard were analysed together with all samples
to confirm the calibration status of the ICP-OES.
Table 3.3: Standard wavelength and deletion limits for heavy metals and plasma viewing position on the PerkinElmer optima 5300DV
Elements
Wavelength (nm) Method detection limits (ppm) (Water)
Linear dynamic range (ppm)
Plasma viewing position
Al 396.153 0.008 1000 Radial
Cu 324.752 0.008 50 Axial
Mn 257.610 0.002 500 Radial
Pb 220.353 0.002 1000 Axial
Zn 202548 0.0009 100 Axial
Zn .213.857 0.0017 100 Axial
Adapted From U.S. Environmental Protection Agency, 1996. Inductively Coupled Plasma-Atomic Emission Spectrophotometry, Method 6010B, Revision 2.0, SW-846 Manual, 3rd edition, Office of Solid Waste and Emergency Response
3.4.1.2 Chemical oxygen demand (COD) USEPA (1995) stated that chemical oxygen demand (COD) is an important parameter
used in assessing the degree of pollution and indices of self-purification of a river body.
The COD was determined in the laboratory using standard Hanna instruments reactor
HI839800 and HI 83099 COD and multi-parameter Photometer
The reactor was firstly preheated to 150 ˚C. Two syringes were supplied in the kit.
One of the syringe was used to add 2ml of each eleven (11) sample to the vial in
triplicate and the second syringe was used to add deionized water into another reagent
vial in triplicate which was used as the blank (control). The vial was kept at an angle
of 45o. With the cap of the reagent tightly closed, the samples were mixed properly by
inverting the vial a couple of times and then inserted immediately into the reactor and
heated at 150 ˚C for 2 hours. At the end of the digestion period, the reactor switched

52
off automatically and the vials containing the samples were allowed to cool down to
about 120 ˚C for 20 minutes. Each vial was inverted severally while still warm and was
then placed in the H1 740216 rack. The vials were left in the rack to cool to room
temperature.
Colometric COD result was determined. First, the blank reading was read after setting
the photometer machine to COD MR to confirm the zero reading after which the vials
containing the eleven (11) samples in triplicates was now determined and recorded.
3.4.1.3. Biological oxygen demand measurement (BOD).
Biological Oxygen Demand (BOD) is an indicator of the concentration of
biodegradable organic matter present in a water sample (Chinedu et al., 2011). It can
be used to gather the general quality of the water and its degree of pollution.
A sterilized 500ml plastic bottle in triplicate was used to collect BOD samples in all
sampling points. Onsite analysis of water samples readings of dissolved oxygen was
taken using a BOD/DO Hanna instrument version HI 98193, this reading is regarded
as initial dissolved oxygen reading (DO1). The BOD bottles were placed in a box,
covered with a black plastic and brought back to UNISA Laboratory. The box
containing BOD bottles were now sealed properly, put in the laboratory cupboard and
was incubated for five (5) days at room temperature. After five days of incubation at
room temperature, the dissolved oxygen level in the BOD bottles was measured using
the same digital meter. The value of BOD as adapted by Mocuba (2010) and Chinedu
et al. (2011) was determined by subtracting dissolved oxygen after incubation (DO5)
level from the DO1 (measured in the field) level found five days previously:
BOD = DO (mg/l) (measured in the field) - DO (mg/l) (measured after incubation).
3.4.2 Microbiological analysis
Isolation of Bacteria (pure culture), Gram staining, extraction of DNA, PCR and
tolerance test were carried out. The methods used are explained in detail as follows:
3.4.2.1 Isolation of bacteria (pure culture) from sample
The bacterial culturing of the water samples was examined using culture techniques.
Approximately 1 ml of undiluted water samples from eleven sites was added to
Nutrient agar (NA) media purchased from Sigma Aldrich, Pretoria RSA, using a sterile
53
Pasteur pipette (except for the inflow site that was diluted with sterile distilled water
until a dilution of 10-5 was obtained and 1 ml of the diluted sample was now added to
nutrient agar, and was spread using sterile plastic spreader and finally incubated at
37oC for 24 h. Distinct colonies that appeared on the media were directly streaked
onto NA using sterile plastic loops and were incubated for 24hrs at 37oC. After
incubation, microbial growth (based on the number of the colony) was observed.
Distinct colonies were sub-cultured using streak method for purification (Abo-Amer et
al., 2015). The pure cultures were identified based on gram staining and molecular
techniques.
3.4.2.2 Gram Staining
Gram staining technique as described by Behera (2013) were adapted as a basis for
the classification of isolated axenic cultures of bacteria and in the identification of gram
positive (+ve) and gram negative bacteria (-ve).
3.4.2.3 Molecular techniques: extraction of DNA from bacteria isolates
DNA was extracted from each pure culture using a quick g-DNA extraction kit (Zymo
Research, USA) according to the manufacturer’s instructions. Approximately 1060 µl
of storage buffer was added to each 20 mg tube of proteinase K and was maintained
at -20oC. A loopful of cultured was mixed with 200 µl of saline water in the micro-
centrifuge tube and vortexed at low intensity for 2 minutes. Approximately 200 µl of
the sample together with 200 BioFluid and Cell Buffer and 20 μl Proteinase K was
added to another micro-centrifuge tube. The tube was mixed thoroughly with the vortex
machine and then incubated at 55◦C for 10 minutes. After the incubation period,
approximately 1 volume of Genomic Binding Buffer was added to the digested sample
and then mixed thoroughly. The mixture was transferred to a Zymo-Spin 11C-XL
column in a collection tube and centrifuged at 12000 rpm for 1 min. The collection tube
together with the flow through the tube was then discarded.
Approximately 400 μl DNA pre-wash buffer was added to the column in a new
collection tube and centrifuged for 1 min. The collection tube was later emptied.
Afterward, approximately 700 μl/g – DNA wash buffer was added and centrifuged for
1 min and the collection tube was emptied also. Approximately 20 μl/g – DNA wash
buffer was added again and centrifuged for 1 min and the collection tube with the flow
through the tube was then discarded. The column was transferred to a clean centrifuge
54
in order to elute the DNA. The supernatant (the amplicon) was collected and
precipitated by adding approximately 70 μl DNA Elution, incubated for 5 minutes and
then centrifuged for 1 mins. Immediately after the DNA extraction, polymerase chain
reaction (PCR) was carried out using the universal bacterial 16S rDNA primers 27F
(27F and 518R).
3.4.2.4. Amplification of 16S rDNA genes by polymerase chain reaction (PCR) and analysis of the PCR products.
The PCR amplification of the target DNA was carried out in a thermal cycler (MJ
MiniTM Personal Thermal Cycler, Biorad SA) using 200 μl PCR tubes and a reaction
mixture volume of 25 μl. The reaction mixture (working solution) was prepared,
containing 12.5 μl × Dream Taq™ PCR master mix (10 × Dream Taq™ buffer, 2 μM
dNTP mix and 1.25 Dream Taq™ polymerase), 1 μl of each PCR primer (27F and
518R) (10 μM) (synthesised by Inqaba Biotechnologies Industry, Pretoria, South
Africa) and 2.5 μl of genomic DNA (25 ng/μl) was made up of 25 μl with ultra-pure
nuclease-free water (8.5 μl).
Approximately 22.5 ml of the working solution was taken and added to the PCR tube
that was properly labelled. Also, 1.5 ml of the extracted rDNA was added to the PCR
tube and vortex to ensure homogeneity. The PCR tubes were then placed in the
Thermal cycler under the following reaction conditions; Initial denaturation at 94°C for
5 min, 32 cycles of denaturation at 94°C for 30 sec, annealing at 55°C for 30 sec,
extension at 72°C for 1 min, and a final extension step at 72°C for 10 min. The PCR
products were first analyzed by 1% agarose gel electrophoresis in 1X_ TBE buffer
(Sigma SA) and were stained with 2% of 10 mg/ml ethidium bromide (Sigma SA) and
visualize under short-wavelength UV light. The PCR products were done by Gel
extraction Kit and sent to Inqaba, Pretoria, South Africa (SA) for sequencing.
3.4.2.5 Phylogenetic analysis The 16s gene sequences obtained was first analyzed by BLAST (Basic Local
Alignment Search Tool) algorithm. Based on the scoring index, the most similar
sequences were aligned with the sequences of other representative bacterial 16S
rDNA regions by using Clustal W software. The 16S rDNA sequences selected
bacterial strains were then deposited in GenBank.
55
3.5 Heavy Metal Screening Test To examine the ability of the 70 bacteria isolates to resist heavy metals, a screening
test as described by Hookoom and Puchooa (2013) was adapted. A cut of range for
concentration of all four (4) heavy metal used were determined as follows; lead (in
lead nitrate - Pb) is 0.006 mg/l, Zinc (in Zinc nitrate -Zn) is 0.02 mg/l, Copper (in copper
sulphate - Cu) is 0.005 mg/l and Aluminium (in Aluminium Nitrate - Al) is 0.2 mg/l.
Overnight grown cultures of bacterial cells were inoculated on nutrient agar plates
supplemented with different concentrations of heavy metals as indicated previously
above. Zinc in Zinc nitrate, Lead to Lead nitrate, Aluminium in Aluminium nitrate and
Copper in Copper sulphate were incubated at 37°C for 24 hours and cell growth
observed.
The concentrations of each metal was increased by a common factor of 10 with
concentrations as follows; (Pb =0.06mg/l, Zn= 0.2mg/l, Cu=0.05mg/l, Al=2mg/l). The
numbers of bacteria isolates were reduced/screened to 39, based on only those that
are resistance to the heavy metals being tested. In order to further reduce the number
of bacteria isolates, the concentrations of each metal were further increased by a
common factor of 20 bringing the concentrations as follows; (Pb =0.12 mg/l, Zn= 0.4
mg/l, Cu=0.01 mg/l, Al=4 mg/l). The numbers of bacteria isolates were further reduced
to 22 based on only those that are resistance to the metals. It is this 22 isolates that
molecular study was conducted on at Inqaba Biotec, Pretoria, South Africa for
sequencing. Table showing the reaction of the isolates to different heavy metals and
their progression in their reduction is shown in chapter 4.
3.6 Statistical Analysis One-way analysis of variance (ANOVA) was done using SAS version 9.4 at a
significance level of 0.05 to show the mean separation of the parameters measured
across the sampling points. Also, Pearson correlation coefficient was also done using
SAS version 9.4 at a significant of 0.05 to show the relationship between the
parameters across the eleven (11) sampling points.

56
57
CHAPTER 4: RESULT AND DISCUSSION
4.1 Introduction This chapter presents the research results, its interpretation and discussion of the
findings. The study evaluated the water quality of sources within and around the Vaal
areas, which is an urban area with industries, over a period of four seasons. The
results presented in this chapter included data obtained on concentrations of heavy
metals in industrial effluent water samples, Leeuwkuil Plant, Vaal River and potable
water around Vaal, as well as their microbial characterisation and resistance to some
heavy metals. The interpretations and discussions of the obtained results were based
on the impact of heavy metals in industrial effluents on Leeuwkuil Plant and the
environment in relation to compliance with the physico-chemical parameters stipulated
standards by organisations such as Green Drop (2013), SAGES certification
requirements (2013), SANS-241 (2015) and WHO (1984; 1989).

58
Table 4.1A: Elemental concentrations (ppm) in portable water, water from the Vaal River, Leeuwkuil Plant, and industries in the Vaal
areas. Values (M±S.E.) followed by dissimilar letters in a column are significantly different at p≤0.05 and separated by different letters
Elemental concentrations (mg/l) Ag Al B Ca Cr Cu Fe K Mg Na IND1 0.2±0.0b 10.6±3.6a 0.6±0.0c 186.3±16.5ab 0.2±0.0c 0.7±0.0a 14.0±1.3ab 8.5±0.8b 83.5±7.9a 213.0±18.7c IND2 0.2±0.0b 0.2±0.1c 0.7±0.0c 37.8±3.9c 0.8±0.0a 0.2±0.0b 16.7±1.5a 8.6±0.9b 5.7±0.5b 432.1±78.6ab IND3 0.2±0.0b 1.8±0.6b 5.4±0.8b 143.4±13.8ab 0.2±0.0c 0.2±0.0b 0.7±0.0d 63.2±5.6a 70.6±7.0a 49.1±4.8c IND4 0.2±0.0b 14.0±4.7a 0.5±0.0c 472.3±45.8a 0.2±0.0c 0.3±0.0b 13.1±1.2ab 6.6±0.6bc 25.9±2.3b 97.4±9.0c IND5 0.2±0.0b 1.8±0.6b 16.1±2.5a 293.7±21.3ab 0.5±0.0b 0.2±0.0b 6.4±0.6cd 9.7±0.9b 12.4±1.0b 866.4±85.0a InF 0.4±0.2 b 0.2±0.0c 0.2±0.0c 35.2±2.1c 0.8±0.0a 0.2±0.0b 3.2±0.3d 8.5±0.5b 12.0±1.0b 52.8±5.0c
UpS 0.2±0.0b 0.2±0.0c 0.2±1.0c 67.1±5.5c 0.2±0.0c 0.2±0.0b 0.2±0.0d 8.2±0.2b 18.3±2.0b 53.6±5.0c
DoS 2.6±1.4a 0.2±0.0c 0.7±0.0c 58.8±4.2c 0.2±0.0c 0.3±0.0b 0.2±0.0d 8.3±0.3b 20.2±2.0b 51.2±5.0c PO1 0.3±0.1b 0.2±1.0c 0.2±0.0c 20.2±0.5c 0.2±0.0c 0.2±0.0b 0.7±0.0d 2.0±0.0d 4.4±0.0b 5.5±0.0c PO2 0.2±0.0b 0.2±0.0c 0.2±0.0c 27.7±2.8c 0.2±0.0c 0.2±0.0b 0.7±0.0d 3.7±0.8cd 6.5±0.0b 43.3±4.0c
*UpS= Upstream; *DoS= Downstream; *InF=Inflow; *FinE= Final Effluent; PO=Potable water, IND = Industry 1-5
FinF 2.1±0.1a 0.2±0.0c 0.2±0.0c 33.9±7.5c 0.2±0.0c 0.2±0.0b 1.5±0.0d 8.6±0.9b 11.8±1.0b 59.4±6.0c
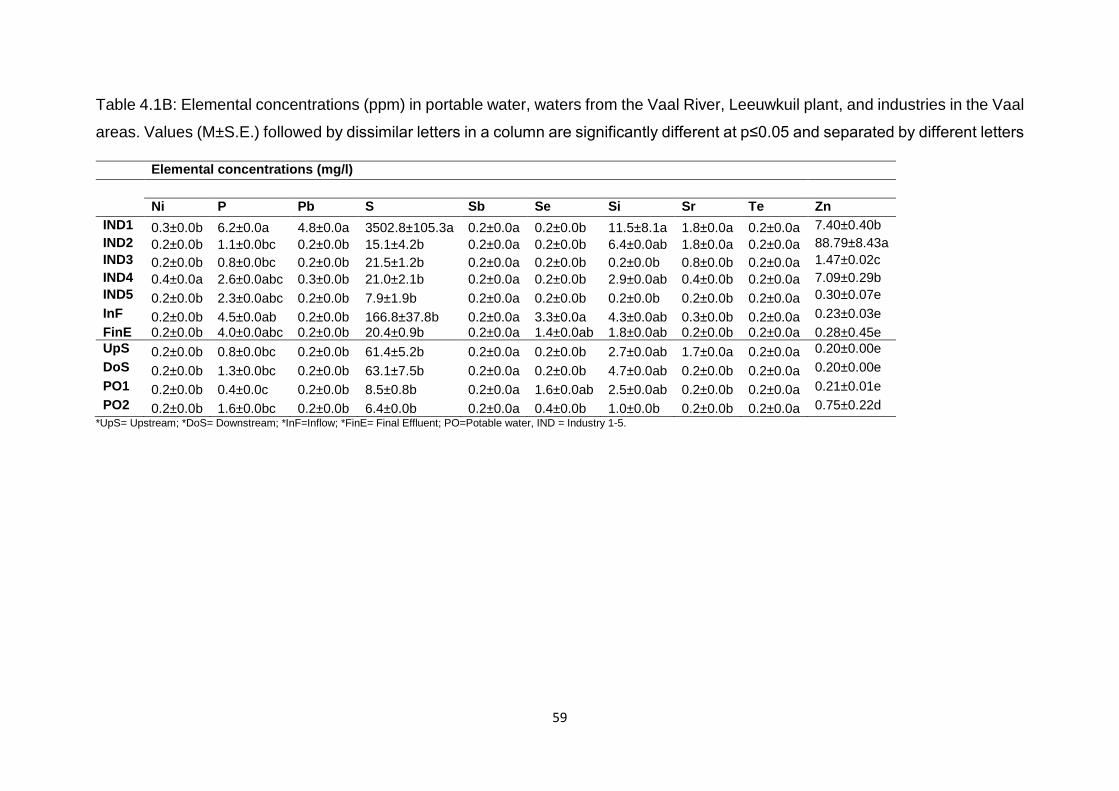
59
Table 4.1B: Elemental concentrations (ppm) in portable water, waters from the Vaal River, Leeuwkuil plant, and industries in the Vaal
areas. Values (M±S.E.) followed by dissimilar letters in a column are significantly different at p≤0.05 and separated by different letters
Elemental concentrations (mg/l) Ni P Pb S Sb Se Si Sr Te Zn IND1 0.3±0.0b 6.2±0.0a 4.8±0.0a 3502.8±105.3a 0.2±0.0a 0.2±0.0b 11.5±8.1a 1.8±0.0a 0.2±0.0a 7.40±0.40b IND2 0.2±0.0b 1.1±0.0bc 0.2±0.0b 15.1±4.2b 0.2±0.0a 0.2±0.0b 6.4±0.0ab 1.8±0.0a 0.2±0.0a 88.79±8.43a IND3 0.2±0.0b 0.8±0.0bc 0.2±0.0b 21.5±1.2b 0.2±0.0a 0.2±0.0b 0.2±0.0b 0.8±0.0b 0.2±0.0a 1.47±0.02c IND4 0.4±0.0a 2.6±0.0abc 0.3±0.0b 21.0±2.1b 0.2±0.0a 0.2±0.0b 2.9±0.0ab 0.4±0.0b 0.2±0.0a 7.09±0.29b IND5 0.2±0.0b 2.3±0.0abc 0.2±0.0b 7.9±1.9b 0.2±0.0a 0.2±0.0b 0.2±0.0b 0.2±0.0b 0.2±0.0a 0.30±0.07e InF 0.2±0.0b 4.5±0.0ab 0.2±0.0b 166.8±37.8b 0.2±0.0a 3.3±0.0a 4.3±0.0ab 0.3±0.0b 0.2±0.0a 0.23±0.03e FinE 0.2±0.0b 4.0±0.0abc 0.2±0.0b 20.4±0.9b 0.2±0.0a 1.4±0.0ab 1.8±0.0ab 0.2±0.0b 0.2±0.0a 0.28±0.45e UpS 0.2±0.0b 0.8±0.0bc 0.2±0.0b 61.4±5.2b 0.2±0.0a 0.2±0.0b 2.7±0.0ab 1.7±0.0a 0.2±0.0a 0.20±0.00e DoS 0.2±0.0b 1.3±0.0bc 0.2±0.0b 63.1±7.5b 0.2±0.0a 0.2±0.0b 4.7±0.0ab 0.2±0.0b 0.2±0.0a 0.20±0.00e PO1 0.2±0.0b 0.4±0.0c 0.2±0.0b 8.5±0.8b 0.2±0.0a 1.6±0.0ab 2.5±0.0ab 0.2±0.0b 0.2±0.0a 0.21±0.01e PO2 0.2±0.0b 1.6±0.0bc 0.2±0.0b 6.4±0.0b 0.2±0.0a 0.4±0.0b 1.0±0.0b 0.2±0.0b 0.2±0.0a 0.75±0.22d
*UpS= Upstream; *DoS= Downstream; *InF=Inflow; *FinE= Final Effluent; PO=Potable water, IND = Industry 1-5.
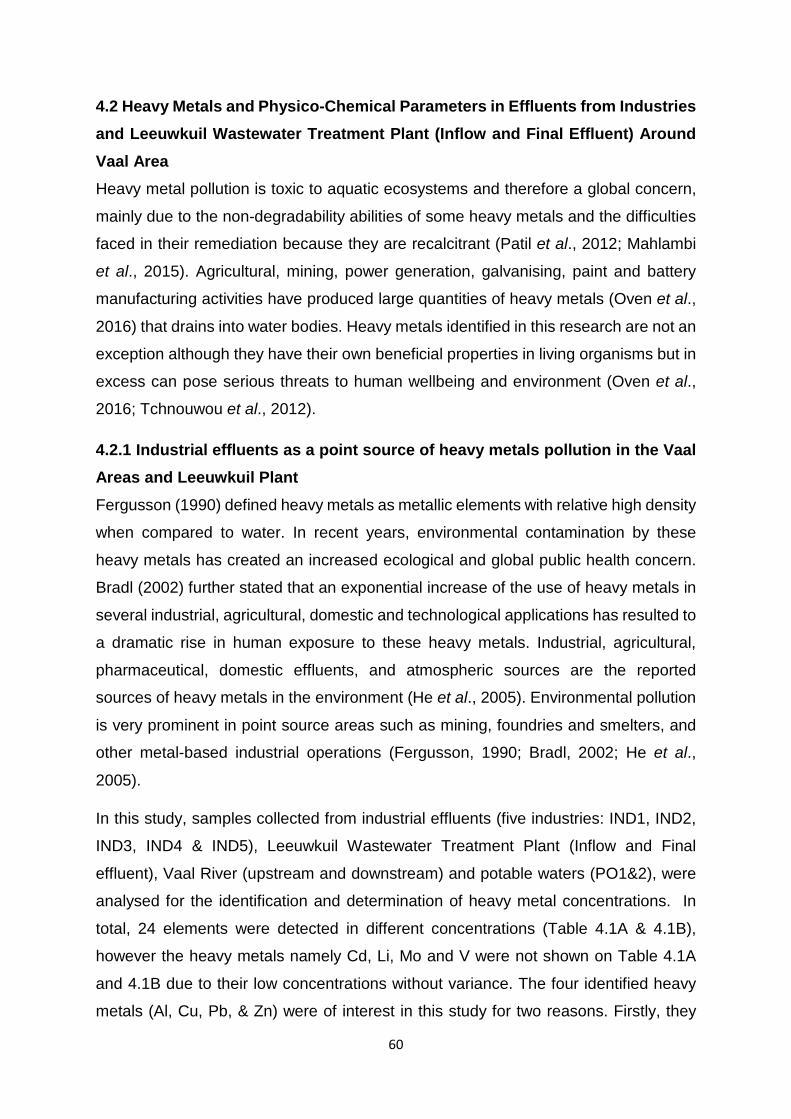
60
4.2 Heavy Metals and Physico-Chemical Parameters in Effluents from Industries and Leeuwkuil Wastewater Treatment Plant (Inflow and Final Effluent) Around Vaal Area Heavy metal pollution is toxic to aquatic ecosystems and therefore a global concern,
mainly due to the non-degradability abilities of some heavy metals and the difficulties
faced in their remediation because they are recalcitrant (Patil et al., 2012; Mahlambi
et al., 2015). Agricultural, mining, power generation, galvanising, paint and battery
manufacturing activities have produced large quantities of heavy metals (Oven et al.,
2016) that drains into water bodies. Heavy metals identified in this research are not an
exception although they have their own beneficial properties in living organisms but in
excess can pose serious threats to human wellbeing and environment (Oven et al.,
2016; Tchnouwou et al., 2012).
4.2.1 Industrial effluents as a point source of heavy metals pollution in the Vaal Areas and Leeuwkuil Plant Fergusson (1990) defined heavy metals as metallic elements with relative high density
when compared to water. In recent years, environmental contamination by these
heavy metals has created an increased ecological and global public health concern.
Bradl (2002) further stated that an exponential increase of the use of heavy metals in
several industrial, agricultural, domestic and technological applications has resulted to
a dramatic rise in human exposure to these heavy metals. Industrial, agricultural,
pharmaceutical, domestic effluents, and atmospheric sources are the reported
sources of heavy metals in the environment (He et al., 2005). Environmental pollution
is very prominent in point source areas such as mining, foundries and smelters, and
other metal-based industrial operations (Fergusson, 1990; Bradl, 2002; He et al.,
2005).
In this study, samples collected from industrial effluents (five industries: IND1, IND2,
IND3, IND4 & IND5), Leeuwkuil Wastewater Treatment Plant (Inflow and Final
effluent), Vaal River (upstream and downstream) and potable waters (PO1&2), were
analysed for the identification and determination of heavy metal concentrations. In
total, 24 elements were detected in different concentrations (Table 4.1A & 4.1B),
however the heavy metals namely Cd, Li, Mo and V were not shown on Table 4.1A
and 4.1B due to their low concentrations without variance. The four identified heavy
metals (Al, Cu, Pb, & Zn) were of interest in this study for two reasons. Firstly, they
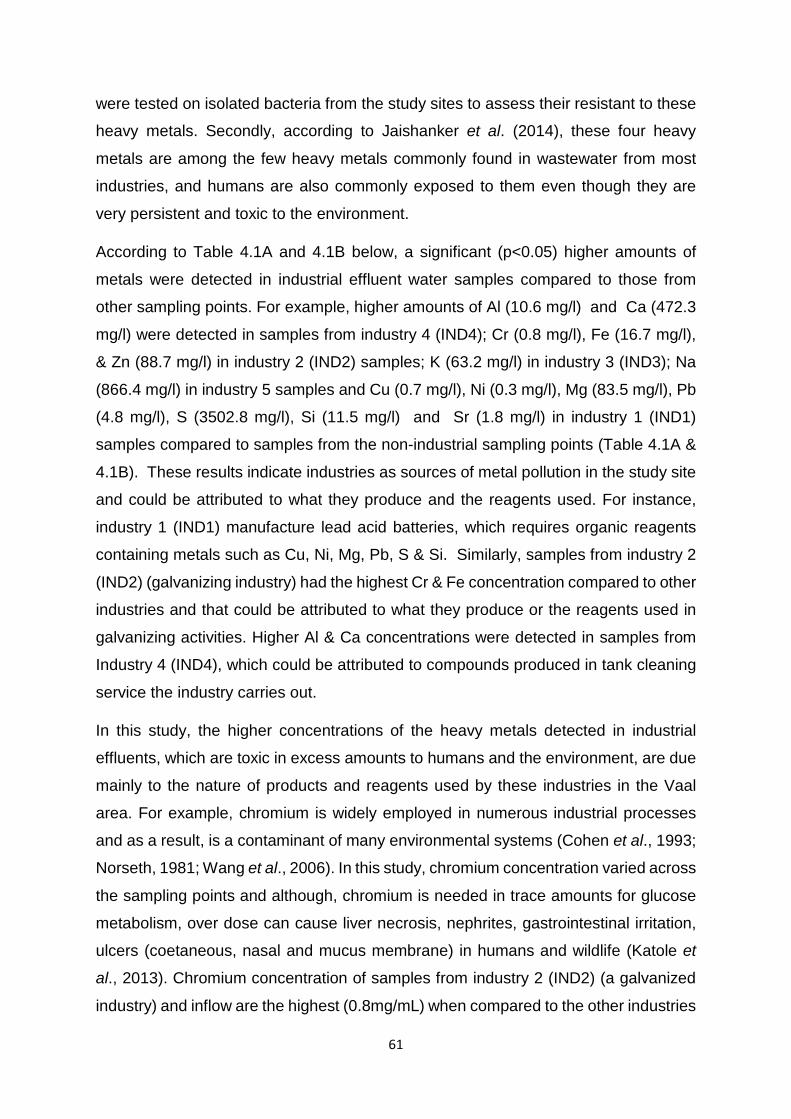
61
were tested on isolated bacteria from the study sites to assess their resistant to these
heavy metals. Secondly, according to Jaishanker et al. (2014), these four heavy
metals are among the few heavy metals commonly found in wastewater from most
industries, and humans are also commonly exposed to them even though they are
very persistent and toxic to the environment.
According to Table 4.1A and 4.1B below, a significant (p<0.05) higher amounts of
metals were detected in industrial effluent water samples compared to those from
other sampling points. For example, higher amounts of Al (10.6 mg/l) and Ca (472.3
mg/l) were detected in samples from industry 4 (IND4); Cr (0.8 mg/l), Fe (16.7 mg/l),
& Zn (88.7 mg/l) in industry 2 (IND2) samples; K (63.2 mg/l) in industry 3 (IND3); Na
(866.4 mg/l) in industry 5 samples and Cu (0.7 mg/l), Ni (0.3 mg/l), Mg (83.5 mg/l), Pb
(4.8 mg/l), S (3502.8 mg/l), Si (11.5 mg/l) and Sr (1.8 mg/l) in industry 1 (IND1)
samples compared to samples from the non-industrial sampling points (Table 4.1A &
4.1B). These results indicate industries as sources of metal pollution in the study site
and could be attributed to what they produce and the reagents used. For instance,
industry 1 (IND1) manufacture lead acid batteries, which requires organic reagents
containing metals such as Cu, Ni, Mg, Pb, S & Si. Similarly, samples from industry 2
(IND2) (galvanizing industry) had the highest Cr & Fe concentration compared to other
industries and that could be attributed to what they produce or the reagents used in
galvanizing activities. Higher Al & Ca concentrations were detected in samples from
Industry 4 (IND4), which could be attributed to compounds produced in tank cleaning
service the industry carries out.
In this study, the higher concentrations of the heavy metals detected in industrial
effluents, which are toxic in excess amounts to humans and the environment, are due
mainly to the nature of products and reagents used by these industries in the Vaal
area. For example, chromium is widely employed in numerous industrial processes
and as a result, is a contaminant of many environmental systems (Cohen et al., 1993;
Norseth, 1981; Wang et al., 2006). In this study, chromium concentration varied across
the sampling points and although, chromium is needed in trace amounts for glucose
metabolism, over dose can cause liver necrosis, nephrites, gastrointestinal irritation,
ulcers (coetaneous, nasal and mucus membrane) in humans and wildlife (Katole et
al., 2013). Chromium concentration of samples from industry 2 (IND2) (a galvanized
industry) and inflow are the highest (0.8mg/mL) when compared to the other industries
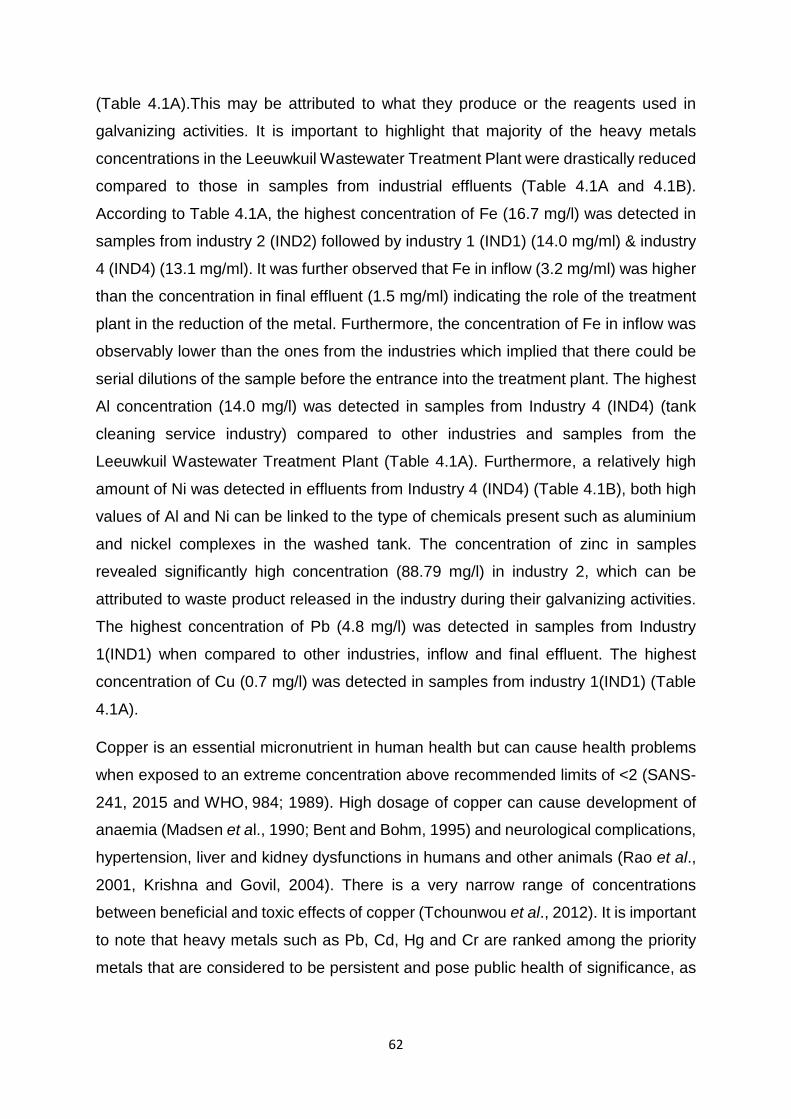
62
(Table 4.1A).This may be attributed to what they produce or the reagents used in
galvanizing activities. It is important to highlight that majority of the heavy metals
concentrations in the Leeuwkuil Wastewater Treatment Plant were drastically reduced
compared to those in samples from industrial effluents (Table 4.1A and 4.1B).
According to Table 4.1A, the highest concentration of Fe (16.7 mg/l) was detected in
samples from industry 2 (IND2) followed by industry 1 (IND1) (14.0 mg/ml) & industry
4 (IND4) (13.1 mg/ml). It was further observed that Fe in inflow (3.2 mg/ml) was higher
than the concentration in final effluent (1.5 mg/ml) indicating the role of the treatment
plant in the reduction of the metal. Furthermore, the concentration of Fe in inflow was
observably lower than the ones from the industries which implied that there could be
serial dilutions of the sample before the entrance into the treatment plant. The highest
Al concentration (14.0 mg/l) was detected in samples from Industry 4 (IND4) (tank
cleaning service industry) compared to other industries and samples from the
Leeuwkuil Wastewater Treatment Plant (Table 4.1A). Furthermore, a relatively high
amount of Ni was detected in effluents from Industry 4 (IND4) (Table 4.1B), both high
values of Al and Ni can be linked to the type of chemicals present such as aluminium
and nickel complexes in the washed tank. The concentration of zinc in samples
revealed significantly high concentration (88.79 mg/l) in industry 2, which can be
attributed to waste product released in the industry during their galvanizing activities.
The highest concentration of Pb (4.8 mg/l) was detected in samples from Industry
1(IND1) when compared to other industries, inflow and final effluent. The highest
concentration of Cu (0.7 mg/l) was detected in samples from industry 1(IND1) (Table
4.1A).
Copper is an essential micronutrient in human health but can cause health problems
when exposed to an extreme concentration above recommended limits of <2 (SANS-
241, 2015 and WHO, 984; 1989). High dosage of copper can cause development of
anaemia (Madsen et al., 1990; Bent and Bohm, 1995) and neurological complications,
hypertension, liver and kidney dysfunctions in humans and other animals (Rao et al.,
2001, Krishna and Govil, 2004). There is a very narrow range of concentrations
between beneficial and toxic effects of copper (Tchounwou et al., 2012). It is important
to note that heavy metals such as Pb, Cd, Hg and Cr are ranked among the priority
metals that are considered to be persistent and pose public health of significance, as
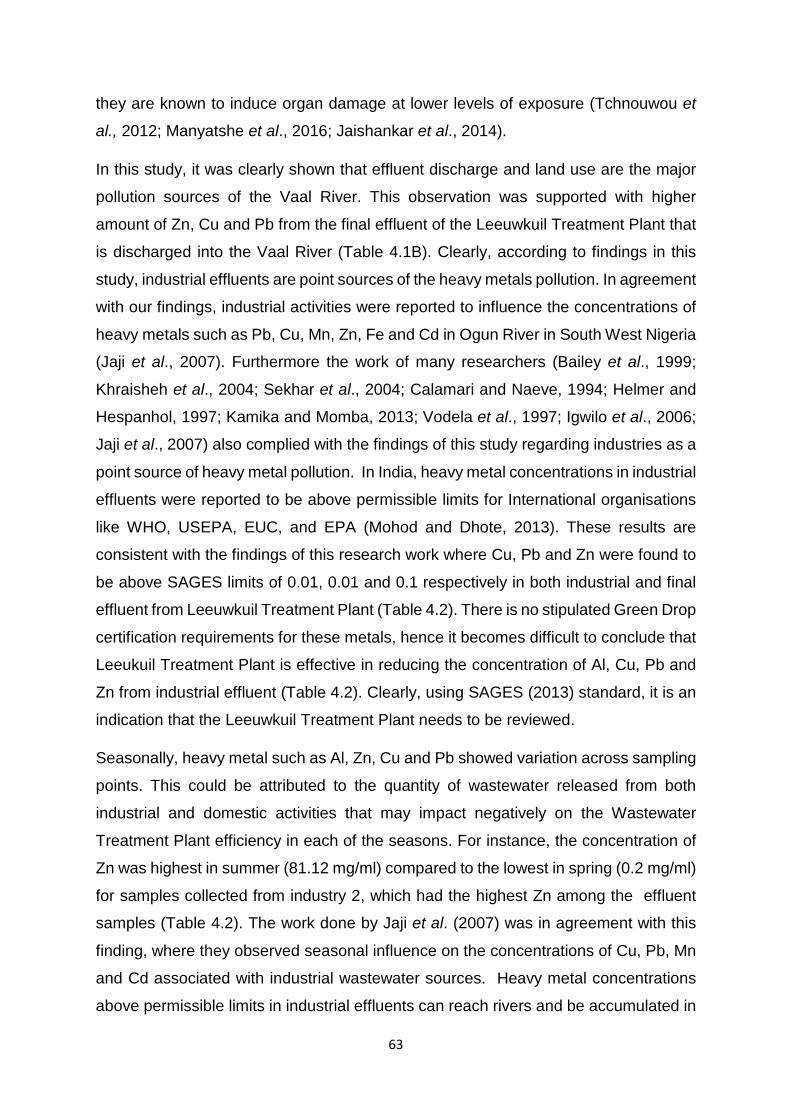
63
they are known to induce organ damage at lower levels of exposure (Tchnouwou et
al., 2012; Manyatshe et al., 2016; Jaishankar et al., 2014).
In this study, it was clearly shown that effluent discharge and land use are the major
pollution sources of the Vaal River. This observation was supported with higher
amount of Zn, Cu and Pb from the final effluent of the Leeuwkuil Treatment Plant that
is discharged into the Vaal River (Table 4.1B). Clearly, according to findings in this
study, industrial effluents are point sources of the heavy metals pollution. In agreement
with our findings, industrial activities were reported to influence the concentrations of
heavy metals such as Pb, Cu, Mn, Zn, Fe and Cd in Ogun River in South West Nigeria
(Jaji et al., 2007). Furthermore the work of many researchers (Bailey et al., 1999;
Khraisheh et al., 2004; Sekhar et al., 2004; Calamari and Naeve, 1994; Helmer and
Hespanhol, 1997; Kamika and Momba, 2013; Vodela et al., 1997; Igwilo et al., 2006;
Jaji et al., 2007) also complied with the findings of this study regarding industries as a
point source of heavy metal pollution. In India, heavy metal concentrations in industrial
effluents were reported to be above permissible limits for International organisations
like WHO, USEPA, EUC, and EPA (Mohod and Dhote, 2013). These results are
consistent with the findings of this research work where Cu, Pb and Zn were found to
be above SAGES limits of 0.01, 0.01 and 0.1 respectively in both industrial and final
effluent from Leeuwkuil Treatment Plant (Table 4.2). There is no stipulated Green Drop
certification requirements for these metals, hence it becomes difficult to conclude that
Leeukuil Treatment Plant is effective in reducing the concentration of Al, Cu, Pb and
Zn from industrial effluent (Table 4.2). Clearly, using SAGES (2013) standard, it is an
indication that the Leeuwkuil Treatment Plant needs to be reviewed.
Seasonally, heavy metal such as Al, Zn, Cu and Pb showed variation across sampling
points. This could be attributed to the quantity of wastewater released from both
industrial and domestic activities that may impact negatively on the Wastewater
Treatment Plant efficiency in each of the seasons. For instance, the concentration of
Zn was highest in summer (81.12 mg/ml) compared to the lowest in spring (0.2 mg/ml)
for samples collected from industry 2, which had the highest Zn among the effluent
samples (Table 4.2). The work done by Jaji et al. (2007) was in agreement with this
finding, where they observed seasonal influence on the concentrations of Cu, Pb, Mn
and Cd associated with industrial wastewater sources. Heavy metal concentrations
above permissible limits in industrial effluents can reach rivers and be accumulated in
64
tissues and organs of living organs such as catfish (Osman and Kloas, 2010).
Therefore, there is need for industries to have effective and efficient treatment systems
and continuous monitoring of the quality of effluent being released into the main
treatment plant in order to reduce treatment costs.
The excessive concentration of metals such as Pb, Zn, Cu, and other heavy metals
from the final effluent identified in this study are of concern as they can affect the water
quality causing it to be considered unsuitable for drinking, irrigation and other water
uses (Jaishankar et al., 2014). Furthermore, such alterations in water quality of the
river due to these heavy metals can affect other parameters such as BOD, COD, TDS,
total suspended solids (TSS) and faecal coli forms (Patil et al., 2012). For example,
death of aquatic organisms due to excessive Pb can cause decomposed organisms
in the water to influence parameters such as BOD, COD, TDS and TSS. The detection
of high concentrations of Pb in the final effluent of this study is of great concern
because it exceeded the SAGES (2013) standard.
4.2.2 Physico-chemical characteristics of effluents from industries and Leeuwkuil Wastewater Treatment Plant A comparative study was conducted to analyse the influence of abiotic factors
responsible for heavy metals concentrations in the collected water samples.
Temperature, pH, biological oxygen demand (BOD), dissolved oxygen (DO), chemical
oxygen demand (COD), total dissolved solutes (TDS), salinity, and electrical
conductivity (EC) were determined and compared with the Green Drop (2013)
certification requirements and SAGES (2013) standard (Table 4.2).
Temperature is a critical water quality parameter, since it directly influences the
amount of dissolved oxygen that is available to aquatic organisms. All the organisms
have a range of temperatures at which they carry out essential activities such as
reproduction, optimal growth and general fitness (Dallas and Day, 2004). Change in
temperature affects the metabolic rate, respiration, the distribution and survival of
aquatic organisms by altering physiological processes and enzyme activities leading
to death in aquatic organisms (McKee and Wolf 1963; Eaton, 2005). If the temperature
changes are not regularly monitored properly, it can affect the ability of aquatic
organisms to grow, reproduce, escape predators, and compete for habitat (Chapman
and WHO, 1996). According to results obtained in this study, seasonal variation
65
significantly (p<0.05) affected the temperature of samples from all seven sampling
points. For instance, the highest sample temperatures were recorded during summer
for all industrial effluent samples compared to the lowest values during winter (Table
4.2).
Similarly, among the sampling sites, significant differences (p<0.05) in sample
temperatures were recorded during each season. In summer, the highest sample
temperature (28.2oC) was recorded for Industry 3 compared to Inflow, which had the
lowest temperature (26.3oC). A similar pattern was also noted during each of the other
seasons (Table 4.2). These temperatures varied significantly across the seven
sampling sites and ranged between 26.3oC and 28.2oC during summer, 22.7oC to
26.9oC during autumn, 15.7oC to 16.7oC during winter and 20.33oC to 21.18oC during
spring. Such observed changes in the temperature were affected by seasonal
variations. According to Eckenfelder and Wesley (2000), a rise in the inflow
temperature above 35oC has the tendency to cause negative changes in the biological
activity during the treatment process and can cause the reduction of the efficiency of
nutrient removal while high temperature in the effluent can lead to the disruption of
aquatic organism’s activities in the receiving water bodies. However, this was not the
case in this study as temperature values were in compliance with the green drop
standard for effluent.
The pH measurement is among one of the most important and commonly used tests
in water chemistry (APHA, 1995). In this study, seasonal variation significantly
(p<0.05) affected the pH of samples from all seven sampling points. In general, most
sites recorded significantly higher pH values during winter compared to spring (Table
4.2). It was also noted that the pH values varied significantly across the sampling
points in each season. For example, among the seven sampling points, five sites
(Industries 1, 2, 4 & 5 and Final effluent) had the highest pH values in winter compared
to other sites (Industry 3 and Inflow). Zamxaka et al. (2004) reported variations in
water sample pH values with the Gogogo sites (Sites 1 to 8) having relatively lower
pH values compared to the sites in Nkonkobe (Sites 9 to 17). They further confirmed
the effect of season by reporting that the overall pH values were relatively higher in
winter compared to summer (Zamxaka et al., 2004), which is in support of our findings
as shown in Table 4.2. In general, similar differences in the pH values were noted in
our study, when sampling sites were compared during each season.
66
The effluent pH across all seven sampling sites ranged from 6.8 to 12.5 with the lowest
values in autumn (Industry 1) and the highest values recorded in winter in (Industry 4)
(Table 4.2). These results indicated that all the industries produced alkaline
wastewater (>pH 7) except for Industry 1 (summer and autumn) and Industry 2 (in
spring), which were slightly acidic (<pH 7). The acidity in Industry 1 samples could be
traced to the waste from battery production, whereas, Industry 2 are involved in
coating steel and wires (galvanization). Industries and wastewater treatment plants
can release acidic (organic and inorganic) compounds and other products in their
effluents that can influence pH of receiving water bodies (Bosch, 1999). However, it is
important to note that the most values obtained in this study from the seven sampling
points (Table 4.2) are within the stipulated Green Drop certification requirements (5.5
– 9.5) and posed no threat to the receiving water bodies (Jaji et al., 2007; Igbinosa
and Okoh, 2009).
Table 4.2 shows the BOD results of samples from the industries, Inflow and Final
effluents. Similar to temperature and pH, seasonal variation significantly (p<0.05)
affected the BOD values of all sampled sites (industries and the Leeuwkuil plant). For
example, samples from Industry 1 had the highest BOD value obtained in winter (6.83
mg/l) compared to the lowest BOD (5.60 mg/l) in spring (Table 4.2). Similar to our
finding, Vaishali and Punita (2013) reported significant differences in BOD values with
post winter having the highest value compared to post monsoon season. In our study
however, during each season, significant differences were recorded among sampling
sites. Although there is no stipulated Green Drop certification requirement for BOD,
the decrement in the value in the final effluent implied Leeuwkuil Treatment Plant is
effective in the removal of organic matter. This decrement in BOD regimes in the inflow
and final effluent samples could also be traced to the serial dilution of the industrial
effluent by the domestic effluent (Akbar et al., 2010).
In addition, seasonal variation significantly (p<0.05) affected the DO values of all
sampled sites (industries and the Leeuwkuil Plant). The values of DO in the industries,
inflow and final effluent were observed to be low and varied significantly across the
sampling points in each of the seasons. Our results are in agreement with findings
reported by Sangeeta and Neha (2015) that seasonal variation affected the DO values
in eight sampling points in the Nalasopara region with the monsoon season having the
highest mean value (3.073 mg/l) compared to summer (1.711 mg/l). In another study,
67
DO values varied significantly and ranged from 3.9–6.6 mg/l when the physico-
chemical qualities of the final effluents of an urban wastewater treatment plant in South
Africa were assessed between August 2007 and July 2008 (Odjadjare and Okoh,
2010). However, there is no stipulated SAGES (2013) standard recorded for DO for
the effluents hence, it becomes difficult to evaluate the effectiveness of Leeuwkuil
Wastewater Treatment Plant. However, it is notable that there is an increase in the
concentration of DO in the final effluent (which was lower in the inflow), one can
conclude that Leeuwkuil Treatment Plant is effective in removing organic pollutant that
were present in the inflow hence the reason for high DO in the final effluent.
The measurement of the total quantity of oxygen required for oxidising all organic
material into carbon dioxide and water was also taken into consideration in the current
study. Seasonal averages of COD from industrial effluent and Leeuwkuil Treatment
Plant (inflow and final effluent) showed significant (p<0.05) variations in all four
seasons. For example, the highest COD was in autumn (320 mg/l) compared to the
lowest in winter (184 mg/l) for samples from industry 1 (Table 4.2). In our study, the
COD values ranged from 3 to 909 mg/l during summer, 3 to 1172 mg/l during autumn,
136 to 1209 mg/l in winter and 0 to 1493 mg/l during spring. Seasonal variation was
also reported to influence the COD of final effluents of an urban wastewater treatment
plant in South Africa (Odjadjare and Okoh, 2010). Although in our study, COD values
from industries did not meet the green drop standard of effluent indicating high level
of pollution, these were noticeably reduced at the final effluent in summer, autumn and
spring when compared to the Green Drop certification. Implying that the Leeuwkuil
Wastewater Treatment Plant was effective in their treatment during the three seasons.
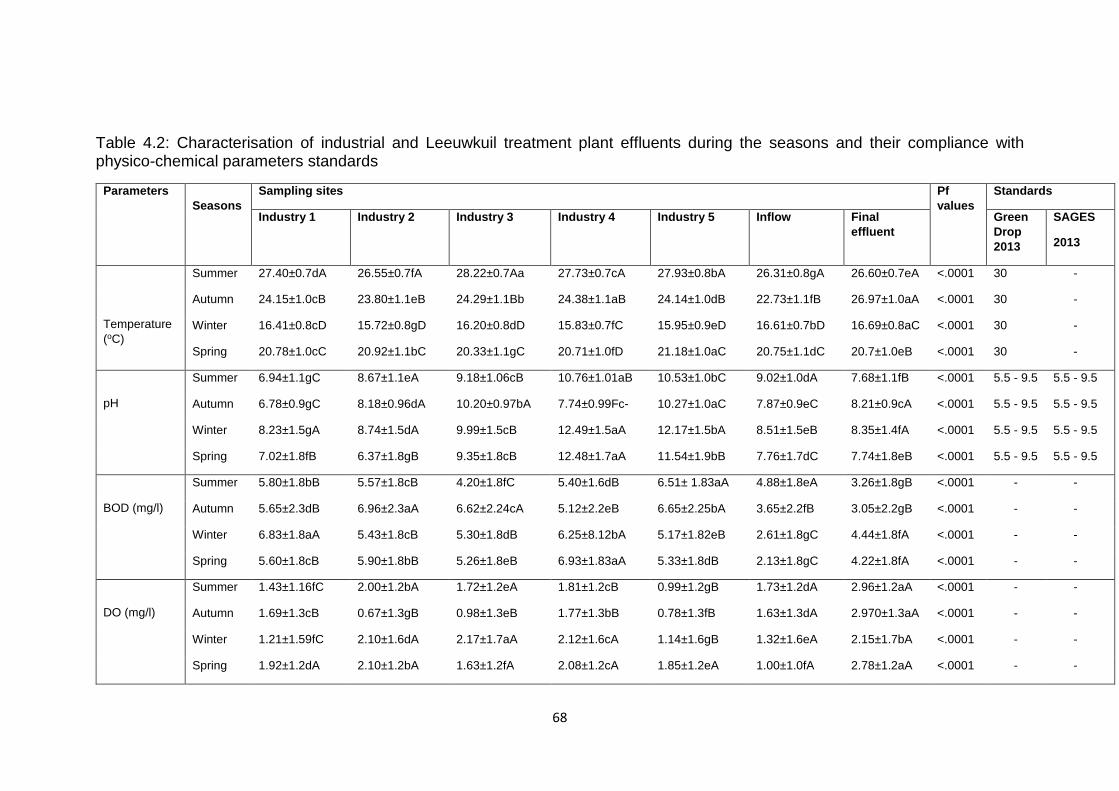
68
Table 4.2: Characterisation of industrial and Leeuwkuil treatment plant effluents during the seasons and their compliance with physico-chemical parameters standards
Parameters Seasons
Sampling sites Pf values
Standards
Industry 1 Industry 2 Industry 3 Industry 4 Industry 5 Inflow Final effluent
Green Drop 2013
SAGES
2013
Temperature (oC)
Summer 27.40±0.7dA 26.55±0.7fA 28.22±0.7Aa 27.73±0.7cA 27.93±0.8bA 26.31±0.8gA 26.60±0.7eA <.0001 30 -
Autumn 24.15±1.0cB 23.80±1.1eB 24.29±1.1Bb 24.38±1.1aB 24.14±1.0dB 22.73±1.1fB 26.97±1.0aA <.0001 30 -
Winter 16.41±0.8cD 15.72±0.8gD 16.20±0.8dD 15.83±0.7fC 15.95±0.9eD 16.61±0.7bD 16.69±0.8aC <.0001 30 -
Spring 20.78±1.0cC 20.92±1.1bC 20.33±1.1gC 20.71±1.0fD 21.18±1.0aC 20.75±1.1dC 20.7±1.0eB <.0001 30 -
pH
Summer 6.94±1.1gC 8.67±1.1eA 9.18±1.06cB 10.76±1.01aB 10.53±1.0bC 9.02±1.0dA 7.68±1.1fB <.0001 5.5 - 9.5 5.5 - 9.5
Autumn 6.78±0.9gC 8.18±0.96dA 10.20±0.97bA 7.74±0.99Fc- 10.27±1.0aC 7.87±0.9eC 8.21±0.9cA <.0001 5.5 - 9.5 5.5 - 9.5
Winter 8.23±1.5gA 8.74±1.5dA 9.99±1.5cB 12.49±1.5aA 12.17±1.5bA 8.51±1.5eB 8.35±1.4fA <.0001 5.5 - 9.5 5.5 - 9.5
Spring 7.02±1.8fB 6.37±1.8gB 9.35±1.8cB 12.48±1.7aA 11.54±1.9bB 7.76±1.7dC 7.74±1.8eB <.0001 5.5 - 9.5 5.5 - 9.5
BOD (mg/l)
Summer 5.80±1.8bB 5.57±1.8cB 4.20±1.8fC 5.40±1.6dB 6.51± 1.83aA 4.88±1.8eA 3.26±1.8gB <.0001 - -
Autumn 5.65±2.3dB 6.96±2.3aA 6.62±2.24cA 5.12±2.2eB 6.65±2.25bA 3.65±2.2fB 3.05±2.2gB <.0001 - -
Winter 6.83±1.8aA 5.43±1.8cB 5.30±1.8dB 6.25±8.12bA 5.17±1.82eB 2.61±1.8gC 4.44±1.8fA <.0001 - -
Spring 5.60±1.8cB 5.90±1.8bB 5.26±1.8eB 6.93±1.83aA 5.33±1.8dB 2.13±1.8gC 4.22±1.8fA <.0001 - -
DO (mg/l)
Summer 1.43±1.16fC 2.00±1.2bA 1.72±1.2eA 1.81±1.2cB 0.99±1.2gB 1.73±1.2dA 2.96±1.2aA <.0001 - -
Autumn 1.69±1.3cB 0.67±1.3gB 0.98±1.3eB 1.77±1.3bB 0.78±1.3fB 1.63±1.3dA 2.970±1.3aA <.0001 - -
Winter 1.21±1.59fC 2.10±1.6dA 2.17±1.7aA 2.12±1.6cA 1.14±1.6gB 1.32±1.6eA 2.15±1.7bA <.0001 - -
Spring 1.92±1.2dA 2.10±1.2bA 1.63±1.2fA 2.08±1.2cA 1.85±1.2eA 1.00±1.0fA 2.78±1.2aA <.0001 - -
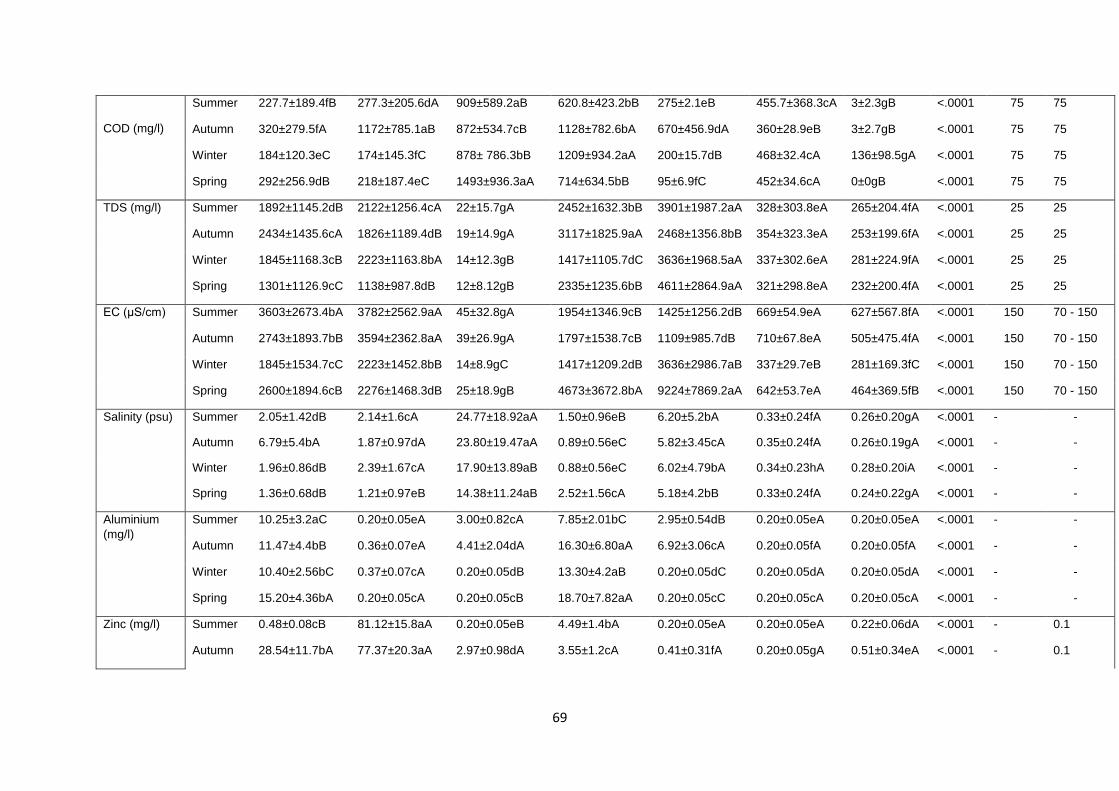
69
COD (mg/l)
Summer 227.7±189.4fB 277.3±205.6dA 909±589.2aB 620.8±423.2bB 275±2.1eB 455.7±368.3cA 3±2.3gB <.0001 75 75
Autumn 320±279.5fA 1172±785.1aB 872±534.7cB 1128±782.6bA 670±456.9dA 360±28.9eB 3±2.7gB <.0001 75 75
Winter 184±120.3eC 174±145.3fC 878± 786.3bB 1209±934.2aA 200±15.7dB 468±32.4cA 136±98.5gA <.0001 75 75
Spring 292±256.9dB 218±187.4eC 1493±936.3aA 714±634.5bB 95±6.9fC 452±34.6cA 0±0gB <.0001 75 75
TDS (mg/l) Summer 1892±1145.2dB 2122±1256.4cA 22±15.7gA 2452±1632.3bB 3901±1987.2aA 328±303.8eA 265±204.4fA <.0001 25 25
Autumn 2434±1435.6cA 1826±1189.4dB 19±14.9gA 3117±1825.9aA 2468±1356.8bB 354±323.3eA 253±199.6fA <.0001 25 25
Winter 1845±1168.3cB 2223±1163.8bA 14±12.3gB 1417±1105.7dC 3636±1968.5aA 337±302.6eA 281±224.9fA <.0001 25 25
Spring 1301±1126.9cC 1138±987.8dB 12±8.12gB 2335±1235.6bB 4611±2864.9aA 321±298.8eA 232±200.4fA <.0001 25 25
EC (μS/cm) Summer 3603±2673.4bA 3782±2562.9aA 45±32.8gA 1954±1346.9cB 1425±1256.2dB 669±54.9eA 627±567.8fA <.0001 150 70 - 150
Autumn 2743±1893.7bB 3594±2362.8aA 39±26.9gA 1797±1538.7cB 1109±985.7dB 710±67.8eA 505±475.4fA <.0001 150 70 - 150
Winter 1845±1534.7cC 2223±1452.8bB 14±8.9gC 1417±1209.2dB 3636±2986.7aB 337±29.7eB 281±169.3fC <.0001 150 70 - 150
Spring 2600±1894.6cB 2276±1468.3dB 25±18.9gB 4673±3672.8bA 9224±7869.2aA 642±53.7eA 464±369.5fB <.0001 150 70 - 150
Salinity (psu) Summer 2.05±1.42dB 2.14±1.6cA 24.77±18.92aA 1.50±0.96eB 6.20±5.2bA 0.33±0.24fA 0.26±0.20gA <.0001 - -
Autumn 6.79±5.4bA 1.87±0.97dA 23.80±19.47aA 0.89±0.56eC 5.82±3.45cA 0.35±0.24fA 0.26±0.19gA <.0001 - -
Winter 1.96±0.86dB 2.39±1.67cA 17.90±13.89aB 0.88±0.56eC 6.02±4.79bA 0.34±0.23hA 0.28±0.20iA <.0001 - -
Spring 1.36±0.68dB 1.21±0.97eB 14.38±11.24aB 2.52±1.56cA 5.18±4.2bB 0.33±0.24fA 0.24±0.22gA <.0001 - -
Aluminium (mg/l)
Summer 10.25±3.2aC 0.20±0.05eA 3.00±0.82cA 7.85±2.01bC 2.95±0.54dB 0.20±0.05eA 0.20±0.05eA <.0001 - -
Autumn 11.47±4.4bB 0.36±0.07eA 4.41±2.04dA 16.30±6.80aA 6.92±3.06cA 0.20±0.05fA 0.20±0.05fA <.0001 - -
Winter 10.40±2.56bC 0.37±0.07cA 0.20±0.05dB 13.30±4.2aB 0.20±0.05dC 0.20±0.05dA 0.20±0.05dA <.0001 - -
Spring 15.20±4.36bA 0.20±0.05cA 0.20±0.05cB 18.70±7.82aA 0.20±0.05cC 0.20±0.05cA 0.20±0.05cA <.0001 - -
Zinc (mg/l) Summer 0.48±0.08cB 81.12±15.8aA 0.20±0.05eB 4.49±1.4bA 0.20±0.05eA 0.20±0.05eA 0.22±0.06dA <.0001 - 0.1
Autumn 28.54±11.7bA 77.37±20.3aA 2.97±0.98dA 3.55±1.2cA 0.41±0.31fA 0.20±0.05gA 0.51±0.34eA <.0001 - 0.1
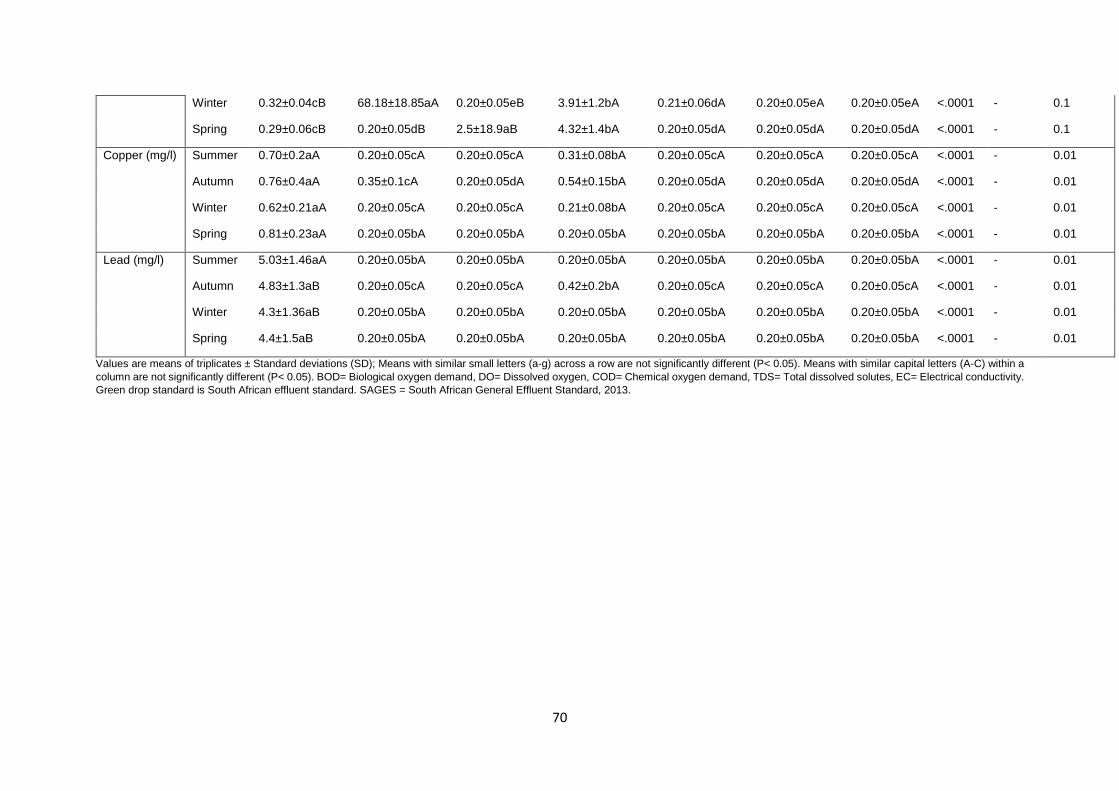
70
Winter 0.32±0.04cB 68.18±18.85aA 0.20±0.05eB 3.91±1.2bA 0.21±0.06dA 0.20±0.05eA 0.20±0.05eA <.0001 - 0.1
Spring 0.29±0.06cB 0.20±0.05dB 2.5±18.9aB 4.32±1.4bA 0.20±0.05dA 0.20±0.05dA 0.20±0.05dA <.0001 - 0.1
Copper (mg/l) Summer 0.70±0.2aA 0.20±0.05cA 0.20±0.05cA 0.31±0.08bA 0.20±0.05cA 0.20±0.05cA 0.20±0.05cA <.0001 - 0.01
Autumn 0.76±0.4aA 0.35±0.1cA 0.20±0.05dA 0.54±0.15bA 0.20±0.05dA 0.20±0.05dA 0.20±0.05dA <.0001 - 0.01
Winter 0.62±0.21aA 0.20±0.05cA 0.20±0.05cA 0.21±0.08bA 0.20±0.05cA 0.20±0.05cA 0.20±0.05cA <.0001 - 0.01
Spring 0.81±0.23aA 0.20±0.05bA 0.20±0.05bA 0.20±0.05bA 0.20±0.05bA 0.20±0.05bA 0.20±0.05bA <.0001 - 0.01
Lead (mg/l) Summer 5.03±1.46aA 0.20±0.05bA 0.20±0.05bA 0.20±0.05bA 0.20±0.05bA 0.20±0.05bA 0.20±0.05bA <.0001 - 0.01
Autumn 4.83±1.3aB 0.20±0.05cA 0.20±0.05cA 0.42±0.2bA 0.20±0.05cA 0.20±0.05cA 0.20±0.05cA <.0001 - 0.01
Winter 4.3±1.36aB 0.20±0.05bA 0.20±0.05bA 0.20±0.05bA 0.20±0.05bA 0.20±0.05bA 0.20±0.05bA <.0001 - 0.01
Spring 4.4±1.5aB 0.20±0.05bA 0.20±0.05bA 0.20±0.05bA 0.20±0.05bA 0.20±0.05bA 0.20±0.05bA <.0001 - 0.01
Values are means of triplicates ± Standard deviations (SD); Means with similar small letters (a-g) across a row are not significantly different (P< 0.05). Means with similar capital letters (A-C) within a column are not significantly different (P< 0.05). BOD= Biological oxygen demand, DO= Dissolved oxygen, COD= Chemical oxygen demand, TDS= Total dissolved solutes, EC= Electrical conductivity. Green drop standard is South African effluent standard. SAGES = South African General Effluent Standard, 2013.
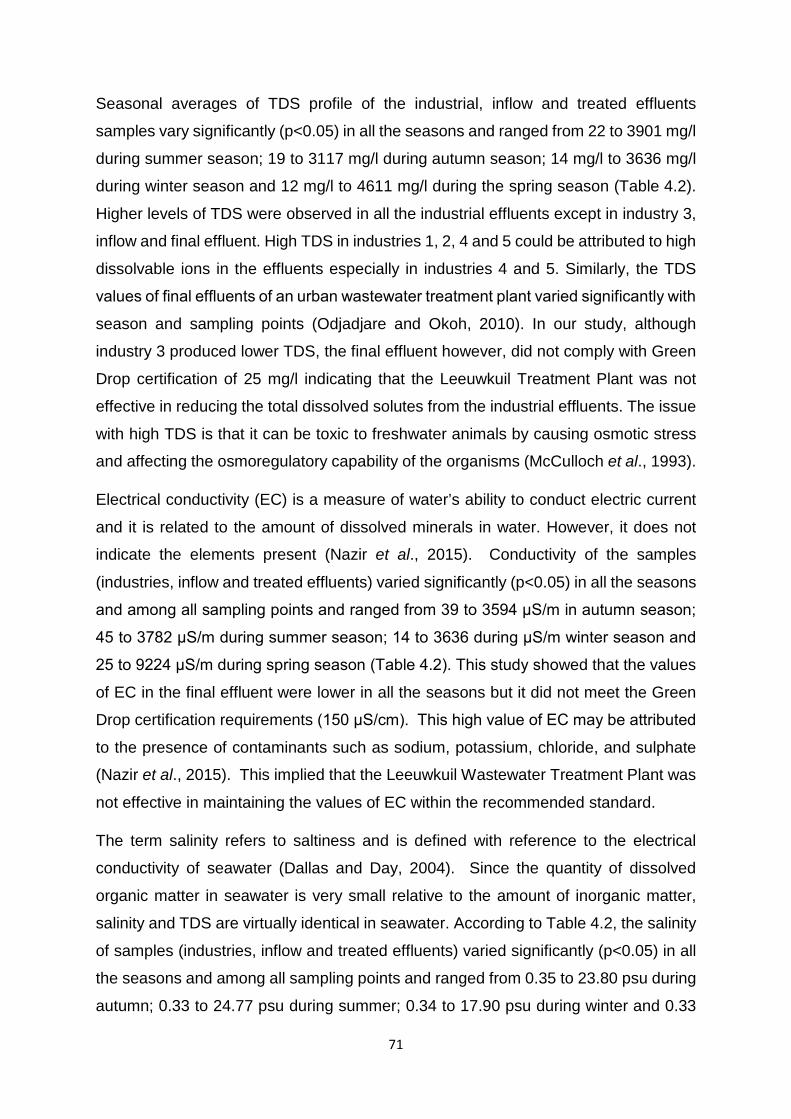
71
Seasonal averages of TDS profile of the industrial, inflow and treated effluents
samples vary significantly (p<0.05) in all the seasons and ranged from 22 to 3901 mg/l
during summer season; 19 to 3117 mg/l during autumn season; 14 mg/l to 3636 mg/l
during winter season and 12 mg/l to 4611 mg/l during the spring season (Table 4.2).
Higher levels of TDS were observed in all the industrial effluents except in industry 3,
inflow and final effluent. High TDS in industries 1, 2, 4 and 5 could be attributed to high
dissolvable ions in the effluents especially in industries 4 and 5. Similarly, the TDS
values of final effluents of an urban wastewater treatment plant varied significantly with
season and sampling points (Odjadjare and Okoh, 2010). In our study, although
industry 3 produced lower TDS, the final effluent however, did not comply with Green
Drop certification of 25 mg/l indicating that the Leeuwkuil Treatment Plant was not
effective in reducing the total dissolved solutes from the industrial effluents. The issue
with high TDS is that it can be toxic to freshwater animals by causing osmotic stress
and affecting the osmoregulatory capability of the organisms (McCulloch et al., 1993).
Electrical conductivity (EC) is a measure of water’s ability to conduct electric current
and it is related to the amount of dissolved minerals in water. However, it does not
indicate the elements present (Nazir et al., 2015). Conductivity of the samples
(industries, inflow and treated effluents) varied significantly (p<0.05) in all the seasons
and among all sampling points and ranged from 39 to 3594 μS/m in autumn season;
45 to 3782 μS/m during summer season; 14 to 3636 during μS/m winter season and
25 to 9224 μS/m during spring season (Table 4.2). This study showed that the values
of EC in the final effluent were lower in all the seasons but it did not meet the Green
Drop certification requirements (150 μS/cm). This high value of EC may be attributed
to the presence of contaminants such as sodium, potassium, chloride, and sulphate
(Nazir et al., 2015). This implied that the Leeuwkuil Wastewater Treatment Plant was
not effective in maintaining the values of EC within the recommended standard.
The term salinity refers to saltiness and is defined with reference to the electrical
conductivity of seawater (Dallas and Day, 2004). Since the quantity of dissolved
organic matter in seawater is very small relative to the amount of inorganic matter,
salinity and TDS are virtually identical in seawater. According to Table 4.2, the salinity
of samples (industries, inflow and treated effluents) varied significantly (p<0.05) in all
the seasons and among all sampling points and ranged from 0.35 to 23.80 psu during
autumn; 0.33 to 24.77 psu during summer; 0.34 to 17.90 psu during winter and 0.33
72
to 14.38 psu during spring (Table 4.2). Similarly, the salinity of final effluent of an urban
wastewater treatment plant varied significantly with season and sampling points
(Odjadjare·and Okoh, 2010). In our study, higher levels of salinity were observed in
samples from industry 3 (wire industry) indicating high dissolvable salt in their effluent
water. The high salinity in industry 3 can be traced to oxidation of cations and anions
used in wire manufacturing. According to the results, salinity in inflow samples is lower
in all the seasons compared to the industrial samples due to serial dilution of industrial
effluent by domestic effluent. Furthermore, salinity in inflow was found to be higher
than in the final effluent in all the seasons. However, there are no set standard for
salinity level for effluent discharged into the aquatic ecosystems in South Africa. The
water quality criteria for South African coastal zones put the acceptable limit of salinity
in marine ecosystem for all biological activity at 33-36 psu (SANCOR, 1984), indicating
effectiveness by the treatment plant in removing dissolved salts present in waste
water.
In summary, the industries were observed to have high values for the heavy metals
and the water quality parameters (BOD, DO, COD, TDS, EC, and salinity) measured
in this study. This indicated them as point source of pollution in Vaal area of South
Africa. The Leeuwkuil Wastewater Treatment Plant was also assessed on its ability to
reduce the contaminants to the required and acceptable limit using Green Drop and
SAGES certification requirements. There were no stipulated Green Drop standard for
the four heavy metals (Al, Cu, Zn, Pb), BOD, salinity, and DO. Amongst the four heavy
metals of interest in this study, Cu, Zn, and Pb were observed to be above the SAGES
certification requirements whereas Al has no SAGES certification requirements for
comparison. Furthermore, water parameters such as TDS (25 mg/l) and EC (150
μS/cm) did not meet the Green Drop standard. An overall assessment of the Leeuwkuil
Wastewater Treatment Plant showed the treatment plant needs to be reviewed as it
was found to be ineffective in maintaining TDS and EC but was only effective in
maintaining temperature, pH, and COD within the Green Drop standard and SAGES
standards.
73
4.2.3 Correlation coefficient analysis of the heavy metals and physico-chemical parameters of effluents from industries and the Leeuwkuil Wastewater Treatment Plant Analysis of the data obtained in this study showed strong significant (p<0.05)
correlations between physico-chemical variables (Tables 4.3-4.6); and in the case of
regression, a significantly high dependence of one variable on the order as shown
Figures 4.1-4.4 for samples from the industries, inflow and final effluent for all the
seasons. The analysis of the interrelationship between physical parameters and heavy
metals gave an insight on the influence of the industrial effluents on the wastewater
treatment plants. Verandani and Vardhan (2012) stated that the study of correlation
coefficients of water quality parameters helps to evaluate the concentration of the
various pollutants, which will aid in assessing the overall quality of water. Strong
correlation between variables is within the correlation coefficients range of 0.8 to 1 and
-0.8 to -1, moderate correlation in the range of 0.5 to 0.8 and -0.5 to -0.8, and weak
correlation in the range of 0.0 to 0.5 and -0.0 to -0.5.
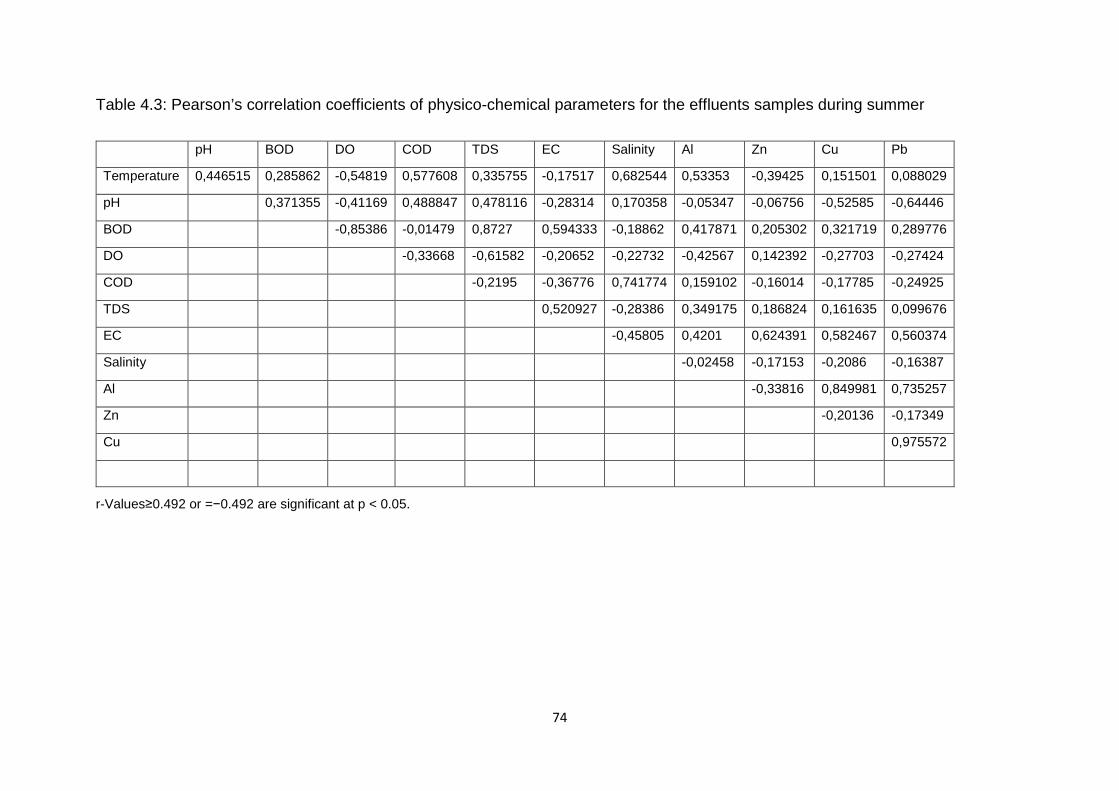
74
Table 4.3: Pearson’s correlation coefficients of physico-chemical parameters for the effluents samples during summer
r-Values≥0.492 or =−0.492 are significant at p < 0.05.
pH BOD DO COD TDS EC Salinity Al Zn Cu Pb
Temperature 0,446515 0,285862 -0,54819 0,577608 0,335755 -0,17517 0,682544 0,53353 -0,39425 0,151501 0,088029
pH
0,371355 -0,41169 0,488847 0,478116 -0,28314 0,170358 -0,05347 -0,06756 -0,52585 -0,64446
BOD
-0,85386 -0,01479 0,8727 0,594333 -0,18862 0,417871 0,205302 0,321719 0,289776
DO
-0,33668 -0,61582 -0,20652 -0,22732 -0,42567 0,142392 -0,27703 -0,27424
COD
-0,2195 -0,36776 0,741774 0,159102 -0,16014 -0,17785 -0,24925
TDS
0,520927 -0,28386 0,349175 0,186824 0,161635 0,099676
EC
-0,45805 0,4201 0,624391 0,582467 0,560374
Salinity
-0,02458 -0,17153 -0,2086 -0,16387
Al
-0,33816 0,849981 0,735257
Zn
-0,20136 -0,17349
Cu
0,975572

75
Table 4.4: Pearson’s correlation coefficients of physico-chemical parameters for the effluents samples during winter
pH BOD DO COD TDS EC Salinity Al Zn Cu Pb
Temperature -0,62665 -0,5061 -0,21799 -0,29731 -0,61774 -0,61774 -0,1601 -0,21394 -0,58123 0,230549 0,239868
pH
0,294096 0,014836 0,575691 0,453104 0,453104 0,201925 0,30797 -0,2172 -0,35865 -0,3728
BOD
0,114118 0,159207 0,407374 0,407374 0,130844 0,113135 0,113135 0,556414 0,545843
DO
0,424983 -0,49109 -0,49109 0,219185 -0,02771 0,339929 -0,47393 -0,48022
COD
-0,34968 -0,34968 0,320958 0,472718 -0,26364 -0,27551 -0,29304
TDS
1 -0,18126 0,112987 0,283994 0,153692 0,152934
EC
-0,18126 0,112987 0,283994 0,153692 0,152934
Salinity
-0,31186 -0,14396 -0,16588 -0,15967
Al
-0,20475 0,546822 0,526943
Zn
-0,17878 -0,17542
Cu
0,999722
r-Values≥0.492 or =−0.492 are significant at p < 0.05.
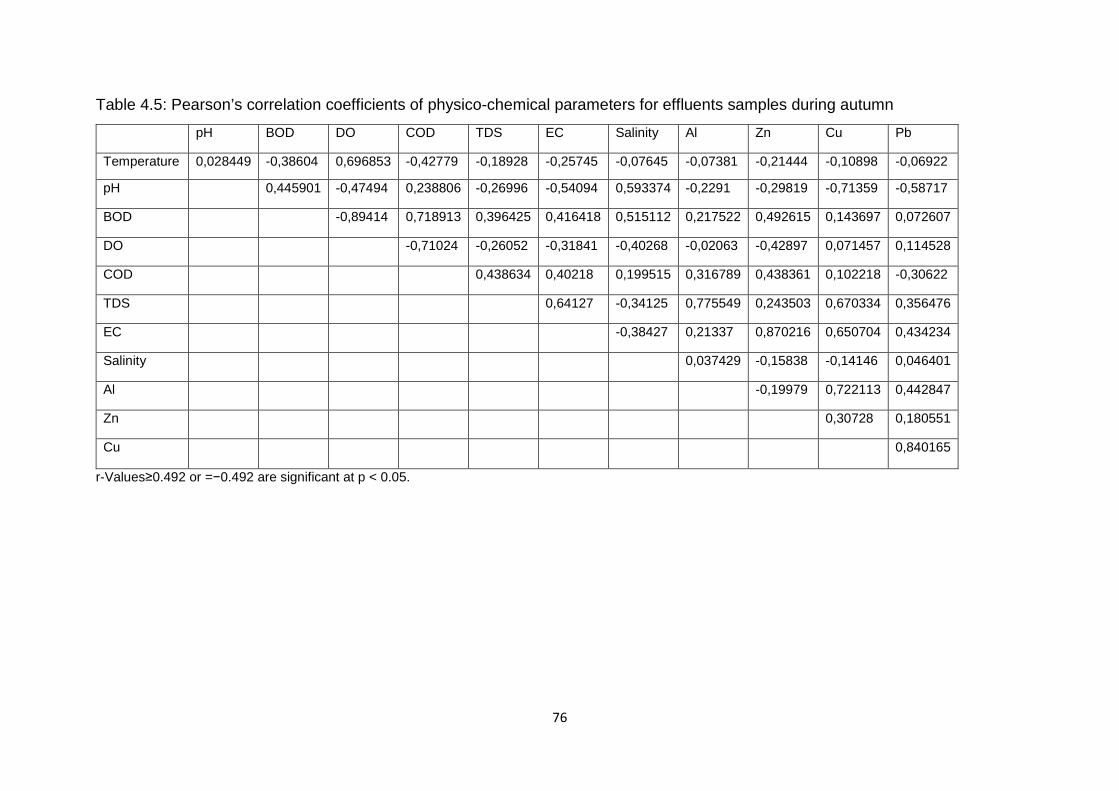
76
Table 4.5: Pearson’s correlation coefficients of physico-chemical parameters for effluents samples during autumn
pH BOD DO COD TDS EC Salinity Al Zn Cu Pb
Temperature 0,028449 -0,38604 0,696853 -0,42779 -0,18928 -0,25745 -0,07645 -0,07381 -0,21444 -0,10898 -0,06922
pH
0,445901 -0,47494 0,238806 -0,26996 -0,54094 0,593374 -0,2291 -0,29819 -0,71359 -0,58717
BOD
-0,89414 0,718913 0,396425 0,416418 0,515112 0,217522 0,492615 0,143697 0,072607
DO
-0,71024 -0,26052 -0,31841 -0,40268 -0,02063 -0,42897 0,071457 0,114528
COD
0,438634 0,40218 0,199515 0,316789 0,438361 0,102218 -0,30622
TDS
0,64127 -0,34125 0,775549 0,243503 0,670334 0,356476
EC
-0,38427 0,21337 0,870216 0,650704 0,434234
Salinity
0,037429 -0,15838 -0,14146 0,046401
Al
-0,19979 0,722113 0,442847
Zn
0,30728 0,180551
Cu
0,840165
r-Values≥0.492 or =−0.492 are significant at p < 0.05.
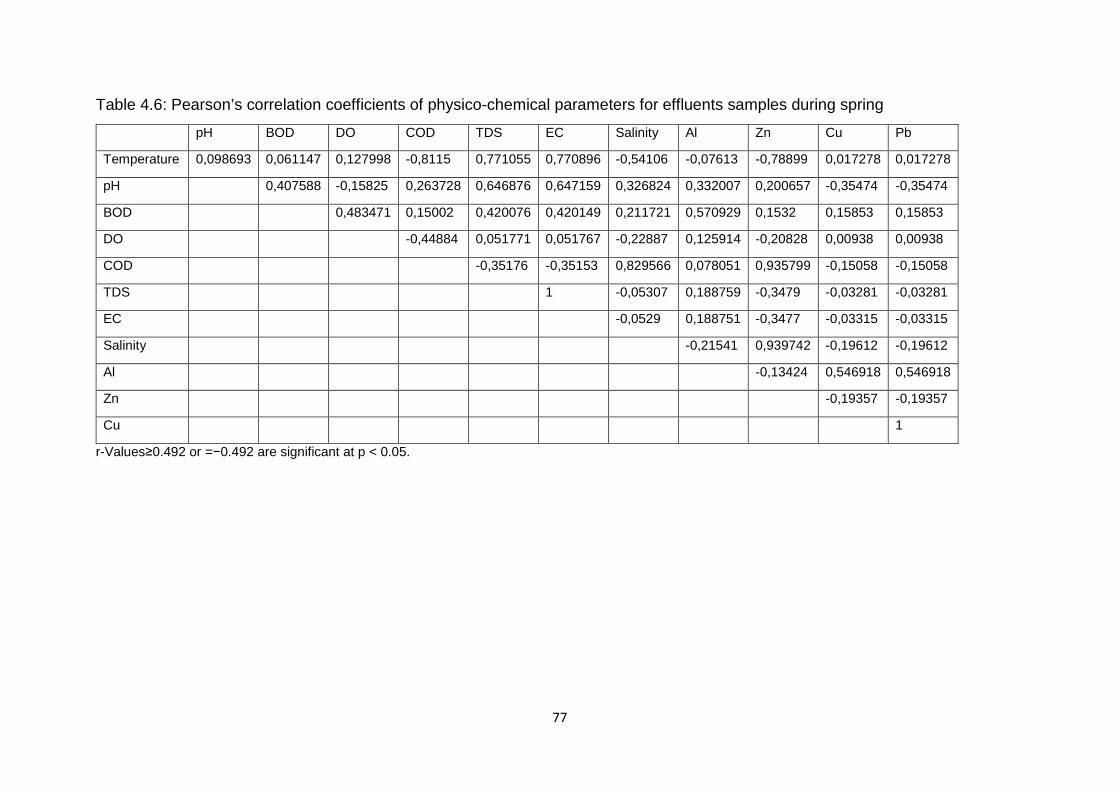
77
Table 4.6: Pearson’s correlation coefficients of physico-chemical parameters for effluents samples during spring
pH BOD DO COD TDS EC Salinity Al Zn Cu Pb
Temperature 0,098693 0,061147 0,127998 -0,8115 0,771055 0,770896 -0,54106 -0,07613 -0,78899 0,017278 0,017278
pH
0,407588 -0,15825 0,263728 0,646876 0,647159 0,326824 0,332007 0,200657 -0,35474 -0,35474
BOD
0,483471 0,15002 0,420076 0,420149 0,211721 0,570929 0,1532 0,15853 0,15853
DO
-0,44884 0,051771 0,051767 -0,22887 0,125914 -0,20828 0,00938 0,00938
COD
-0,35176 -0,35153 0,829566 0,078051 0,935799 -0,15058 -0,15058
TDS
1 -0,05307 0,188759 -0,3479 -0,03281 -0,03281
EC
-0,0529 0,188751 -0,3477 -0,03315 -0,03315
Salinity
-0,21541 0,939742 -0,19612 -0,19612
Al
-0,13424 0,546918 0,546918
Zn
-0,19357 -0,19357
Cu
1
r-Values≥0.492 or =−0.492 are significant at p < 0.05.
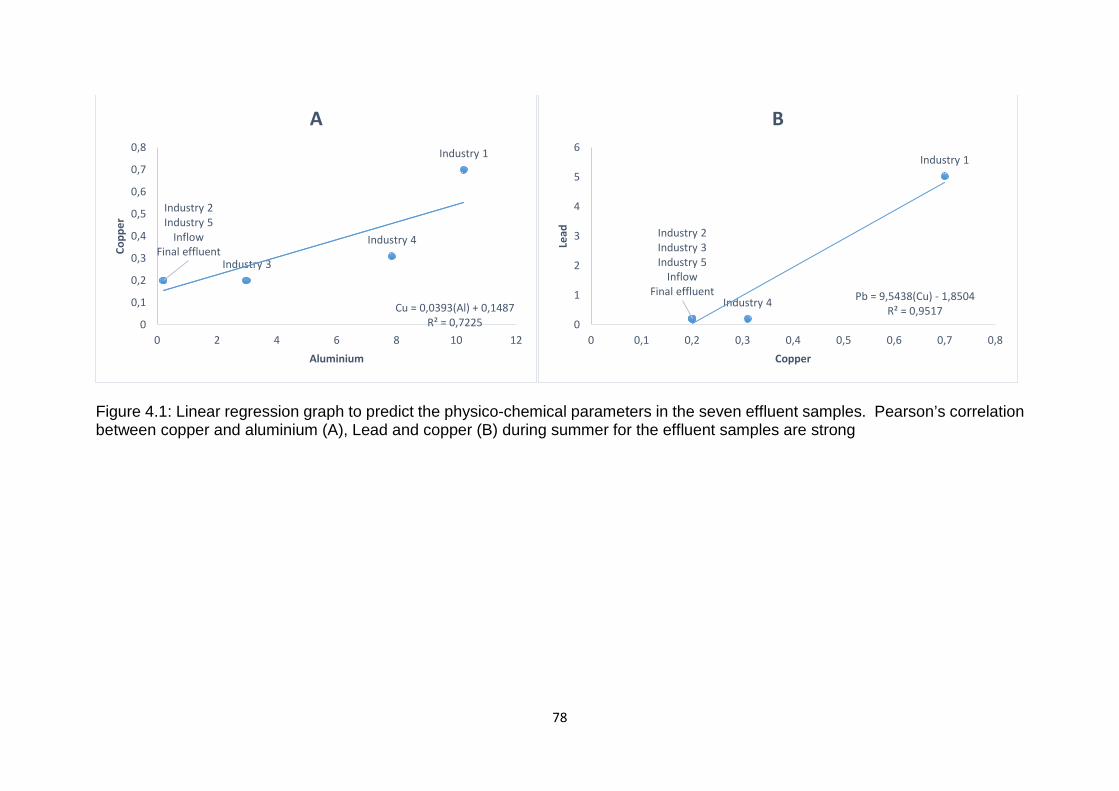
78
Figure 4.1: Linear regression graph to predict the physico-chemical parameters in the seven effluent samples. Pearson’s correlation between copper and aluminium (A), Lead and copper (B) during summer for the effluent samples are strong
Industry 1
Industry 3
Industry 4
Industry 2Industry 5
InflowFinal effluent
Cu = 0,0393(Al) + 0,1487R² = 0,72250
0,1
0,2
0,3
0,4
0,5
0,6
0,7
0,8
0 2 4 6 8 10 12
Copp
er
Aluminium
A
Industry 1
Industry 4
Industry 2Industry 3Industry 5
InflowFinal effluent Pb = 9,5438(Cu) - 1,8504
R² = 0,95170
1
2
3
4
5
6
0 0,1 0,2 0,3 0,4 0,5 0,6 0,7 0,8
Lead
Copper
B
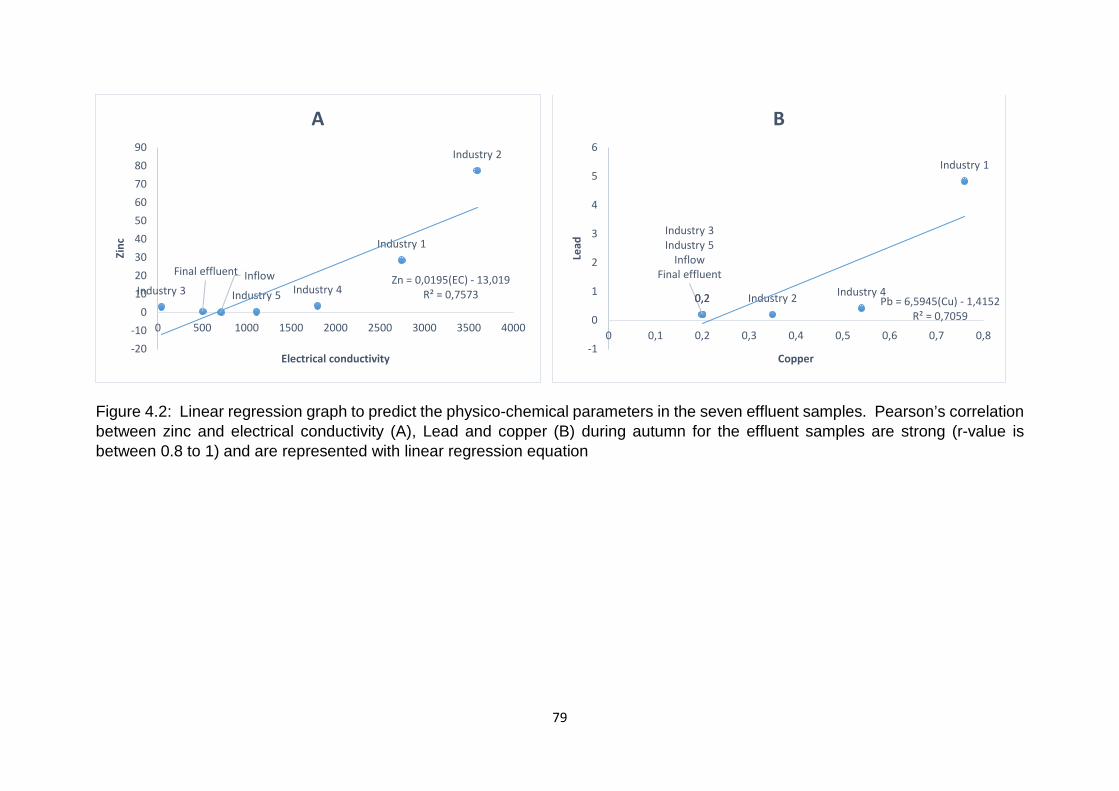
79
Figure 4.2: Linear regression graph to predict the physico-chemical parameters in the seven effluent samples. Pearson’s correlation between zinc and electrical conductivity (A), Lead and copper (B) during autumn for the effluent samples are strong (r-value is between 0.8 to 1) and are represented with linear regression equation
Industry 1
Industry 20,2 Industry 40,2
Industry 3Industry 5
Inflow Final effluent
Pb = 6,5945(Cu) - 1,4152R² = 0,7059
-1
0
1
2
3
4
5
6
0 0,1 0,2 0,3 0,4 0,5 0,6 0,7 0,8
Lead
Copper
B
Industry 1
Industry 2
Industry 3 Industry 4Industry 5
InflowFinal effluentZn = 0,0195(EC) - 13,019
R² = 0,7573
-20-10
0102030405060708090
0 500 1000 1500 2000 2500 3000 3500 4000
Zinc
Electrical conductivity
A
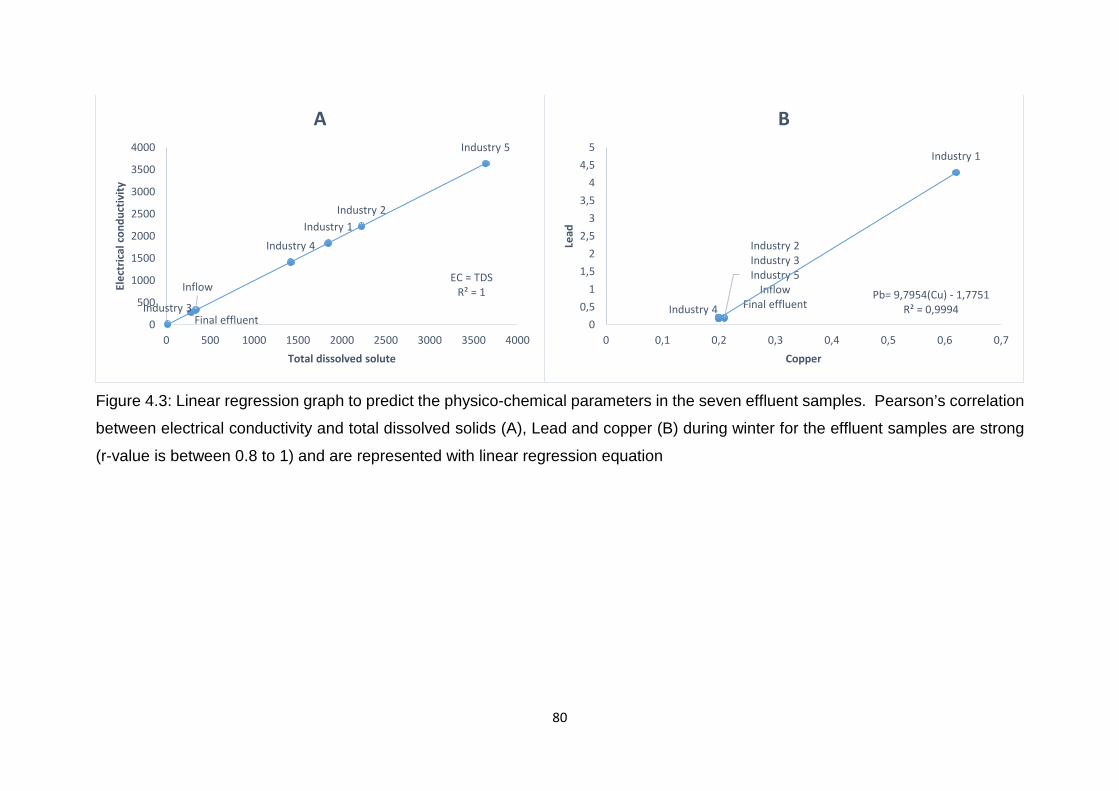
80
Figure 4.3: Linear regression graph to predict the physico-chemical parameters in the seven effluent samples. Pearson’s correlation
between electrical conductivity and total dissolved solids (A), Lead and copper (B) during winter for the effluent samples are strong
(r-value is between 0.8 to 1) and are represented with linear regression equation
Industry 1Industry 2
Industry 3
Industry 4
Industry 5
Inflow
Final effluent
EC = TDSR² = 1
0
500
1000
1500
2000
2500
3000
3500
4000
0 500 1000 1500 2000 2500 3000 3500 4000
Elec
tric
al c
ondu
ctiv
ity
Total dissolved solute
A
Industry 1
Industry 2Industry 3Industry 5
InflowFinal effluentIndustry 4
Pb= 9,7954(Cu) - 1,7751R² = 0,9994
00,5
11,5
22,5
33,5
44,5
5
0 0,1 0,2 0,3 0,4 0,5 0,6 0,7
Lead
Copper
B
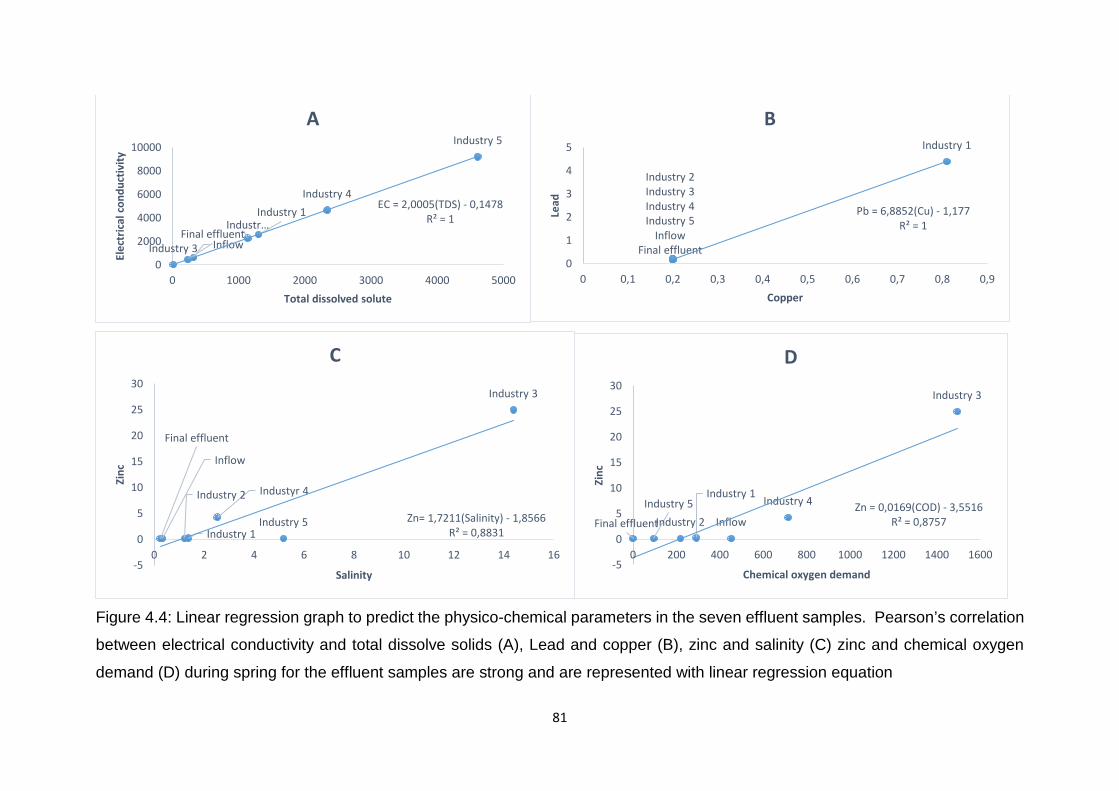
81
Figure 4.4: Linear regression graph to predict the physico-chemical parameters in the seven effluent samples. Pearson’s correlation
between electrical conductivity and total dissolve solids (A), Lead and copper (B), zinc and salinity (C) zinc and chemical oxygen
demand (D) during spring for the effluent samples are strong and are represented with linear regression equation
Industry 1Industr…
Industry 3
Industry 4
Industry 5
InflowFinal effluent
EC = 2,0005(TDS) - 0,1478R² = 1
0
2000
4000
6000
8000
10000
0 1000 2000 3000 4000 5000
Elec
tric
al c
ondu
ctiv
ity
Total dissolved solute
AIndustry 1
Industry 2Industry 3Industry 4Industry 5
InflowFinal effluent
Pb = 6,8852(Cu) - 1,177R² = 1
0
1
2
3
4
5
0 0,1 0,2 0,3 0,4 0,5 0,6 0,7 0,8 0,9
Lead
Copper
B
Industry 1
Industry 2
Industry 3
Industyr 4
Industry 5
Inflow
Final effluent
Zn= 1,7211(Salinity) - 1,8566R² = 0,8831
-5
0
5
10
15
20
25
30
0 2 4 6 8 10 12 14 16
Zinc
Salinity
C
Industry 1
Industry 2
Industry 3
Industry 4Industry 5InflowFinal effluent
Zn = 0,0169(COD) - 3,5516R² = 0,8757
-5
0
5
10
15
20
25
30
0 200 400 600 800 1000 1200 1400 1600
Zinc
Chemical oxygen demand
D
82
According to Table 4.3 and Figure 4.1, at a significant level of p<0.05, during the
summer season, a strong and positive correlation was obtained between the following
parameters; temperature and COD (r2=0.5776), temperature and salinity (r2=0.6825,
p<0.05), temperature and Al (r2=0.5335), BOD and EC (r2=0.5943), BOD and TDS
(r2=0.8727), TDS and EC (r2=0.5209), EC and Zn (r2=0.6243), EC and Cu (r2=0.5824),
EC and Pb (r2=0.5603), Al and Cu (r2=0.8499), Al and Pb (r2=0.7352) and Cu and Pb
((r2=0.9755) at p<0.05). Similarly, during winter and at significant level of p< 0.05
(Table 4.4 and Figure 4.3), positive correlation also existed between pH and COD
((r2=0.5756), BOD and Pb (r2=0.5458), Al and Cu (r2 (=0.5468), Al and Pb ((r2=0.5269),
and Cu and Pb (r2=0.9997). In a similar study in the Nalasopra region, strong positive
correlations were noted between some physico-chemical parameters (Sangeeta and
Neha, 2015). Similar strong positive correlations between various pairs of metals
including manganese, copper, cadmium, nickel, cobalt and chromium in the soil water
system have been reported (Akbar et al., 2010).
In addition to the noted correlations between pairs of physico-chemical parameters
during summer and winter, similar strong correlations were observed with Cu and pH,
Al and TDS and Zn and EC during autumn at a significant level of p< 0.05 (Table 4.5
and Figure 4.2). For example, a significant positive correlation existed between
temperature and dissolved oxygen (r=0.6968), pH and salinity (r=0.5933), BOD and
salinity (r2=0.5151), BOD and Zn (r2=0.4926), TDS and EC (r2=0.6412), TDS and Al
(r2=0.7755), TDS and Cu (r2=0.6703), EC and Zn (r2=0.8702), EC and Cu (r2=0.6507),
Al and Cu (r2=0.7221), and Cu and Pb (r2=0.8401) (Table 4.5).
A similar correlation pattern was observed between BOD and the different variables
across the four seasons indicating high dependency of BOD on the concentration
levels of the variables across the seasons. This also implied that seasonal variation
had a significant influence on the wastewater released by the industries. The
wastewater released by the industries also impacted the quality of the effluent from
the Leeuwkuil Wastewater Treatment Plant.
Spring also recorded positive correlations between certain physico-chemical
parameters as shown in Table 4.6 and Figure 4.4. For example, a strong positive
relationship at significant level of p< 0.05 existed between temperature and DO
(r2=0.7710), temperature and EC (r2=0.7708), pH and DO (r2=0.6468), pH and EC
83
(r2=0.6471), BOD and Al (r2=0.5709), COD and salinity (r2=0.8295), COD and Zn
(r2=0.9357), salinity and Zn (r2=0.9397), Al and Cu (r2=0.5469), Al and Pb (r2=0.5469),
and Cu and Pb (r2=1). In general, these results demonstrated strong correlations
between pairs of heavy metals in all seasons. This is a clear indication of common
origins (industries) of these contaminants and their influence on the Leeuwkuil
wastewater treatment plant in Vaal area.
84
4.3 Heavy Metals and Physico-Chemical Parameters in Upstream and Downstream (Vaal River) and Potable Water around the Vaal Area In this study, samples collected from the Vaal River (upstream and downstream) and
potable waters (PO1 & PO2), were analysed for identification and determination of
heavy metal concentrations. The same number of heavy metals was identified in
upstream, downstream, potable water 1 and 2 (Table 4.1A & 4.1B). Notably from this
study, the concentrations of most heavy metals identified (Al, Cr, Cu, Fe, Ni, Pb, and
Zn) in potable water were observed to be lower than the concentrations of the ones in
upstream and downstream. This result implied that the purification plants were
effective in reducing the concentrations of these heavy metals.
4.3.1 Heavy metal analysis of samples from Vaal River and Potable water Previous studies on water quality of river showed that leachate, runoff from domestic
activities and industrial effluent contributes to the pollution of rivers and the reduction
of their quality for domestic, aesthetic, industrial and other uses (Fadiran and Mamba,
2005; Mtetwa, 1996). Lead (Pb) concentrations in upstream and downstream (Vaal
River) were observed to be high (Table 4.1 and 4.7). This result was consistent with
the findings of Osman and Kloas (2010), where they observed Pb concentrations to
be higher in Nile River as a result of urban effluent draining into the river. In
Bangladesh, a similar report showed high level of heavy metal pollution as a result of
industrial effluents, urban and agricultural wastes being discharged into rivers and
other forms of water bodies (Alam et al., 2007). According to the Department of
Environment (2001), Rupsha River is the most polluted river with heavy metals and
this is attributed to the increased number of industries located around the area. This
was also observed in this study in Vereeninging area of South Africa where 24 heavy
metals were identified in industrial and wastewater treatment plant effluents, and the
Vaal River. The presence of these heavy metals in the Vaal River implied that there is
a tendency for fishes in the river to be contaminated with heavy metals through
bioaccumulation. Samad et al. (2015) discovered Pb, Zn, Fe and Mn in Bangladesh
River (Rupsha River), and Fe, Cu, Zn, Pb, Cr, Mn and Ni in the fish and crayfish
muscles of the same river. This is an indication that the fish diffused or ingested these
metals and over time, it bioaccumulated in their muscles (Manyatshe et al., 2016). This
can create a health hazards for human being especially if the bioaccumulation factor
85
is beyond the acceptable limits. Furthermore, the concentration of Fe in upstream and
downstream is low (0.2 mg/l) as compared to final effluent (1.5 mg/l). We can conclude
that there could be absorption of this particular metal below the sediments in the Vaal
River (Varol and Sen, 2012).
The presence of high Pb concentration in the Leeuwkuil Plant impacted on the quality
of wastewater discharged into Vaal River by the plant. This trend was also observed
in potable waters where Pb concentrations were above the recommended limit. Lead
is non-biodegradable and can therefore persist and build up to toxic levels in living
organisms (Bent and Bohm, 1995). Their accumulation in aquatic organisms can reach
humans through the food chain and potable water, and can pose health related
complications in humans. For instance, Pb is carcinogenic and persistence (Patil et
al., 2012; Mahlambi et al., 2015; Manyatshe et al., 2016) and its accumulation in
excessive concentrations through the food chain can cause neurological and
behavioural disorders especially in children, anaemia, impaired kidney and testicular
function in humans (Barzilay et al., 1999).
In the Vaal area, the Vaal River is exposed to threat of heavy metals pollution arising
from anthropogenic activities such as land use, urbanisation and industrialisation. The
main concern arises as this river serves as a backbone of the country’s economy as it
provides water services to the economic hub (Gauteng province) of the country
(Tempelhoff, 2006). Furthermore, the Vaal River contributes 25% to the Gross
Domestic Product (GDP) of the country’s economy and has over 12 million people
who directly depend on it for water (Tshwane University of Technology, 2009).
Therefore, a proper evaluation to assess any presence of toxic constituents is beyond
environmental health but also for society’s wellbeing. As a result, the current study
further evaluated samples from Vaal River and potable waters for their quality and
concentrations of heavy metals in relation to seasonal variations together with their
potential associated effects on humans and the environment.
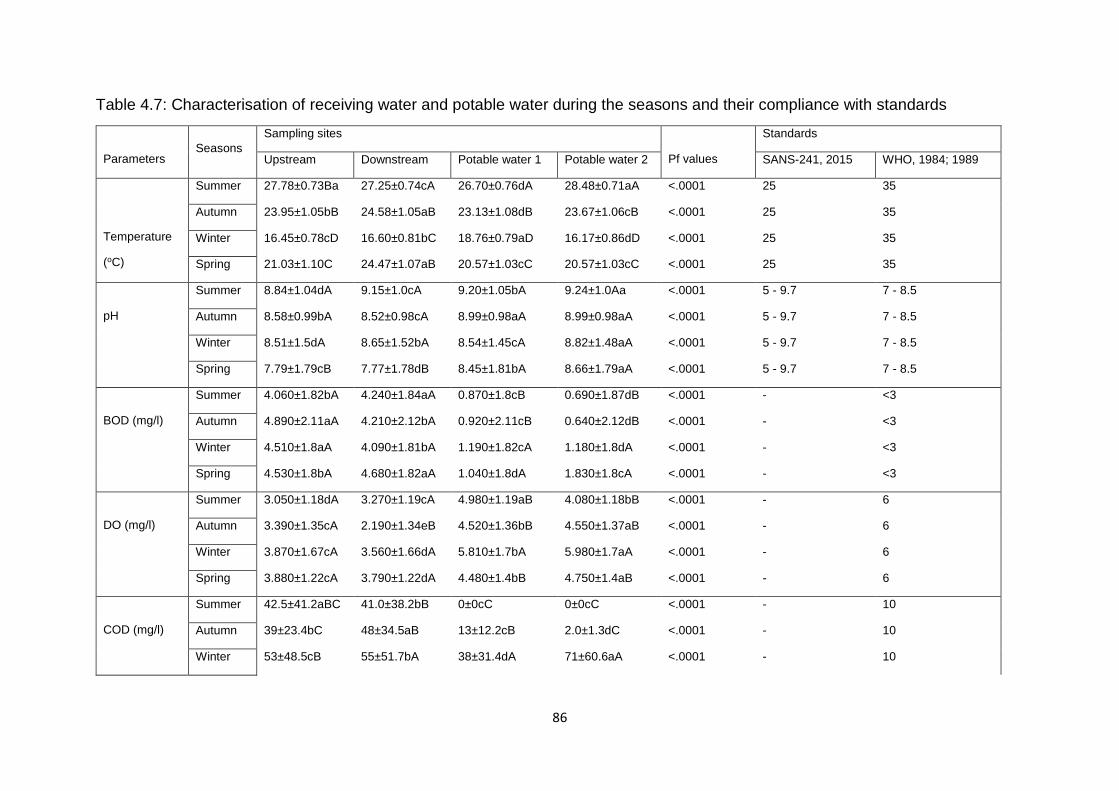
86
Table 4.7: Characterisation of receiving water and potable water during the seasons and their compliance with standards
Parameters
Seasons
Sampling sites
Pf values
Standards
Upstream Downstream Potable water 1 Potable water 2 SANS-241, 2015 WHO, 1984; 1989
Temperature
(oC)
Summer 27.78±0.73Ba 27.25±0.74cA 26.70±0.76dA 28.48±0.71aA <.0001 25 35
Autumn 23.95±1.05bB 24.58±1.05aB 23.13±1.08dB 23.67±1.06cB <.0001 25 35
Winter 16.45±0.78cD 16.60±0.81bC 18.76±0.79aD 16.17±0.86dD <.0001 25 35
Spring 21.03±1.10C 24.47±1.07aB 20.57±1.03cC 20.57±1.03cC <.0001 25 35
pH
Summer 8.84±1.04dA 9.15±1.0cA 9.20±1.05bA 9.24±1.0Aa <.0001 5 - 9.7 7 - 8.5
Autumn 8.58±0.99bA 8.52±0.98cA 8.99±0.98aA 8.99±0.98aA <.0001 5 - 9.7 7 - 8.5
Winter 8.51±1.5dA 8.65±1.52bA 8.54±1.45cA 8.82±1.48aA <.0001 5 - 9.7 7 - 8.5
Spring 7.79±1.79cB 7.77±1.78dB 8.45±1.81bA 8.66±1.79aA <.0001 5 - 9.7 7 - 8.5
BOD (mg/l)
Summer 4.060±1.82bA 4.240±1.84aA 0.870±1.8cB 0.690±1.87dB <.0001 - <3
Autumn 4.890±2.11aA 4.210±2.12bA 0.920±2.11cB 0.640±2.12dB <.0001 - <3
Winter 4.510±1.8aA 4.090±1.81bA 1.190±1.82cA 1.180±1.8dA <.0001 - <3
Spring 4.530±1.8bA 4.680±1.82aA 1.040±1.8dA 1.830±1.8cA <.0001 - <3
DO (mg/l)
Summer 3.050±1.18dA 3.270±1.19cA 4.980±1.19aB 4.080±1.18bB <.0001 - 6
Autumn 3.390±1.35cA 2.190±1.34eB 4.520±1.36bB 4.550±1.37aB <.0001 - 6
Winter 3.870±1.67cA 3.560±1.66dA 5.810±1.7bA 5.980±1.7aA <.0001 - 6
Spring 3.880±1.22cA 3.790±1.22dA 4.480±1.4bB 4.750±1.4aB <.0001 - 6
COD (mg/l)
Summer 42.5±41.2aBC 41.0±38.2bB 0±0cC 0±0cC <.0001 - 10
Autumn 39±23.4bC 48±34.5aB 13±12.2cB 2.0±1.3dC <.0001 - 10
Winter 53±48.5cB 55±51.7bA 38±31.4dA 71±60.6aA <.0001 - 10
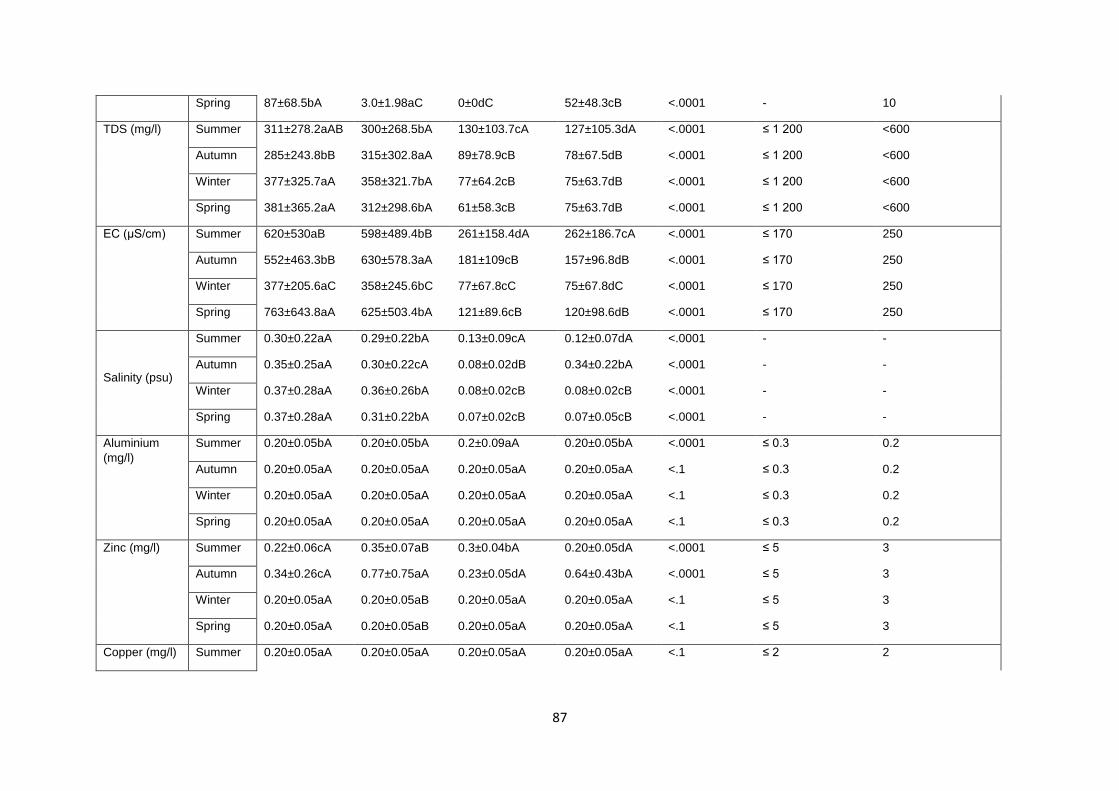
87
Spring 87±68.5bA 3.0±1.98aC 0±0dC 52±48.3cB <.0001 - 10
TDS (mg/l) Summer 311±278.2aAB 300±268.5bA 130±103.7cA 127±105.3dA <.0001 ≤ 1 200 <600
Autumn 285±243.8bB 315±302.8aA 89±78.9cB 78±67.5dB <.0001 ≤ 1 200 <600
Winter 377±325.7aA 358±321.7bA 77±64.2cB 75±63.7dB <.0001 ≤ 1 200 <600
Spring 381±365.2aA 312±298.6bA 61±58.3cB 75±63.7dB <.0001 ≤ 1 200 <600
EC (μS/cm) Summer 620±530aB 598±489.4bB 261±158.4dA 262±186.7cA <.0001 ≤ 170 250
Autumn 552±463.3bB 630±578.3aA 181±109cB 157±96.8dB <.0001 ≤ 170 250
Winter 377±205.6aC 358±245.6bC 77±67.8cC 75±67.8dC <.0001 ≤ 170 250
Spring 763±643.8aA 625±503.4bA 121±89.6cB 120±98.6dB <.0001 ≤ 170 250
Salinity (psu)
Summer 0.30±0.22aA 0.29±0.22bA 0.13±0.09cA 0.12±0.07dA <.0001 - -
Autumn 0.35±0.25aA 0.30±0.22cA 0.08±0.02dB 0.34±0.22bA <.0001 - -
Winter 0.37±0.28aA 0.36±0.26bA 0.08±0.02cB 0.08±0.02cB <.0001 - -
Spring 0.37±0.28aA 0.31±0.22bA 0.07±0.02cB 0.07±0.05cB <.0001 - -
Aluminium (mg/l)
Summer 0.20±0.05bA 0.20±0.05bA 0.2±0.09aA 0.20±0.05bA <.0001 ≤ 0.3 0.2
Autumn 0.20±0.05aA 0.20±0.05aA 0.20±0.05aA 0.20±0.05aA <.1 ≤ 0.3 0.2
Winter 0.20±0.05aA 0.20±0.05aA 0.20±0.05aA 0.20±0.05aA <.1 ≤ 0.3 0.2
Spring 0.20±0.05aA 0.20±0.05aA 0.20±0.05aA 0.20±0.05aA <.1 ≤ 0.3 0.2
Zinc (mg/l) Summer 0.22±0.06cA 0.35±0.07aB 0.3±0.04bA 0.20±0.05dA <.0001 ≤ 5 3
Autumn 0.34±0.26cA 0.77±0.75aA 0.23±0.05dA 0.64±0.43bA <.0001 ≤ 5 3
Winter 0.20±0.05aA 0.20±0.05aB 0.20±0.05aA 0.20±0.05aA <.1 ≤ 5 3
Spring 0.20±0.05aA 0.20±0.05aB 0.20±0.05aA 0.20±0.05aA <.1 ≤ 5 3
Copper (mg/l) Summer 0.20±0.05aA 0.20±0.05aA 0.20±0.05aA 0.20±0.05aA <.1 ≤ 2 2
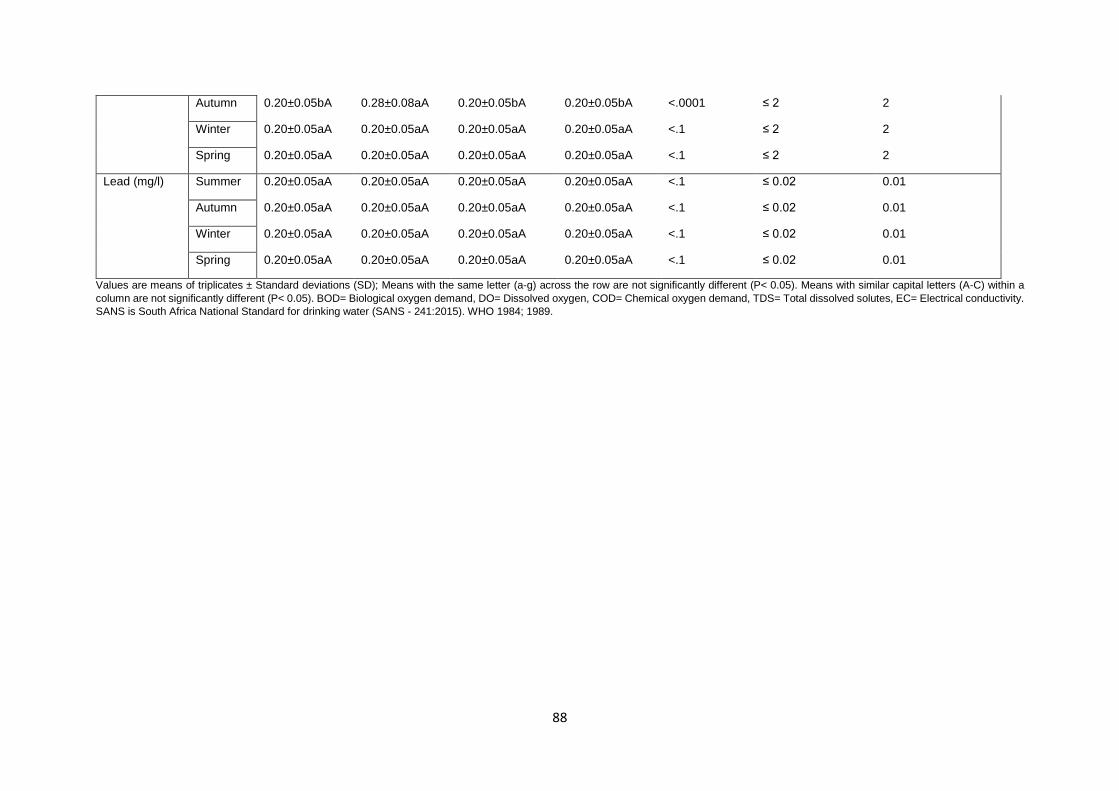
88
Autumn 0.20±0.05bA 0.28±0.08aA 0.20±0.05bA 0.20±0.05bA <.0001 ≤ 2 2
Winter 0.20±0.05aA 0.20±0.05aA 0.20±0.05aA 0.20±0.05aA <.1 ≤ 2 2
Spring 0.20±0.05aA 0.20±0.05aA 0.20±0.05aA 0.20±0.05aA <.1 ≤ 2 2
Lead (mg/l) Summer 0.20±0.05aA 0.20±0.05aA 0.20±0.05aA 0.20±0.05aA <.1 ≤ 0.02 0.01
Autumn 0.20±0.05aA 0.20±0.05aA 0.20±0.05aA 0.20±0.05aA <.1 ≤ 0.02 0.01
Winter 0.20±0.05aA 0.20±0.05aA 0.20±0.05aA 0.20±0.05aA <.1 ≤ 0.02 0.01
Spring 0.20±0.05aA 0.20±0.05aA 0.20±0.05aA 0.20±0.05aA <.1 ≤ 0.02 0.01
Values are means of triplicates ± Standard deviations (SD); Means with the same letter (a-g) across the row are not significantly different (P< 0.05). Means with similar capital letters (A-C) within a column are not significantly different (P< 0.05). BOD= Biological oxygen demand, DO= Dissolved oxygen, COD= Chemical oxygen demand, TDS= Total dissolved solutes, EC= Electrical conductivity. SANS is South Africa National Standard for drinking water (SANS - 241:2015). WHO 1984; 1989.
89
4.3.2 Physico-chemical characteristics of samples from Vaal River and Potable water A comparative study was also conducted for samples from upstream, downstream,
potable water 1and 2 to analyse the influencing abiotic factors responsible for heavy
metals concentrations. Temperature, pH, biological oxygen demand (BOD), dissolved
oxygen (DO), chemical oxygen demand (COD), total dissolved solids (TDS), salinity,
and electrical conductivity (EC) were determined and compared to the SAN-241
(2015) and WHO (1984; 1989) standards for drinking water (Table 4.7).
Similarly, temperatures for upstream, downstream, potable water 1 and 2, samples
varied significantly (p<0.05) across the seasons and ranged from 26.7 to 28.5oC during
summer, 23.1 to 24.6oC during autumn, 16.2 to 18.8oC during winter and 20.6 to
24.5oC in spring as illustrated in Table 4.7. Our results are similar to findings reported
by Sangeeta and Neha (2015) that seasonal variation affected the physico-chemical
water parameters of the Nalasopara Region in India. The highest water sample
temperature was in summer compared to winter and monsoon seasons (Sangeeta
and Neha, 2015). In another related study, Odjadjare and Okoh (2010) assessed the
physico-chemical quality of an urban municipal wastewater effluent and reported on
similar influence of seasons with respect to variations in temperature of water samples
from study sites in the Eastern Cape, South Africa. However, the measured
temperatures for the upstream, downstream, potable water 1 and 2 in this study were
found to be below the set values based on South African National Standard (SANS-
241, 2015) (except in summer) and World Health Organization Standard (WHO, 1984;
1989), 25oC and 35oC, respectively. The fluctuations in average temperature values
could be attributed to changes in the seasons.
Similar to temperature, seasonal variation significantly (p<0.05) partly affected pH
values of the Vaal River (upstream and downstream) and that of potable waters (PO1&
PO2) as shown in Table 4.7. In the Vaal River, the lowest pH values were recorded
during spring compared to other seasons (Table 4.7). In summer, significant
differences in pH values were noted among sampling sites, for example, the pH value
of potable water 2 (pH 9.2) was higher than that for upstream (pH 8.8) and similarity
in differences among sites were also shown during other seasons (Table 4.7). It is
important to note that upstream, downstream, potable water 1 and 2 were within
alkaline values. The values ranged from 8.8 to 9.2 during summer, 8.5 to 8.9 during
90
autumn, 8.5 to 8.8 during winter and 7.8 to 8.7 during spring (Table 4.7). This also
corresponded with the work done by Karen and Cornelius, (2012) where the pH values
of the Vaal River catchment areas sampled were found to be in the alkaline range (pH
7-8). The pH values for upstream and downstream, were within permissible limits of
SANS (2015) and WHO (1984; 1989) standard but potable water 1 and 2 exceeded
those limit. This could be due to the chemicals that were used during water purification
process which increased the pH value of potable water. This implied that the
purification process needs to be reviewed (Table 4.7).
The BOD values obtained for upstream, downstream, potable water samples were
found to vary significantly (p<0.05) across the- sampling points in each of the seasons.
The BOD values ranged from 0.69 to 4.24 mg/l during summer, from 0.64 to 4.89 mg/l
during autumn, 1.18 to 4.51 mg/l in winter and from 1.04 to 4.68 mg/l during spring
(Table 4.7). Overall, the BOD values range recorded in our study for upstream, and
downstream (4.060-4.680 mg/l) and there was no significant difference across the
seasons. This result was not in agreement with the work done by Sibanda et al. (2014)
where they observed the range of BOD values of the Tyume River to be between 0.78
- 2.76 mg/l and there were significant differences across seasons. This observation
could be attributed to more wastewater discharge, external pollution and land use due
to high industrialized activities taking place in the studied areas than the areas around
the Tyume River (Sibanda et al., 2014). The wide BOD range noted for the Vaal River
in this study could be attributed to increased urbanisation, population and
industrialised activities taking place in the Vaal areas compared to few industries and
less population in the rural settings along the Tyume River in the Eastern Cape
(Sibanda et al., 2014). Notably, the BOD values in our study are higher than the World
Health Organization (WHO, 1984; 1989) standard of <3 mg/l, which is an indication of
pollution in the Vaal River (both in upstream and downstream). However, the BOD
values of the potable waters were found to be lower than the WHO standard, which is
an indication that potable water distributed to the populace through the purification
plant posed no threat to human beings, although there is no SANS-241 (2015)
standard for BOD. Based on WHO (1984; 1989) standard, the purification plant is
effective in maintaining the BOD levels within the acceptable limits.
91
The DO values of upstream showed no significant (p<0.05) difference across the
seasons unlike the DO values for downstream. The DO values for upstream and
downstream were observed to be lower than the two potable waters sampled in this
study and so did not meet SANS-241(2015) and WHO (1984; 1989) standards (Table
4.7) indicating higher pollution than the potable water channels. Notably, the lower
values observed in DO of upstream indicating that there was an external source of
pollution probably due to human activities such as farming, fishing, and animal excreta.
Another plausible reason could be because of serial dilution as the river flows from
upstream to downstream in all seasons. The purification plant on the other hand is not
effective in maintaining DO using WHO (1984; 1989) standards.
Seasonal averages of COD varied significantly across the sampling points in each of
the seasons for upstream, downstream, potable waters. In summer, COD values
ranged from 0 to 42.5 mg/l, in autumn (2 to 48 mg/l), during winter (38 to 71 mg/l) and
in spring (0 to 87 mg/l) (Table 4.7). WHO (1984; 1989) standard revealed that
upstream in all seasons and downstream in all the seasons except in spring, potable
water (in winter and autumn) did not meet this international standard. Clearly, it was
evident that the Vaal River was contaminated with chemical organic matters but the
purification plant could reduce those toxic constituents in most seasons.
The TDS values for upstream, potable waters vary significantly across the seasons.
However, the TDS values for downstream showed no significant difference across
seasons. This was not in agreement with the work done by Sibanda et al. (2014) were
they observed that TDS varied significantly across seasons for all the samples from a
typical rural based river. However, their work was in agreement with the seasonal
variations obtained in this study for upstream. Vaishali and Punita (2013) assessed
the effect of seasonal variation on water quality of the River Mini and reported
significant variation in the TDS. This result was consistent with findings in this study
for the Vaal River. The highest TDS were recorded in winter season indicating an
increase in organic matter in the River Mini water during the season, which they
attributed to the increase in anthropogenic interferences of the surrounding areas
(Vaishali and Punita, 2013). This was consistent with the results obtained for
downstream in this study. An evaluation of the physico-chemical characteristics of the
Buffalo River in the Eastern Cape Province of South Africa, revealed similar effect of
season on the TDS were the values ranged from 20.3 – 23.350 mg/l across sites
92
(Chigor et al. 2013). TDS for upstream and downstream were below the limits for
SANS (2015) (1200 mg/l) and WHO (1984; 1989) limit of 600 mg/l. Furthermore, the
potable waters were also found to meet both standards indicating the effectiveness of
the purification plant.
The EC values for downstream, upstream and potable waters (1 and 2) ranged from
261 to 620 μS/cm in summer, 157 to 630 μS/cm in autumn, 75 to 377 μS/cm in winter
and 120 to 763 μS/cm in springs, respectively as illustrated in Table 4.7. These values
are higher compared to those reported by Jordaan and Bezuidenhout (2013) for the
Vaal River in 2012 (17.91 to 78 μS/cm). This implied that the rate of pollution has
increased over the years as a result of technological advancement due to the release
of pollutants capable of increasing the electrical conductivity of waterbodies.
Furthermore, the EC of the Buffalo River in the Eastern Cape Province of South Africa
showed higher EC values compared to our study (42.3–46,693 μS/cm) (Chigor et al.,
2013). This implied that the location activities influence the level of EC and possibly
other physico-chemical parameters as a result of pollution. Hence, it is important to
monitor the quality of water sources on a regular basis as the values obtained in this
study did not meet the SANS (2015) limit of ≤ 170 μS/cm and WHO (1984; 1989) limit
of 250 μS/cm during the sampling period indicating pollution of the Vaal River.
The salinity of downstream, upstream and potable waters (1 and 2) were equally
determined as shown in Table 4.7. Seasonal variation did not significantly affect the
salinity of samples from the Vaal River; however, it affected the salinity of potable
waters. For instance, the highest salinity in potable water (0.34 psu) was recorded in
autumn compared to the lowest in spring (0.07 psu). The impacts of excess
salinisation on water resources include decrease crop yield, increased formation of
scale in aquatic organisms and increased requirements for pre-treatment of water for
selected industrial use such as boiler feed water (DEAT, 2000). There was no
stipulated standard for salinity and as a result, it is difficult to ascertain the
effectiveness of the purification plant.
In summary, most of the water quality parameters of upstream and downstream did
not meet the SANS (2015) and WHO (1984; 1989) standards indicating partly the
influence of the final effluents discharged by the Leeuwkuil Wastewater Treatment
Plant and possibly, other external source is responsible for the pollution. However, the
93
purification plant was found to be effective in maintaining the values of Cu, Zn, Al,
temperature, BOD, COD, and TDS although more review needs to be done in the plant
to ensure that the plant is capable of maintaining all the water qualities within the
stipulated limits.
4.3.3 Correlation coefficient of heavy metals and physico-chemical parameters of samples from Vaal River and Potable water A correlation analysis was used to evaluate the degree of interrelation and association
between two or more variables of the Vaal River and potable water treatment process.
Strong positive correlations (0.8-1) at significant level of p< 0.05 were observed
between BOD, COD, TDS, EC and salinity during the summer season. For example,
it was evident that there were stronger correlations between some heavy metals (Al
and Cu, Al and Pb, Cu and Pb) with a correlation coefficient of 1 (Table 4.8 and Figure
4.5). Regression analysis demonstrated strong associations between some
parameters that will help predict water quality indices.
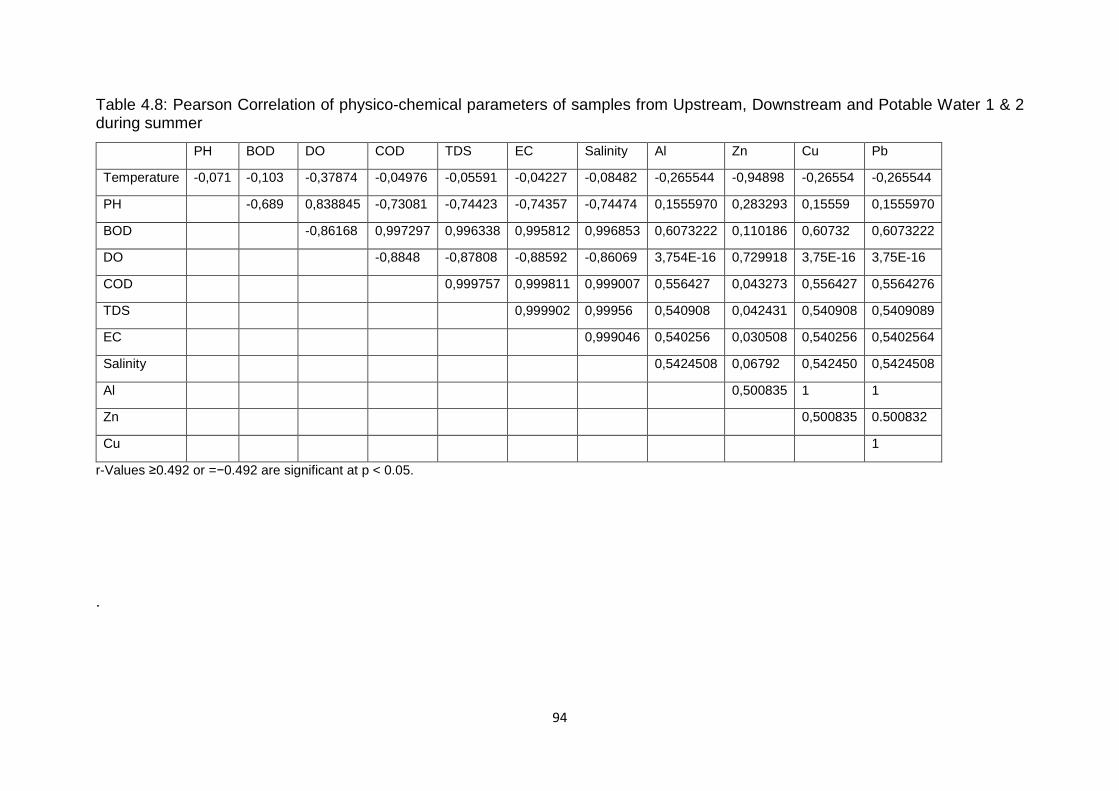
94
Table 4.8: Pearson Correlation of physico-chemical parameters of samples from Upstream, Downstream and Potable Water 1 & 2 during summer
PH BOD DO COD TDS EC Salinity Al Zn Cu Pb
Temperature -0,071 -0,103 -0,37874 -0,04976 -0,05591 -0,04227 -0,08482 -0,265544 -0,94898 -0,26554 -0,265544
PH
-0,689 0,838845 -0,73081 -0,74423 -0,74357 -0,74474 0,1555970 0,283293 0,15559 0,1555970
BOD
-0,86168 0,997297 0,996338 0,995812 0,996853 0,6073222 0,110186 0,60732 0,6073222
DO
-0,8848 -0,87808 -0,88592 -0,86069 3,754E-16 0,729918 3,75E-16 3,75E-16
COD
0,999757 0,999811 0,999007 0,556427 0,043273 0,556427 0,5564276
TDS
0,999902 0,99956 0,540908 0,042431 0,540908 0,5409089
EC
0,999046 0,540256 0,030508 0,540256 0,5402564
Salinity
0,5424508 0,06792 0,542450 0,5424508
Al
0,500835 1 1
Zn
0,500835 0.500832
Cu
1
r-Values ≥0.492 or =−0.492 are significant at p < 0.05.
.
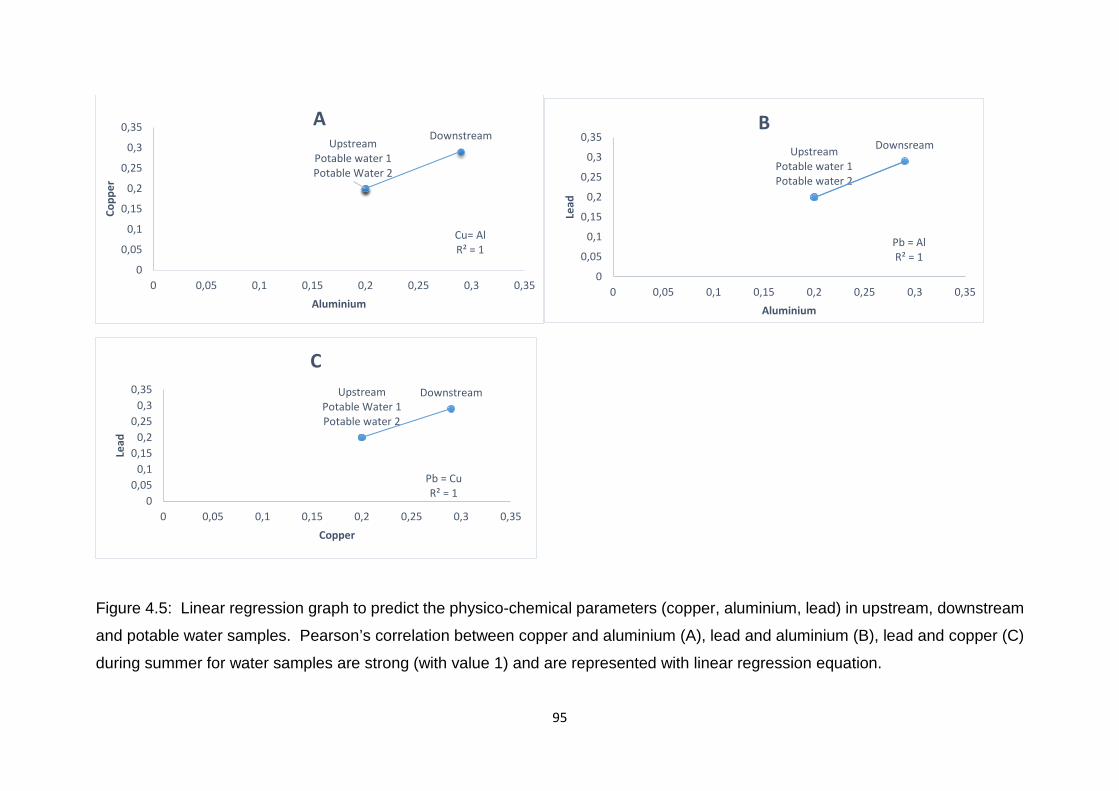
95
Figure 4.5: Linear regression graph to predict the physico-chemical parameters (copper, aluminium, lead) in upstream, downstream
and potable water samples. Pearson’s correlation between copper and aluminium (A), lead and aluminium (B), lead and copper (C)
during summer for water samples are strong (with value 1) and are represented with linear regression equation.
DownstreamUpstream
Potable water 1Potable Water 2
Cu= AlR² = 1
0
0,05
0,1
0,15
0,2
0,25
0,3
0,35
0 0,05 0,1 0,15 0,2 0,25 0,3 0,35
Copp
er
Aluminium
AUpstream
Potable water 1Potable water 2
Downsream
Pb = AlR² = 1
0
0,05
0,1
0,15
0,2
0,25
0,3
0,35
0 0,05 0,1 0,15 0,2 0,25 0,3 0,35
Lead
Aluminium
B
UpstreamPotable Water 1Potable water 2
Downstream
Pb = CuR² = 1
00,05
0,10,15
0,20,25
0,30,35
0 0,05 0,1 0,15 0,2 0,25 0,3 0,35
Lead
Copper
C
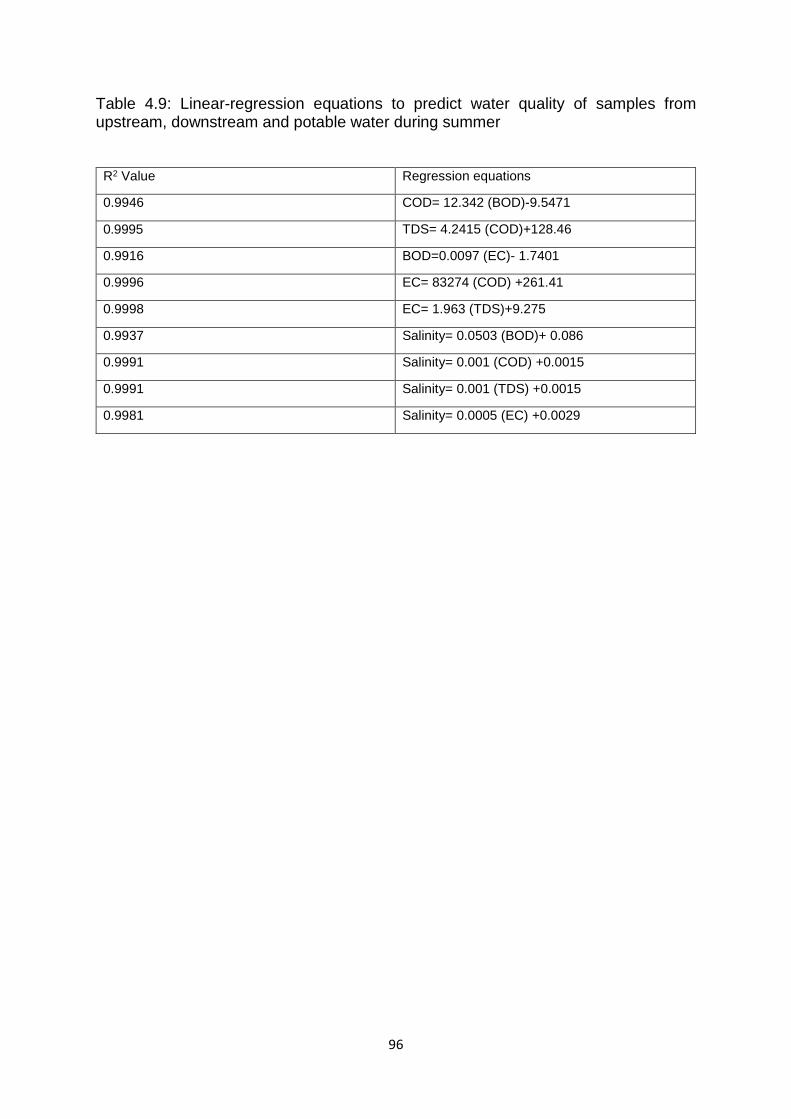
96
Table 4.9: Linear-regression equations to predict water quality of samples from upstream, downstream and potable water during summer
R2 Value Regression equations
0.9946 COD= 12.342 (BOD)-9.5471
0.9995 TDS= 4.2415 (COD)+128.46
0.9916 BOD=0.0097 (EC)- 1.7401
0.9996 EC= 83274 (COD) +261.41
0.9998 EC= 1.963 (TDS)+9.275
0.9937 Salinity= 0.0503 (BOD)+ 0.086
0.9991 Salinity= 0.001 (COD) +0.0015
0.9991 Salinity= 0.001 (TDS) +0.0015
0.9981 Salinity= 0.0005 (EC) +0.0029
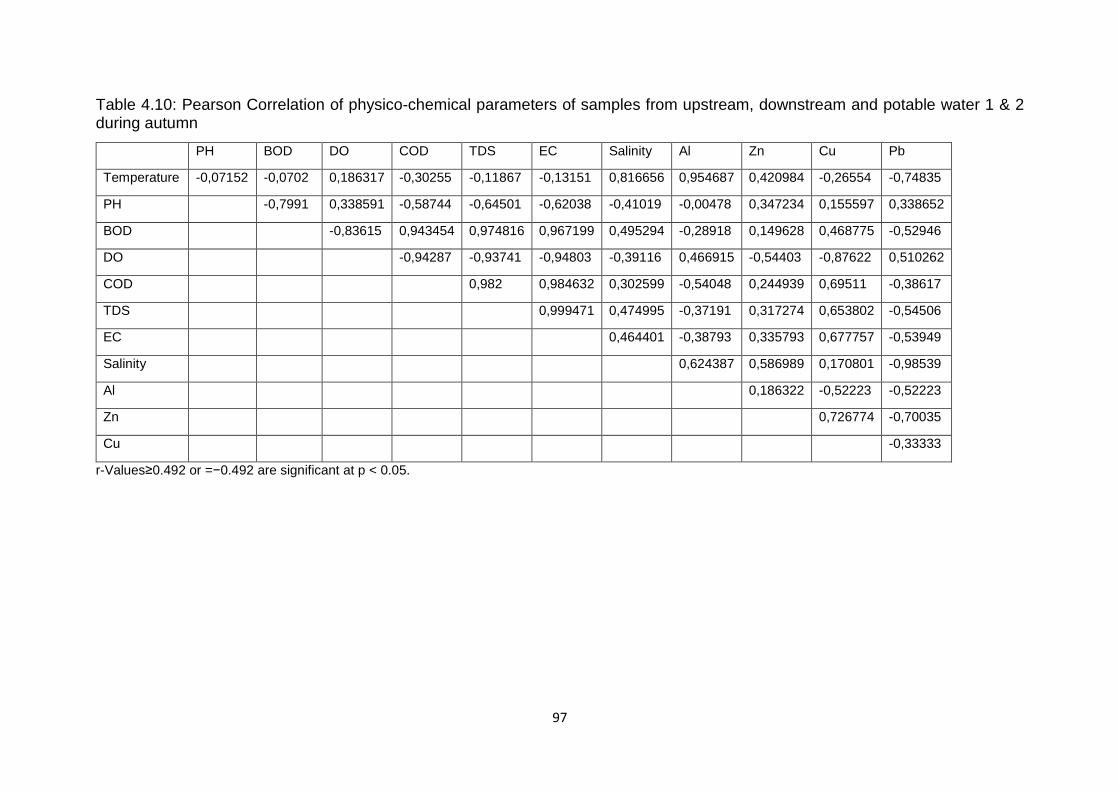
97
Table 4.10: Pearson Correlation of physico-chemical parameters of samples from upstream, downstream and potable water 1 & 2 during autumn
PH BOD DO COD TDS EC Salinity Al Zn Cu Pb
Temperature -0,07152 -0,0702 0,186317 -0,30255 -0,11867 -0,13151 0,816656 0,954687 0,420984 -0,26554 -0,74835
PH
-0,7991 0,338591 -0,58744 -0,64501 -0,62038 -0,41019 -0,00478 0,347234 0,155597 0,338652
BOD
-0,83615 0,943454 0,974816 0,967199 0,495294 -0,28918 0,149628 0,468775 -0,52946
DO
-0,94287 -0,93741 -0,94803 -0,39116 0,466915 -0,54403 -0,87622 0,510262
COD
0,982 0,984632 0,302599 -0,54048 0,244939 0,69511 -0,38617
TDS
0,999471 0,474995 -0,37191 0,317274 0,653802 -0,54506
EC
0,464401 -0,38793 0,335793 0,677757 -0,53949
Salinity
0,624387 0,586989 0,170801 -0,98539
Al
0,186322 -0,52223 -0,52223
Zn
0,726774 -0,70035
Cu
-0,33333
r-Values≥0.492 or =−0.492 are significant at p < 0.05.
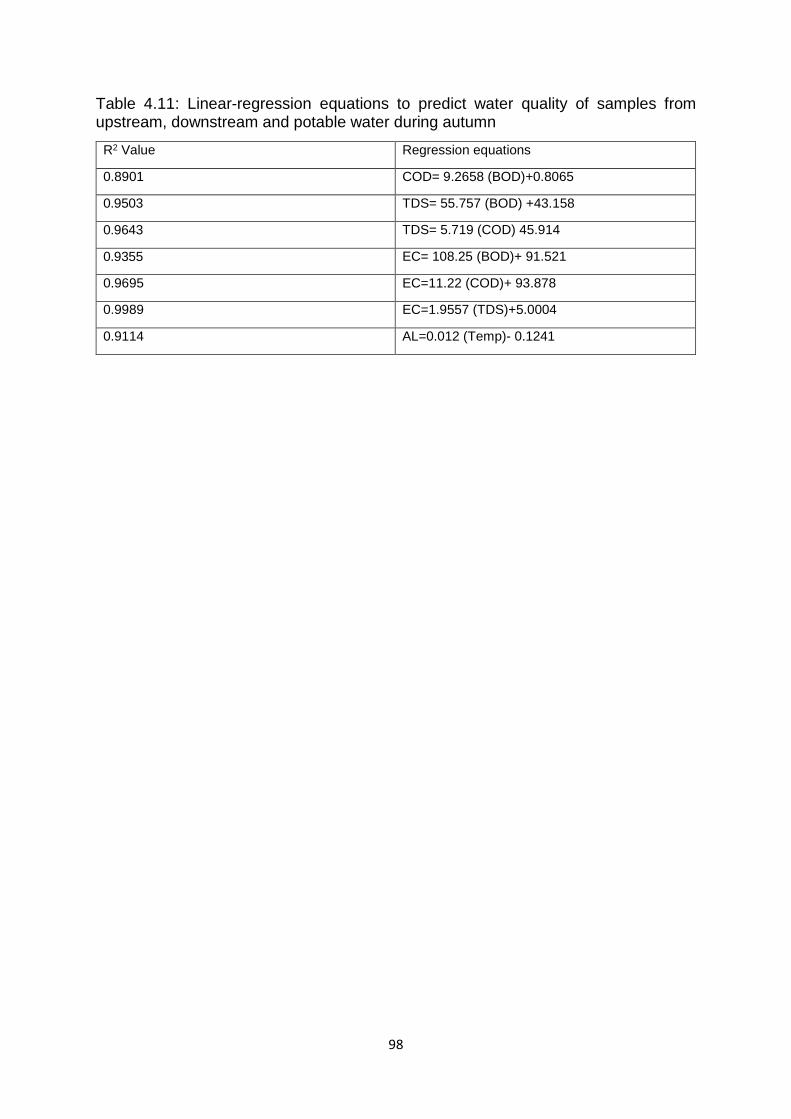
98
Table 4.11: Linear-regression equations to predict water quality of samples from upstream, downstream and potable water during autumn
R2 Value Regression equations
0.8901 COD= 9.2658 (BOD)+0.8065
0.9503 TDS= 55.757 (BOD) +43.158
0.9643 TDS= 5.719 (COD) 45.914
0.9355 EC= 108.25 (BOD)+ 91.521
0.9695 EC=11.22 (COD)+ 93.878
0.9989 EC=1.9557 (TDS)+5.0004
0.9114 AL=0.012 (Temp)- 0.1241
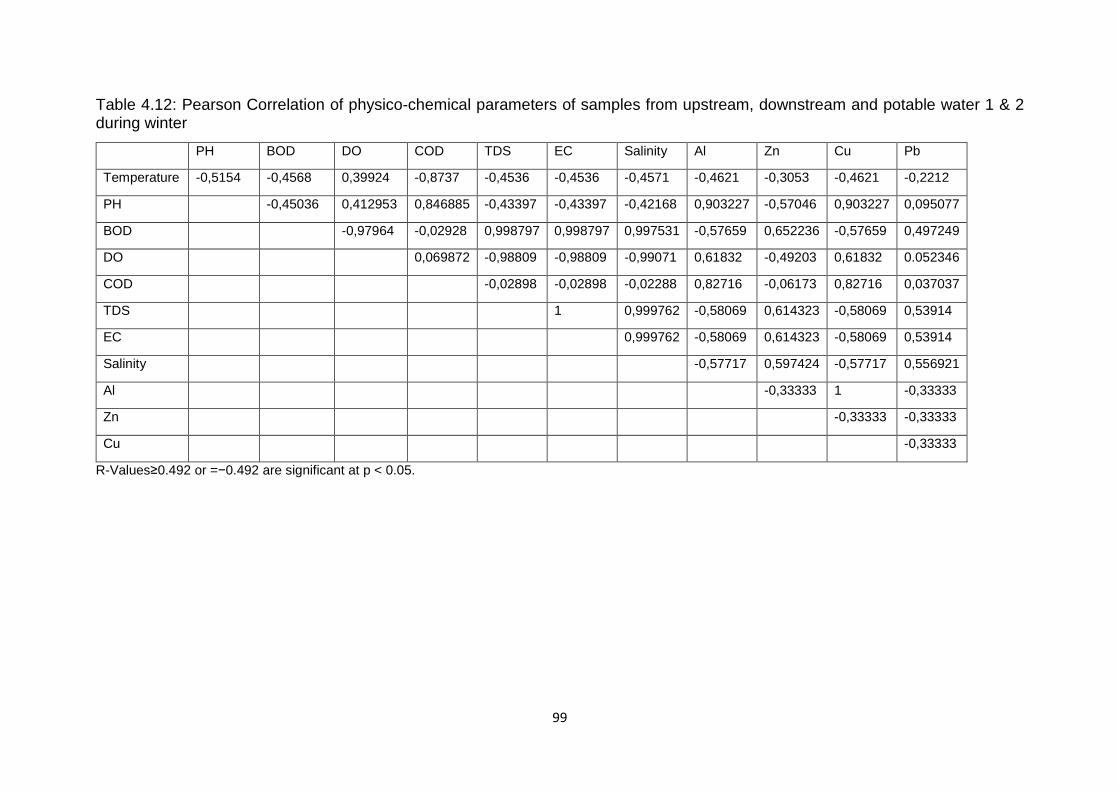
99
Table 4.12: Pearson Correlation of physico-chemical parameters of samples from upstream, downstream and potable water 1 & 2 during winter
PH BOD DO COD TDS EC Salinity Al Zn Cu Pb
Temperature -0,5154 -0,4568 0,39924 -0,8737 -0,4536 -0,4536 -0,4571 -0,4621 -0,3053 -0,4621 -0,2212
PH
-0,45036 0,412953 0,846885 -0,43397 -0,43397 -0,42168 0,903227 -0,57046 0,903227 0,095077
BOD
-0,97964 -0,02928 0,998797 0,998797 0,997531 -0,57659 0,652236 -0,57659 0,497249
DO
0,069872 -0,98809 -0,98809 -0,99071 0,61832 -0,49203 0,61832 0.052346
COD
-0,02898 -0,02898 -0,02288 0,82716 -0,06173 0,82716 0,037037
TDS
1 0,999762 -0,58069 0,614323 -0,58069 0,53914
EC
0,999762 -0,58069 0,614323 -0,58069 0,53914
Salinity
-0,57717 0,597424 -0,57717 0,556921
Al
-0,33333 1 -0,33333
Zn
-0,33333 -0,33333
Cu
-0,33333
R-Values≥0.492 or =−0.492 are significant at p < 0.05.
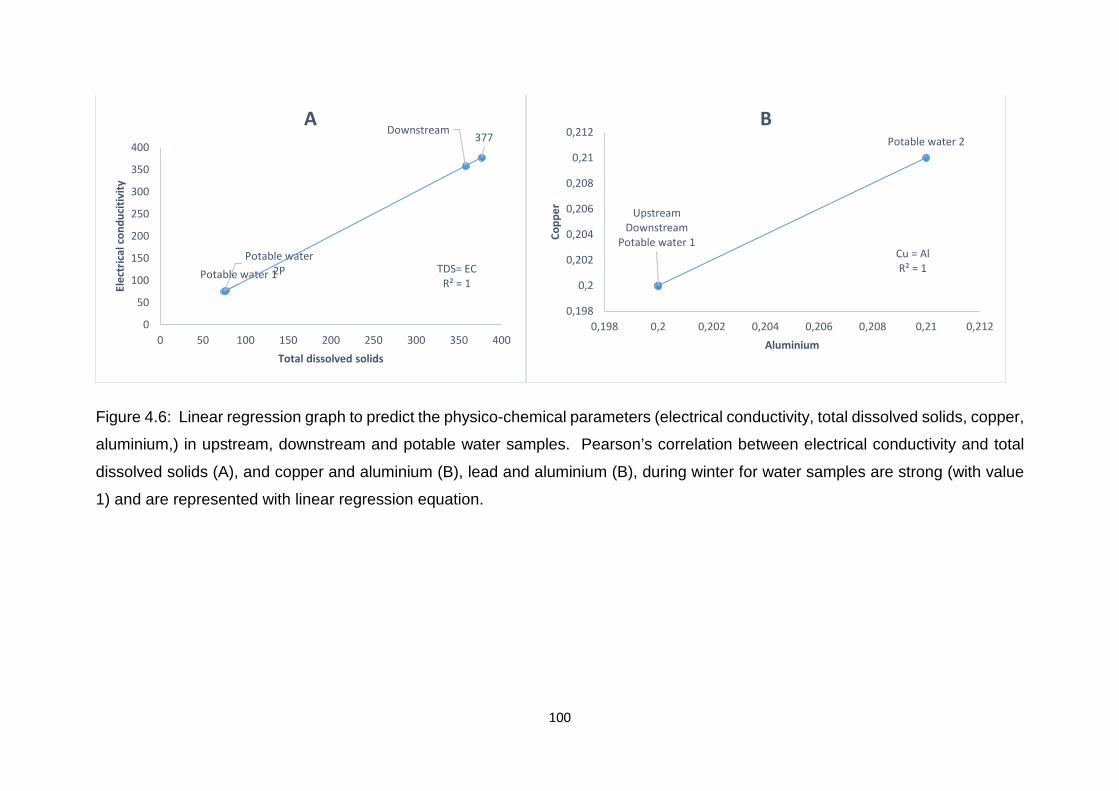
100
Figure 4.6: Linear regression graph to predict the physico-chemical parameters (electrical conductivity, total dissolved solids, copper,
aluminium,) in upstream, downstream and potable water samples. Pearson’s correlation between electrical conductivity and total
dissolved solids (A), and copper and aluminium (B), lead and aluminium (B), during winter for water samples are strong (with value
1) and are represented with linear regression equation.
377Downstream
Potable water 1Potable water
2P TDS= ECR² = 1
0
50
100
150
200
250
300
350
400
0 50 100 150 200 250 300 350 400
Elec
tric
al c
ondu
citiv
ity
Total dissolved solids
A
UpstreamDownstream
Potable water 1
Potable water 2
Cu = AlR² = 1
0,198
0,2
0,202
0,204
0,206
0,208
0,21
0,212
0,198 0,2 0,202 0,204 0,206 0,208 0,21 0,212
Copp
er
Aluminium
B
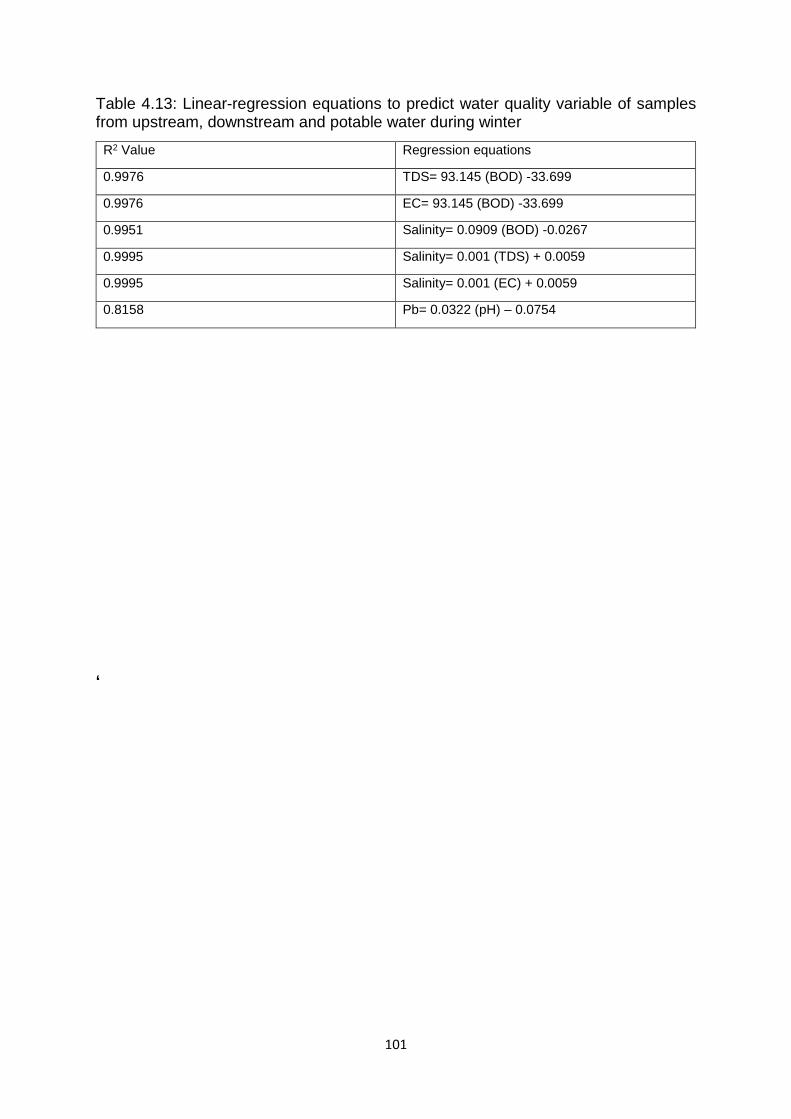
101
Table 4.13: Linear-regression equations to predict water quality variable of samples from upstream, downstream and potable water during winter
‘
R2 Value Regression equations
0.9976 TDS= 93.145 (BOD) -33.699
0.9976 EC= 93.145 (BOD) -33.699
0.9951 Salinity= 0.0909 (BOD) -0.0267
0.9995 Salinity= 0.001 (TDS) + 0.0059
0.9995 Salinity= 0.001 (EC) + 0.0059
0.8158 Pb= 0.0322 (pH) – 0.0754
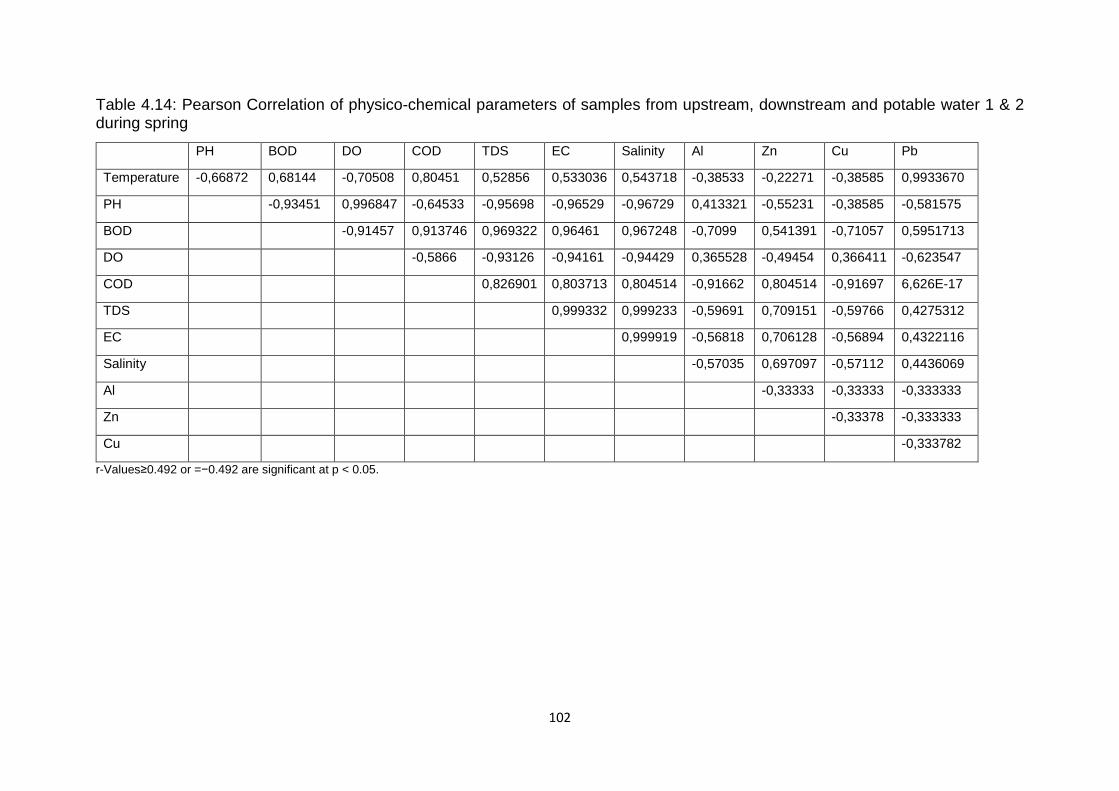
102
Table 4.14: Pearson Correlation of physico-chemical parameters of samples from upstream, downstream and potable water 1 & 2 during spring
PH BOD DO COD TDS EC Salinity Al Zn Cu Pb
Temperature -0,66872 0,68144 -0,70508 0,80451 0,52856 0,533036 0,543718 -0,38533 -0,22271 -0,38585 0,9933670
PH
-0,93451 0,996847 -0,64533 -0,95698 -0,96529 -0,96729 0,413321 -0,55231 -0,38585 -0,581575
BOD
-0,91457 0,913746 0,969322 0,96461 0,967248 -0,7099 0,541391 -0,71057 0,5951713
DO
-0,5866 -0,93126 -0,94161 -0,94429 0,365528 -0,49454 0,366411 -0,623547
COD
0,826901 0,803713 0,804514 -0,91662 0,804514 -0,91697 6,626E-17
TDS
0,999332 0,999233 -0,59691 0,709151 -0,59766 0,4275312
EC
0,999919 -0,56818 0,706128 -0,56894 0,4322116
Salinity
-0,57035 0,697097 -0,57112 0,4436069
Al
-0,33333 -0,33333 -0,333333
Zn
-0,33378 -0,333333
Cu
-0,333782
r-Values≥0.492 or =−0.492 are significant at p < 0.05.
103
As shown in Table 4.9, it was evident that during the summer season, the association
between the COD and BOD (r2= 0.9946); TDS and COD (r= 0.9995); EC and TDS (r2=
0.9998); Salinity and BOD; Salinity and COD (r2 = 0.9991), were very strong (Table
4.9). Similarly, in autumn, strong correlations were revealed between certain phyico-
chemical parameters at significant level of p< 0.05. For example, the concentration of
BOD correlated strongly and positively (with correlation coefficients >0.9) with COD,
TDS and EC (Table 4.10). Similarly, COD correlated strongly with TDS and EC,
however, the strongest correlation among heavy metals was between Zn and Cu (0.7)
(Table 4.10). Linear regression analysis revealed an r2 value of 0.9989; 0.9695,
0.9114, 0.9643, 1.0, 1.0 and 1.0 for the associations between EC and TDS; EC and
COD; Al and Temp; TDS and COD, Pb and Al, Cu and Pb, Cu and Al respectively
(Table 4.11). In our study, the higher correlation coefficients noted between heavy
metals would imply same origin of the metals identified (Verandani and Vardhan,
2012).
Similar to autumn, strong positive correlations existed between certain phyico-
chemical parameters during winter at a significant level of p< 0.05. For example, BOD
correlated strongly with TDS (0.99), EC (0.99) and salinity (0.99) and between EC and
TDS (1), TDS and salinity (0.99), EC and salinity (0.99). Similarly, pH correlated
strongly with COD (0.85), and Al correlated well with Cu with a coefficient value of 1
(Table 4.12 and Figure 4.6). Nevertheless, interrelation and association between
variables during winter season revealed that Pb, Zn and Cu had a moderate
correlation with the other water parameters when compared to Al that had strong
correlation with Cu (Table 4.12). Furthermore, linear regression analysis revealed the
following r2 values for the following parameters; salinity and BOD (r2= 0.9951); salinity
and TDS (r2= 0.9995); salinity and EC (r2= 0.9995) (Table 4.13).
Taken together, the interrelationship and associations between some physico-
chemical parameters of the effluents from wastewater treatment, Vaal River and
potable treatment process showed correlation coefficient values and linear regression
equations similar to findings reported by other authors (Akbar et al., 2010; Vaishali
and Punita, 2013; Sangeeta and Neha, 2015). This could imply that the industrial
effluents influenced the Leeuwkuil Wastewater Treatment Plant which in turn
influenced Vaal River and the purification plant.
104
4.4. Identification of Microbial Presence and their Resistance to Heavy Metals
4.4.1 Microbiological characterisation The physico-chemical parameters of the water identified can reveal particular
conditions for the ecology of aquatic organisms and possibly suggest suitable
management strategies for maintaining the quality of water (Abdel-Raouf et al., 2012;
Mbalassa et al., 2014). The municipal treatment plants is aimed at removing or
reducing organic wastes in order to avoid a decrease in dissolved oxygen in the
receiving watershed, eliminating contaminants in order to avoid excessive richness of
nutrients, and protect human health by deactivating microorganisms capable of
causing disease (Dixit et al., 2015; Akpor and Muchie, 2010). Based on these, it
became necessary to assess the microbial compositions of waste obtained from the
industries, Leeuwkuil Wastewater Treatment Plant (inflow and final effluent) and
purification plant (potable water 1 and 2). Identification of harmful microorganisms in
potable water 1 and 2 in this study could pose a serious health concern to the people
living around Vaal area.
4.4.1.1 Culture morphology In this study, a total of seventy pure strains of bacteria were isolated from the sampling
points. Observations of the pure cultures in petri plates revealed morphological
variations in terms of the colony form, texture, opacity, elevation and colour. Colonies
with similar morphological characteristics were grouped together and selected for the
screening process.
4.4.1.2 Screening for resistant microbial isolates towards high heavy metal concentration In this study, heavy metal screening tests were carried out for all 70 isolates obtained
by exposing the isolates to increasing concentrations of four metals (Al, Cu, Pb and
Zn). The results showed that 22 isolates were resistant (+) to a factor of 10 increased
concentrations of Al, Cu, Pb, and Zn (Table 4.15). Among the 22 isolates, 90% (20)
showed resistance to Cu and Pb, whilst 86% (19) were resistant to Al and 82% (18) to
Zn (Table 4.15).
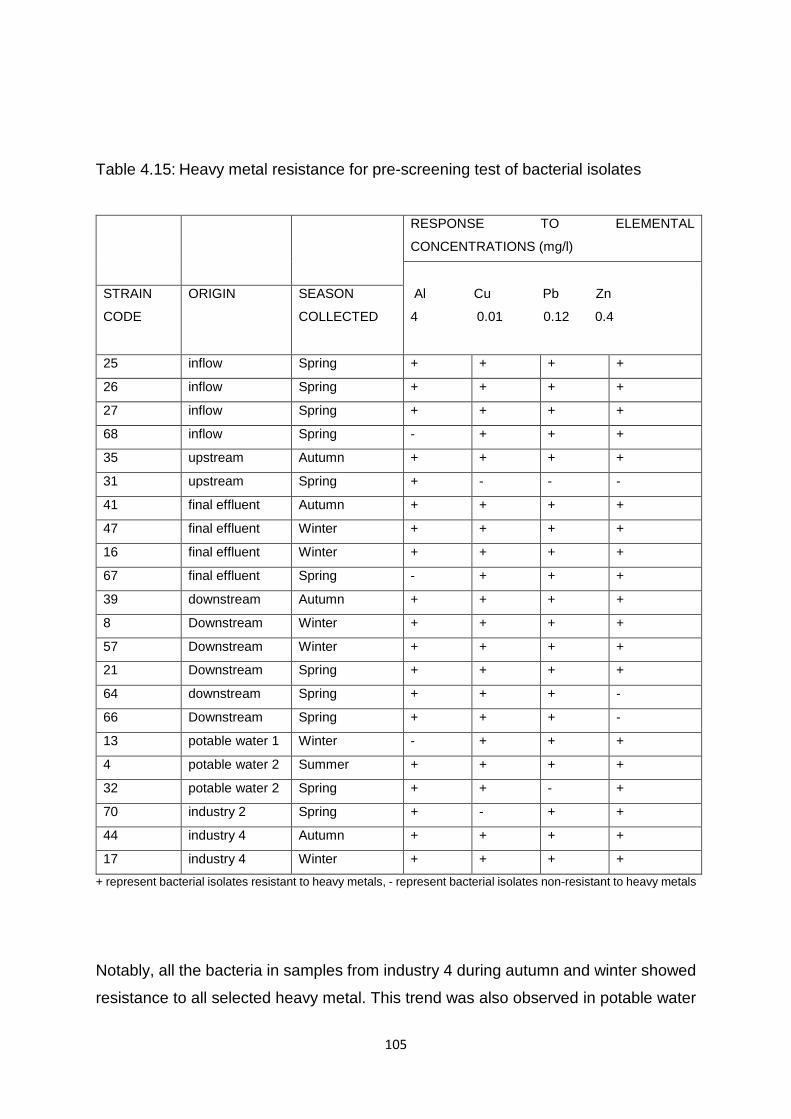
105
Table 4.15: Heavy metal resistance for pre-screening test of bacterial isolates
RESPONSE TO ELEMENTAL
CONCENTRATIONS (mg/l)
STRAIN CODE
ORIGIN SEASON COLLECTED
Al Cu Pb Zn
4 0.01 0.12 0.4
25 inflow Spring + + + +
26 inflow Spring + + + +
27 inflow Spring + + + +
68 inflow Spring - + + +
35 upstream Autumn + + + +
31 upstream Spring + - - -
41 final effluent Autumn + + + +
47 final effluent Winter + + + +
16 final effluent Winter + + + +
67 final effluent Spring - + + +
39 downstream Autumn + + + +
8 Downstream Winter + + + +
57 Downstream Winter + + + +
21 Downstream Spring + + + +
64 downstream Spring + + + -
66 Downstream Spring + + + -
13 potable water 1 Winter - + + +
4 potable water 2 Summer + + + +
32 potable water 2 Spring + + - +
70 industry 2 Spring + - + +
44 industry 4 Autumn + + + +
17 industry 4 Winter + + + + + represent bacterial isolates resistant to heavy metals, - represent bacterial isolates non-resistant to heavy metals
Notably, all the bacteria in samples from industry 4 during autumn and winter showed
resistance to all selected heavy metal. This trend was also observed in potable water
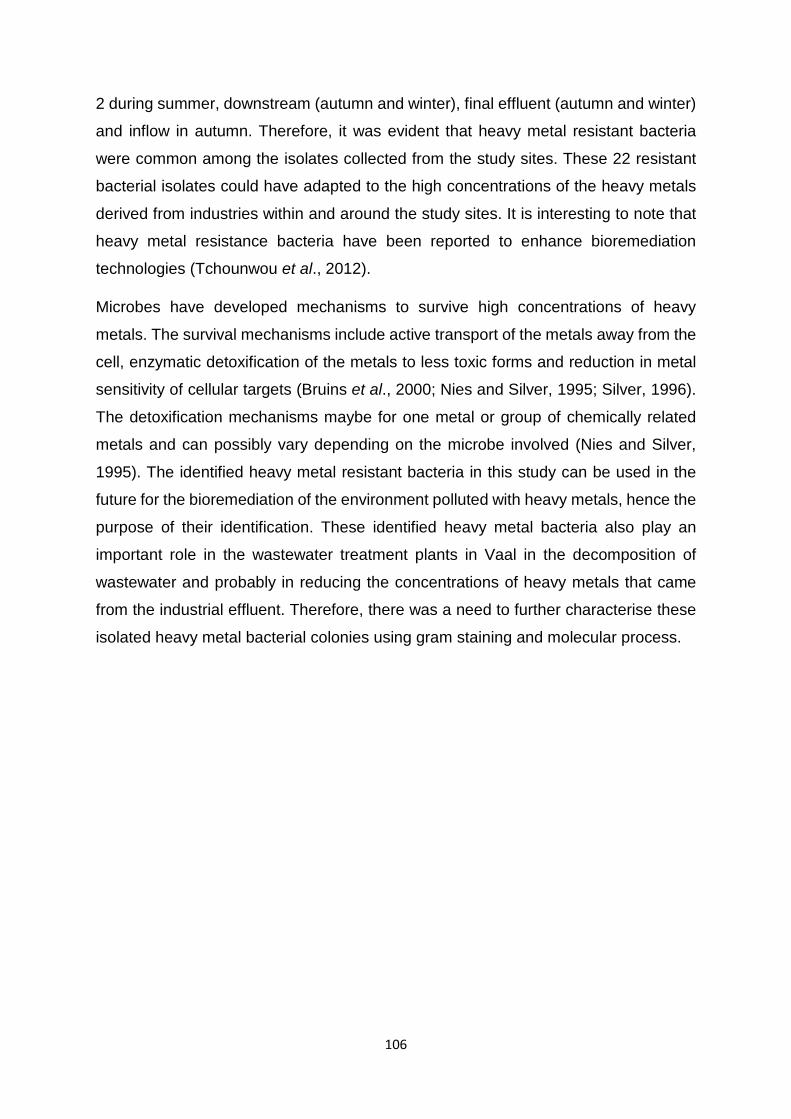
106
2 during summer, downstream (autumn and winter), final effluent (autumn and winter)
and inflow in autumn. Therefore, it was evident that heavy metal resistant bacteria
were common among the isolates collected from the study sites. These 22 resistant
bacterial isolates could have adapted to the high concentrations of the heavy metals
derived from industries within and around the study sites. It is interesting to note that
heavy metal resistance bacteria have been reported to enhance bioremediation
technologies (Tchounwou et al., 2012).
Microbes have developed mechanisms to survive high concentrations of heavy
metals. The survival mechanisms include active transport of the metals away from the
cell, enzymatic detoxification of the metals to less toxic forms and reduction in metal
sensitivity of cellular targets (Bruins et al., 2000; Nies and Silver, 1995; Silver, 1996).
The detoxification mechanisms maybe for one metal or group of chemically related
metals and can possibly vary depending on the microbe involved (Nies and Silver,
1995). The identified heavy metal resistant bacteria in this study can be used in the
future for the bioremediation of the environment polluted with heavy metals, hence the
purpose of their identification. These identified heavy metal bacteria also play an
important role in the wastewater treatment plants in Vaal in the decomposition of
wastewater and probably in reducing the concentrations of heavy metals that came
from the industrial effluent. Therefore, there was a need to further characterise these
isolated heavy metal bacterial colonies using gram staining and molecular process.
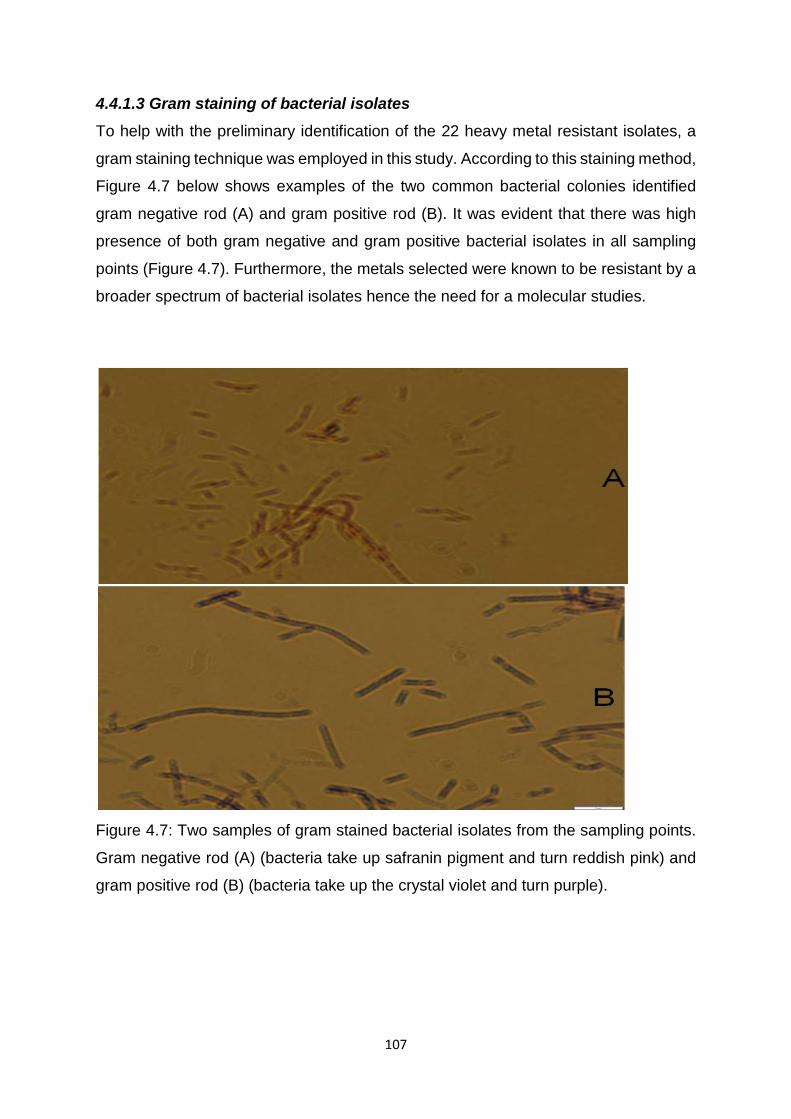
107
4.4.1.3 Gram staining of bacterial isolates To help with the preliminary identification of the 22 heavy metal resistant isolates, a
gram staining technique was employed in this study. According to this staining method,
Figure 4.7 below shows examples of the two common bacterial colonies identified
gram negative rod (A) and gram positive rod (B). It was evident that there was high
presence of both gram negative and gram positive bacterial isolates in all sampling
points (Figure 4.7). Furthermore, the metals selected were known to be resistant by a
broader spectrum of bacterial isolates hence the need for a molecular studies.
Figure 4.7: Two samples of gram stained bacterial isolates from the sampling points.
Gram negative rod (A) (bacteria take up safranin pigment and turn reddish pink) and
gram positive rod (B) (bacteria take up the crystal violet and turn purple).
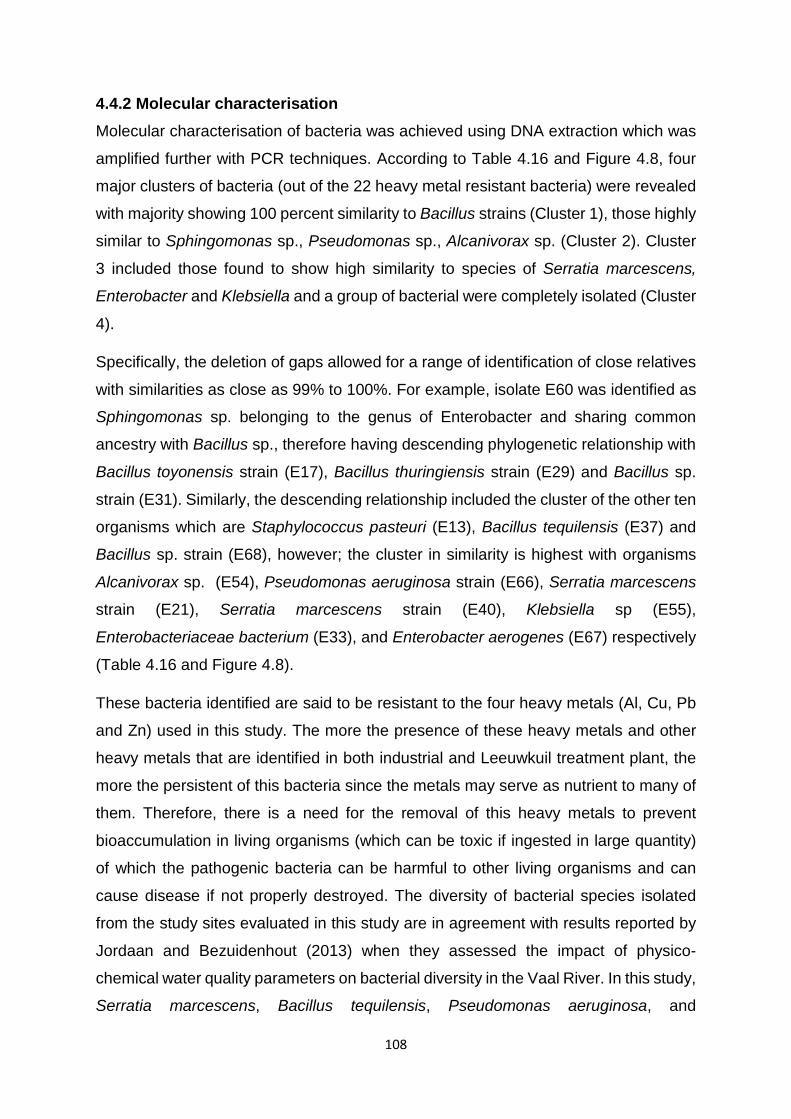
108
4.4.2 Molecular characterisation Molecular characterisation of bacteria was achieved using DNA extraction which was
amplified further with PCR techniques. According to Table 4.16 and Figure 4.8, four
major clusters of bacteria (out of the 22 heavy metal resistant bacteria) were revealed
with majority showing 100 percent similarity to Bacillus strains (Cluster 1), those highly
similar to Sphingomonas sp., Pseudomonas sp., Alcanivorax sp. (Cluster 2). Cluster
3 included those found to show high similarity to species of Serratia marcescens,
Enterobacter and Klebsiella and a group of bacterial were completely isolated (Cluster
4).
Specifically, the deletion of gaps allowed for a range of identification of close relatives
with similarities as close as 99% to 100%. For example, isolate E60 was identified as
Sphingomonas sp. belonging to the genus of Enterobacter and sharing common
ancestry with Bacillus sp., therefore having descending phylogenetic relationship with
Bacillus toyonensis strain (E17), Bacillus thuringiensis strain (E29) and Bacillus sp.
strain (E31). Similarly, the descending relationship included the cluster of the other ten
organisms which are Staphylococcus pasteuri (E13), Bacillus tequilensis (E37) and
Bacillus sp. strain (E68), however; the cluster in similarity is highest with organisms
Alcanivorax sp. (E54), Pseudomonas aeruginosa strain (E66), Serratia marcescens
strain (E21), Serratia marcescens strain (E40), Klebsiella sp (E55),
Enterobacteriaceae bacterium (E33), and Enterobacter aerogenes (E67) respectively
(Table 4.16 and Figure 4.8).
These bacteria identified are said to be resistant to the four heavy metals (Al, Cu, Pb
and Zn) used in this study. The more the presence of these heavy metals and other
heavy metals that are identified in both industrial and Leeuwkuil treatment plant, the
more the persistent of this bacteria since the metals may serve as nutrient to many of
them. Therefore, there is a need for the removal of this heavy metals to prevent
bioaccumulation in living organisms (which can be toxic if ingested in large quantity)
of which the pathogenic bacteria can be harmful to other living organisms and can
cause disease if not properly destroyed. The diversity of bacterial species isolated
from the study sites evaluated in this study are in agreement with results reported by
Jordaan and Bezuidenhout (2013) when they assessed the impact of physico-
chemical water quality parameters on bacterial diversity in the Vaal River. In this study,
Serratia marcescens, Bacillus tequilensis, Pseudomonas aeruginosa, and
109
Sphingomonas spp were found in the upstream and downstream of Vaal River which
is similar to the bacteria species found in Vaal River by Jordaan and Bezuidenhout
(2013). Serratia marcescens is pathogenic because of its involvement in opportunistic
infection in human especially in the urinary tract, respiratory tract, wound and the eye
(Auwaerter, 2007). Pseudomonas aeruginosa is also an opportunistic bacterium in
humans because it is capable of causing disease in an immune-compromised person
(Hall et al., 2004). The presence of these pathogenic bacteria in the Vaal River poses
threat to the life of people living around the area and making use of the water from the
river for their day to day activities. Sphingomonas spp is also found useful despites
the role it plays in human diseases (Ryan and Adley, 2010). They have degradable
ability and can be applied in bioremediation of environmental contaminants (Yabuuchi
and Kosako, 2015). Staphylococcus pasteuri is a coagulase-negative, Gram positive
organism which is emerging as an agent of nosocomial infections and a blood
derivatives contaminant, though its role in causing human disease mostly remains
controversial (Savini et al., 2009). This organism was discovered to be resistant to
several classes of antibiotics such as methicillin/oxacillin, macrolides, lincosamides,
streptogramins, tetracyclines, chloramphenicol, streptomycin, fosfomycin, as well as
quaternary ammonium compounds. In this study, the organism was found in the
potable water. This showed the inability of the purification plant to eradicate these
pathogenic bacteria and as a result, could cause a lot of health hazard to the people
in Vaal River.
Serratia marcescens, Bacillus thuringiensis, and Alcanivorax spp are found in the final
effluent. The presence of Serratia marcescens in final effluent and upstream and
downstream indicated the movement of the bacterium from the final effluent into the
Vaal River. This implied that Leeuwkuil Wastewater Treatment Plant was not effective
in controlling the microbial composition of the waste. Bacillus thuringiensis is known
to be a biological pesticide and in this study, it was found to be resistant to heavy
metals. This implied that the bacterium could have the tendency to bioremediate
environmental contaminants. Alcanivorax spp play some roles in biotechnology where
they are used to breakdown oil especially, the hydrocarbons (Yakimov et al., 1998). In
this study, the bacterium was found to be resistant to heavy metals. This implies that
the organism could be used in bioremediation.
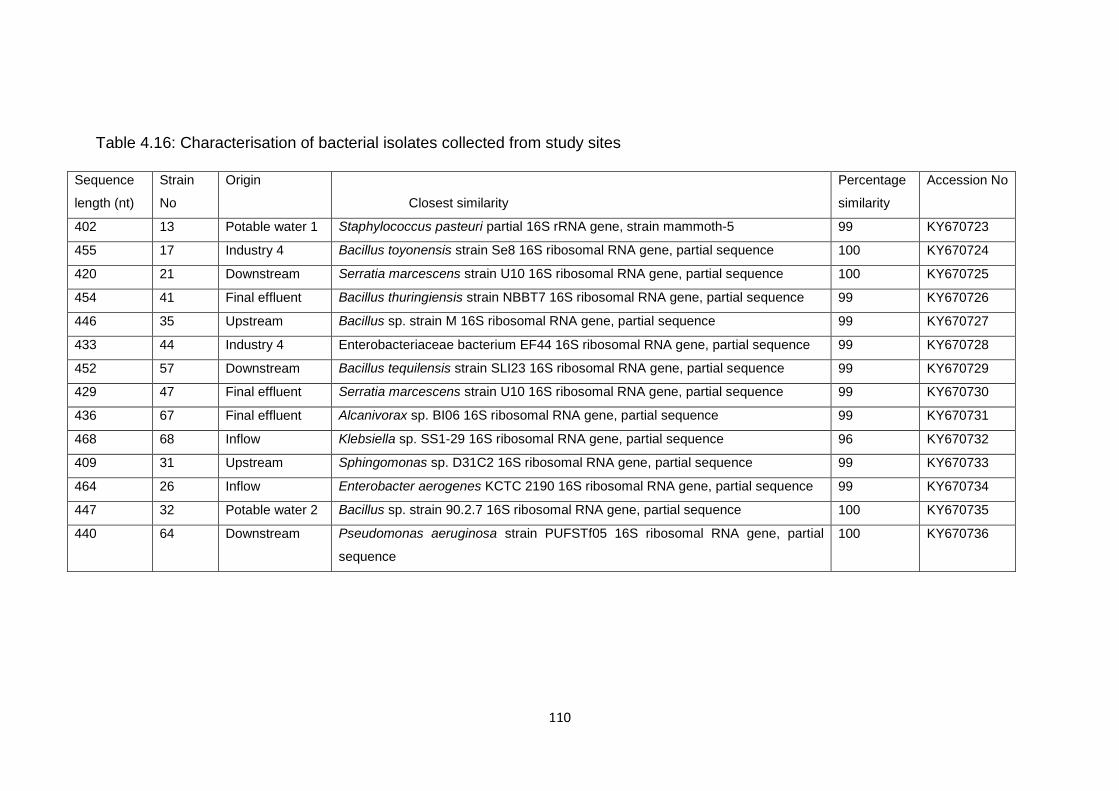
110
Table 4.16: Characterisation of bacterial isolates collected from study sites
Sequence
length (nt)
Strain
No
Origin
Closest similarity
Percentage
similarity
Accession No
402 13 Potable water 1 Staphylococcus pasteuri partial 16S rRNA gene, strain mammoth-5 99 KY670723
455 17 Industry 4 Bacillus toyonensis strain Se8 16S ribosomal RNA gene, partial sequence 100 KY670724
420 21 Downstream Serratia marcescens strain U10 16S ribosomal RNA gene, partial sequence 100 KY670725
454 41 Final effluent Bacillus thuringiensis strain NBBT7 16S ribosomal RNA gene, partial sequence 99 KY670726
446 35 Upstream Bacillus sp. strain M 16S ribosomal RNA gene, partial sequence 99 KY670727
433 44 Industry 4 Enterobacteriaceae bacterium EF44 16S ribosomal RNA gene, partial sequence 99 KY670728
452 57 Downstream Bacillus tequilensis strain SLI23 16S ribosomal RNA gene, partial sequence 99 KY670729
429 47 Final effluent Serratia marcescens strain U10 16S ribosomal RNA gene, partial sequence 99 KY670730
436 67 Final effluent Alcanivorax sp. BI06 16S ribosomal RNA gene, partial sequence 99 KY670731
468 68 Inflow Klebsiella sp. SS1-29 16S ribosomal RNA gene, partial sequence 96 KY670732
409 31 Upstream Sphingomonas sp. D31C2 16S ribosomal RNA gene, partial sequence 99 KY670733
464 26 Inflow Enterobacter aerogenes KCTC 2190 16S ribosomal RNA gene, partial sequence 99 KY670734
447 32 Potable water 2 Bacillus sp. strain 90.2.7 16S ribosomal RNA gene, partial sequence 100 KY670735
440 64 Downstream Pseudomonas aeruginosa strain PUFSTf05 16S ribosomal RNA gene, partial
sequence
100 KY670736
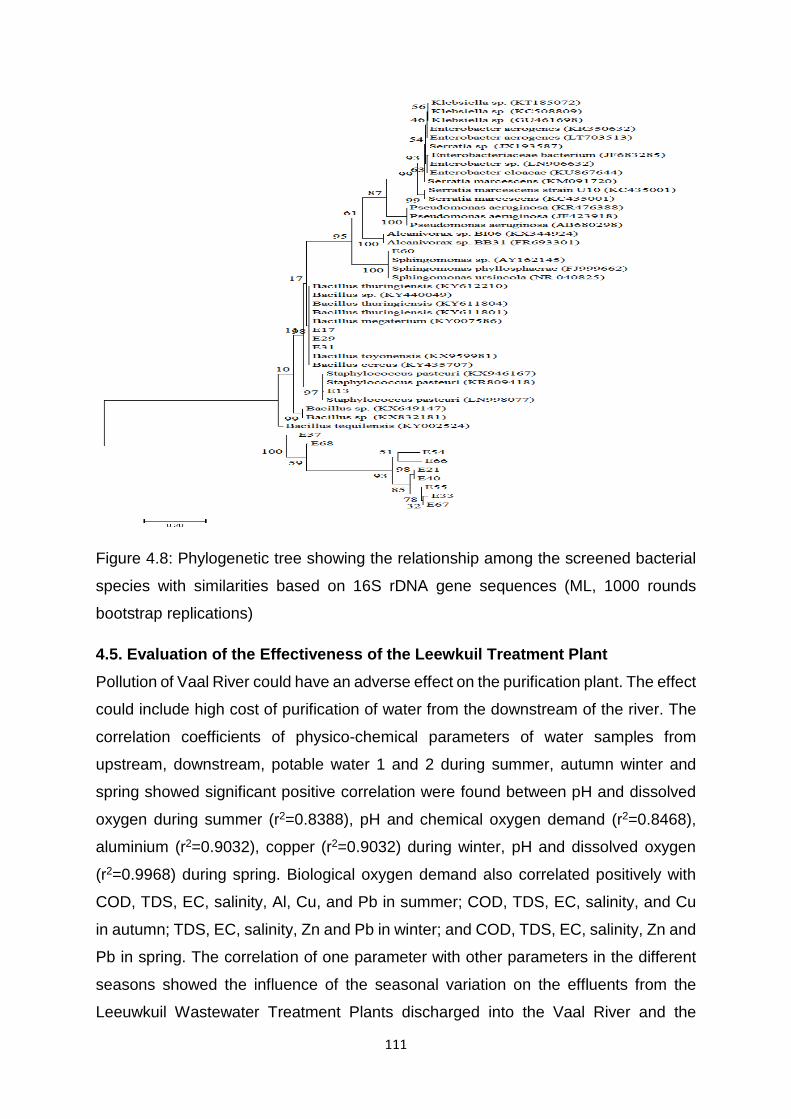
111
Figure 4.8: Phylogenetic tree showing the relationship among the screened bacterial
species with similarities based on 16S rDNA gene sequences (ML, 1000 rounds
bootstrap replications)
4.5. Evaluation of the Effectiveness of the Leewkuil Treatment Plant Pollution of Vaal River could have an adverse effect on the purification plant. The effect
could include high cost of purification of water from the downstream of the river. The
correlation coefficients of physico-chemical parameters of water samples from
upstream, downstream, potable water 1 and 2 during summer, autumn winter and
spring showed significant positive correlation were found between pH and dissolved
oxygen during summer (r2=0.8388), pH and chemical oxygen demand (r2=0.8468),
aluminium (r2=0.9032), copper (r2=0.9032) during winter, pH and dissolved oxygen
(r2=0.9968) during spring. Biological oxygen demand also correlated positively with
COD, TDS, EC, salinity, Al, Cu, and Pb in summer; COD, TDS, EC, salinity, and Cu
in autumn; TDS, EC, salinity, Zn and Pb in winter; and COD, TDS, EC, salinity, Zn and
Pb in spring. The correlation of one parameter with other parameters in the different
seasons showed the influence of the seasonal variation on the effluents from the
Leeuwkuil Wastewater Treatment Plants discharged into the Vaal River and the
112
purification plant. The more polluted the river is the higher the pressure on the
purification plant to produce quality water for the populace.
4.6 Conclusions The contamination of heavy metals in water and other aquatic environments have
gained greater momentum and attention due to its abundance, persistence and
ecotoxicity. In this study, a total of 24 heavy metals (Al, Cd, Cr, Cu, Fe, Mg, Ni, Pb, Sr,
& Zn) were identified from all the sampling points. The water quality test indicated that
wastewater from the industries is polluted with heavy metals and the correlation study
done showed their influence on the Leeuwkuil treatment plant and purification plant.
The water quality test done also signalled the presence of microorganisms in the
samples. Microbial characterisation and heavy metal sensitivity test done showed the
presence of bacterial with 22 of them resistant to the selected heavy metals in this
study. Furthermore, the presence of the pathogenic bacteria in potable water showed
that more attention is required on the purification plant.
113
CHAPTER 5: SUMMARY, RECOMMENDATIONS AND CONCLUSION
5.1 Summary The objectives of this study were to identify and quantify heavy metals and physico-
chemical parameters in effluent water from industries and Leeuwkuil plant, and water
samples from Vaal River and potable water as well as comparing the selected heavy
metals and physico-chemical parameters to current national and international
standards [SAGES, Green Drop certification requirement, South African National
standards (SANS) and World Health Organization (WHO)]. Further objective of this
study were to identify and characterise bacteria that are resistant to the selected heavy
metals in all the sampling points and to determine the correlation between the quality
of potable water and the effectiveness of the treatment plants. The findings of this
study are summarised below:
5.1.1 Heavy metals and physico-chemical parameters of the effluents and water samples Twenty four heavy metals (Ag, Al, B, Ca, Cr, Cu, Fe, K, Mg, Na, Ni, P, S, Pb, Sb, Se,
Sr, Si, Te, Cd, Li, Mo, V & Zn) were identified in effluent water from industries and
Leeuwkuil plant, and water samples from Vaal River and potable water. The industries
recorded high values for heavy metals and water quality parameters (BOD, DO, COD,
TDS, EC, and salinity) indicating them as point source of pollution in Vaal area of
South Africa. The Leeuwkuil Wastewater Treatment Plant was also assessed and was
found to be ineffective in maintaining Cu, Zn, Pb, (using SAGES standard), TDS and
EC but was only effective in maintaining temperature, pH, and COD within the green
drop and SAGES standards. This indicated that Leeuwkuil Wastewater Treatment
Plant needs to be reviewed.
The assessment of heavy metals and physico-chemical parameters from Vaal River
(upstream and downstream) and potable water showed that most of the water quality
parameters of samples from Vaal River did not meet the SANS-241(2015) and WHO
(1984; 1989) standards indicating partly the influence of the final effluents discharged
by the Leeuwkuil wastewater treatment plant and possibly, other external source that
is responsible for the pollution. However, the purification plant was found to be
effective in maintaining the values of Cu, Zn, Al, temperature, BOD, COD, and TDS
although more review is needed to be done in the plant.
114
5.1.2 Identification and characterisation of heavy metal resistant bacteria Seventy bacteria isolates obtained in this study were identified and exposed to
increasing concentrations of four metals (Al, Cu, Pb and Zn). The results showed that
22 isolates were resistant (+) to increased concentrations of Al, Cu, Pb, and Zn.
Among the 22 isolates, 90% (20) showed resistance to Cu and Pb, whilst 86% (19)
were resistant to Al and 82% (18) to Zn. The heavy metal resistant bacteria such as
Sphingomonas sp., Bacillus toyonensis strain (E17), Bacillus thuringiensis (E29),
Bacillus sp. strain (E31), Staphylococcus pasteuri (E13), Bacillus tequilensis (E37) and
Bacillus sp. strain (E68), Alcanivorax sp. (E54), Pseudomonas aeruginosa (E66),
Serratia marcescens (E21), Serratia marcescens strain (E40), Klebsiella sp (E55),
Enterobacteriaceae bacterium (E33), and Enterobacter aerogenes (E67) were
identified based on their similarities in the NCBI database. It is believed that some of
these resistant bacteria like Sphingomonas spp and Alcanivorex (although causing
diseases in human) were helpful in the bioremediation of the heavy metals
contaminations. However, some of them like Serratia marcescens, Pseudomonas
aeruginosa, Staphylococcus pasteuri and Sphingomonas spp are said to be
pathogenic and must be removed so it does not affect human health.
5.1.3 Correlation between the quality of potable water and the effectiveness of treatment plants in Vaal area The correlation coefficients of heavy metals and physico-chemical parameters of water
samples from Vaal River and potable water during summer, autumn winter and spring
showed significant positive correlation between pH and dissolved oxygen during
summer, pH and chemical oxygen demand, aluminium, copper during winter, pH and
dissolved oxygen during spring. Biological Oxygen Demand also correlated positively
with COD, TDS, EC, salinity, Al, Cu, and Pb in summer; COD, TDS, EC, salinity, and
Cu in autumn; TDS, EC, salinity, Zn and Pb in winter; and COD, TDS, EC, salinity, Zn
and Pb in spring. The correlations between these parameters in the different seasons
showed the influence of the seasonal variation on the effluents from the Leeuwkuil
Wastewater Treatment Plants discharged into the Vaal River and the purification plant.
This implied that increase in the pollution of Vaal River will result in a corresponding
increase in the pressure on the purification plant to produce quality water for the people
around the area. This may possibly influence the effectiveness of Leeuwkuil
Wastewater Treatment Plants and the purification plant unless they are constantly
reviewed to ensure consistency in their treatments.
115
5.2 Recommendations The following recommendations are made from this study
Effluent discharge need to be closely monitored by the municipal officials to
ensure compliances by the industries to South Africa standards.
Industries need to partake in environmental conferences or meetings so as to
update themselves with current and latest publications and legal notices. This
is very important to help them improve in their operations and partake in
corporate social investment, including sponsoring community campaigns on
pollution.
Constant upgrading of Leeuwkuil Wastewater Treatment Plant should be
monitored to reduce overload especially in some seasons. Leeuwkuil is already
operating above design capacity especially in summer/spring, which could be
one of the reasons for not maintaining TDS and EC within green drop limit.
The final effluent discharged into Vaal River partly influenced BOD, DO, COD
and EC concentrations of Vaal river as they were above the SANS-241 (2015)
and WHO (1984; 1989) Standards. This pollution could have resulted also due
to external activities around the river or possibly due to contamination from land
use around Vaal, bearing in mind that Vaal is an industrialised area. Concerted
effort can be made by the municipal to divert all storm water to drain pipes so
that the storm water can be effectively treated.
It is imperative for the government (or higher body) to monitor effluent and
waste water before disposal into the river by the sewage plant to avoid pollution
of water bodies.
The publics who come to the river to perform their ritual activities hence
polluting the river should be educated about the negative impact of the activities
to water bodies.
Monthly inspections need to be conducted by the municipality as well as
industries to ensure that effluent does not exceed the stipulated limits. The
municipality should also ensure that all industries are certified by ISO 14001
standard. Heavy fines should be imposed on industries that fails to meet
requirements.
5.3 Recommendations for further research It is believed that some of these resistant bacteria were helpful in the bioremediation
of the heavy metals contaminations. However, in this study, detail work on the
116
identification of their role in the bioremediation was not done. Hence, the
bioremediation study of these heavy metals resistant bacteria is required for future
study. Therefore, more work needs to be done in identifying the mechanisms of
operation of the bacteria in degrading the heavy metals.
The present study ascertained the effectiveness of Leeuwkuil Treatment Plant through
the measurement of physico-chemical parameters and the heavy metals. This
provided a baseline information on the treatment plants but more work needs to be
done in verifying the treatment capacity and the availability of the workers and
equipment needed for the effective treatment of the waste by the treatment plants.
The study provided a baseline information on the impact of the five production
industries on the treatment plants in Vaal, Vereeninging, South Africa. It is
recommended that future studies will comprise more industries that were not studied
in this research and are within the area.
High pH observed in potable water 1 and 2 could have resulted from contamination in
the chemical used by purification plant in purifying water. This can be considered for
future study.
5.4 Conclusion The findings in this study showed industries as a point source of heavy metal pollutions
in Vaal area. This posed serious challenge to the treatment plants in this area of South
Africa. The correlation study done showed the influence of industrial effluents on the
Leeuwkuil treatment plant and purification plant. The water quality test done also
signalled the presence of microorganisms in the samples and were confirmed through
microbial characterisation with the identification of heavy metal resistant bacteria.
Furthermore, pathogenic bacteria were identified in potable water suggesting more
review on the purification plant.
117
REFERENCE
Abbasi U, Jin W, Pervez A, Bhatti ZA, Tariq M, Shaheen S, Iqbal A, Mahmood Q
(2016). Anaerobic microbial fuel cell treating combined industrial wastewater:
Correlation of electricity generation with pollutants. Bioresource technology 200: 1 - 7.
Abdel-Raouf N, Al-Homaidan AA, Ibraheem IBM (2012). Microalgae and wastewater
treatment. Saudi journal of biological sciences 19(3): 257 - 275.
Abo-Amer AE, El-Shanshoury AERR, Alzahrani OM (2015). Isolation and molecular
characterization of heavy metal-resistant Alcaligenes faecalis from sewage
wastewater and synthesis of silver nanoparticles. Geomicrobiology Journal 32(9): 836
- 845.
Abo-Amer, A.E., El-Shanshoury, A.E.R.R. and Alzahrani, O.M., 2015. Isolation and
molecular characterization of heavy metal-resistant Alcaligenes faecalis from sewage
wastewater and synthesis of silver nanoparticles. Geomicrobiology Journal 32(9):
836-845.
Abraham JV, Butler RD, Sigee DC (1997). Ciliate populations and metals in an
activated-sludge plant. Water Research 31(5):1103 - 1111.
Adebisi SA, Fayemiwo KA (2010). Pollution of Ibadan soil by industrial effluents. New
York Journal 3(10): 37 - 41.
Adepoju-Bello AA, Alabi OM (2005). Heavy metals: A review. The Nigerian Journal of
Pharmacy 37: 41 - 45.
Adepoju-Bello AA, Ojomolade OO, Ayoola GA, Coker HAB (2009). Quantitative
analysis of some toxic metals in domestic water obtained from Lagos metropolis. The
Nigerian Journal of Pharmacy 42(1): 57 - 60.
118
Adewumi JR, Ilemobade AA, Van Zyl JE (2010). Treated wastewater reuse in South
Africa: Overview, potential and challenges. Resources, Conservation and
Recycling 55(2): 221 - 231.
Africa Development Bank Group (2015). Annual group report. Rural Water Supply and
Sanitation Initiative (RWSSI) and Rural Water Supply and Sanitation Initiative Trust
Fund (RWSSI-TF). Water and Sanitation Department.
Ahmad K, Bhatti LA, Muneer M, Iqbal M, Iqbal Z (2012). Removal of heavy metals (Zn,
Cr, Pb, Cd, Cu and Fe) in aqueous media by calcium carbonate as an adsorbent.
International Journal of Chemical and Biochemical Sciences 2:48 - 53.
Aina EOA, Adedipe NO (1996). Water quality monitoring and environmental status in
Nigeria. FEPA Monograph 6, FEPA, Abuja, Nigeria, 239.
Ajao AT, Oke MA, Ajijolakewu AK, Odebisi MB (2012). Physicochemical and
Ecotoxicological Evaluation of Raw and Biologically Treated Textile Effluent. Journal
of Scientific Theory and Methods 2012: 270 - 281.
Akaninwor JO, Wegwu MO, Nwaichi EO (2007). Levels of some heavy metals and
physico-chemical properties of effluents from a beverage company in Rivers State,
Nigeria. Journal of Applied Sciences and Environmental Management 11(1).
Akbar Jana F, Ishaqa M, Ihsanullahb I, Asimc SM (2010). Journal of Hazardous
Materials 176: 609 - 616.
Akpor OB, Muchie M (2010). Remediation of heavy metals in drinking water and
wastewater treatment systems: Processes and applications. International Journal of
Physical Sciences 5(12): 1807 - 1817.
Akpor OB, Ohiobor GO, Olaolu TD (2014). Heavy metal pollutants in wastewater
effluents: Sources effects and remediation. Advances in Bioscience and
Bioengineering 2(4): 37 - 43.
119
Alam S (2010). Globalization, Poverty and Environmental Degradation: Sustainable
Development in Pakistan. Journal of Sustainable Development Published by
Canadian Centre of Education 103.Science 3(3).
Alam MJ, Islam MR, Muyen Z, Mamun M, Islam S (2007). Water quality parameters
along rivers. International Journal of Environmental Science and Technology 4(1): 159
- 167.
Alinnor IJ, Obiji IA (2010). Assessment of trace metal composition in fish samples from
Nworie River. Pakistan Journal of Nutrition, 9(1): 81 -85.
Alo BI, Olanipekun A (2006). Heavy metal pollution in different environmental media
in Africa: Problems and prospects (with case studies from Nigeria). FMEnv/University
of Lagos Centre for Environmental Human Resources Development Department of
Chemistry, University of Lagos, Akoka, Lagos, Nigeria and Pollution Control
Department, Federal Ministry of Environment, Abuja, Nigeria.
Amoo IA, Ajayi OO, Ipinmoroti KO, Amuda OS (2004). Performance of some
coagulants in the treatment of effluent from soap/detergent industry. Proceeding 27th
of International Conference of Chemical Society of Nigeria, Benin 415 - 420.
Angelakis AN, Snyder SA (2015). Wastewater treatment and reuse: Past, present, and
future. Water (7): 4887 - 4895.
APHA (1995). Standard methods for the examination of water and waste water, 19th.
Ed, American Public Health Association, American Water Works Association &
Water Environment Federation, Washington, DC.
Appenroth KJ (2010). Definition of “heavy metals” and their role in biological systems.
In Soil heavy metals . Springer Berlin Heidelberg19 - 29.
Asante KA, Agusa T, Subramanian A, Ansa-Asare OD, Biney CA, Tanabe S (2007).
Contamination status of arsenic and other trace elements in drinking water and
120
residents from Tarkwa, a historic mining township in Ghana. Chemosphere 66:1513 -
1522.
Auwaerter P (2007). "Serratia species". Point-of-Care Information Technology ABX
Guide. Johns Hopkins University.
Ayres RU (1992). Toxic heavy metals: materials cycle optimization. Proceedings of
the National Academy of Sciences 89(3): 815 - 820.
Bahri A, Drechsel P, Brissaud F (2008). Water reuse in Africa: challenges and
opportunities. First African water week, “Accelerating Water Security for Socio-
Economic Development of Africa”, Tunis, Tunisia. Google Scholar.
Bailey SE, Olin TJ, Bricka RM, Adrian DD (1999). A review of potentially low-cost
sorbents for heavy metals. Water research 33(11): 2469 - 2479.
Baloyi C, Gumbo JR, Muzerengi C (2014). Pollutants in sewage effluent and sludge
and their impact on downstream water quality: a case study of Malamulele sewage
plant, South Africa. Water Pollution XII 182: 15.
Banza CLN, Nawrot TS, Haufroid V, Decrée S, De Putter T, Smolders E, Kabyla BI,
Luboya ON, Ilunga AN, Mutombo AM, Nemery B (2009). High human exposure to
cobalt and other metals in Katanga, a mining area of the Democratic Republic of
Congo. Environmental research 109(6): 745 - 752.
Barzilay JMD, Winkler G, Weinberg MD, William Eley J (1999). The water we drink.
Water quality and its effects on health: New Brunswick, New Jersey, Rutgers
University Press152.
Battarbee R, Anderson N, Appleby P, Flower RJ, Fritz S, Haworth E, Higgit S, Jones
V, Kreiser A, Munro MA, Natkanski J, Richardson N, Rippey B, Stevenson AC (1988).
Lake Acidification in the United Kingdom, ENSIS, London.
121
Behera S (2013). Physiochemical and Microbial Analysis of Soil and Water of
Dhobiajharan Village (Proposed Coal Mine Site-Tubed) (Doctoral dissertation).
Bent S, Böhm K (1995). Copper-induced liver cirrhosis in a 13-month old
boy. Gesundheitswesen (Bundesverband der Arzte des Offentlichen
Gesundheitsdienstes (Germany) 57(10): 667 - 669.
Bhagirath B, Ratna R (2002). Environmental and accountability impact of industrial
pollution on rural communities. Economic and political weekly 19.
Bielská L (2013). Chemical methods for prediction of bioavailability of persistent
organic pollutants in solid environmental matrices (Doctoral dissertation, Masarykova
univerzita, Přírodovědecká fakulta).
Binning K, Baird, D (2001). Survey of heavy metals in the sediments of the Swartkops
River Estuary, Port Elizabeth South Africa. Water SA 27(4): 461 - 466.
Bosch S (1999). Environmental scoping report for the conveyance, treatment and
disposal of wastewater for the town of Keiskammahoek, in the Eastern Cape. CEN
Integrated Environmental Management Unit, Port Elizabeth.
Bradl H (2002). Adsorption of heavy metal ions on clays. Encyclopedia of surface and
colloid science 373 - 384.
Bruins MR., Kapil S, Oehme FW (2000). Microbial resistance to metals in the
environment. Ecotoxicology and environmental safety 45(3): 198-207.
Buamah R, Petrusevski B, Schippers JC (2008). Presence of arsenic, iron and
manganese in groundwater within the gold-belt zone of Ghana. Journal of Water
Supply: Research and Technology 57: 519 - 529.

122
Burger J, Gaines KF, Boring CS, Stephens WL, Snodgrass J, Dixon C, McMahon M,
Shukla S, Shukla T, Gochfeld M (2002). Metal levels in fish from the Savannah River:
potential hazards to fish and other receptors. Environmental research 89(1): 85 - 97.
Calamari D, Naeve H. (1994). Review of pollution in the African aquatic
environment. Committee for Inland Fisheries of Africa (CIFA) Technical Paper No. 25,
FAO, Rome, 118
Chapman DV, World Health Organisation (1996). Water quality assessments: a guide
to the use of biota, sediments and water in environmental monitoring / edited by
Deborah Chapman, 2nd ed. London: E and FN Spon.
http://www.who.int/iris/handle/10665/41850.
Chigor VN, Sibanda T, Okoh AI (2013). Variations in the physicochemical
characteristics of the Buffalo River in the Eastern Cape Province of South
Africa. Environmental monitoring and assessment 185(10): 8733 - 8747.
Chikoto T (2009). Informal Settlements in South Africa. A Research Report Submitted
in fulfilment of part of the requirements for the Degree of BSc (Hons) (Quantity
Surveying). In the faculty of Engineering, Built environment of Information Technology,
University of Pretoria.
Chindah A, Braide A, Sibuendu O (2004). Distribution of hydrocarbons and heavy metals in sediment and a Crustacean (Shrimps-Penaeus notialis) from the bonny/new
Calabar River estuary, Niger Delta. African Journal of Environmental Assessment and
Management 9:1 - 14.
Chinedu SN, Nwinyi OC, Oluwadamisi AY, Eze VN (2011). Assessment of water
quality in Canaanland, Ota, Southwest Nigeria. Agriculture and Biology Journal of
North America 2(4):577 - 583.
Chirisa I, Bandauko E, Matamanda A, Mandisvika G (2017). Decentralized domestic
wastewater systems in developing countries: the case study of Harare
(Zimbabwe). Applied Water Science 7(3): 1069 - 1078.
123
Cohen MD, Kargacin B, Klein CB, Costa M (1993). Mechanisms of chromium
carcinogenicity and toxicity. Critical reviews in toxicology 23(3): 255-281.
Corcoran E, Nellemann C, Baker E, Bos R, Osborn D, Savelli H (2010). Sick Water?
The central role of wastewater management in sustainable development: A Rapid
Response Assessment. United Nations Environment Programme (UNEP), Un-Habitat,
Grid-Arendal.
Cornish GA, Kielen NC (2004). Wastewater irrigation–hazard or lifeline? Empirical
results from Nairobi, Kenya and Kumasi, Ghana. Wastewater use in irrigated
agriculture 69 - 79.
Dallas HF, Day JA (2004). The effect of water quality variables on aquatic ecosystems:
a review. Pretoria: Reported to Water Research Commission by Freshwater Research
Unit, University of Cape Town. WRC Report No. TT 224/04
Dan’azumi S, Bichi MH (2010). Industrial pollution and implication on source of water
supply in Kano, Nigeria. International Journal of Engineering and Technology 10(1):
101 - 109.
De Villiers S, Thiart C (2007). The nutrient status of South African rivers:
concentrations, trends and fluxes from the 1970's to 2005. South African Journal of
Science 103: 343 - 349.
DEAT (2000).White paper on integrated pollution and waste management for South
Africa: A policy on pollution prevention, Waste minimization, impact management and
remediation, Department of Environmental Affairs and Tourism, 80.
Department of Environment (2001). Water Quality Data of Rivers Buriganga, Meghna,
Balu, Shitalakhya and Jamuna. Department of Environment, Dhaka, Bangladesh.
Department of Water Affairs (1988). Evaporation map for Namibia. Report No:
11/1/8/1/H1, October 1988, p.11.
124
Department of water and environmental affairs (DWEA) (2009).Gauteng water for
growth and department. Draft 1.1. March.
Department of water and forestry (1996). South African water quality guidelines.
Domestic uses. 2nd edition. Department of water affairs and forestry, Pretoria. Volume
1.
Dhokpande SR, Kaware JP (2013). Biological methods for heavy metal removal–A
review. International Journal of Engineering Science and Innovative Technology. 2(5):
304-309
Dixit R, Malaviya D, Pandiyan K, Singh UB, Sahu A, Shukla R, Singh BP, Rai JP,
Sharma PK, Lade H, Paul D (2015). Bioremediation of heavy metals from soil and
aquatic environment: an overview of principles and criteria of fundamental
processes. Sustainability 7(2): 2189 - 2212.
Du Plessis S, Smit B (2005). Economic Growth in South Africa since 1994.
Stellenbosch Economic Working Papers: 1 / 2006. Bureau of Economic Research
University of Stellenbosch.
Duruibe JO, Ogwuegbu MOC, Egwurugwu JN (2007). Heavy metal pollution and
human biotoxic effects. International Journal of Physical Sciences 2(5): 112 - 118.
Eaton AD (2005). Standard Methods for the Examination of Water and Waste Water.
21 st Edn. American Public Health Association, Washington, ISBN. 0875530478. pp.
343 - 453.
Eberhard R, Robinson P (2003). Guidelines for the Development of National Water
Policies and Strategies to support IWRM. Draft. SADC Water Sector Co-ordination
Unit, Gaborone, Botswana.
Eckenfelder W, Wesley J (2000). Literature Review of Temperature Effects in
Biological Wastewater Treatment, Boston.
125
Emfuleni Local Municipality Wastewater Risk Abatement Plan (2013). Emfuleni Local
Municipal. https://en-wikipedia.org/wiki/Emfuleni_Local_Municipality Arial view of
Study Area.
Ensink JH, Simmons RW, van der Hoek W (2004). Wastewater use in Pakistan: The
cases of Haroonabad and Faisalabad. Wastewater use in irrigated agriculture:
Confronting the livelihood and environmental realities 91 - 99.
Ethan JN, Richard WM, Michael GK (2003). The effect of an industrial effluent on an
urban stream benthic community: water quality vs. habitat quality. Environmental
Pollution 123 (1):1 - 13.
Fadiran AO, Mamba SM (2005). Analysis of nitrates and nitrites in some water and
factory effluent samples from some cities in Swaziland. Bulletin of the Chemical
Society of Ethiopia 19(1): 35 - 44.
Fakayode S (2005). Impact assessment of industrial effluent on water quality of the
receiving Alaro River in Ibadan, Nigeria. African Journal of Environmental Assessment
and Management 10:1 - 3.
FAO (2005). Irrigation in Africa in figures. AQUASTAT Survey – 2005. Water Report
29.FAO, Rome.
Faruqui N, Niang S, Redwood M (2004). Untreated wastewater reuse in market
gardens: a case-study of Dakar, Senegal. In Wastewater Use in Irrigated Agriculture.
Confronting the Livelihood and Environmental Realities, Scott CA, Faruqi NI, Raschid-
Sally L (eds). CABI Publishing: Wallingford, UK 113 - 126.
Fazli MM, Soleimani N, Mehrasbi M, Darabian S, Mohammadi J, Ramazani A (2015).
Highly cadmium tolerant fungi: their tolerance and removal potential. Journal of
Environmental Health Science and Engineering 13(1): 19
126
Fergusson JE (1990). Heavy elements, chemistry. Environmental impact and health
effect, Pergamon.
Fernández-Luqueño F, López-Valdez F, Gamero-Melo P, Luna-Suárez S, Aguilera-
González EN, Martínez AI, García-Guillermo MDS, Hernández-Martínez G, Herrera-
Mendoza R, Álvarez-Garza MA, Pérez-Velázquez IR (2013). Heavy metal pollution in
drinking water-a global risk for human health: A review. African Journal of
Environmental Science and Technology 7(7): 567 - 584.
Fonseca M, De Oliveira M, Arakaki L (2006). Removal of cadmium, zinc, manganese
and chromium cations from aqueous solution by clay mineral. Journal of Hazardous
Materials Science 137: 288 - 292.
Gbadebo AM, Taiwo AM, Eghele U (2010). Environmental impacts of drilling mud and
cutting wastes from the Igbokoda onshore oil wells, Southwestern Nigeria. Indian
Journal of Science and Technology 3(5): 504 - 510.
Ghazy SE, El-Asmy AA, EL-Nokrashy AM (2008) Separation of chromium (III) and
chromium (VI) from environmental water samples using eggshell sorbent. Indian
Journal of Science and Technology 1 (6): 1 - 7.Gray CA (1997). Field assessment of
numerical impacts of coastal sewage disposalon fish larvae relative to natural
variability. Environmental Biology of Fishes 50: 415 - 434.
Haferburg G, Kothe E (2010). Metallomics: lessons for metalliferous soil
remediation. Applied microbiology and biotechnology 87(4): 1271 - 1280.
Haji HT (2011). Impact of Climate Change on Surface Water Availability in the Upper
Vaal River Basin.(Doctorate Dissertation, Tshwane University of Technology).
Halder JN, Islam N (2015). Water Pollution and its Impact on the Human Health.
Journal of Environment and Human 2(1): 2373 - 8332.
127
Hall J, Hodgson G, Kerr KG (2004). Provision of safe potable water for immune-
compromised patients in hospital. Journal of Hospital Infections 58: 155 - 158.
Hammer, M.J., and M.J. Hammer, Jr., 2004. Water Quality. In: Water and Waste Water
Technology. 5th Edn. New Jersey: Prentice-Hall 139 - 159.
Hanif HN, Bhatti Ali MA (2010). Heavy metal tolerance and biosorption potential of
white rot fungi. Asian Journal of Chemistry 22: 335-345.
He ZL, Yang XE, Stoffella PJ (2005). Trace elements in agroecosystems and impacts
on the environment. Journal of Trace elements in Medicine and Biology 19(2-3): 125
- 140.
Helmer R, Hespanhol I (1997). Wastewater as a resource. Chapter 4: Water Pollution
Control: A Guide to the Use of Water Quality Management. United Nations
Environment Program, the Water supply and Sanitation Collective Council, and the
World Health Organization.
Hookoom M, Puchooa D (2013). Isolation and identification of heavy metals tolerant
bacteria from industrial and agricultural areas in Mauritius. Current research in
microbiology and biotechnology 1(3): 119 - 123.
Horan NJ (1990). Biological Wastewater Treatment Systems: Theory and Operation
John Wiley & Sons. New York. 310p.
Hurse TJ, Connor MA (1999). Nitrogen removal from wastewater treatment
lagoons. Water science and technology 39(6): 191 - 198.
Hutton M, Symon C (1986). The Quantities of Cadmium, Lead, Mercury and Arsenic
Entering the U.K. Environment from Human Activities. Science of the Total
Environment. 57: 129 - 150.
128
Ibeto CN, Okoye COB (2010). High levels of Heavy metals in Blood of Urban
population in Nigeria. Research Journal of Environmental Sciences 4(4): 371 - 382.
Ibrahim S, Tayel I (2005). “Effect of Heavy Metals on Gills of Tilapia Ziilli Inhabiting the
River Nile Water (Damietta Branch and El-Rahawey Drain),” Egypt Journal of Aquatic
Biology & Fish (9)2:111- 128.
Igbinosa EO, Okoh AI (2009). Impact of discharge wastewater effluents on the
physico-chemical qualities of a receiving watershed in a typical rural
community. International Journal of Environmental Science and Technology 6(2): 175
- 182.
Igwilo IO, Afonne OJ, Maduabuchi UJM, Orisakwe OE (2006). Toxicological study of
the Anam River in Otuocha, Anambra state, Nigeria. Archives of environmental and
occupational health 61(5): 205 - 208.
Ilhan S, Nourbakhsh MN, Kiliçarslan S, Ozdag H (2004). Removal of chromium, lead
and copper ions from industrial waste waters by Staphylococcus
saprophyticus. Turkish Electronic Journal of Biotechnology 2(2): 50 - 57.
Jaafar R, Omar I, Jidon AJ, Wan-Khamizar BW, Siti-Aishah BM, Sharifah-Noor-Akmal
SH (1993). Skin cancer caused by chronic arsenical poisoning: A report of three cases.
Medical Journal of Malaysia 48: 86 - 92.
Jaishankar M, Mathew BB, Shah MS, Murthy KTP, Gowda KRS (2014). Biosorption
of few heavy metal ions using agricultural wastes. Journal of Environment Pollution
and Human Health 2(1): 1 - 6.
Jaji MO, Bamgbose O, Odukoya OO, Arowolo TA (2007). Water quality assessment
of Ogun River, south west Nigeria. Environmental monitoring and assessment 133(1-
3): 473 - 482.
129
Jakimska A, Konieczka P, Skóra K, Namieśnik J (2011). Bioaccumulation of Metals in
Tissues of Marine Animals, Part I: the Role and Impact of Heavy Metals on
Organisms. Polish Journal of Environmental Studies 20(5).
Jamatia A, Chakraborty S, Das D, Jamatia SK, Ray S, Das MK (2014). Evaluation of
Physiochemical characteristics of disposed Rubber industry effluent: a case study of
Bodhjungnagar industrial growth centre. IOSR Journal of Engineering. 4: 44 - 50.
Jenkins D, Richard M, Daigger G (2003). Manual on the Causes and Control of
Activated Sludge Bulking and Foaming. 2nd edition. Lewis publishers, Boca.
Jimena MG, Roxana O, Catiana Z, Margarita H, Susana M, Ines-Isla M (2008).
Industrial effluents and surface waters genotoxicity and mutagenicity evaluation of a
river of Tucuman, Argentina. J. of hazardous Material 155(3): 403 - 406.
JMP (2012): Progress on Drinking Water and Sanitation – (2012) update. 60 p.
http://www.wssinfo.org/fileadmin/user_upload/resources/
Jordaan K, Bezuidenhout CC (2013). The impact of physico-chemical water quality
parameters on bacterial diversity in the Vaal River, South Africa. Water SA 39(3): 385
- 396.
Kamika I, Momba MN (2013). Assessing the resistance and bioremediation ability of
selected bacterial and protozoan species to heavy metals in metal-rich industrial
wastewater. BMC microbiology 13(1): 28.
Katole SB, Kumar P, Patil RD (2013). Environmental pollutants and livestock health:
a review. Veterinary Research International 1(1): 1 - 13.
Keller S (2012). Water Pollution. http://www.sswm.info/content/water-pollution.
130
Keraita B, Drechsel P, Huibers FP, Raschid-Sally L (2002). Wastewater use in informal
irrigation in urban and periurban areas of Kumasi, Ghana. Urban Agriculture
Magazine 8: 11 - 13.
Khanijo I (2002). Nutrient removal from waste water by wetland system. Wetlands 10.
Khraisheh MA, Al-degs YS, Mcminn WA (2004). Remediation of wastewater
containing heavy metals using raw and modified diatomite. Chemical Engineering
Journal 99(2): 177 - 184.
Kott Y, Roze N, Sperber S, Betzer N (1974). Bacteriophages as viral pollution
indicators. Water research 8(3): 165 - 171.
Kraemer A, Choudhury K, Kampa E (2001). Protecting Water Resources: Pollution
Prevention. (Thematic Background Paper). International Conference on Freshwater in
Bonn.
Krishna AK, Govil PK (2004). Heavy metal contamination of soil around Pali industrial
area, Rajasthan, India. Environmental Geology 47(1): 38 - 44.
Krishnani K, Meng X, Christodoulatos C, Boddu V (2008). Biosorption mechanism of
nine different heavy metals onto biomatrix from rice husk. Journal of Hazardous
Materials Science 153:1222 - 1234.
Kumar PR, Pinto LB, Somashekar RK (2010). Assessment of the efficiency of sewage
treatment plants: a comparative study between nagasandra and mailasandra sewage
treatment plants. Kathmandu university journal of science, engineering and
technology 6(2): 115 - 125.
Lahnsteiner J, Lempert G (2007). Water management in windhoek, namibia. Water Science and Technology 55(1 - 2): 441 - 448.
131
Lakherwa D (2014) Adsorption of heavy metals: a review. International Journal of
Environmental Research 4(1): 2249 - 3131
Larsdotter K (2006). Microalgae for phosphorus removal from wastewater in a Nordic
climate (Doctoral dissertation from School of Biolotechnology, Royal Institute of
Technology, Stockholm, Sweden).
Lenntech Water Treatment and Air Purification (2004). Water Treatment, Published by
Lenntech, Rotterdamseweg, Netherlands.
Lenntech WT (2009). Chemical Properties, Health and Environmental Effects of
Copper. Lenntech Water Treatment and Purification Holding B.V.
www.lenntech.com/periodic/elements/cu .htm.
Lim SS, Lee DS, Lee SI, Park HJ, Kwak JH, Choi WJ (2010). Reduction of ammonia
volatilization and nitrogen loss by addition of zeolite and phospho-gypsum to cattle
manure mixed with rise hull and sawdust as bedding materials. In The 9th International
Conference of the East and Southeast Asia Federation of Soil Science Societies 434
- 435.
Lofrano G, Brown J (2010). Wastewater management through the ages: A history of
mankind. Science of the Total Environment 408(22): 5254 - 5264.
Longe EO, Omole DO (2008). Analysis of pollution status of river Illo, Ota, Nigeria. The
Environmentalist 28(4): 451 - 457.
Madsen H, Poultsen L, Grandjean P (1990). Risk of high copper content in drinking
water. Ugeskr. Laeger. 152 (25): 1806-1809.
Madyiwa S (2006). Modelling the lead and cadmium uptake by star grass under
irrigation with treated wastewater. PhD Thesis. University of Pretoria, Pretoria, South
Africa.
132
Mahlaka R (2015). Vaal River City, a new riverfront development pushing boundaries:
A mixed-income and high-development emerges. Density. http:// www.
moneyweb.co.za/investing/property/vaal-river-city-new-riverfront-development-
pushing-bound.
Mahlambi MM, Ngila CJ, Mamba BB (2015). Recent developments in environmental
photocatalytic degradation of organic pollutants: the case of titanium dioxide
nanoparticles—a review. Journal of Nanomaterials 2015: 5 - 24.
Maila MP, Cloete TE (2005). The use of biological activities to monitor the removal of
fuel contaminants—perspective for monitoring hydrocarbon contamination: a
review. International Biodeterioration and Biodegradation 55(1):1 - 8.
Mamabolo MF (2012). Effects of cooperative governance in the sewage treatment
works in the upper Vaal River (Doctoral dissertation, North-West University).
Mann US, Dhingra A, Singh J (2014). Water Pollution: Causes, Effects And Remedies.
International Journal of Advanced Technology in Engineering and Science: 02(08): 70
- 74.
Manyatshe Al, Fosso-Kankeu E, van der Berg D, Lemmer N, Waanders F, Hlanganani
T (2016). Assessment of seasonal variations in surface water quality of the Mooi and
Vaal rivers network, South Africa. International Conference on Advances in Science,
engineering, Technology and Natural Resources (ICASETNR-16): Nov 24-25.
Marcovecchio JE, Botté SE, Freije RH (2007). Heavy metals, major metals, trace
elements. Handbook of water analysis 2: 275 - 311.
Markandya A (2004). Water quality issues in developing countries. World Bank and
University of Bath 1 - 33.
Martin S, Griswold W (2009). Human health effects of heavy metals. Environmental
Science and Technology briefs for citizens 15:1 - 6.
133
Mateo-Sagasta J, Raschid-Sally L, Thebo A (2015). Global wastewater and sludge
production, treatment and use. In Wastewater 15 - 38. Springer Netherlands.
Matowanyika W (2011) Impact of Alexandra Township on the water quality of the
Jukskei River. A research report submitted to the Faculty of Science, University of the
Witwatersrand, Johannesburg, in partial fulfilment of the requirements for the degree
of Master of Science.
Mbalassa M, Bagalwa JJM, Nshombo M, Kateyo ME (2014). Assessment of
physicochemical parameters in relation with fish ecology in Ishasha River and Lake
Edward, Albertine Rift Valley, East Africa. International Journal of Current
Microbiology and Applied Sciences: 3(6): 230 - 244.
McCulloch WL, Goodfellow Jr WL, Black JA (1993). Characterization, identification
and confirmation of total dissolved solids as effluent toxicants. Environmental.
Toxicology. Risk Assessment, 2: 213 - 227.
McKee JE, Wolf HW (1963). Water Quality Criteria, State Water Quality Control
Board, Sacramento, Calif. Publication, No. 3-A, 93.
Mejáre M, Bülow L (2001). Metal-binding proteins and peptides in bioremediation and
phytoremediation of heavy metals. TRENDS in Biotechnology 19(2): 67 - 73.
Mema V (2010). Impact of poorly maintained waste water and sewage treatment plants: Lessons from South Africa. ReSource 12: 60 - 65.
Metcalf L, Eddy HP (1972). Wastewater engineering collection treatment disposal.
McGraw-Hill Interamericana.
Mills-Knapp S, Traore K, Ericson B, Keith J, Hanrahan D, Caravanos J (2012). The
World’s Worst Pollution Problems: Assessing the Health Risks at Hazardous Waste
Sites. Blacksmith Institute, New York.
134
Milner MJ, Kochian LV (2008). Investigating heavy-metal hyperaccumulation using
Thlaspi caerulescens as a model system. Annals of botany 102(1): 3 - 13.
Mocuba JJ (2010). Dissolved Oxygen and Biochemical Oxygen Demand in the waters
close to the Quelimane sewage discharge (Master's thesis, The University of Bergen).
Mohod CV, Dhote J (2013). Review of heavy metals in drinking water and their effect
on human health. International Journal of Innovative Research in Science,
Engineering and Technology 2(7): 2992 - 2996.
Momba MN, Sibewu M, Mandeya A (2009). Survival of somatic and F-RNA coliphages
in treated wastewater effluents and their impact on viral quality of the receiving water
bodies in the Eastern Cape Province-South Africa. Journal of Biological Sciences 9(7):
648 - 654.
Morrison G, Fatoki OS, Persson L, Ekberg A (2001). Assessment of the impact of point
source pollution from the Keiskammahoek Sewage Treatment Plant on the
Keiskamma River-pH, electrical conductivity, oxygen-demanding substance (COD)
and nutrients. Water SA: 27(4):475 - 480.
Morrison GL, Anderson T, Behnia M (2004). Seasonal performance rating of heat
pump water heaters. Solar Energy 76(1-3):147 - 152.
Mostert E (2009). International co-operation on Rhine water quality 1945–2008: An
example to follow? Physics and Chemistry of the Earth, Parts A/B/C, 34(3): 142 - 149.
Movahedian H, Bina B, Asghari GH (2005). Toxicity evaluation of wastewater
treatment plant effluents using Daphnia magna. Journal of Environmental Health
Science and Engineering 2(2): 1 - 4.
Mtetwa S (1996). Effluent and wastewater standards in Zimbabwe. Lake Chivero. A
Polluted Lake. University of Zimbabwe Publications, Harare, Zimbabwe 124 - 133.
135
Mukherjee S, Nelliyat P (2006). Ground Water Pollution and Emerging Environmental
Challenges of Industrial Effluent Irrigation: A Case Study of Mettupalayam Taluk,
Tamilnadu. Available at SSRN: https://ssrn.com/abstract=1021153 or
http://dx.doi.org/10.2139/ssrn.1021153
Muneer M, Bhatti IA, Adeel S (2010). Removal of Zn, Pb and Cr in textile wastewater
using rice husk as a biosorbent. Asian Journal of Chemistry 22: 7453 - 7459.
Murray K, Du Preez M, Van Ginkel C (2000). National Eutrophication Monitoring
Programme. Implementation Manual Draft. Water Research Commission, Pretoria.
Naidoo S, Olaniran AO (2014). Treated Wastewater Effluent as a Source of Microbial
Pollution of Surface Water Resources. International Journal of Environmental
Research and Public Health 11: 249 - 270.
Nasrullah RN, Bibi H, Iqbal M, Durrani MI (2006). Pollution load in industrial effluent
and ground water of Gadoon Amazai Induatrial Estate (GAIE) Swabi, NWFP. Journal
of agricultural and biological science 1(3): 18 - 24.
Nazir R, Khan M, Masab M, Rehman HU, Rauf NU, Shahab S, Ameer N, Sajed M,
Ullah M, Rafeeq M, Shaheen Z (2015). Accumulation of heavy metals (Ni, Cu, Cd, Cr,
Pb, Zn, Fe) in the soil, water and plants and analysis of physico-chemical parameters
of soil and water collected from Tanda Dam Kohat. Journal of Pharmaceutical
Sciences and Research 7(3): 89.
Nhapi I, Gijzen H (2002). Wastewater Management in Zimbabwe. Proceedings of the
28th WEDC Conference on sustainable environmental sanitation and water services.
Kolkata, India, 2002.
Nies DH (2003). Efflux-mediated heavy metal resistance in prokaryotes. FEMS
microbiology reviews 27(2-3): 313 - 339.
136
Nies DH, Silver S (1995). Ion efflux systems involved in bacterial metal resistance.
Journal of industrial microbiology. 14(2): 186-199.
Njoku KL, Akinola MO, Oboh BO (2009). Phytoremediation of crude oil contaminated
soil: the effect of growth of Glycine max on the physico-chemistry and crude oil
contents of soil. Nature and Science 7(10): 79 - 87.
Norseth T (1981). The carcinogenicity of chromium. Environmental health
perspectives 40: 121.
Nriagu JO (1989). A global Assessment of Natural Sources of Atmospheric Trace
Metals. Nature 338: 47 - 49.
Ntuli F (2012). Management and Control of Industrial Effluents Discharged to Public
Sewers: A Case Study. World Academy of Science, Engineering and Technology,
6(8): 121 - 126.
Oarga A (2009). Life in extreme environments. Revista de Biologia e ciencias da Terra
9(1):1 - 10.
Obodo GA (2004). The bioaccumulation of heavy metals in fish from Anambra
River. Journal of Chemical Society of Nigeria 29(1): 60 - 62.
Odjadjare EE, Okoh AI (2010). Physicochemical quality of an urban municipal
wastewater effluent and its impact on the receiving environment. Environmental
monitoring and assessment 170(1-4): 383 - 394.
Odjegba VJ, Bamgbose NM (2012). Toxicity assessment of treated effluents from a
textile industry in Lagos, Nigeria. African Journal of Environmental Science and
Technology 6(11): 438 - 445.
137
Odjegba VJ, Bamgbose NM (2012). Toxicity assessment of treated effluents from a
textile industry in Lagos, Nigeria. African Journal of Environmental Science and
Technology 6(11): 438 - 445.
Odoemelam SA (2005). Bioaccumulation of trace elements in fish from Oguta Lake.
Journal of the Chemical Society Nigeria 30: 18 - 20
Ogunfowokan AO, Okoh EK, Adenuga AA, Asubiojo OI (2005). An assessment of the
impact of point source pollution from a university sewage treatment oxidation pond on
a receiving stream – a preliminary study. Journal of Applied Sciences 5(1):36 - 43.
Ogunleye IO, Izuagie AA (2013). Determination of heavy metal contents in some
industrial effluents from Ondo State, Nigeria. Journal of Environmental Chemistry and
Ecotoxicology 5(8): 216 - 219.
Okoh AI, Odjadjare EE, Igbinosa EO, Osode AN (2007). Wastewater treatment plants
as a source of microbial pathogens in receiving watersheds. African Journal of
Biotechnology 6(25).
Okonkwo JO (2010). Sanitation, Potable Water Supply and Environmental Protection.
Benefits, Progress and Issues for Sustainability in Developing Countries. Aisa Policy
brief Number 23.
Olafisoye OB, Adefioye T, Osibote OA (2013). Heavy metals contamination of water,
soil, and plants around an electronic waste dumpsite. Polish Journal of Environmental
Studies 22(5): 1431 - 1439.
Olaniyi I, Odoh R, Onyebuchi NJ (2012). Effect of industrial effluent on the surrounding
environment. Archives of Applied Science Research 4(1): 406 - 413.
Olowu RA, Ayejuyo OO, Adewuyi GO, Adejoro IA, Denloye AAB, Babatunde AO,
Ogundajo AL (2010). Determination of heavy metals in fish tissues, water and
138
sediment from Epe and Badagry Lagoons, Lagos, Nigeria. Journal of Chemistry 7(1):
215 - 221.
Opelo RJ, Little CJP (2004). Strategic development for the wastewater and sanitation
sector of Botswana.
Organisation for Economic Co-operation and Development (OECD) (2008).OECD
Environmental data: Compendium 2006 - 2008.
Osman AG, Kloas W (2010). Water quality and heavy metal monitoring in water,
sediments, and tissues of the African catfish Clarias gariepinus (Burchell, 1822) from
the river Nile, Egypt. Journal of Environmental Protection 1(4): 389 - 400.
Oven M, Saghir KM, Huda QA, Nadeen FM, Almeelbi T (2016). Heavy metals:
Biological importance and detoxification strategies. Journal of Bioremediation &
Biodegradation 7: 1 - 15.
Owa FW (2014). Water pollution: sources, effects, control and
management. International Letters of Natural Sciences 3.
Pacific Institute (2010): World Water Quality Facts and Statistics. Oakland: Pacific
Institute.
Pandey S, Rai R, Rai LC (2012). Proteomics combines morphological, physiological
and biochemical attributes to unravel the survival strategy of Anabaena sp. PCC 7120
under arsenic stress. Journal of proteomics 75(3): 921 - 937.
Paranychianakis NV, Salgot M, Snyder SA, Angelakis AN (2015). Water reuse in EU
states: necessity for uniform criteria to mitigate human and environmental
risks. Critical Reviews in Environmental Science and Technology 45(13): 1409 - 1468.
139
Parkman M, Patchett J, Odongo O (2008). Kisumu Water Supply and Sanitation
Project, Long Term Action Plan: Water Design Report, Lake Victoria South Water
Services Board, Kisumu, Kenya.
Patil PN, Sawant DV, Deshmukh RN (2012). Physico-chemical parameters for testing
of water-A review. International Journal of Environmental Sciences, 3(3): 1194 - 1207.
Peplow D (1999). Environmental impacts of mining in Eastern Washington. University
of Washington Water Center.
Piddock LJ (2006). Multidrug-resistance efflux pumps? Not just for resistance. Nature
Reviews Microbiology 4(8): 629 - 636.
projections, and key challenges for sustainability. Technology in Society 28(1-2): 63–
80.
Prüss A, Kay D, Fewtrell L, Bartram J (2002). Estimating the burden of disease from
water, sanitation, and hygiene at a global level. Environmental health
perspectives 110(5): 537.
Qadir M, Sharma BR, Bruggeman A, Choukr-Allah R, Karajeh F (2007). Non-
conventional water resources and opportunities for water augmentation to achieve
food security in water scarce countries. Agricultural water management 87(1): 2 - 22.
Qasem A (2011). Performance Assessment Model for Wastewater Treatment
Plants (Doctoral dissertation, Concordia University).
Raja R, Hemaiswarya S, Kumar NA, Sridhar S, Rengasamy R (2008). A perspective
on the biotechnological potential of microalgae. Critical reviews in microbiology 34(2):
77 - 88.
140
Rajaram T, Das A (2008). Water pollution by industrial effluents in India: discharge
scenario and case for participatory ecosystem specific local regulation. Futures 40(1):
56 - 69.
Rajendran P, Muthukrishnan J, Gunasekaran P (2003). Microbes in heavy metal
remediation. Indian Journal of Experimental Biology. 41: 935 - 944.
Rao MS, Gopalkrishnan R, Venkatesh BR (2001). Medical geology an emerging field
in environmental science. In National symposium on role of earth sciences. Integrated
and Related Social issues GSI Special. Publication No.65 (II).
Re V, Faye SC, Faye A, Faye S, Gaye CB, Sacchi E, Zuppi GM (2011). Water Quality
Decline in Coastal Aquifers under Anthropic Pressure: The Case of a Suburban Area
of Dakar (Senegal), Environmental Monitoring and Assessment 172 (1 - 4): 605 - 622.
Röllin HB, Rudge CV, Thomassen Y, Mathee Odland J.Ø (2009). Levels of toxic and
essential metals in maternal and umbilical cord blood from selected areas of South
Africa—results of a pilot study. Journal of Environmental Monitoring 11(3): 618 - 627.
Ryan MP, Adley CC (2010). Sphingomonas paucimobilis: a persistent Gram-negative
nosocomial infectious organism. Journal of Hospital Infection 75(3): 153 - 157.
SAGES (2013). Requirements for the Purification of Wastewater or Effluent. Gazette
No 9225, Regulation No 991, 18 May.
Samad M, Mahmud Y, Adhikary R, Rahman S, Haq M, Rashid H (2015). Chemical
profile and heavy metal concentration in water and freshwater species of Rupsha
River, Bangladesh. American Journal of Environmental Protection 3(6): 180 - 186.
Samad M, Mahmud Y, Adhikary R, Rahman S, Haq M, Rashid H (2015). Chemical
profile and heavy metal concentration in water and freshwater species of Rupsha
River, Bangladesh. American Journal of Environmental Protection 3(6): 180-186.
SANCOR (1984). Report of the ad hocworking committee. Lusher JA (Ed.).
Established by the Marine Pollution Committee of the South African National
141
Committee for Oceanographic Research, South African Network for Coastal and
Oceanic Research, 25.
Sandeep KP, Shweta T (2008). Physico-chemical analysis of ground water of selected
area of Ghazipur city- A case study. Nature and Science 6(4): 25 - 28.
Sangeeta P, Neha P (2015). Monitoring of Seasonal Variation in Physicochemical
Water Parameters in Nalasopara Region. Journal of Ecosystem and Ecography 5(1):
1.
Santona L, Castaldi P, Melis P (2006). Evaluation of the interaction mechanisms
between red muds and heavy metals. Journal of Hazardous Materials 136(2): 324-
329.
Sato T, Qadir M, Yamamoto S, Endo T, Zahoor A (2013). Global, regional, and country
level need for data on wastewater generation, treatment, and use. Agricultural Water
Management 130: 1 - 13.
Savenije HH, Van der Zaag P (2000. Conceptual framework for the management of
shared river basins; with special reference to the SADC and EU. Water policy 2(1):9 -
45.
Savini V, Catavitello C, Bianco A, Balbinot A, D'antonio D (2009). Epidemiology,
pathogenicity and emerging resistances in Staphylococcus pasteuri: from mammals
and lampreys, to man. Recent patents on anti-infective drug discovery 4(2): 123 - 129.
Seanego KG (2014). Ecological Status of the Sand River after the Discharge of
Sewage Effluent from the Polokwane and Seshego Wastewater Treatment Works
(Doctorate Dissertation, University of Limpopo).
Sedibeng District Municipality (2010). Integrated Development Plan. Vereeniging:
SDM.
142
Sekhar KC, Chary NS, Kamala CT, Raj DS, Rao AS (2004). Fractionation studies and
bioaccumulation of sediment-bound heavy metals in Kolleru Lake by edible
fish. Environment International 29(7): 1001 - 1008.
Sharma S, Dastidar MG, Sreekrishnan TR (2003). Biological removal of zinc from
wastewater using Aspergillus sp. European Journal of Mineral Processing and
Environmental Protection 3(1):1 - 8.
Shun‐Xing L, Hua‐Sheng H, Feng‐Ying Z, Nan‐Sheng D, Fang L (2007). Influence of
nitrate on metal sorption and bioaccumulation in marine phytoplankton, Dunaliella
salina. Environmental toxicology 22(6): 582 - 586.
Sibanda T, Chigor VN, Koba S, Obi CL, Okoh AI (2014). Characterisation of the
physicochemical qualities of a typical rural-based river: ecological and public health
implications. International Journal of Environmental Science and Technology 11(6):
1771 - 1780.
Sibeya C (2016). Assessment of the Performance of Wastewater Treatment Plants: A
case study of Gammams and Otjomuise Wastewater Treatment Plants in Windhoek,
Namibia. (Masters Dissertation, University of Zimbabwe).
Silver S (1996). Bacterial resistances to toxic metal ions – a review. Gene 179: 9 - 19.
Snyman HG, Van Niekerk AM, Rajasakran N (2006). Sustainable wastewater
treatment–what has gone wrong and how do we get back on track. In Proceedings of
the water Institute of South Africa (WISA) Conference. 21 -25 May, Durban.
Stanbridge HH (1976). History of Sewage Treatment in Britian. 5. Land Spreading.
Institute of Water Pollution Control, Maidstone, Kent, United Kingdom.
Stolberg F, Borysova O, Mitrofanov I, Barannik V, Eghtesadi P (2006). Global
international waters assessment Caspian Sea, regional assessment report, Sweden:
University of Kalmar.
143
Strauss M, Blumenthal UJ (1990). Human waste use in agriculture and
aquaculture. Utilization, practices and health perspectives, executive summary.
International Reference Center for Waste Disposal Report 9: 90.
Strydom JP, Britz TJ, Mostert JF (1997). Two-phase anaerobic digestion of three
different dairy effluents using a hybrid bioreactor. Water SA 23(2): 151 - 156.
Subhashini V, Swamy AVVS, Hema KR (2003). Phytoremediation emerging and
technology for the uptake of cadmium the contaminated soil by plant
species. International Journal of Environmental Research 4: 0976 - 4402.
Sukumaran D, Saha R, Saxena RC (2015). Performance Evaluation of Prevailing
Biological Wastewater Treatment Systems in West Bengal, India. 3(1):1 - 4.
Syed Zaghum Abbas, Mohd Rafatullah, Norli Ismail and Japareng Lalung (2014).
Isolation, Identification, characterization, and evaluation of cadmium removal capacity
of Enterobacter specie. Journal of Basic Microbiology 54: 1279 - 1287.
Tchounwou PB, Yedjou CG, Patlolla AK, Sutton DJ (2012). Heavy metal toxicity and
the environment. In Molecular, clinical and environmental toxicology133 - 164.
Springer, Basel.
Tebbutt THY (1983). Relationship between natural water quality and health. Paris:
UNESCO.
Tempelhoff J, Munnik V, Viljoen M (2007). The Vaal River Barrage, South Africa's
hardest working water way: an historical contemplation. TD: The Journal for
Transdisciplinary Research in Southern Africa 3(1):107 - 133.
Tempelhoff JW (2006). Water and the human culture of appropriation: the Vaal River
up to 1956. TD: The Journal for Transdisciplinary Research in Southern Africa 2(2):
431 - 452.
144
Teplitski M, Eberhard A, Gronquist MR, Gao M, Robinson JB, Bauer WD (2003).
Chemical identification of N-acyl homoserine lactone quorum-sensing signals
produced by Sinorhizobium meliloti strains in defined medium. Archives of
microbiology 180(6): 494 - 497.
The World Water Organization (TWWO) (2010). Water Facts and Water Stories from
Across the Globe.”
Thebe TA, Mangore EN (2012). Wastewater production, treatment, and use in
Zimbabwe. Department of Civil and Water Engineering, National University of Science
and Technology, Bulawayo.
Topare NS, Attar SJ, Manfe MM (2011). Sewage/wastewater treatment technologies:
a review. Scientific Reviews and Chemical Communications 1(1).
Tshwane University of Technology (2009). Integrated water management of the Vaal
River catchment. Pretoria: Civil Engineering..
Tyagi VK, Chopra AK, Durgapal NC, Kumar A (2007). Evaluation of Daphnia magna
as an indicator of toxicity and treatment efficacy of municipal sewage treatment
plant. Journal of Applied Sciences and Environmental Management 11(1).
Uaboi-Egbenni PO, Okolie PN, Martins O, Teniola O (2010). Studies on the
occurrence and distribution of heavy metals in sediments in Lagos Lagoon and their
effects on benthic microbial population. African Journal of Environmental Science and
Technology 4(6).
Ujang Z, Buckley C (2002). Water and wastewater in developing countries: present
reality and strategy for the future. Water Science and Technology 46(9):1 - 9.
United Nation (2012). Population connected to wastewater collecting system.
145
UN Department of Economic and Social Affairs, Division for Sustainable Development
(UNDESA-DSD), (2004). Sanitation Country Profile: Russian Federation.
UNECE (2003). Environmental Performance Reviews: Georgia. UN Publication,
NewYork and Geneva.
UNEP (2008). UN collaborative programme on reducing emissions from deforestation
and forest degradation in development countries (UN-REDD) framework document;
van der werf GR, Morton DC, DeFries RS, Olivier JG, Kasibhatla PS, Jackson RB,
Collatz JG, Randerson JT 737 - 738.
United Nations Environmental Protection/Global Program of Action (2004). Why The
Marine Environment Needs Protection from Heavy Metals, Heavy Metals 2004,
UNEP/GPA Coordination Office.
United Nations World Water Assessment Programme (2003). The World Water
Development Report 1: Water for People, Water for Life. UNESCO: Paris, France.
US Department of Health and Human Services (2008). Agency for Toxic Substances
and Disease Registry. Toxic substance portal: Formaldehyde. 4770 Buford Hwy NE,
Atlanta, GA 30341
United State Environmental Protection Agency (USEPA) (2004). Guidelines for Water
Reuse. EPA/625/R-04/108, USEPA, Washington, DC.
United State. Environmental Protection Agency (1996). Inductively Coupled Plasma-
Atomic Emission Spectrophotometry, Method 6010B, Revision 2.0, SW-846 Manual,
3rd edition, Office of Solid Waste and Emergency Response
USEPA (1992). U.S. Environmental Protection Agency, Office of Groundwater and
Drinking Water. Status Report on the Development of Draft MCLGs for Disinfectants
and By-Products. Washington, D.C.
146
USEPA (1995). Technical guidance manual for determining total maximum daily loads.
Book II: streams and rivers, part I; BOD, DO and Nutrients/Eutrophication.
Vaishali P, Punita P (2013). Assessment of seasonal variation in water quality of River
Mini, at Sindhrot, Vadodara. International journal of environmental sciences 3(5):
1424.
Valavanidis A, Vlachogianni T (2010). Metal pollution in ecosystems. Ecotoxicology
studies and risk assessment in the marine environment. Department. of Chemistry,
University of Athens University Campus Zografou, 15784.Athens, Greece.
Van der Hoek W (2004). A framework for a global assessment of the extent of
wastewater irrigation: the need for a common wastewater typology. Wastewater use
in irrigated agriculture: Confronting the livelihood and environmental realities.
Wallingford, UK: CABI Publishing11 - 24.
Van Vuuren L (2009). The state of water in South Africa – Are we heading for a crisis?
The Water Wheell 8(5): 31 - 33.
Varol M, Şen B (2012). Assessment of nutrient and heavy metal contamination in
surface water and sediments of the upper Tigris River, Turkey. Catena 92: 1 - 10.
Verandani S, Vardhan D (2012). Study of groundwater quality of Ulhasnagar city in
Thane district, Maharashtra, India using multivariate and microbial analysis. Research
Journal of Chemistry and Environment 16: 58 - 64.
Vodela JK, Renden JA, Lenz SD, McElhenney WH, Kemppainen BW (1997). Drinking
water contaminants (arsenic, cadmium, lead, benzene, and trichloroethylene).
Interaction of contaminants with nutritional status on general performance and immune
function in broiler chickens. Poultry Science 76(11): 1474 - 1492.
Vodela JK, Renden JA, Lenz SD, MchelHenney WH, Kemppainen BW (1997).
Drinking water contaminants. Poultry Science 76: 1474 - 1492.
147
Volesky B (1990). Biosorption and biosorbents. In biosorption of heavy metals, CRC
press, Florida 3 - 6.
Volesky B, Naja G (2007). Biosorption technology: starting up an enterprise.
International Journal of Technology Transfer and Commercialisation 6:196 - 211.
Waisberg M, Joseph P, Hale B, Beyersmann D (2003). Molecular and cellular
mechanisms of cadmium carcinogenesis. Toxicology 192(2): 95 - 117.
Wakelin SA, Macdonald LM, Rogers SL, Gregg AL, Bolger TP, Baldock JA (2008).
Habitat selective factors influencing the structural composition and functional capacity
of microbial communities in agricultural soils. Soil Biology and Biochemistry 40(3): 803
- 813.
Wang J, Chen C (2006). Biosorption of heavy metals by Saccharomyces cerevisiae:
a review. Biotechnology advances 24(5): 427 - 451.
Wang SL, Xu XR, Sun YX, Liu JL, Li HB (2013). Heavy metal pollution in coastal areas
of South China: a review. Marine pollution bulletin 76(1): 7 - 15.
Water Resource Department of Land and Water Bureau (WRDLWB), Ministry of Land,
Infrastructure, Transport and Tourism, Japan (2012). Water Resources in Japan,
2012.
Water wheel (2009). The state of water in South Africa. Water wheel 8(5): 31 - 33.
Watson C, Pulford ID, Riddell‐Black D (2003). Screening of willow species for
resistance to heavy metals: comparison of performance in a hydroponics system and
field trials. International Journal of Phytoremediation 5(4): 351 - 365.
WHO (1982). Rapid assessment of sources of air, water and land pollution, WHO
offset Publication, No. 62, England.
148
World Bank (2012). The World Bank data; GNI per capita, Atlas method (current US$).
Yabuuchi E, Kosako Y (2015). "Sphingomonas". Bergey's Manual of Systematics of
Archaea and Bacteria. John Wiley and Sons.
Yakimov MM, Golyshin PN, Lang S, Moore ER, Abraham WR, Lünsdorf H, Timmis KN
(1998). Alcanivorax borkumensis gen. nov., sp. nov., a new, hydrocarbon-degrading
and surfactant-producing marine bacterium. International Journal of Systematic and
Evolutionary Microbiology 48(2): 339 - 348.
Yi L, Jiao W, Chen X, Chen W (2011). An overview of reclaimed water reuse in China.
Journal of Environmental Sciences, 23(10): 1585 - 1593.
Zamxaka M, Pironcheva G, Muyima NYO (2004). Microbiological and physico-
chemical assessment of the quality of domestic water sources in selected rural
communities of the Eastern Cape Province, South Africa. Water SA 30(3): 333 - 340.