asset building: increasing capacity for performance
TRANSCRIPT

Per
C E N T E R F O R S O C I A L D E V E L O P M E N T
Asset Building:
Increasing Capacity for
formance Measurement and Effects
September 2004
Center for Social Development Washington University in St. Louis


Asset Building:
Increasing Capacity for Performance Measurement and Effects
Amanda Moore McBride Research Director
Stacie Lintvedt Hanson
Research Associate
Sondra Beverly Faculty Associate
Mark Schreiner Senior Scholar
Michael Sherraden
Director
Lissa Johnson Project Director
September 2004
Center for Social Development George Warren Brown School of Social Work
Washington University in St. Louis One Brookings Drive, Campus Box 1196
St. Louis, Missouri 63130 314-935-9778 phone, 314-935-8661 fax
[email protected] http://gwbweb.wustl.edu/csd
Portions of this report were prepared under Contract CNSHQCO3012 Corporation for National and Community Service


Table of Contents About the Center for Social Development………………........................................................................ i 1. Asset Building and Performance Measurement: An Introduction.......................................................3 Asset Building................................................................................................................................... 3 Performance Measurement................................................................................................................ 4 Theory-driven performance measurement..................................................................................4 Terminology and logic model framework.................................................................................. 4 2. Individual Development Account Programs: Effective Practices and Possible Outcomes.................7 Defining Individual Development Accounts.....................................................................................7 IDA Programs: Program Components and Effective Practices.........................................................7 Program expectations and rules.................................................................................................. 7 Asset incentives...........................................................................................................................8 Match rates..................................................................................................................................8 General financial education and asset-specific education...........................................................9 IDA program staff and peer support............................................................................................9 Recruitment and retention...........................................................................................................10 Costs and benefits........................................................................................................................10 Possible IDA Outcomes.....................................................................................................................11 Economic effects.........................................................................................................................11 Psychological, social, and civic effects.......................................................................................12 3. Individual Development Account Programs: Indicators for Performance Measurement....................13 Outputs...............................................................................................................................................13 Intermediate Outcomes......................................................................................................................15 End Outcomes....................................................................................................................................16 Community-level outcomes........................................................................................................ 17 4. Financial Education Programs: Effective Practices and Possible Outcomes.......................................19 Defining Financial Education............................................................................................................19 Financial Education Activities...........................................................................................................20 Teaching methods....................................................................................................................... 21 Cultural competence................................................................................................................... 21 Recruitment and retention...........................................................................................................22 Possible Financial Education Outcomes............................................................................................26 5. Financial Education Programs: Indicators for Performance Measurement.........................................27 Outputs...............................................................................................................................................27 Intermediate Outcomes......................................................................................................................28 Budgeting and monitoring...........................................................................................................28 Cash-flow management and basic banking.................................................................................28 Saving and investing................................................................................................................... 29 Credit.......................................................................................................................................... 29 End Outcomes....................................................................................................................................30 6. Housing and Homeownership Development Programs: Effective Practices and Possible
Outcomes...............................................................................................................................................33 Defining Housing and Homeownership Development......................................................................33 Cooperative housing strategies................................................................................................... 34 Homebuyer strategies................................................................................................................. 34 Housing and Homeownership Programs: Program Components and Effective Practices................ 35 Homeownership education and counseling................................................................................ 35 Possible Housing and Homeownership Outcomes............................................................................39
Center for Social Development Washington University in St. Louis
Potential outcomes for participants.............................................................................................39 Potential outcomes beyond the owners.......................................................................................40 7. Housing and Homeownership Development Programs: Indicators for Performance Measurement...41 Outputs...............................................................................................................................................41 Intermediate Outcomes......................................................................................................................43 End Outcomes....................................................................................................................................44 8. Microenterprise Programs: Effective Practices and Possible Outcomes.............................................47 Defining Microenterprise.................................................................................................................. 47 Microenterprise Programs: Program Components and Effective Practices.......................................47 Training.......................................................................................................................................48 Microfinance............................................................................................................................... 49 Social support..............................................................................................................................50 Possible Microenterprise Outcomes.................................................................................................. 52 Potential financial outcomes for participants..............................................................................52 Potential non-financial and “way-of-life” outcomes.................................................................. 52 Potential outcomes beyond the owners.......................................................................................53 9. Microenterprise Programs: Indicators for Performance Measurement............................................... 55 Outputs...............................................................................................................................................55 Human-capital outputs................................................................................................................ 55 Financial-capital outputs.............................................................................................................56 Social-capital outputs..................................................................................................................57 Intermediate Outcomes......................................................................................................................59 Human-capital intermediate outcomes........................................................................................59 Financial-capital intermediate outcomes.................................................................................... 60 Social-capital intermediate outcomes......................................................................................... 61 End Outcomes....................................................................................................................................61 End outcomes for employment................................................................................................... 61 End outcomes for income........................................................................................................... 62 End outcomes for asset accumulation.........................................................................................63 End outcomes for psychological and social well-being..............................................................64 References..................................................................................................................................................67 Appendix A Methods for Assessing Outputs and Outcomes of Asset-Building Programs......................79 Process Measurement.........................................................................................................................79 Data sources and methods...........................................................................................................80 Intermediate and End Outcome Assessments....................................................................................80 Data sources and methods...........................................................................................................81 Sample survey questions.............................................................................................................82 Research Designs...............................................................................................................................84 Cross-sectional design.................................................................................................................84 Pretest, posttest design................................................................................................................ 84 Retrospective pretest design........................................................................................................84 Example questions for a retrospective pretest design...........................................................85 Longitudinal design.....................................................................................................................85 Experimental design....................................................................................................................85
Center for Social Development Washington University in St. Louis

List of Tables
Table 3.1. IDA Programs: Outputs..........................................................................................................14 Table 3.2. IDA Programs: Intermediate Outcomes................................................................................. 15 Table 3.3. IDA Programs: End Outcomes...............................................................................................16 Table 3.4. IDA Programs: Possible Community-level Outcomes...........................................................18 Table 4.1. Selected Topics in Four Broad Areas of Basic Financial Education.......................................20 Table 4.2. Effective Practices in the Delivery of Financial Education.....................................................21 Table 4.3. Effective Practices in Recruitment and Retention...................................................................25 Table 5.1. Financial Education Programs: Outputs.................................................................................27 Table 5.2. Intermediate Outcomes of Budgeting and Monitoring Sessions.............................................28 Table 5.3. Intermediate Outcomes of Cash-Flow Management and Basic Banking Sessions.................29 Table 5.4. Intermediate Outcomes of Saving and Investing Sessions......................................................29 Table 5.5. Intermediate Outcomes of Credit Sessions..............................................................................30 Table 5.6. Basic Financial Education: End Outcomes.............................................................................31 Table 6.1. Homebuyer Training Topics Recommended by AHECTI......................................................36 Table 7.1. Housing and Homeownership Development Programs: Outputs...........................................42 Table 7.2. Housing and Homeownership Development Programs: Intermediate Outcomes..................43 Table 7.3. Housing and Homeownership Development Programs: End Outcomes................................45 Table 9.1. Microenterprise Programs: Human Capital Outputs...............................................................56 Table 9.2. Microenterprise Programs: Financial Capital Outputs...........................................................57 Table 9.3. Microenterprise Programs: Social Capital Outputs................................................................58 Table 9.4. Microenterprise Programs: Human Capital Intermediate Outcomes......................................60 Table 9.5. Microenterprise Programs: Financial Capital Intermediate Outcomes...................................61 Table 9.6. Microenterprise Programs: Social Capital Intermediate Outcomes....................................... 61 Table 9.7. Microenterprise Programs: End Outcomes for Employment................................................. 62 Table 9.8. Microenterprise Programs: End Outcomes for Income..........................................................63 Table 9.9. Microenterprise Programs: End Outcomes for Asset Accumulation..................................... 64 Table 9.10. Microenterprise Programs: End Outcomes for Well-being...................................................65
Center for Social Development Washington University in St. Louis


About the Center for Social Development The Center for Social Development (CSD) is an academic research center based at the George Warren Brown School of Social Work (GWB), Washington University in St. Louis. The Center began in 1994 with Michael Sherraden, Benjamin E. Youngdahl Professor of Social Development, as the founding director. Although relatively young as an organization, CSD has established itself as a leading academic center in social development both domestically and internationally. CSD has a multipurpose agenda encompassing social theory, research, policy innovation, projects in the community, and teaching. CSD projects connect academic and applied interests and build bridges across public, non-profit, and private sectors. Both academic excellence and real-world involvement are emphasized. The emphasis is on partnerships for joint study and joint action. CSD focuses on two primary areas of research, asset building and civic service. CSD is the leading academic center of theory and research on asset-building strategies for low-income, low-asset populations. Michael Sherraden introduced the term “asset-based policy.” CSD’s work has focused on asset accumulation, designing and testing subsidized (matched) savings in the form of Individual Development Accounts (IDAs). CSD applies research results on IDAs to asset building policies at state, national, and international levels. The Center also studies microenterprise, homeownership, and other innovative asset building strategies.
Center for Social Development Washington University in St. Louis

Asset Building: Increasing Capacity for Performance Measurement and Effects ii
Center for Social Development Washington University in St. Louis
1. Asset Building and Performance Measurement: An Introduction
Asset Building Since the 1990s, asset-building programs have emerged that aim to increase asset ownership among low-income individuals and households. Asset-building strategies have long been institutionalized for the non-poor in the form of mortgage tax deductions, Individual Retirement Accounts, 401(k)s, college saving plans, and small business loans. Although most of these asset schemes are “private,” they receive substantial funding through the federal tax system (Sherraden, 2001). In Assets and the Poor (1991), Michael Sherraden proposed that asset accumulation policies be expanded to include the poor. Assets and development, not income and maintenance, was the premise for this new approach to welfare. While income transfers have a role to play in meeting immediate needs, a long-term development approach emphasizes potential, opportunity, and investment. Ownership of assets1—be they savings, a home, or a small business—may lead to a range of positive social, economic, and civic effects (Boshara, Scanlon, & Page-Adams, 1998; Moore et al., 2002; Sherraden, 1991). Many community-based programs and federal demonstrations currently exist to provide low-income individuals and households with the opportunity to develop and acquire assets. Microenterprise and homeownership programs now take myriad forms, and are implemented across a range of institutional hosts. Program goals may include improving credit, providing access to credit, increasing financial management skills, and increasing savings and asset ownership. Individual Development Accounts (IDAs) represent one of the newest asset-building strategies, combining all such goals. IDAs are matched savings accounts for low-income individuals and households. The savings are used for home purchase, home repair, small business capitalization, and post-secondary education or job training. The 1996 Personal Responsibility and Work Opportunity Reconciliation Act authorized states to use portions of their federal Temporary Assistance to Needy Families grants for IDAs. In 1998, the federal Assets for Independence Act (AFIA) passed with bipartisan support, which provided $125 million in federal funding for IDA programs. Theory building and empirical evidence on “asset effects” are in the very early stages of specification and testing. Practitioners developed and implemented the first IDA programs just more than ten years ago. Microenterprise and homeownership programs have existed for decades, but they have a sparse knowledge base.
1 We use the term assets to refer to individual and household stocks of physical capital or financial wealth, because these have the most direct policy and program implications (Sherraden, 1991). We do not include community-level assets nor social capital, such as organizations or social networks.
Center for Social Development Washington University in St. Louis
Asset Building: Increasing Capacity for Performance Measurement and Effects 4
Performance Measurement2
Theory-driven performance measurement. Our preference in performance measurement is for theory-driven, evidence-based practice and research. We believe this is essential for development of meaningful and useful evaluation results and the development of the knowledge base on assets. There are both conceptual and practical pay-offs for specifying program theories. Questions regarding program performance are never asked in a vacuum (Sherraden et al., 1995). At the outset, program staff (or those requesting an evaluation) have ideas about what they are looking for, what the program is supposed to be doing and why. These ideas are, in fact, theories about the program and what it is supposed to be doing. Very often theories remain unspecified in performance measurement or evaluation studies. When ideas are specified as theories, the program design and program goals can be clearer. This clarity can lead to more specific outcome targets and more focused program operations. In turn, this can facilitate more effective program management and performance measurement. Another reason to “bother with theory” is that theoretically-based conclusions are stronger. Even with the most ideal performance indicators and evaluation designs (and they are never ideal), one can never be entirely certain that observed effects are the result of the program intervention. Some element of doubt always remains. However, the incorporation of theory into program design and performance measurement helps to reduce this doubt by adding theoretical logic, propositions, and predictions based on those propositions. Conclusions drawn from such a study carry more weight. While we do not propose theories of asset development or asset-ownership in this report, we encourage their use and development as the basis of any performance measurement. Terminology and logic model framework. We define performance measurement terminology here as it is used throughout the report. We rely on the standard definitions set-forth by Project Star (2003) and Harry Hatry and colleagues at the Urban Institute (2002). We also apply the logic model framework to our review of effective practices and recommendations for performance indicators. While we do not include example logic models for asset-building programs in this report, we suggest possible outputs and outcomes applicable to a range of asset-building programs. Because a logic model should be unique to a given program, staff and evaluators can draw from these lists to customize their performance measurement. The logic model, with its emphasis on goals, activities, and outcomes, promotes the articulation of program theory. The program staff or evaluator is forced to articulate program intentions. As the name implies, activities or services that are delivered as part of the program should logically target change in the given social or economic condition. Delivered services are measured as outputs. Outputs represent the amount or volume of services delivered by a program. Outputs presumably lead to intermediate and end outcomes.
2 In this report, we use the term “performance measurement” as it is the contemporary term in the research and evaluation nomenclature. It refers to the process of assessing program performance and effects. However, since this term is not yet well known among practitioners, “program evaluation” was used during data collection. The terms are used synonymously in this report.
Center for Social Development Washington University in St. Louis

Asset Building and Performance Measurement: An Introduction 5
Intermediate outcomes are changes in participants that contribute to end outcomes but are not typically viewed as ends in themselves. End outcomes are changes in attitudes, behaviors, or conditions that represent real improvements in the lives of participants or others. In the logic model framework, outcome indicators are measurable outcomes that reflect whether and to what extent goals have been achieved. For the measured indicators to be meaningful, however, research designs and methods must be rigorous enough to assess what has been implemented and whether changes are attributable to the program. This report is intended as a resource for the development and implementation of performance measurement in the asset-building field. It is divided by asset-building strategy: IDAs, financial education, housing and homeownership, and microenterprise. For each strategy, we review effective practices and possible outcomes, and suggest indicators for performance measurement. The indicators are grouped by possible outputs, intermediate outcomes, and end outcomes. These indicators reflect the diversity of asset programming. Depending upon the unique program context, administrators and researchers may select and apply the appropriate indicators.
Center for Social Development Washington University in St. Louis

Asset Building: Increasing Capacity for Performance Measurement and Effects 6
Center for Social Development Washington University in St. Louis

2. Individual Development Account Programs: Effective Practices and Possible Outcomes
In this section of the report, Individual Development Account programs (IDAs) are discussed. What is known about effective practices is presented, and possible outcomes are discussed. Following this, we suggest possible outputs and indicators for intermediate and end outcomes. Defining Individual Development Accounts IDAs were introduced by Sherraden (1991), who suggested that saving and asset accumulation depend not only on personal preferences but also on institutional structures. The middle and upper classes accumulate subsidized assets largely through federal and state tax deductions and other assistance such as direct deposits into 401(k)s. If those of low-income are presented with the opportunity for saving and investment, then they might also be able to accumulate assets and experience the economic, psychological, social, and civic effects that are attributed with asset ownership. Sherraden’s original proposal (1988, 1991) was for progressive, universal savings accounts. It was a large idea, which would take time to achieve. The asset-building community, especially microenterprise development practitioners, understood this vision and considered it viable. With the support of private foundations, they implemented a modified version of this idea in the form of community-based IDA programs. IDAs are matched savings accounts, which can be used for home purchase, post-secondary education, or microenterprise. These are known as the “big three” uses, but given the diversity of programs, many other uses exist, e.g., home repair, job training, retirement, etc. IDA programs are not just savings accounts, however; they are a “program bundle” (Schreiner et al., 2001). Most IDA programs include matching funds, financial education, asset-specific education, and staff and peer support. IDA Programs: Program Components and Effective Practices Because IDAs are a relatively new policy proposal, there is little research on effective practices. We depend heavily on findings from the first nationwide, multi-method study of IDAs, the American Dream Demonstration (ADD). Moreover, because IDA programs have components of microenterprise, housing and homeownership, and financial education programs, effective practices in these programs apply to IDAs as well. Reference the other asset sections of the report for more information. Program expectations and rules. Each IDA program sets its own rules and expectations for participation. Programs may require minimum monthly deposits, limited numbers of missed deposits or unmatched withdrawals, and a yearly maximum cap on the funds to be matched. A yearly match cap divided by 12 creates a monthly saving target for people to work toward to earn the maximum match. Raising the bar with higher monthly saving targets lays out a goal that people are likely to strive toward (Schreiner et al., 2001; Schreiner & Sherraden, forthcoming).
Center for Social Development Washington University in St. Louis

Asset Building: Increasing Capacity for Performance Measurement and Effects 8
Higher monthly saving targets are associated with increased net deposits (Schreiner et al., 2001), increased deposit frequency (Zhan, 2003), reduced dropouts (Schreiner & Sherraden, 2002), and decreased unmatched withdrawals (Sherraden, et al., 2001). IDA participants have expressed that the program is a unique opportunity, and they strive to meet the program’s expectations (McBride, Sherraden, Johnson, & Hanson, 2003; Sherraden, Williams, McBride, & Ssewamala, 2003). These findings suggest that people will rise to the expectations set for them, and higher savings targets may increase saving effects. Some programs also establish deadlines for using the matching funds. Because of limited funding, programs may find it necessary to impose such deadlines, but it is not the ideal condition to bring about long-term positive change for poor families. Because IDAs are run by local organizations without long-term funding, IDAs are seen by some as a short-term saving program, but this was never the intent. Ideally, participants should be allowed to save as long as they like without being forced to withdraw (Schreiner, et al., 2001). Some programs convey expectations and facilitate savings through reminders. If a participant has missed a deposit, the program may send a post-card via mail to remind the participant to save. The experimental research site in the American Dream Demonstration sent post-card reminders to participants each month, whether they missed a deposit or not. Participants report that the reminders help them to plan for and make their savings deposits (Sherraden, McBride, Johnson, & Hanson, forthcoming). Asset incentives. To use the matching funds, IDA participants select a specific asset goal. The asset goal may actually act as a stronger incentive than saving in general (Sherraden, McBride, Johnson, Hanson, & Sherraden, 2004). Participants express that the IDA is their chance to achieve the American Dream of buying a home or starting a business (McBride, Sherraden, Johnson, & Hanson, 2003; Sherraden et al., forthcoming). This incentive may promote asset accumulation while discouraging withdrawals for short-term needs. All of the participants in the Michigan IDA Partnership program agreed that saving for a specific asset is an incentive to save. However, these same participants were confused about the process for obtaining and using their matching funds, i.e., paying the asset provider with the matching funds; this process should be made explicit so that people can obtain their asset goals (Losby et. al., 2003). Match rates. Economic theory predicts that high match rates will increase the likelihood of saving, and IDA studies have supported this prediction. Higher match rates have been associated with being a “saver,” someone who has at least a net deposit of $100 in their IDA account (Schreiner and Sherraden, forthcoming). Higher match rates are also linked with a lower risk of unmatched withdrawals and exiting the program (Schreiner, et al., 2001; Schreiner & Sherraden, 2002). Participants respond to higher match rates by saving more frequently (Zhan, 2003), but high match rates are actually associated with lower savings (Curley & Grinstein-Weiss, 2003; Stegman, 2001; Schreiner et. al., 2001; 2002; Schreiner, 2004; Schreiner & Sherraden, forthcoming). A higher match rate allows a family to deposit less but accumulate more assets, therefore it may depress individual saving amounts (Schreiner, 2004). Despite this drawback, higher match rates may result in more savers, allowing more families to experience the financial and educational
Center for Social Development Washington University in St. Louis

Individual Development Account Programs: Effective Practices and Possible Outcomes
9
benefits of the program (Gorham, 2002; Schreiner & Sherraden, 2004). IDA participants view the matching funds as an incentive to develop and maintain a saving habit—96 percent of participants in the Michigan IDA Partnership believed that the average match rate of 2.5 to 1 made it easier for them to save (Losby, Hein, & Robinson, 2003). General financial education and asset-specific education. Although financial education alone may be considered an asset building strategy, IDA programs also incorporate financial education to help participants develop knowledge about their finances and savings. Financial education classes and requirements differ from program to program, but most include general financial education curricula as well as asset-specific education, such as how to obtain a home loan. Research demonstrates that net deposits increase with additional hours of financial education, including increased net IDA savings and net deposits (Curley & Grinstein-Weiss, 2003; Schreiner, et al., 2001; Schreiner & Sherraden, forthcoming; Sherraden, 2002; Stegman, et al., 2001; Zhan, 2003). Eighty-four percent of IDA participants in Michigan believed that the financial management classes helped them save, and 98 percent were satisfied with the financial management services (Losby et al., 2003). Asset-specific education is especially important in helping participants obtain their asset goals (Gorham et al., 2002). While financial education is critical to the success of IDA programs, many agencies find it difficult to develop and implement effective curricula (Mills et al., 2002). Some organizations may find that contracting with outside trainers is more effective and efficient (King, 2000). IDA program staff and peer support. Studies have found that staff support may contribute to participant success. Zhan (2003) found that additional staff hours for each single mother increased the deposit frequency, and many IDA participants, especially those who were less successful savers, wished for more assistance from staff (Lazear, 1999). Individual counseling and case management are often critical for participants who may be on the verge of dropping out (King, 2000; Mills et al., 2001; Schreiner & Sherraden, 2002; Schreiner et al., 2001; Stegman, et al., 2001). Some IDA participants find it difficult to save and make ends meet, and staff members should be upfront about the difficulties of saving while offering assistance and encouraging peer and mutual support (Losby et al., 2003). Mills et al. (2002) suggest that non-financial case management is most helpful for participants at the beginning and then also at the end of the program, orientating participants to program expectations as well as preparing them for their asset purchase. Intensive staffing increases the cost of administering an IDA program, and organizations should ensure that they have the resources to support an adequate number of knowledgeable employees (Gorham et al., 2002; King, 2000; Sherraden, 2002). Staff can help participants with specific tasks such as repairing credit, navigating the home loan process, and developing a small business (Lazear, 1999). In rural areas, where participants may be spread across a large geographical area and may lack reliable transportation, home visits to both potential and enrolled participants can provide increased motivation and may help address cultural barriers (Gorham et al., 2002).
Center for Social Development Washington University in St. Louis

Asset Building: Increasing Capacity for Performance Measurement and Effects 10
In addition to knowledgeable and accessible staff, IDA programs can also form community advisory committees to tap into external expertise. Such advisory boards have been influential in developing policies, recruiting partner organizations, developing financial education curricula, and grounding the program in the needs of the community (King, 2000; Mills, et al., 2002). Programs are sustained by community members who are involved in program planning and collaborative partnerships with banks and other local organizations (Gorham et al., 2002; King, 2000, Mills et al., 2000; Page-Adams, 2002). Recruitment and retention. IDA programs have found initial recruiting of participants a more difficult task than expected. Programs have been most successful in recruiting through targeted community groups and the organization’s current clients (Gorham et al., 2002; King, 2000; Mills et al., 2002; Page-Adams, 2002). The IDA program can be confusing to potential participants, who often think there is a “catch” or assume it is too good to be true (Sherraden, Hong, & Moore, 2000; Sherraden et al., forthcoming). Telephone and face-to-face contact with staff may be necessary (Lazear, 1999), as well as utilizing successful IDA graduates to market the program (Gorham et al., 2002). Many programs have found that recruitment is a slow process at first, but word-of-mouth soon spreads and acts as the most effective way to draw in participants (Mills et al., 2002). In regard to retention, some dropouts are likely inevitable due to family or financial emergencies or residential mobility, but certain program features may work to decrease the number of dropouts. Some of these have already been mentioned, such as higher match rates, increased monthly saving targets, and staff counseling. Programs can also decrease transaction costs by offering public transportation vouchers for attendance to financial education classes or setting up direct deposit transfers (Schreiner & Sherraden, 2002). Depositing the money in the bank should be a smooth and simple process for all participants. When retaining a certain participant is impossible, programs can make an effort to replace that person so as to make full use of the program and its resources (Gorham et al., 2002). Research findings are divided on the recruitment and retention of unsuccessful clients. Mills et al. (2002) recommends targeting individuals most likely to succeed, stating that experienced programs are less accommodating of clients who fail to meet requirements. Staff has discovered that even those with very low incomes can sustain a savings pattern, therefore continuing to assist unsuccessful accountholders is not an efficient use of resources (Mills et al., 2002). This strategy may be necessary for programs where time and funding is limited, but it is not conducive to the overall mission of IDA policies and programs. Not all individuals will be able to save at the same rate over the same time period, but low savers can still benefit from an institutionalized saving program (Schreiner et al., 2001; 2002), especially when intensive case management services are offered (Mills et al., 2001). Costs and benefits. IDAs are expensive programs because of their multiple components, making them labor intensive. Schreiner (2004) found that an IDA program in Tulsa, Oklahoma, cost $64 per participant-month. This is only one program, and different programs operate on different cost structures and distribute resources differently.
Center for Social Development Washington University in St. Louis

Individual Development Account Programs: Effective Practices and Possible Outcomes
11
While the costs in Tulsa exceeded the net deposits of the participants (Schreiner, 2000), it is “clear that IDA programs are aiming for more than savings balances” (Sherraden, 2000, p. 5). Programs aim to change behaviors and increase human capital, and it is likely that the benefits of IDAs are not simply financial, but psychological, social, and civic as well (McBride, 2003; McBride, Lombe, & Beverly, 2003; Sherraden, 2000; Sherraden et al., forthcoming). While these benefits are still being determined, program administrators must be aware of the costs and secure ongoing funding to ensure program stability (Gorham, et al., 2002; Losby, et al., 2003; Sherraden, 2002). “High touch” (intensive services) IDA programming at the community level will likely be too costly to go to a larger scale (Sherraden, 2000). There is a clear trade-off between effective program features such as staff involvement and financial education, and program cost. A key challenge is to figure out what program features have the most pay-off, for whom, and in what circumstances. Possible IDA Outcomes The outcomes expected from IDA programs are psychological, social, and civic as well as economic. It is important to recognize that there are IDA program effects, financial education effects, saving effects, and asset acquisition effects. Untangling these nuances is an important mandate for asset-building research. Reference the sections on microenterprise, housing and homeownership, and financial education regarding possible effects. In this section, we detail what is known regarding economic, psychological, social, and civic effects from IDA research. Economic effects. Studies have demonstrated that IDA programs help those of low income save and accumulate assets. Average net deposits per participant in the American Dream Demonstration (ADD), a nationwide demonstration of IDA programs, were $528, and total net deposits plus the savings match averaged $1,543 per participant (Schreiner et al., 2002). Controlling for other factors, income is not associated with being a “saver” or with net deposits in IDAs. Those with very low incomes save as successfully as others. Very low-income IDA participants save at a higher rate relative to their income. Those at 50 percent of poverty and below save more than 3 percent of their income, while those at 200 percent of poverty save about 1 percent of income. Controlling for other factors, past and current welfare recipiency is not associated with being a “saver” or net deposits in IDAs. Welfare recipients save as successfully as others. As of December 31, 2001, 32 percent of ADD participants had made a matched withdrawal, and the average withdrawal plus match was $2,586. These withdrawals were used for home purchase (28 percent), microenterprise (23 percent), post-secondary education (21 percent), and home repair (18 percent) (Schreiner et al., 2002). In a cross-sectional survey, respondents agreed that because of their IDA participation, they were more likely to work or stay employed (59 percent), work more hours (41 percent), and buy or renovate a home (73 percent) (Moore et al., 2002).
Center for Social Development Washington University in St. Louis

Asset Building: Increasing Capacity for Performance Measurement and Effects 12
However, some economic effects of IDA programs may not be as desirable. In this same survey of ADD participants, 35 percent of respondents reported that they were less likely to save outside of their IDA, and 30 percent agreed that they had less money for leisure than they would like. Nine percent had more difficulty paying their bills, and eight percent reported giving up food or other necessities for the IDA (Moore et al., 2002). Psychological, social, and civic effects. Other positive outcomes for IDA participants include psychological, social, and civic effects. An overwhelming majority of participants have reported positive psychological benefits (Moore et al., 2002), including feeling more confident about the future (93 percent), feeling more control over their lives (85 percent), and feeling more economically secure (84 percent). Qualitative evidence reinforces these survey findings. IDA participants report having more “hope” for their futures, and believe that because of the IDA they will be able to achieve their goals (Sherraden, Hong, & Moore, 2000; Sherraden et al., forthcoming). They also feel more secure about their futures, knowing that they have “money in the bank.” Participants believe that they are more likely to have good relationships with family members because of their IDA participation (Moore et al., 2002). Participants report sharing the saving process with their family members, involving spouses in establishing budgets and saving plans and involving children in purchasing decisions and making deposits (Sherraden et al., forthcoming). Some participants believe, because of consumption changes to increase their savings deposits, their family relations are improved, e.g., cooking dinner and renting a movie to watch at home instead of eating at a restaurant and seeing a movie at a theater (Sherraden et al., forthcoming). Participants report that they are more likely to be respected in their communities and involved in their neighborhoods (Moore et al., 2002). Findings are suggestive regarding the effect of new asset-ownership (small business ownership and homeownership) on parents’ voluntary involvement in their children’s educational and social activities (McBride, 2003).
Center for Social Development Washington University in St. Louis

3. Individual Development Account Programs: Indicators for Performance Measurement
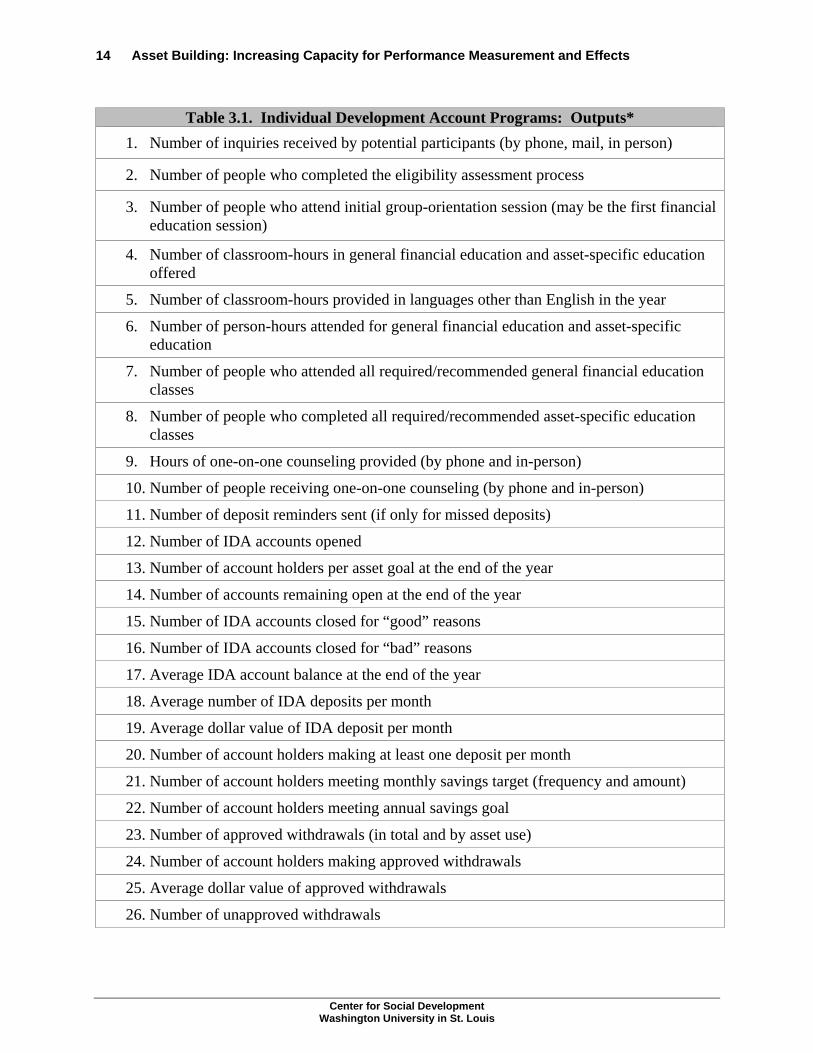
Based upon what is known about effective IDA practices and possible outcomes, this section offers suggestions for measuring outputs, intermediate outcomes, and end outcomes. These indicators may or may not be applicable to all IDA programs. As an asset-building strategy, IDA programs are discussed after microenterprise, housing and homeownership, and financial education, because depending on the IDA program design, the program will have features of each of these strategies. In this section, we report possible unique outputs and outcomes to the IDA program context. However, each of the previous asset strategy sections should be referenced for identification of other applicable indicators to a given program. Outputs The IDA “program bundle” includes multiple components, some of which relate to the specific asset goal. If one program allows participants to save for microenterprise and homeownership and provides services related to their purchase, then there are twice as many possible outputs. The range of possible outputs to track in IDA programs could be quite extensive (Table 3.1, plus comparable tables in chapters on microenterprise, financial education, and housing). Existing management information systems for IDAs, such as the Center for Social Development’s “MIS IDA,” allow for systematic tracking of program outputs. Outputs should be measured over a defined period of time, such as a calendar year or fiscal year. The outputs in Table 3.1 will likely come from administrative records or perhaps financial bank records. For many items, program staff must identify a specific population of IDA account holders to be used in calculations. We suggest that outputs like average number of IDA deposits per month and number of account holders meeting annual savings goal be calculated for people who had IDA accounts at the end of the year.
Center for Social Development Washington University in St. Louis
Asset Building: Increasing Capacity for Performance Measurement and Effects 14
Table 3.1. Individual Development Account Programs: Outputs* 1. Number of inquiries received by potential participants (by phone, mail, in person)
2. Number of people who completed the eligibility assessment process
3. Number of people who attend initial group-orientation session (may be the first financial education session)
4. Number of classroom-hours in general financial education and asset-specific education offered
5. Number of classroom-hours provided in languages other than English in the year
6. Number of person-hours attended for general financial education and asset-specific education
7. Number of people who attended all required/recommended general financial education classes
8. Number of people who completed all required/recommended asset-specific education classes
9. Hours of one-on-one counseling provided (by phone and in-person)
10. Number of people receiving one-on-one counseling (by phone and in-person)
11. Number of deposit reminders sent (if only for missed deposits)
12. Number of IDA accounts opened
13. Number of account holders per asset goal at the end of the year
14. Number of accounts remaining open at the end of the year
15. Number of IDA accounts closed for “good” reasons
16. Number of IDA accounts closed for “bad” reasons
17. Average IDA account balance at the end of the year
18. Average number of IDA deposits per month
19. Average dollar value of IDA deposit per month
20. Number of account holders making at least one deposit per month
21. Number of account holders meeting monthly savings target (frequency and amount)
22. Number of account holders meeting annual savings goal
23. Number of approved withdrawals (in total and by asset use)
24. Number of account holders making approved withdrawals
25. Average dollar value of approved withdrawals
26. Number of unapproved withdrawals
Center for Social Development Washington University in St. Louis

IDA Programs: Indicators for Performance Measurement 15
Table 3.1. Individual Development Account Programs: Outputs*
27. Number of account holders making unapproved withdrawals
28. Average dollar value of unapproved withdrawals *Refer to the microenterprise, housing, and financial education sections for other applicable outputs. Intermediate Outcomes Table 3.2 lists possible intermediate outcomes of IDA programs, based on common program components. These outcomes generally flow from the process of saving and preparing to make an asset purchase and/or from the education and support typically provided by IDA programs. They are classified as economic, personal or psychological, and related to the family or household. Information on intermediate outcomes is likely to require a survey of IDA participants perhaps compared to non-participants (See Appendix B).
Table 3.2. Individual Development Account Programs: Intermediate Outcomes*
1. Economic
• Saves regularly
• Increase in IDA assets accumulated
• “Protects” savings
• Number of non-asset related withdrawals from IDA savings per year
• Greater knowledge of financial matters
• More time spent on financial matters
• Improved consumption efficiency
• Decrease in use of second-tier financial services
• Plan for purchase of asset
• Plan for maintaining asset
2. Personal or psychological
• Improved self regard
• Improved outlook on life
• Greater sense of personal control over life
• Lengthened time horizons
Center for Social Development Washington University in St. Louis

Asset Building: Increasing Capacity for Performance Measurement and Effects 16
Table 3.2. Individual Development Account Programs: Intermediate Outcomes*
3. Family/Household
• Increased participation in household financial decision-making
• Children open savings accounts/save in some form
*Refer to the microenterprise, housing, and financial education sections for additional intermediate outcomes. Source: Sherraden (1991) and Sherraden et al. (1995). End Outcomes IDA programs and other asset-based policy strategies have multiple hypothesized end outcomes. The end outcomes specified below (Table 3.3) are expected to flow from the acquisition and ownership of a particular asset, e.g., home or small business. In large measure, research on asset effects is just emerging. Knowledge of asset effects will be refined and specified by the results of IDA and other asset-based policy demonstrations. Information on end outcomes is likely to come from survey data.
Table 3.3. Individual Development Account Programs: End Outcomes* 1. Economic
• Increase in non-IDA assets accumulated (other savings, financial investments, real property, car, durable goods)
• Greater effort and success in increasing asset values
• Maintenance and improvement of real property
• Decrease in financial crises in the household
• More investments in human capital
• Eventual increase in income
• Eventual decrease in "dependency" (public assistance as a percentage of income)
Center for Social Development Washington University in St. Louis

IDA Programs: Indicators for Performance Measurement 17
Table 3.3. Individual Development Account Programs: End Outcomes*
2. Social and civic
• Increase in social connectedness and/or decrease in social isolation
• Increase in caring for and helping others
• Involvement in neighborhood/community affairs
• Involvement in formal political processes
3. Household
• More constant household composition
• Decreased moving due to negative causes (unable to afford rent, eviction)
• Increased moving due to positive causes (move to a better neighborhood, move for a job)
• Decrease in domestic violence
4. Intergenerational
• Improved school behaviors (attendance, grades, completion)
• Avoiding pregnancy
• Fewer arrests
• Eventual financial well-being of offspring
• Increased savings behavior of offspring
• Increased investments in education of offspring
• Increased asset transfers to offspring *Refer to the microenterprise, housing, and financial education sections for additional end outcomes. Source: Sherraden (1991) and Sherraden et al. (1995). Community-level outcomes. Community effects are unlikely to occur unless asset-building programs involve a substantial proportion of people in a defined geographic area. Therefore, assessment of community effects, while important, will require extensive applications of IDAs. The best opportunity for measuring these effects would be a systematic multi-site demonstration that includes comparison communities. These potential effects might be identified as economic, community life, schooling, and civic and political affairs (Table 3.4).
Center for Social Development Washington University in St. Louis

Asset Building: Increasing Capacity for Performance Measurement and Effects 18
Table 3.4. Individual Development Account Programs:
Possible Community-level Outcomes 1. Economic
• Increased home-ownership rate
• More new housing construction or major remodeling
• Increased business investment in the neighborhood
• Increased economic activity in new or existing businesses
• Decreased unemployment
• Increase in average earnings
• Increase in access to first-tier financial services in the community
2. Community Life
• Houses in better repair
• Yards better kept
• Less clutter, junk on the street
• Social life in the neighborhood
• More people talking with neighbors
• More social events in the neighborhood
• More mutual support and “good neighborliness”
3. Schooling
• Reduced turnover in school population
• Better school attendance
• Better school performance (grades, test scores, completion)
4. Civic and Political Affairs
• More public meetings and discussions on issues
• More active civic associations
• Increases in contributions to political candidates or issues (both time and money)
• Increase in voting rate
Center for Social Development Washington University in St. Louis

4. Financial Education Programs: Effective Practices and Possible Outcomes
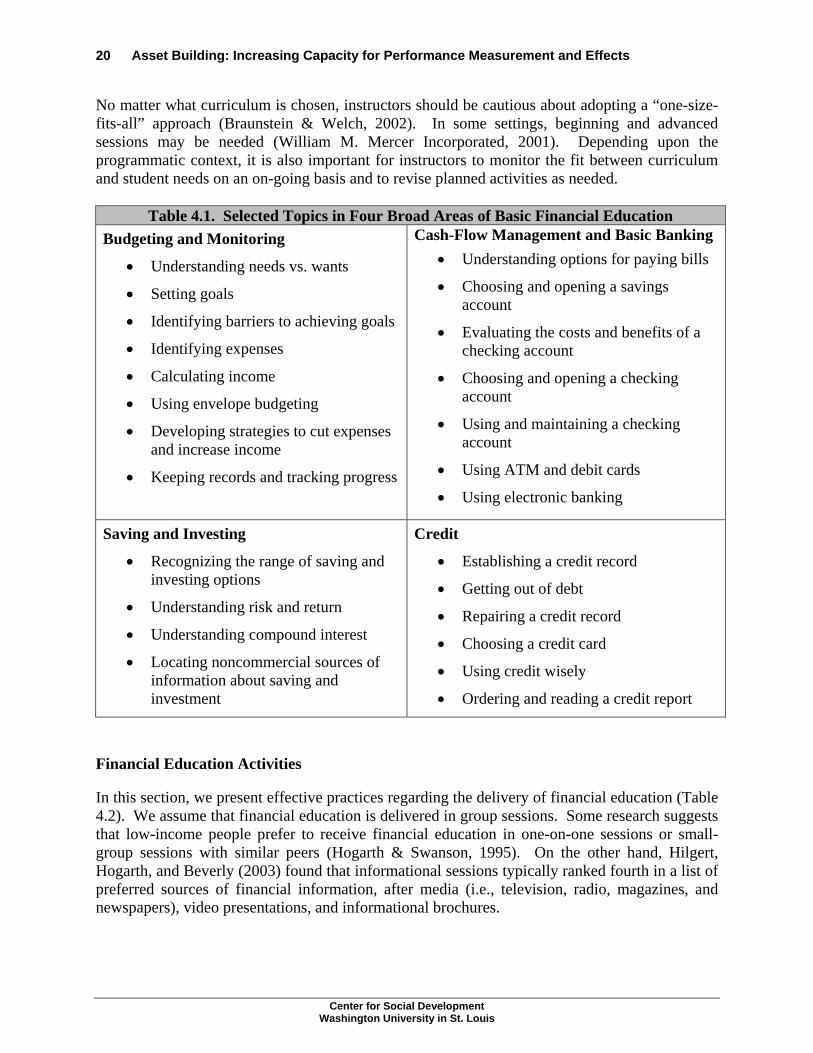
In this section of the report, financial education programs are discussed. What is known about effective practices is presented, and possible outcomes are discussed. Following this, we suggest possible outputs and indicators for intermediate and end outcomes. Defining Financial Education Financial literacy has been defined as “the ability to understand financial terms and concepts and to translate knowledge skillfully into behavior” (Jacob, Hudson, & Bush, 2000, p. 9). According to Vitt et al. (2000), a financially literate person “possesses knowledge of banking and credit, practices money management, understands the need for protection against unforeseen emergencies, plans for major life events, and saves and invests for the future” (p. 29). Financial education programs are essentially curricula designed to increase financial literacy. Most financial education programs are connected to another asset-building program, e.g., microenterprise, housing or homeownership development, or IDA programs. Basic financial education programs often cover four broad areas: budgeting and monitoring; cash-flow management and basic banking; saving (sometimes with investment); and credit.3 Table 4.1 lists topics that are common in each of these areas. The most important prerequisite for selecting topics for financial education sessions is for program designers to know the targeted audience (Anderson, Scott, & Zhan, 2002; Corporation for Enterprise Development, n.d.; Vitt et al., 2000). Students must perceive the topics as relevant to their current life experiences and needs. To meet this goal, education should be practical and applied, rather than abstract or “theoretical” (Anderson et al., 2002; Vitt et al., 2000). One important strategy is to focus on real-life tasks such as balancing a checkbook, buying a home, calculating needed savings, and identifying strategies for reducing expenses (Vitt et al., 2000). Many programs use an existing, “packaged” curriculum. Curricula designed for low-income learners include Money Smart (from the Federal Deposit Insurance Corporation), Your Money and Your Life (University of Illinois Extension and Financial Links for Low-Income People), Dollar Works (University of Minnesota Extension Service), and Making Your Money Work (Purdue University Extension Service). Vitt et al. (2000) note that the latter two curricula are designed to accommodate cultural differences among learners. The National Endowment for Financial Education (www.nefe.org) provides a list of financial education curricula. The Jump$tart Coalition for Personal Financial Literacy (www.jumpstart.org) provides a similar clearinghouse of resources for use in Kindergarten through 12th grade classrooms.
3 Less common areas of emphasis for basic financial education programs are insurance, tax planning, and retirement planning. Some targeted programs focus on asset-specific education for home ownership or small business ownership.
Center for Social Development Washington University in St. Louis
Asset Building: Increasing Capacity for Performance Measurement and Effects 20
No matter what curriculum is chosen, instructors should be cautious about adopting a “one-size-fits-all” approach (Braunstein & Welch, 2002). In some settings, beginning and advanced sessions may be needed (William M. Mercer Incorporated, 2001). Depending upon the programmatic context, it is also important for instructors to monitor the fit between curriculum and student needs on an on-going basis and to revise planned activities as needed.
Table 4.1. Selected Topics in Four Broad Areas of Basic Financial Education Cash-Flow Management and Basic Banking Budgeting and Monitoring
• Understanding needs vs. wants
• Setting goals
• Identifying barriers to achieving goals
• Identifying expenses
• Calculating income
• Using envelope budgeting
• Developing strategies to cut expenses and increase income
• Keeping records and tracking progress
• Understanding options for paying bills
• Choosing and opening a savings account
• Evaluating the costs and benefits of a checking account
• Choosing and opening a checking account
• Using and maintaining a checking account
• Using ATM and debit cards
• Using electronic banking
Saving and Investing
• Recognizing the range of saving and investing options
• Understanding risk and return
• Understanding compound interest
• Locating noncommercial sources of information about saving and investment
Credit
• Establishing a credit record
• Getting out of debt
• Repairing a credit record
• Choosing a credit card
• Using credit wisely
• Ordering and reading a credit report
Financial Education Activities In this section, we present effective practices regarding the delivery of financial education (Table 4.2). We assume that financial education is delivered in group sessions. Some research suggests that low-income people prefer to receive financial education in one-on-one sessions or small-group sessions with similar peers (Hogarth & Swanson, 1995). On the other hand, Hilgert, Hogarth, and Beverly (2003) found that informational sessions typically ranked fourth in a list of preferred sources of financial information, after media (i.e., television, radio, magazines, and newspapers), video presentations, and informational brochures.
Center for Social Development Washington University in St. Louis

Financial Education Programs: Effective Practices and Possible Outcomes 21
Table 4.2. Effective Practices in the Delivery of Financial Education 1. Teaching Methods
• Provide opportunities to learn by doing
• Use a variety of activities, including many that are interactive
• Emphasize having fun while learning
• Build on existing experiences, skills, and knowledge of learners
2. Cultural Competence • Choose instructors with extensive experience with the target audience
• Consider choosing instructors who are culturally, ethnically, and/or racially similar to the target audience
• Train instructors to understand differences in beliefs and life experiences between themselves and the target audience
• Use hand-outs and activities that are appropriate for the target audience
Teaching methods. The first four recommendations are inter-connected and relate to teaching methods. First, instructors should provide many opportunities to learn by doing. For example, students should be able to participate in real or simulated financial activities such as making a budget, opening an account, making deposits, and reviewing a credit report (Anderson et al., 2002; Brobeck, 2002, February 6; Hogarth & Swanson, 1995; Vitt et al., 2000). As this recommendation implies, sessions should not be lecture-oriented. Instead, instructors should use a variety of activities, including facilitated group discussion, individual exercises, small group exercises, case studies, role plays, games, and field trips (Corporation for Enterprise Development, n.d.; Vitt et al., 2000; William M. Mercer Incorporated, 2001).4 Instructors should emphasize having fun while learning and allow plenty of time for interaction (Corporation for Enterprise Development, n.d.). Finally, instructors should identify, draw out, and build on the existing skills, experiences, and knowledge of participants (Corporation for Enterprise Development, n.d.). When these standards are met, the education is likely to be interesting, relevant, and accessible to students. Cultural competence. The next four best practices fall into the category of cultural competence, that is, the ability to provide services that are sensitive to the needs of service recipients. If standards regarding cultural competence are not met, financial education is unlikely to be effective. At worst, the experience may alienate students and discourage them from seeking financial education in the future. Selection of instructors (and other presenters) is key to cultural competence. The ideal instructor will have extensive experience with the target audience (William M. Mercer Incorporated, 2001). It is often helpful if instructors are culturally and ethnically or racially similar to students 4 Anderson et al. (2002) have suggestions for how to introduce, monitor, and discuss exercises.
Center for Social Development Washington University in St. Louis

Asset Building: Increasing Capacity for Performance Measurement and Effects 22
(Toussaint-Comeau & Rhine, 2000). In any case, instructors and presenters must be sensitive to the cultural background, educational background, and life experiences of participants (Schuchardt, Marlowe, Parker, & Smith, 1991; Vitt et al., 2000; William M. Mercer Incorporated, 2001). Presenters should also understand the differences in values, beliefs and experiences between themselves and their audiences (Schuchardt et al., 1991). Finally, the language used in presentations, hand-outs, and in-class activities must be appropriate for the target audience (Corporation for Enterprise Development, n.d.; Jacob et al., 2000; Vitt et al., 2000). Packaged curricula targeted to low- and moderate-income consumers are typically designed for those who read at an 8th grade level or below. When participants do not speak English well, written and oral translation may be needed (Toussaint-Comeau & Rhine, 2000). Recruitment and retention. To be successful, financial education programs are likely to need a well-designed recruitment and retention plan. In the first year of a program sponsored by Financial Links for Low-Income People (FLLIP), staff reported that recruitment was harder than anticipated, and 40 percent of participants dropped out before completing the financial management training (Anderson et al., 2002). This section describes effective practices in recruitment and retention (Table 4.3). Marketing. Programs often recruit participants by handing-out flyers to current agency clients, posting flyers in public places frequented by the target audience, and advertising in the media, but the FLLIP experience suggests that additional marketing may be needed. According to Anderson et al. (2002), media advertisement should be considered an initial step, to publicize the program to community leaders and service providers. Seeking referrals from other social service agencies is an important additional strategy. Anderson et al. (2002) suggest making personal visits to multiple agencies (e.g., making presentations at agency staff meetings) and making regular phone calls to remind staff to make referrals. Although posting flyers and giving flyers to current clients are insufficient strategies, flyers are an important recruitment tool. Flyers should reflect reasons that people commonly seek financial education, including credit problems, financial crises, and the desire for home ownership (Vitt et al., 2000). For example, FLLIP flyers often began with attention-getting questions such as “Dream of owning a home?” “Need to get out of debt?” and “Financial problems weighing you down?” (Anderson et al., 2002). Flyers should also include information about benefits participants can expect (Toussaint-Comeau & Rhine, 2000; Vitt et al., 2000; William M. Mercer Incorporated, 2001). According to Anderson et al. (2002), flyers and brochures should also mention the availability of child care, transportation assistance, and any incentives. They should note that training is free, that no prior knowledge of financial matters is expected, and that trainers are friendly and/or come from the community. Finally, Anderson et al. (2002) offer the following formatting recommendations:
• Place the most desirable benefits of the program in bold and in large print • Put contact information in large print • Use simple language • Avoid crowding the flyer with too much information
Center for Social Development Washington University in St. Louis

Financial Education Programs: Effective Practices and Possible Outcomes 23
To achieve the latter, Anderson et al. suggest including only basic information in the flyer and creating a brochure with more information, to be given to those who express interest. First session. Research suggests that the first session is critical. Even more than other sessions, the first class needs to be fun and informative (William M. Mercer Incorporated, 2001). Anderson et al. suggest using the time to introduce instructors, discuss what participants hope to learn, describe the overall purpose of the training and how participants should benefit, and facilitate entertaining exercises. Another strategy is to have past participants describe how they have benefited from the program (William M. Mercer Incorporated, 2001). Logistics. Financial education sessions should be convenient, inexpensive, and non-intimidating. Sessions should take place in familiar, convenient settings, such as community centers, churches, schools, and libraries (Toussaint-Comeau & Rhine, 2000; William M. Mercer Incorporated, 2001). Sessions should be scheduled with the needs of the target audience in mind. It may be necessary to offer classes at a variety of times (Toussaint-Comeau & Rhine, 2000). Research also shows that programs should provide child care, especially for evening and weekend sessions (Toussaint-Comeau & Rhine, 2000), and reimburse transportation costs (Anderson et al., 2002). Some simple practices regarding logistics are likely to reduce drop-out rates. First, some suggest offering fewer but longer sessions (e.g., four two-hour sessions, rather than eight one-hour sessions) because attrition increases with the number of sessions (William M. Mercer Incorporated, 2001). Second, program staff should make reminder phone calls to participants before each session (Anderson et al., 2002). Third, those who miss sessions should be allowed to attend make-up sessions (Anderson et al., 2002). Incentives. Another important recruitment strategy is to offer incentives for participation (Toussaint-Comeau & Rhine, 2000; William M. Mercer Incorporated, 2001). Simple incentives include refreshments and door prizes. Course-related incentives, such as a free credit report, an individual credit-counseling session, and help in opening an account, may also be effective. Simple incentives are recommended above to recruit participants. Some suggest that simple incentives like calculators, note pads, and nice folders also increase retention by creating a sense of professionalism and pride in participation (Anderson et al., 2002). Other incentives could be tied to program completion. For example, those who complete the program might receive a certificate as well as a gift card or cash payment. In addition, program staff might arrange for a local bank to provide stream-lined account opening for those who have earned the program certificate (Anderson et al., 2002).
Center for Social Development Washington University in St. Louis

Asset Building: Increasing Capacity for Performance Measurement and Effects 24
Instructor-participant relationship. The final effective practice regarding retention emphasizes the relationship between instructor and participants. Drop-out is probably less likely when instructors have good rapport with participants (Anderson et al., 2002). In addition, participants are more likely to remain interested and motivated when instructors regularly ask about their needs and interests and continue to adjust the training to the knowledge and skills of participants (Anderson et al., 2002). These best-practice recommendations come from experience in the field and so are likely to improve recruitment and retention, but it is also important to consistently monitor recruitment and retention efforts and to make modification as necessary (Anderson et al., 2002). Jacob et al. (2002) provide a monitoring tool. This form asks, for example, what marketing strategies were used, which seemed to be most effective, what incentives were offered, and how many participants took advantage of these incentives.
Center for Social Development Washington University in St. Louis

Financial Education Programs: Effective Practices and Possible Outcomes 25
Table 4.3. Effective Practices in Recruitment and Retention
1. Marketing
• Seek referrals from other social service agencies
• Advertise extensively, using a variety of channels
• Consider common motivators for attendance 2. First Session
• Make the first session especially fun and interactive • Stress the benefits learners can expect from participation
3. Logistics • Provide sessions in convenient, familiar settings
• Offer sessions at a variety of times
• Provide child care
• Reimburse transportation costs
• Offer fewer (but longer) sessions
• Make reminder calls before each session
• Allow participants to make up missed sessions
4. Incentives
• Offer refreshments and door prizes
• Provide course-related incentives, such as a free credit report or credit counseling
• Provide simple incentives that create a sense of professionalism and pride
• Offer incentives for program completion
5. Instructor-Participant Relationship
• Develop relationships with participants
• Continue to adjust training to the needs and interests of participants
Center for Social Development Washington University in St. Louis

Asset Building: Increasing Capacity for Performance Measurement and Effects 26
Possible Financial Education Outcomes Programs that attempt to improve well-being through education typically aim to change knowledge, attitudes, and behaviors. The ultimate goal of financial education should be behavioral change (Brobeck, 2002, February 6) because it is change in financial behavior (e.g., better cash-flow management; decreased reliance on payday loans; increased saving) that may help improve individual and family well-being. Increased knowledge may be necessary to achieve this goal if people do not have enough information to evaluate the costs and benefits of a particular behavior (e.g., choosing among various account options) or if they do not know how to follow a recommended practice (e.g., opening an account or reconciling a bank statement). In some cases, attitudinal change may also facilitate behavioral change. Some people may have learned to devalue saving and thus may benefit from messages that reinforce the value of saving. The America Saves campaign uses social marketing strategies (mass advertising and encouragement from churches, employers, and other organizations) to persuade people to place greater value on saving (Brobeck, 2002, February 6). Others may believe that they are unable to achieve even reasonable financial goals. With this in mind, some researchers say that financial education programs should attempt to increase self-esteem and self-efficacy (Vitt et al., 2000; William M. Mercer Incorporated, 2001)
Center for Social Development Washington University in St. Louis

5. Financial Education Programs: Indicators for Performance Measurement
Based on what is known about effective financial education practices and possible outcomes, this section offers suggestions for measuring outputs, intermediate outcomes, and end outcomes. These indicators may or may not be applicable to all programs. In constructing program logic models, indicators unique to the program context can be applied. Outputs Table 5.1 suggests outputs to measure and monitor. We consider these to be example outputs; program staff should choose outputs that reflect the goals, structure, and activities of the sessions they provide. This is especially true for items 6 through 9 in Table 5.1. Outputs should be measured over a defined period of time, such as a calendar year or a fiscal year. A session is defined as a single meeting (e.g., a two-hour class on choosing and opening a checking account). A series is defined as a set of sessions designed to be attended by a single participant. For example, a series might include six two-hour sessions, covering budgeting, banking, saving, and credit. A classroom-hour is an hour of financial education provided, regardless of the number of people in attendance. A person-hour is one hour spent in attendance by one student. Thus, ten people attending a single two-hour session counts as two classroom-hours and 20 person-hours. If a program targets particular demographic groups, items 4 through 9 might be broken into sub-categories. For example, for item 4, a program might monitor the number of immigrants or the number of low-income individuals who attended at least one session.
Table 5.1. Financial Education Programs: Outputs 1. Number of series offered
2. Number of sessions offered
3. Number of classroom-hours offered (in selected topic areas and in total)
4. Number of people who attended at least one session
5. Number of person-hours attended
6. Number of people who attended 80 percent of sessions in a given series
7. Number of people who received eight hours of education
8. Number of people who received a credit report
9. Number of people who visited a local bank branch
Center for Social Development Washington University in St. Louis

Asset Building: Increasing Capacity for Performance Measurement and Effects 28
Intermediate Outcomes Intermediate outcomes are changes in knowledge, attitudes, and behaviors that are not typically viewed as ends in themselves. Most intermediate outcomes are curriculum-dependent; that is, they reflect the content covered in a particular financial education session or series. In this subsection, we present intermediate outcomes separately for the four broad areas of financial education. Again, these should be viewed as example outcomes. Budgeting and monitoring. The first intermediate outcome for budgeting and monitoring involves setting specific goals, such as paying off a $3,000 balance on a high-interest credit card within one year (Table 5.2). Stating a goal—and calculating the savings necessary to achieve it—facilitate positive thinking and create an incentive for action (O'Neill, 2002). The second outcome involves creating a written budget or spending plan. According to O’Neill (2002), “spending plans help people make spending choices, prioritize needs and wants, live within their income, and accumulate savings for ‘big ticket’ financial goals” (p. 54). The third and fourth outcomes allow individuals to monitor progress toward their financial plans and goals. The remaining outcomes relate to reducing expenses, something that is often necessary before people can save.
Table 5.2. Intermediate Outcomes of Budgeting and Monitoring Sessions 1. Have written financial goals
2. Have a written budget or spending plan for the year
3. Keep written records of spending
4. Compare planned spending to regular spending
5. Compare prices when shopping
6. Use coupons when grocery shopping
7. Can prioritize spending, putting “needs” before “wants”
8. Understand the expenses of paying bills late (e.g., late fees, finance charges, disconnection fees, fees to re-establish services, repossession)
9. Understand that small reductions in weekly spending can add up to large increases in saving over time
Cash-flow management and basic banking. Because paying bills is a primary component of cash-flow management, the first intermediate outcome for cash-flow management and basic banking is knowledge of options for paying bills (e.g., envelope budgeting and cash payment; payment by check, credit card, or electronic banking). The remaining outcomes involve knowledge and skills that are assumed to be prerequisites for successful account ownership (Table 5.3).
Center for Social Development Washington University in St. Louis

Financial Education Programs: Indicators for Performance Measurement 29
Table 5.3. Intermediate Outcomes of Cash-Flow Management and
Basic Banking Sessions 1. Understand options for paying bills
2. Understand the costs of check cashing outlets
3. Can choose an appropriate savings account
4. Can open a savings account
5. Understand the benefits and costs of checking accounts, including overdraft fees
6. Can choose an appropriate checking account
7. Can open a checking account
8. Can manage and maintain a checking account
9. Understand the benefits and costs of ATM and debit cards
10. Can manage an ATM or debit card Saving and investing. The intermediate outcomes for saving and investing involve knowledge and skills that presumably help motivate people to save, help them “find” money to set aside, and help them choose appropriate saving and investing products (Table 5.4).
Table 5.4. Intermediate Outcomes of Saving and Investing Sessions 1. Understand the benefits of direct deposit
2. Can identify sources of saving (e.g., reductions in expenses; “extra” money from raises, bonuses, or tax refunds)
3. Understand the costs and benefits of a range of saving and investment vehicles
4. Understand the relationship between risk and return
5. Understand compound interest
6. Can locate non-commercial sources of information about saving and investment Credit. The intermediate outcomes for credit involve knowledge and skills that presumably help people establish and maintain a good credit record, choose appropriate loans, and use credit cards and other forms of credit wisely (Table 5.5)
Center for Social Development Washington University in St. Louis

Asset Building: Increasing Capacity for Performance Measurement and Effects 30
Table 5.5. Intermediate Outcomes of Credit Sessions
1. Understand the importance of a good credit record
2. Understand steps to establish a credit record
3. Understand steps to repair a credit record
4. Can order a credit report
5. Can read a credit report
6. Can correct errors on a credit report
7. Understand the different types of loans
8. Can evaluate loan rates, terms and fees (including payday loans and rent-to-own services)
9. Can evaluate credit card rates, terms, and fees
10. Understand the costs of making minimum payments on credit cards
11. Understand the effect of high levels of debt on financial resources End Outcomes End outcomes are changes that are meaningful in and of themselves. Table 5.6 lists example end outcomes for basic financial education programs. (Many of these outcomes were adapted from (O'Neill, 2002)). As noted earlier, the ultimate goal of financial education is usually behavior change, so most of the end outcomes reflect behavior, or conditions that reflect behavior (as well as knowledge, resources, constraints, and opportunities). These outcomes are grouped together in a single table because they are inter-related and because each can be linked to financial education sessions on multiple topics. For example, a family must have positive cash flow to get out of debt, and reducing debt increases opportunities for saving. The first two outcomes relate to budgeting and cash-flow management. They are minimum requirements for financial health. The third outcome is important because account ownership reduces the cost of routine financial transactions like check-cashing and bill-paying (Consumer Federation of America, 1997) and helps people build a credit history (Caskey, 1997). Account ownership is also an important early step toward asset accumulation (Beverly, McBride, & Schreiner, 2003). The next four outcomes relate to saving. Financial experts commonly view an emergency fund as a first savings priority. (Definitions of adequacy vary depending on factors such as number of earners in the household, ability to reduce expenses, and access to credit, but a common guideline is to set aside money to cover three months of living expenses (Mason & Griffith, 1998).) Most people have short-term goals, like purchasing a car, moving, or going on vacation, that require short-term savings. Most people also need or want to save for long-term goals, such as retirement for themselves or education for their children. Saving regularly is often the best
Center for Social Development Washington University in St. Louis
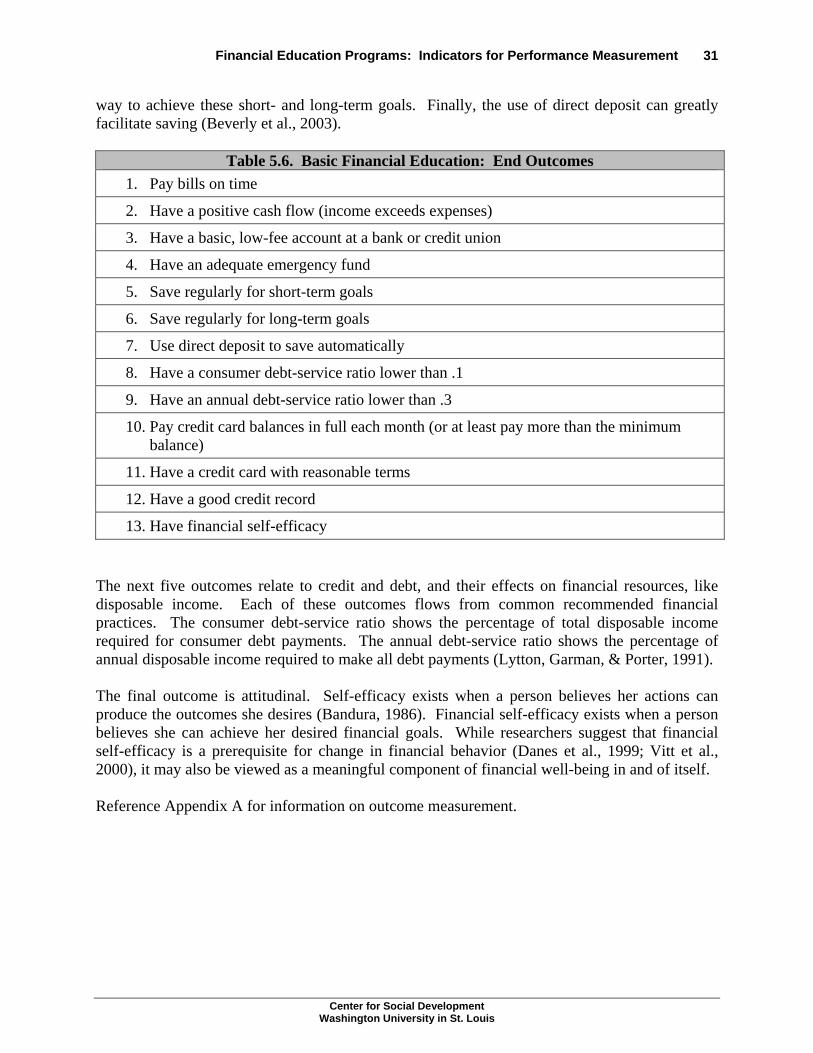
Financial Education Programs: Indicators for Performance Measurement 31
way to achieve these short- and long-term goals. Finally, the use of direct deposit can greatly facilitate saving (Beverly et al., 2003).
Table 5.6. Basic Financial Education: End Outcomes 1. Pay bills on time
2. Have a positive cash flow (income exceeds expenses)
3. Have a basic, low-fee account at a bank or credit union
4. Have an adequate emergency fund
5. Save regularly for short-term goals
6. Save regularly for long-term goals
7. Use direct deposit to save automatically
8. Have a consumer debt-service ratio lower than .1
9. Have an annual debt-service ratio lower than .3
10. Pay credit card balances in full each month (or at least pay more than the minimum balance)
11. Have a credit card with reasonable terms
12. Have a good credit record
13. Have financial self-efficacy The next five outcomes relate to credit and debt, and their effects on financial resources, like disposable income. Each of these outcomes flows from common recommended financial practices. The consumer debt-service ratio shows the percentage of total disposable income required for consumer debt payments. The annual debt-service ratio shows the percentage of annual disposable income required to make all debt payments (Lytton, Garman, & Porter, 1991). The final outcome is attitudinal. Self-efficacy exists when a person believes her actions can produce the outcomes she desires (Bandura, 1986). Financial self-efficacy exists when a person believes she can achieve her desired financial goals. While researchers suggest that financial self-efficacy is a prerequisite for change in financial behavior (Danes et al., 1999; Vitt et al., 2000), it may also be viewed as a meaningful component of financial well-being in and of itself. Reference Appendix A for information on outcome measurement.
Center for Social Development Washington University in St. Louis

Asset Building: Increasing Capacity for Performance Measurement and Effects 32
Center for Social Development Washington University in St. Louis

6. Housing and Homeownership Development Programs: Effective Practices and Possible Outcomes
In this section of the report, housing and homeownership development programs are discussed. What is known about effective practices is presented, and possible outcomes are discussed. Following this, we suggest possible outputs and indicators for intermediate and end outcomes. Defining Housing and Homeownership Development Housing and homeownership development encompasses a large programmatic category from rent subsidies to home loans and cooperatives to new home construction. The intent of all strategies is to create access to affordable housing for low-income individuals and families. Since the 1930s, the federal government has led efforts to provide low-income families with affordable, permanent housing. These efforts have taken the form of public housing developments or subsidies provided to private developers and landlords (Salsich, 1989). Traditionally, federally-funded affordable housing has focused on assisting families with rent rather than homeownership. While rental subsidies provide families with temporary shelter, they do not offer them the economic, legal, and social benefits of owning their own home (Johnson & Sherraden, 1992). In the late 1980s and 1990s, the federal government became increasingly interested in helping low-income families become homeowners. In 1990, the National Affordable Housing Act contained the HOPE Initiatives, which were designed to open some federally-owned housing units for low-income families to purchase (Rohe & Stegman, 1992). These somewhat unsuccessful attempts to sell public housing units coincided with a decrease in federal funding and public support for housing subsidies, and local non-profit organizations increasingly stepped in to meet low-income housing needs (Balfour & Smith, 1996; Salsich, 1989). Nonprofit organizations now play a significant role in providing affordable housing in cities and communities across the nation. These housing organizations take a number of different forms and have diverse purposes—some are large umbrella organizations that provide many different services across a city or region, while others are small agencies with a mission to serve a particular population or neighborhood. Because of their identification with the community, nonprofit housing organizations are often able to combine community development techniques with housing provision (Salsich, 1989). While these organizations provide all forms of affordable housing, from rented apartments to new home purchases, this section will focus on homeownership programs, which help low-income families obtain affordable housing through ownership. We focus on cooperative housing and homebuyer strategies such as lease-purchase and matched downpayment programs.
Center for Social Development Washington University in St. Louis

Asset Building: Increasing Capacity for Performance Measurement and Effects 34
Cooperative housing strategies. Cooperative housing (“co-ops”) provides families with the opportunity to own a share of stock in a housing corporation. Co-ops may be used as a viable and affordable alternative to renting for families who may not be ready or credit-eligible for homeownership. Six basic principles provide a framework for co-op housing operations: (1) open and voluntary membership; (2) democratic control; (3) limited rate of return on investment; (4) return of surplus to members; (5) cooperation between cooperatives; and (6) constant education (Helm, Horvitz, & Ben-Egypt, 1993, p. 238-239). Because co-op members are owners of the corporation, there is a sense of pride and community, which may translate into better maintenance and less crime and vandalism. The monthly housing costs are comparable or lower than similar rental units, and members have the advantage of contributing toward their asset rather than a landlord’s. Members are also eligible for tax deductions for their shares of the mortgage interest and property taxes (Helm et al., 1993). An example of a successful co-op housing development is the redevelopment of the Ellen Wilson Dwellings in Washington, DC, a former public housing project that had been abandoned and dilapidated. The redevelopment plan was conceived and implemented by neighborhood residents and former public housing tenants, who worked with community leaders to propose a development that would enhance the neighborhood. The Dwellings were transformed into mixed-income townhomes that are integrated, both architecturally and socially, into the existing neighborhood (Holin & Amendolia, 2001). Homebuyer strategies. There are a myriad of homeownership programs operating across the country, but lease-purchase and matched downpayment programs are common ways to prepare low-income families for homeownership. Both programs emphasize homeownership preparation through financial education and home maintenance training (Baker et al., 2002; Balfour & Smith, 1996; Weber & Smith, 2003). Under lease-purchase arrangements, tenants in good standing may take ownership of a unit after a certain period of time. Rental payments are viewed as payment against the home debt, and tenants are required to perform designated maintenance duties, but they are not allowed to take federal tax deductions for this investment (Balfour & Smith, 1996). Because lease-purchase programs follow a family for a significant period of time, homeownership preparation is combined with social services designed to create family self-sufficiency. These programs are often targeted toward individuals who are financially ready to purchase a home and are working towards economic stability. Matched downpayment programs help low-income families purchase homes by negotiating the lending process and offering financial assistance with the downpayment (Baker et al., 2002). Examples include IDA programs. Matched downpayment programs are more short-term than lease-purchase programs, and there is heavy emphasis on credit establishment and credit repair. Very poor families with bad credit may not be eligible for immediate homeownership (Baker et al., 2002).
Center for Social Development Washington University in St. Louis

Housing and Homeownership Programs: Effective Practices and Possible Outcomes 35
Housing and Homeownership Programs: Program Components and Effective Practices Although there are many different types of programs for potential homebuyers, most include the following components: marketing, education and counseling, and assistance with the purchase process (e.g., home search, finance options, sales contract, inspection, closing). For most organizations, assistance with the purchase process consists of referrals to real estate agents, lenders, and inspectors. In addition, staff are usually available to answer questions and address concerns. Some housing programs have a closing coordinator who helps participants schedule closings and obtain necessary paperwork (The Enterprise Foundation, 2001a). Finally, some programs offer a fourth component, financial subsidies for downpayments. Below, we focus our discussion on education and counseling services because these are in many ways the “meat” of homeownership programs. Homeownership education and counseling. Most homebuyer programs provide services that correspond to the following five “stages” of homeownership education and counseling: (1) pre-counseling screening; (2) pre-purchase education; (3) pre-purchase counseling; (4) post-purchase follow-up and support; and (5) post-purchase delinquency and default counseling (Mallach, n.d.). The pre-counseling screening typically consists of a face-to-face interview with homeownership program staff. The goal is to assess income, debt, and other financial indicators to determine whether an individual will be eligible for a mortgage loan. Individuals who do not meet mortgage qualifications should usually be referred to a local credit counseling agency (The Enterprise Foundation, 2001a). Pre-screening to sort out those who are not yet eligible for home ownership is important so that individuals and agencies do not waste time and resources (Mallach, n.d.) If the client passes the initial screening, she is encouraged to attend some form of pre-purchase education or homebuyer training. The Enterprise Foundation (2001a) recommends a minimum of eight hours of face-to face training. Training often occurs in group sessions, held over a period of eight to twelve weeks. Offering these programs on the weekends or during the evenings is usually desirable to ensure maximum participation. The financial education section of this report offers other specific suggestions for effective group financial education (see also The Housing Partnership Network, n.d.). Some homebuyer programs offer training in the form of telephone sessions or home-study sessions, but these strategies seem to be less effective at reducing future mortgage defaults (Hirad and Zorn,2001). Homebuyer training topics recommended by the American Homeowner Education & Counseling Training Institute (AHECTI), a nonprofit organization established in 1997 to standardize the homeowner education and counseling industry, are summarized in Table 6.1 (The Enterprise Foundation, 2001b, lists topics covered by existing homebuyer programs). Most homeownership programs encourage participants to attend all training sessions before they begin shopping for homes (The Enterprise Foundation, 2001a). Many programs will not provide financial assistance (e.g., a match for downpayment) unless participants attend these sessions.
Center for Social Development Washington University in St. Louis
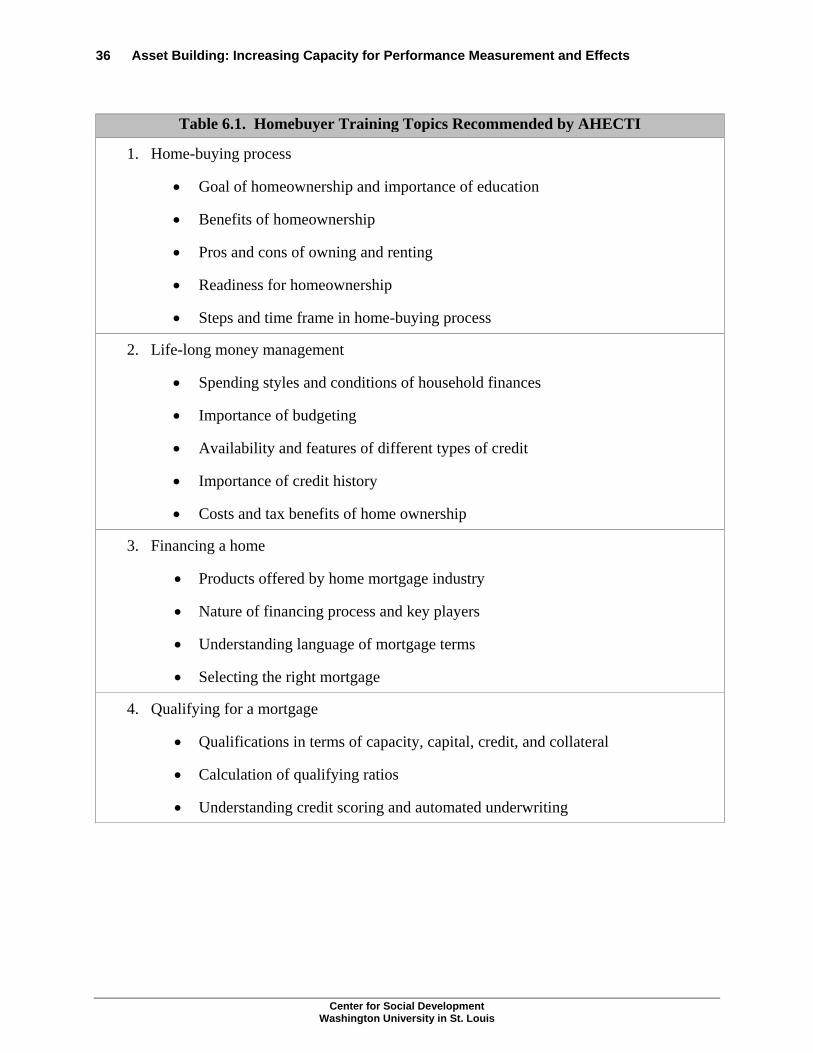
Asset Building: Increasing Capacity for Performance Measurement and Effects 36
Table 6.1. Homebuyer Training Topics Recommended by AHECTI
1. Home-buying process
• Goal of homeownership and importance of education
• Benefits of homeownership
• Pros and cons of owning and renting
• Readiness for homeownership
• Steps and time frame in home-buying process
2. Life-long money management
• Spending styles and conditions of household finances
• Importance of budgeting
• Availability and features of different types of credit
• Importance of credit history
• Costs and tax benefits of home ownership
3. Financing a home
• Products offered by home mortgage industry
• Nature of financing process and key players
• Understanding language of mortgage terms
• Selecting the right mortgage
4. Qualifying for a mortgage
• Qualifications in terms of capacity, capital, credit, and collateral
• Calculation of qualifying ratios
• Understanding credit scoring and automated underwriting
Center for Social Development Washington University in St. Louis
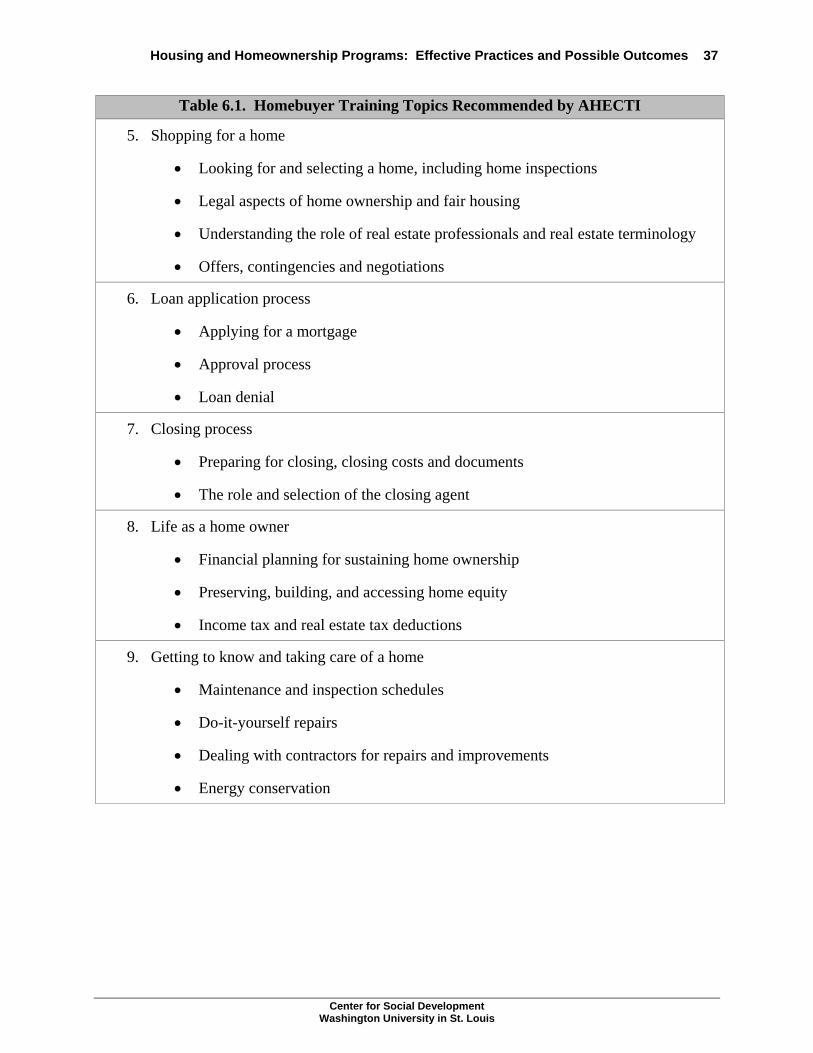
Housing and Homeownership Programs: Effective Practices and Possible Outcomes 37
Table 6.1. Homebuyer Training Topics Recommended by AHECTI
5. Shopping for a home
• Looking for and selecting a home, including home inspections
• Legal aspects of home ownership and fair housing
• Understanding the role of real estate professionals and real estate terminology
• Offers, contingencies and negotiations
6. Loan application process
• Applying for a mortgage
• Approval process
• Loan denial
7. Closing process
• Preparing for closing, closing costs and documents
• The role and selection of the closing agent
8. Life as a home owner
• Financial planning for sustaining home ownership
• Preserving, building, and accessing home equity
• Income tax and real estate tax deductions
9. Getting to know and taking care of a home
• Maintenance and inspection schedules
• Do-it-yourself repairs
• Dealing with contractors for repairs and improvements
• Energy conservation
Center for Social Development Washington University in St. Louis

Asset Building: Increasing Capacity for Performance Measurement and Effects 38
Table 6.1. Homebuyer Training Topics Recommended by AHECTI
10. Preventing foreclosure
• How to manage the household budget and prioritize debts
• Proactive communications with lender/servicer
• Resources for home owners in default
• The foreclosure process Source: Adapted by Mallach (n.d.) from American Homeowner Education & Counseling Training Institute. (1999). Certification and accreditation standards and procedures. The next stage is pre-purchase counseling, although this stage may also occur simultaneously with the previous stage. This stage usually consists of one-on-one sessions and tends to focus more on individual and specific issues that need to be addressed before a participant can become a homeowner (Mallach, n.d.). After this stage, if all goes well, the program participant has the necessary skills to purchase a home and is qualified to do so. After the program participant purchases the home, post-purchase follow-up and support counseling is advised (Mallach, n.d.). Effective homeownership programs aim not just to help families purchase homes, but also to help them maintain and remain in their homes (Katz et al., 2003). Issues commonly addressed in this stage are home maintenance and repair and additional financial management skills. Follow-up support can be provided through individual counseling sessions, group sessions, or a combination. However, many programs have found that the majority of participants will not participate in voluntary post-purchase support sessions (Mallach, n.d.). Administrators of homeownership programs should therefore consider making these sessions mandatory or providing incentives for participating. Some homeownership programs require potential homebuyers to commit to participating in post-purchase counseling for one to five years after home purchase. To increase participation and to address some home maintenance issues, follow-up sessions might be scheduled in the participant’s home (Mallach, n.d.) The final stage of counseling for many homebuyer programs is post-purchase delinquency and default counseling. These group sessions or individual contacts typically involve counseling, budgeting assistance, advocacy, referral and sometimes, financial assistance. Even if this is not a “formal” service provided by the agency, it is helpful for new homeowners to know the program staff are available for this type of assistance (Mallach, n.d.). Nonprofit organizations, especially those that are expanding their traditional social services to include homeownership, should ensure that they have the expert staff and financial resources to be successful. Homebuyer programs also require partnerships with key lending institutions, and it is imperative to educate potential lenders about the viability of the program and guide applicants through the lending process (Balfour & Smith, 2002; Listokin, 2001).
Center for Social Development Washington University in St. Louis

Housing and Homeownership Programs: Effective Practices and Possible Outcomes 39
Possible Housing and Homeownership Outcomes A number of intermediate and long-term outcomes are expected from homeownership programs. In addition to securing permanent affordable housing for their families, low-income homeowners can begin to realize the financial benefits enjoyed by their wealthier peers. These new homeowners can deduct mortgage interest payments from their income taxes, and economic studies demonstrate that home purchase is often a sound investment as housing prices across the price distribution continue to rise. Potential outcomes for participants. Cooperative housing is designed to increase the social and economic empowerment of low-income individuals by giving them greater ownership and control over their living situations. Van Ryzin (1994) surveyed elderly residents of cooperative housing associations and found a very high perception of control over their living environment and a positive sense of ownership. The sense of ownership was closely associated with the overall physical and social quality of the environment. Involving residents in the management of low-income housing leads to empowerment, although the internal social dynamics of the association are important (Van Ryzin, 1994). Homeownership plays a critical role in the asset accumulation of American households. In 1995, the median net worth of homeowners was $78,000 compared to only $2,300 for renters. Home equity also constitutes the majority of total household wealth, and owning an important asset such as a home can protect families in times of economic strain (Boshara, Scanlon, & Page-Adams, 1998). Homeowners report more satisfaction with their lives, more participation in block associations (Rohe & Basolo, 1997), and a greater engagement with local politics (Rossi & Weber, 1996). Homeownership has also been associated with positive family health effects and marital stability (Boshara, et al., nd). Children of homeowners are less likely to drop out of school or become pregnant as teenagers, an association especially strong for low-income families (Green & White, 1997), and homeownership improves overall outcomes for children in any neighborhood (Harkness & Newman, 2002). It should be acknowledged that the gains for minority homeowners are often not as great (Katz Reid, 2004), which may be due in part to residential segregation and distressed neighborhood conditions that may reduce housing prices (Boshara et al., n.d.). There are concerns that families who purchase homes in distressed communities may lose money on their investment or find themselves “trapped” in declining neighborhoods (Scanlon, 1998). Non-profit housing organizations should be aware of these risks and realize that higher homeownership rates do not automatically result in successful community revitalization. Research demonstrates that numerous other long-term benefits may arise from homeownership, although Rossi and Weber (1996) warn that it is difficult to establish the causality of homeownership effects. However, it is clear that there is a strong preference for homeownership over renting in the United States, and low-income families should be given the opportunity to obtain this part of the American Dream and realize the potential benefits (Johnson & Sherraden, 1992).
Center for Social Development Washington University in St. Louis

Asset Building: Increasing Capacity for Performance Measurement and Effects 40
Potential outcomes beyond the owners. It is easy to assume that individual asset ownership will have positive spillover effects to the neighborhood—homeowners will work to improve their neighborhood conditions in order to protect their investment (Scanlon, 1998; Weber & Smith, 2003). But connecting homeownership with community revitalization requires a long-term commitment on the part of the organization. Housing agencies need political as well as financial resources to create community change through sustained collective action and intervention (Weber & Smith, 2003; Wyly et al., 2001).
Center for Social Development Washington University in St. Louis

7. Housing and Homeownership Development Programs: Indicators for Performance Measurement
Based on what is known about effective housing and homeownership development practices and possible outcomes, this section offers suggestions for measuring outputs, intermediate outcomes, and end outcomes. These indicators may or may not be applicable to all programs. In constructing program logic models, indicators unique to the program context can be applied. Outputs Table 7.1 suggests outputs to measure and monitor. Outputs should be measured over a defined period of time, such as a calendar year or a fiscal year. A classroom-hour is an hour of education provided, regardless of the number of people in attendance. A person-hour is one hour spent in attendance by one student. Thus, ten people attending a single two-hour homeownership education session counts as two classroom-hours and 20 person-hours. The outputs in Table 7.1 can be taken from program records.
Center for Social Development Washington University in St. Louis

Asset Building: Increasing Capacity for Performance Measurement and Effects 42
Table 7.1. Housing and Homeownership Development Programs: Outputs
1. Number of inquiries received by potential participants in the year
2. Number of people who received one-on-one pre-counseling screening
3. Number of people who completed pre-purchase education sessions
4. Number of classroom-hours of pre-purchase education provided
5. Number of person-hours of education attended
6. Number of people receiving one-on-one pre-purchase counseling
7. Number of hours of one-on-one pre-purchase counseling provided
8. Number of hours spent assisting clients with home purchase process
9. Number of referrals made to real estate agents
10. Number of referrals made to lenders
11. Number of people completing a mortgage loan application
12. Number of approved mortgages
13. Number of homes purchased (with and without downpayment subsidies)
14. Number of people receiving financial subsidy for downpayment
15. Total dollar value of downpayment subsidies
16. Total dollar value of approved mortgages
17. Total dollar value of purchased homes
18. Number of hours of post-purchase group education provided
19. Number of people attending post-purchase group education
20. Number of hours of post-purchase one-on-one counseling provided
21. Number of people attending post-purchase one-on-one counseling
22. Number of hours of delinquency and default counseling provided
23. Number of people attending delinquency and default counseling
24. Number of purchasers still in homes at the end of the year
25. Number of purchasers in default at some time during the year
26. Number of foreclosures in the year
Center for Social Development Washington University in St. Louis

Housing and Homeownership Programs: Indicators for Performance Measurement 43
Intermediate Outcomes The outputs delivered by a housing or homeownership development program are expected to lead to intermediate outcomes involving financial knowledge and behavior, and economic and psychological well-being. Table 7.2 suggests possible intermediate outcomes. Outcomes related to financial knowledge and behavior should directly correspond to topics covered in pre- and post-purchase education sessions. They should also emphasize knowledge and behavior that remain important after the home has been purchased, such as knowledge and behavior that affect the home owner’s ability to maintain and remain in the new home. For more detailed discussion of performance measurement for financial education, see other chapters on this topic in this report. Intermediate outcomes related to financial status are expected to flow from changes in financial knowledge and behavior associated with pre- and post-purchase education and counseling. For example, pre-purchase education and counseling commonly address credit problems, so improvement in participants’ credit records is a logical intermediate outcome. Finally, intermediate outcomes related to psychological well-being represent changes in attitude that flow fairly quickly from completing financial education, preparing for home ownership, and becoming a home owner.
Table 7.2. Housing and Homeownership Development Programs: Intermediate Outcomes
1. Increased financial knowledge
• Understand the costs of paying bills late
• Can prioritize bills and debt repayment
• Understand the need to save for home maintenance and repair
• Can identify sources of saving (e.g., reductions in expenses; “extra” money from raises, bonuses, or tax refunds)
• Can choose an appropriate savings account
• Understand how to preserve and increase home equity
• Understand when and how to access home equity
• Understand how to deal with contractors for home maintenance, repair, and improvements
• Understand income tax deductions related to home ownership
• Understand how to communicate with the mortgage servicer
• Can identify resources for home owners in default
Center for Social Development Washington University in St. Louis
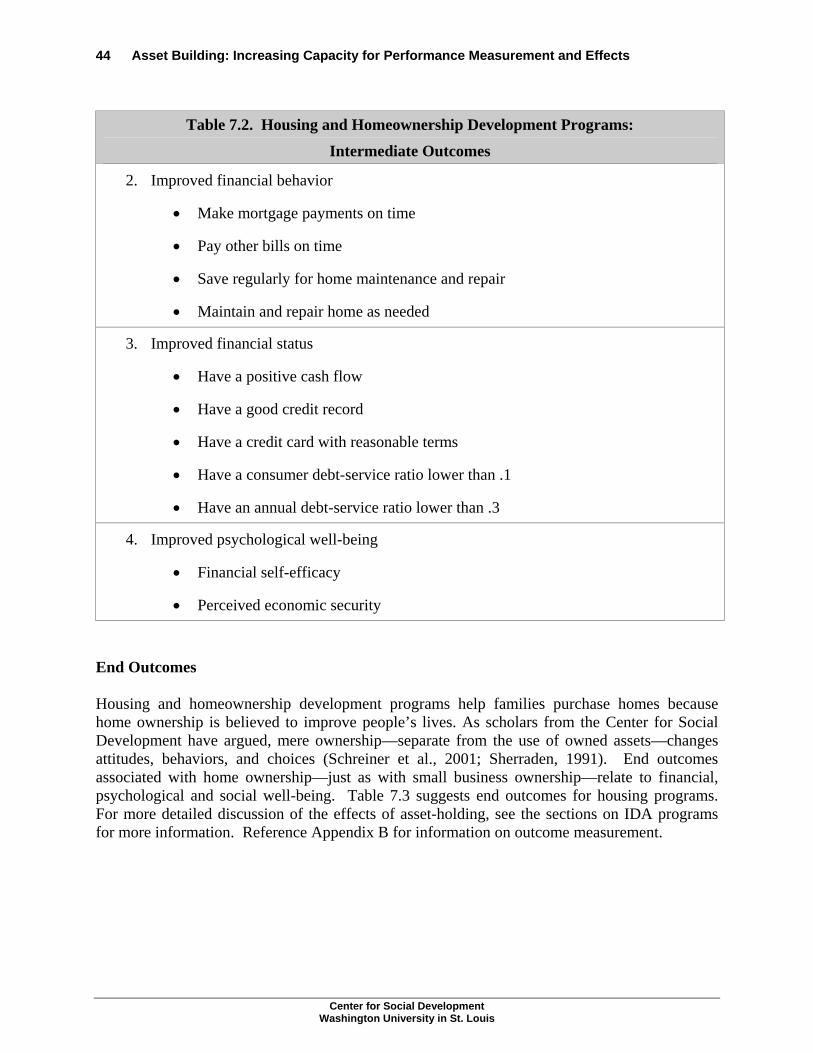
Asset Building: Increasing Capacity for Performance Measurement and Effects 44
Table 7.2. Housing and Homeownership Development Programs:
Intermediate Outcomes
2. Improved financial behavior
• Make mortgage payments on time
• Pay other bills on time
• Save regularly for home maintenance and repair
• Maintain and repair home as needed
3. Improved financial status
• Have a positive cash flow
• Have a good credit record
• Have a credit card with reasonable terms
• Have a consumer debt-service ratio lower than .1
• Have an annual debt-service ratio lower than .3
4. Improved psychological well-being
• Financial self-efficacy
• Perceived economic security End Outcomes Housing and homeownership development programs help families purchase homes because home ownership is believed to improve people’s lives. As scholars from the Center for Social Development have argued, mere ownership—separate from the use of owned assets—changes attitudes, behaviors, and choices (Schreiner et al., 2001; Sherraden, 1991). End outcomes associated with home ownership—just as with small business ownership—relate to financial, psychological and social well-being. Table 7.3 suggests end outcomes for housing programs. For more detailed discussion of the effects of asset-holding, see the sections on IDA programs for more information. Reference Appendix B for information on outcome measurement.
Center for Social Development Washington University in St. Louis

Housing and Homeownership Programs: Indicators for Performance Measurement 45
Table 7.3. Housing and Homeownership Development Programs: End Outcomes
1. Greater net worth
2. Greater interest in and knowledge of investing
3. Greater consumption efficiency
4. Greater future orientation
5. Lengthened time horizons
6. Greater self-esteem
7. Greater self-efficacy
8. Greater household stability
9. Increase in social connectedness
10. Greater involvement in neighborhood and community affairs
11. Increased voting
12. Greater academic engagement of children of home owners
13. Decrease in unplanned pregnancy for children of home owners Source: Sherraden et al. (1995).
Center for Social Development Washington University in St. Louis

Asset Building: Increasing Capacity for Performance Measurement and Effects 46
Center for Social Development Washington University in St. Louis

8. Microenterprise Programs: Effective Practices and Possible Outcomes5
In this section of the report, microenterprise programs are discussed. What is known about effective practices is presented, and possible outcomes are discussed. Following this, we suggest possible outputs and indicators for intermediate and end outcomes. Defining Microenterprise A microenterprise is a very small company run by an owner of modest means, usually with few or no other employees. Common activities include child care, catering, cosmetology, or cleaning services. The microenterprise rubric generally excludes one-person small businesses owned by professionals such as doctors, lawyers, or computer programmers, and it also excludes hobbyists (such as those selling hand-made arts and crafts at weekend shows). The microenterprise-support field has, to this point, focused largely on lending and training, perhaps due to its roots in microcredit models from low-income countries and in particular the Grameen Bank of Bangladesh (Yunus, 1999 and 1998; Soloman, 1992). We offer a different perspective, one that suggests that—even when they make loans—microenterprise programs best support self-employment when they help people build human capital (education, experience, and entrepreneurship), financial capital (loans or savings), and social capital (networks and personal support). Microenterprise Programs: Program Components and Effective Practices Microenterprise-support programs aim to help people of modest means to start, strengthen, and/or expand very small companies. Microenterprise programs have their work cut out for them. Self-employment requires assets in the form of human, financial, and social capital. By definition, people of modest means have fewer of these assets. To fill gaps in the assets that facilitate successful self-employment, microenterprise-support programs offer training, microfinance, and social support.
5 Please reference the comprehensive review upon which this section is based: Schreiner, M. (2004). Support for microenterprise as asset building: Concepts, good practices, and measurement, working paper 04-06. St. Louis: Center for Social Development, Washington University in St. Louis.
Center for Social Development Washington University in St. Louis

Asset Building: Increasing Capacity for Performance Measurement and Effects 48
Training. Self-employment requires a wide range of skills, attitudes, and habits. The people most likely to succeed are older, highly-educated, and have experience in self-employment or in wage jobs in the same field (Spalter-Roth, Soto, and Zandniapour, 1994; Evans and Leighton, 1989). Training aims to equip microenterprise owners with the human capital needed to compete in the marketplace through:
• Advice about the risks of microenterprise and alternatives such as wage jobs • Help with a written business plan • General business skills, such as taxes, accounting, strategic planning, and pricing • Assistance with legal compliance and licensing for specific businesses, in particular child
care, cosmetology, and food service • Consulting services and technical assistance on an on-going, on-call basis
Effective microenterprise training serves to scare off many potential participants. After all, self-employment is usually more difficult than wage-employment: the hours are longer, the pay is lower, and the risks are higher. “To be your own boss” and “to set your own hours” takes a mindset and a discipline that many people would rather delegate. The Women’s Self-Employment Program of Chicago—the oldest microenterprise program in the United States—“believes that a critical element of self-employment training is to help clients understand whether or not they are suited as entrepreneurs” (Novogratz, 1992, p. 21). Likewise, Edgcomb (2002) notes that good training helps participants to assess their assets. In this vein, Balkin (1989) proposes that microenterprise training should first help people to get more education, second to search for a wage job, and only last to attempt self-employment. Kosanovich and Fleck (2001) call this the “cold shower” approach. The capstone of microenterprise training is often a formal written business plan. Making a plan forces participants to sit down and ask themselves some tough questions (Bhatt, 2002):
• Does the idea make sense in business terms? • How long will it take to break even, and how will I get by until then? • Have I confused the enjoyment of supply with the existence of demand? (If I make it,
will they come?) The point is, a business is a business. “All too often”—says Sternberg (1998, p. 16)—“they start making a product because they like it (crafts, jellies, party balloons, tie-dyed silk scarves, hand-painted candy jars, or tape-recorded stories) rather than because it has a profitable market.” The business plan also serves three other purposes. For microenterprise programs that make loans, the business plan screens out the highest-risk borrowers—no plan, no loan. For programs that do not make loans, the business plan prepares borrowers to approach banks or other lenders. Finally, the plan serves as a “final exam” and as a way to track effort toward self-employment. States have been willing to waive work-search requirements for public-assistance recipients in microenterprise training as long as there is something concrete—such as a business plan—to prove that the training is real.
Center for Social Development Washington University in St. Louis

Microenterprise Programs: Effective Practices and Possible Outcomes 49
Microenterprise training can also teach general business skills. Microenterprise training attempts to provide “the practical knowledge to do the myriad of little things it takes to start and sustain an enterprise” (Balkin, 1992, p. 141). Because of the wide array of business ideas in a given classroom, and because trainers themselves often lack sector-specific skills, it is good practice (Edgcomb, 2002) to focus on common business tasks such as taxes, accounting, strategic planning, and pricing. Sector-specific training makes sense in fields such as child care, cosmetology, and food service that not only have many microenterprises—making it worthwhile for the microenterprise program to acquire sector-specific expertise—but that also require licenses (Sherraden, Sanders, and Sherraden, 1998). In the United States and abroad, regulation is a barrier—though not always an unhealthy one—to microenterprise (Dennis, 1998; de Soto, 1989). For example, microenterprise programs may not be able to teach beauticians how to cut the latest hairstyles, they can still teach them how to navigate legal and regulatory requirements. Finally, microenterprise programs often supplement classroom training with one-on-one consulting on an on-going, on-call basis. The Unemployment Insurance Self-Employment Demonstration (Benus, et al., 1995) and a review of self-employment programs in Britain and France (Bendick and Egan, 1987) suggest that long-term, on-call advice and technical assistance for problems as they come up can be more effective than once-off, up-front courses meant to prevent possible problems. On-call advice is also less costly, both because problems that do not crop up are not treated and because people who end up not starting businesses are not trained. Microfinance. Self-employment requires not only human capital but also financial capital. Microfinance is the supply of financial services—loans and/or savings—tailored to the demands of microenterprises. This includes loans from the microenterprise-support program itself or from banks or other lenders. It also includes savings services. Microloans. According to Drury, Walsh, and Strong (1994, p. 2-15), “many microbusiness practitioners believe that lack of access to capital is the greatest single barrier to starting businesses, and that capital is an input even more important than general business training.” Indeed, there is a strong link between business start-up and owner’s net worth (Bates, 1996; Holtz-Eakin, Joulfaian, and Rosen, 1994; Evans and Leighton, 1989). Microenterprise programs often make loans to their participants because, as the saying goes, banks make loans only to those who do not need them. Banks require signals of creditworthiness that microenterprises often cannot offer: real estate for collateral, an unblemished credit-bureau record, and a wage job with enough steady income to make monthly payments. Unlike banks, microenterprise programs often use joint-liability groups to control risk. Programs that lend to individuals may also consider non-standard signals of creditworthiness that banks ignore, such as a record of on-time payments for rent and utilities, regular remittances to relatives abroad, and/or completion of a microenterprise training course or business plan. A few banks work in partnership with microenterprise programs to make loans to program “graduates” based on their business plans. The microenterprise field hopes that this will show banks that microloans are good business.
Center for Social Development Washington University in St. Louis

Asset Building: Increasing Capacity for Performance Measurement and Effects 50
Microsavings. A decade ago, the word “microfinance” did not exist; people spoke only of “microcredit.” The shift to the new word reflects the awareness that, for microenterprises, savings matter just as much—if not more—as loans. For one thing, most new ventures do not use much debt at start-up (Dennis, 1998); according to Bates (1996), about one-fourth start with no financial capital at all. When start-ups do use financial capital, the most common sources are not bank loans but rather owner’s savings or informal loans from friends or relatives. Berger and Udell (1998) and Bates (1997) find that microenterprises are limited less by low debt than by low savings. Indeed, Bates (1996) argues that, because lenders require collateral, low savings leads to a low access to loans. For start-ups, savings has other advantages over loans. Of course, savings pay interest, but loans cost interest. And loans are tied to specific purchases—such as a barber chair or a lawn mower—and cannot pay for research during the planning stage or for the owner’s living expenses during the years of gestation required of most small ventures (Servon, 1997; Birley, 1989; Nares and Feit, 1989). Finally, even established, successful microenterprises do not provide a monthly paycheck, so they need savings to smooth the peaks and valleys in income and expenses. In sum, without a reserve of savings, most new, small firms will fold before they fledge. The challenge for microenterprise programs is that it is easier to make loans than to support saving. There are two practical options: helping people to save in banks and implementing Individual Development Account programs. Social support. In addition to human capital and financial capital, self-employment requires social capital. As Balkin (1989, p. 7) says, “No one does it on their own.” Business happens not only in the marketplace but also in the social arena, and the self-employed must rely on their personal networks for contacts and information and on their families for emotional support and physical sustenance. People of modest means have limited social support because their friends and relatives also tend to be of modest means and not to own businesses. To build social capital and to empower the self-employed, microenterprise programs often target specific groups, provide basic skills training and mentors, and offer events that bring microenterprise owners together.
Microenterprise programs can target women, racial/ethnic minorities, and the foreign-born in many ways. Location is one; participation is easier when the program’s office and classrooms are close to where the target group lives and close to public-transport routes. Child-care is another; women may not be able to attend classes unless they have someone to watch their children. Programs targeted to women may also include spouses to get their “buy-in”, as male partners may either sabotage women’s self-employment efforts or—especially if they have wage jobs—be mainstays of support (Taub, 1998; Spalter-Roth, Hartmann, and Shaw, 1993). Timing is important; most participants also work wage jobs, so classes should be repeated and scheduled to allow attendance by people working day or night shifts. The background of the trainer also matters; students make a greater effort when they identify with the teacher and feel
Center for Social Development Washington University in St. Louis
Microenterprise Programs: Effective Practices and Possible Outcomes 51
that they “fit in” (Akerlof and Kranton, 2002). For the foreign-born, a key is to deliver classes, handouts, and advertising in the mother tongue. To increase the chances for success, programs targeted to women—especially those coming off public assistance—often find that basic-skills training provides a context of success that boosts self-esteem. Still, “even for motivated low-income women, microenterprise training does not generally increase living standards—at least in the short run—although it does make trainees feel better about themselves” (Spalter-Roth, Soto, and Zandniapour, 1994, p. 8). The skills per se are useful, however, and building self-esteem through self-employment training can be good wage-employment training. Microenterprise programs often match participants with mentors. The self-employed are more likely to have had parents or relatives who owned a business (Balkin, 1989; Evans and Leighton, 1989), conferring a social advantage in terms of information and opportunities. “A self-employment training program can be thought of as a substitute for the business-minded relative that low-income people never had” (Balkin, 1989, p. 136). The best mentors come from the same backgrounds as participants and work in the same fields. Microenterprise programs also build social capital by bringing owners together in joint-liability groups, business incubators or clusters, trade shows and get-togethers. With joint-liability groups, three to five people receive loans, all of whom must repay before any one of them can get a repeat loan. Made famous by the Grameen Bank of Bangladesh (Edgcomb and Barton, 1998), joint-liability eschews traditional collateral and credit evaluations, controlling repayment risk instead via existing social capital among group members. Joint-liability also builds social capital by giving members a reason to mentor each other. In the United States, performance has been less dramatic than in Bangladesh (Larance, 2001). There is less social capital to tap. Not only are Americans more mobile, more spread out, and more diverse, but lenders often place strangers together in groups (Hung, 2002; Sternberg, 1998). Group meetings can be seen as more burdensome than empowering (Ashe, 2000; Taub, 1998). Business incubators are buildings that house microenterprises that share secretarial support, telephone and fax lines, computers, copiers, and restrooms. This helps dilute overhead costs. “Clusters” group microenterprises that produce complementary goods and services (Bhatt, 2002). Because they are close in space, microenterprises in clusters have lower transaction costs—both for information and transportation—and so enjoy economies of agglomeration (Porter, 1997; Krugman, 1995). Of course, a cluster or incubator needs an organizer, and the microenterprise-support program can play that role. Finally, microenterprise programs can promote social capital through microenterprise trade shows or simply by convening a group of business owners and then letting nature take its course. One of the best ways to build social capital is simply to bring people together, and the microenterprise program can be the institutional setting.
Center for Social Development Washington University in St. Louis

Asset Building: Increasing Capacity for Performance Measurement and Effects 52
Possible Microenterprise Outcomes Microenterprise-support programs help people of modest means to build human, financial, and social capital via self-employment. If successful, this has the same benefits (jobs and income) as wage employment. In addition, self-employment has unique non-financial or “way-of-life” benefits, and its benefits may spill-over to non-owners. Potential financial outcomes for participants. Microenterprise programs try to help start, strengthen, and/or expand very small companies in order to increase income and employment. Thus, the financial benefits of microenterprises are a lot like those of wage jobs. Starting a microenterprise is assumed to “create” a job and to increase income. Of course, this assumption is only partially correct; in the absence of the microenterprise, many—if not most—owners would have found a wage job of some sort. At the same time, others would have been unemployed, and even those with wage jobs would have—to some degree—displaced other, less-fortunate wage workers. On the whole, successful microenterprise does create jobs and, in so doing, increases aggregate national income. Although self-employment has low, risky wages, one of its main effects seems to be to diversify the risk of the portfolio of household activities (Sherraden, Sanders, and Sherraden, 1998; Dunn, 1997; Hulme and Mosley, 1996; Servon, 1996). For example, a household with one or more wage jobs might start a part-time microenterprise to insure against job loss. Unlike wage jobs—whose hours and income are usually rigid and all-or-none—self-employment effort and earnings can be adjusted by the household as needed. Potential non-financial and “way-of-life” outcomes. Sherraden, Sanders, and Sherraden (1998) point out that, for most microenterprise owners, financial benefits (which are often low and risky) matter less than non-financial and “way-of-life” benefits. Simply put, microenterprise owners tend to be drawn from those who want the lifestyle promised by self-employment. For them, microenterprise improves quality-of-life and fulfills a dream. They give up higher incomes in exchange for independence, pride of ownership, and self-fulfillment (Himes and Servon, 1998). Much of the excitement for microenterprise as a way for single mothers to leave public assistance stems from its unique promise to combine home-based self-employment with child care or elder care. Others—such as those on farms or otherwise rooted in place—want work that does not require them to move. Some microenterprise owners see the business as a way to imprint a work ethic on children and as a way to build assets to bequeath. Even owners of failed firms see self-employment as a “learning experience” that will serve them throughout life (Sherraden, Sanders, and Sherraden, 1998).
Center for Social Development Washington University in St. Louis

Microenterprise Programs: Effective Practices and Possible Outcomes 53
Potential outcomes beyond the owners. Finally, microenterprise may benefit society at large, most obviously by creating jobs. As mentioned above, microenterprise may also help single mothers leave public assistance (Friedman, Grossman, and Sahay, 1995; Else and Raheim, 1992), although it probably will not be a common route (Schreiner, 1999b; Servon and Bates, 1998). Microenterprise may also have macroeconomic benefits. Even if 999 flowers die from every 1,000 that bloom, the successes may be well worth the failures, especially if they grow into large companies. While these community- and societal-level impacts are well known, measuring these impacts of microenterprise programs remains elusive.
Center for Social Development Washington University in St. Louis

Asset Building: Increasing Capacity for Performance Measurement and Effects 54
Center for Social Development Washington University in St. Louis
9. Microenterprise Programs: Indicators for Performance Measurement
Based on what is known about effective microenterprise practices and possible outcomes, this section offers suggestions for measuring outputs, intermediate outcomes, and end outcomes. These indicators may or may not be applicable to all programs. In constructing program logic models, indicators unique to the program context can be applied. Outputs The services delivered by a microenterprise-support program—its outputs—aim to build human capital, financial capital, and social capital. Tables 9.1-9.3 suggest outputs to measure and monitor. We consider these to be example outputs; program staff should choose outputs that reflect the goals, structure, and activities of the sessions they provide. Human-capital outputs. First and foremost, a microenterprise program helps participants weigh the risks and rewards of self-employment versus alternatives. Thus, potential participants who sign up but soon opt out are a valid (and valuable) output. Performance measurement should “give credit” to microenterprise programs both for helping those who are “ready and willing” to try self-employment and for helping others to choose the right path for them. When tracking those who seek these services, it is useful to assess those who already own a microenterprise and those who do not. Black et al. (2002) define a microenterprise “participant” as someone who, in the past year, had a loan in good standing and/or received at least 10 hours of training or technical assistance. For most microenterprise programs, formal classroom training forms the heart of structured human-capital building. Measures can assess the number of hours devoted to specific skills training.
Often, the capstone of microenterprise human-capital building is the business plan. As with in-take, performance measurement should count not only completed business plans but also in-process plans and abandoned plans.
Good practice suggests complementing classroom training and business-plan guidance with on-going, on-call, one-on-one consulting and technical assistance. Edgcomb (2002) suggests that while programs should actively offer technical assistance to owners, results are best when owners initiate the request, which can be assessed.
Center for Social Development Washington University in St. Louis

Asset Building: Increasing Capacity for Performance Measurement and Effects 56
Table 9.1. Microenterprise Programs: Human Capital Outputs
1. Number of inquiries received by potential participants in the year (by phone, mail, in person)
2. Number of people who started the formal in-take process in the year
3. Number of people who attended initial group-orientation session
4. Number of people who received one-on-one in-take counseling
5. Number of people with loans in good standing
6. Number of people who received 10 hours of training or technical assistance
7. Number of classroom/training hours in the year for:
• General business skills training in taxes, accounting, and strategic planning
• Specific business skills training in legal compliance and licensing
• Management training or other advanced topics
8. Number of business plans supervised in the year
9. Hours of one-on-one counseling or technical assistance in the year:
• Scheduled by the program
• Requested by the owner Financial-capital outputs. To build financial capital, microenterprise programs’ main tools are loans and savings programs such as IDAs. Loans may be disbursed to joint-liability groups or individuals, to start-up ventures or on-going microenterprises. For on-going microenterprises, the loan may be the borrower’s first, or it may be a repeat loan. These distinctions are important to assess.
Loan output may be measured not only as the number of loans disbursed but also as dollars disbursed (Schreiner, 2001), with the same sub-classes as above. It is also useful—for example, when deriving the portfolio-at-risk measure of arrears (see below)—to measure dollars outstanding at the end of the year, with the same sub-classes as for the number of loans disbursed and dollars disbursed. IDAs are one mechanism for savings development. Programs assist with opening a savings account, prodding to make regular deposits, and delivering financial education:
Center for Social Development Washington University in St. Louis

Microenterprise Programs: Indicators for Performance Measurement 57
Table 9.2. Microenterprise Programs: Financial Capital Outputs
1. Number of loans disbursed in the year (joint-liability loans or individual loans for either start-up ventures or on-going microenterprises)
2. Dollars disbursed in loans in the year
3. Dollars outstanding at the end of the year
4. Number of IDAs opened in the year
5. Number of IDAs open at the end of the year
6. Number of deposit reminders to IDA savers in the year (by mail and telephone)
7. Classroom-hours of IDA financial education provided in the year:
• Personal finance
• Microenterprise-specific
• Other Social-capital outputs. Outputs meant to build social capital include targeting disadvantaged groups to help them build networks and self-esteem and matching participants with mentors and organizing social events. Targeting to groups who are disadvantaged in terms of social capital for business development is reflected in the demographics of participants served in the past year. These measures are helpful for tracking target population achievement. These same measures can also be applied to program staff and class instructors to assess how closely their background matches that of disadvantaged target groups. Targeting the foreign-born can be measured in terms of services provided in languages other than English.
One way to assess how well a microenterprise program targets people of modest means is to compare their income with a poverty line (Doyle and Black, 2001). Income is measured best as “total income” from past-year tax returns.
Class scheduling indicates commitment to people who often must patch income together from multiple jobs. Attempts to accommodate the unique situation of women include providing child care and reaching out to participants’ male partners. Self-esteem training is like other forms of training with outputs measuring the number of hours devoted to specific content areas.
Center for Social Development Washington University in St. Louis

Asset Building: Increasing Capacity for Performance Measurement and Effects 58
Microenterprise programs match participants with mentors so as to fill in a “missing link” in the network that the disadvantaged may lack among kith and kin. Programs also build social capital by organizing events that build networks. This breaks the “free-rider” collective-action problem in which participants themselves have few incentives to arrange such events because, even though each would benefit, no individual benefits enough to compensate for the trouble of playing host. Programs organize incubators, trade shows, and simple get-togethers.
Table 9.3. Microenterprise Programs: Social Capital Outputs
1. Numbers of participants and staff according to:
• Gender (male or female)
• Race/ethnicity
• Birthplace (United States or other)
• Disability (yes or no)
• Receipt of TANF or food stamps (in the past year and in the four years before )
• Experience with microenterprise ownership (never, formerly but not currently, currently)
2. Number of classroom-hours provided in languages other than English in the year
3. Number of Materials produced in languages other than English in the year:
• Radio and television advertisements (yes or no)
• Printed publicity (yes or no)
• Written program information (yes or no)
• Class handouts (yes or no)
4. Number of participants in the year with income below the family-size adjusted poverty guideline of the U.S. Department of Health and Human Services (below 100, 150, and 200 percent)
5. Number of participants in the year with income below 80 percent of the local area median income as published by the U.S. Department of Housing and Urban Development
6. Number of classroom-hours of training provided in the year (before 5 p.m. and after 5 p.m.)
Center for Social Development Washington University in St. Louis

Microenterprise Programs: Indicators for Performance Measurement 59
Table 9.3. Microenterprise Programs: Social Capital Outputs
7. Hours of child care provided for participants in the year
8. Number of male partners of participants who attended at least one training session in the year
9. Classroom-hours of self-esteem training in the year:
• Basic skills such as literacy or numeracy
• Job or job-search skills
• Other
10. Number of participants who met at least once with a mentor in the year (assigned in the current year and past years)
11. Number of meetings between participants and mentors in the year (assigned in the current year and past years)
12. Number of mentors prepared for assignment in the year
13. Number of microenterprises housed in business incubators in the year
14. Number of trade shows and number of participants whose participation in a trade show was facilitated by the microenterprise program in the year
15. Number of microenterprise-owner get-togethers hosted and number of participants per get-together
Intermediate Outcomes If all goes well, the outputs delivered by a microenterprise-support program lead to intermediate outcomes that represent increases in human, financial, and social capital. Possible intermediate outcomes are listed in Tables 9.4-9.6. Human-capital intermediate outcomes. Intermediate outcomes indicate the accumulation of human capital by participants, promoting end outcomes that improve well-being. These include knowledge gained from classroom-hours of training, business plans finished, and business licenses issued. Indicators may also reflect the formal “establishment” of the business.
Center for Social Development Washington University in St. Louis

Asset Building: Increasing Capacity for Performance Measurement and Effects 60
Table 9.4. Microenterprise Programs: Human Capital Intermediate Outcomes
1. Perceived knowledge gained from classroom-hours of training attended in the year
• General business skill training
• Training for specific businesses
• Management training or other advanced topics
2. Number of formal written business plans finished in the year
3. Number of business licenses or permits issued to participants in the year
4. Number of participants obtaining an Employer Identification Number in the year
5. Number of participants adopting a legal status other than “sole proprietorship” or “partnership” in the year
Financial-capital intermediate outcomes. Microenterprise programs attempt to build financial capital through loans and IDAs. Outcomes for IDAs are covered in subsequent sections. For loans, two simple indicators mark success: repeat borrowers and repayment rates. Using the wisdom of “fool me once, shame on you, fool me twice, shame on me,” borrowers may get one loan and discover that it was a mistake, but they will not come back for a repeat loan unless they benefited from the first one (Schreiner, 2003).
A loan that is not repaid is not a loan but a gift. It is one thing to produce gifts and another thing to produce loans, so performance must consider arrears and default. Repayment-as-promised is an intermediate outcome symbolizing a milestone on the road to desired end outcomes because it indicates not only some financial capacity by the owner but also that the microenterprise program inspires honesty and/or the desire among borrowers to maintain a clean record and so qualify for repeat loans. The most conservative (and most useful) measure of arrears is portfolio-at-risk, the ratio of all dollars outstanding in loans one day or more overdue, divided by all dollars outstanding (Rosenberg, 1999). Given dollars outstanding at year-end (discussed earlier), deriving portfolio-at-risk requires measuring dollars outstanding in overdue loans, classified as usual by joint-liability/individual, start-up/on-going, and first/repeat. Once 90-days late, loans have gone bad. In a rescue effort, microenterprise programs may reschedule such delinquent loans. Even if borrowers are making the rescheduled payments on-time, the loans remain at-risk. Thus, good practice counts rescheduled loans as if they were 90-days delinquent (with the usual sub-classes). Not all microenterprise programs make loans, so business loans to participants from other formal sources (usually banks) are also indicators of progress.
Center for Social Development Washington University in St. Louis

Microenterprise Programs: Indicators for Performance Measurement 61
Table 9.5. Microenterprise Programs: Financial Capital Intermediate Outcomes
1. Number of repeat borrowers
2. Rates of repayment per participant
3. Number of loans in the year to borrowers who received program loans before
4. Dollars outstanding in loans with at least one installment overdue at year-end
5. Dollars outstanding in rescheduled loans or in loans 90 or more days overdue at the end of the year
6. Number of loans in the year to participants from other formal sources Social-capital intermediate outcomes. Microenterprise programs attempt to build social capital through self-esteem training and through institutionalized social events. Web sites and business cards may help to spread social networks. Finally, business owners with business partners have larger social networks—all else constant—than sole proprietors.
Table 9.6. Microenterprise Programs: Social Capital Intermediate Outcomes
1. Classroom-hours of basic-skills training attended in the past year for literacy, numeracy, job skills, or self-esteem
2. Number of participants who are members in local chambers of commerce, clubs of small-business owners, and the like
3. Number of participants with business cards at year-end
4. Number of participants with business web sites at year-end
5. Number of owners in the microenterprise at year-end (none, one, two, three or more) End Outcomes Microenterprise programs produce outputs so as to increase human, financial, and social capital in the hopes that the asset accumulation leads to improved end outcomes in participants’ lives. These end outcomes include more employment, higher income, greater asset accumulation, and improved psychological and social well-being. Possible end outcomes are listed in Tables 9.7-9.10. End outcomes for employment. The Holy Grail for microenterprise-support programs is new business starts. Programs also seek to strengthen on-going concerns. Because failure rates decline with each year of survival (Taylor, 1999), a good indicator of strength is continued
Center for Social Development Washington University in St. Louis

Asset Building: Increasing Capacity for Performance Measurement and Effects 62
existence. Furthermore, full-time self-employment is a sign of strength, and looking at both full-time and part-time work in both microenterprise and wage jobs (see below) allows programs to see whether microenterprise helps to stabilize income and reduce the need to “patch.” A simple but powerful sign of the strength and stability of a microenterprise is the existence of a locale outside the home (Schreiner, 2002), although working from home can provide non-financial benefits, especially for women. By building human capital, microenterprise programs stimulate wage-employment as well as self-employment (Benus, et al., 1995; Drury, Walsh, and Strong, 1994). Beyond employing the owner, microenterprises may also employ others.
Table 9.7. Microenterprise Programs: End Outcomes for Employment
1. Number of participants who started a business in the year
2. Number of participants who were self-employed at year-start (full-time and part-time)
3. Number of participants who were self-employed at year-end (full-time and part-time)
4. Number of participants with home-based businesses
5. Number of participants with businesses with a locale outside the home (owned and rented)
6. Number of participants with wage jobs at year-start (full-time and part-time)
7. Number of participants with wage jobs at year-end (full-time and part-time)
8. Person-months of employees in supported microenterprises in the year (full-time and part-time, who are and are not family)
End outcomes for income. Employment—whether in microenterprise or wage jobs—affects income, for both owners and their employees. A large share of income for owners and employees comes in the form of “fringe benefits.” The central “fringe benefits” are health insurance and employer-sponsored, subsidized retirement savings. If income increases, then the use of income-tested public assistance may fall.
Microenterprise may or may not increase earnings per hour (Drury, Walsh, and Strong, 1994; Bendick and Egan, 1987; Spalter-Roth, Hartmann, and Shaw, 1993), as at least some owners work more hours without commensurate increases in total income. To measure earnings per hour requires data on hours worked.
Center for Social Development Washington University in St. Louis

Microenterprise Programs: Indicators for Performance Measurement 63
Table 9.8. Microenterprise Programs: End Outcomes for Income
1. Income for supported participants in the year (from self-employment and wage employment)
• Increase in retained earnings of the business at year-start and year-end
• Owner’s draw or salary
2. Income for employees in supported microenterprises (payroll expenses) in the year
3. For supported participants in the year:
• Number covered by private health insurance at year-end
• Number covered by life insurance at year-end
• Number who contributed to an IRA, 401(k), SEP, Keogh, or other tax-preferred retirement account in the year
4. For employees of supported microenterprises:
• Number covered by private health insurance at year-end
• Number covered by life insurance at year-end
• Number who contributed to an IRA, 401(k), SEP, Keogh, or other tax-preferred retirement account in the year
5. Number of participants who received TANF or food stamps at year-end
6. Number of participants who received TANF or food stamps at year-end
7. Hours worked by participants in microenterprise in the year-end
8. Hours worked by participants in wage jobs in the year-end End outcomes for asset accumulation. Asset accumulation is an end in itself; owners savor their savings, so mere ownership—quite apart from the use of owned assets—improves well-being and changes thoughts and choices (Schreiner et al., 2001; Sherraden, 1991). For example, beyond microenterprise training, programs may prompt participants to get more education. Business owners may also help their children become educated.
Employment and income from microenterprise affects not only the net worth of participants at year-end but also their ownership of household assets such as homes, cars, and appliances. An often-overlooked but central social asset is a marriage.
Center for Social Development Washington University in St. Louis

Asset Building: Increasing Capacity for Performance Measurement and Effects 64
Table 9.9. Microenterprise Programs: End Outcomes for Asset Accumulation
1. Number of participants with a high-school diploma or GED at year-end
2. Number of participants who attended a college course for credit in the year
3. Number of participants who attended a non-credit course (besides microenterprise training) in the year
4. Number of participants with a college degree at year-end
5. Number of participants with children in a private school at year
6. Number of participants with children in high school at year
7. Number of participants with children in college at year
8. Total financial assets (personal financial assets and microenterprise assets)
9. Total financial liabilities (personal debt and microenterprise liabilities)
10. Number of participants who own a home
11. Number of participants who own a car
12. Number of participants who own a major household appliance:
• Refrigerator
• Stand-alone freezer
• Dishwasher
• Clothes washer
• Clothes dryer
• Computer
13. Number of participants who are married End outcomes for psychological and social well-being. For microenterprise-support programs, the ultimate end outcome is to improve well-being by improving economic outcomes (employment and income) as well as by improving non-economic outcomes such as self-efficacy, independence, and citizenship. These outcomes may be similar for ownership of a range of assets such as small businesses and homes (McBride, 2003). Brief examples are detailed here. See Appendix B for possible survey questions and methods.
Center for Social Development Washington University in St. Louis

Microenterprise Programs: Indicators for Performance Measurement 65
Table 9.10. Microenterprise Programs: End Outcomes for Well-being
1. Greater net worth
2. Greater interest in and knowledge of investing
3. Greater future orientation
4. Lengthened time horizons
5. Greater self-esteem
6. Greater self-efficacy
7. Greater household stability
8. Increase in social connectedness
9. Greater involvement in neighborhood and community affairs
10. Increased voting
11. Greater academic engagement of children of business owners
12. Decrease in unplanned pregnancy for children of business owners Source: Sherraden et al. (1995). While we recognize that there may be community-level outcomes as a result of microenterprise programs, it is difficult to isolate these effects. In fact, such indicators, e.g., employment rates, fluctuate largely due to economic forces beyond the programs’ control. If programs target specific geographic areas, then perhaps effects on community well-being could be approximated if these efforts are concentrated and long-term. See the sections on IDAs for more information.
Center for Social Development Washington University in St. Louis

Asset Building: Increasing Capacity for Performance Measurement and Effects 66
Center for Social Development Washington University in St. Louis

References Akerlof, G.A., & R.E. Kranton. (2002). Identity and schooling: Some lessons from the
economics of education. Journal of Economic Literature, 40, 1167-1201. Anderson, S., Scott, J., & Zhan, M. (2002). Financial Links for Low-Income People (FLLIP): An
evaluation of implementation and initial training activity. Urbana-Champaign, IL: University of Illinois at Urbana-Champaign, School of Social Work.
Ashe, J. (2000). Microfinance in the United States: The working capital experience-ten years of
lending and learning. Journal of Microfinance, 2(2), 22-60. Baker, M., et al. (2002). Evaluation of the HomeLINKS Purchase Program: First annual report.
Cambridge, MA: Abt Associates, Inc. Retrieved from www.abtassoc.com/reports/2001998961273_94292.pdf.
Balfour, D.L, & Smith, J.L. (1996). Transforming lease-purchase housing programs for low
income families: Towards empowerment and engagement. Journal of Urban Affairs, 18(2), 173.
Balkin, S. (1989). Self-employment and low-income people. New York: Praeger. Balkin, S. (1992). Entrepreneurial activities of homeless men. Journal of Sociology and Social
Welfare, 19(4), 129-150. Bandura, A. (1986). Social foundation of thought and action: A social cognitive theory.
Englewood Cliffs, NJ: Prentice Hall. Bates, T. (1996). The financial needs of black-owned businesses. Journal of Developmental
Entrepreneurship, 1(1), 1-15. Bates, T. (1997). Race, self-employment, and upward mobility: An illusive American dream.
Baltimore, MD: Johns Hopkins University Press. Bendick, M., & Egan, M.L. (1987). Transfer payment diversion for small business development:
British and French experience. Industrial and Labor Relations Review, 40, 528-542. Benus, J.M., Johnson, T.B., Wood, M, Grover, N., & Theodore S. (1995). Self-employment
programs: A new re-employment strategy, final report on the UI Self-Employment Demonstration (Occasional Paper 95-4). Washington, DC: U.S. Department of Labor, Unemployment Insurance.
Berger, A.N., & Udell, G.F. (1998). The economics of small-business finance: The Roles of
private equity and debt markets in the financial growth cycle. Journal of Banking and Finance, 22, 613-673.
Center for Social Development Washington University in St. Louis

Asset Building: Increasing Capacity for Performance Measurement and Effects 68
Beverly, S.G., McBride, A.M., & Schreiner, M. (2003). A framework of asset-accumulation stages and strategies. Journal of Family and Economic Issues, 24(2), 143-156.
Bhatt, N. (2002). Inner city entrepreneurship development: The microcredit challenge. San
Francisco: Institute for Contemporary Studies Press. Birley, S. (1989). Female entrepreneurs: Are they really any different? Journal of Small Business
Management, 27(1), 32-37. Black, J., Thetford, T., Edgcomb, E., & Klein, J. (2002). For good measure: Performance in the
U.S. microenterprise industry (FIELD). Washington, DC: Aspen Institute. Boshara, R., Scanlon, E., & Page-Adams, D. (1998). Building assets for stronger families, better
neighborhoods, and realizing the American Dream. Washington, DC: Corporation for Enterprise Development.
Bourque, L.B., & Fielder, E.P. (2003). How to conduct self-administered and mail surveys (2nd
ed.). Thousand Oaks, CA: Sage Publications. Braunstein, S., & Welch, C. (2002, November). Financial literacy: An overview of practice,
research, and policy. Federal Reserve Bulletin, pp. 445-457. Brobeck, S. (2002, February 6). Developing a national strategy to advance financial literacy
(Testimony before the Committee on Banking, Housing, and Urban Affairs of the United States Senate). Washington, DC: Consumer Federation of America.
Caskey, J.P. (1997). Beyond cash-and-carry: Financial savings, financial services, and low-
income households in two communities (Report written for the Consumer Federation of America and the Ford Foundation). Swarthmore, PA: Swarthmore College.
Consumer Federation of America. (1997). The high cost of "banking" at the corner check casher:
Check cashing outlet fees and payday loans. Washington, DC: Author. Corporation for Enterprise Development. (n.d.). CFED's guide to financial education resources
for children and youth. Washington, DC: Author. Curley, J., & Grinstein-Weiss, M. (2003). A comparative analysis of rural and urban saving
performance in Individual Development Accounts (Working paper No. 03-08). St. Louis, MO: Washington University, Center for Social Development.
Danes, S.M., Huddleston-Casas, C., & Boyce, L. (1999). Financial planning curriculum for
teens: Impact evaluation. Financial Counseling and Planning, 10(1), 25-37. De Soto, H. (1989). The other path: The invisible revolution in the third world. New York:
Harper and Row.
Center for Social Development Washington University in St. Louis
References 69
Dennis, W.J. (1998). Business regulation as an impediment to the transition from welfare to self-employment. Journal of Labor Research, 19, 263-276.
Doyle, K., & Black, J. (2001). Performance measures for microenterprise in the United States.
Journal of Microfinance, 3(1), 19-43. Drury, D., Walsh, S., & Strong, M. (1994). Evaluation of the EDWAA Job Creation
Demonstration (Research and evaluation report series 94-G). Washington, DC: U.S. Department of Labor.
Dunn, E. (1997). Diversification in the household economic portfolio. Washington, DC:
Management Systems International. Edgcomb, E. (2002). Improving microenterprise training and technical assistance: Findings for
program managers (FIELD). Washington, DC: Aspen Institute. Edgcomb, E., & Barton, L. (1998). Social intermediation and microfinance programs: A
literature review. Washington, DC: Development Alternatives. Retrieved from http://www.mip.org/pdfs/mbp/social.pdf.
Else, J.F., & Raheim, S. (1992). AFDC clients as entrepreneurs: Self-employment offers an
important option. Public Welfare, 50(4), 36-41. The Enterprise Foundation. (2001a). 10 essential steps for home-buyer training and counseling.
Retrieved July 20, 2004, from http://www.enterprisefoundation.org/resources/ERD/resource.asp?id=1293&c=6&a=view&f=browse.
The Enterprise Foundation. (2001b). Sample home-buyer training curricula: Expert course
offerings. Retrieved July 20, 2004, from http://www.enterprisefoundation.org/resources/ERD/resource.asp?id=1323&c =6&a=view&f=browse.
Evans, D.S., & Leighton, L.S. (1989). Some empirical aspects of entrepreneurship. American
Economic Review, 79, 519-535. Federal Deposit Insurance Corporation. (n.d.). Money smart: An adult education program.
Washington, DC: Author. Friedman, R.E., Grossman, B., & Sahay, R. (1995). Building assets: Self-employment for welfare
recipients. Overview of the findings from the self-employment investment demonstration. Washington, DC: Corporation for Enterprise Development.
Gorham, L., Quercia, R.G., Rohe, W., & Toppen, J. (2002). Low-income families building
assets: Individual Development Account programs lessons and best practices. Chapel Hill, NC: Center for Urban and Regional Studies.
Center for Social Development Washington University in St. Louis

Asset Building: Increasing Capacity for Performance Measurement and Effects 70
Green, R.K., & White, M.J. (1997). Measuring the benefits of homeowning: Effects on children.
Journal of Urban Economics, 41, 441-461. Harkness, J., & Newman, S.J. (2002). Homeownership for the poor in distressed neighborhoods:
Does this make sense? Housing Policy Debate, 13(3), 34. Hatry, H.P., Morley, E., Abravanel, M., & Marshall, M. (2002). Outcome indicators and
outcome management. Washington, DC: The Urban Institute. Helm, J.P., Horvitz, S.M., & Ben-Egypt, N. (1993). Cooperative homeownership: An affordable
alternative. Journal of Housing, 50, 238-40. Hilgert, M.A., Hogarth, J.M., & Beverly, S.G. (2003). Household financial management: The
connection between knowledge and behavior. Federal Reserve Bulletin, 89(7), 309-322. Himes, C., & Servon, L.J. (1998). Measuring client success: An evaluation of ACCION's impact
on microenterprises in the United States (U.S. Issues Series No. 2). Boston: ACCION International.
Hirad, A., & Zorn, P.M. (2001). A little knowledge is a good thing: Empirical evidence of the
effectiveness of pre-purchase homeownership counseling (Low-Income Homeownership Working Paper Series). Cambridge, MA: Harvard University, Joint Center for Housing Studies.
Hogarth, J.M., & Swanson, J. (1995). Using adult education principles in financial education for
low income audiences. Family Economics and Resource Management Biennial, 1, 139-146.
Holin, M.J. & Amendolia, J. (2001). Interim assessment of the HOPE VI Program case study of
Ellen Wilson dwellings in Washington, DC. Cambridge, MA: Abt Associates. Retrieved from www.abtassoc.com/reports/2001409176851.pdf.
Holtz-Eakin, D., Joulfaian, D., & Rosen, H.S. (1994). Sticking it out: Entrepreneurial survival
and liquidity constraints. Journal of Political Economy, 102(1), 53-75. The Housing Partnership Network. (n.d.). Homeownership counseling highlights and best
practices. Retrieved July 20, 2004, from http://www.housingpartnership.net/programs/homeownership/Homebuyer_Education_and_Outreach_Initiative.htm.
Hulme, D., & Mosley, P. (1996). Finance against poverty (Volume I). London: Routledge.
Center for Social Development Washington University in St. Louis

References 71
Hung, C.R. (2002). From south to north: A comparative study of group-based microcredit programs in LDCs and the United States. In J. Carr & Z.Y. Tong (Eds.), Replicating microfinance in the United States (pp. 223-254). Washington, DC: Fannie Mae Foundation.
Jacob, K. (2002). Evaluating your financial literacy program: A practical guide. Chicago:
Woodstock Institute. Jacob, K., Hudson, S., & Bush, M. (2000). Tools for survival: An analysis of financial literacy
programs for lower-income families. Chicago: Woodstock Institute. Johnson, A.K., & Sherraden, M. (1992). Asset-based social welfare policy: Homeownership for
the poor. Journal of Sociology and Social Welfare, 19(3), 65-83. Katz, B., Turner, M.A., Brown, K.D., Cunningham, M., & Sawyer, N. (2003). Rethinking local
affordable housing strategies: Lessons from 70 years of policy and practice. Washington, DC: The Brookings Institution, Center on Urban and Metropolitan Policy and the Urban Institute.
Katz-Reid, C. (2004). Achieving the American Dream? A longitudinal analysis of
homeownership experiences of low-income households (Working Paper 04–04). Seattle, WA: University of Washington, Center for Studies in Demography and Ecology.
King, J. (2000). Assets for the future: Saving for the seventh generation. Fredericksburg, VA:
First Nations Development Institute, Native Assets Research Center. Kosanovich, W.T., & Fleck, H. (2001). Final report: Comprehensive assessment of self-
employment assistance programs. Washington, DC: U.S. Department of Labor, DTI Associates, Inc. and Madonna Yost Opinion Research.
Krugman, P. (1995). Development, geography, and economic theory. Cambridge, MA: MIT
Press. Lam, T.C.M., & Bengo, P. (2003). A comparison of three retrospective self-reporting methods of
measuring change in instructional practices. American Journal of Evaluation, 24(1), 65-80.
Larance, L.Y. (2001). Fostering social capital through NGO design: Grameen Bank membership
in Bangladesh. Journal of International Social Work, 44(1), 7-18. Lazear, D. (1999). Implementation and outcomes of an IDA project (Policy Report). St. Louis,
MO: Washington University, Center for Social Development. Listokin, Y. (2001). Confronting the barriers to Native American homeownership on tribal lands:
The case of the Navajo partnership for housing. Urban Lawyer, 33(2), 44.
Center for Social Development Washington University in St. Louis

Asset Building: Increasing Capacity for Performance Measurement and Effects 72
Losby, J.L., Hein, M.L., & Robinson, J.R. (2003). Michigan IDA partnership: Year 2 program evaluation report. Newark, DE: ISED Consulting and Research. Retrieved from http://www.cmif.org/IDA/Documents/MIDAPYr2Rpt.pdf.
Lytton, R.H., Garman, E.T., & Porter, N.M. (1991). How to use financial ratios when advising
clients. Financial Counseling and Planning, 2, 3-23. Mallach, A. (n.d.). Homeownership education and counseling: Issues in research and definition.
Retrieved July 20, 2004, from http://www.phil.frb.org/cca/capubs/homeowner.pdf. Mason, J.W., & Griffith, R. (1998, Spring). New ratios for analyzing and interpreting personal
financial statements. Journal of the Institute of Certified Financial Planners, pp. 71-87. McBride, A.M. (2003). Asset-ownership among low-income and low-wealth individuals:
Opportunity, stakeholding, and civic engagement (Doctoral Dissertation). St. Louis, MO: Washington University.
McBride, A.M, Lombe, M., & Beverly, S. (2003). The effects of Individual Development
Account programs: Perceptions of participants. St. Louis, MO: Washington University, Center for Social Development.
McBride, A.M., Sherraden, M.S., Johnson, E., & Hanson, S. (2003, August). Defining and
measuring opportunity: Implications for social work practice and social welfare policy. Presentation at the Social Work Policy conference, Charleston, SC.
Mills, G., et al. (2000). Evaluation of asset accumulation initiatives: Final report. Cambridge,
MA: Abt Associates, Inc. Retrieved from http://www.abtassoc.com/reports/9031.pdf. Mills, G. et al. (2001). Assets for Independence Act evaluation: Phase 1 implementation final
report. Cambridge, MA: Abt Associates, Inc. Retrieved from http://www.abtassoc.com/reports/2002689791089_30429.pdf.
Mills, G., et al. (2002). Assets for Independence Act evaluation: Second annual site visit report.
Cambridge, MA: Abt Associates, Inc. Retrieved from http://www.abtassoc.com/reports/AFIA_2nd_annual.pdf.
Moore, A., Beverly, S., Schreiner, M., Sherraden, M., Lombe, J., Cho, E.Y.N., Johnson, L., &
Vonderlack, R. (2002). Saving, IDA programs, and effects of IDAs: A survey of participants (Research Report). St. Louis, MO: Washington University, Center for Social Development.
Nares, P., & Fiet, R. (1989). The self-employment strategy: Gaining momentum, expanding
opportunities. Washington, DC: Corporation for Enterprise Development. Novogratz, J. (1992). Hopeful change: The potential of microenterprise programs as a
community revitalization intervention. New York: Rockefeller Foundation.
Center for Social Development Washington University in St. Louis

References 73
O'Neill, B. (2002). Twelve key components of financial wellness. Journal of Family and
Consumer Sciences, 94(4), 53-58. Page-Adams, D. (2002). Design, implementation, and administration of Individual Development
Account Programs, downpayments on the American Dream Policy Demonstration: A national demonstration of Individual Development Accounts (Research Report). St. Louis, MO: Washington University, Center for Social Development.
Porter, M.E. (1997). New strategies for inner-city economic development. Economic
Development Quarterly, 11(1), 11-27. Pratt, C.C., McGuigan, W.M., & Katzev, A.R. (2000). Measuring program outcomes: Using
retrospective pretest methodology. American Journal of Evaluation, 21(3), 341-349. Project Star. (2003). Beginning with the end in mind: A performance measurement toolkit for
AmeriCorps*VISTA project applicants. Washington, DC: Corporation for National and Community Service.
Rohe, W.M., & Stegman, W. (1992). Public housing home-ownership: Will it work and for
whom? Journal of the American Planning Association, 58(2), 14. Rohe, W.M., & Basolo, V. (1997). Long-term effects of homeownership on the self-perceptions
and social interaction of low-income persons. Environment and Behavior, 29(6), 793. Rosenberg, R. (1999). Measuring microcredit delinquency: How a ratio can hurt you
(Occasional Paper No. 3). Washington, DC: World Bank, Consultative Group to Assist the Poorest. Retrieved from http://www.cgap.org/html/p_occasional_papers03.html.
Rossi, P. & Weber, E. (1996). The social benefits of homeownership: Empirical evidence from
national surveys. Housing Policy Debate, 7, 11-35. Salsich, P.W. (1989). Nonprofit housing organizations. Notre Dame Journal of Law, Ethics &
Public Policy, 4(2), 227-268. Scanlon, E. (1998). Low-income homeownership policy as a community development strategy.
Journal of Community Practice, 5, 137-154. Schreiner, M. (1999a) Lessons for microenterprise programs from a fresh look at the
Unemployment Insurance Self-Employment Demonstration. Evaluation Review, 23(5), 503-526.
Schreiner, M. (1999b). Self-employment, microenterprise, and the poorest Americans. Social
Service Review, 73(4), 496-523.
Center for Social Development Washington University in St. Louis

Asset Building: Increasing Capacity for Performance Measurement and Effects 74
Schreiner, M. (2000). Resources used to produce Individual Development Accounts in the first two years of the experimental program of the American Dream Demonstration at the Community Action Project of Tulsa County. St. Louis, MO: Washington University, Center for Social Development.
Schreiner, M. (2001) Seven aspects of loan size. Journal of Microfinance, 3(2), 27-47. Schreiner, M. (2002a). Scoring: The next breakthrough in microfinance? (Occasional Paper No.
7). Washington, DC: World Bank, Consultative Group to Assist the Poorest. Retrieved from http://www.cgap.org/html/p-occasional-papers07.html.
Schreiner, M. (2002b). What do Individual Development Accounts cost? The first three years at
CAPTC. St. Louis, MO: Washington University, Center for Social Development. Schreiner, M. (2003). The performance of subsidized microfinance organizations-BancoSol of
Bolivia and the Grameen Bank of Bangladesh. Lewiston, NY: Edwin Mellen. Schreiner, M. (2004). Program costs for Individual Development Accounts: Final figures from
CAPTC in Tulsa. St. Louis, MO: Washington University, Center for Social Development. Retrieved from http://www.microfinance.com.
Schreiner, M., Clancy, M., & Sherraden, M. (2002). Final report: Saving performance in the
American Dream Demonstration (Research Report). St. Louis, MO: Washington University, Center for Social Development.
Schreiner, M., & Morduch, J. (2002). Opportunities and challenges for microfinance in the
United States. In J. Carr and Z.Y. Tong (Eds.), Replicating microfinance in the United States (pp. 19-61). Washington, DC: Woodrow Wilson Center Press.
Schreiner, M., Ng, G.T., & Sherraden, M. (2004). Cost-effectiveness in Individual Development
Accounts (Working Paper No. 04-03). St. Louis, MO: Washington University, Center for Social Development.
Schreiner, M., & Sherraden, M. (forthcoming). Can the poor save? Saving and asset
accumulation in Individual Development Accounts. New York: Aldine de Gruyter. Schreiner, M. & Sherraden, M. (2002). Drop-out from Individual Development Accounts:
Prediction and prevention. St. Louis, MO: Washington University, Center for Social Development.
Schreiner, M. & Sherraden, M. (2004). Match rates, Individual Development Accounts, and
saving by the poor. EEA Conference. Schreiner, M., Sherraden, M., Clancy, M., Johnson, L., Curley, J., Grinstein-Weiss, M., Zhan,
M., & Beverly, S. (2001). Savings and asset accumulation in Individual Development Accounts. St. Louis, MO: Washington University, Center for Social Development.
Center for Social Development Washington University in St. Louis

References 75
Schreiner, M., & Woller, G. (2003). Microenterprise in the first and third worlds. World
Development, 31, 1567-1580. Schuchardt, J., Marlowe, J., Parker, L., & Smith, C. (1991). Low income families: Keys to
successful outreach. Advancing the Consumer Interest, 3(2), 27-31. Servon, L.J. (1996). Microenterprise programs and women: Entrepreneurship as individual
empowerment. Journal of Developmental Entrepreneurship, 1(1), 31-55. Servon, L.J. (1997). Microenterprise programs in U.S. inner cities: Economic development or
social welfare? Economic Development Quarterly, 11(2), 166-180. Servon, L.J., & Bates, T. (1998). Microenterprise as an exit route from poverty:
Recommendations for programs and policy makers. Journal of Urban Affairs, 20, 419-441.
Shelton, G.G., & Hill, O.L. (1995). First-time home buyers programs as an impetus for change in
budget behavior. Financial Counseling and Planning, 6, 83-92. Sherraden, M. (1988). Rethinking social welfare: Toward assets. Social Policy, 18(3), 37-43. Sherraden, M. (1991) Assets and the poor: A new American welfare policy. Armonk, NY: M.E.
Sharpe. Sherraden, M. (2000). On Costs and the Future of IDAs (Perspective). St. Louis, MO:
Washington University, Center for Social Development. Sherraden, M. (2001). Asset-building policies and programs for the poor. In T. Shapiro and E.
Wolff (Eds.), Assets for the poor: Spreading the benefits of asset ownership (pp. 302-333). New York: Russell Sage.
Sherraden, M. (2002). Individual Development Accounts: Summary of research. St. Louis, MO:
Washington University, Center for Social Development. Sherraden, M., Hong, P., & Moore, A. (2000, January). Savers speak: Case studies with IDA
participants. Presentation at the Society for Social Work and Research Annual Conference, Charleston, SC.
Sherraden, M., et al. (1995). IDA evaluation handbook: A practical guide and tools for
evaluation of pioneering IDA projects. St. Louis, MO: Washington University, Center for Social Development.
Sherraden, M.S., McBride, A.M., Hanson, S., Johnson, E., & Sherraden, M. (2004,
February). The meaning of savings in low-income households: Evidence from Individual Development Accounts. Presented at the Eastern Economic Association Meetings, Washington, DC.
Center for Social Development Washington University in St. Louis

Asset Building: Increasing Capacity for Performance Measurement and Effects 76
Sherraden, M.S., McBride, A.M., Johnson, L., & Hanson, S. (forthcoming). The experience of saving: In-depth interviews with IDA participants. St. Louis, MO: Washington University, Center for Social Development.
Sherraden, M.S., Sanders, C.K., & Sherraden, M. (1998). From the eyes of the entrepreneurs:
Microenterprise as an anti-poverty strategy (Report to the Self-Employment Learning Project). Washington, DC: Aspen Institute.
Sherraden, M.S., Williams, T., McBride, A.M., & Ssewamala, F. (2003, February). Overcoming
poverty: Supported saving as a household development strategy. Presentation at the Council on Social Work Education Annual Conference, Atlanta, GA.
Soloman, L.D. (1992). Microenterprise: Human reconstruction in America's inner cities.
Harvard Journal of Law and Public Policy, 15(1), 191-221. Spalter-Roth, R., Hartmann, H.I., & Shaw, L.B. (1993). Exploring the characteristics of self-
employment and part-time work among women. Washington, DC: Institute For Women's Policy Research.
Spalter-Roth, R., Soto, E., & Zandniapour, L. (1994). Microenterprise and women: The viability
of self-employment as a strategy for alleviating poverty. Washington, DC: Institute for Women's Policy Research.
Stegman, M., Faris, R., & Gonzalez, O. (2001). The impacts of IDA programs on family savings
and asset-holding. Chapel Hill, NC: Center for Community Capitalism. Sternberg, M.T. (1998). Peer lending: Social service or good business? Economic Development
Commentary, 22(3), 15-21. Taub, R.P. (1998). Making the adaptation across cultures and societies: A report on an attempt to
clone the Grameen Bank in Southern Arkansas. Journal of Developmental Entrepreneurship, 3(1), 53-69.
Taylor, M. (1999). Survival of the fittest? An analysis of self-employment duration in Britain.
Economic Journal, 109, C140-C155. Toussaint-Comeau, M., & Rhine, S.L.W. (2000). Delivery of financial literacy programs
(Consumer Issues Research Series). Chicago: Federal Reserve Bank of Chicago, Consumer and Community Affairs Division.
Van Ryzin, G.G. (1994). Residents' sense of control and ownership in a mutual housing
association. Journal of Urban Affairs,16(3), 241-53. Vitt, L.A., Anderson, C., Kent, J., Lyter, D.M., Siegenthaler, J.K., & Ward, J. (2000). Personal
finance and the rush to competence: Financial literacy education in the U.S. Middleburg, VA: Institute for Socio-Financial Studies.
Center for Social Development Washington University in St. Louis

References 77
Weber, R.N., & Smith, J.L. (2003). Assets and neighborhoods: The role of individual assets in
neighborhood revitalization. Housing Policy Debate, 14(1-2), 34. William M. Mercer Incorporated. (2001). FLLIP financial literacy program: Key stakeholder
focus groups, report of key findings. Chicago: Author. Wyly, E.K, Cooke, T.J., Hammel, D.J., Holloway, S.R., & Hudson, M. (2001). Low to moderate
income lending in context: Progress report on the neighborhood impacts of homeownership policy. Housing Policy Debate, 12(1), 41.
Yunus, M. (1998). Poverty alleviation: Is economics any help? Lessons from the Grameen Bank
experience. Journal of International Affairs, 52(1), 47-65. Yunus, M. (1999). The Grameen Bank. Scientific American, 281(5), 114-119. Zhan, M. (2003). Savings outcomes of single mothers in Individual Development Accounts. St.
Louis, MO: Washington University, Center for Social Development.
Center for Social Development Washington University in St. Louis

Asset Building: Increasing Capacity for Performance Measurement and Effects 78
Center for Social Development Washington University in St. Louis

Appendix A Methods for Assessing Outputs and Outcomes of Asset-Building Programs
While there are numerous resources that exist to promote performance measurement, the following suggests research designs and methods specific to the asset-building context. We borrow heavily from the 1995 IDA Evaluation Handbook: A Practical Guide for Evaluation of Pioneering IDA Projects by Michael Sherraden and colleagues at the Center for Social Development. We add unique content that pertains directly to the most prevalent asset-building programs implemented by Entrepreneur Corps sponsoring organizations. Our suggestions are based on the possible outputs and outcome indicators identified in this report. Performance measurement should be specific to the program context; each program is different. The choice of methodological strategy, design, and methods should be driven by specific research questions. For example:
• What is being implemented by the asset-building program? What is the level of effort in the asset-building program or how many people are participating? Answering these questions requires process measurement.
• Are the participants saving? Have they increased their financial knowledge? Answering
these questions requires outcome measurement. Process Measurement Process measurement occurs at the program level, addressing design, implementation, and administration. The intention is to collect information regarding program outputs. Implementation does not occur as a neat and separate activity. The evaluator must also look at design (what exactly is being implemented) and administration (running the program on a day to day basis after it is "implemented"). Process measurement assesses the structure and rules of the program, staffing, procedures, activities, and so forth. Questions of who, what, how, and under what circumstances are important. The evaluator will want to examine both program characteristics and participant characteristics, and how the two fit together or do not fit together. This type of evaluation may be inductive in that the evaluation is open to discovery of unanticipated relationships. It is a learning evaluation in that the evaluator seeks not only answers to particular questions, but also to be enlightened by any unanticipated information and to create new questions altogether. With this said, however, it is recommended that the data sources and methods be targeted to the specific output questions. A logic model framework supports targeted assessment.
Center for Social Development Washington University in St. Louis
Asset Building: Increasing Capacity for Performance Measurement and Effects 80
Data sources and methods. The main data sources for process measurement are program staff and program documents or agency records. Program staff include the agency director, supervisors, all workers in the program, and support staff. This category should also include staff of cooperating agencies, such as financial institutions, organizational partners, public welfare offices, housing organizations, etc. Program documents include planning documents, proposals, brochures, budgets, financial reports, program-related correspondence, program records, personnel files, activity sheets, appointment records, staff assignment sheets, meeting minutes, telephone logs, training materials, program reports, and public communications. Program documents on clients include eligibility criteria, records of the selection process, attendance records, referral forms, progress charts, and case files. These main data sources can be supplemented by data that comes directly from participants. For this purpose, the evaluator would be well-served by obtaining information from two groups: those who are most committed and most successful in the program, and those who are least committed and least successful. In previous sections we have suggested outputs that correspond to both. The value in working with the extremes is that the evaluator determines what is working well and for whom, and what is working poorly and for whom. Also, if the participant population is comprised of distinct groups (for example, by age, race, family circumstances, citizenship status), it would be useful to obtain the perspectives of these different groups. Intermediate and End Outcome Assessments Asset-building programs are designed to promote asset accumulation. Therefore, a fundamental type of evaluation is to assess whether this is happening. If asset-building programs do not enable participants to accumulate assets, what good could they possibly be? This question is not purely rhetorical. The evaluator must always remain open to other "attainments" in the program, both good and bad. For example, perhaps participants do not accumulate assets, but they do become financially informed and aware. Or perhaps participants do accumulate assets, but only because of unacceptable human sacrifice in the family, such as forgoing meals. All of this is important information. Ideally, asset-building participants would be compared to another group (a control or comparison group) to ascertain differences in asset accumulation. It is also important that asset accumulation is shown to be linked or not linked with program outputs. In this sense, connections should be made between assessment of design, implementation, and administration and assessment of outcomes.
Center for Social Development Washington University in St. Louis

Appendix A 81
Data sources and methods. The main data sources are asset-building program participants and program records. Program records are indispensable as an official record of asset accumulation patterns and amounts. Asset accumulation information may be held by a cooperating financial institution and/or by the program. Quantitative data can also be enriched by details and examples that are possible with qualitative methods. Survey methods can be supplemented by more in-depth methods such as focus groups or in-depth interviews. Detailed information about the process from the participant's perspective is essential. No one can explain as well as the participants themselves how and why they accumulate or do not accumulate assets in the program. Most of the asset-building programs described here include some type of financial or asset-specific education. The data source for the intermediate outcomes related to education would most likely be self-administered surveys. Participants could be asked to complete one survey during the last session of an education series. Or, they could be asked to complete a short survey at the end of every session. For example, participants could complete a short survey about budgeting immediately after the session on budgeting. Refer to the following sample survey questions.
Center for Social Development Washington University in St. Louis

Asset Building: Increasing Capacity for Performance Measurement and Effects 82
Sample Survey Questions for Intermediate Outcomes of Budgeting and Monitoring Sessions
Outcome Survey Question
Have written financial goals Do you have written saving goals for this year? (yes, no)
Have a written budget or spending plan for the year Do you have a written budget or spending plan for this year? (yes, no)
Keep written records of spending How often do keep written records of what you spend? (Would you say almost never, seldom, about half the time, often, or almost always?)
Compare planned spending to regular spending How often do you compare what you plan to spend to what you actually spend? (almost never, seldom, about half the time, often, or almost always)
Compare prices when shopping How often do you compare prices when you shop? (almost never, seldom, about half the time, often, or almost always)
Use coupons when grocery shopping How often do you use coupons when grocery shopping? (almost never, seldom, about half the time, often, or almost always)
Understand the expenses of paying bills late I understand the expenses of paying bills late (strongly agree, agree, disagree, strongly agree) *
Understand that small reductions in weekly spending can add up to large increases in saving over time
You can build large savings over time by making small reductions in your weekly spending (true, false)
Note: Some questions in this table were adapted from Shelton & Hill (1995); Danes et al. (1999); and Anderson et al. (2002).
* This question is designed for use in a retrospective pretest design. See the Money Smart curriculum (FDIC, n.d.) for similar questions on other financial education topics.
Center for Social Development Washington University in St. Louis

Appendix A 83
The data source for the end outcomes identified in this report would most likely be a survey completed by participants some time after the program ends. For example, participants might be asked to return a mail survey six months, 12 months, and/or 18 months after participating in education. This time lag is important because people need time to achieve many of the outcomes, e.g., arranging for direct deposit, beginning to save regularly, reducing debt. The time lag also allows staff to observe whether the program has lasting effects. A mail survey may be the only feasible way to collect data several months after the program ends, but mail surveys often have very low response rates. Bourque and Fielder (2003) offer suggestions for administering a mail survey. For a number of the end outcomes listed in this report, which pertain to psychological and social well-being, a simple survey could be constructed from the following items. Respondents would read a statement and then respond by agreeing, disagreeing, or neither. Programs then report the number of responses in each class for each item at year-end. We list possible items modified from questionnaires used in the randomized experiment that was part of the American Dream Demonstration of IDAs.
1. I like my work 2. If I wanted to start my own business, I could do it 3. I feel hopeful about my future 4. I have a mental/physical disability that limits the kind or amount of work I can do 5. I feel healthy 6. Society discriminates against people like me 7. If I set my mind to it, I can do what I set out to do 8. I am involved with my children’s schools 9. I expect that my children will graduate from college 10. People in my community respect me 11. If I need help, family and friends are there for me 12. I go to church regularly 13. I voted in the last presidential election 14. I voted in the last non-presidential election 15. I have a good relationship with my spouse or partner 16. I have a good relationship with my parents 17. I have a good relationship with my children 18. I have several friends whom I see regularly 19. When I disagree with someone, I can talk about it without getting too upset 20. I’m happy with my home 21. I’m happy with my car 22. I can make ends meet without too much trouble 23. I am getting ahead financially 24. If I get sick, I can get the medical care I need 25. I expect to live as long as most people 26. I am comfortable putting money in a bank account 27. I like my neighborhood 28. I usually pay off the balance on my credit card at the end of each month 29. I understand taxes well enough to get the deductions I deserve 30. I keep track of my income and expenses
Center for Social Development Washington University in St. Louis

Asset Building: Increasing Capacity for Performance Measurement and Effects 84
Research Designs The three most important design questions are: (1) From whom will data be collected? (2) How often? (3) In what relation to the asset-building program? Below we outline the basic design choices that are likely to apply to intermediate and end outcome assessments. In applying any of these designs, there may be issues in sampling (who is selected to respond and why), adjustments in data to solve particular problems, and strategies for statistical analysis. All of these issues require particular knowledge. Program staff may have this knowledge, or they may call on expert advisors or consultants. Cross-sectional design. A cross-sectional design is the simplest strategy for data collection because it involves data collection at a single point in time. Cross sectional designs are common because of simplicity and low cost. They are most useful for descriptive data (what is happening), and for simple associations or correlational data (one thing appears to be related to another). Cross sectional data can be gathered by any method—survey, in-depth interviews, focus groups, or case study methods. Regardless of use, the interpretation of cross-sectional data is limited to associations. This type of design cannot lead to causal interpretations. Pretest, posttest design. Another variation of non-experimental design is before and after program participation. In this design, the participant group is assessed before the program begins and again after the program has been running for a period of time. Ordinarily this design would be applied only with quantitative data, most likely in the form of a survey. The considerable advantage of this design is that baseline measures are taken before the program changes anything about the participants' lives. In a sense, the participants serve as their own “controls.” We assume that the differences between measures at time one and time two are due to program participation. But we cannot rule out the possibility that something else caused the differences, so causal conclusions must still be limited. Retrospective pretest design. We also recommend the “retrospective pretest” design, an alternative to the traditional pretest-posttest design. With this design, at the end of each session (or at the end of the series) or delivery of a program service, participants report on their current knowledge, behaviors, or attitudes and then use the same measures to describe their knowledge, behavior, or attitudes at the beginning of the session or prior to delivery of the service. The following are examples on pairs of questions for a session on checking delivered during financial education.
Center for Social Development Washington University in St. Louis

Appendix A 85
Example Questions for a Retrospective Pretest Design*
After the Session Before the Session
I know how to:
Compare types of checking accounts
Open a checking account
Write checks
Keep records for a checking account
I knew how to:
Compare types of checking accounts
Open a checking account
Write checks
Keep records for a checking account *Answers on a four-point scale: strongly disagree, disagree, agree, strongly agree Source: FDIC (n.d.) This type of design (sometimes called a “post-then-pre” design) is appropriate when participants are likely to overestimate their knowledge and skills on a pretest (Lam & Bengo, 2003; Pratt, McGuigan, & Katzev, 2000). Pretest overestimation is a likely problem for financial education participants who may not fully understand, at the time of the pretest, the concepts and skills to be taught during the program.6 The evaluation materials provided in the Money Smart curriculum use a retrospective pretest approach (Federal Deposit Insurance Corporation, n.d.). Longitudinal design. An extension of cross-sectional design is to take measures at two or more points in time. This could be every six months, every year, or some other schedule, depending upon the judgment of evaluators. Data collected in a longitudinal design have greater potential than in a cross-sectional design. Descriptions can be extended to show trends, which can be very important. Analyses can show that values on measures at one point in time are associated with values on other measures at a later point in time. In other words, you can show associations across time. Although longitudinal design is not complicated, it is time-consuming and expensive. Therefore, it is not nearly as common as cross-sectional design. Ordinarily, longitudinal design is used only with survey methodology, where it is a powerful tool. In sophisticated statistical analyses, if samples are large enough, it is possible to analyze several alternative explanations simultaneously. Although definitive causal statements cannot be made from such analyses, the longitudinal nature of the data does enable much stronger conclusions than are possible with cross-sectional designs. Experimental design. Experimental designs include measurement of two groups (sometimes more than two groups, but this is uncommon). Experimental designs allow evaluators to compare changes in the participant group with a similar group (as similar as possible) that does not participate in the program, known as the comparison or control group. By assessing differences between the two groups, effects of the program can be ascertained. Ordinarily, experimental
6 For example, before attending a session on basic banking, a person may overestimate her ability to compare checking accounts because she is not aware of the range of fees that should be considered.
Center for Social Development Washington University in St. Louis

Asset Building: Increasing Capacity for Performance Measurement and Effects 86
designs are used only with quantitative methods, because the designs impose a logic that is best fulfilled by statistical tests.
Center for Social Development Washington University in St. Louis