asset depreciation study for the ontario energy board · asset depreciation study for the ontario...
TRANSCRIPT

Asset Depreciation Study for the
Ontario Energy Board
Kinectrics Inc. Report No: K-418033-RA-001-R000
July 8, 2010 Kinectrics Inc. 800 Kipling Avenue, Unit 2 Toronto, ON Canada M8Z 6C4 www.kinectrics.com

Asset Depreciation Study for the Ontario Energy Board EXECUTIVE SUMMARY
KINECTRICS INC ii K-418033-RA-001-R000
DISCLAIMER
The views expressed in this report are those of Kinectrics Inc. and do not necessarily represent the views of, and should not be attributed to the Ontario Energy Board, any individual Board member, or Board staff.
Asset Depreciation Study for the Ontario Energy Board EXECUTIVE SUMMARY
KINECTRICS INC iii K-418033-RA-001-R000
EXECUTIVE SUMMARY
Generally accepted accounting principles (GAAP) requires entities with property, plant and equipment (PP&E) to amortize the cost of assets over the period of time that they provide useful service. Prior to adoption of International Financial Reporting Standards (IFRS), GAAP in Canada permitted the use of asset service lives specified by the regulator. IFRS (without approval of a standard for Rate-regulated Activities) does not allow for the use of externally mandated depreciation rates. The Ontario Energy Board (OEB) stipulated that all Ontario’s utilities are expected to adopt IFRS effective January 1, 2011
1. At the same time, OEB is requiring all
distributors to adopt useful life estimates that do not depend on the regulator and are determined by independent asset service life studies. In addition, IFRS is requiring componentization of assets placed in service by distributors at a sufficient level of detail to recognize that portions of an overall asset may be replaced or refurbished during the life of the asset of which they are a component, while the overall life of the asset may be somewhat longer. The purpose of this Report is to assist utilities in making the transition from GAAP to IFRS and to assist them with determining appropriate initial service lives for assets most commonly used in the distribution of electricity in Ontario. This approach is considered an effective way to minimize the need and cost to Ontario consumers of a myriad of like studies by individual distributors. This report may also serve as a reference guide for the OEB in reviewing rate applications while keeping the responsibility for selecting and substantiating asset service lives with the utilities. This Report identifies and describes common groups of assets and their most common “components”. Total service lives are ascribed to each component, and assets are assigned to one of the following “parent” systems:
Overhead Lines (OH)
Transformer and Municipal Stations (TS&MS)
Underground Systems (UG)
Monitoring and Control Systems (S) For each of the assets and their respective components, a useful life range and a typical useful life value within the range are given. This information is a composite of industry values known to Kinectrics Inc. (see Section E - 6) and information from six Ontario Local Distribution Companies (LDCs) of varying sizes and geographical locations selected as a sample, and with whom Kinectrics Inc. met on an individual basis. It is also recognized that the useful lives of assets are dependent on a number of Utilization Factors (UFs) that are present within each jurisdiction. The degrees of impact of these influencing factors were qualitatively determined using information gathered from the LDCs. The UFs are identified as:
Mechanical Stress
Electrical Loading
Operating Practices
Environmental Conditions
Maintenance Practices
Non-Physical Factors By considering the useful life ranges and the extent to which the utilization factors impact their assets, utilities will be able to select appropriate depreciation periods for their asset groups as
1 Report of the Board – Transition to International Financial Reporting Standards, July 28, 2009

Asset Depreciation Study for the Ontario Energy Board EXECUTIVE SUMMARY
KINECTRICS INC iv K-418033-RA-001-R000
shown in the example for Power Transformers in Section E - 5 of this Report. The example demonstrates how UFs can be used in conjunction with local circumstances to estimate an appropriate depreciation period within the prescribed useful life range. Table F-1 summarizes useful lives and the factors impacting those lives as developed by this report. For completeness, Kinectrics has included a table that summarizes typical useful lives for Ontario’s Local Distribution Companies’ non-distribution assets, sometimes referred to as Minor Assets (Table F-2). The useful life values for Minor Assets were based on utility practices without further analysis. In addition to the useful life information presented in this Report, Kinectrics has identified several areas for improvement that, once addressed, can enhance the Local Distributors’ ability to improve the accuracy of their determination of asset service lives.
Asset Depreciation Study for the Ontario Energy Board CREDENTIALS OF THE CONSULTANT
KINECTRICS INC v K-418033-RA-001-R000
CREDENTIALS OF THE CONSULTANT
Kinectrics Inc is a recognized expert in determining useful lives of asset as a leader in developing “state of the art” Asset Condition Assessment methodology that estimates condition of assets based on their End-of-Life criteria and successfully completed a number of large scale Asset Management projects. These projects involved condition assessments of both station and lines distribution assets and included performing risk assessments based on the findings and recommending future life cycle sustaining investments, both capital and maintenance in nature. Over the last year Kinectrics Inc completed a number of projects aimed at assisting Ontario’s LDCs with the IFRS conversion. The projects involved developing LDC-specific assets groupings and componentization and for each asset grouping/component providing industry based useful life ranges. Kinectrics Inc has also provided information on typical industry time-based maintenance intervals and qualitative assessment of factors that may influence typical life within the range, such as operational practices, utilization, functional requirements, environmental impact etc. In addition, Kinectrics has acted as the Technical Due Diligence Consultant in many of the Ontario LDC mergers, in which depreciation assessments and valuation of assets were major tasks. Kinectrics Inc observations on the useful life of assets as they relate to IFRS have recently been published in the November 2009 Special Edition of “The Distributor”, an Electricity Distributors Association (EDA) publication.
Kinectrics staff understands power systems, having conducted comprehensive work on line design, standards, protection, losses and virtually every other aspect of planning and design for the last 30 years. Kinectrics has high voltage and high current lab testing expertise and has conducted many distribution asset failure investigations. Our theoretical knowledge is backed up by practical experience with power system components. This equipment expertise is of great practical value in working with utility staff whose mandate is to achieve the optimal physical and economic life cycle for these assets. Kinectrics asset management experience goes far deeper than logging equipment populations and demographics in computer databases. Kinectrics has a unique and cost-effective capability covering a wide spectrum of areas including:
Intimate knowledge of transmission and distribution systems equipment and their needs, and additional lifecycle-management or test result analysis services that we offer beyond testing and that are based on this extensive experience and understanding
Kinectrics’ testing facility that is world industry leader in capability and expertise in this domain and includes access to over 25 world-class Ontario-based laboratory and testing facilities, and to a range of proprietary technologies and processes
In-depth experience in the management and execution of utility projects for numerous clients in Ontario and Canada, as well as North America and the rest of the world
Access to staff from Kinectrics and other utility experts in key focus areas
Operation under the ISO 9001 quality management system, with additional ISO 17025 qualification for key laboratories
Project execution at the Project Management Professional (PMP) level
Asset Depreciation Study for the Ontario Energy Board CREDENTIALS OF THE CONSULTANT
KINECTRICS INC vi K-418033-RA-001-R000
(This page has intentionally been left blank.)
Asset Depreciation Study for the Ontario Energy Board TABLE OF CONTENTS
KINECTRICS INC vii K-418033-RA-001-R000
TABLE OF CONTENTS
EXECUTIVE SUMMARY .............................................................................................................................. iii
CREDENTIALS OF THE CONSULTANT ...................................................................................................... v
TABLE OF CONTENTS .............................................................................................................................. vii
LIST OF TABLES ........................................................................................................................................ xv
LIST OF FIGURES ..................................................................................................................................... xix
A INTRODUCTION .................................................................................................................................. 1
B OBJECTIVE AND SCOPE .................................................................................................................... 3
B - 1 OBJECTIVE .......................................................................................................................... 3 B - 2 SCOPE OF WORK ............................................................................................................... 3
C EXECUTION PROCESS ...................................................................................................................... 5
D DELIVERABLES ................................................................................................................................... 7
E METHODOLOGY .................................................................................................................................. 9
E - 1 DEFINITIONS ....................................................................................................................... 9 E - 2 INDUSTRY RESEARCH......................................................................................................12 E - 3 UTILITY INTERVIEWS ........................................................................................................13 E - 4 COMBINING INDUSTRY RESEARCH AND UTILITY INTERVIEW FINDINGS ..................13 E - 5 EXAMPLE OF USING THE REPORT .................................................................................14 E - 6 STATISTICAL ANALYSIS....................................................................................................14
F SUMMARY OF RESULTS AND FINDINGS ....................................................................................... 16
G CONCLUSIONS .................................................................................................................................. 21
H APPENDIX - DERIVATION OF USEFUL LIVES ................................................................................ 23
1. Fully Dressed Wood Poles ............................................................................................................ 25 1.1 Description .......................................................................................................................................25
1.1.1 Componentization Assumptions................................................................................................................ 25 1.1.2 System Hierarchy ..................................................................................................................................... 25
1.2 Degradation Mechanism ..................................................................................................................25 1.3 Useful Life ........................................................................................................................................26
1.3.1 Useful Life Data ........................................................................................................................................ 26 1.4 Impact of Utilization Factors ............................................................................................................28
1.4.1 Utility Interview Data ................................................................................................................................. 28
2. Fully Dressed Concrete Poles ....................................................................................................... 30 2.1 Description .......................................................................................................................................30
2.1.1 Componentization Assumptions................................................................................................................ 30 2.1.2 System Hierarchy ..................................................................................................................................... 30
2.2 Degradation Mechanism ..................................................................................................................30 2.3 Useful Life ........................................................................................................................................30
2.3.1 Useful Life Data ........................................................................................................................................ 30 2.4 Impact of Utilization Factors ............................................................................................................31
2.4.1 Utility Interview Data ................................................................................................................................. 31
Asset Depreciation Study for the Ontario Energy Board TABLE OF CONTENTS
KINECTRICS INC viii K-418033-RA-001-R000
3. Fully Dressed Steel Poles ............................................................................................................. 33 3.1 Description .......................................................................................................................................33
3.1.1 Componentization Assumptions................................................................................................................ 33 3.1.2 System Hierarchy ..................................................................................................................................... 33
3.2 Degradation Mechanism ..................................................................................................................33 3.3 Useful Life ........................................................................................................................................33
3.3.1 Useful Life Data ........................................................................................................................................ 33 3.4 Impact of Utilization Factors ............................................................................................................34
3.4.1 Utility Interview Data ................................................................................................................................. 35
4. Overhead Line Switch ................................................................................................................... 36 4.1 Asset Description .............................................................................................................................36
4.1.1 Componentization Assumptions................................................................................................................ 36 4.1.2 Design Configuration ................................................................................................................................ 36 4.1.3 System Hierarchy ..................................................................................................................................... 36
4.2 Degradation Mechanism ..................................................................................................................36 4.3 Useful Life ........................................................................................................................................37
4.3.1 Useful Life Data ........................................................................................................................................ 37 4.4 Impact of Utilization Factors ............................................................................................................38
4.4.1 Utility Interview Data ................................................................................................................................. 38
5. Overhead Line Switch Motor ......................................................................................................... 39 5.1 Asset Description .............................................................................................................................39
5.1.1 Componentization Assumptions................................................................................................................ 39 5.1.2 System Hierarchy ..................................................................................................................................... 39
5.2 Degradation Mechanism ..................................................................................................................39 5.3 Useful Life ........................................................................................................................................39
5.3.1 Useful Life Data ........................................................................................................................................ 39 5.4 Impact of Utilization Factors ............................................................................................................40
5.4.1 Utility Interview Data ................................................................................................................................. 40
6. Overhead Line Switch Remote Terminal Unit ............................................................................... 42 6.1 Asset Description .............................................................................................................................42
6.1.1 Componentization Assumptions................................................................................................................ 42 6.1.2 System Hierarchy ..................................................................................................................................... 42
6.2 Degradation Mechanism ..................................................................................................................42 6.3 Useful Life ........................................................................................................................................42
6.3.1 Useful Life Data ........................................................................................................................................ 42 6.4 Impact of Utilization Factors ............................................................................................................43
6.4.1 Utility Interview Data ................................................................................................................................. 43
7. Overhead Integra Switch ............................................................................................................... 45 7.1 Asset Description .............................................................................................................................45
7.1.1 Componentization Assumptions................................................................................................................ 45 7.1.2 System Hierarchy ..................................................................................................................................... 45
7.2 Degradation Mechanism ..................................................................................................................45 7.3 Useful Life ........................................................................................................................................45
7.3.1 Useful Life Data ........................................................................................................................................ 45 7.4 Impact of Utilization Factors ............................................................................................................46
7.4.1 Utility Interview Data ................................................................................................................................. 46
8. Overhead Conductors ................................................................................................................... 48 8.1 Asset Description .............................................................................................................................48
8.1.1 Componentization Assumptions................................................................................................................ 48 8.1.2 Design Configuration ................................................................................................................................ 48 8.1.3 System Hierarchy ..................................................................................................................................... 48
8.2 Degradation Mechanism ..................................................................................................................48 8.3 Useful Life ........................................................................................................................................49
8.3.1 Useful Life Data ........................................................................................................................................ 49 8.4 Impact of Utilization Factors ............................................................................................................50
8.4.1 Utility Interview Data ................................................................................................................................. 50
Asset Depreciation Study for the Ontario Energy Board TABLE OF CONTENTS
KINECTRICS INC ix K-418033-RA-001-R000
9. Overhead Transformers and Voltage Regulators .......................................................................... 52 9.1 Asset Description .............................................................................................................................52
9.1.1 Componentization Assumptions................................................................................................................ 52 9.1.2 Design Configuration ................................................................................................................................ 52 9.1.3 System Hierarchy ..................................................................................................................................... 52
9.2 Degradation Mechanism ..................................................................................................................52 9.3 Useful Life ........................................................................................................................................52
9.3.1 Useful Life Data ........................................................................................................................................ 53 9.4 Impact of Utilization Factors ............................................................................................................53
9.4.1 Utility Interview Data ................................................................................................................................. 54
10. Overhead Shunt Capacitor Banks ................................................................................................. 55 10.1 Asset Description ........................................................................................................................55
10.1.1 Componentization Assumptions .............................................................................................................. 55 10.1.2 System Hierarchy ................................................................................................................................... 55
10.2 Degradation Mechanism .............................................................................................................55 10.3 Useful Life ...................................................................................................................................55
10.3.1 Useful Life Data ...................................................................................................................................... 55 10.4 Impact of Utilization Factors ........................................................................................................56
11. Reclosers ....................................................................................................................................... 57 11.1 Asset Description ........................................................................................................................57
11.1.1 Componentization Assumptions .............................................................................................................. 57 11.1.2 Design Configuration .............................................................................................................................. 57 11.1.3 System Hierarchy ................................................................................................................................... 57
11.2 Degradation Mechanism .............................................................................................................57 11.3 Useful Life ...................................................................................................................................57
11.3.1 Useful Life Data ...................................................................................................................................... 57 11.4 Impact of Utilization Factors ........................................................................................................58
11.4.1 Utility Interview Data ............................................................................................................................... 59
12. Power Transformers ...................................................................................................................... 60 12.1 Asset Description ........................................................................................................................60
12.1.1 Componentization Assumptions .............................................................................................................. 60 12.1.2 System Hierarchy ................................................................................................................................... 60
12.2 Degradation Mechanism .............................................................................................................60 12.3 Useful Life ...................................................................................................................................61
12.3.1 Useful Life Data ...................................................................................................................................... 61 12.4 Impact of Utilization Factors ........................................................................................................62
12.4.1 Utility Interview Data ............................................................................................................................... 62
13. Station Service Transformers ........................................................................................................ 63 13.1 Asset Description ........................................................................................................................63
13.1.1 Componentization Assumptions .............................................................................................................. 63 13.1.2 System Hierarchy ................................................................................................................................... 63
13.2 Degradation Mechanism .............................................................................................................63 13.3 Useful Life ...................................................................................................................................63
13.3.1 Useful Life Data ...................................................................................................................................... 63 13.4 Impact of Utilization Factors ........................................................................................................64
13.4.1 Utility Interview Data ............................................................................................................................... 64
14. Station Grounding Transformers ................................................................................................... 66 14.1 Asset Description ........................................................................................................................66
14.1.1 Componentization Assumptions .............................................................................................................. 66 14.1.2 System Hierarchy ................................................................................................................................... 66
14.2 Degradation Mechanism .............................................................................................................66 14.3 Useful Life ...................................................................................................................................66
14.3.1 Useful Life Data ...................................................................................................................................... 66 14.4 Impact of Utilization Factors ........................................................................................................67
15. Station Direct Current System ....................................................................................................... 68

Asset Depreciation Study for the Ontario Energy Board TABLE OF CONTENTS
KINECTRICS INC x K-418033-RA-001-R000
15.1 Asset Description ........................................................................................................................68 15.1.1 Componentization Assumptions .............................................................................................................. 68 15.1.2 System Hierarchy ................................................................................................................................... 68
15.2 Degradation Mechanism .............................................................................................................68 15.3 Useful Life ...................................................................................................................................69
15.3.1 Useful Life Data ...................................................................................................................................... 69 15.4 Impact of Utilization Factors ........................................................................................................70
15.4.1 Utility Interview Data ............................................................................................................................... 70
16. Station Metal Clad Switchgear ...................................................................................................... 71 16.1 Asset Description ........................................................................................................................71
16.1.1 Componentization Assumptions .............................................................................................................. 71 16.1.2 Design Configuration .............................................................................................................................. 71 16.1.3 System Hierarchy ................................................................................................................................... 71
16.2 Degradation Mechanism .............................................................................................................71 16.3 Useful Life ...................................................................................................................................71
16.3.1 Useful Life Data ...................................................................................................................................... 71 16.4 Impact of Utilization Factors ........................................................................................................72
16.4.1 Utility Interview Data ............................................................................................................................... 72
17. Station Independent Breakers ....................................................................................................... 74 17.1 Asset Description ........................................................................................................................74
17.1.1 Componentization Assumptions .............................................................................................................. 74 17.1.2 Design Configuration .............................................................................................................................. 74 17.1.3 System Hierarchy ................................................................................................................................... 74
17.2 Degradation Mechanism .............................................................................................................75 17.2.1 Oil Breakers ............................................................................................................................................ 75 17.2.2 Gas (SF6) Breakers ................................................................................................................................ 76 17.2.3 Air Blast Breakers ................................................................................................................................... 76 17.2.4 Air Magnetic Breakers ............................................................................................................................ 76 17.2.5 Vacuum Breakers ................................................................................................................................... 76
17.3 Useful Life ...................................................................................................................................77 17.3.1 Useful Life Data ...................................................................................................................................... 77
17.4 Impact of Utilization Factors ........................................................................................................78 17.4.1 Utility Interview Data ............................................................................................................................... 78
18. Station Switch ................................................................................................................................ 79 18.1 Asset Description ........................................................................................................................79
18.1.1 Componentization Assumptions .............................................................................................................. 79 18.1.2 Design Configuration .............................................................................................................................. 79 18.1.3 System Hierarchy ................................................................................................................................... 79
18.2 Degradation Mechanism .............................................................................................................79 18.3 Useful Life ...................................................................................................................................80
18.3.1 Useful Life Data ...................................................................................................................................... 80 18.4 Impact of Utilization Factors ........................................................................................................81
18.4.1 Utility Interview Data ............................................................................................................................... 81
19. Electromechanical Relays ............................................................................................................. 83 19.1 Asset Description ........................................................................................................................83
19.1.1 Componentization Assumptions .............................................................................................................. 83 19.1.2 System Hierarchy ................................................................................................................................... 83
19.2 Degradation Mechanism .............................................................................................................83 19.3 Useful Life ...................................................................................................................................83
19.3.1 Useful Life Data ...................................................................................................................................... 84 19.4 Impact of Utilization Factors ........................................................................................................84
19.4.1 Utility Interview Data ............................................................................................................................... 85
20. Solid State Relays ......................................................................................................................... 86 20.1 Asset Description ........................................................................................................................86
20.1.1 Componentization Assumptions .............................................................................................................. 86 20.1.2 System Hierarchy ................................................................................................................................... 86
20.2 Degradation Mechanism .............................................................................................................86

Asset Depreciation Study for the Ontario Energy Board TABLE OF CONTENTS
KINECTRICS INC xi K-418033-RA-001-R000
20.3 Useful Life ...................................................................................................................................86 20.3.1 Useful Life Data ...................................................................................................................................... 86
20.4 Impact of Utilization Factors ........................................................................................................87 20.4.1 Utility Interview Data ............................................................................................................................... 87
21. Digital Microprocessor Relays ....................................................................................................... 89 21.1 Asset Description ........................................................................................................................89
21.1.1 Componentization Assumptions .............................................................................................................. 89 21.1.2 System Hierarchy ................................................................................................................................... 89
21.2 Degradation Mechanism .............................................................................................................89 21.3 Useful Life ...................................................................................................................................89
21.3.1 Useful Life Data ...................................................................................................................................... 89 21.4 Impact of Utilization Factors ........................................................................................................90
21.4.1 Utility Interview Data ............................................................................................................................... 90
22. Rigid Busbars ................................................................................................................................ 92 22.1 Asset Description ........................................................................................................................92
22.1.1 Componentization Assumptions .............................................................................................................. 92 22.1.2 System Hierarchy ................................................................................................................................... 92
22.2 Degradation Mechanism .............................................................................................................92 22.3 Useful Life ...................................................................................................................................92
22.3.1 Useful Life Data ...................................................................................................................................... 92 22.4 Impact of Utilization Factors ........................................................................................................93
22.4.1 Utility Interview Data ............................................................................................................................... 93
23. Steel Structure ............................................................................................................................... 95 23.1 Asset Description ........................................................................................................................95
23.1.1 Componentization Assumptions .............................................................................................................. 95 23.1.2 System Hierarchy ................................................................................................................................... 95
23.2 Degradation Mechanism .............................................................................................................95 23.3 Useful Life ...................................................................................................................................95
23.3.1 Useful Life Data ...................................................................................................................................... 95 23.4 Impact of Utilization Factors ........................................................................................................96
23.4.1 Utility Interview Data ............................................................................................................................... 96
24. Primary Paper Insulated Lead Covered Cables ............................................................................ 98 24.1 Asset Description ........................................................................................................................98
24.1.1 Componentization Assumptions .............................................................................................................. 98 24.1.2 System Hierarchy ................................................................................................................................... 98
24.2 Degradation Mechanism .............................................................................................................98 24.3 Useful Life ...................................................................................................................................98
24.3.1 Useful Life Data ...................................................................................................................................... 98 24.4 Impact of Utilization Factors ........................................................................................................99
24.4.1 Utility Interview Data ............................................................................................................................... 99
25. Primary Ethylene-Propylene Rubber Cables ............................................................................... 101 25.1 Asset Description ......................................................................................................................101
25.1.1 Componentization Assumptions ............................................................................................................ 101 25.1.2 System Hierarchy ................................................................................................................................. 101
25.2 Degradation Mechanism ...........................................................................................................101 25.3 Useful Life .................................................................................................................................101
25.3.1 Useful Life Data .................................................................................................................................... 101 25.4 Impact of Utilization Factors ......................................................................................................102
25.4.1 Utility Interview Data ............................................................................................................................. 102
26. Primary Non-Tree Retardant Cross Linked Polyethylene Cables – Direct Buried ...................... 104 26.1 Asset Description ......................................................................................................................104
26.1.1 Componentization Assumptions ............................................................................................................ 104 26.1.2 System Hierarchy ................................................................................................................................. 104
26.2 Degradation Mechanism ...........................................................................................................104 26.3 Useful Life .................................................................................................................................104

Asset Depreciation Study for the Ontario Energy Board TABLE OF CONTENTS
KINECTRICS INC xii K-418033-RA-001-R000
26.3.1 Useful Life Data .................................................................................................................................... 105 26.4 Impact of Utilization Factors ......................................................................................................105
26.4.1 Utility Interview Data ............................................................................................................................. 106
27. Primary Non-Tree Retardant Cross Linked Polyethylene Cables – In Duct ............................... 107 27.1 Asset Description ......................................................................................................................107
27.1.1 Componentization Assumptions ............................................................................................................ 107 27.1.2 System Hierarchy ................................................................................................................................. 107
27.2 Degradation Mechanism ..........................................................................................................107 27.3 Useful Life .................................................................................................................................107
27.3.1 Useful Life Data .................................................................................................................................... 108 27.4 Impact of Utilization Factors ......................................................................................................108
27.4.1 Utility Interview Data ............................................................................................................................. 109
28. Primary Tree Retardant Cross Linked Polyethylene Cables – Direct Buried .............................. 110 28.1 Asset Description ......................................................................................................................110
28.1.1 Componentization Assumptions ............................................................................................................ 110 28.1.2 System Hierarchy ................................................................................................................................. 110
28.2 Degradation Mechanism ...........................................................................................................110 28.3 Useful Life .................................................................................................................................111
28.3.1 Useful Life Data .................................................................................................................................... 111 28.4 Impact of Utilization Factors ......................................................................................................112
28.4.1 Utility Interview Data ............................................................................................................................. 112
29. Primary Tree Retardant Cross Linked Polyethylene Cables – In Duct ....................................... 113 29.1 Asset Description ......................................................................................................................113
29.1.1 Componentization Assumptions ............................................................................................................ 113 29.1.2 System Hierarchy ................................................................................................................................. 113
29.2 Degradation Mechanism ...........................................................................................................113 29.3 Useful Life .................................................................................................................................114
29.3.1 Useful Life Data .................................................................................................................................... 114 29.4 Impact of Utilization Factors ......................................................................................................115
29.4.1 Utility Interview Data ............................................................................................................................. 115
30. Secondary Paper Insulated Lead Covered Cables ..................................................................... 116 30.1 Asset Description ......................................................................................................................116
30.1.1 Componentization Assumptions ............................................................................................................ 116 30.1.2 System Hierarchy ................................................................................................................................. 116
30.2 Degradation Mechanism ...........................................................................................................116 30.3 Useful Life .................................................................................................................................116
30.3.1 Useful Life Data .................................................................................................................................... 116 30.4 Impact of Utilization Factors ......................................................................................................117
30.4.1 Utility Interview Data ............................................................................................................................. 117
31. Secondary Cables – Direct Buried .............................................................................................. 119 31.1 Asset Description ......................................................................................................................119
31.1.1 Componentization Assumptions ............................................................................................................ 119 31.1.2 System Hierarchy ................................................................................................................................. 119
31.2 Degradation Mechanism ...........................................................................................................119 31.3 Useful Life .................................................................................................................................119
31.3.1 Useful Life Data .................................................................................................................................... 119 31.4 Impact of Utilization Factors ......................................................................................................120
31.4.1 Utility Interview Data ............................................................................................................................. 120
32. Secondary Cables – In Duct ........................................................................................................ 122 32.1 Asset Description ......................................................................................................................122
32.1.1 Componentization Assumptions ............................................................................................................ 122 32.1.2 System Hierarchy ................................................................................................................................. 122
32.2 Degradation Mechanism ...........................................................................................................122 32.3 Useful Life .................................................................................................................................122
32.3.1 Useful Life Data .................................................................................................................................... 122

Asset Depreciation Study for the Ontario Energy Board TABLE OF CONTENTS
KINECTRICS INC xiii K-418033-RA-001-R000
32.4 Impact of Utilization Factors ......................................................................................................123 32.4.1 Utility Interview Data ............................................................................................................................. 123
33. Network Transformers ................................................................................................................. 125 33.1 Asset Description ......................................................................................................................125
33.1.1 Componentization Assumptions ............................................................................................................ 125 33.1.2 System Hierarchy ................................................................................................................................. 125
33.2 Degradation Mechanism ...........................................................................................................125 33.3 Useful Life .................................................................................................................................126
33.3.1 Useful Life Data .................................................................................................................................... 126 33.4 Impact of Utilization Factors ......................................................................................................127
33.4.1 Utility Interview Data ............................................................................................................................. 127
34. Pad-Mounted Transformers ......................................................................................................... 129 34.1 Asset Description ......................................................................................................................129
34.1.1 Componentization Assumptions ............................................................................................................ 129 34.1.2 System Hierarchy ................................................................................................................................. 129
34.2 Degradation Mechanism ...........................................................................................................129 34.3 Useful Life .................................................................................................................................129
34.3.1 Useful Life Data .................................................................................................................................... 129 34.4 Impact of Utilization Factors ......................................................................................................130
34.4.1 Utility Interview Data ............................................................................................................................. 130
35. Submersible and Vault Transformers .......................................................................................... 132 35.1 Asset Description ......................................................................................................................132
35.1.1 Componentization Assumptions ............................................................................................................ 132 35.1.2 System Hierarchy ................................................................................................................................. 132
35.2 Degradation Mechanism ...........................................................................................................132 35.3 Useful Life .................................................................................................................................132
35.3.1 Useful Life Data .................................................................................................................................... 132 35.4 Impact of Utilization Factors ......................................................................................................133
35.4.1 Utility Interview Data ............................................................................................................................. 133
36. Underground Foundations ........................................................................................................... 135 36.1 Asset Description ......................................................................................................................135
36.1.1 Componentization Assumptions ............................................................................................................ 135 36.1.2 System Hierarchy ................................................................................................................................. 135
36.2 Degradation Mechanism ...........................................................................................................135 36.3 Useful Life .................................................................................................................................135
36.3.1 Useful Life Data .................................................................................................................................... 135 36.4 Impact of Utilization Factors ......................................................................................................136
36.4.1 Utility Interview Data ............................................................................................................................. 136
37. Underground Vaults ..................................................................................................................... 138 37.1 Asset Description ......................................................................................................................138
37.1.1 Componentization Assumptions ............................................................................................................ 138 37.1.2 System Hierarchy ................................................................................................................................. 138
37.2 Degradation Mechanism ...........................................................................................................138 37.3 Useful Life .................................................................................................................................138
37.3.1 Useful Life Data .................................................................................................................................... 138 37.4 Impact of Utilization Factors ......................................................................................................139
37.4.1 Utility Interview Data ............................................................................................................................. 139
38. Underground Vault Switches ....................................................................................................... 141 38.1 Asset Description ......................................................................................................................141
38.1.1 Componentization Assumptions ............................................................................................................ 141 38.1.2 Design Configuration ............................................................................................................................ 141 38.1.3 System Hierarchy ................................................................................................................................. 141
38.2 Degradation Mechanism ...........................................................................................................141 38.3 Useful Life .................................................................................................................................141
38.3.1 Useful Life Data .................................................................................................................................... 141
Asset Depreciation Study for the Ontario Energy Board TABLE OF CONTENTS
KINECTRICS INC xiv K-418033-RA-001-R000
38.4 Impact of Utilization Factors ......................................................................................................142 38.4.1 Utility Interview Data ............................................................................................................................. 142
39. Pad-Mounted Switchgear ............................................................................................................ 144 39.1 Asset Description ......................................................................................................................144
39.1.1 Componentization Assumptions ............................................................................................................ 144 39.1.2 Design Configuration ............................................................................................................................ 144 39.1.3 System Hierarchy ................................................................................................................................. 144
39.2 Degradation Mechanism ...........................................................................................................144 39.3 Useful Life .................................................................................................................................145
39.3.1 Useful Life Data .................................................................................................................................... 145 39.4 Impact of Utilization Factors ......................................................................................................145
39.4.1 Utility Interview Data ............................................................................................................................. 146
40. Ducts ............................................................................................................................................ 147 40.1 Asset Description ......................................................................................................................147
40.1.1 Componentization Assumptions ............................................................................................................ 147 40.1.2 Design Configuration ............................................................................................................................ 147 40.1.3 System Hierarchy ................................................................................................................................. 147
40.2 Degradation Mechanism ...........................................................................................................147 40.3 Useful Life .................................................................................................................................147
40.3.1 Useful Life Data .................................................................................................................................... 147 40.4 Impact of Utilization Factors ......................................................................................................148
40.4.1 Utility Interview Data ............................................................................................................................. 148
41. Concrete Encased Duct Banks.................................................................................................... 150 41.1 Asset Description ......................................................................................................................150
41.1.1 Componentization Assumptions ............................................................................................................ 150 41.1.2 System Hierarchy ................................................................................................................................. 150
41.2 Degradation Mechanism ...........................................................................................................150 41.3 Useful Life .................................................................................................................................150
41.3.1 Useful Life Data .................................................................................................................................... 150 41.4 Impact of Utilization Factors ......................................................................................................151
41.4.1 Utility Interview Data ............................................................................................................................. 151
42. Cable Chambers .......................................................................................................................... 153 42.1 Asset Description ......................................................................................................................153
42.1.1 Componentization Assumptions ............................................................................................................ 153 42.1.2 System Hierarchy ................................................................................................................................. 153
42.2 Degradation Mechanism ...........................................................................................................153 42.3 Useful Life .................................................................................................................................153
42.3.1 Useful Life Data .................................................................................................................................... 154 42.4 Impact of Utilization Factors ......................................................................................................154
42.4.1 Utility Interview Data ............................................................................................................................. 155
43. Remote Supervisory Control and Data Acquisition ..................................................................... 156 43.1 Asset Description ......................................................................................................................156
43.1.1 Componentization Assumptions ............................................................................................................ 156 43.1.2 System Hierarchy ................................................................................................................................. 156
43.2 Degradation Mechanism ...........................................................................................................156 43.3 Useful Life .................................................................................................................................156
43.3.1 Useful Life Data .................................................................................................................................... 156 43.4 Impact of Utilization Factors ......................................................................................................157
43.4.1 Utility Interview Data ............................................................................................................................. 157
I APPENDIX – PERCENT OF ASSETS IN THE USEFUL LIFE RANGE .......................................... 159
J REFERENCES ................................................................................................................................. 163

Asset Depreciation Study for the Ontario Energy Board LIST OF TABLES
KINECTRICS INC xv K-418033-RA-001-R000
LIST OF TABLES
Table 1-1 Useful Life Values for Fully Dressed Wood Poles ........................................................ 26
Table 1-2 - Composite Score for Fully Dressed Wood Poles ........................................................ 28
Table 2-1 Useful Life Values for Fully Dressed Concrete Poles ................................................... 30
Table 3-1 Useful Life Values for Fully Dressed Steel Poles .......................................................... 33
Table 4-1 Useful Life Values for Overhead Line Switch ................................................................ 37
Table 4-2 - Composite Score for Overhead Line Switch ............................................................... 38
Table 5-1 Useful Life Values for Overhead Line Switch Motor ..................................................... 39
Table 5-2 - Composite Score for Overhead Line Switch Motor ..................................................... 40
Table 6-1 Useful Life Values for Overhead Line Switch Remote Terminal Unit ........................... 42
Table 6-2 - Composite Score for Overhead Line Switch Remote Terminal Unit ........................... 43
Table 7-1 Useful Life Values for Overhead Integra Switch ........................................................... 45
Table 7-2 - Composite Score for Overhead Integra Switch .......................................................... 46
Table 8-1 Useful Life Values for Overhead Conductors ................................................................ 49
Table 8-2 Composite Score for Overhead Conductors ................................................................. 50
Table 9-1 Useful Life Values for Overhead Transformers and Voltage Regulators ...................... 53
Table 9-2 - Composite Score for Overhead Transformers and Voltage Regulators ..................... 54
Table 10-1 Useful Life Values for Overhead Shunt Capacitor Banks ........................................... 55
Table 11-1 Useful Life Values for Reclosers ................................................................................. 57
Table 11-2 - Composite Score for Reclosers ................................................................................ 58
Table 12-1 Useful Life Values for Power Transformers ................................................................ 61
Table 12-2 - Composite Score for Power Transformers................................................................ 62
Table 13-1 Useful Life Values for Station Service Transformers .................................................. 63
Table 13-2 - Composite Score for Station Service Transformers ................................................. 64
Table 14-1 Useful Life Values for Station Grounding Transformers ............................................. 66
Table 15-1 Useful Life Values for Station Direct Current System ................................................. 69
Table 15-2 - Composite Score for Station Direct Current System ................................................ 70
Table 16-1 Useful Life Values for Station Metal Clad Switchgear ................................................. 71
Table 16-2 - Composite Score for Station Metal Clad Switchgear ................................................ 72
Table 17-1 Useful Life Values for Station Independent Breakers ................................................. 77
Table 17-2 - Composite Score for Station Independent Breakers ................................................ 78
Table 18-1 Useful Life Values for Station Switch .......................................................................... 80
Table 18-2 - Composite Score for Station Switch ......................................................................... 81
Table 19-1 Useful Life Values for Electromechanical Relays ....................................................... 84
Table 19-2 - Composite Score for Electromechanical Relays ....................................................... 85
Table 20-1 Useful Life Values for Solid State Relays.................................................................... 86
Asset Depreciation Study for the Ontario Energy Board LIST OF TABLES
KINECTRICS INC xvi K-418033-RA-001-R000
Table 20-2 - Composite Score for Solid State Relays ................................................................... 87
Table 21-1 Useful Life Values for Digital Microprocessor Relays ................................................. 89
Table 21-2 - Composite Score for Digital Microprocessor Relays ................................................ 90
Table 22-1 Useful Life Values for Rigid Busbars ........................................................................... 92
Table 22-2 - Composite Score for Rigid Busbars .......................................................................... 93
Table 23-1 Useful Life Values for Steel Structure ......................................................................... 95
Table 23-2 - Composite Score for Steel Structure ........................................................................ 96
Table 24-1 Useful Life Values for Primary Paper Insulated Lead Covered Cables ...................... 98
Table 24-2 - Composite Score for Primary Paper Insulated Lead Covered Cables ..................... 99
Table 25-1 Useful Life Values for Primary Ethylene-Propylene Rubber Cables ......................... 101
Table 25-2 - Composite Score for Primary Ethylene-Propylene Rubber Cables ........................ 102
Table 26-1 Useful Life Values for Primary Non-Tree Retardant Cross Linked Polyethylene Cables
– Direct Buried ............................................................................................................................. 104
Table 26-2 - Composite Score for Primary Non-Tree Retardant Cross Linked Polyethylene Cables
– Direct Buried ............................................................................................................................. 106
Table 27-1 Useful Life Values for Primary Non-Tree Retardant Cross Linked Polyethylene Cables
– In Duct ...................................................................................................................................... 107
Table 27-2 - Composite Score for Primary Non-Tree Retardant Cross Linked Polyethylene Cables
– In Duct ...................................................................................................................................... 109
Table 28-1 Useful Life Values for Primary Tree Retardant Cross Linked Polyethylene Cables –
Direct Buried ................................................................................................................................ 111
Table 28-2 - Composite Score for Primary Tree Retardant Cross Linked Polyethylene Cables –
Direct Buried ................................................................................................................................ 112
Table 29-1 Useful Life Values for Primary Tree Retardant Cross Linked Polyethylene Cables – In
Duct ............................................................................................................................................. 114
Table 29-2 - Composite Score for Primary Tree Retardant Cross Linked Polyethylene Cables – In
Duct ............................................................................................................................................. 115
Table 30-1 Useful Life Values for Secondary Paper Insulated Lead Covered Cables ............... 116
Table 30-2 - Composite Score for Secondary Paper Insulated Lead Covered Cables ............... 117
Table 31-1 Useful Life Values for Secondary Cables – Direct Buried ......................................... 119
Table 31-2 - Composite Score for Secondary Cables – Direct Buried ........................................ 120
Table 32-1 Useful Life Values for Secondary Cables – In Duct .................................................. 122
Table 32-2 - Composite Score for Secondary Cables – In Duct ................................................. 123
Table 33-1 Useful Life Values for Network Transformers ........................................................... 126
Table 33-2 - Composite Score for Network Transformers........................................................... 127
Table 34-1 Useful Life Values for Pad-Mounted Transformers ................................................... 129
Table 34-2 - Composite Score for Pad-Mounted Transformers .................................................. 130

Asset Depreciation Study for the Ontario Energy Board LIST OF TABLES
KINECTRICS INC xvii K-418033-RA-001-R000
Table 35-1 Useful Life Values for Submersible and Vault Transformers .................................... 132
Table 35-2 - Composite Score for Submersible and Vault Transformers ................................... 133
Table 36-1 Useful Life Values for Underground Foundations ..................................................... 135
Table 36-2 - Composite Score for Underground Foundations .................................................... 136
Table 37-1 Useful Life Values for Underground Vaults ............................................................... 138
Table 37-2 - Composite Score for Underground Vaults .............................................................. 139
Table 38-1 Useful Life Values for Underground Vault Switches ................................................. 141
Table 38-2 - Composite Score for Underground Vault Switches ................................................ 142
Table 39-1 Useful Life Values for Pad-Mounted Switchgear ...................................................... 145
Table 39-2 - Composite Score for Pad-Mounted Switchgear ...................................................... 146
Table 40-1 Useful Life Values for Ducts ...................................................................................... 147
Table 40-2 - Composite Score for Ducts ..................................................................................... 148
Table 41-1 Useful Life Values for Concrete Encased Duct Banks .............................................. 150
Table 41-2 - Composite Score for Concrete Encased Duct Banks ............................................. 151
Table 42-1 Useful Life Values for Cable Chambers .................................................................... 153
Table 42-2 - Composite Score for Cable Chambers ................................................................... 155
Table 43-1 Useful Life Values for Remote Supervisory Control and Data Acquisition ............... 156
Table 43-2 - Composite Score for Remote Supervisory Control and Data Acquisition ............... 157

Asset Depreciation Study for the Ontario Energy Board LIST OF TABLES
KINECTRICS INC xviii K-418033-RA-001-R000
(This page has intentionally been left blank)

Asset Depreciation Study for the Ontario Energy Board LIST OF FIGURES
KINECTRICS INC xix K-418033-RA-001-R000
LIST OF FIGURES
Figure 1-1 Useful Life Values for Fully Dressed Wood Poles ....................................................... 26
Figure 1-2 Useful Life Values for Fully Dressed Wood Poles – Cross Arm – Wood ..................... 27
Figure 1-3 Useful Life Values for Fully Dressed Wood Poles – Cross Arm - Steel ....................... 28
Figure 1-4 Impact of Utilization Factors of the Useful Life of Fully Dressed Wood Poles ............. 29
Figure 2-1 Useful Life Values for Fully Dressed Concrete Poles .................................................. 31
Figure 2-2 Impact of Utilization Factors on the Useful Life of Fully Dressed Concrete Poles....... 32
Figure 3-1 Useful Life Values for Fully Dressed Steel Poles ........................................................ 34
Figure 3-2 Impact of Utilization Factors on the Useful Life of Fully Dressed Steel Poles ............. 35
Figure 4-1 Useful Life Values for Overhead Line Switch .............................................................. 37
Figure 4-2 Impact of Utilization Factors on the Useful Life of Overhead Line Switch ................... 38
Figure 5-1 Useful Life Values for Overhead Line Switch Motor .................................................... 40
Figure 5-2 Impact of Utilization Factors on the Useful Life of Overhead Line Switch Motor ......... 41
Figure 6-1 Useful Life Values for Overhead Line Switch Remote Terminal Unit .......................... 43
Figure 6-2 Impact of Utilization Factors on the Useful Life of Overhead Line Switch Remote
Terminal Unit ................................................................................................................................. 44
Figure 7-1 Useful Life Values for Overhead Integra Switch .......................................................... 46
Figure 7-2 Impact of Utilization Factors on the Useful Life of Overhead Integra Switch ............... 47
Figure 8-1 Useful Life Values for Overhead Conductors .............................................................. 50
Figure 8-2 Impact of Utilization Factors on the Useful Life of Overhead Conductors ................... 51
Figure 9-1 Useful Life Values for Overhead Transformers and Voltage Regulators ..................... 53
Figure 9-2 Impact of Utilization Factors on the Useful Life of Overhead Transformers and Voltage
Regulators ..................................................................................................................................... 54
Figure 10-1 Useful Life Values for Overhead Shunt Capacitor Banks .......................................... 56
Figure 11-1 Useful Life Values for Reclosers ................................................................................ 58
Figure 11-2 Impact of Utilization Factors on the Useful Life of Reclosers .................................... 59
Figure 12-1 Useful Life Values for Power Transformers ............................................................... 61
Figure 12-2 Impact of Utilization Factors on the Useful Life of Power Transformers .................... 62
Figure 13-1 Useful Life Values for Station Service Transformers ................................................. 64
Figure 13-2 Impact of Utilization Factors on the Useful Life of Station Service Transformers...... 65
Figure 14-1 Useful Life Values for Station Grounding Transformers ............................................ 67
Figure 15-1 Useful Life Values for Station Direct Current System ................................................ 69
Figure 15-2 Impact of Utilization Factors on the Useful Life of Station Direct Current System .... 70
Figure 16-1 Useful Life Values for Station Metal Clad Switchgear ............................................... 72
Figure 16-2 Impact of Utilization Factors on the Useful Life of Station Metal Clad Switchgear .... 73
Figure 17-1 Useful Life Values for Station Independent Breakers ................................................ 77
Asset Depreciation Study for the Ontario Energy Board LIST OF FIGURES
KINECTRICS INC xx K-418033-RA-001-R000
Figure 17-2 Impact of Utilization Factors on the Useful Life of Station Independent Breakers..... 78
Figure 18-1 Useful Life Values for Station Switch ......................................................................... 81
Figure 18-2 Impact of Utilization Factors on the Useful Life of Station Switch ............................. 82
Figure 19-1 Useful Life Values for Electromechanical Relays ...................................................... 84
Figure 19-2 Impact of Utilization Factors on the Useful Life of Electromechanical Relays ........... 85
Figure 20-1 Useful Life Values for Solid State Relays .................................................................. 87
Figure 20-2 Impact of Utilization Factors on the Useful Life of Solid State Relays ....................... 88
Figure 21-1 Useful Life Values for Digital Microprocessor Relays ................................................ 90
Figure 21-2 Impact of Utilization Factors on the Useful Life of Digital Microprocessor Relays..... 91
Figure 22-1 Useful Life Values for Rigid Busbars ......................................................................... 93
Figure 22-2 Impact of Utilization Factors on the Useful Life of Rigid Busbars .............................. 94
Figure 23-1 Useful Life Values for Steel Structure ........................................................................ 96
Figure 23-2 Impact of Utilization Factors on the Useful Life of Steel Structure ............................ 97
Figure 24-1 Useful Life Values for Primary Paper Insulated Lead Covered Cables ..................... 99
Figure 24-2 Impact of Utilization Factors on the Useful Life of Primary Paper Insulated Lead
Covered Cables ........................................................................................................................... 100
Figure 25-1 Useful Life Values for Primary Ethylene-Propylene Rubber Cables ........................ 102
Figure 25-2 Impact of Utilization Factors on the Useful Life of Primary Ethylene-Propylene Rubber
Cables .......................................................................................................................................... 103
Figure 26-1 Useful Life Values for Primary Non-Tree Retardant Cross Linked Polyethylene
Cables – Direct Buried ................................................................................................................. 105
Figure 26-2 Impact of Utilization Factors on the Useful Life of Primary Non-Tree Retardant Cross
Linked Polyethylene Cables – Direct Buried ............................................................................... 106
Figure 27-1 Useful Life Values for Primary Non-Tree Retardant Cross Linked Polyethylene
Cables – In Duct .......................................................................................................................... 108
Figure 27-2 Impact of Utilization Factors on the Useful Life of Primary Non-Tree Retardant Cross
Linked Polyethylene Cables – In Duct ......................................................................................... 109
Figure 28-1 Useful Life Values for Primary Tree Retardant Cross Linked Polyethylene Cables –
Direct Buried ................................................................................................................................ 111
Figure 28-2 Impact of Utilization Factors on the Useful Life of Primary Tree Retardant Cross
Linked Polyethylene Cables – Direct Buried ............................................................................... 112
Figure 29-1 Useful Life Values for Primary Tree Retardant Cross Linked Polyethylene Cables – In
Duct ............................................................................................................................................. 114
Figure 29-2 Impact of Utilization Factors on the Useful Life of Primary Tree Retardant Cross
Linked Polyethylene Cables – In Duct ......................................................................................... 115
Figure 30-1 Useful Life Values for Secondary Paper Insulated Lead Covered Cables .............. 117
Asset Depreciation Study for the Ontario Energy Board LIST OF FIGURES
KINECTRICS INC xxi K-418033-RA-001-R000
Figure 30-2 Impact of Utilization Factors on the Useful Life of Secondary Paper Insulated Lead
Covered Cables ........................................................................................................................... 118
Figure 31-1 Useful Life Values for Secondary Cables – Direct Buried ....................................... 120
Figure 31-2 Impact of Utilization Factors on the Useful Life of Secondary Cables – Direct Buried
..................................................................................................................................................... 121
Figure 32-1 Useful Life Values for Secondary Cables – In Duct ................................................. 123
Figure 32-2 Impact of Utilization Factors on the Useful Life of Secondary Cables – In Duct ..... 124
Figure 33-1 Useful Life Values for Network Transformers .......................................................... 127
Figure 33-2 Impact of Utilization Factors on the Useful Life of Network Transformers ............... 128
Figure 34-1 Useful Life Values for Pad-Mounted Transformers .................................................. 130
Figure 34-2 Impact of Utilization Factors on the Useful Life of Pad-Mounted Transformers ...... 131
Figure 35-1 Useful Life Values for Submersible and Vault Transformers ................................... 133
Figure 35-2 Impact of Utilization Factors on the Useful Life of Submersible and Vault
Transformers ............................................................................................................................... 134
Figure 36-1 Useful Life Values for Underground Foundations .................................................... 136
Figure 36-2 Impact of Utilization Factors on the Useful Life of Underground Foundations ........ 137
Figure 37-1 Useful Life Values for Underground Vaults .............................................................. 139
Figure 37-2 Impact of Utilization Factors on the Useful Life of Underground Vaults .................. 140
Figure 38-1 Useful Life Values for Underground Vault Switches ................................................ 142
Figure 38-2 Impact of Utilization Factors on the Useful Life of Underground Vault Switches..... 143
Figure 39-1 Useful Life Values for Pad-Mounted Switchgear ..................................................... 145
Figure 39-2 Impact of Utilization Factors on the Useful Life of Pad-Mounted Switchgear .......... 146
Figure 40-1 Useful Life Values for Ducts ..................................................................................... 148
Figure 40-2 Impact of Utilization Factors on the Useful Life of Ducts ......................................... 149
Figure 41-1 Useful Life Values for Concrete Encased Duct Banks ............................................. 151
Figure 41-2 Impact of Utilization Factors on the Useful Life of Concrete Encased Duct Banks . 152
Figure 42-1 Useful Life Values for Cable Chambers ................................................................... 154
Figure 42-2 Impact of Utilization Factors on the Useful Life of Cable Chambers ....................... 155
Figure 43-1 Useful Life Values for Remote Supervisory Control and Data Acquisition .............. 157
Figure 43-2 Impact of Utilization Factors on the Useful Life of Remote Supervisory Control and
Data Acquisition ........................................................................................................................... 158
Asset Depreciation Study for the Ontario Energy Board LIST OF FIGURES
KINECTRICS INC xxii K-418033-RA-001-R000
(This page has intentionally been left blank)
Asset Depreciation Study for the A – INTRODUCTION Ontario Energy Board
KINECTRICS INC - 1 - K-418033-RA-001-R000
A INTRODUCTION
Generally accepted accounting principles (GAAP) require entities with property, plant, and equipment (PP&E) to amortize the cost of such assets over the period of time that they provide useful service. Determination of such periods of time (total service lives) is generally based on engineering studies, asset retirement statistics and the experience of other utilities with like assets. Total service lives are reviewed from time to time to ensure they are current. The majority of electricity distributors in Ontario continue to use asset service lives originally prescribed by Ontario Hydro at least 20 years ago. Prior to adoption of International Financial Reporting Standards (IFRS), GAAP in Canada permitted the use of asset service lives specified by the regulator. IFRS (without approval of a standard for Rate-regulated Activities) does not allow for the use of externally mandated depreciation rates. Ontario Energy Board (OEB) has stipulated that all Ontario’s distributors are expected to adopt IFRS beginning in 2011. In order to be IFRS compliant, distributors must adopt useful life estimates that do not depend on the regulator and are supported by independent asset service life studies. In addition IFRS requires the componentization of assets placed in service by distributors at a sufficient level of detail to recognize that portions of an overall asset may be replaced or refurbished during the life of the asset of which they are a component, while the overall life of the asset may be somewhat longer. For many distributors, the level of detail maintained in their fixed asset and depreciation records is already sufficient to meet the IFRS componentization requirements. Such distributors have typically broken their PP&E into parts and have established formal “plant retirement units” (scaled in anticipation that they could be retired from service part way through the life of the asset of which they are a part). For other distributors, additional breakout may be necessary in adopting IFRS. Because of the myriad of possible asset and system configurations, there are no industry standard components or plant retirement units. Nonetheless, industry practice in Ontario has been common enough that there are expected to be normative collections of asset components and system design configurations that can enable a study of service lives to be performed on the most commonly found components and configurations. The purpose of this Report is to assist utilities in making the transition to IFRS and to assist them with determining appropriate initial service lives for assets most commonly used in the distribution of electricity in Ontario, particularly in situations where they have not conducted their own study. This approach is considered an effective way to minimize the need and cost to Ontario consumers of a myriad of like studies by individual distributors. The method of depreciation of PP&E used by Ontario distributors is the straight-line remaining service life method, and Kinectrics understands this will continue to be the method used under IFRS. This study will assist distributors with the determination of suitable asset total service lives. Distributors must still evaluate whether the total service lives set out in this Report are completely applicable to their own utility. This evaluation includes assessing the applicability of utilization factors (UF) that affect the most likely values provided in the Report, determining whether adjustments need to be made to reflect their individual componentization circumstances, determining how much service life remains for each component as well as the amount, if any, of residual or scrap value that is expected on disposition/removal from service of the component. Such utility-specific work is not part of the work for which Kinectrics Inc was engaged.
Asset Depreciation Study for the A – INTRODUCTION Ontario Energy Board
KINECTRICS INC - 2 - K-418033-RA-001-R000
(This page has intentionally been left blank)
Asset Depreciation Study for the B – OBJECTIVE AND SCOPE Ontario Energy Board
KINECTRICS INC - 3 - K-418033-RA-001-R000
B OBJECTIVE AND SCOPE
B - 1 OBJECTIVE
The objective of this Report is to assist electricity distributors in Ontario in determining total service lives for typical electricity distribution system assets that they own. The information contained in the Report is expected to further facilitate transfer of responsibility for determining asset total service lives to distributors as they transition to IFRS.
B - 2 SCOPE OF WORK
This Report identifies and describes commonly configured groups of assets forming most commonly found “components” and ascribes total service lives to such components. In addition, assets are assigned to one of the following “parent” systems:
Overhead Lines (OH)
Transformer and Municipal Stations (TS&MS)
Underground Systems (UG)
Monitoring and Control Systems (S) For each of the assets and their components, this Report provides a useful life range and a typical useful life value within the range. To further assist distributors with selecting the depreciation periods most appropriate for their utility, the Report also assesses the importance of various factors that affect the typical useful life value. Useful life is expressed as a specific number of years rounded off to the nearest multiple of 5, being the Typical Useful Life (TUL). As well, a lower and upper limit of number of years is provided, within which most situations could be expected to occur. These upper and lower limits are referred to as the Minimum Useful Life (MIN UL) and Maximum Useful Life (MAX UL) and are also rounded off to the nearest multiple of 5. The definition of these terms is provided in Subsection E - 1 of this Report. The Report also indicates the typical Utilization Factors (UF) affecting the degree to which shorter or longer total services lives could be judged by a distributor in a particular circumstance to be more appropriate. These factors include Maintenance Practices, Environmental Conditions, Mechanical Loading, Electrical Loading, Operating Practices, and Non-Physical Factors such as obsolescence. A description of these factors is provided in Subsection E - 1of this Report. The Report includes a summary of the statistical analysis that establishes a percentage of assets that will reach their end-of-life (EOL) between MIN UL and MAX UL in Subsection E - 6. In addition, the Report provides a guideline regarding the typical depreciation periods used in Ontario for other utility assets that do not fall under any of the above “parent” systems, such as office equipment, computers, buildings, vehicles, and communication equipment. These assets are often referred to as Minor Assets or General Plant. Kinectrics selected six Ontario distributors in collaboration with the Ontario Energy Board staff and met with these distributors to ascertain what they consider to be appropriate values for TUL, MIN UL and MAX UL, as well as factors that they felt impacted the TUL for each class of depreciable property. A class of depreciable property is that grouping of components that is appropriate to consider together for purposes of this study. Some such distributors had recently completed depreciation studies of their own, and all were prepared to assist with this work.

Asset Depreciation Study for the B – OBJECTIVE AND SCOPE Ontario Energy Board
KINECTRICS INC - 4 - K-418033-RA-001-R000
(This page has intentionally been left blank)
Asset Depreciation Study for the C – EXECUTION PROCESS Ontario Energy Board
KINECTRICS INC - 5 - K-418033-RA-001-R000
C EXECUTION PROCESS
The project execution process entailed seven steps to ensure that the industry-based information compiled by Kinectrics includes all the relevant assets and components used by Ontario’s Local Distribution Companies (LDCs). The procedure was as follows: Step 1 Kinectrics established a list of asset groupings representative of the typical breakdown of assets for Ontario’s LDCs. This list was based on Kinectrics familiarity with LDCs business practices, particularly as a result of having performed a number of studies in support of the IFRS transition initiative for a number of large LDCs. The asset breakdown presented in this Report should be regarded as a guideline as it is likely that LDCs will have a somewhat different asset breakdown based on their specific asset mix and existing accounting practices. Step 2 Kinectrics provided further breakdown or componentization for some of the asset categories. This was also based on Kinectrics familiarity with LDCs business practices and, at the same time was assessed against the following two criteria:
1. A value of component is significant or material enough relative to the value of the asset of which it is a component.
2. A need to replace the component does not necessarily warrant replacement of the entire
asset. Step 3 Kinectrics compiled industry based useful life values for the assets and their components using different sources, including industry statistics, research studies and reports (either by individuals or working groups, such as CIGRE), and Kinectrics Inc past experience (see Section E-2). The listing for each asset/component includes a minimum and maximum useful life range (MIN UL and MAX UL) as well as TUL and utilization factors, such as maintenance practices, environmental conditions, mechanical and electrical loading, etc. that have an impact on whether the actual life for a particular utility is longer or shorter than the typical life. Step 4 Six LDCs of different sizes were engaged to provide input to the study. The selection was made considering variables such as asset mix and geographical location. The utilities had varying experience regarding assets grouping, breakdown and componentization. Kinectrics Inc met with these utilities directly and obtained and discussed their assessments of each of the useful life values and the influencing utilization factors for each asset. Step 5 The typical lives for some assets/components were combined with the corresponding lives obtained from utility interviews as described in Section E - 4 of this Report for each of the asset categories/components to come up with the recommended TUL, as well as recommended MIN UL and MAX UL. The study work also summarized and displayed the qualitative assessment of the degree to which each Utilization Factor underwrites the choice of TUL and affects TUL and the range between MIN UL, and MAX UL. Step 6 A Draft Report was prepared by Kinectrics and circulated for comment from the LDC community. Step 7 This Final Report was prepared and submitted to the OEB incorporating adjustments in response to comments on the Draft Report.

Asset Depreciation Study for the C – EXECUTION PROCESS Ontario Energy Board
KINECTRICS INC - 6 - K-418033-RA-001-R000
(This page has intentionally been left blank)

Asset Depreciation Study for the D – DELIVERABLES Ontario Energy Board
KINECTRICS INC - 7 - K-418033-RA-001-R000
D DELIVERABLES
This Report is the primary deliverable to the Ontario Energy Board from this engagement for use by electricity distributors in Ontario. In particular, this Report includes: 1. An Executive Summary and Table of Contents.
2. A summary of the credentials of the consultant.
3. A description of the methods used to determine estimated total life and estimated ranges of
the respective categories of the depreciable assets, as well as a description of the data sources relied upon.
4. A description of each asset category and component for which Kinectrics has determined a service life.
5. A reference table listing the asset categories and components for which a service life has
been determined:
i. a most likely service life for the component expressed in years (referred to as the typical useful life or TUL), and
ii. a reasonable upper and lower limit stated in years for the service life of the component under various operating or environmental conditions (referred to as the minimum and maximum useful live or MIN UL and MAX UL, respectively)
iii. a description of the factors that impact the useful life of each asset.
6. Implementation suggestions that Kinectrics considers useful for distributors to consider when
implementing the service lives (these suggestions include utilization and maintenance factors and practices).
7. Other matters Kinectrics considers relevant including the definition of Useful Life, Factors Impacting Typical Useful Life and statistical evaluation of percentage of the asset population that is expected to fall between MIN UL and MAX UL.
Kinectrics also provided in Section G some conclusions about areas of need where distributors could improve the overall process of managing depreciation cost.

Asset Depreciation Study for the D – DELIVERABLES Ontario Energy Board
KINECTRICS INC - 8 - K-418033-RA-001-R000
(This page has intentionally been left blank)

Asset Depreciation Study for the E – METHODOLOGY Ontario Energy Board
KINECTRICS INC - 9 - K-418033-RA-001-R000
E METHODOLOGY
This Section defines some of the terms used throughout this report and describes the methodology used to estimate typical useful life, its range between minimum and maximum values for the defined distribution assets categories and the utilization factors influencing useful life.
E - 1 DEFINITIONS
The definitions of Asset Categories and Components, Useful Life Ranges, Typical Useful Life and the Factors that impact Useful Life (both physical and non-physical in nature) are listed below. Asset Categories Asset categories refer to typical distribution system assets such as as station transformers, distribution transformers (overhead and underground), breakers, switches, underground cables, poles, vaults, cable chambers, etc. Some of the assets, such as power transformers, are complex systems and include a number of components. Components For the purposes of this study, component refers to the sub-category of an asset that meets both of the following criteria:
1. Its replacement value is material enough to track.
2. A need to replace the component does not necessarily warrant replacing the entire asset. An asset may be comprised of more than one component, each with independent failure modes and degradation mechanisms that may result in a substantially different useful life than that of the overall asset. A component may also be managed under an independent maintenance and replacement schedule. Typical Useful Life (TUL) TUL is defined differently, depending on the asset category and component type, and can be categorized under one of the following three scenarios:
i. Assets Are Replaced Only When Failed
TUL= Age when most of the assets fail and are replaced and is equal to the asset’s physical EOL (physical EOL is defined as an asset’s inability to perform its functions as designed).
ii. Assets Are Replaced Due to Reasons Not Related to Their Performance
TUL = Typical age when assets are replaced before they reach their physical EOL due to reasons such as lack of spare parts or replacement assets, incompatibility with system requirements, external drivers (e.g., road widening, or PCB Regulation), or internal initiatives (e.g., carbon print reduction or voltage conversion).
iii. Assets are Replaced for Economic Reason
TUL = Typical age when assets reach their “economic life”, i.e., although physical EOL is not reached, high risk of failure cost makes it economical to replace them.
Asset Depreciation Study for the E – METHODOLOGY Ontario Energy Board
KINECTRICS INC - 10 - K-418033-RA-001-R000
Depending on the utility’s circumstances, replace vs. refurbish strategy and type and age distribution of a particular asset category/component, TUL may reflect a combination of all three scenarios described above. The degradation mechanism is discussed for each asset studied in this report. Useful Life Ranges TUL falls between Minimal Useful Life (MIN UL) and Maximum Useful Life (MAX UL) which for the purposes of this report are defined as: MIN UL = Age when a small percentage of assets reach their physical EOL, usually at the beginning section of the statistical “bath-tub curve”, where failure rate starts increasing exponentially MAX UL = Age when most of the assets reach their physical EOL, usually at the end section of the statistical “bath-tub curve”, where failure rate increases exponentially The exact percentage of assets/components that fail before reaching MIN UL or MAX UL varies from utility to utility as well as among different asset categories/components. Although MIN UL and MAX UL are most often related to physical EOL, in some cases the range is defined by economic or other reasons. In such cases, the range is usually less than when MIN UL and MAX UL are dictated by the physical EOL alone. It is worth noting that an asset category can have a typical life that is equal to either the maximum or minimum life. This fact is simply an indication that the majority of the units within a population will be operational for either the minimum or maximum number of years; i.e. the statistical data is skewed towards either the maximum or minimum values. This could also happen, for example, when assets are replaced for economic reasons to alleviate failure risk cost. A statistical analysis that estimates the percentage of assets/components whose useful lives are within the range defined by MIN UL and MAX UL is presented in Subsection E - 6 of this report. The range in useful lives that are found in practice reflects differences in various factors described in the “Utilization Factors” subsection below. Utilization Factors For the purposes of this Report, the term Utilization Factors (UFs) refers to factors that are expected to affect TUL of assets and their components and to a certain extent MIN UL and MAX UL. The degree of their effect is qualitatively described as High (H), Medium (M), Low (L), or No Impact (NI). The following UFs were identified:
1. Mechanical stress refers to forces and loads applied to an asset that may lead to degradation over time, e.g. wind load, ice load, gravitational and spring forces on components, etc.
2. Electrical loading refers to stresses such as continuous loading, temporary overloading
and exposure to short circuit fault current.
3. Operating practices refers to how frequently an asset is subject to operations (automatic or manual) that impact its useful life, e.g. reclosers, switch or breaker operations.

Asset Depreciation Study for the E – METHODOLOGY Ontario Energy Board
KINECTRICS INC - 11 - K-418033-RA-001-R000
4. Environmental conditions include pollution, salt, acid rain, humidity, extreme temperature, and animals that are prevalent and cause long-term degradation over a period of time.
5. Maintenance Practices refers to how frequently and regularly Routine Inspection or
Routine Testing/ Maintenance is performed on assets/components.
6. Non-Physical Factors refers to things that are not directly related to physical condition of assets, e.g. obsolescence, economic considerations related to life cycle cost management, increased rating requirements due to system growth, regulatory changes, construction activities, etc. These factors could lead to asset replacement even when assets can still perform as designed.
Each asset may be impacted by one or more of the UFs, resulting in different degradation rates for the same assets and/or components in different jurisdictions. Therefore, it is expected that some of the utility-specific total lives chosen will be different than the TULs provided in this Report based on the qualitative assessment of the above factors. As part of the interview, each of the six utilities was asked to rank the degree to which each UF impacts the life of each of their assets. For each UF, a singular degree of impact value (H, M, L, NI), based on a composite of the rankings provided by the utilities, is reported. The degree of impact (DI) is determined by the following formulation:
6
1
max
6
1
)(
)(
m
m
m
m
RS
RS
DI
m Utility number. Six (6) utilities were interviewed. RS Ranking Score. This is a numerical score assigned to the qualitative rakings of
H, M, L, and NI (no impact).
Qualitative Ranking
Ranking Score (RS)
H 4
M 3
L 1.5
NI (no impact)
0
αm Data availability coefficient (1 when data is provided by utility, 0 otherwise).
RSmax Maximum possible Ranking Score. The maximum value is equal to the score of a qualitative ranking of “H”; in this case the numerical value is 4.
The numerical percentage of degree of impact (DI) is then translated into a singular, qualitative ranking as per the following:
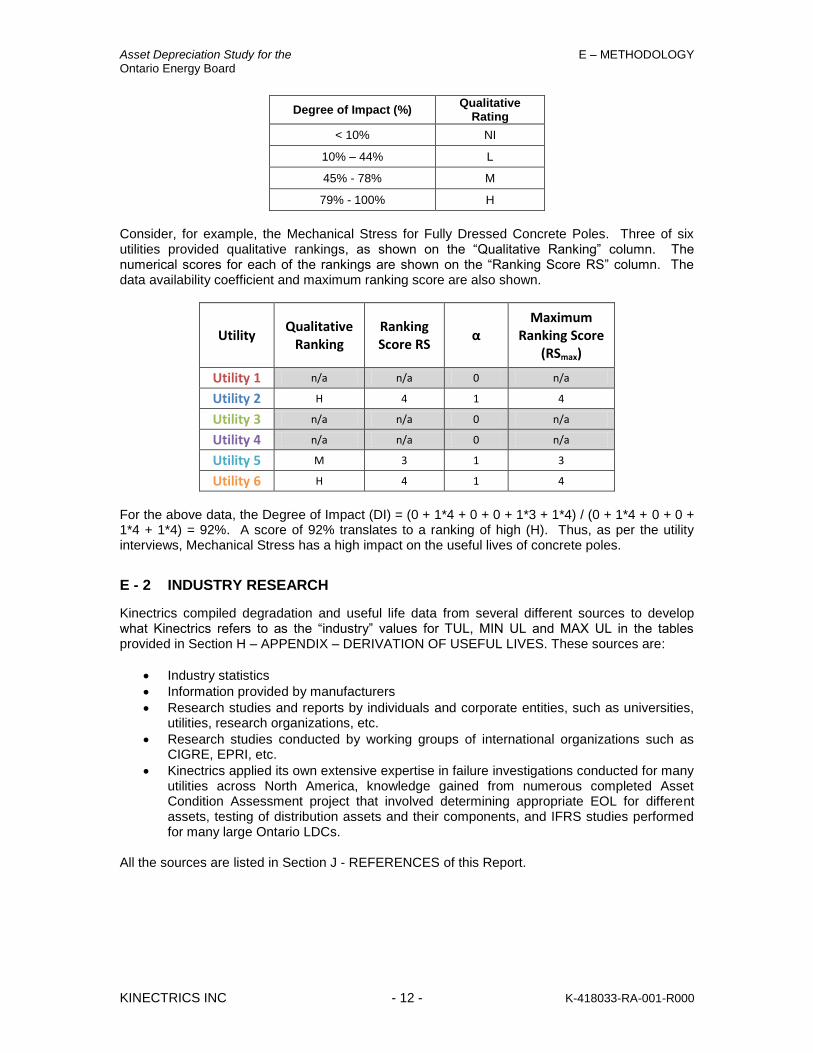
Asset Depreciation Study for the E – METHODOLOGY Ontario Energy Board
KINECTRICS INC - 12 - K-418033-RA-001-R000
Degree of Impact (%) Qualitative
Rating
< 10% NI
10% – 44% L
45% - 78% M
79% - 100% H
Consider, for example, the Mechanical Stress for Fully Dressed Concrete Poles. Three of six utilities provided qualitative rankings, as shown on the “Qualitative Ranking” column. The numerical scores for each of the rankings are shown on the “Ranking Score RS” column. The data availability coefficient and maximum ranking score are also shown.
Utility Qualitative
Ranking Ranking Score RS
α Maximum
Ranking Score (RSmax)
Utility 1 n/a n/a 0 n/a
Utility 2 H 4 1 4
Utility 3 n/a n/a 0 n/a
Utility 4 n/a n/a 0 n/a
Utility 5 M 3 1 3
Utility 6 H 4 1 4
For the above data, the Degree of Impact (DI) = (0 + 1*4 + 0 + 0 + 1*3 + 1*4) / (0 + 1*4 + 0 + 0 + 1*4 + 1*4) = 92%. A score of 92% translates to a ranking of high (H). Thus, as per the utility interviews, Mechanical Stress has a high impact on the useful lives of concrete poles.
E - 2 INDUSTRY RESEARCH
Kinectrics compiled degradation and useful life data from several different sources to develop what Kinectrics refers to as the “industry” values for TUL, MIN UL and MAX UL in the tables provided in Section H – APPENDIX – DERIVATION OF USEFUL LIVES. These sources are:
Industry statistics
Information provided by manufacturers
Research studies and reports by individuals and corporate entities, such as universities, utilities, research organizations, etc.
Research studies conducted by working groups of international organizations such as CIGRE, EPRI, etc.
Kinectrics applied its own extensive expertise in failure investigations conducted for many utilities across North America, knowledge gained from numerous completed Asset Condition Assessment project that involved determining appropriate EOL for different assets, testing of distribution assets and their components, and IFRS studies performed for many large Ontario LDCs.
All the sources are listed in Section J - REFERENCES of this Report.

Asset Depreciation Study for the E – METHODOLOGY Ontario Energy Board
KINECTRICS INC - 13 - K-418033-RA-001-R000
E - 3 UTILITY INTERVIEWS
Kinectrics interviewed staff members from six utilities across Ontario. The utilities were selected in conjunction with OEB staff and the sample represents a good cross-section of Ontario’s distributors based on their size, geographical location, and asset mix as follows:
One utility from GTA
One utility from the Niagara Escarpment Region
One utility from South Western Ontario
One utility from Eastern Ontario
Two utilities from Northern Ontario The interviews were focused on obtaining information from the utilities technical staff regarding:
Appropriateness of the assets/components break down
Utility-specific TUL, MIN UL and MAX UL
Utilization factors affecting the above values Actual asset failure information was not available so utility staff relied on existing age distribution information when available, hands-on field experience or budgetary forecasting experience to provide the required information. The utilities sampled had a good grasp of the challenge related to establishing realistic useful life and their responses were based on the mix of available data, actual experience and informed judgment.
E - 4 COMBINING INDUSTRY RESEARCH AND UTILITY INTERVIEW FINDINGS
Industry research was combined with interview results to ensure that the recommended values, although still based on the industry-wide experience, properly reflect Ontario’s perspective. The more utilities that provided input regarding a certain asset, the more weight utility input was given in arriving at the overall TUL, MIN UL and MAX UL as shown in the table below:
Number of Utility Inputs Ontario Weight Industry Weight
6 50% 50%
5 42% 58%
4 33% 67%
3 25% 75%
2 16% 84%
1 4% 96%
The overall values shown in the summary tables in Section F and H incorporate the logic described in the above table. The summary of the results of combining both industry research and Ontario LDC survey findings is provided in Table F-1 of this Report for TUL, MIN UL and MAX UL along with summary assessments by the distributors of the impact of UFs on useful lives. A detailed description of degradation mechanism(s), TUL, MIN UL, MAX UL and UFs for each asset category and component is provided in Section H of this Report. Recommended ranges for the Minor Assets that do not fall under any of the “parent” systems are provided in the Table F-2.
Asset Depreciation Study for the E – METHODOLOGY Ontario Energy Board
KINECTRICS INC - 14 - K-418033-RA-001-R000
E - 5 EXAMPLE OF USING THE REPORT
Following is an example demonstrating how an appropriate depreciation period could be selected by a utility for Power Transformers:
1. TUL from either Table F-1 in Section 0 or the detailed description in Section 12 of Section H- APPENDIX - DERIVATION OF USEFUL LIVES for the overall Fully Dressed Pole is 45 years, with MIN UL and MAX UL at 30 and 60 years, respectively.
2. The UFs are as follows:
Mechanical Stress – no impact
Electrical Stress – medium impact
Environmental Conditions – medium impact
Operating Practices – low impact
Maintenance Practices – low impact
Non-Physical Factors – no impact
3. A utility may select an appropriate depreciation period based on the specific UFs reflecting the actual utility conditions. For example, if electrical stress is not significant (lightly loaded transformer), environment in terms of pollution or weather extremes is not very harsh, the units are regularly maintained, and tap changers are operated not very frequently, the utility could select a depreciation period above the TUL but below MAX UL, say 50 years. Should the conditions and factors be more severe, the depreciation period chosen by the utility may be less than the TUL shown, (e.g., 40 years).
4. As more information is accumulated over time (e.g., several years of failure history), a utility may decide to adjust the depreciation period based on empirical information to better reflect its specific circumstances.
The decision on whether TUL should be the same as the one in the table or whether it should be shortened or prolonged and by how much is not an exact science and depends on the informed judgment of the utility’s technical staff and the utility’s approach to life cycle cost management. Although the values provided in this study for the UFs are those that underwrite TUL in each case, statistical analysis described in Section E-6 suggests that there is between 67% and 91% probability that the selected depreciation period will fall within the prescribed range (i.e., between MIN UL and MAX UL). Therefore, it is possible that the selected depreciation period could be outside of the Min UL or Max UL provided in this report depending on the impact of the various UFs. In such cases, and particularly if the depreciation period is significantly longer or shorter than the recommended TUL, a utility’s auditors and the OEB will likely require the utility to explain with more rigour the reasons for selecting the particular depreciation period.
E - 6 STATISTICAL ANALYSIS
Once Kinectrics determined the useful life values of TUL, MIN UL, and MAX UL using industry and Ontario LDC information, Kinectrics performed a statistical analysis to estimate what percentage of assets is expected to fall between MIN UL and MAX UL. A detailed description of the methodology is presented in APPENDIX I – PERCENT OF ASSETS IN THE USEFUL LIFE RANGE of this Report. The following assumptions were made in the analysis:
1. EOL distribution for all the assets is uni-modal with the peak potentially skewed towards MIN UL or MAX UL depending on the asset category/component.
Asset Depreciation Study for the E – METHODOLOGY Ontario Energy Board
KINECTRICS INC - 15 - K-418033-RA-001-R000
2. The value corresponding to the peak of failure density function is the same as TUL.
3. In defining the useful life range, the MIN UL and MAX UL are within (√3 times standard deviation б) from the mean value µ of the useful life distribution, regardless of where TUL is relative to the mean value µ.
4. For any specific asset category/component TUL always lies within the useful life range.
Based on these assumptions, the percentage of assets with useful life within the range between MIN UL and MAX UL is found to be equal to 91% for a normally distributed useful life (i.e., TUL is the same as the mean value). If the useful life distribution is not normal (i.e., TUL is not the same as the mean value) the percentage of assets within the range between MIN UL and MAX UL will be less than 91% but more than the minimum value of 67%.

Asset Depreciation Study for the E – METHODOLOGY Ontario Energy Board
KINECTRICS INC - 16 - K-418033-RA-001-R000
(This page has been intentionally left blank.)
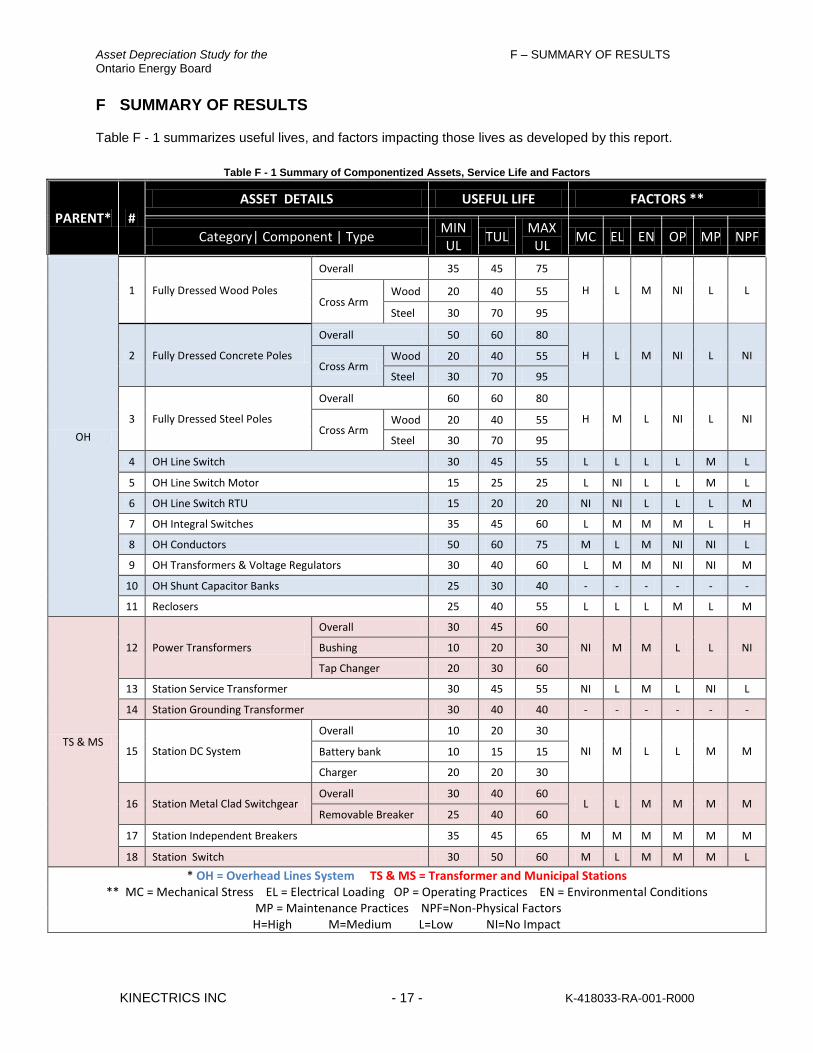
Asset Depreciation Study for the F – SUMMARY OF RESULTS Ontario Energy Board
KINECTRICS INC - 17 - K-418033-RA-001-R000
F SUMMARY OF RESULTS
Table F - 1 summarizes useful lives, and factors impacting those lives as developed by this report.
Table F - 1 Summary of Componentized Assets, Service Life and Factors
PARENT* #
ASSET DETAILS USEFUL LIFE FACTORS **
Category| Component | Type MIN UL
TUL MAX
UL MC EL EN OP MP NPF
OH
1 Fully Dressed Wood Poles
Overall 35 45 75
H L M NI L L Cross Arm
Wood 20 40 55
Steel 30 70 95
2 Fully Dressed Concrete Poles
Overall 50 60 80
H L M NI L NI Cross Arm
Wood 20 40 55
Steel 30 70 95
3 Fully Dressed Steel Poles
Overall 60 60 80
H M L NI L NI Cross Arm
Wood 20 40 55
Steel 30 70 95
4 OH Line Switch 30 45 55 L L L L M L
5 OH Line Switch Motor 15 25 25 L NI L L M L
6 OH Line Switch RTU 15 20 20 NI NI L L L M
7 OH Integral Switches 35 45 60 L M M M L H
8 OH Conductors 50 60 75 M L M NI NI L
9 OH Transformers & Voltage Regulators 30 40 60 L M M NI NI M
10 OH Shunt Capacitor Banks 25 30 40 - - - - - -
11 Reclosers 25 40 55 L L L M L M
TS & MS
12 Power Transformers
Overall 30 45 60
NI M M L L NI Bushing 10 20 30
Tap Changer 20 30 60
13 Station Service Transformer 30 45 55 NI L M L NI L
14 Station Grounding Transformer 30 40 40 - - - - - -
15 Station DC System
Overall 10 20 30
NI M L L M M Battery bank 10 15 15
Charger 20 20 30
16 Station Metal Clad Switchgear
Overall 30 40 60 L L M M M M
Removable Breaker 25 40 60
17 Station Independent Breakers 35 45 65 M M M M M M
18 Station Switch 30 50 60 M L M M M L
* OH = Overhead Lines System TS & MS = Transformer and Municipal Stations ** MC = Mechanical Stress EL = Electrical Loading OP = Operating Practices EN = Environmental Conditions
MP = Maintenance Practices NPF=Non-Physical Factors H=High M=Medium L=Low NI=No Impact

Asset Depreciation Study for the F – SUMMARY OF RESULTS Ontario Energy Board
KINECTRICS INC - 18 - K-418033-RA-001-R000
PARENT* #
ASSET DETAILS USEFUL LIFE FACTORS **
Category| Component | Type MIN UL
TUL MAX
UL MC EL EN OP MP NPF
TS & MS
19 Electromechanical Relays 25 35 50 NI NI NI NI NI H
20 Solid State Relays 10 30 45 NI NI NI NI NI H
21 Digital & Numeric Relays 15 20 20 NI NI NI NI NI H
22 Rigid Busbars 30 55 60 L L L NI NI L
23 Steel Structure 35 50 90 L NI M NI NI L
UG
24 Primary Paper Insulated Lead Covered (PILC) Cables 60 65 75 L L M L NI M
25 Primary Ethylene-Propylene Rubber (EPR) Cables 20 25 25 NI M L NI NI NI
26 Primary Non-Tree Retardant (TR) Cross Linked Polyethylene (XLPE) Cables Direct Buried
20 25 30 M M M L L L
27 Primary Non-TR XLPE Cables In Duct 20 25 30 M M M L L M
28 Primary TR XLPE Cables Direct Buried 25 30 35 M M M L L L
29 Primary TR XLPE Cables In Duct 35 40 55 M M M L L L
30 Secondary PILC Cables 70 75 80 NI L L NI NI H
31 Secondary Cables Direct Buried 25 35 40 M M M L NI NI
32 Secondary Cables In Duct 35 40 60 M M M L NI NI
33 Network Transformers Overall 20 35 50
NI L H NI NI NI Protector 20 35 40
34 Pad-Mounted Transformers 25 40 45 L M M NI L L
35 Submersible/Vault Transformers 25 35 45 L M M NI L L
36 UG Foundations 35 55 70 M NI M L L M
37 UG Vaults Overall 40 60 80
M NI M L L L Roof 20 30 45
38 UG Vault Switches 20 35 50 L L L L L NI
39 Pad-Mounted Switchgear 20 30 45 L L H L L L
40 Ducts 30 50 85 H NI M NI NI L
41 Concrete Encased Duct Banks 35 55 80 M NI M NI NI L
42 Cable Chambers 50 60 80 M NI H NI L NI
S 43 Remote SCADA 15 20 30 NI NI L NI L H
* TS & MS = Transformer and Municipal Stations UG = Underground Systems S = Monitoring and Control Systems ** MC = Mechanical Stress EL = Electrical Loading OP = Operating Practices EN = Environmental Conditions
MP = Maintenance Practices NPF=Non-Physical Factors H=High M=Medium L=Low NI=No Impact
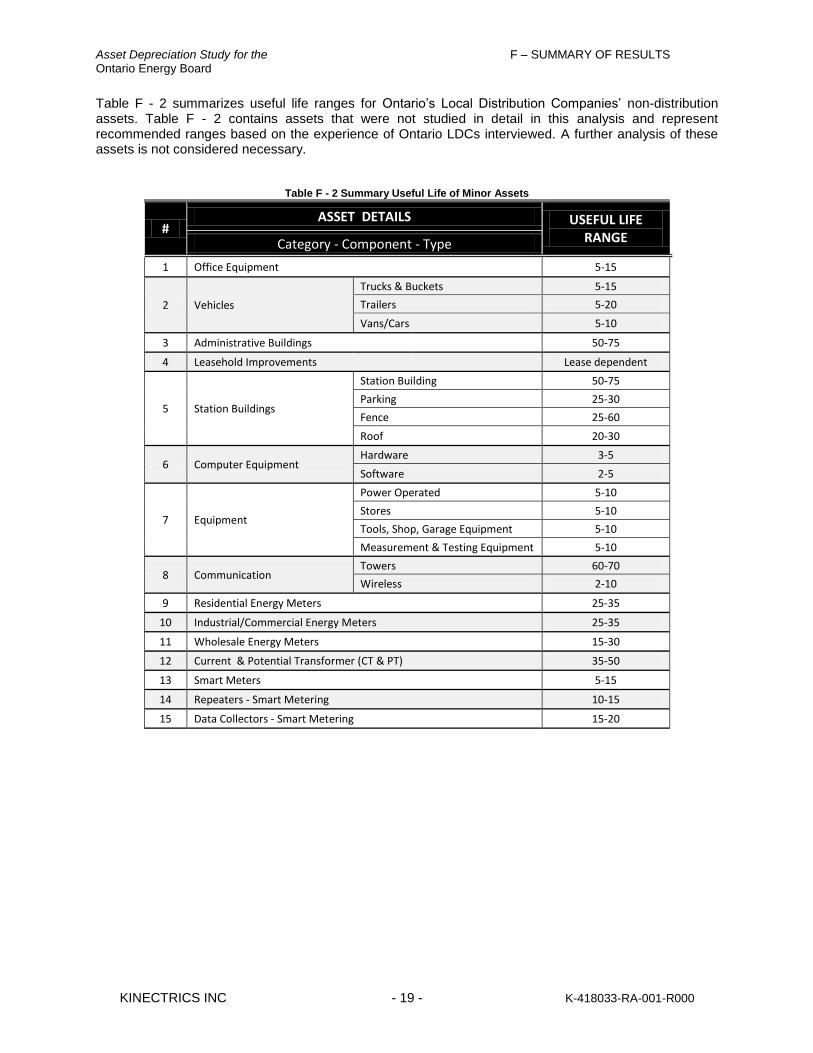
Asset Depreciation Study for the F – SUMMARY OF RESULTS Ontario Energy Board
KINECTRICS INC - 19 - K-418033-RA-001-R000
Table F - 2 summarizes useful life ranges for Ontario’s Local Distribution Companies’ non-distribution assets. Table F - 2 contains assets that were not studied in detail in this analysis and represent recommended ranges based on the experience of Ontario LDCs interviewed. A further analysis of these assets is not considered necessary.
Table F - 2 Summary Useful Life of Minor Assets
# ASSET DETAILS USEFUL LIFE
RANGE Category - Component - Type
1 Office Equipment 5-15
2 Vehicles
Trucks & Buckets 5-15
Trailers 5-20
Vans/Cars 5-10
3 Administrative Buildings 50-75
4 Leasehold Improvements Lease dependent
5 Station Buildings
Station Building 50-75
Parking 25-30
Fence 25-60
Roof 20-30
6 Computer Equipment Hardware 3-5
Software 2-5
7 Equipment
Power Operated 5-10
Stores 5-10
Tools, Shop, Garage Equipment 5-10
Measurement & Testing Equipment 5-10
8 Communication Towers 60-70
Wireless 2-10
9 Residential Energy Meters 25-35
10 Industrial/Commercial Energy Meters 25-35
11 Wholesale Energy Meters 15-30
12 Current & Potential Transformer (CT & PT) 35-50
13 Smart Meters 5-15
14 Repeaters - Smart Metering 10-15
15 Data Collectors - Smart Metering 15-20

Asset Depreciation Study for the F – SUMMARY OF RESULTS Ontario Energy Board
KINECTRICS INC - 20 - K-418033-RA-001-R000
(This page has intentionally been left blank)

Asset Depreciation Study for the G – CONCLUSIONS
Ontario Energy Board
KINECTRICS INC - 21 - K-418033-RA-001-R000
G CONCLUSIONS
This Report provides reference information that will assist Ontario’s electrical distribution utilities in selecting appropriate useful lives for typical distribution asset categories. The ultimate decision on what the appropriate useful lives are lies with utilities and they are expected to justify their selection based on the local circumstances vis-à-vis utilization factors that affect TUL and other relevant considerations such as empirical data and manufacturers recommendations. This Report combines available industry information, Kinectrics expertise and survey results from 6 of Ontario’s LDC. Thus, Kinectrics considers that the total service lives recommended are sufficiently reliable so that another independent expert would reasonably arrive at the same conclusion. Nevertheless, it is expected that for most asset categories/components TUL, and thus the selected depreciation period, will vary among utilities..,. The utility should be prepared and be able to provide a rationale for selecting a particular depreciation period based on the information in this Report and the utility’s specific experience. Asset categories and their componentization as presented in this report represent typical assets componentization in Ontario. In most cases utilities will only have a subset of the asset categories included in the Report. Furthermore, utilities may choose not to have some of the asset categories componentized as suggested in this Report and have depreciation tracked at the asset level. In the course of our work Kinectrics identified several areas for improvement that, once addressed, should enhance distributors’ ability to improve the accuracy of their determination of asset service lives. At the present time most distributors have limited data available on actual asset retirement history. One consequence of this is that the range of asset service lives from minimum to maximum tends to be broader that it would be if reliable asset retirement histories were available. To improve the overall process of managing depreciation cost, from this study Kinectrics concludes there is a need:
For distributors to improve availability of asset retirement records that identify both the end of life and its causes (e.g., failures, non-physical factors (obsolescence), high risk of failure, etc).
For ongoing comparison of the depreciation period selected with actual physical useful lives based on empirical evidence.
To gather data to support probability of failure curves for assets that are run to failure.
To consider whether there are other Utilization Factors that have significance and develop ways to quantify their impacts on Typical Useful Life.
For distributors to acquire and maintain planned and corrective maintenance records in a manner that can be easily accessed and analyzed.
To develop and maintain a record of assets replaced as a result of major projects (e.g., road widening or voltage conversion).
The depreciation periods selected are expected to be reviewed periodically and adjusted if and when required based on the knowledge and experience gained in the future.
Asset Depreciation Study for the G – CONCLUSIONS
Ontario Energy Board
KINECTRICS INC - 22 - K-418033-RA-001-R000
(This page has intentionally been left blank)

Asset Depreciation Study for the H – APPENDIX - DERIVATION OF USEFUL LIVES
Ontario Energy Board
KINECTRICS INC - 23 - K-418033-RA-001-R000
H APPENDIX - DERIVATION OF USEFUL LIVES
A results section has been created for each asset category. Each includes: Description - The description of the asset category including componentization, design configurations, alternative design configurations and system hierarchy. For some assets their attributes such as type and material (e.g. wood poles) or interrupting mechanism (e.g. reclosers) were also mentioned. In such cases, although these attributes may result in useful lives being somewhat different, the useful lives information provided in this Report is for the overall asset category and Kinectrics recommends not breaking these asset categories down further based on their attributes.
1. Degradation Mechanism – A discussion of the degradation mechanism including end of life
criteria. This describes physical EOL referred to in Section E-1 - DEFINITIONS.
2. Useful Life - The useful life values (MIN UL, TUL and MAX UL) for the asset and their respective components. This section presents both industry and survey values as well as the combined values.
3. Impact of Utilization Factors – This section discusses the factors (UFs) impacting useful life and
includes qualitative degree of impact based on the utilities surveyed. If utilities considered the TUL to be impacted by a factor, they rated the magnitude of the impact on a scale of high, medium or low (displayed on the graph as red, orange and yellow, respectively). For the case where utilities felt that the factor has no impact on the TUL the space is left light gray. Finally, “No Response” is displayed as dark grey and signifies that one or more utility did not provide information for that asset.
Please refer to Table F - 1 for a summary of these results.

Asset Depreciation Study for the H – APPENDIX - DERIVATION OF USEFUL LIVES
Ontario Energy Board
KINECTRICS INC - 24 - K-418033-RA-001-R000
(This page has been intentionally left blank.)
Asset Depreciation Study for the H – APPENDIX - DERIVATION OF USEFUL LIVES
Ontario Energy Board 1. Fully Dressed Wood Poles
KINECTRICS INC - 25 - K-418033-RA-001-R000
1. Fully Dressed Wood Poles
1.1 Description
The asset referred to in this category is the fully dressed wood pole ranging in size from 30 to 75 feet. This includes the wood pole, cross arm, bracket, insulator, cutouts, arresters, and anchor and guys. Wood poles are typically the most common form of support for overhead distribution feeders and low voltage secondary lines.
1.1.1 Componentization Assumptions
For the purposes of this report, the Fully Dressed Wood Poles asset category has been componentized so that the cross arm can be regarded as a separate component. Therefore the Fully Dressed Wood Pole has overall useful life values based on the useful life of the pole itself, and useful life values for the cross arm component. The most significant component of this asset is the wood pole itself. The wood species predominately used for distribution systems are Red Pine, Jack Pine, and Western Red Cedar (WRC), either butt treated or full length treated. Smaller numbers of Larch, Fir, White Pine and Southern Yellow Pine have also been used. Preservative treatments applied prior to 1980, range from none on some WRC poles, to butt treated and full length Creosote or Pentachlorophenol (PCP) in oil. The present day treatment, regardless of species, is CCA-Peg (Chromated Copper Arsenate, in a Polyethylene Glycol solution). Other treatments such as Copper Naphthenate and Ammoniacal Copper Arsenate have also been used, but these are relatively uncommon.
1.1.2 System Hierarchy
Fully Dressed Wood Poles are considered to be a part of the Overhead Lines asset grouping.
1.2 Degradation Mechanism
The end of life criteria for wood poles includes loss of strength, functionality, or safety (typically due to rot, decay, or physical damage). As wood is a natural material the degradation processes are somewhat different from those which affect other physical assets on the electricity distribution systems. The critical processes are biological, involving naturally occurring fungi that attack and degrade wood, resulting in decay. The nature and severity of the degradation depends both on the type of wood and the environment. Some fungi attack the external surfaces of the pole and some the internal heartwood. Therefore, the mode of degradation can be split into either external rot or internal rot. Wood poles can also be degraded by damage inflicted by woodpeckers, and insects such as carpenter ants. As a structural item the sole concern when assessing the condition for a wood pole is the reduction in mechanical strength due to degradation or damage.

Asset Depreciation Study for the H – APPENDIX - DERIVATION OF USEFUL LIVES
Ontario Energy Board 1. Fully Dressed Wood Poles
KINECTRICS INC - 26 - K-418033-RA-001-R000
1.3 Useful Life
Based on the Industry Values and Utility Interviews the Useful Life Values, Minimum (MIN UL), Typical (TUL) and Maximum (MAX UL) for Fully Dressed Wood Poles are displayed in Table 1-1.
Table 1-1 Useful Life Values for Fully Dressed Wood Poles
MIN UL TUL MAX UL
35 45 75
Wood 20 40 55
Steel 30 70 95
USEFUL LIFE
(years)ASSET
COMPONENTIZATION
Overall
Cross Arm
1.3.1 Useful Life Data
This section displays the data used to determine the Useful Life Values for Fully Dressed Wood Poles. All six of the interviewed utilities gave Minimum, Typical and Maximum Useful Life (MIN UL, TUL and MAX UL) Values for Fully Dressed Wood Poles (Figure 1-1). For the cross arm component, five of the Utilities gave MIN UL, TUL and MAX UL Values for Wood Cross Arms (Figure 1-2) and two of the Utilities gave MIN UL, TUL and MAX UL Values for Steel Cross Arms (Figure 1-3).
40
34
28
44 45 46
80
73
66
0
10
20
30
40
50
60
70
80
90
100
MINIMUM TYPICAL MAXIMUM
Fully Dressed Wood Poles Overall
INDUSTRY
OVERALL
UTILITIES AVERAGE
Utility 1
Utility 2
Utility 3
Utility 4
Utility 5
Utility 6
AGE(years)
Figure 1-1 Useful Life Values for Fully Dressed Wood Poles

Asset Depreciation Study for the H – APPENDIX - DERIVATION OF USEFUL LIVES
Ontario Energy Board 1. Fully Dressed Wood Poles
KINECTRICS INC - 27 - K-418033-RA-001-R000
2022
25
4042
45
50
57
66
0
10
20
30
40
50
60
70
80
90
100
MINIMUM TYPICAL MAXIMUM
Cross Arm Wood
INDUSTRY
OVERALL
UTILITIES AVERAGE
Utility 1
Utility 2
Utility 3
Utility 4
Utility 5
AGE(years)
Figure 1-2 Useful Life Values for Fully Dressed Wood Poles – Cross Arm – Wood
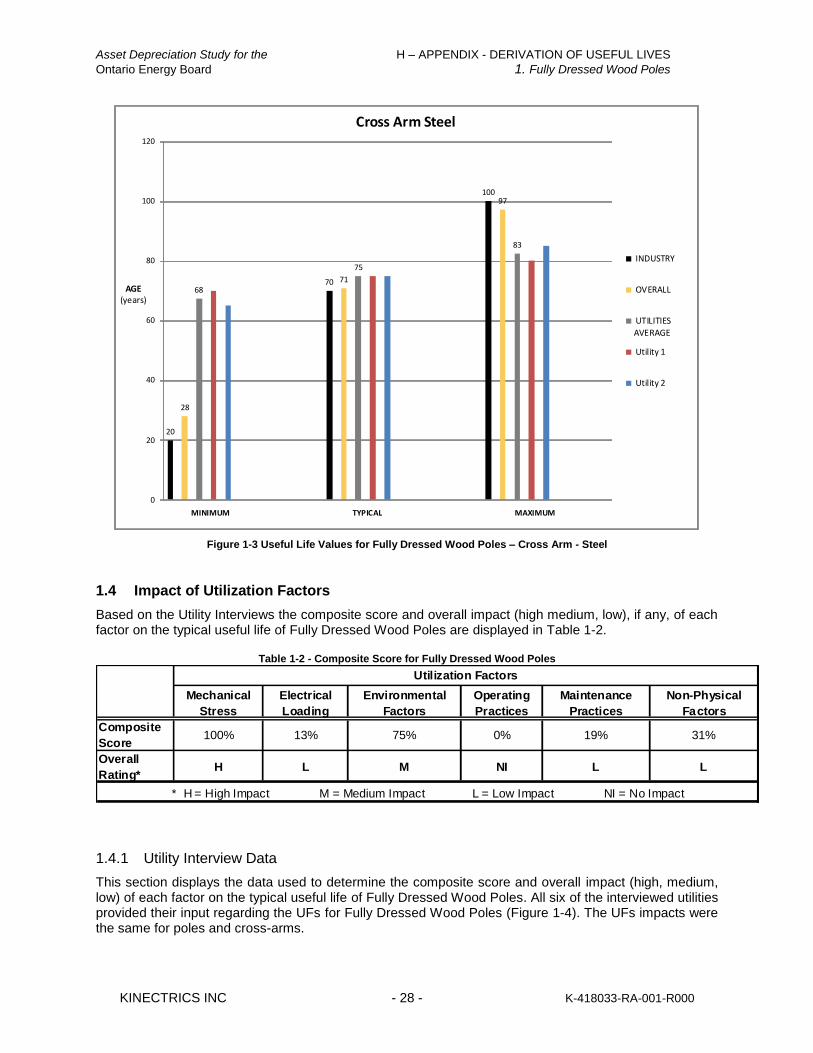
Asset Depreciation Study for the H – APPENDIX - DERIVATION OF USEFUL LIVES
Ontario Energy Board 1. Fully Dressed Wood Poles
KINECTRICS INC - 28 - K-418033-RA-001-R000
20
28
6870 71
75
10097
83
0
20
40
60
80
100
120
MINIMUM TYPICAL MAXIMUM
Cross Arm Steel
INDUSTRY
OVERALL
UTILITIES
AVERAGE
Utility 1
Utility 2
AGE(years)
Figure 1-3 Useful Life Values for Fully Dressed Wood Poles – Cross Arm - Steel
1.4 Impact of Utilization Factors
Based on the Utility Interviews the composite score and overall impact (high medium, low), if any, of each factor on the typical useful life of Fully Dressed Wood Poles are displayed in Table 1-2.
Table 1-2 - Composite Score for Fully Dressed Wood Poles
Mechanical
Stress
Electrical
Loading
Environmental
Factors
Operating
Practices
Maintenance
Practices
Non-Physical
Factors
Composite
Score100% 13% 75% 0% 19% 31%
Overall
Rating*H L M NI L L
* H = High Impact M = Medium Impact L = Low Impact NI = No Impact
Utilization Factors
1.4.1 Utility Interview Data
This section displays the data used to determine the composite score and overall impact (high, medium, low) of each factor on the typical useful life of Fully Dressed Wood Poles. All six of the interviewed utilities provided their input regarding the UFs for Fully Dressed Wood Poles (Figure 1-4). The UFs impacts were the same for poles and cross-arms.
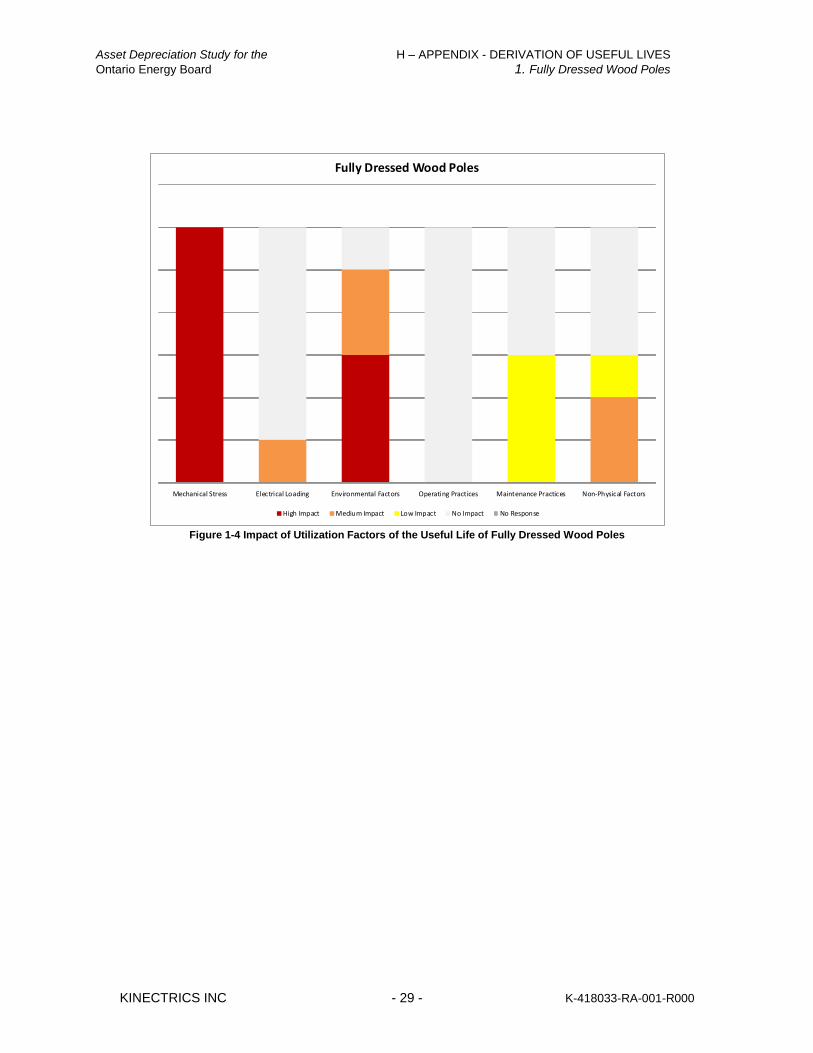
Asset Depreciation Study for the H – APPENDIX - DERIVATION OF USEFUL LIVES
Ontario Energy Board 1. Fully Dressed Wood Poles
KINECTRICS INC - 29 - K-418033-RA-001-R000
Mechanical Stress Electrical Loading Environmental Factors Operating Practices Maintenance Practices Non-Physical Factors
Fully Dressed Wood Poles
High Impact Medium Impact Low Impact No Impact No Response
Figure 1-4 Impact of Utilization Factors of the Useful Life of Fully Dressed Wood Poles

Asset Depreciation Study for the H – APPENDIX - DERIVATION OF USEFUL LIVES
Ontario Energy Board 2. Fully Dressed Concrete Poles
KINECTRICS INC - 30 - K-418033-RA-001-R000
2. Fully Dressed Concrete Poles
2.1 Description
The asset referred to in this category is the fully dressed concrete pole ranging in size from 30 to 75 feet. This includes the concrete pole, cross arm, bracket, insulator, cutouts, arresters, and anchor and guys. Concrete poles are a common form of support for overhead distribution feeders particularly in urban utilities.
2.1.1 Componentization Assumptions
For the purposes of this report, the Fully Dressed Concrete Poles asset category has been componentized so that the cross arm can be regarded as a separate component. Therefore the Fully Dressed Concrete Pole has an overall useful life value based on the useful life of the pole itself, and also a useful life value for the cross arm component.
2.1.2 System Hierarchy
Fully Dressed Concrete Poles are considered to be a part of the Overhead Lines asset grouping.
2.2 Degradation Mechanism
Concrete poles age, as do other concrete structures, by mechanisms such as moisture ingress, freeze/thaw cycles, and chemical erosion. Moisture ingress into cracks or concrete pores can result in freezing during the winter and damage to concrete surface. Road salt spray can further accelerate the degradation process and lead to concrete spalling. Typical concrete mixes employ a washed-gravel aggregate and have extremely high resistance to downward compressive stresses (about 3,000 lb/sq in); however, any appreciable stretching or bending (tension) will break the microscopic rigid lattice, resulting in cracking and separation of the concrete. The spun concrete process used in manufacturing poles prevents moisture entrapment inside the pores. Spun, pre-stressed concrete is particularly resistant to corrosion problems common in a water-and-soil environment.
2.3 Useful Life
Based on the Industry Values and Utility Interviews the Useful Life Values, Minimum (MIN UL), Typical (TUL) and Maximum (MAX UL) for Fully Dressed Concrete Poles are displayed in Table 2-1.
Table 2-1 Useful Life Values for Fully Dressed Concrete Poles
MIN UL TUL MAX UL
50 60 80
Wood 20 40 55
Steel 30 70 95
ASSET
COMPONENTIZATION
USEFUL LIFE
(years)
Overall
Cross Arm
2.3.1 Useful Life Data
This section displays the data used to determine the Useful Life Values for Fully Dressed Concrete Poles. Two of the interviewed utilities gave MIN UL Values and three of the interviewed utilities gave TUL and MAX UL Values for Fully Dressed Concrete Poles (Figure 2-1 Useful Life Values for Fully Dressed Concrete Poles). For the cross arm component, refer to Section 1.3.1 for Fully Dressed Wood Poles.

Asset Depreciation Study for the H – APPENDIX - DERIVATION OF USEFUL LIVES
Ontario Energy Board 2. Fully Dressed Concrete Poles
KINECTRICS INC - 31 - K-418033-RA-001-R000
50 5053
60 5957
8078
72
0
10
20
30
40
50
60
70
80
90
MINIMUM TYPICAL MAXIMUM
Fully Dressed Concrete Poles
INDUSTRY
OVERALL
UTILITIES AVERAGE
Utility 2
Utility 6AGE(years)
Figure 2-1 Useful Life Values for Fully Dressed Concrete Poles
2.4 Impact of Utilization Factors
Based on the Utility Interviews the composite score and overall impact (high medium, low), if any, of each factor on the typical useful life of Fully Dressed Concrete Poles are displayed in Table 2-2.
Table 2-2 - Composite Score for Fully Dressed Concrete Poles
Mechanical
Stress
Electrical
Loading
Environmental
Factors
Operating
Practices
Maintenance
Practices
Non-Physical
Factors
Composite
Score92% 25% 58% 0% 13% 0%
Overall
Rating*H L M NI L NI
* H = High Impact M = Medium Impact L = Low Impact NI = No Impact
Utilization Factors
2.4.1 Utility Interview Data
This section displays the data used to determine the composite score and overall impact (high, medium, low) of each factor on the typical useful life of Fully Dressed Concrete Poles. Three of the interviewed utilities provided their input regarding the UFs for Fully Dressed Concrete Poles (Figure 1-42).
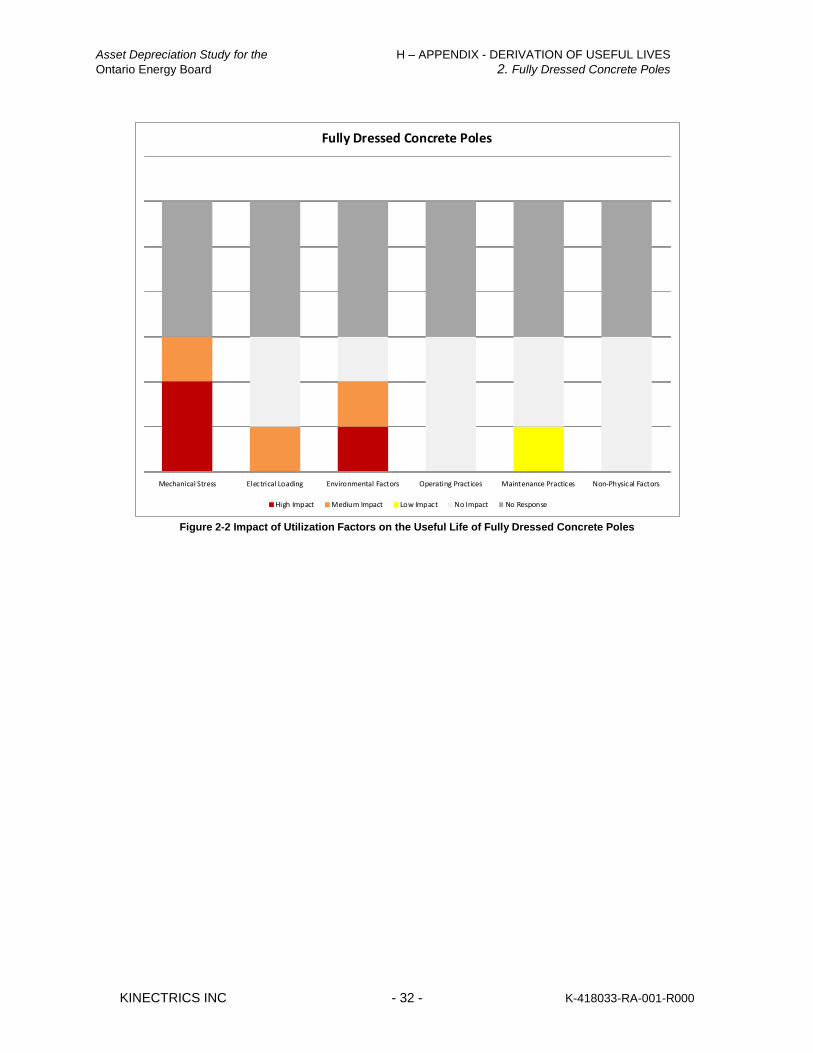
Asset Depreciation Study for the H – APPENDIX - DERIVATION OF USEFUL LIVES
Ontario Energy Board 2. Fully Dressed Concrete Poles
KINECTRICS INC - 32 - K-418033-RA-001-R000
Mechanical Stress Electrical Loading Environmental Factors Operating Practices Maintenance Practices Non-Physical Factors
Fully Dressed Concrete Poles
High Impact Medium Impact Low Impact No Impact No Response
Figure 2-2 Impact of Utilization Factors on the Useful Life of Fully Dressed Concrete Poles
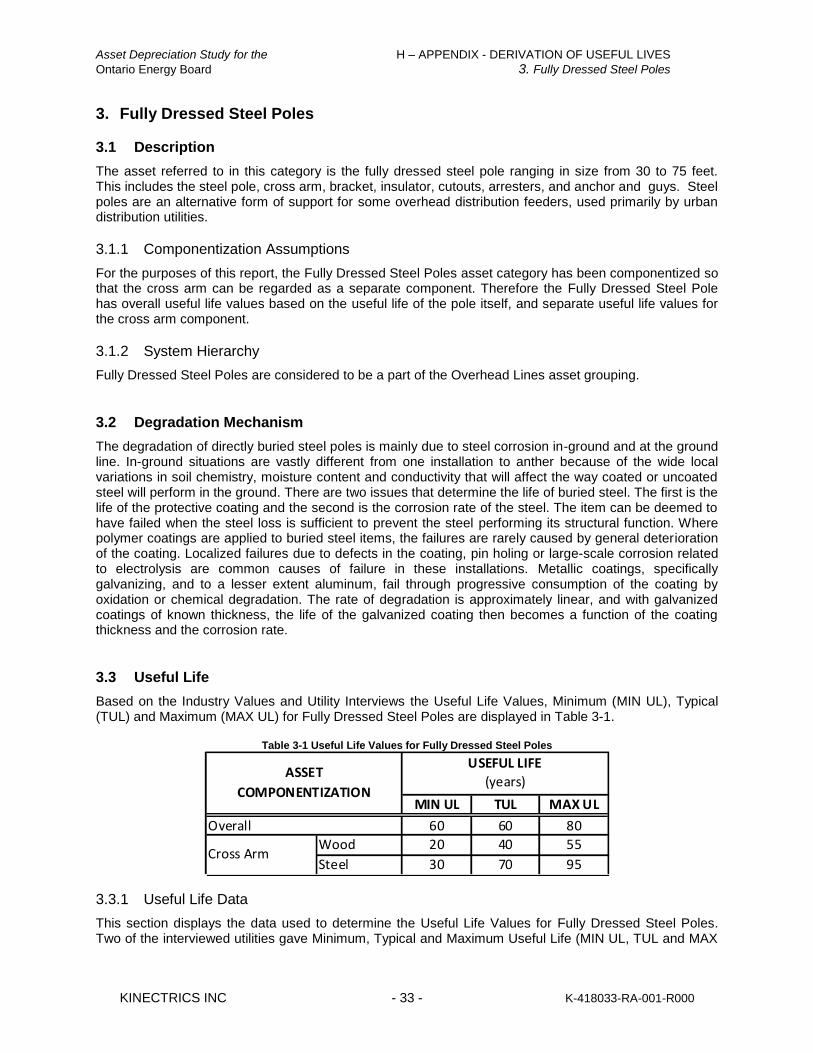
Asset Depreciation Study for the H – APPENDIX - DERIVATION OF USEFUL LIVES
Ontario Energy Board 3. Fully Dressed Steel Poles
KINECTRICS INC - 33 - K-418033-RA-001-R000
3. Fully Dressed Steel Poles
3.1 Description
The asset referred to in this category is the fully dressed steel pole ranging in size from 30 to 75 feet. This includes the steel pole, cross arm, bracket, insulator, cutouts, arresters, and anchor and guys. Steel poles are an alternative form of support for some overhead distribution feeders, used primarily by urban distribution utilities.
3.1.1 Componentization Assumptions
For the purposes of this report, the Fully Dressed Steel Poles asset category has been componentized so that the cross arm can be regarded as a separate component. Therefore the Fully Dressed Steel Pole has overall useful life values based on the useful life of the pole itself, and separate useful life values for the cross arm component.
3.1.2 System Hierarchy
Fully Dressed Steel Poles are considered to be a part of the Overhead Lines asset grouping.
3.2 Degradation Mechanism
The degradation of directly buried steel poles is mainly due to steel corrosion in-ground and at the ground line. In-ground situations are vastly different from one installation to anther because of the wide local variations in soil chemistry, moisture content and conductivity that will affect the way coated or uncoated steel will perform in the ground. There are two issues that determine the life of buried steel. The first is the life of the protective coating and the second is the corrosion rate of the steel. The item can be deemed to have failed when the steel loss is sufficient to prevent the steel performing its structural function. Where polymer coatings are applied to buried steel items, the failures are rarely caused by general deterioration of the coating. Localized failures due to defects in the coating, pin holing or large-scale corrosion related to electrolysis are common causes of failure in these installations. Metallic coatings, specifically galvanizing, and to a lesser extent aluminum, fail through progressive consumption of the coating by oxidation or chemical degradation. The rate of degradation is approximately linear, and with galvanized coatings of known thickness, the life of the galvanized coating then becomes a function of the coating thickness and the corrosion rate.
3.3 Useful Life
Based on the Industry Values and Utility Interviews the Useful Life Values, Minimum (MIN UL), Typical (TUL) and Maximum (MAX UL) for Fully Dressed Steel Poles are displayed in Table 3-1.
Table 3-1 Useful Life Values for Fully Dressed Steel Poles
MIN UL TUL MAX UL
60 60 80
Wood 20 40 55
Steel 30 70 95
ASSET
COMPONENTIZATION
USEFUL LIFE
(years)
Overall
Cross Arm
3.3.1 Useful Life Data
This section displays the data used to determine the Useful Life Values for Fully Dressed Steel Poles. Two of the interviewed utilities gave Minimum, Typical and Maximum Useful Life (MIN UL, TUL and MAX
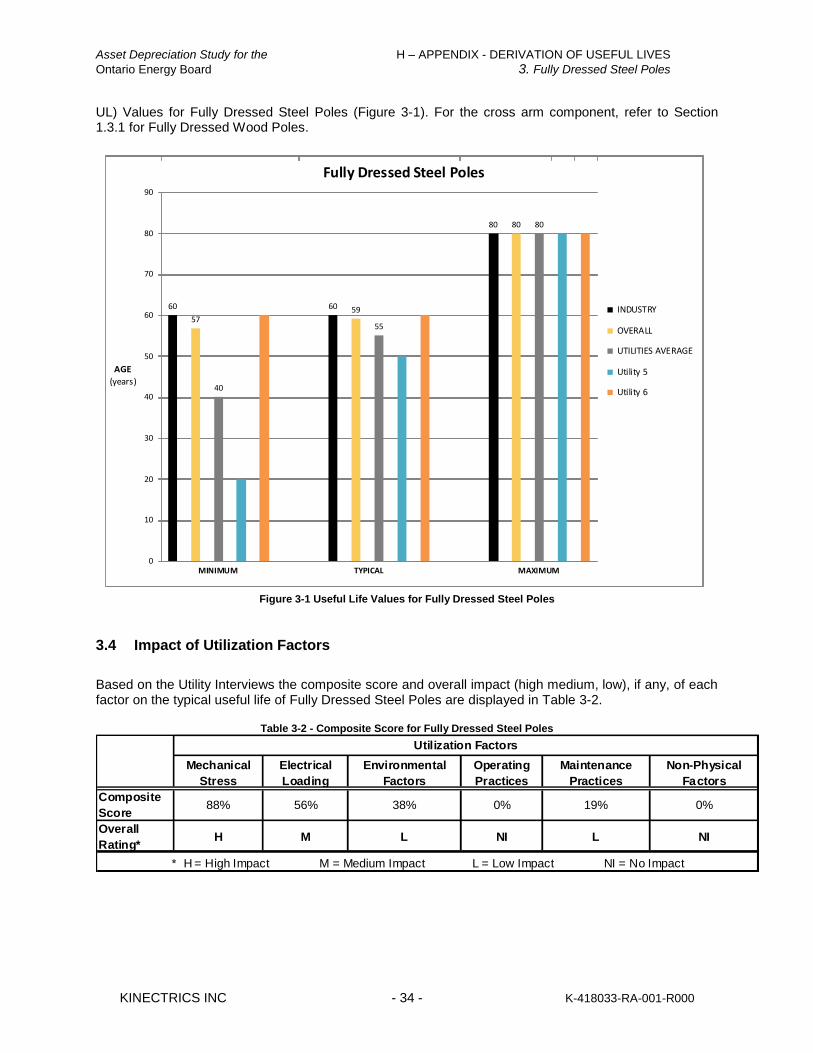
Asset Depreciation Study for the H – APPENDIX - DERIVATION OF USEFUL LIVES
Ontario Energy Board 3. Fully Dressed Steel Poles
KINECTRICS INC - 34 - K-418033-RA-001-R000
UL) Values for Fully Dressed Steel Poles (Figure 3-1). For the cross arm component, refer to Section 1.3.1 for Fully Dressed Wood Poles.
60
57
40
60 59
55
80 80 80
0
10
20
30
40
50
60
70
80
90
MINIMUM TYPICAL MAXIMUM
Fully Dressed Steel Poles
INDUSTRY
OVERALL
UTILITIES AVERAGE
Utility 5
Utility 6
AGE
(years)
Figure 3-1 Useful Life Values for Fully Dressed Steel Poles
3.4 Impact of Utilization Factors
Based on the Utility Interviews the composite score and overall impact (high medium, low), if any, of each factor on the typical useful life of Fully Dressed Steel Poles are displayed in Table 3-2.
Table 3-2 - Composite Score for Fully Dressed Steel Poles
Mechanical
Stress
Electrical
Loading
Environmental
Factors
Operating
Practices
Maintenance
Practices
Non-Physical
Factors
Composite
Score88% 56% 38% 0% 19% 0%
Overall
Rating*H M L NI L NI
* H = High Impact M = Medium Impact L = Low Impact NI = No Impact
Utilization Factors

Asset Depreciation Study for the H – APPENDIX - DERIVATION OF USEFUL LIVES
Ontario Energy Board 3. Fully Dressed Steel Poles
KINECTRICS INC - 35 - K-418033-RA-001-R000
3.4.1 Utility Interview Data
This section displays the data used to determine the composite score and overall impact (high, medium, low) of each factor on the typical useful life of Fully Dressed Steel Poles. Two of the interviewed utilities provided their input regarding the UFs for Fully Dressed Steel Poles (Figure 1-42).
Mechanical Stress Electrical Loading Environmental Factors Operating Practices Maintenance Practices Non-Physical Factors
Fully Dressed Steel Poles
High Impact Medium Impact Low Impact No Impact No Response
Figure 3-2 Impact of Utilization Factors on the Useful Life of Fully Dressed Steel Poles
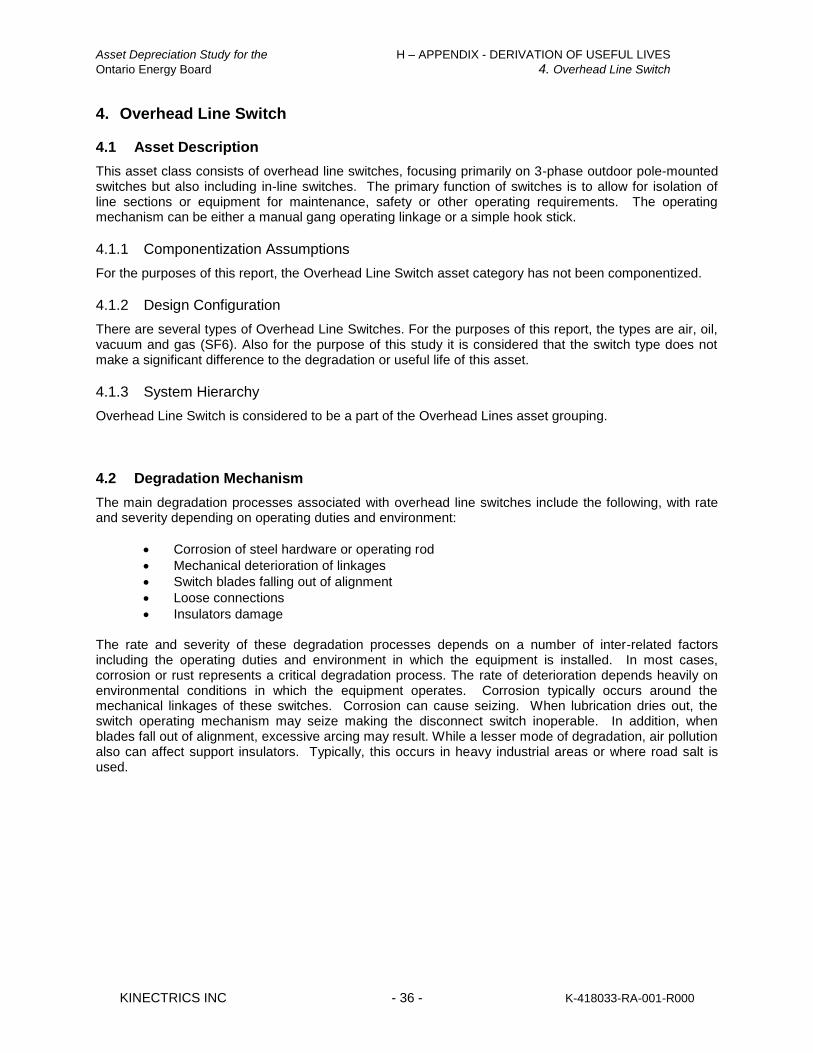
Asset Depreciation Study for the H – APPENDIX - DERIVATION OF USEFUL LIVES
Ontario Energy Board 4. Overhead Line Switch
KINECTRICS INC - 36 - K-418033-RA-001-R000
4. Overhead Line Switch
4.1 Asset Description
This asset class consists of overhead line switches, focusing primarily on 3-phase outdoor pole-mounted switches but also including in-line switches. The primary function of switches is to allow for isolation of line sections or equipment for maintenance, safety or other operating requirements. The operating mechanism can be either a manual gang operating linkage or a simple hook stick.
4.1.1 Componentization Assumptions
For the purposes of this report, the Overhead Line Switch asset category has not been componentized.
4.1.2 Design Configuration
There are several types of Overhead Line Switches. For the purposes of this report, the types are air, oil, vacuum and gas (SF6). Also for the purpose of this study it is considered that the switch type does not make a significant difference to the degradation or useful life of this asset.
4.1.3 System Hierarchy
Overhead Line Switch is considered to be a part of the Overhead Lines asset grouping.
4.2 Degradation Mechanism
The main degradation processes associated with overhead line switches include the following, with rate and severity depending on operating duties and environment:
Corrosion of steel hardware or operating rod
Mechanical deterioration of linkages
Switch blades falling out of alignment
Loose connections
Insulators damage
The rate and severity of these degradation processes depends on a number of inter-related factors including the operating duties and environment in which the equipment is installed. In most cases, corrosion or rust represents a critical degradation process. The rate of deterioration depends heavily on environmental conditions in which the equipment operates. Corrosion typically occurs around the mechanical linkages of these switches. Corrosion can cause seizing. When lubrication dries out, the switch operating mechanism may seize making the disconnect switch inoperable. In addition, when blades fall out of alignment, excessive arcing may result. While a lesser mode of degradation, air pollution also can affect support insulators. Typically, this occurs in heavy industrial areas or where road salt is used.
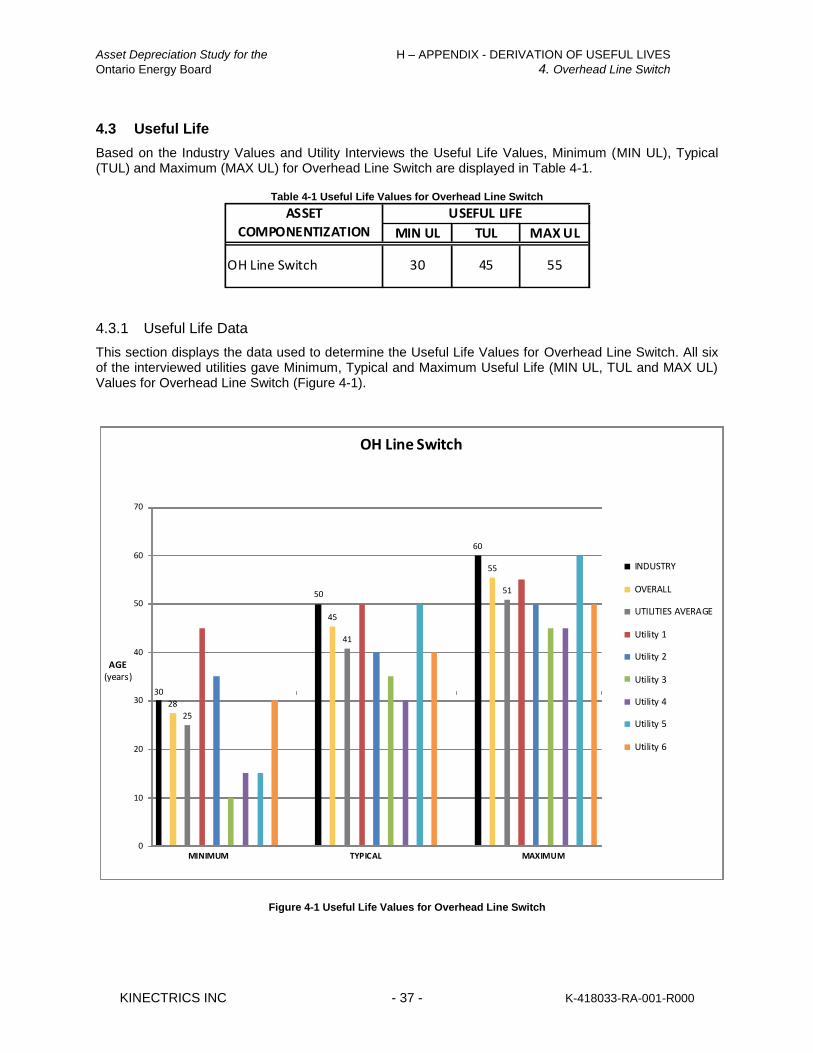
Asset Depreciation Study for the H – APPENDIX - DERIVATION OF USEFUL LIVES
Ontario Energy Board 4. Overhead Line Switch
KINECTRICS INC - 37 - K-418033-RA-001-R000
4.3 Useful Life
Based on the Industry Values and Utility Interviews the Useful Life Values, Minimum (MIN UL), Typical (TUL) and Maximum (MAX UL) for Overhead Line Switch are displayed in Table 4-1.
Table 4-1 Useful Life Values for Overhead Line Switch
MIN UL TUL MAX UL
30 45 55
ASSET
COMPONENTIZATION
USEFUL LIFE
OH Line Switch
4.3.1 Useful Life Data
This section displays the data used to determine the Useful Life Values for Overhead Line Switch. All six of the interviewed utilities gave Minimum, Typical and Maximum Useful Life (MIN UL, TUL and MAX UL) Values for Overhead Line Switch (Figure 4-1).
30
28
25
50
45
41
60
55
51
0
10
20
30
40
50
60
70
MINIMUM TYPICAL MAXIMUM
OH Line Switch
INDUSTRY
OVERALL
UTILITIES AVERAGE
Utility 1
Utility 2
Utility 3
Utility 4
Utility 5
Utility 6
AGE(years)
Figure 4-1 Useful Life Values for Overhead Line Switch

Asset Depreciation Study for the H – APPENDIX - DERIVATION OF USEFUL LIVES
Ontario Energy Board 4. Overhead Line Switch
KINECTRICS INC - 38 - K-418033-RA-001-R000
4.4 Impact of Utilization Factors
Based on the Utility Interviews the composite score and overall impact (high medium, low), if any, of each factor on the typical useful life of Overhead Line Switch are displayed in Table 4-2.
Table 4-2 - Composite Score for Overhead Line Switch
Mechanical
Stress
Electrical
Loading
Environmental
Factors
Operating
Practices
Maintenance
Practices
Non-Physical
Factors
Composite
Score35% 25% 35% 44% 65% 42%
Overall
Rating*L L L L M L
* H = High Impact M = Medium Impact L = Low Impact NI = No Impact
Utilization Factors
4.4.1 Utility Interview Data
This section displays the data used to determine the composite score and overall impact (high, medium, low) of each factor on the typical useful life of Overhead Line Switch. All six of the interviewed utilities provided their input regarding the UFs for Overhead Line Switches (Figure 1-42).
Mechanical Stress Electrical Loading Environmental Factors Operating Practices Maintenance Practices Non-Physical Factors
OH Line Switch
High Impact Medium Impact Low Impact No Impact
Figure 4-2 Impact of Utilization Factors on the Useful Life of Overhead Line Switch
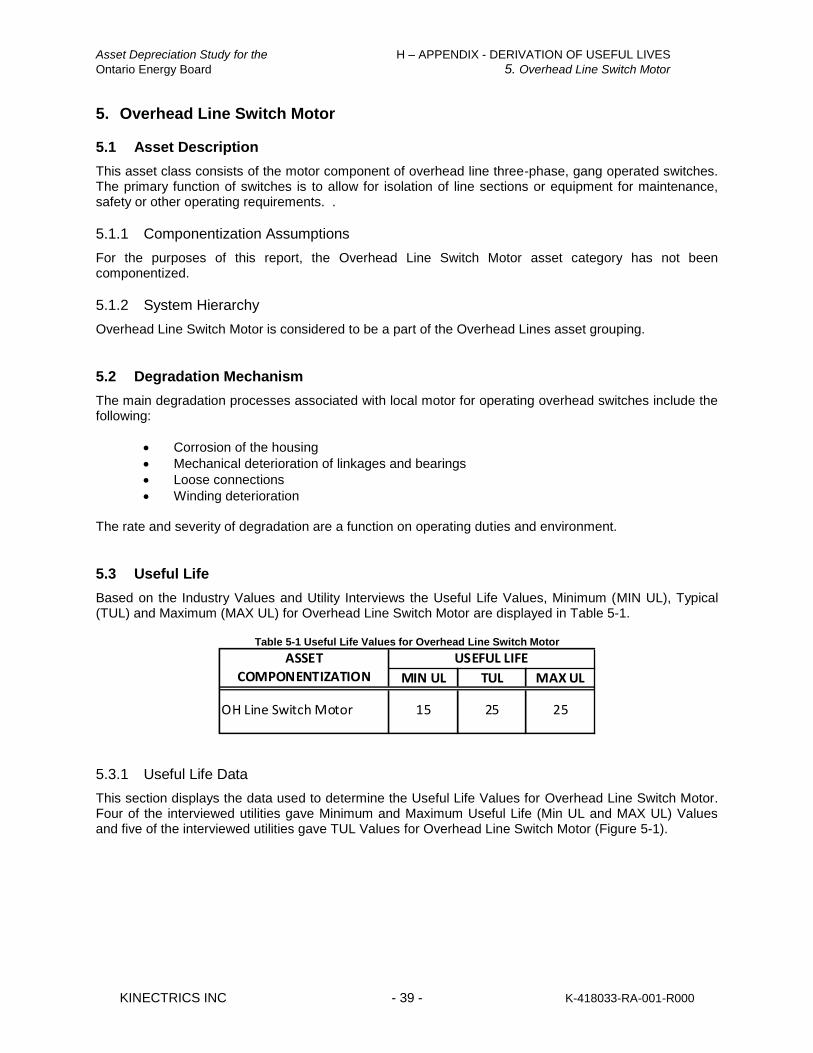
Asset Depreciation Study for the H – APPENDIX - DERIVATION OF USEFUL LIVES
Ontario Energy Board 5. Overhead Line Switch Motor
KINECTRICS INC - 39 - K-418033-RA-001-R000
5. Overhead Line Switch Motor
5.1 Asset Description
This asset class consists of the motor component of overhead line three-phase, gang operated switches. The primary function of switches is to allow for isolation of line sections or equipment for maintenance, safety or other operating requirements. .
5.1.1 Componentization Assumptions
For the purposes of this report, the Overhead Line Switch Motor asset category has not been componentized.
5.1.2 System Hierarchy
Overhead Line Switch Motor is considered to be a part of the Overhead Lines asset grouping.
5.2 Degradation Mechanism
The main degradation processes associated with local motor for operating overhead switches include the following:
Corrosion of the housing
Mechanical deterioration of linkages and bearings
Loose connections
Winding deterioration The rate and severity of degradation are a function on operating duties and environment.
5.3 Useful Life
Based on the Industry Values and Utility Interviews the Useful Life Values, Minimum (MIN UL), Typical (TUL) and Maximum (MAX UL) for Overhead Line Switch Motor are displayed in Table 5-1.
Table 5-1 Useful Life Values for Overhead Line Switch Motor
MIN UL TUL MAX UL
15 25 25
ASSET
COMPONENTIZATION
USEFUL LIFE
OH Line Switch Motor
5.3.1 Useful Life Data
This section displays the data used to determine the Useful Life Values for Overhead Line Switch Motor. Four of the interviewed utilities gave Minimum and Maximum Useful Life (Min UL and MAX UL) Values and five of the interviewed utilities gave TUL Values for Overhead Line Switch Motor (Figure 5-1).
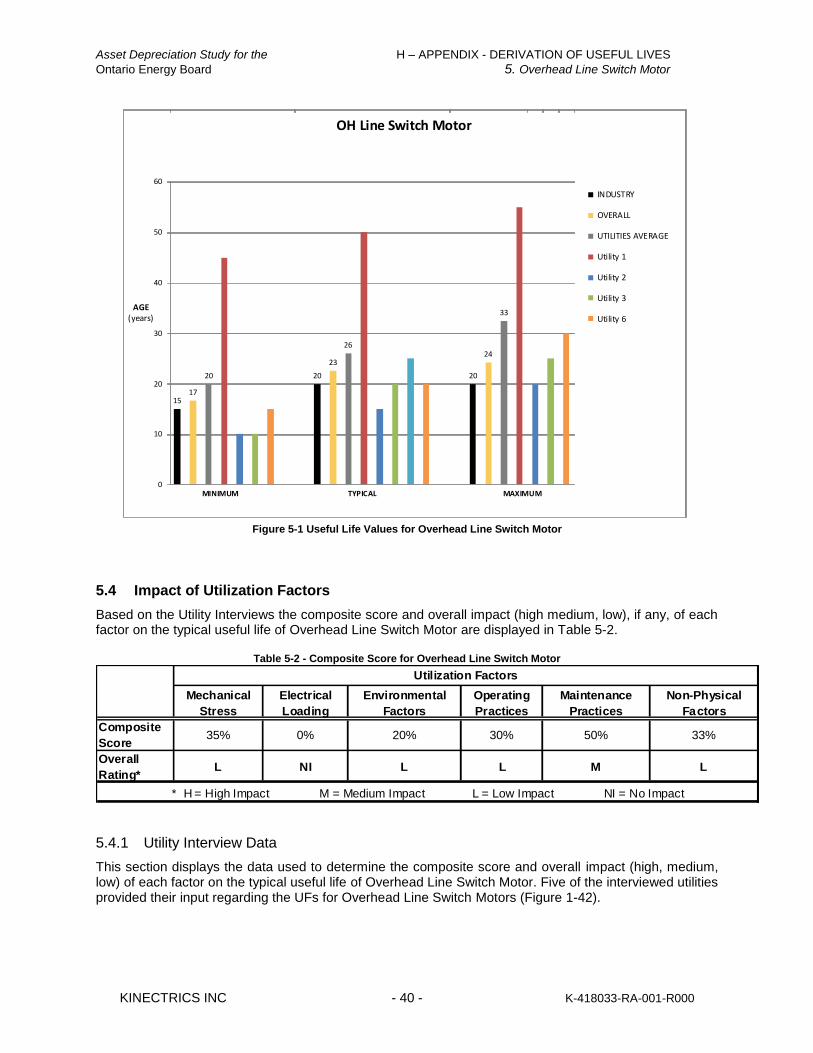
Asset Depreciation Study for the H – APPENDIX - DERIVATION OF USEFUL LIVES
Ontario Energy Board 5. Overhead Line Switch Motor
KINECTRICS INC - 40 - K-418033-RA-001-R000
1517
20 20
23
26
20
24
33
0
10
20
30
40
50
60
MINIMUM TYPICAL MAXIMUM
OH Line Switch Motor
INDUSTRY
OVERALL
UTILITIES AVERAGE
Utility 1
Utility 2
Utility 3
Utility 6
AGE(years)
Figure 5-1 Useful Life Values for Overhead Line Switch Motor
5.4 Impact of Utilization Factors
Based on the Utility Interviews the composite score and overall impact (high medium, low), if any, of each factor on the typical useful life of Overhead Line Switch Motor are displayed in Table 5-2.
Table 5-2 - Composite Score for Overhead Line Switch Motor
Mechanical
Stress
Electrical
Loading
Environmental
Factors
Operating
Practices
Maintenance
Practices
Non-Physical
Factors
Composite
Score35% 0% 20% 30% 50% 33%
Overall
Rating*L NI L L M L
* H = High Impact M = Medium Impact L = Low Impact NI = No Impact
Utilization Factors
5.4.1 Utility Interview Data
This section displays the data used to determine the composite score and overall impact (high, medium, low) of each factor on the typical useful life of Overhead Line Switch Motor. Five of the interviewed utilities provided their input regarding the UFs for Overhead Line Switch Motors (Figure 1-42).
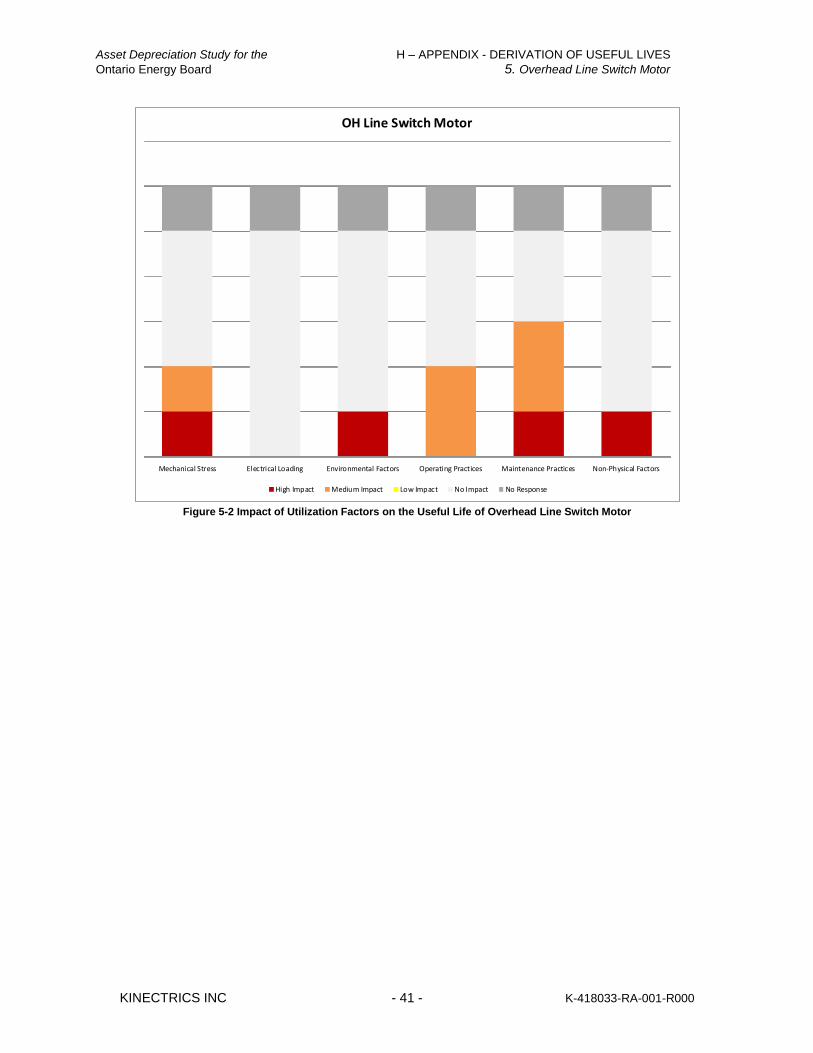
Asset Depreciation Study for the H – APPENDIX - DERIVATION OF USEFUL LIVES
Ontario Energy Board 5. Overhead Line Switch Motor
KINECTRICS INC - 41 - K-418033-RA-001-R000
Mechanical Stress Electrical Loading Environmental Factors Operating Practices Maintenance Practices Non-Physical Factors
OH Line Switch Motor
High Impact Medium Impact Low Impact No Impact No Response
Figure 5-2 Impact of Utilization Factors on the Useful Life of Overhead Line Switch Motor

Asset Depreciation Study for the H – APPENDIX - DERIVATION OF USEFUL LIVES
Ontario Energy Board 6. Overhead Line Switch Remote Terminal Unit
KINECTRICS INC - 42 - K-418033-RA-001-R000
6. Overhead Line Switch Remote Terminal Unit
6.1 Asset Description
This asset class consists of remote terminal unit (RTU) component of overhead line three-phase, gang operated switches. The primary function of switches is to allow for isolation of line sections or equipment for maintenance, safety or other operating requirements.
6.1.1 Componentization Assumptions
For the purposes of this report, the Overhead Line Switch Remote Terminal Unit asset category has not been componentized.
6.1.2 System Hierarchy
Overhead Line Switch Remote Terminal Unit is considered to be a part of the Overhead Lines asset grouping.
6.2 Degradation Mechanism
The main degradation processes associated with the remote terminal units include the following:
Corrosion of the housing
Contamination of the circuitry
Loose connections
Failure of electronic components
The rate and severity of degradation are a function on operating duties and environment.
6.3 Useful Life
Based on the Industry Values and Utility Interviews the Useful Life Values, Minimum (MIN UL), Typical (TUL) and Maximum (MAX UL) for Overhead Line Switch Remote Terminal Unit are displayed in Table 6-1.
Table 6-1 Useful Life Values for Overhead Line Switch Remote Terminal Unit
MIN UL TUL MAX UL
15 20 20
ASSET
COMPONENTIZATION
USEFUL LIFE
OH Line Switch RTU
6.3.1 Useful Life Data
This section displays the data used to determine the Useful Life Values for Overhead Line Switch Remote Terminal Unit. Four of the interviewed utilities gave Typical and Maximum Useful Life (TUL and MAX UL) Values and five of the interviewed utilities gave MIN UL Values for Overhead Line Switch Remote Terminal Unit (Table 6-1).

Asset Depreciation Study for the H – APPENDIX - DERIVATION OF USEFUL LIVES
Ontario Energy Board 6. Overhead Line Switch Remote Terminal Unit
KINECTRICS INC - 43 - K-418033-RA-001-R000
1516
17
20 20 20 20
22
26
0
5
10
15
20
25
30
35
40
MINIMUM TYPICAL MAXIM UM
OH Line Switch RTU
INDUSTRY
OVERALL
UTILITIES AVERAGE
Utility 1
Utility 2
Utility 3
Utility 5
AGE
(years)
Figure 6-1 Useful Life Values for Overhead Line Switch Remote Terminal Unit
6.4 Impact of Utilization Factors
Based on the Utility Interviews the composite score and overall impact (high medium, low), if any, of each factor on the typical useful life of Overhead Line Switch Remote Terminal Unit are displayed in Table 6-2.
Table 6-2 - Composite Score for Overhead Line Switch Remote Terminal Unit
Mechanical
Stress
Electrical
Loading
Environmental
Factors
Operating
Practices
Maintenance
Practices
Non-Physical
Factors
Composite
Score0% 0% 28% 15% 30% 75%
Overall
Rating*NI NI L L L M
* H = High Impact M = Medium Impact L = Low Impact NI = No Impact
Utilization Factors
6.4.1 Utility Interview Data
This section displays the data used to determine the composite score and overall impact (high, medium, low) of each factor on the typical useful life of Overhead Line Switch Remote Terminal Unit. Five of the interviewed utilities provided their input regarding the UFs for Overhead Line Switch RTUs (Figure 1-4).

Asset Depreciation Study for the H – APPENDIX - DERIVATION OF USEFUL LIVES
Ontario Energy Board 6. Overhead Line Switch Remote Terminal Unit
KINECTRICS INC - 44 - K-418033-RA-001-R000
Mechanical Stress Electrical Loading Environmental Factors Operating Practices Maintenance Practices Non-Physical Factors
OH Line Switch RTU
High Impact Medium Impact Low Impact No Impact No Response
Figure 6-2 Impact of Utilization Factors on the Useful Life of Overhead Line Switch Remote Terminal Unit

Asset Depreciation Study for the H – APPENDIX - DERIVATION OF USEFUL LIVES
Ontario Energy Board 7. Overhead Integral Switch
KINECTRICS INC - 45 - K-418033-RA-001-R000
7. Overhead Integral Switch
7.1 Asset Description
This asset class consists of integral switches. Integral switches are considered to be overhead line switches with integrated remotely operable opening and closing mechanisms and communication capability that can receive signals from and be monitored by a SCADA system. These units include the switch, communications, and RTU. As with other line switches, this asset allows for the isolation of overhead line sections or equipment for maintenance, safety, and any other operating requirements.
7.1.1 Componentization Assumptions
For the purposes of this report, the Overhead Integral Switch asset category has not been componentized.
7.1.2 System Hierarchy
Overhead Integral Switch is considered to be a part of the Overhead Lines asset grouping.
7.2 Degradation Mechanism
The main degradation processes associated with line switches include those associated with the switch, motor and communication circuitry:
Corrosion of the housing, hardware and linkages
Mechanical deterioration of linkages and bearings
Loose connections
Motor winding deterioration
Contamination of the circuitry
Failure of electronic components
Switch blades falling out of alignment
Insulators damage
7.3 Useful Life
Based on the Industry Values and Utility Interviews the Useful Life Values, Minimum (MIN UL), Typical (TUL) and Maximum (MAX UL) for Overhead Integral Switch are displayed in Table 7-1.
Table 7-1 Useful Life Values for Overhead Integral Switch
MIN UL TUL MAX UL
35 45 60OH Integral Switches
ASSET
COMPONENTIZATION
USEFUL LIFE
7.3.1 Useful Life Data
This section displays the data used to determine the Useful Life Values for Overhead Integral Switch. Three of the interviewed utilities gave Minimum, Typical and Maximum Useful Life (MIN UL, TUL and MAX UL) Values for Overhead Integral Switch (Figure 7-1).
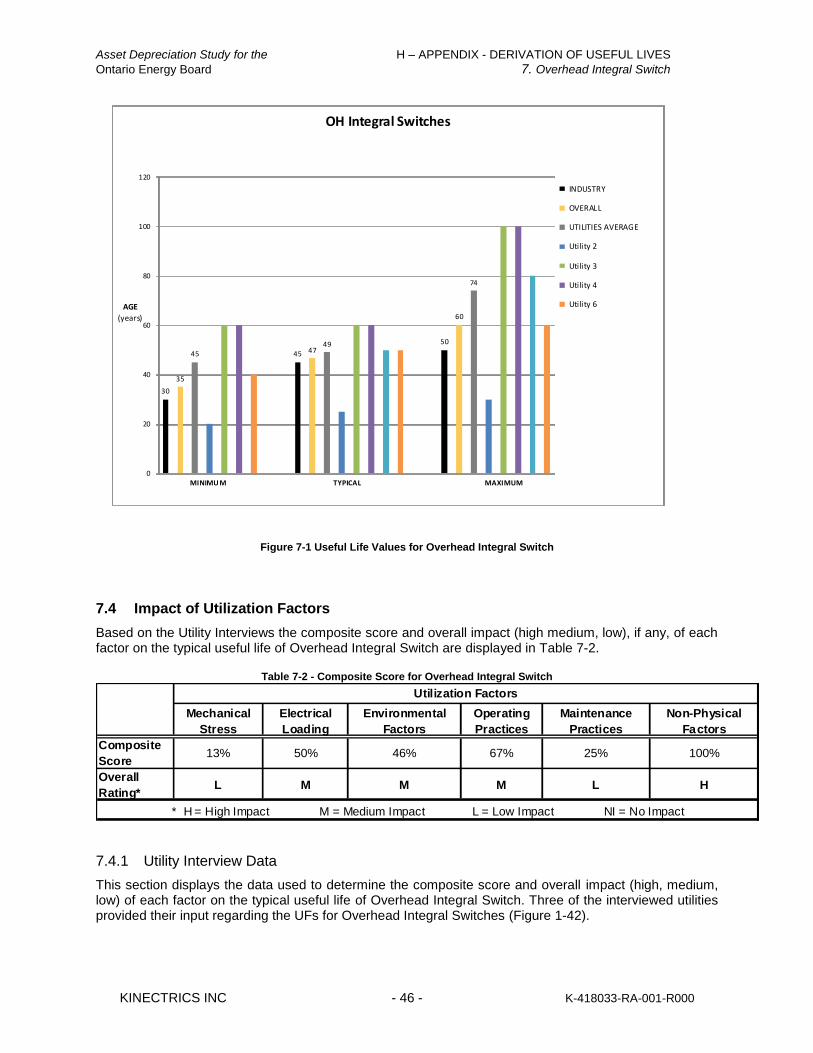
Asset Depreciation Study for the H – APPENDIX - DERIVATION OF USEFUL LIVES
Ontario Energy Board 7. Overhead Integral Switch
KINECTRICS INC - 46 - K-418033-RA-001-R000
30
35
45 45 4749 50
60
74
0
20
40
60
80
100
120
MINIMU M TYPICAL MAXIMUM
OH Integral Switches
INDUSTRY
OVERALL
UTILITIES AVERAGE
Utility 2
Utility 3
Utility 4
Utility 6AGE
(years)
Figure 7-1 Useful Life Values for Overhead Integral Switch
7.4 Impact of Utilization Factors
Based on the Utility Interviews the composite score and overall impact (high medium, low), if any, of each factor on the typical useful life of Overhead Integral Switch are displayed in Table 7-2.
Table 7-2 - Composite Score for Overhead Integral Switch
Mechanical
Stress
Electrical
Loading
Environmental
Factors
Operating
Practices
Maintenance
Practices
Non-Physical
Factors
Composite
Score13% 50% 46% 67% 25% 100%
Overall
Rating*L M M M L H
* H = High Impact M = Medium Impact L = Low Impact NI = No Impact
Utilization Factors
7.4.1 Utility Interview Data
This section displays the data used to determine the composite score and overall impact (high, medium, low) of each factor on the typical useful life of Overhead Integral Switch. Three of the interviewed utilities provided their input regarding the UFs for Overhead Integral Switches (Figure 1-42).
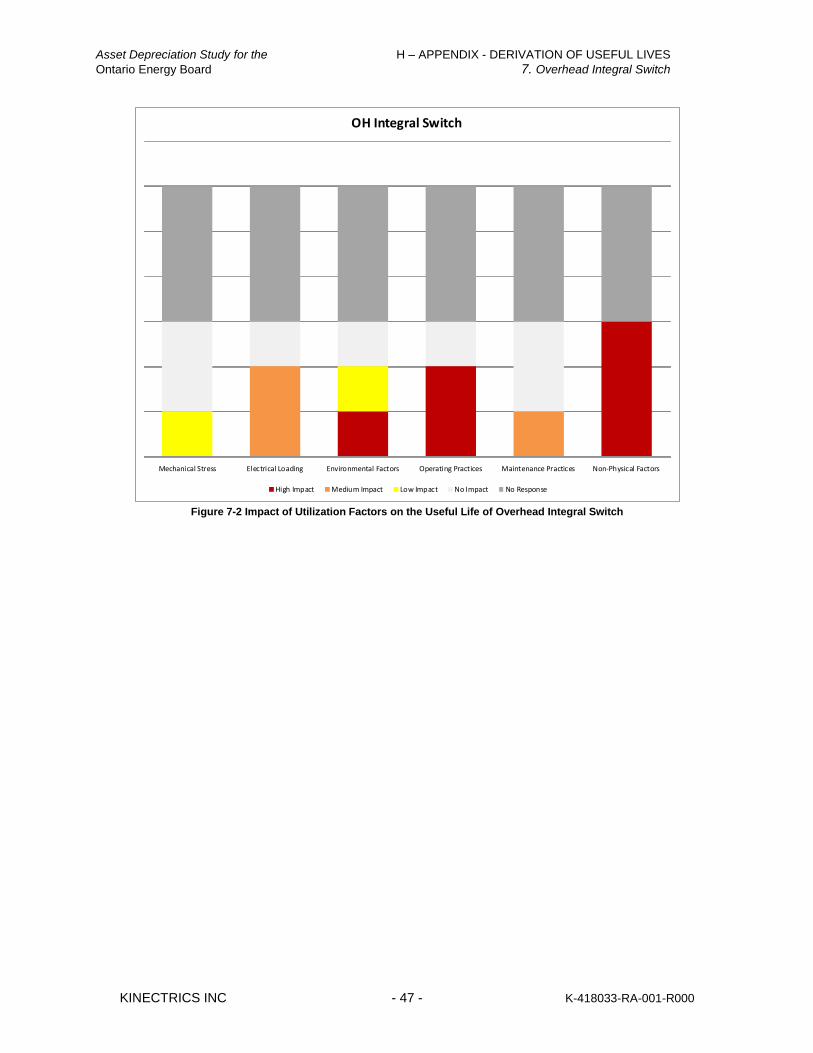
Asset Depreciation Study for the H – APPENDIX - DERIVATION OF USEFUL LIVES
Ontario Energy Board 7. Overhead Integral Switch
KINECTRICS INC - 47 - K-418033-RA-001-R000
Mechanical Stress Electrical Loading Environmental Factors Operating Practices Maintenance Practices Non-Physical Factors
OH Integral Switch
High Impact Medium Impact Low Impact No Impact No Response
Figure 7-2 Impact of Utilization Factors on the Useful Life of Overhead Integral Switch
Asset Depreciation Study for the H – APPENDIX - DERIVATION OF USEFUL LIVES
Ontario Energy Board 8. Overhead Conductors
KINECTRICS INC - 48 - K-418033-RA-001-R000
8. Overhead Conductors
8.1 Asset Description
Overhead conductors along with structures that support them constitute overhead lines or feeders that distribute electrical energy to customers from the distribution or transmission station. These conductors are sized to carry a specified maximum current and to meet other design criteria, i.e. mechanical loading.
8.1.1 Componentization Assumptions
For the purposes of this report, the Overhead Conductors asset category has not been componentized.
8.1.2 Design Configuration
There are several types of Overhead Line Switches. For the purposes of this report, the types are aluminum conductor steel reinforced (ACSR), all aluminum conductor (AAC), and copper.
8.1.3 System Hierarchy
Overhead Conductors is considered to be a part of the Overhead Lines asset grouping.
8.2 Degradation Mechanism
To function properly, conductors must retain both their conductive properties and mechanical (i.e. tensile) strength. Aluminum conductors have three primary modes of degradation: corrosion, fatigue and creep. The rate of each degradation mode depends on several factors, including the size and construction of the conductor, as well as environmental and operating conditions. Most utilities find that corrosion and fatigue present the most critical forms of degradation. Generally, corrosion represents the most critical life-limiting factor for aluminum-based conductors. Visual inspection cannot detect corrosion readily in conductors. Environmental conditions affect degradation rates from corrosion. Both aluminum and zinc-coated steel core conductors are particularly susceptible to corrosion from chlorine-based pollutants, even in low concentrations. Fatigue degradation presents greater detection and assessment challenges than corrosion degradation. In extreme circumstances, under high tensions or inappropriate vibration or galloping control, fatigue can occur in very short timeframes. However, under normal operating conditions, with proper design and application of vibration control, fatigue degradation rates are relatively slow. Under normal circumstances, widespread fatigue degradation is not commonly seen in conductors less than 70 years of age. Also, in many cases detectable indications of fatigue may only exist during the last 10% of a conductor’s life. In designing distribution lines, engineers ensure that conductors have adequate rated tensile strength (RTS) to withstand the heaviest anticipated weather loads. The tensile strength of conductors gradually decreases over time. When conductors experience unexpectedly large mechanical loads and tensions, they begin to undergo permanent stretching with noticeable increases in sagging. Overloading lines beyond their thermal capacity causes elevated operating temperatures. When operating at elevated temperatures, aluminum conductors begin to anneal and lose tensile strength. Each elevated temperature event adds further damage to the conductor. After a loss of 10% of a conductor’s RTS, significant sag occurs, requiring either re-sagging or replacement of the conductor. Phase to phase power arcs can result from conductor galloping during severe storm events. This can cause localized burning and melting of a conductor’s aluminum strands, reducing strength at those sites and potentially leading to conductor failures. Visual inspection readily detects arcing damage.

Asset Depreciation Study for the H – APPENDIX - DERIVATION OF USEFUL LIVES
Ontario Energy Board 8. Overhead Conductors
KINECTRICS INC - 49 - K-418033-RA-001-R000
Other forms of conductor damage include:
Broken strands (i.e., outer and inners)
Strand abrasion
Elongation (i.e., change in sags and tensions)
Burn damage (i.e., power arc/clashing)
Birdcaging The degradation of copper wire is mostly due to corrosion. Oxidization gives copper a high resistance to corrosion. Derivatives of chlorine and sulfur contained in coastal atmospheres start the oxidation by forming a blackish or greenish film. The film is very dense, has low solubility, high electric resistance and high resistance to chemical attack and to corrosion. Despite this, mechanical vibrations, abrasion, erosion and thermal variations may cause fissures and faults in this layer. When this happens, the metal is uncovered and corrosion may occur. Also electrolytes with low chlorine content could enter, causing a change in the chemical passivity. This may also be the result of a deficit of oxygen which would make the area anodic and rapidly accelerate corrosion. Note that the weather protection and insulation on the Cables is for improving reliability of the distribution system as opposed to improving the useful life of this asset. The conductive properties of the wire are what degradation impacts, although Utilities may choose to replace weather protected cables if called for by their own system reliability practices.
8.3 Useful Life
Based on the Industry Values and Utility Interviews the Useful Life Values, Minimum (MIN UL), Typical (TUL) and Maximum (MAX UL) for Overhead Conductors are displayed in Table 8-1.
Table 8-1 Useful Life Values for Overhead Conductors
MIN UL TUL MAX UL
50 60 75
ASSET
COMPONENTIZATION
USEFUL LIFE
OH Conductors
8.3.1 Useful Life Data
This section displays the data used to determine the Useful Life Values for Overhead Conductors. Four of the interviewed utilities gave Minimum (Min UL) Values and five of the interviewed utilities gave TUL and MAX UL Values for Overhead Conductors (Figure 8-1).

Asset Depreciation Study for the H – APPENDIX - DERIVATION OF USEFUL LIVES
Ontario Energy Board 8. Overhead Conductors
KINECTRICS INC - 50 - K-418033-RA-001-R000
5048
42
6059
55
77
73
62
0
10
20
30
40
50
60
70
80
90
MINIMU M TYPICAL MAXIMUM
OH Conductors
INDUSTRY
OVERALL
UTILITIES AVERAGE
Utility 1
Utility 2
Utility 5
AGE(years)
AGE(years)
Figure 8-1 Useful Life Values for Overhead Conductors
8.4 Impact of Utilization Factors
Based on the Utility Interviews the composite score and overall impact (high medium, low), if any, of each factor on the typical useful life of Overhead Conductors are displayed in Table 8-1.
Table 8-2 Composite Score for Overhead Conductors
Mechanical
Stress
Electrical
Loading
Environmental
Factors
Operating
Practices
Maintenance
Practices
Non-Physical
Factors
Composite
Score50% 38% 65% 0% 8% 28%
Overall
Rating*M L M NI NI L
* H = High Impact M = Medium Impact L = Low Impact NI = No Impact
Utilization Factors
8.4.1 Utility Interview Data
This section displays the data used to determine the composite score and overall impact (high, medium, low) of each factor on the typical useful life of Overhead Conductors. Five of the interviewed utilities provided their input regarding the UFs for Overhead Conductors (Figure 1-42).
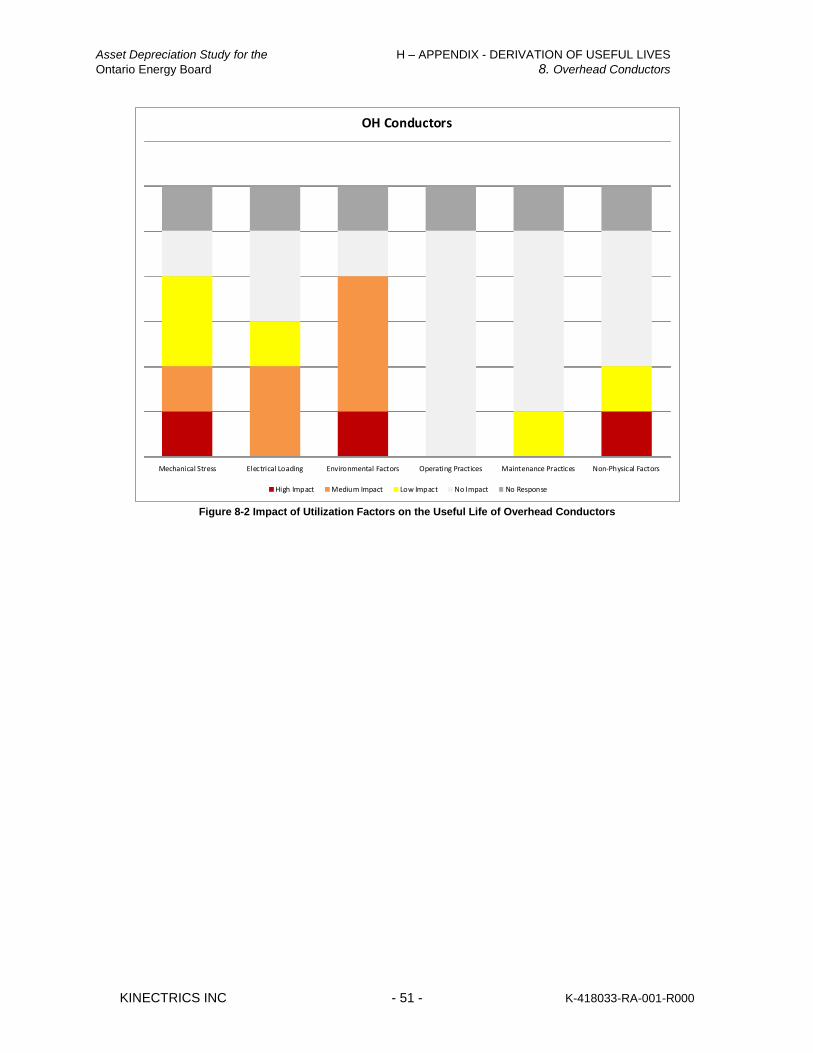
Asset Depreciation Study for the H – APPENDIX - DERIVATION OF USEFUL LIVES
Ontario Energy Board 8. Overhead Conductors
KINECTRICS INC - 51 - K-418033-RA-001-R000
Mechanical Stress Electrical Loading Environmental Factors Operating Practices Maintenance Practices Non-Physical Factors
OH Conductors
High Impact Medium Impact Low Impact No Impact No Response
Figure 8-2 Impact of Utilization Factors on the Useful Life of Overhead Conductors

Asset Depreciation Study for the H – APPENDIX - DERIVATION OF USEFUL LIVES
Ontario Energy Board 9. Overhead Transformers and Voltage Regulators
KINECTRICS INC - 52 - K-418033-RA-001-R000
9. Overhead Transformers and Voltage Regulators
9.1 Asset Description
Distribution pole top transformers change sub-transmission or primary distribution voltages to secondary voltages such as 120/240 V or other common voltages for use in residential and commercial applications.
9.1.1 Componentization Assumptions
For the purposes of this report, the Overhead Transformers and Voltage Regulators asset category has not been componentized.
9.1.2 Design Configuration
For the purposes of this report, Overhead Transformers and Voltage Regulators refers to both single phase and three phase Transformers.
9.1.3 System Hierarchy
Overhead Transformers and Voltage Regulators is considered to be a part of the Overhead Lines asset grouping.
9.2 Degradation Mechanism
It has been demonstrated that the life of the transformer’s internal insulation is related to temperature-rise and duration. Therefore, transformer life is affected by electrical loading profiles and length of time in service. Other factors such as mechanical damage, exposure to corrosive salts, and voltage and current surges also have a strong effect. Therefore, a combination of condition, age and load based criteria is commonly considered in determining the useful remaining life of distribution transformers. The impacts of loading profiles, load growth, and ambient temperature on asset condition, loss-of-life, and life expectancy can be assessed using methods outlined in ANSI/IEEE Loading Guides. This also provides an initial baseline for the size of transformer that should be selected for a given number and type of end users to obtain optimal life. The life of the voltage regulator’s internal insulation is related to temperature-rise and duration. Therefore, voltage regulator life is affected by electrical loading profiles and length of time in service. Other factors such as mechanical damage, exposure to corrosive salts, and voltage and current surges also have a strong effect. Therefore, a combination of condition, age and load based criteria is commonly considered in determining the useful remaining life of voltage regulators. The impacts of loading profiles, load growth, and ambient temperature on asset condition, loss-of-life, and life expectancy can be assessed. There is also the operating practice affect on voltage regulators in terms of the number of operations that it is required to perform on a daily basis.
9.3 Useful Life
Based on the Industry Values and Utility Interviews the Useful Life Values, Minimum (MIN UL), Typical (TUL) and Maximum (MAX UL) for Overhead Transformers and Voltage Regulators are displayed in Table 9-1.

Asset Depreciation Study for the H – APPENDIX - DERIVATION OF USEFUL LIVES
Ontario Energy Board 9. Overhead Transformers and Voltage Regulators
KINECTRICS INC - 53 - K-418033-RA-001-R000
Table 9-1 Useful Life Values for Overhead Transformers and Voltage Regulators
MIN UL TUL MAX UL
30 40 60OH Transformers
ASSET
COMPONENTIZATION
USEFUL LIFE
9.3.1 Useful Life Data
This section displays the data used to determine the Useful Life Values for Overhead Transformers and Voltage Regulators. All six of the interviewed utilities gave Minimum, Typical and Maximum Useful Life (MIN UL, TUL and MAX UL) Values for Overhead Transformers and Voltage Regulators (Figure 9-1).
30 2928
4042
45
6062
63
0
10
20
30
40
50
60
70
80
90
100
MINIMUM TYPICAL MAXIMUM
OH Transformers
INDUSTRY
OVERALL
UTILITIES AVERAGE
Utility 1
Utility 2
Utility 3
Utility 4
Utility 5
Utility 6
AGE(years)
Figure 9-1 Useful Life Values for Overhead Transformers and Voltage Regulators
9.4 Impact of Utilization Factors
Based on the Utility Interviews the composite score and overall impact (high medium, low), if any, of each factor on the typical useful life of Overhead Transformers and Voltage Regulators are displayed in Table 9-2.
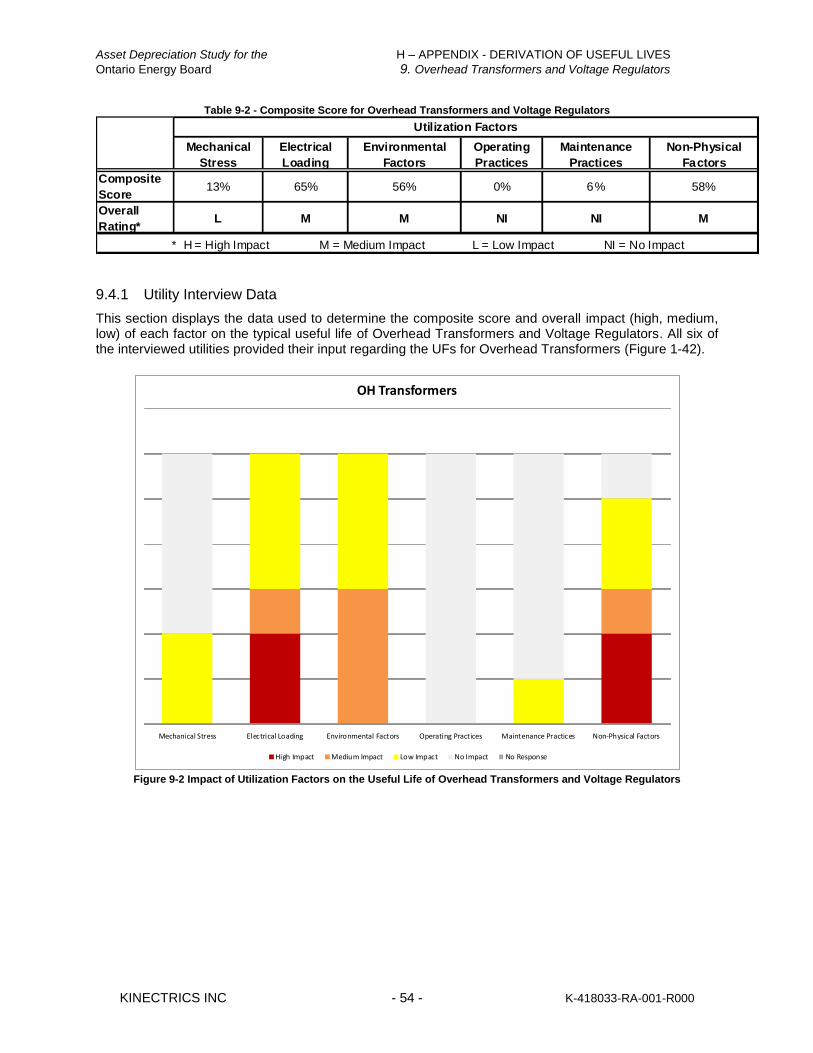
Asset Depreciation Study for the H – APPENDIX - DERIVATION OF USEFUL LIVES
Ontario Energy Board 9. Overhead Transformers and Voltage Regulators
KINECTRICS INC - 54 - K-418033-RA-001-R000
Table 9-2 - Composite Score for Overhead Transformers and Voltage Regulators
Mechanical
Stress
Electrical
Loading
Environmental
Factors
Operating
Practices
Maintenance
Practices
Non-Physical
Factors
Composite
Score13% 65% 56% 0% 6% 58%
Overall
Rating*L M M NI NI M
* H = High Impact M = Medium Impact L = Low Impact NI = No Impact
Utilization Factors
9.4.1 Utility Interview Data
This section displays the data used to determine the composite score and overall impact (high, medium, low) of each factor on the typical useful life of Overhead Transformers and Voltage Regulators. All six of the interviewed utilities provided their input regarding the UFs for Overhead Transformers (Figure 1-42).
Mechanical Stress Electrical Loading Environmental Factors Operating Practices Maintenance Practices Non-Physical Factors
OH Transformers
High Impact Medium Impact Low Impact No Impact No Response
Figure 9-2 Impact of Utilization Factors on the Useful Life of Overhead Transformers and Voltage Regulators
Asset Depreciation Study for the H – APPENDIX - DERIVATION OF USEFUL LIVES
Ontario Energy Board 10. Overhead Shunt Capacitor Banks
KINECTRICS INC - 55 - K-418033-RA-001-R000
10. Overhead Shunt Capacitor Banks
10.1 Asset Description
This asset category refers to pole mounted shunt capacitor banks and their supporting hardware. The capacitor bank also includes the control switches and devices, fuse cutout, surge arrester and in some cases current-limiting fuses. Shunt capacitors regulate voltage in distribution systems, and provide reactive compensation.
10.1.1 Componentization Assumptions
For the purposes of this report, the Overhead Shunt Capacitor Banks asset category has not been componentized.
10.1.2 System Hierarchy
Overhead Shunt Capacitor Banks is considered to be a part of the Overhead Lines asset grouping.
10.2 Degradation Mechanism
The major degradation of overhead capacitor banks is related to the capacitors themselves. They are exposed to detrimental environmental factors including: extreme temperatures, contamination, birds etc. They also experience steady state, transient and dynamic over voltage conditions. The switching devices add an additional stress to the capacitors. These environmental conditions, electrical loading and operating practices cause non-reversible degradation of the insulation in capacitor units and external insulation. Fuse and bushing degradation result primarily from the failure of seals (hence moisture seeps in). Based on the surrounding environmental conditions this may cause corrosion of the capacitor units and support frame. Internal degradation can also occur in insulators.
10.3 Useful Life
Based on the Industry Values and Utility Interviews the Useful Life Values, Minimum (MIN UL), Typical (TUL) and Maximum (MAX UL) for Overhead Shunt Capacitor Banks are displayed in Table 10-1 Useful Life Values for Overhead Shunt Capacitor Banks
Table 10-1 Useful Life Values for Overhead Shunt Capacitor Banks
MIN UL TUL MAX UL
25 30 40OH Shunt Capacitor Banks
ASSET
COMPONENTIZATION
USEFUL LIFE
10.3.1 Useful Life Data
This section displays the data used to determine the Useful Life Values for Overhead Shunt Capacitor Banks. None of the interviewed utilities gave Minimum, Typical and Maximum Useful Life (MIN UL, TUL and MAX UL) Values for Overhead Shunt Capacitor Banks (Figure 10-1).
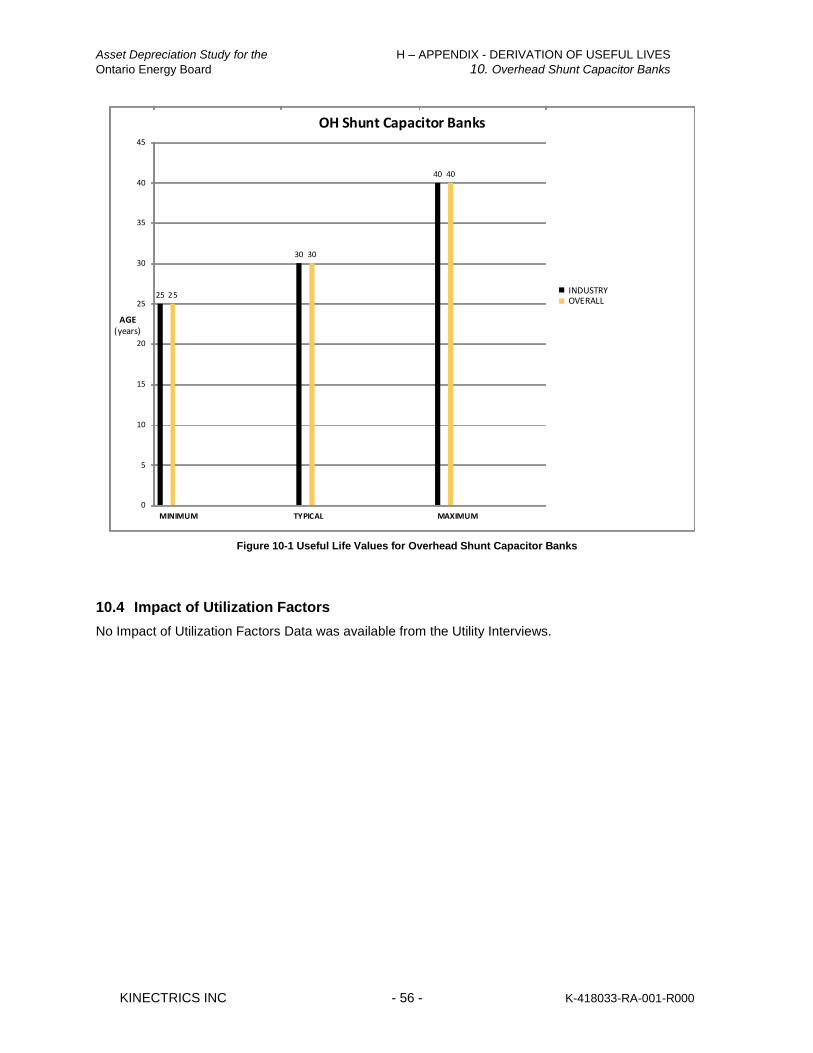
Asset Depreciation Study for the H – APPENDIX - DERIVATION OF USEFUL LIVES
Ontario Energy Board 10. Overhead Shunt Capacitor Banks
KINECTRICS INC - 56 - K-418033-RA-001-R000
25 25
30 30
40 40
0
5
10
15
20
25
30
35
40
45
MINIMUM TYPICAL MAXIMUM
OH Shunt Capacitor Banks
INDUSTRYOVERALL
AGE(years)
Figure 10-1 Useful Life Values for Overhead Shunt Capacitor Banks
10.4 Impact of Utilization Factors
No Impact of Utilization Factors Data was available from the Utility Interviews.
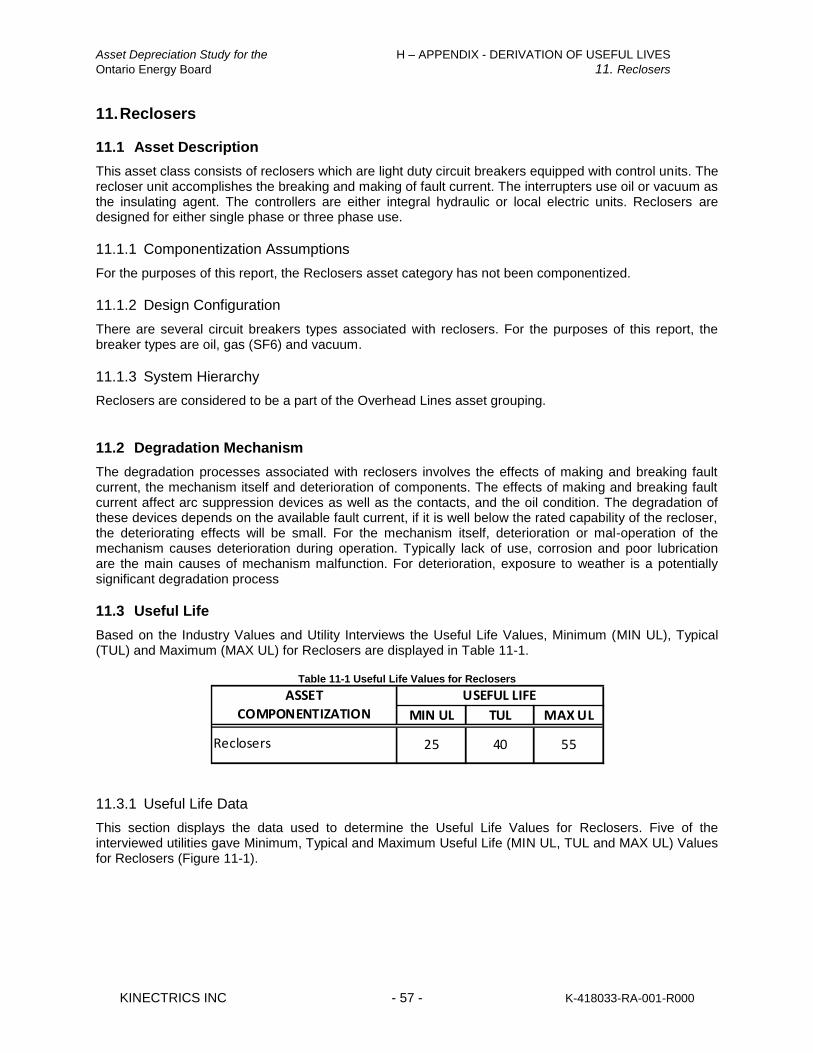
Asset Depreciation Study for the H – APPENDIX - DERIVATION OF USEFUL LIVES
Ontario Energy Board 11. Reclosers
KINECTRICS INC - 57 - K-418033-RA-001-R000
11. Reclosers
11.1 Asset Description
This asset class consists of reclosers which are light duty circuit breakers equipped with control units. The recloser unit accomplishes the breaking and making of fault current. The interrupters use oil or vacuum as the insulating agent. The controllers are either integral hydraulic or local electric units. Reclosers are designed for either single phase or three phase use.
11.1.1 Componentization Assumptions
For the purposes of this report, the Reclosers asset category has not been componentized.
11.1.2 Design Configuration
There are several circuit breakers types associated with reclosers. For the purposes of this report, the breaker types are oil, gas (SF6) and vacuum.
11.1.3 System Hierarchy
Reclosers are considered to be a part of the Overhead Lines asset grouping.
11.2 Degradation Mechanism
The degradation processes associated with reclosers involves the effects of making and breaking fault current, the mechanism itself and deterioration of components. The effects of making and breaking fault current affect arc suppression devices as well as the contacts, and the oil condition. The degradation of these devices depends on the available fault current, if it is well below the rated capability of the recloser, the deteriorating effects will be small. For the mechanism itself, deterioration or mal-operation of the mechanism causes deterioration during operation. Typically lack of use, corrosion and poor lubrication are the main causes of mechanism malfunction. For deterioration, exposure to weather is a potentially significant degradation process
11.3 Useful Life
Based on the Industry Values and Utility Interviews the Useful Life Values, Minimum (MIN UL), Typical (TUL) and Maximum (MAX UL) for Reclosers are displayed in Table 11-1.
Table 11-1 Useful Life Values for Reclosers
MIN UL TUL MAX UL
25 40 55Reclosers
ASSET
COMPONENTIZATION
USEFUL LIFE
11.3.1 Useful Life Data
This section displays the data used to determine the Useful Life Values for Reclosers. Five of the interviewed utilities gave Minimum, Typical and Maximum Useful Life (MIN UL, TUL and MAX UL) Values for Reclosers (Figure 11-1).
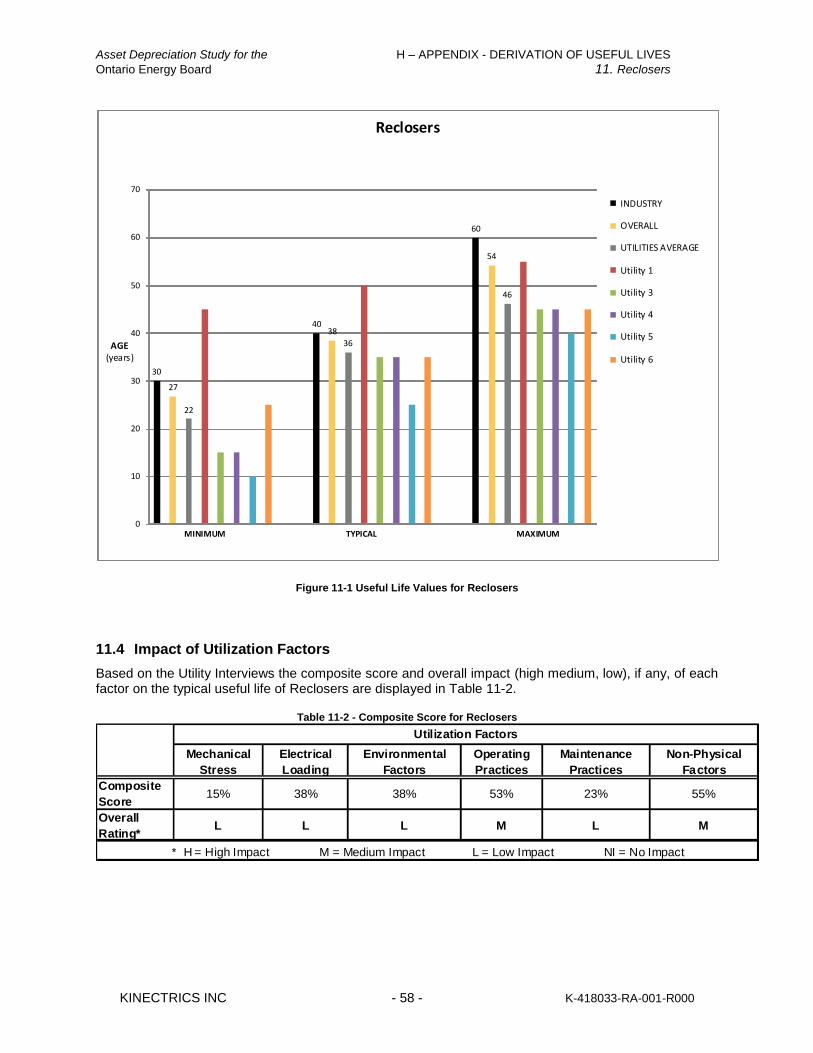
Asset Depreciation Study for the H – APPENDIX - DERIVATION OF USEFUL LIVES
Ontario Energy Board 11. Reclosers
KINECTRICS INC - 58 - K-418033-RA-001-R000
30
27
22
4038
36
60
54
46
0
10
20
30
40
50
60
70
MINIMUM TYPICAL MAXIMUM
Reclosers
INDUSTRY
OVERALL
UTILITIES AVERAGE
Utility 1
Utility 3
Utility 4
Utility 5
Utility 6
AGE(years)
Figure 11-1 Useful Life Values for Reclosers
11.4 Impact of Utilization Factors
Based on the Utility Interviews the composite score and overall impact (high medium, low), if any, of each factor on the typical useful life of Reclosers are displayed in Table 11-2.
Table 11-2 - Composite Score for Reclosers
Mechanical
Stress
Electrical
Loading
Environmental
Factors
Operating
Practices
Maintenance
Practices
Non-Physical
Factors
Composite
Score15% 38% 38% 53% 23% 55%
Overall
Rating*L L L M L M
* H = High Impact M = Medium Impact L = Low Impact NI = No Impact
Utilization Factors

Asset Depreciation Study for the H – APPENDIX - DERIVATION OF USEFUL LIVES
Ontario Energy Board 11. Reclosers
KINECTRICS INC - 59 - K-418033-RA-001-R000
11.4.1 Utility Interview Data
This section displays the data used to determine the composite score and overall impact (high, medium, low) of each factor on the typical useful life of Reclosers. Five of the interviewed utilities provided their input regarding the UFs for Reclosers (Figure 1-42).
Mechanical Stress Electrical Loading Environmental Factors Operating Practices Maintenance Practices Non-Physical Factors
Reclosers
High Impact Medium Impact Low Impact No Impact No Response
Figure 11-2 Impact of Utilization Factors on the Useful Life of Reclosers
Asset Depreciation Study for the H – APPENDIX - DERIVATION OF USEFUL LIVES
Ontario Energy Board 12. Power Transformers
KINECTRICS INC - 60 - K-418033-RA-001-R000
12. Power Transformers
12.1 Asset Description
While power transformers can be employed in either step-up or step-down mode, a majority of the applications in transmission and distribution stations involve step down of the transmission or sub-transmission voltage to distribution voltage levels. Power transformers vary in capacity and ratings over a broad range. There are two general classifications of power transformers: transmission station transformers and distribution station transformers. For transformer stations, when step down from 230kV or 115kV to distribution voltage is required, ratings may range from 30MVA to 125 MVA.
12.1.1 Componentization Assumptions
For the purposes of this report, the Power Transformers asset category has been componentized so that the bushing and tap changer may be regarded as separate components. Therefore the Power Transformer has overall useful life values based on the useful life of the transformer itself and useful life values for the specific components, bushing and tap changer.
12.1.2 System Hierarchy
Power Transformers is considered to be a part of the Transformer and Municipal Stations asset grouping.
12.2 Degradation Mechanism
Transformers operate under many extreme conditions, and both normal and abnormal conditions affect their aging and breakdown. They are subject to thermal, electrical, and mechanical aging. Overloads cause above-normal temperatures, through-faults can cause displacement of coils and insulation, and lightning and switching surges can cause internal localized over-voltages. For a majority of transformers, end of life is a result of the failure of insulation, more specifically, the failure of pressboard and paper insulation. While the insulating oil can be treated or changed, it is not practical to change the paper and pressboard insulation. The condition and degradation of the insulating oil, however, plays a significant role in aging and deterioration of the transformer, as it directly influences the speed of degradation of the paper insulation. The degradation of oil and paper in transformers is essentially an oxidation process. The three important factors that impact the rate of oxidation of oil and paper insulation are the presence of oxygen, high temperature, and moisture. Particles and acids, as well as static electricity in oil cooled units, also affect the insulation. Tap changers and bushing are major components of the power transformer. Tap changers are complex mechanical devices and are therefore prone to failure resulting from either mechanical or electrical degradation. Bushings are subject to aging from both electrical and thermal stresses.

Asset Depreciation Study for the H – APPENDIX - DERIVATION OF USEFUL LIVES
Ontario Energy Board 12. Power Transformers
KINECTRICS INC - 61 - K-418033-RA-001-R000
12.3 Useful Life
Based on the Industry Values and Utility Interviews the Useful Life Values, Minimum (MIN UL), Typical (TUL) and Maximum (MAX UL) for Power Transformers are displayed in Table 12-1.
Table 12-1 Useful Life Values for Power Transformers
MIN UL TUL MAX UL
30 45 60
10 20 30
20 30 60Tap Changer
Bushing
Overall
ASSET
COMPONENTIZATION
USEFUL LIFE
12.3.1 Useful Life Data
This section displays the data used to determine the Useful Life Values for Power Transformers. All six of the interviewed utilities gave Minimum, Typical and Maximum Useful Life (MIN UL, TUL and MAX UL) Values for Power Transformers (Figure 12-1).
32 32 33
45 45 45
55
58
61
0
10
20
30
40
50
60
70
80
MINIMUM TYPICAL MAXIMUM
Power Transformers Overall
INDUSTRY
OVERALL
UTILITIES AVERAGE
Utility 1
Utility 2
Utility 3
Utility 4
Utility 5
Utility 6
AGE(years)
Figure 12-1 Useful Life Values for Power Transformers
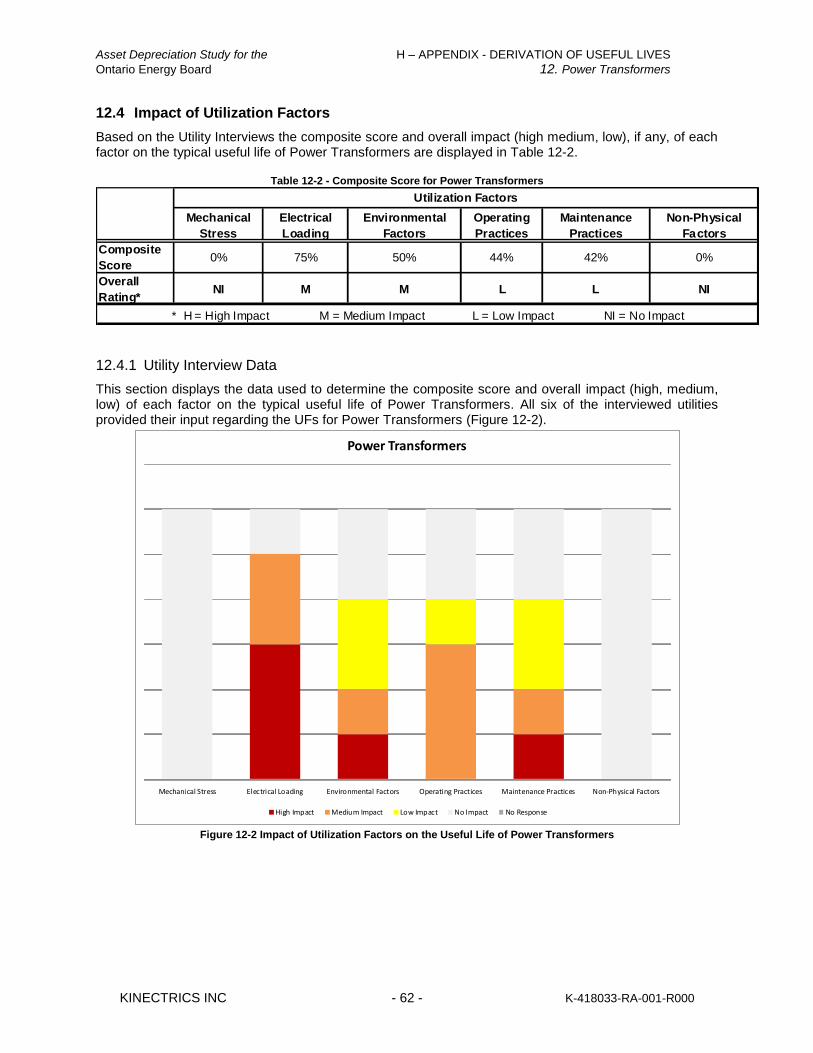
Asset Depreciation Study for the H – APPENDIX - DERIVATION OF USEFUL LIVES
Ontario Energy Board 12. Power Transformers
KINECTRICS INC - 62 - K-418033-RA-001-R000
12.4 Impact of Utilization Factors
Based on the Utility Interviews the composite score and overall impact (high medium, low), if any, of each factor on the typical useful life of Power Transformers are displayed in Table 12-2.
Table 12-2 - Composite Score for Power Transformers
Mechanical
Stress
Electrical
Loading
Environmental
Factors
Operating
Practices
Maintenance
Practices
Non-Physical
Factors
Composite
Score0% 75% 50% 44% 42% 0%
Overall
Rating*NI M M L L NI
* H = High Impact M = Medium Impact L = Low Impact NI = No Impact
Utilization Factors
12.4.1 Utility Interview Data
This section displays the data used to determine the composite score and overall impact (high, medium, low) of each factor on the typical useful life of Power Transformers. All six of the interviewed utilities provided their input regarding the UFs for Power Transformers (Figure 12-2).
Mechanical Stress Electrical Loading Environmental Factors Operating Practices Maintenance Practices Non-Physical Factors
Power Transformers
High Impact Medium Impact Low Impact No Impact No Response
Figure 12-2 Impact of Utilization Factors on the Useful Life of Power Transformers
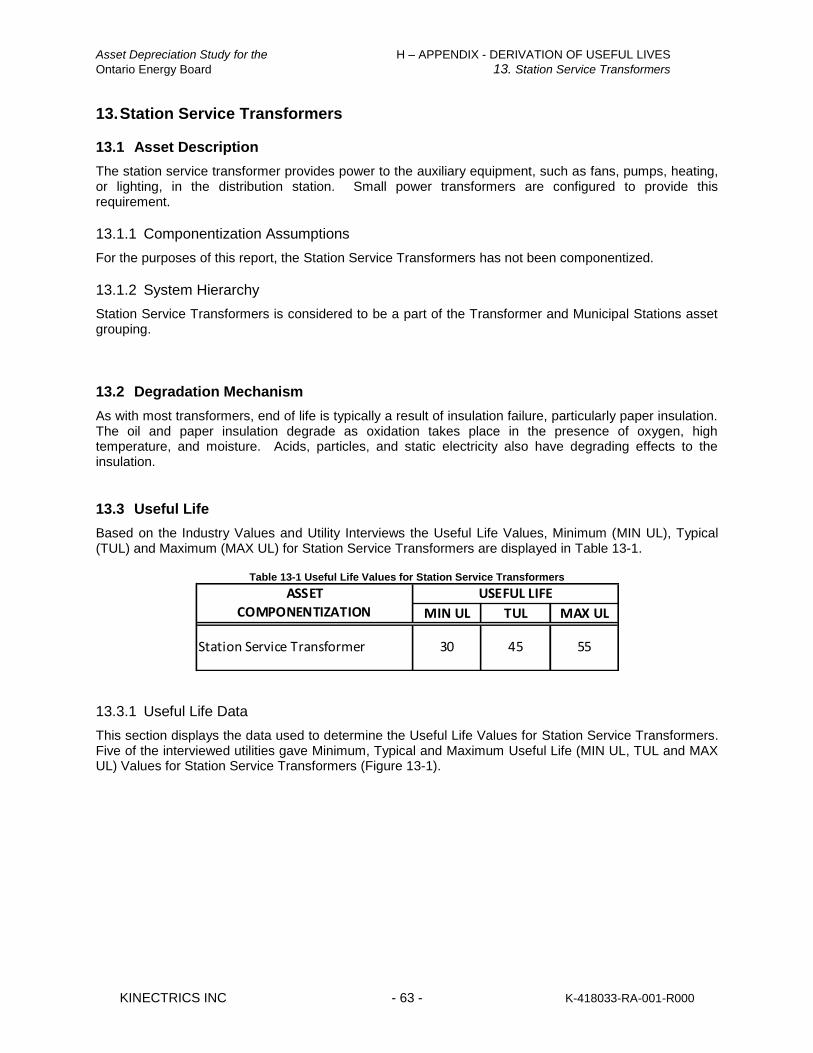
Asset Depreciation Study for the H – APPENDIX - DERIVATION OF USEFUL LIVES
Ontario Energy Board 13. Station Service Transformers
KINECTRICS INC - 63 - K-418033-RA-001-R000
13. Station Service Transformers
13.1 Asset Description
The station service transformer provides power to the auxiliary equipment, such as fans, pumps, heating, or lighting, in the distribution station. Small power transformers are configured to provide this requirement.
13.1.1 Componentization Assumptions
For the purposes of this report, the Station Service Transformers has not been componentized.
13.1.2 System Hierarchy
Station Service Transformers is considered to be a part of the Transformer and Municipal Stations asset grouping.
13.2 Degradation Mechanism
As with most transformers, end of life is typically a result of insulation failure, particularly paper insulation. The oil and paper insulation degrade as oxidation takes place in the presence of oxygen, high temperature, and moisture. Acids, particles, and static electricity also have degrading effects to the insulation.
13.3 Useful Life
Based on the Industry Values and Utility Interviews the Useful Life Values, Minimum (MIN UL), Typical (TUL) and Maximum (MAX UL) for Station Service Transformers are displayed in Table 13-1.
Table 13-1 Useful Life Values for Station Service Transformers
MIN UL TUL MAX UL
30 45 55Station Service Transformer
ASSET
COMPONENTIZATION
USEFUL LIFE
13.3.1 Useful Life Data
This section displays the data used to determine the Useful Life Values for Station Service Transformers. Five of the interviewed utilities gave Minimum, Typical and Maximum Useful Life (MIN UL, TUL and MAX UL) Values for Station Service Transformers (Figure 13-1).
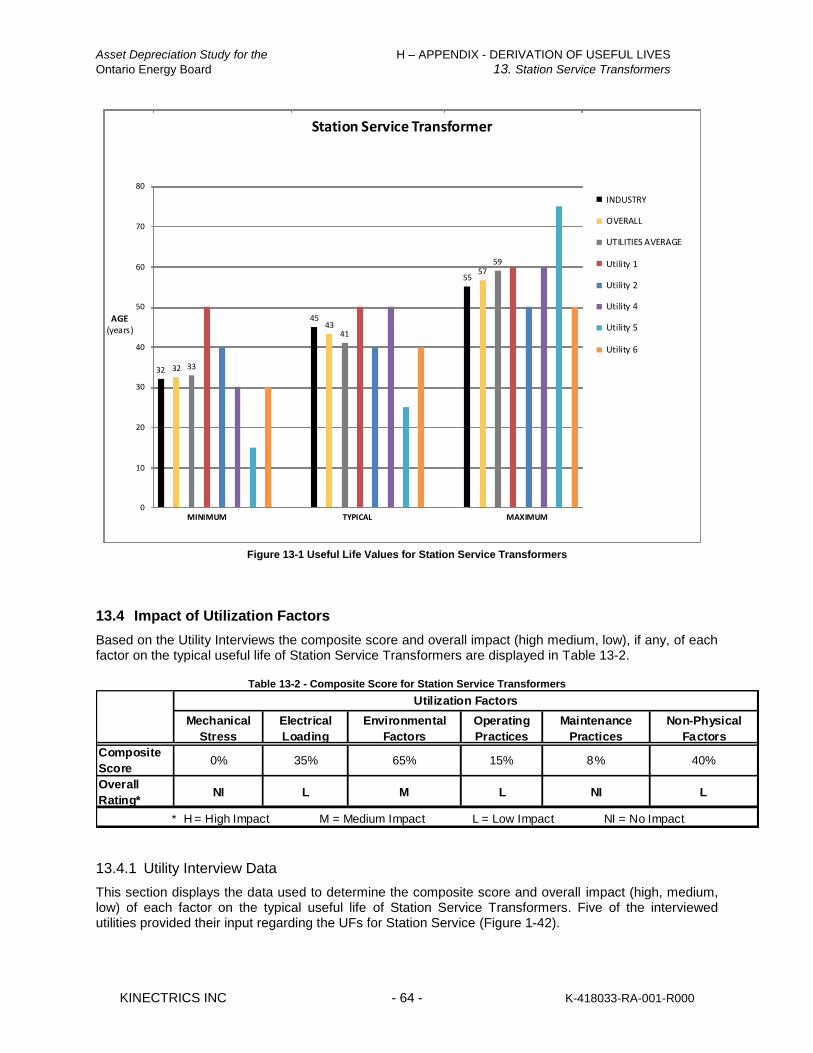
Asset Depreciation Study for the H – APPENDIX - DERIVATION OF USEFUL LIVES
Ontario Energy Board 13. Station Service Transformers
KINECTRICS INC - 64 - K-418033-RA-001-R000
32 32 33
4543
41
5557
59
0
10
20
30
40
50
60
70
80
MINIMUM TYPICAL MAXIMUM
Station Service Transformer
INDUSTRY
OVERALL
UTILITIES AVERAGE
Utility 1
Utility 2
Utility 4
Utility 5
Utility 6
AGE(years)
Figure 13-1 Useful Life Values for Station Service Transformers
13.4 Impact of Utilization Factors
Based on the Utility Interviews the composite score and overall impact (high medium, low), if any, of each factor on the typical useful life of Station Service Transformers are displayed in Table 13-2.
Table 13-2 - Composite Score for Station Service Transformers
Mechanical
Stress
Electrical
Loading
Environmental
Factors
Operating
Practices
Maintenance
Practices
Non-Physical
Factors
Composite
Score0% 35% 65% 15% 8% 40%
Overall
Rating*NI L M L NI L
* H = High Impact M = Medium Impact L = Low Impact NI = No Impact
Utilization Factors
13.4.1 Utility Interview Data
This section displays the data used to determine the composite score and overall impact (high, medium, low) of each factor on the typical useful life of Station Service Transformers. Five of the interviewed utilities provided their input regarding the UFs for Station Service (Figure 1-42).

Asset Depreciation Study for the H – APPENDIX - DERIVATION OF USEFUL LIVES
Ontario Energy Board 13. Station Service Transformers
KINECTRICS INC - 65 - K-418033-RA-001-R000
Mechanical Stress Electrical Loading Environmental Factors Operating Practices Maintenance Practices Non-Physical Factors
Station Service Transformer
High Impact Medium Impact Low Impact No Impact No Response
Figure 13-2 Impact of Utilization Factors on the Useful Life of Station Service Transformers
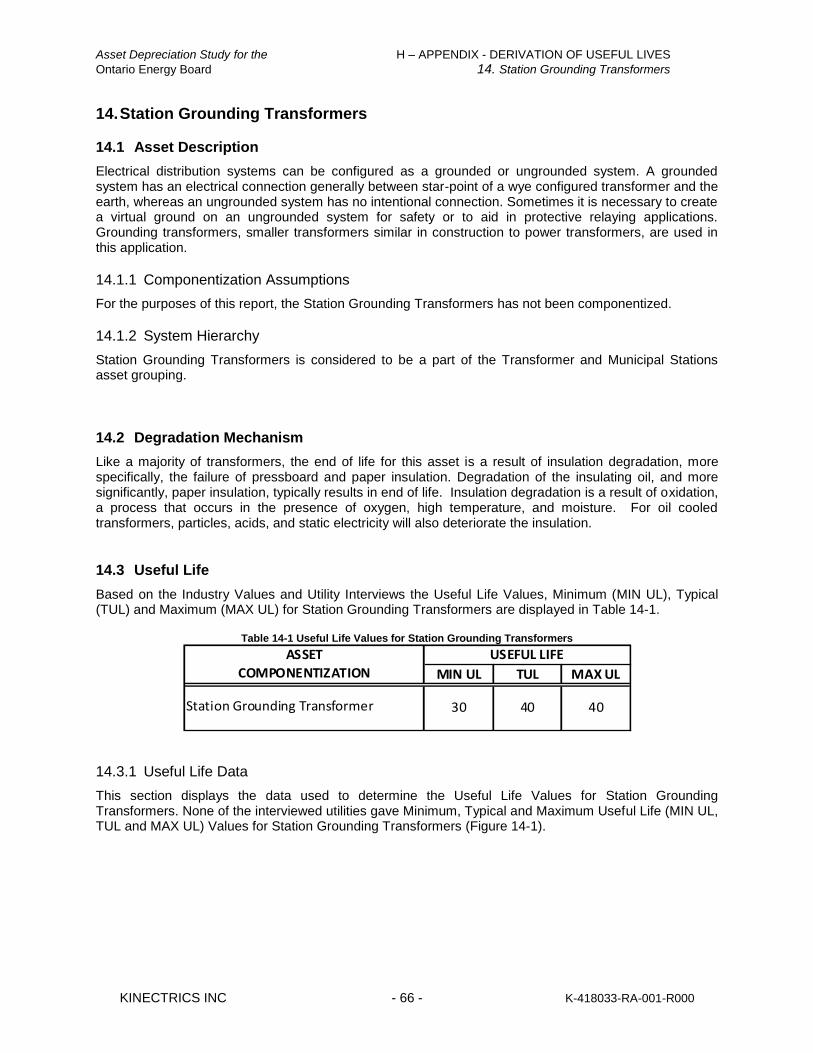
Asset Depreciation Study for the H – APPENDIX - DERIVATION OF USEFUL LIVES
Ontario Energy Board 14. Station Grounding Transformers
KINECTRICS INC - 66 - K-418033-RA-001-R000
14. Station Grounding Transformers
14.1 Asset Description
Electrical distribution systems can be configured as a grounded or ungrounded system. A grounded system has an electrical connection generally between star-point of a wye configured transformer and the earth, whereas an ungrounded system has no intentional connection. Sometimes it is necessary to create a virtual ground on an ungrounded system for safety or to aid in protective relaying applications. Grounding transformers, smaller transformers similar in construction to power transformers, are used in this application.
14.1.1 Componentization Assumptions
For the purposes of this report, the Station Grounding Transformers has not been componentized.
14.1.2 System Hierarchy
Station Grounding Transformers is considered to be a part of the Transformer and Municipal Stations asset grouping.
14.2 Degradation Mechanism
Like a majority of transformers, the end of life for this asset is a result of insulation degradation, more specifically, the failure of pressboard and paper insulation. Degradation of the insulating oil, and more significantly, paper insulation, typically results in end of life. Insulation degradation is a result of oxidation, a process that occurs in the presence of oxygen, high temperature, and moisture. For oil cooled transformers, particles, acids, and static electricity will also deteriorate the insulation.
14.3 Useful Life
Based on the Industry Values and Utility Interviews the Useful Life Values, Minimum (MIN UL), Typical (TUL) and Maximum (MAX UL) for Station Grounding Transformers are displayed in Table 14-1.
Table 14-1 Useful Life Values for Station Grounding Transformers
MIN UL TUL MAX UL
30 40 40
ASSET
COMPONENTIZATION
USEFUL LIFE
Station Grounding Transformer
14.3.1 Useful Life Data
This section displays the data used to determine the Useful Life Values for Station Grounding Transformers. None of the interviewed utilities gave Minimum, Typical and Maximum Useful Life (MIN UL, TUL and MAX UL) Values for Station Grounding Transformers (Figure 14-1).
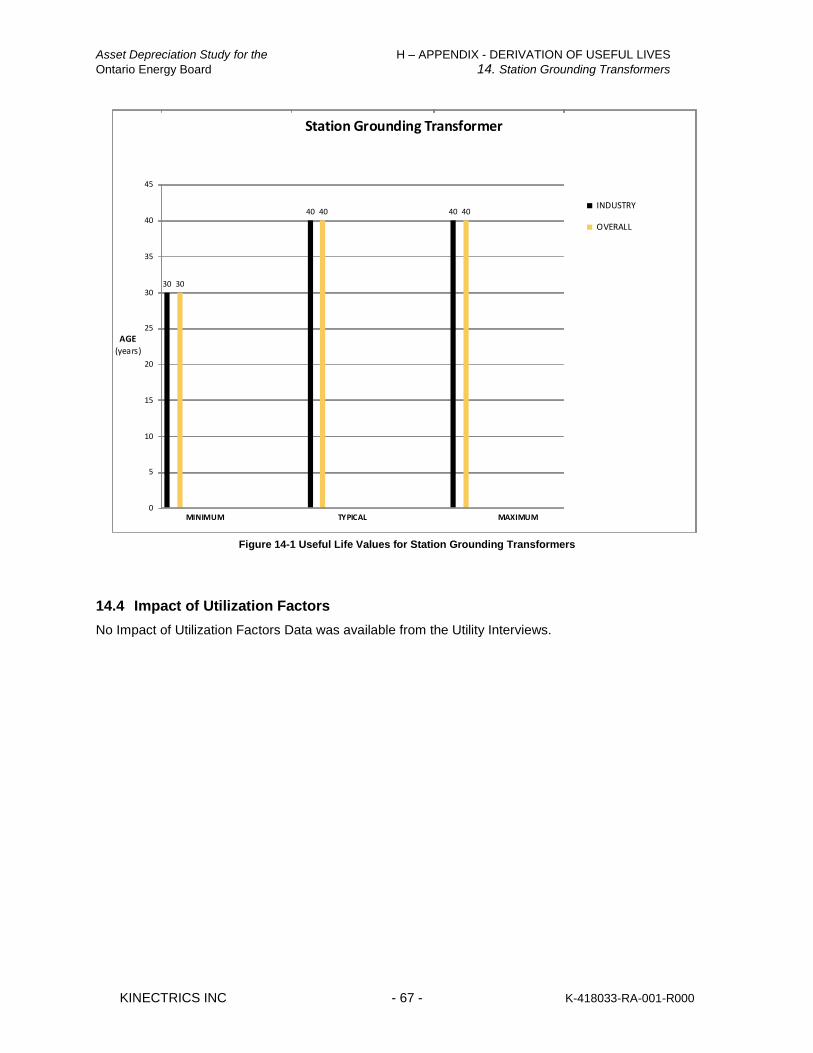
Asset Depreciation Study for the H – APPENDIX - DERIVATION OF USEFUL LIVES
Ontario Energy Board 14. Station Grounding Transformers
KINECTRICS INC - 67 - K-418033-RA-001-R000
30 30
40 40 40 40
0
5
10
15
20
25
30
35
40
45
MINIMUM TYPICAL MAXIMUM
Station Grounding Transformer
INDUSTRY
OVERALL
AGE
(years)
Figure 14-1 Useful Life Values for Station Grounding Transformers
14.4 Impact of Utilization Factors
No Impact of Utilization Factors Data was available from the Utility Interviews.
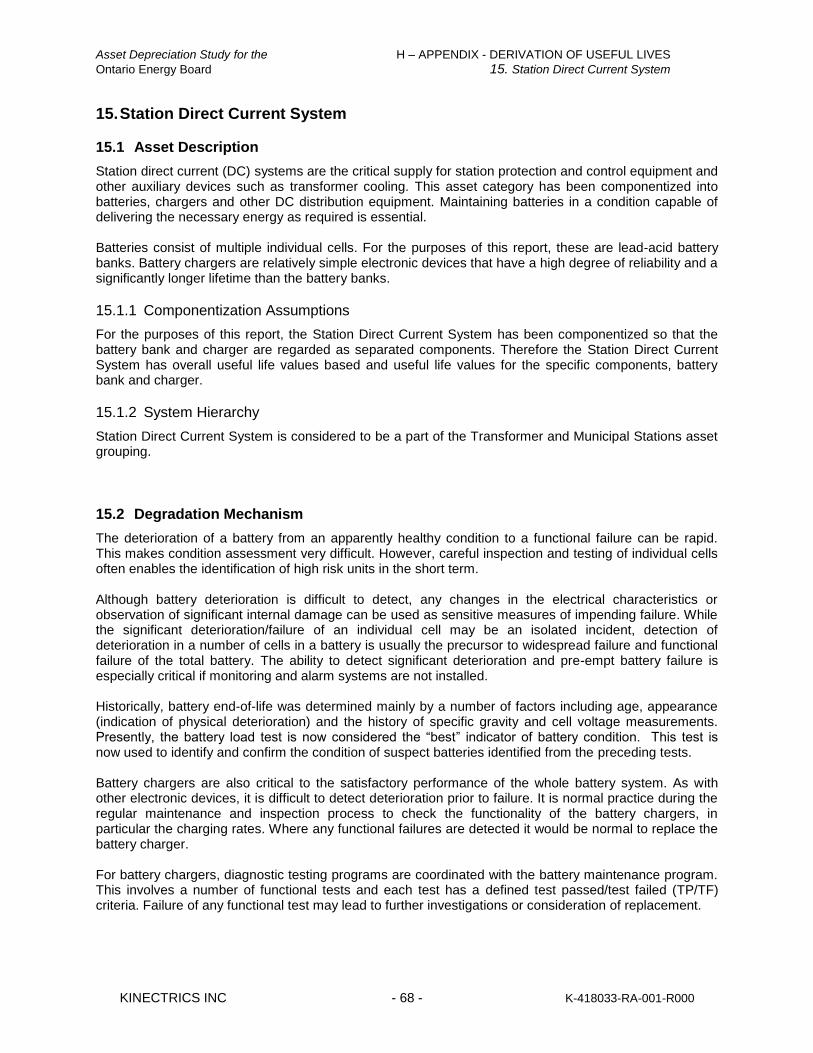
Asset Depreciation Study for the H – APPENDIX - DERIVATION OF USEFUL LIVES
Ontario Energy Board 15. Station Direct Current System
KINECTRICS INC - 68 - K-418033-RA-001-R000
15. Station Direct Current System
15.1 Asset Description
Station direct current (DC) systems are the critical supply for station protection and control equipment and other auxiliary devices such as transformer cooling. This asset category has been componentized into batteries, chargers and other DC distribution equipment. Maintaining batteries in a condition capable of delivering the necessary energy as required is essential. Batteries consist of multiple individual cells. For the purposes of this report, these are lead-acid battery banks. Battery chargers are relatively simple electronic devices that have a high degree of reliability and a significantly longer lifetime than the battery banks.
15.1.1 Componentization Assumptions
For the purposes of this report, the Station Direct Current System has been componentized so that the battery bank and charger are regarded as separated components. Therefore the Station Direct Current System has overall useful life values based and useful life values for the specific components, battery bank and charger.
15.1.2 System Hierarchy
Station Direct Current System is considered to be a part of the Transformer and Municipal Stations asset grouping.
15.2 Degradation Mechanism
The deterioration of a battery from an apparently healthy condition to a functional failure can be rapid. This makes condition assessment very difficult. However, careful inspection and testing of individual cells often enables the identification of high risk units in the short term. Although battery deterioration is difficult to detect, any changes in the electrical characteristics or observation of significant internal damage can be used as sensitive measures of impending failure. While the significant deterioration/failure of an individual cell may be an isolated incident, detection of deterioration in a number of cells in a battery is usually the precursor to widespread failure and functional failure of the total battery. The ability to detect significant deterioration and pre-empt battery failure is especially critical if monitoring and alarm systems are not installed. Historically, battery end-of-life was determined mainly by a number of factors including age, appearance (indication of physical deterioration) and the history of specific gravity and cell voltage measurements. Presently, the battery load test is now considered the “best” indicator of battery condition. This test is now used to identify and confirm the condition of suspect batteries identified from the preceding tests. Battery chargers are also critical to the satisfactory performance of the whole battery system. As with other electronic devices, it is difficult to detect deterioration prior to failure. It is normal practice during the regular maintenance and inspection process to check the functionality of the battery chargers, in particular the charging rates. Where any functional failures are detected it would be normal to replace the battery charger. For battery chargers, diagnostic testing programs are coordinated with the battery maintenance program. This involves a number of functional tests and each test has a defined test passed/test failed (TP/TF) criteria. Failure of any functional test may lead to further investigations or consideration of replacement.
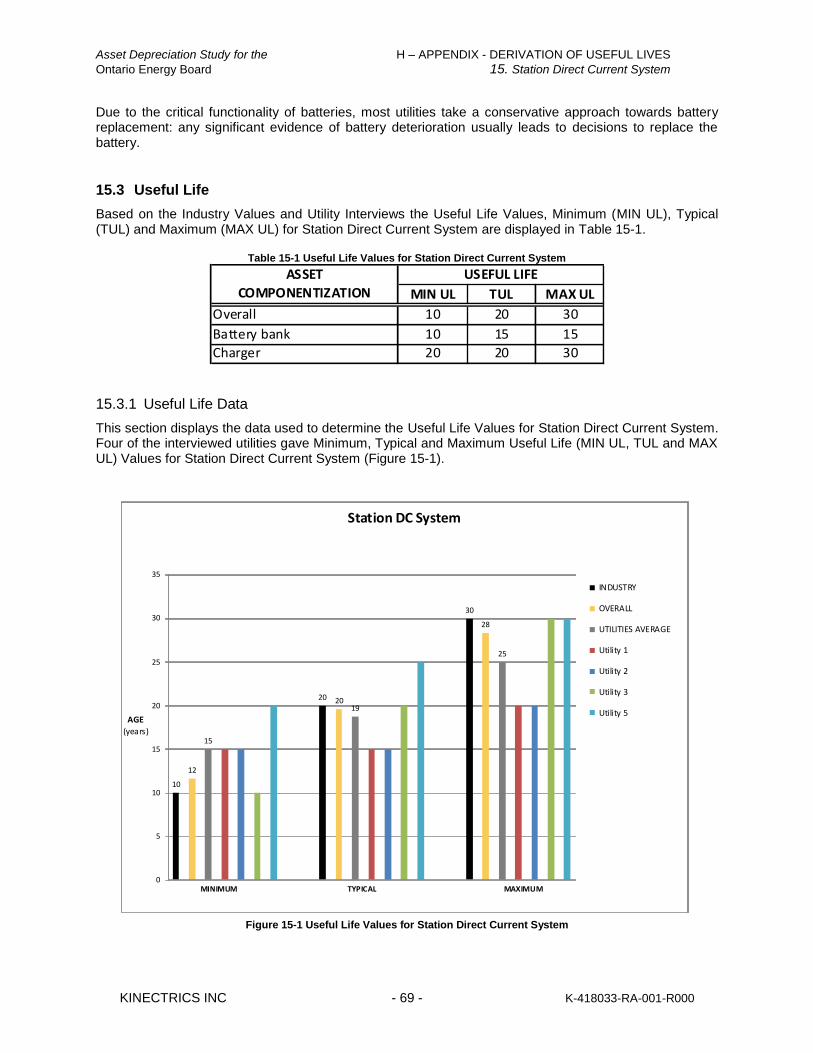
Asset Depreciation Study for the H – APPENDIX - DERIVATION OF USEFUL LIVES
Ontario Energy Board 15. Station Direct Current System
KINECTRICS INC - 69 - K-418033-RA-001-R000
Due to the critical functionality of batteries, most utilities take a conservative approach towards battery replacement: any significant evidence of battery deterioration usually leads to decisions to replace the battery.
15.3 Useful Life
Based on the Industry Values and Utility Interviews the Useful Life Values, Minimum (MIN UL), Typical (TUL) and Maximum (MAX UL) for Station Direct Current System are displayed in Table 15-1.
Table 15-1 Useful Life Values for Station Direct Current System
MIN UL TUL MAX UL
10 20 30
10 15 15
20 20 30Charger
ASSET
COMPONENTIZATION
USEFUL LIFE
Battery bank
Overall
15.3.1 Useful Life Data
This section displays the data used to determine the Useful Life Values for Station Direct Current System. Four of the interviewed utilities gave Minimum, Typical and Maximum Useful Life (MIN UL, TUL and MAX UL) Values for Station Direct Current System (Figure 15-1).
10
12
15
20 2019
30
28
25
0
5
10
15
20
25
30
35
MINIMUM TYPICAL MAXIMUM
Station DC System
INDUSTRY
OVERALL
UTILITIES AVERAGE
Utility 1
Utility 2
Utility 3
Utility 5AGE
(years)
Figure 15-1 Useful Life Values for Station Direct Current System

Asset Depreciation Study for the H – APPENDIX - DERIVATION OF USEFUL LIVES
Ontario Energy Board 15. Station Direct Current System
KINECTRICS INC - 70 - K-418033-RA-001-R000
15.4 Impact of Utilization Factors
Based on the Utility Interviews the composite score and overall impact (high medium, low), if any, of each factor on the typical useful life of Station Direct Current System are displayed in Table 15-2.
Table 15-2 - Composite Score for Station Direct Current System
Mechanical
Stress
Electrical
Loading
Environmental
Factors
Operating
Practices
Maintenance
Practices
Non-Physical
Factors
Composite
Score8% 50% 15% 23% 52% 53%
Overall
Rating*NI M L L M M
* H = High Impact M = Medium Impact L = Low Impact NI = No Impact
Utilization Factors
15.4.1 Utility Interview Data
This section displays the data used to determine the composite score and overall impact (high, medium, low) of each factor on the typical useful life of Station Direct Current System. Five of the interviewed utilities provided their input regarding the UFs for Station Direct Current System (Figure 15-2).
Mechanical Stress Electrical Loading Environmental Factors Operating Practices Maintenance Practices Non-Physical Factors
Station DC System
High Impact Medium Impact Low Impact No Impact No Response
Figure 15-2 Impact of Utilization Factors on the Useful Life of Station Direct Current System
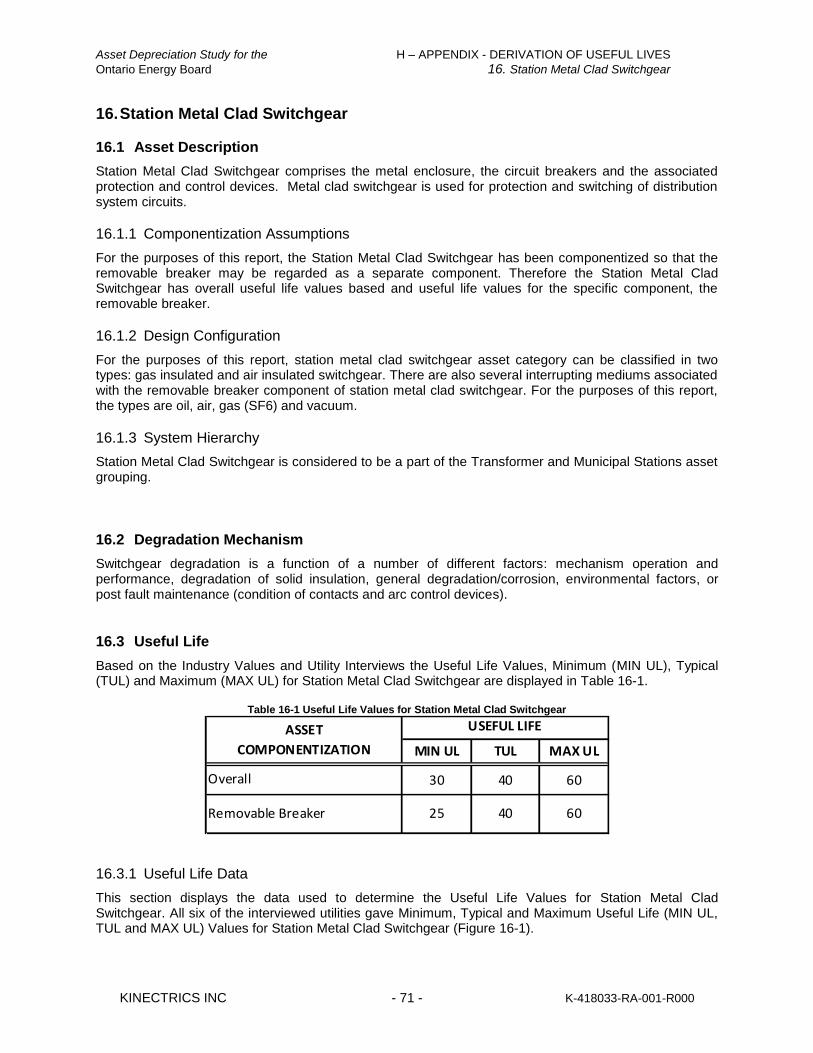
Asset Depreciation Study for the H – APPENDIX - DERIVATION OF USEFUL LIVES
Ontario Energy Board 16. Station Metal Clad Switchgear
KINECTRICS INC - 71 - K-418033-RA-001-R000
16. Station Metal Clad Switchgear
16.1 Asset Description
Station Metal Clad Switchgear comprises the metal enclosure, the circuit breakers and the associated protection and control devices. Metal clad switchgear is used for protection and switching of distribution system circuits.
16.1.1 Componentization Assumptions
For the purposes of this report, the Station Metal Clad Switchgear has been componentized so that the removable breaker may be regarded as a separate component. Therefore the Station Metal Clad Switchgear has overall useful life values based and useful life values for the specific component, the removable breaker.
16.1.2 Design Configuration
For the purposes of this report, station metal clad switchgear asset category can be classified in two types: gas insulated and air insulated switchgear. There are also several interrupting mediums associated with the removable breaker component of station metal clad switchgear. For the purposes of this report, the types are oil, air, gas (SF6) and vacuum.
16.1.3 System Hierarchy
Station Metal Clad Switchgear is considered to be a part of the Transformer and Municipal Stations asset grouping.
16.2 Degradation Mechanism
Switchgear degradation is a function of a number of different factors: mechanism operation and performance, degradation of solid insulation, general degradation/corrosion, environmental factors, or post fault maintenance (condition of contacts and arc control devices).
16.3 Useful Life
Based on the Industry Values and Utility Interviews the Useful Life Values, Minimum (MIN UL), Typical (TUL) and Maximum (MAX UL) for Station Metal Clad Switchgear are displayed in Table 16-1.
Table 16-1 Useful Life Values for Station Metal Clad Switchgear
MIN UL TUL MAX UL
30 40 60
25 40 60
Overall
Removable Breaker
ASSET
COMPONENTIZATION
USEFUL LIFE
(years)
16.3.1 Useful Life Data
This section displays the data used to determine the Useful Life Values for Station Metal Clad Switchgear. All six of the interviewed utilities gave Minimum, Typical and Maximum Useful Life (MIN UL, TUL and MAX UL) Values for Station Metal Clad Switchgear (Figure 16-1).
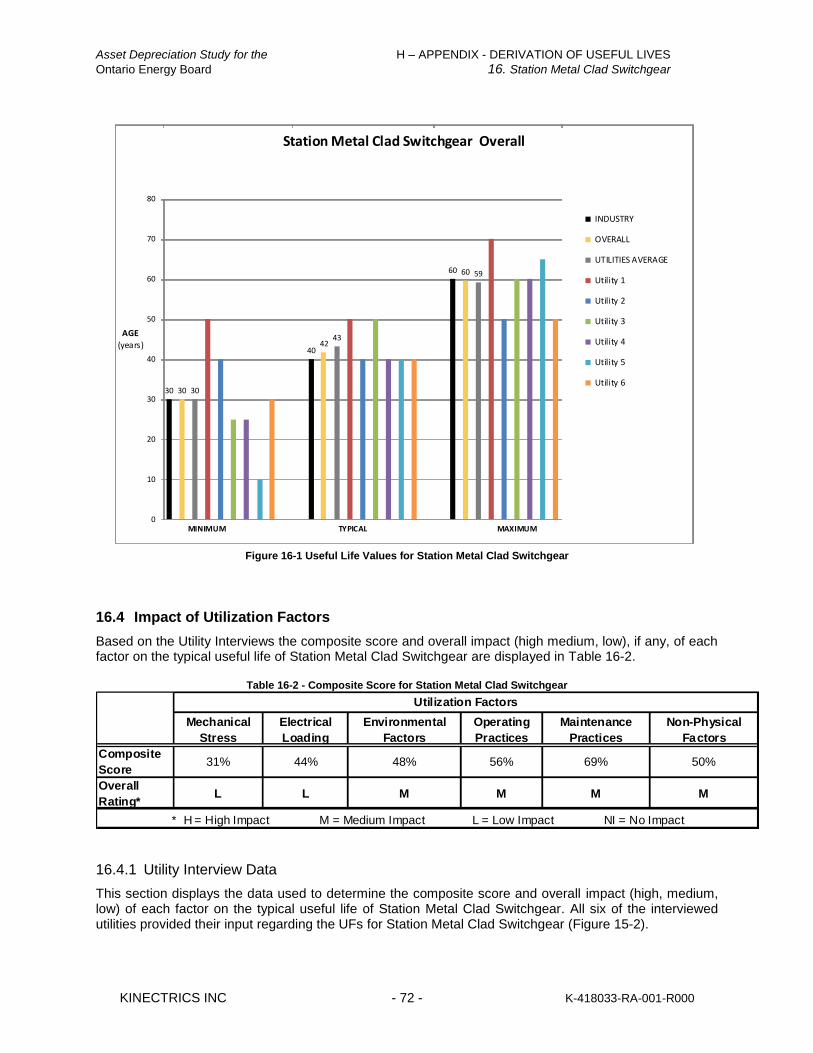
Asset Depreciation Study for the H – APPENDIX - DERIVATION OF USEFUL LIVES
Ontario Energy Board 16. Station Metal Clad Switchgear
KINECTRICS INC - 72 - K-418033-RA-001-R000
30 30 30
4042
43
60 60 59
0
10
20
30
40
50
60
70
80
MINIMUM TYPICAL MAXIMUM
Station Metal Clad Switchgear Overall
INDUSTRY
OVERALL
UTILITIES AVERAGE
Utility 1
Utility 2
Utility 3
Utility 4
Utility 5
Utility 6
AGE
(years)
Figure 16-1 Useful Life Values for Station Metal Clad Switchgear
16.4 Impact of Utilization Factors
Based on the Utility Interviews the composite score and overall impact (high medium, low), if any, of each factor on the typical useful life of Station Metal Clad Switchgear are displayed in Table 16-2.
Table 16-2 - Composite Score for Station Metal Clad Switchgear
Mechanical
Stress
Electrical
Loading
Environmental
Factors
Operating
Practices
Maintenance
Practices
Non-Physical
Factors
Composite
Score31% 44% 48% 56% 69% 50%
Overall
Rating*L L M M M M
* H = High Impact M = Medium Impact L = Low Impact NI = No Impact
Utilization Factors
16.4.1 Utility Interview Data
This section displays the data used to determine the composite score and overall impact (high, medium, low) of each factor on the typical useful life of Station Metal Clad Switchgear. All six of the interviewed utilities provided their input regarding the UFs for Station Metal Clad Switchgear (Figure 15-2).

Asset Depreciation Study for the H – APPENDIX - DERIVATION OF USEFUL LIVES
Ontario Energy Board 16. Station Metal Clad Switchgear
KINECTRICS INC - 73 - K-418033-RA-001-R000
Mechanical Stress Electrical Loading Environmental Factors Operating Practices Maintenance Practices Non-Physical Factors
Station Metal Clad Switchgear
High Impact Medium Impact Low Impact No Impact
Figure 16-2 Impact of Utilization Factors on the Useful Life of Station Metal Clad Switchgear
Asset Depreciation Study for the H – APPENDIX - DERIVATION OF USEFUL LIVES
Ontario Energy Board 17. Station Independent Breakers
KINECTRICS INC - 74 - K-418033-RA-001-R000
17. Station Independent Breakers
17.1 Asset Description
Circuit breakers are automated switching devices that can make, carry and interrupt electrical currents under normal and abnormal conditions. Breakers are required to operate infrequently, however, when an electrical fault occurs, breakers must operate reliably and with adequate speed to minimize damage. This asset category refers to five types of independent station circuit breakers: oil, gas (SF6), air magnetic, air blast and vacuum.
17.1.1 Componentization Assumptions
For the purposes of this report, the Station Independent Breakers has not been componentized.
17.1.2 Design Configuration
For the purposes of this report, the independent breakers could be either indoor or outdoor. The breaker types are oil, gas (SF6), air magnetic, air blast and vacuum. The oil circuit breaker (OCB) is the oldest type of breaker design and has been in use for over 70 years. Two types of designs exist among OCBs: bulk oil breakers (in which oil serves as the insulating and arc quenching medium) and minimum oil breakers (in which oil provides the arc quenching function only). Gas, sulfur hexafluoride (SF6) insulated equipment is a relatively young technology. The first SF6 equipment was developed in the late 1960s. After some initial design and manufacturing problems equipment was increasingly used to replace oil filled equipment with widespread adoption and utilization since the mid 1980s. One of the more remarkable features of SF6 is its performance when subjected to an arc, or during a fault operation. SF6 is extremely stable and even at the high temperatures associated with an arc, limited breakdown occurs. Furthermore, most of the products of the breakdown recombine to form SF6. Consequently, SF6 circuit breakers can operate under fault conditions many more times than oil breakers before requiring maintenance. In air magnetic circuit breakers, magnetic blowout coils are used to create a strong magnetic field that draws the arc into specially designed arc chutes. The breaker current flows through the blowout coils and produces a magnetic flux. This magnetic field drives the arc against barriers built perpendicular to the length of the arc. The cross sectional area of the arc is thereby reduced, and its resistance is considerably increased. The surface of the barriers cool and de-ionize the arc, thus collaborating to extinguish the arc. Air-blast breakers use compressed air as the quenching, insulating and actuating medium. In normal operation, a blast of compressed air carries the arc into an arc chute where it is quickly extinguished. A combination cooler-muffler is often provided to cool ionized exhaust gases before they pass out into the atmosphere and to reduce noise during operation. Vacuum Breakers consist of fixed and moving butt type contacts in small evacuated chambers (i.e. bottles). A bellows attached to the moving contact permits the required short stroke to occur with no vacuum losses. Arc interruption occurs at current zero after withdrawal of the moving contact. Current medium voltage vacuum breakers require low mechanical drive energy, have high endurance, can interrupt fully rated short circuits up to 100 times, and operate reliably over 30,000 or more switching operations. Vacuum breakers also are safe and protective of the environment.
17.1.3 System Hierarchy
Station Independent Breakers is considered to be a part of the Transformer and Municipal Stations asset grouping.
Asset Depreciation Study for the H – APPENDIX - DERIVATION OF USEFUL LIVES
Ontario Energy Board 17. Station Independent Breakers
KINECTRICS INC - 75 - K-418033-RA-001-R000
17.2 Degradation Mechanism
Circuit breakers have many moving parts that are subject to wear and stress. They frequently “make” and “break” high currents and experience the arcing accompanying these operations. All circuit breakers undergo some contact degradation every time they open to interrupt an arc. Also, arcing produces heat and decomposition products that degrade surrounding insulation materials, nozzles, and interrupter chambers. The mechanical energy needed for the high contact velocities of these assets adds mechanical deterioration to their degradation processes. The rate and severity of degradation depends on many factors, including insulating and conducting materials, operating environments, and a breaker’s specific duties. The following additional factors could lead to end-of-life for this asset class:
Decreasing reliability, availability and maintainability
High maintenance and operating costs
Changes in operating conditions, rendering the existing asset obsolete
Maintenance overhaul requirements
Many of the earlier breakers relied on hydraulic or pneumatic assisted mechanisms. These have proved problematic in some cases and contributed significantly to the higher failure rates associated with this generation of equipment. More recent equipment usually utilize spring assisted mechanisms that have proved more reliable and require less maintenance.
17.2.1 Oil Breakers
For oil type circuit breakers the key degradation processes associated is as follows:
Corrosion
Effects of moisture
Mechanical
Bushing deterioration The rate and severity of these degradation processes is dependent on a number of inter-related factors, in particular the operating duties and environment in which the equipment is installed. Often the critical degradation process is either corrosion or moisture ingress or a combination of the two, resulting in degradation to internal insulation, deterioration of the mechanism affecting the critical performance of the breaker, damage to major components such as bushings or widespread degradation to oil seals and structurally components. A significant area of concern is barrier-bushing deterioration resulting from moisture ingress. The Synthetic Resin Bonded Paper (SRBP) insulation absorbs the moisture, which can result in discharge tracking across its surface leading to eventual failure of the bushing. Oil impregnated paper bushings are particularly sensitive to moisture. Once moisture finds its way into the oil and then into the paper insulation, it is very difficult to remove and can eventually lead to failure. Significant levels of moisture in the main tank can lead to general degradation of internal components and in acute cases free water can collect at the bottom of the tank. This creates a condition where a catastrophic failure could occur during operation. Corrosion of the main tank and other structural components is also a concern. One area that is particularly susceptible to corrosion is underneath the main tank on the “bell end”, this problem is common to both single and three tank circuit breakers. Corrosion of the mechanical linkages associated with the oil circuit breaker operating mechanism is also a widespread problem that can lead to the eventual seizure of the links.
Asset Depreciation Study for the H – APPENDIX - DERIVATION OF USEFUL LIVES
Ontario Energy Board 17. Station Independent Breakers
KINECTRICS INC - 76 - K-418033-RA-001-R000
A lesser mode of degradation, although still serious in certain circumstances, is pollution of bushings, particularly where the equipment is located by the sea or in a heavy industrial area. Other areas of degradation include:
Deterioration of contacts
Wear of mechanical components such as bearings
Loose primary connections
Deterioration of concrete plinth affecting stability of the circuit breaker
17.2.2 Gas (SF6) Breakers
Failures relating to internal degradation and ultimate breakdown of insulation are limited to early life failures where design or manufacture led to specific problems. There is virtually no experience of failures resulting from long term degradation within the SF6 chambers. Failures and incorrect operations are primarily related to gas leaks and problems with the mechanism and other ancillary systems. Gas seals and valves are a potential weak point. Clearly, loss of SF6 or ingress of moisture and air compromise the performance of the breaker. As would be expected the earlier SF6 equipment was more prone to these problems. Seals and valves have progressively been improved in more modern equipment.
17.2.3 Air Blast Breakers
The air blast circuit breaker has a similar degradation to other types of circuit breakers. The key degradation processes associated with air blast circuit breakers are:
Corrosion
Effects of moisture
Bushing/insulator deterioration
Mechanical Severity and rate are dependent on factors such as operating duty and environment. Corrosion is a problem for most types of breakers. It can degrade internal insulators, performance mechanisms, major components (e.g. bushings), structural components, and oil seals. Moisture causes degradation of the insulating system. Mechanical degradation presents greater end-of-life concerns than electrical degradation. Generally, operating mechanisms, bearings, linkages, and drive rods represent components that experience most mechanical degradation problems. Contacts, nozzles, and highly stressed components can also experience electrical-related degradation and deterioration. Other defects that arise with aging include:
Loose primary and grounding connections
Oil contamination and/or leakage
Deterioration of concrete foundation affecting stability of breakers
17.2.4 Air Magnetic Breakers
Air magnetic breakers have a similar degradation mechanism to other breakers in that corrosion; moisture, bushing/insulator deterioration, and mechanical degradation are factors.
17.2.5 Vacuum Breakers
The vacuum breakers in this asset class have a similar degradation mechanism to other breakers, where corrosion, moisture, bushing/insulator deterioration, and mechanical degradation are factors.

Asset Depreciation Study for the H – APPENDIX - DERIVATION OF USEFUL LIVES
Ontario Energy Board 17. Station Independent Breakers
KINECTRICS INC - 77 - K-418033-RA-001-R000
17.3 Useful Life
Based on the Industry Values and Utility Interviews the Useful Life Values, Minimum (MIN UL), Typical (TUL) and Maximum (MAX UL) for Station Independent Breakers are displayed in Table 17-1.
Table 17-1 Useful Life Values for Station Independent Breakers
MIN UL TUL MAX UL
35 45 65Station Independent Breakers
ASSET
COMPONENTIZATION
USEFUL LIFE
17.3.1 Useful Life Data
This section displays the data used to determine the Useful Life Values for Station Independent Breakers. One of the interviewed utilities gave Minimum Useful Life (MIN UL) Values and three of the interviewed utilities gave TUL and MAX UL Values for Station Independent Breakers (Figure 17-1).
3033
60
40
44
57
60
63
72
0
10
20
30
40
50
60
70
80
90
MINIMUM TYPICAL MAXIMUM
Station Independent Breakers
INDUSTRY
OVERALL
UTILITIES AVERAGE
AGE
(years)
Figure 17-1 Useful Life Values for Station Independent Breakers

Asset Depreciation Study for the H – APPENDIX - DERIVATION OF USEFUL LIVES
Ontario Energy Board 17. Station Independent Breakers
KINECTRICS INC - 78 - K-418033-RA-001-R000
17.4 Impact of Utilization Factors
Based on the Utility Interviews the composite score and overall impact (high, medium, low), if any, of each factor on the typical useful life of Station Independent Breakers are displayed in Table 17-2.
Table 17-2 - Composite Score for Station Independent Breakers
Mechanical
Stress
Electrical
Loading
Environmental
Factors
Operating
Practices
Maintenance
Practices
Non-Physical
Factors
Composite
Score58% 63% 50% 63% 50% 67%
Overall
Rating*M M M M M M
* H = High Impact M = Medium Impact L = Low Impact NI = No Impact
Utilization Factors
17.4.1 Utility Interview Data
This section displays the data used to determine the composite score and overall impact (high, medium, low) of each factor on the typical useful life of Station Independent Breakers. Three of the interviewed utilities provided their input regarding the UFs for Station Independent Breakers (Figure 17-2).
Mechanical Stress Electrical Loading Environmental Factors Operating Practices Maintenance Practices Non-Physical Factors
Station Independent Breakers
High Impact Medium Impact Low Impact No Impact No Response
Figure 17-2 Impact of Utilization Factors on the Useful Life of Station Independent Breakers

Asset Depreciation Study for the H – APPENDIX - DERIVATION OF USEFUL LIVES
Ontario Energy Board 18. Station Switch
KINECTRICS INC - 79 - K-418033-RA-001-R000
18. Station Switch
18.1 Asset Description
This asset class consists of the station switches used to physically and electrically isolate sections of the power system for the purposes of maintenance, safety, and other operational requirements. Station switches typically consist of manual or motor operated isolating devices mounted on support insulators and metal support structures. Many high voltage station switches (e.g. line and transformer isolating switches) have motor-operators and the capability of remote-controlled operation. These switches are normally operated when there is no current through the switch, unless specifically designed to be capable of operating under load.
18.1.1 Componentization Assumptions
For the purposes of this report, the Station Switch has not been componentized.
18.1.2 Design Configuration
For the purposes of this report, the station switch refers to both insulting and load interrupting switches. The types included are oil, air magnetic, air blast, gas (SF6) and vacuum.
18.1.3 System Hierarchy
Station Switch is considered to be a part of the Transformer and Municipal Stations asset grouping.
18.2 Degradation Mechanism
Disconnect switches have many moving parts that are subject to wear and operational stress. Except for parts contained in motor-operator cabinets, switch components are exposed to the ambient environment. Thus, environmental factors, along with operating conditions, vintage, design, and configuration all contribute to switch degradation. Critical degradation processes include corrosion, moisture ingress, and ice formation. A combination of these factors that may result in permanent damage to major components such as contacts, blades, bearings, drives and support insulators. Generally, the following represent key end-of-life factors for disconnect switches:
Decreasing reliability, availability, and maintainability
High maintenance and operating costs
Maintenance overhaul requirements
Obsolete design, lack of parts and service support Application criticality and manufacturer also play key roles in determining the end-of-life for disconnect switches. Generally, widespread deterioration of live components, support insulators, motor-operators, and drive linkages define the end-of-life for these switches. However, routine maintenance programs usually provide ample opportunity to assess switch condition and viability. Disconnect switches have components fabricated from dissimilar materials, and use of these different materials influences degradation. For example, blade, hinge and jaw contacts may consist of combinations of copper, aluminum, silver and stainless steel, several of which have tin, silver and chrome plating. Further switch bases may consist of galvanized steel or aluminum. Most disconnect switches have porcelain support and rotating insulators. The porcelain offers rigidity, strength and dielectric characteristics needed for reliability. However, excessive deflection or deformation of support or rotating stack insulators can cause blade misalignment and other problems, resulting in operational failures.

Asset Depreciation Study for the H – APPENDIX - DERIVATION OF USEFUL LIVES
Ontario Energy Board 18. Station Switch
KINECTRICS INC - 80 - K-418033-RA-001-R000
Disconnect switches must have the ability to open and close properly even with heavy ice build-up on their blades and contacts. However, these switches may sit idle for several months or more. This infrequent operation may lead to corrosion and water ingress damage, increasing the potential for component seizures. Bearings commonly seize from poor lubrication and sealing, despite manufacturers’ claims that such components are sealed, greaseless and maintenance-free for life. Normally, when blades enter or leave jaw contacts, they rotate to clean accumulated ice from contact surfaces. To accomplish this, hinge ends have rotating or other current transfer contacts. These contacts are often simple, long-life copper braids. However, some switches have more complex rotating contacts in grease-filled chambers. Without proper maintenance these more complex switches may degrade, causing blade failures.
18.3 Useful Life
Based on the Industry Values and Utility Interviews the Useful Life Values, Minimum (MIN UL), Typical (TUL) and Maximum (MAX UL) for Station Switch are displayed in Table 18-1.
Table 18-1 Useful Life Values for Station Switch
MIN UL TUL MAX UL
30 50 60Station Switch
ASSET
COMPONENTIZATION
USEFUL LIFE
18.3.1 Useful Life Data
This section displays the data used to determine the Useful Life Values for Station Switch. Four of the interviewed utilities gave Minimum, Typical and Maximum Useful Life (MIN UL, TUL and MAX UL) Values for Station Switch (Figure 18-1).
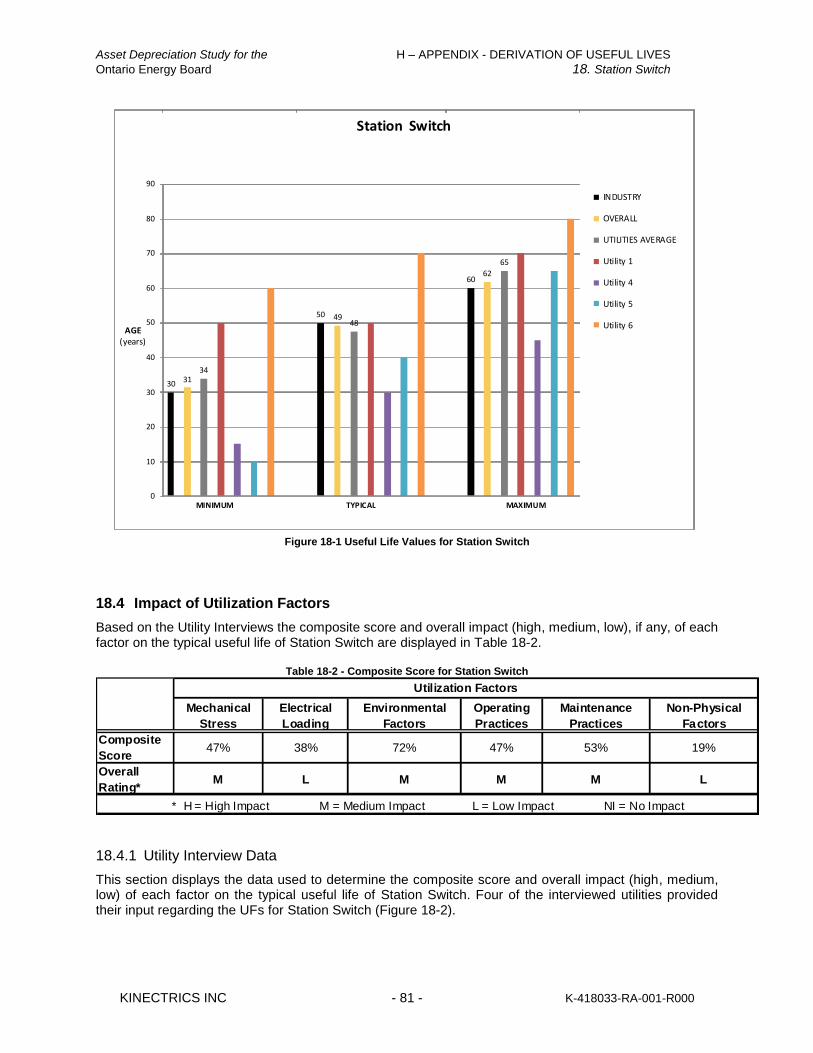
Asset Depreciation Study for the H – APPENDIX - DERIVATION OF USEFUL LIVES
Ontario Energy Board 18. Station Switch
KINECTRICS INC - 81 - K-418033-RA-001-R000
30 3134
50 4948
6062
65
0
10
20
30
40
50
60
70
80
90
MINIMUM TYPICAL MAXIMUM
Station Switch
INDUSTRY
OVERALL
UTILITIES AVERAGE
Utility 1
Utility 4
Utility 5
Utility 6AGE
(years)
Figure 18-1 Useful Life Values for Station Switch
18.4 Impact of Utilization Factors
Based on the Utility Interviews the composite score and overall impact (high, medium, low), if any, of each factor on the typical useful life of Station Switch are displayed in Table 18-2.
Table 18-2 - Composite Score for Station Switch
Mechanical
Stress
Electrical
Loading
Environmental
Factors
Operating
Practices
Maintenance
Practices
Non-Physical
Factors
Composite
Score47% 38% 72% 47% 53% 19%
Overall
Rating*M L M M M L
* H = High Impact M = Medium Impact L = Low Impact NI = No Impact
Utilization Factors
18.4.1 Utility Interview Data
This section displays the data used to determine the composite score and overall impact (high, medium, low) of each factor on the typical useful life of Station Switch. Four of the interviewed utilities provided their input regarding the UFs for Station Switch (Figure 18-2).
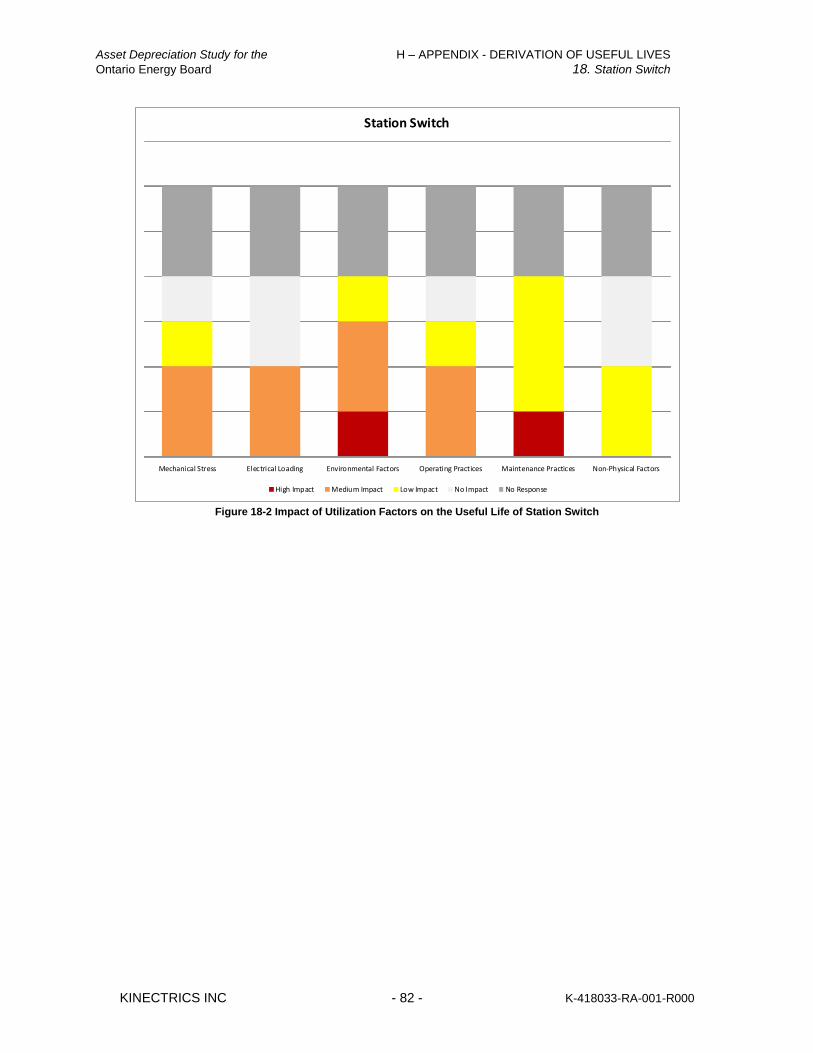
Asset Depreciation Study for the H – APPENDIX - DERIVATION OF USEFUL LIVES
Ontario Energy Board 18. Station Switch
KINECTRICS INC - 82 - K-418033-RA-001-R000
Mechanical Stress Electrical Loading Environmental Factors Operating Practices Maintenance Practices Non-Physical Factors
Station Switch
High Impact Medium Impact Low Impact No Impact No Response
Figure 18-2 Impact of Utilization Factors on the Useful Life of Station Switch
Asset Depreciation Study for the H – APPENDIX - DERIVATION OF USEFUL LIVES
Ontario Energy Board 19. Electromechanical Relays
KINECTRICS INC - 83 - K-418033-RA-001-R000
19. Electromechanical Relays
19.1 Asset Description
Protection relays work to detect faults and isolate the system by triggering the opening and closing of the circuit breakers. This asset class includes the older designs of protective relays which had primarily electromechanical mechanisms.
19.1.1 Componentization Assumptions
For the purposes of this report, the Electromechanical Relays has not been componentized.
19.1.2 System Hierarchy
Electromechanical Relays is considered to be a part of the Transformer and Municipal Stations asset grouping.
19.2 Degradation Mechanism
The degradation of electromechanical relays is primarily related to the wear and seizing of the mechanical mechanisms. For instance relay contacts age due to the following factors:
Contact oxidation
Contact welding or pitting due to excessive current
Chemical corrosion In the case of degradation of relay moving parts, such as wear of moving parts like spring/armature, the major contributing factor is the wear after numerous switching cycles. Degradation on relay coils is mainly a thermal aging issue due to continuous energization or elevated cabinet temperatures. Excessive heat generated by coil or associated components may cause the coil to burn out or adversely affect other nearby components or components within the relay or nearby (e.g. chemical breakdown of varnishes causing contact contamination, or change in component dimensions). As a consequence, the failure mode of an electromechanical relay can be:
Failure to actuate when commanded
Actuates without command
Does not make or break current
Failure to carry current
High contact resistance
Set-point shift
Time delay shift
19.3 Useful Life
Based on the Industry Values and Utility Interviews the Useful Life Values, Minimum (MIN UL), Typical (TUL) and Maximum (MAX UL) for Electromechanical Relays are displayed in Table 19-1.

Asset Depreciation Study for the H – APPENDIX - DERIVATION OF USEFUL LIVES
Ontario Energy Board 19. Electromechanical Relays
KINECTRICS INC - 84 - K-418033-RA-001-R000
Table 19-1 Useful Life Values for Electromechanical Relays
MIN UL TUL MAX UL
25 35 50Electromechanical Relays
ASSET
COMPONENTIZATION
USEFUL LIFE
19.3.1 Useful Life Data
This section displays the data used to determine the Useful Life Values for Electromechanical Relays. Five of the interviewed utilities gave Minimum Useful Life (MAX UL) Values and all six of the utilities interviewed gave TUL and MAX UL Values for Electromechanical Relays (Figure 19-1).
20
25
33
30
35
39
50 50 50
0
10
20
30
40
50
60
70
MINIMUM TYPICAL MAXIMUM
Electromechanical Relays
INDUSTRY
OVERALL
UTILITIES AVERAGE
Utility 1
Utility 2
Utility 3
Utility 4
Utility 5
Utility 6
AGE
(years)
Figure 19-1 Useful Life Values for Electromechanical Relays
19.4 Impact of Utilization Factors
Based on the Utility Interviews the composite score and overall impact (high medium, low), if any, of each factor on the typical useful life of Electromechanical Relays are displayed in Table 19-2.
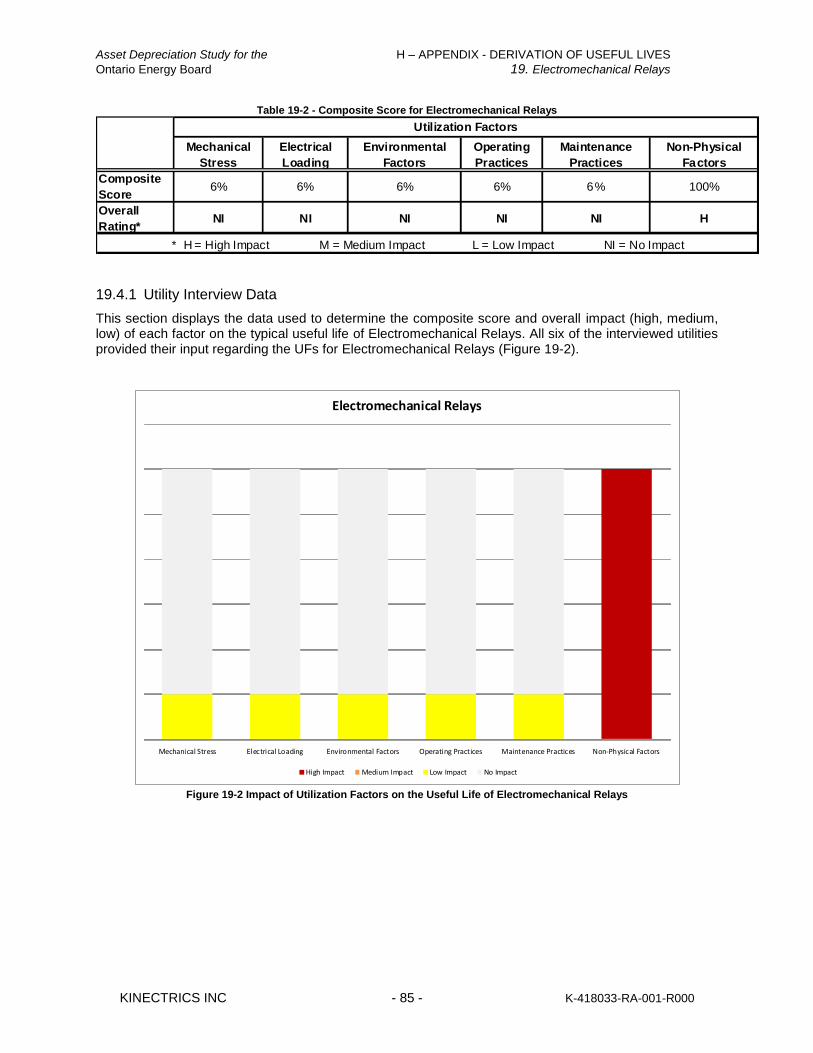
Asset Depreciation Study for the H – APPENDIX - DERIVATION OF USEFUL LIVES
Ontario Energy Board 19. Electromechanical Relays
KINECTRICS INC - 85 - K-418033-RA-001-R000
Table 19-2 - Composite Score for Electromechanical Relays
Mechanical
Stress
Electrical
Loading
Environmental
Factors
Operating
Practices
Maintenance
Practices
Non-Physical
Factors
Composite
Score6% 6% 6% 6% 6% 100%
Overall
Rating*NI NI NI NI NI H
* H = High Impact M = Medium Impact L = Low Impact NI = No Impact
Utilization Factors
19.4.1 Utility Interview Data
This section displays the data used to determine the composite score and overall impact (high, medium, low) of each factor on the typical useful life of Electromechanical Relays. All six of the interviewed utilities provided their input regarding the UFs for Electromechanical Relays (Figure 19-2).
Mechanical Stress Electrical Loading Environmental Factors Operating Practices Maintenance Practices Non-Physical Factors
Electromechanical Relays
High Impact Medium Impact Low Impact No Impact
Figure 19-2 Impact of Utilization Factors on the Useful Life of Electromechanical Relays
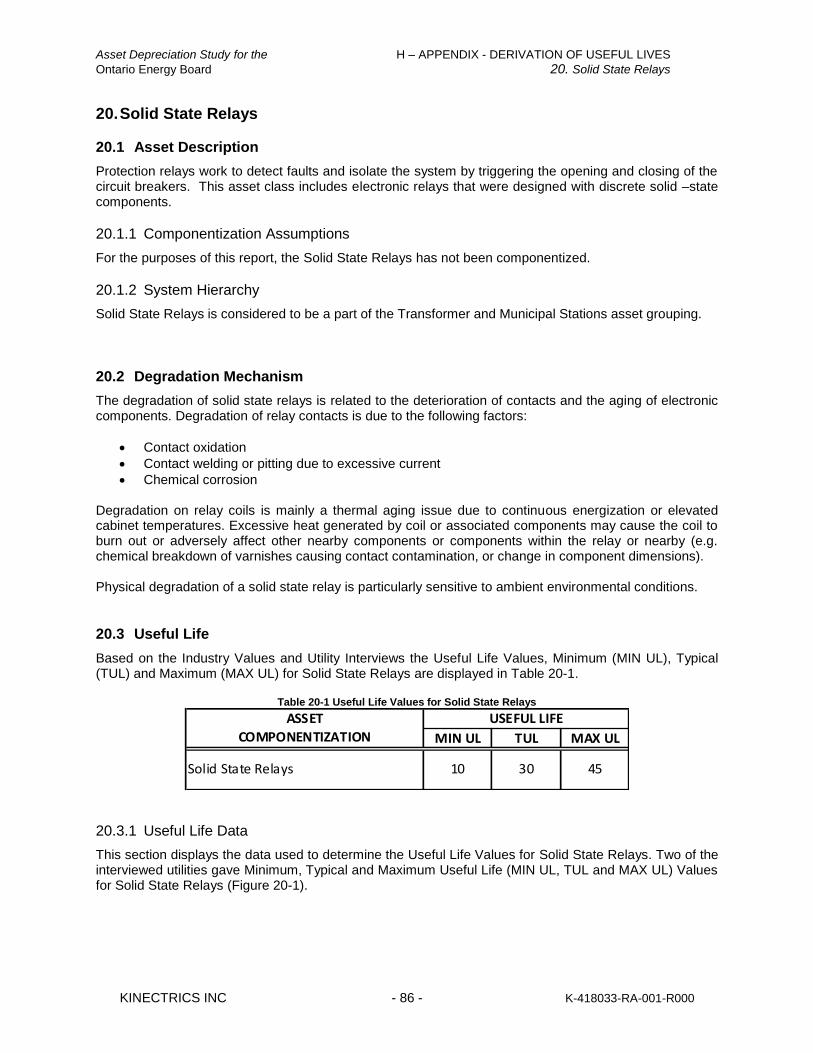
Asset Depreciation Study for the H – APPENDIX - DERIVATION OF USEFUL LIVES
Ontario Energy Board 20. Solid State Relays
KINECTRICS INC - 86 - K-418033-RA-001-R000
20. Solid State Relays
20.1 Asset Description
Protection relays work to detect faults and isolate the system by triggering the opening and closing of the circuit breakers. This asset class includes electronic relays that were designed with discrete solid –state components.
20.1.1 Componentization Assumptions
For the purposes of this report, the Solid State Relays has not been componentized.
20.1.2 System Hierarchy
Solid State Relays is considered to be a part of the Transformer and Municipal Stations asset grouping.
20.2 Degradation Mechanism
The degradation of solid state relays is related to the deterioration of contacts and the aging of electronic components. Degradation of relay contacts is due to the following factors:
Contact oxidation
Contact welding or pitting due to excessive current
Chemical corrosion Degradation on relay coils is mainly a thermal aging issue due to continuous energization or elevated cabinet temperatures. Excessive heat generated by coil or associated components may cause the coil to burn out or adversely affect other nearby components or components within the relay or nearby (e.g. chemical breakdown of varnishes causing contact contamination, or change in component dimensions). Physical degradation of a solid state relay is particularly sensitive to ambient environmental conditions.
20.3 Useful Life
Based on the Industry Values and Utility Interviews the Useful Life Values, Minimum (MIN UL), Typical (TUL) and Maximum (MAX UL) for Solid State Relays are displayed in Table 20-1.
Table 20-1 Useful Life Values for Solid State Relays
MIN UL TUL MAX UL
10 30 45Solid State Relays
ASSET
COMPONENTIZATION
USEFUL LIFE
20.3.1 Useful Life Data
This section displays the data used to determine the Useful Life Values for Solid State Relays. Two of the interviewed utilities gave Minimum, Typical and Maximum Useful Life (MIN UL, TUL and MAX UL) Values for Solid State Relays (Figure 20-1).
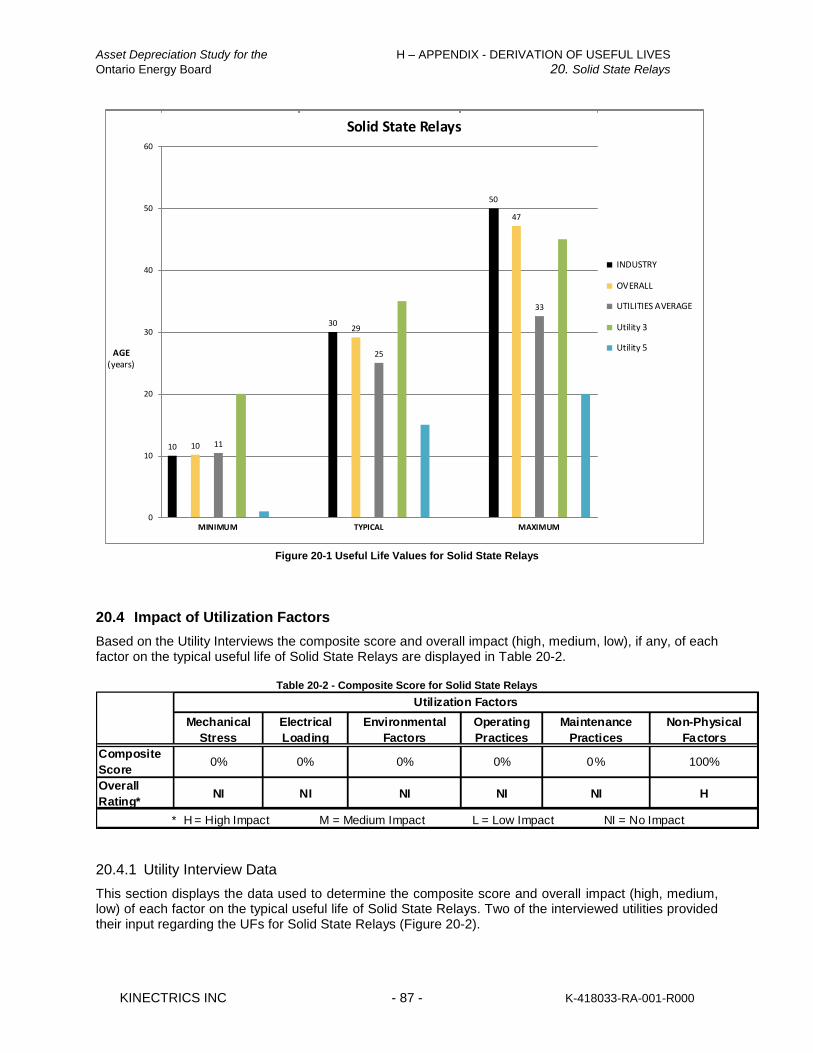
Asset Depreciation Study for the H – APPENDIX - DERIVATION OF USEFUL LIVES
Ontario Energy Board 20. Solid State Relays
KINECTRICS INC - 87 - K-418033-RA-001-R000
10 10 11
3029
25
50
47
33
0
10
20
30
40
50
60
MINIMUM TYPICAL MAXIMUM
Solid State Relays
INDUSTRY
OVERALL
UTILITIES AVERAGE
Utility 3
Utility 5AGE
(years)
Figure 20-1 Useful Life Values for Solid State Relays
20.4 Impact of Utilization Factors
Based on the Utility Interviews the composite score and overall impact (high, medium, low), if any, of each factor on the typical useful life of Solid State Relays are displayed in Table 20-2.
Table 20-2 - Composite Score for Solid State Relays
Mechanical
Stress
Electrical
Loading
Environmental
Factors
Operating
Practices
Maintenance
Practices
Non-Physical
Factors
Composite
Score0% 0% 0% 0% 0% 100%
Overall
Rating*NI NI NI NI NI H
* H = High Impact M = Medium Impact L = Low Impact NI = No Impact
Utilization Factors
20.4.1 Utility Interview Data
This section displays the data used to determine the composite score and overall impact (high, medium, low) of each factor on the typical useful life of Solid State Relays. Two of the interviewed utilities provided their input regarding the UFs for Solid State Relays (Figure 20-2).
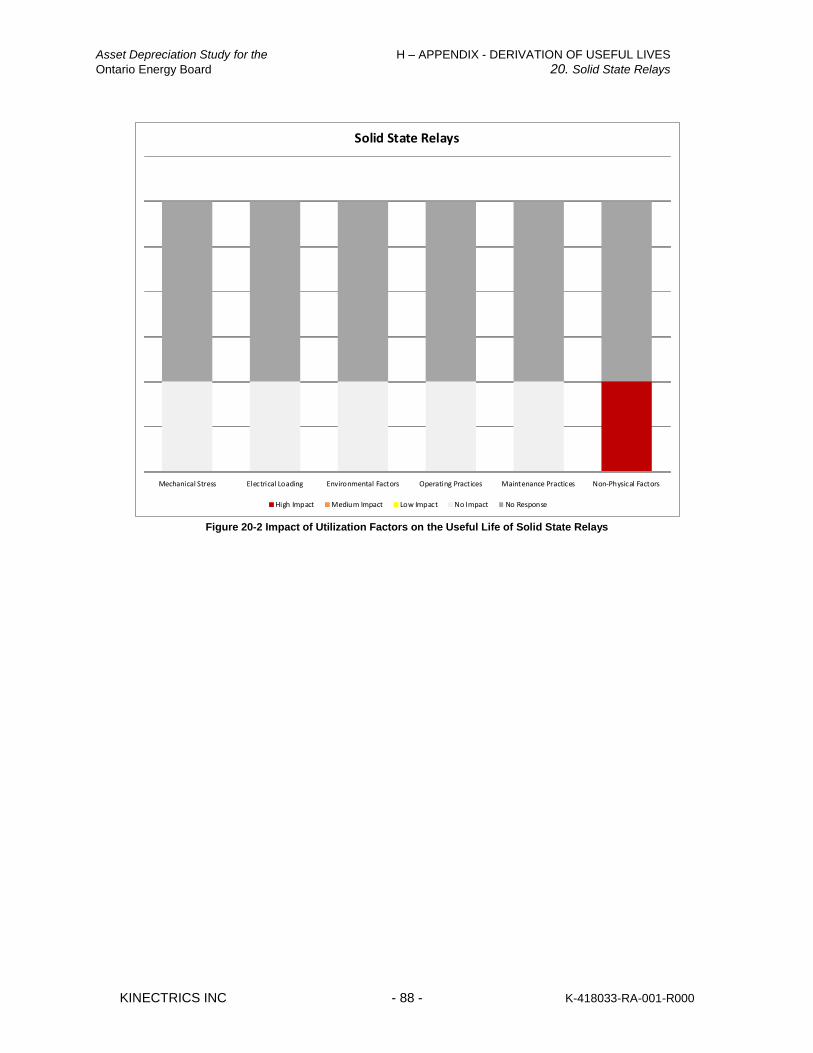
Asset Depreciation Study for the H – APPENDIX - DERIVATION OF USEFUL LIVES
Ontario Energy Board 20. Solid State Relays
KINECTRICS INC - 88 - K-418033-RA-001-R000
Mechanical Stress Electrical Loading Environmental Factors Operating Practices Maintenance Practices Non-Physical Factors
Solid State Relays
High Impact Medium Impact Low Impact No Impact No Response
Figure 20-2 Impact of Utilization Factors on the Useful Life of Solid State Relays
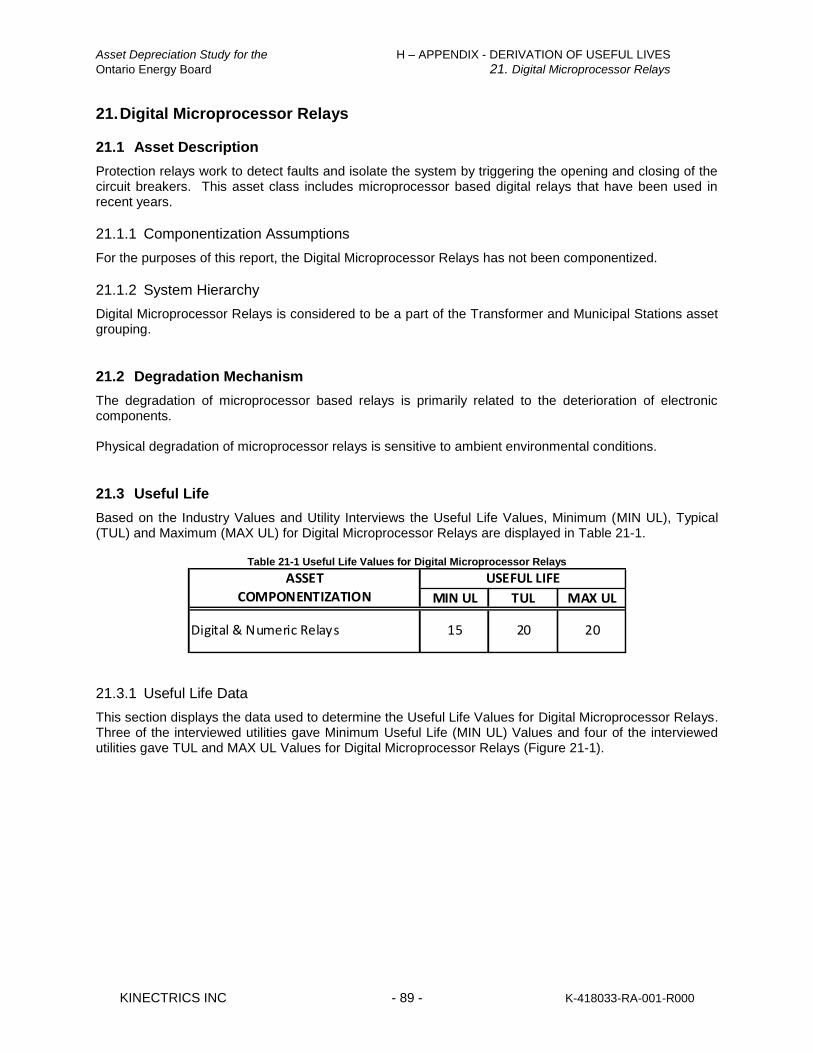
Asset Depreciation Study for the H – APPENDIX - DERIVATION OF USEFUL LIVES
Ontario Energy Board 21. Digital Microprocessor Relays
KINECTRICS INC - 89 - K-418033-RA-001-R000
21. Digital Microprocessor Relays
21.1 Asset Description
Protection relays work to detect faults and isolate the system by triggering the opening and closing of the circuit breakers. This asset class includes microprocessor based digital relays that have been used in recent years.
21.1.1 Componentization Assumptions
For the purposes of this report, the Digital Microprocessor Relays has not been componentized.
21.1.2 System Hierarchy
Digital Microprocessor Relays is considered to be a part of the Transformer and Municipal Stations asset grouping.
21.2 Degradation Mechanism
The degradation of microprocessor based relays is primarily related to the deterioration of electronic components. Physical degradation of microprocessor relays is sensitive to ambient environmental conditions.
21.3 Useful Life
Based on the Industry Values and Utility Interviews the Useful Life Values, Minimum (MIN UL), Typical (TUL) and Maximum (MAX UL) for Digital Microprocessor Relays are displayed in Table 21-1.
Table 21-1 Useful Life Values for Digital Microprocessor Relays
MIN UL TUL MAX UL
15 20 20Digital & Numeric Relays
ASSET
COMPONENTIZATION
USEFUL LIFE
21.3.1 Useful Life Data
This section displays the data used to determine the Useful Life Values for Digital Microprocessor Relays. Three of the interviewed utilities gave Minimum Useful Life (MIN UL) Values and four of the interviewed utilities gave TUL and MAX UL Values for Digital Microprocessor Relays (Figure 21-1).
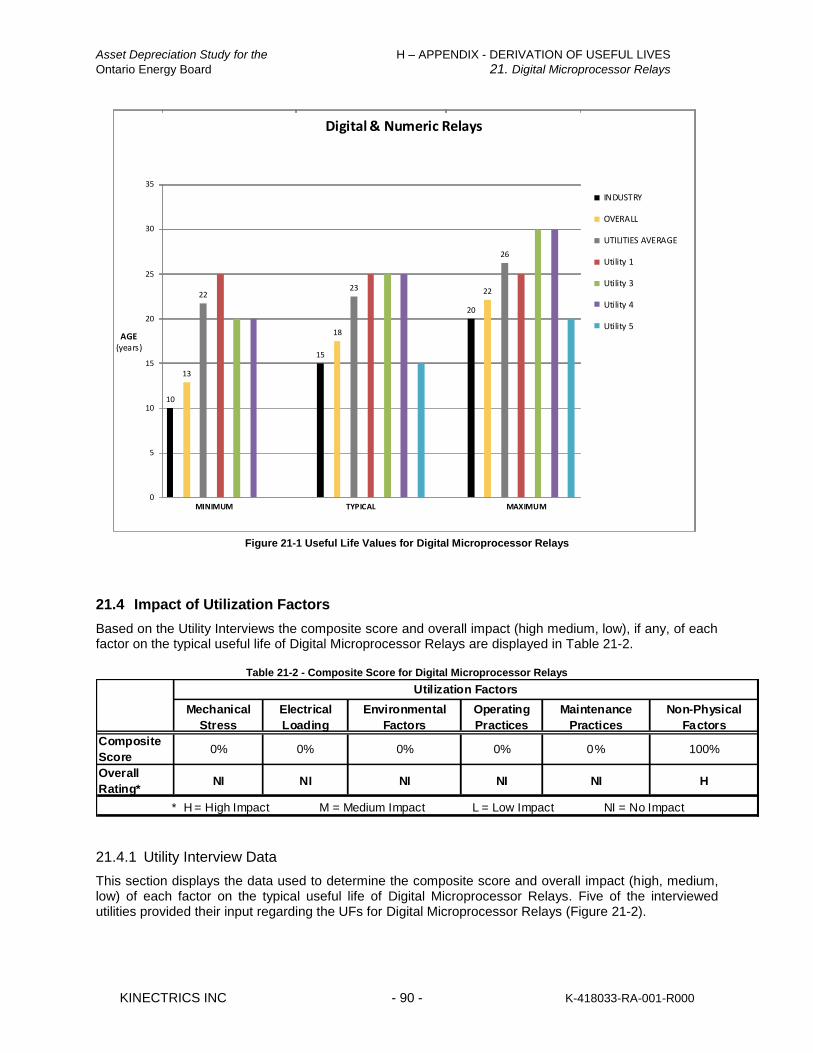
Asset Depreciation Study for the H – APPENDIX - DERIVATION OF USEFUL LIVES
Ontario Energy Board 21. Digital Microprocessor Relays
KINECTRICS INC - 90 - K-418033-RA-001-R000
10
13
22
15
18
23
20
22
26
0
5
10
15
20
25
30
35
MINIMUM TYPICAL MAXIMUM
Digital & Numeric Relays
INDUSTRY
OVERALL
UTILITIES AVERAGE
Utility 1
Utility 3
Utility 4
Utility 5AGE
(years)
Figure 21-1 Useful Life Values for Digital Microprocessor Relays
21.4 Impact of Utilization Factors
Based on the Utility Interviews the composite score and overall impact (high medium, low), if any, of each factor on the typical useful life of Digital Microprocessor Relays are displayed in Table 21-2.
Table 21-2 - Composite Score for Digital Microprocessor Relays
Mechanical
Stress
Electrical
Loading
Environmental
Factors
Operating
Practices
Maintenance
Practices
Non-Physical
Factors
Composite
Score0% 0% 0% 0% 0% 100%
Overall
Rating*NI NI NI NI NI H
* H = High Impact M = Medium Impact L = Low Impact NI = No Impact
Utilization Factors
21.4.1 Utility Interview Data
This section displays the data used to determine the composite score and overall impact (high, medium, low) of each factor on the typical useful life of Digital Microprocessor Relays. Five of the interviewed utilities provided their input regarding the UFs for Digital Microprocessor Relays (Figure 21-2).
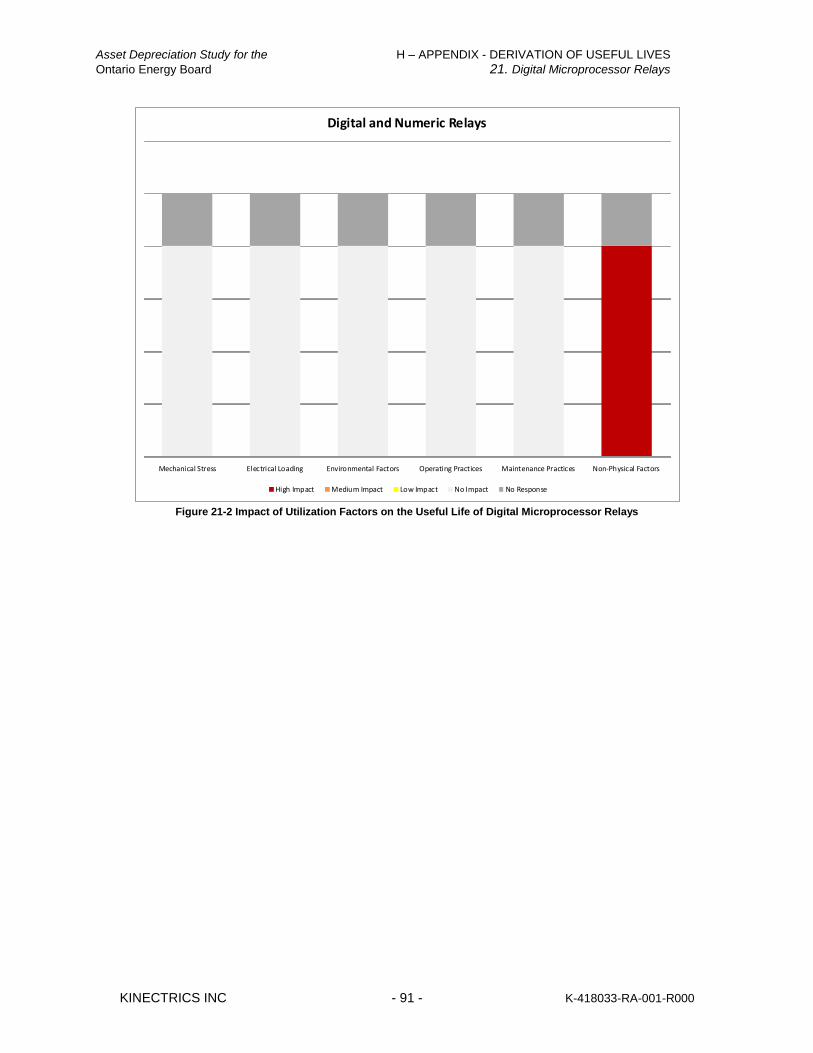
Asset Depreciation Study for the H – APPENDIX - DERIVATION OF USEFUL LIVES
Ontario Energy Board 21. Digital Microprocessor Relays
KINECTRICS INC - 91 - K-418033-RA-001-R000
Mechanical Stress Electrical Loading Environmental Factors Operating Practices Maintenance Practices Non-Physical Factors
Digital and Numeric Relays
High Impact Medium Impact Low Impact No Impact No Response
Figure 21-2 Impact of Utilization Factors on the Useful Life of Digital Microprocessor Relays
Asset Depreciation Study for the H – APPENDIX - DERIVATION OF USEFUL LIVES
Ontario Energy Board 22. Rigid Busbars
KINECTRICS INC - 92 - K-418033-RA-001-R000
22. Rigid Busbars
22.1 Asset Description
This asset class includes the current carrying bus in the station. The buses are generally fashioned from aluminum or copper tube or bar.
22.1.1 Componentization Assumptions
For the purposes of this report, the Rigid Busbars has not been componentized.
22.1.2 System Hierarchy
Rigid Busbars is considered to be a part of the Transformer and Municipal Stations asset grouping.
22.2 Degradation Mechanism
Degradation of busbars can result from environmentally induced chemical corrosion, electrical overheating or mechanical damage.
22.3 Useful Life
Based on the Industry Values and Utility Interviews the Useful Life Values, Minimum (MIN UL), Typical (TUL) and Maximum (MAX UL) for Rigid Busbars are displayed in Table 22-1.
Table 22-1 Useful Life Values for Rigid Busbars
MIN UL TUL MAX UL
30 55 60Rigid Busbars
ASSET
COMPONENTIZATION
USEFUL LIFE
22.3.1 Useful Life Data
This section displays the data used to determine the Useful Life Values for Rigid Busbars. Three of the interviewed utilities gave Minimum Useful Life (MIN UL) Values and four of the interviewed utilities gave TUL and MAX UL Values for Rigid Busbars (Figure 22-1).
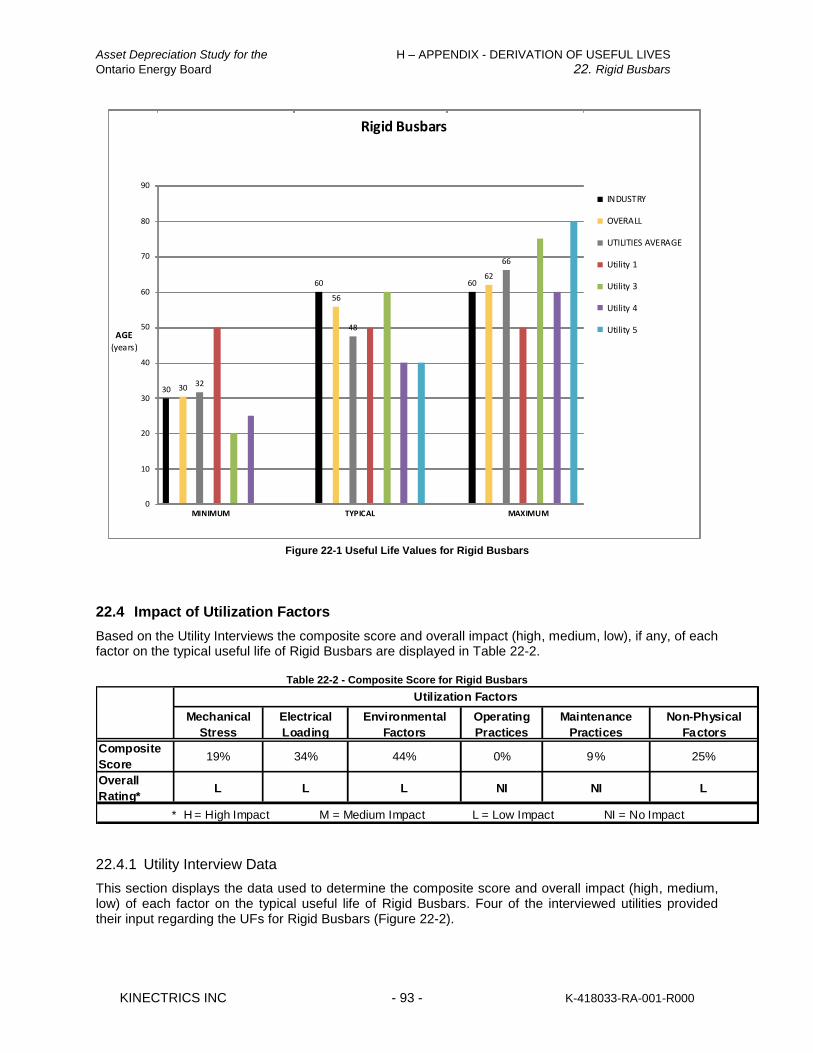
Asset Depreciation Study for the H – APPENDIX - DERIVATION OF USEFUL LIVES
Ontario Energy Board 22. Rigid Busbars
KINECTRICS INC - 93 - K-418033-RA-001-R000
30 30 32
60
56
48
6062
66
0
10
20
30
40
50
60
70
80
90
MINIMUM TYPICAL MAXIMUM
Rigid Busbars
INDUSTRY
OVERALL
UTILITIES AVERAGE
Utility 1
Utility 3
Utility 4
Utility 5AGE
(years)
Figure 22-1 Useful Life Values for Rigid Busbars
22.4 Impact of Utilization Factors
Based on the Utility Interviews the composite score and overall impact (high, medium, low), if any, of each factor on the typical useful life of Rigid Busbars are displayed in Table 22-2.
Table 22-2 - Composite Score for Rigid Busbars
Mechanical
Stress
Electrical
Loading
Environmental
Factors
Operating
Practices
Maintenance
Practices
Non-Physical
Factors
Composite
Score19% 34% 44% 0% 9% 25%
Overall
Rating*L L L NI NI L
* H = High Impact M = Medium Impact L = Low Impact NI = No Impact
Utilization Factors
22.4.1 Utility Interview Data
This section displays the data used to determine the composite score and overall impact (high, medium, low) of each factor on the typical useful life of Rigid Busbars. Four of the interviewed utilities provided their input regarding the UFs for Rigid Busbars (Figure 22-2).

Asset Depreciation Study for the H – APPENDIX - DERIVATION OF USEFUL LIVES
Ontario Energy Board 22. Rigid Busbars
KINECTRICS INC - 94 - K-418033-RA-001-R000
Mechanical Stress Electrical Loading Environmental Factors Operating Practices Maintenance Practices Non-Physical Factors
Rigid Busbars
High Impact Medium Impact Low Impact No Impact No Response
Figure 22-2 Impact of Utilization Factors on the Useful Life of Rigid Busbars
Asset Depreciation Study for the H – APPENDIX - DERIVATION OF USEFUL LIVES
Ontario Energy Board 23. Steel Structure
KINECTRICS INC - 95 - K-418033-RA-001-R000
23. Steel Structure
23.1 Asset Description
There are a number of different types of structures at distribution stations for supporting bus and equipment. The predominant types are galvanized steel, either lattice or hollow sections.
23.1.1 Componentization Assumptions
For the purposes of this report, the Steel Structure has not been componentized.
23.1.2 System Hierarchy
Steel Structure is considered to be a part of the Transformer and Municipal Stations asset grouping.
23.2 Degradation Mechanism
Degradation or reduction in strength of steel structures can result from corrosion, structural fatigue, or gradual deterioration of foundation components. Corrosion of lattice steel members and hardware reduces their cross-sectional area causing a reduction in strength. Similarly, corrosion of tubular steel poles reduces the effectiveness of the tubular walls. Rates of corrosion may vary, depending upon environmental and climatic conditions (e.g., the presence of salt spray in coastal areas or heavy industrial pollution). Structural fatigue results from repeated structural loading and unloading of support members. Temperature variations, plus wind and ice loadings lead to changes in conductor tension. Tension changes result in structural load variations on angle and dead end towers. Other changes such as foundation displacements and breaks in wires, guys and anchors may result in abnormal tower loading. Typically, steel pole foundations are cylindrical steel reinforced concrete structures with anchor bolts connecting the pole to its base. Common degradation processes include corrosion of foundation rebar, concrete spalling and storm damage.
23.3 Useful Life
Based on the Industry Values and Utility Interviews the Useful Life Values, Minimum (MIN UL), Typical (TUL) and Maximum (MAX UL) for Steel Structure are displayed in Table 23-1.
Table 23-1 Useful Life Values for Steel Structure
MIN UL TUL MAX UL
35 50 90Steel Structure
ASSET
COMPONENTIZATION
USEFUL LIFE
23.3.1 Useful Life Data
This section displays the data used to determine the Useful Life Values for Steel Structure. Four of the interviewed utilities gave Minimum Useful Life (MIN UL) Values and five of the interviewed utilities gave TUL and MAX UL Values for Steel Structure (Figure 23-1).
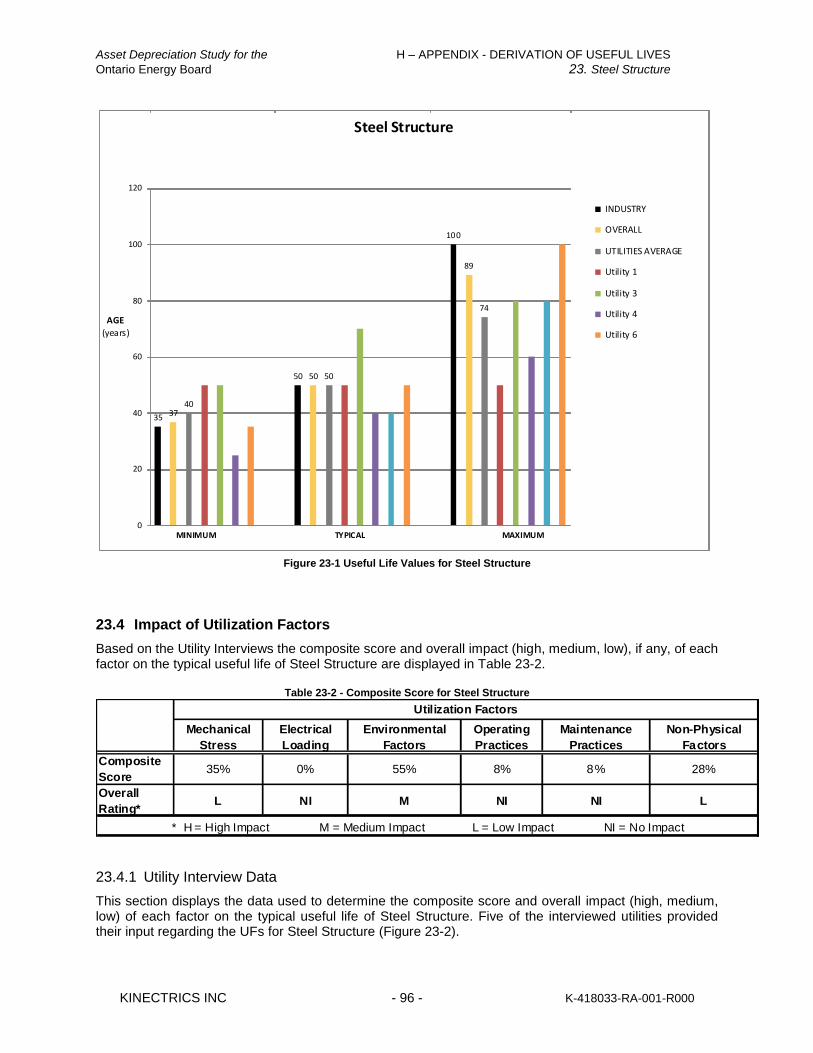
Asset Depreciation Study for the H – APPENDIX - DERIVATION OF USEFUL LIVES
Ontario Energy Board 23. Steel Structure
KINECTRICS INC - 96 - K-418033-RA-001-R000
35 3740
50 50 50
100
89
74
0
20
40
60
80
100
120
MINIMUM TYPICAL MAXIMUM
Steel Structure
INDUSTRY
OVERALL
UTILITIES AVERAGE
Utility 1
Utility 3
Utility 4
Utility 6
AGE
(years)
Figure 23-1 Useful Life Values for Steel Structure
23.4 Impact of Utilization Factors
Based on the Utility Interviews the composite score and overall impact (high, medium, low), if any, of each factor on the typical useful life of Steel Structure are displayed in Table 23-2.
Table 23-2 - Composite Score for Steel Structure
Mechanical
Stress
Electrical
Loading
Environmental
Factors
Operating
Practices
Maintenance
Practices
Non-Physical
Factors
Composite
Score35% 0% 55% 8% 8% 28%
Overall
Rating*L NI M NI NI L
* H = High Impact M = Medium Impact L = Low Impact NI = No Impact
Utilization Factors
23.4.1 Utility Interview Data
This section displays the data used to determine the composite score and overall impact (high, medium, low) of each factor on the typical useful life of Steel Structure. Five of the interviewed utilities provided their input regarding the UFs for Steel Structure (Figure 23-2).

Asset Depreciation Study for the H – APPENDIX - DERIVATION OF USEFUL LIVES
Ontario Energy Board 23. Steel Structure
KINECTRICS INC - 97 - K-418033-RA-001-R000
Mechanical Stress Electrical Loading Environmental Factors Operating Practices Maintenance Practices Non-Physical Factors
Steel Structure
High Impact Medium Impact Low Impact No Impact No Response
Figure 23-2 Impact of Utilization Factors on the Useful Life of Steel Structure

Asset Depreciation Study for the H – APPENDIX - DERIVATION OF USEFUL LIVES
Ontario Energy Board 24. Primary Paper Insulated Lead Covered Cables
KINECTRICS INC - 98 - K-418033-RA-001-R000
24. Primary Paper Insulated Lead Covered Cables
24.1 Asset Description
Distribution underground cables are mainly used in urban areas where it is either impossible or extremely difficult to build overhead lines due to aesthetic, legal, environmental and safety reasons. This asset group includes paper insulated lead covered cables.
24.1.1 Componentization Assumptions
For the purposes of this report, the Primary Paper Insulated Lead Covered Cables has not been componentized.
24.1.2 System Hierarchy
Primary Paper Insulated Lead Covered Cables is considered to be a part of the Underground Systems asset grouping.
24.2 Degradation Mechanism
For Paper Insulated Lead Covered (PILC) cables, the two significant long-term degradation processes are corrosion of the lead sheath and dielectric degradation of the oil impregnated paper insulation. Isolated sites of corrosion resulting in moisture penetration or isolated sites of dielectric deterioration resulting in insulation breakdown can result in localized failures. However, if either of these conditions becomes widespread there will be frequent cable failures and the cable can be deemed to be at effective end-of-life.
24.3 Useful Life
Based on the Industry Values and Utility Interviews the Useful Life Values, Minimum (MIN UL), Typical (TUL) and Maximum (MAX UL) for Primary Paper Insulated Lead Covered Cables are displayed in Table 24-1.
Table 24-1 Useful Life Values for Primary Paper Insulated Lead Covered Cables
MIN UL TUL MAX UL
60 65 75Primary Paper Insulated Lead Covered
(PILC) Cables
ASSET
COMPONENTIZATION
USEFUL LIFE
24.3.1 Useful Life Data
This section displays the data used to determine the Useful Life Values for Primary Paper Insulated Lead Covered Cables. Five of the interviewed utilities gave Minimum, Typical and Maximum Useful Life (MIN UL, TUL and MAX UL) Values for Primary Paper Insulated Lead Covered Cables (Figure 24-1).
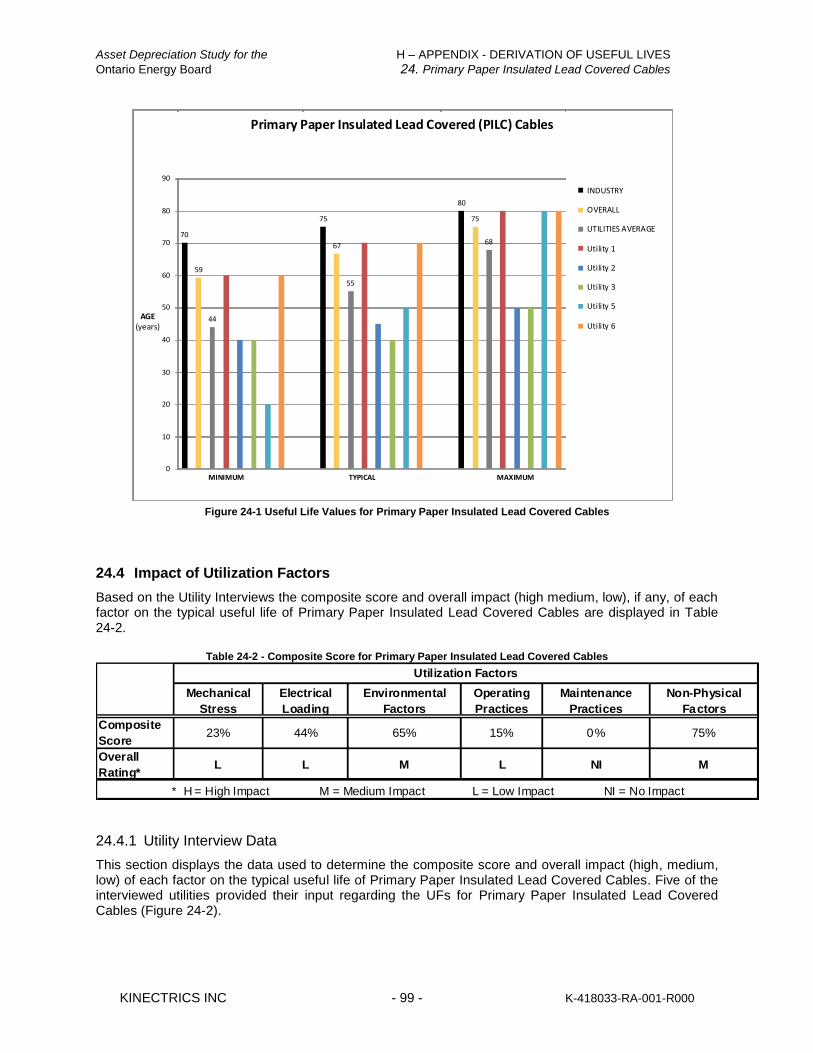
Asset Depreciation Study for the H – APPENDIX - DERIVATION OF USEFUL LIVES
Ontario Energy Board 24. Primary Paper Insulated Lead Covered Cables
KINECTRICS INC - 99 - K-418033-RA-001-R000
70
59
44
75
67
55
80
75
68
0
10
20
30
40
50
60
70
80
90
MINIMUM TYPICAL MAXIMUM
Primary Paper Insulated Lead Covered (PILC) Cables
INDUSTRY
OVERALL
UTILITIES AVERAGE
Utility 1
Utility 2
Utility 3
Utility 5
Utility 6AGE
(years)
Figure 24-1 Useful Life Values for Primary Paper Insulated Lead Covered Cables
24.4 Impact of Utilization Factors
Based on the Utility Interviews the composite score and overall impact (high medium, low), if any, of each factor on the typical useful life of Primary Paper Insulated Lead Covered Cables are displayed in Table 24-2.
Table 24-2 - Composite Score for Primary Paper Insulated Lead Covered Cables
Mechanical
Stress
Electrical
Loading
Environmental
Factors
Operating
Practices
Maintenance
Practices
Non-Physical
Factors
Composite
Score23% 44% 65% 15% 0% 75%
Overall
Rating*L L M L NI M
* H = High Impact M = Medium Impact L = Low Impact NI = No Impact
Utilization Factors
24.4.1 Utility Interview Data
This section displays the data used to determine the composite score and overall impact (high, medium, low) of each factor on the typical useful life of Primary Paper Insulated Lead Covered Cables. Five of the interviewed utilities provided their input regarding the UFs for Primary Paper Insulated Lead Covered Cables (Figure 24-2).
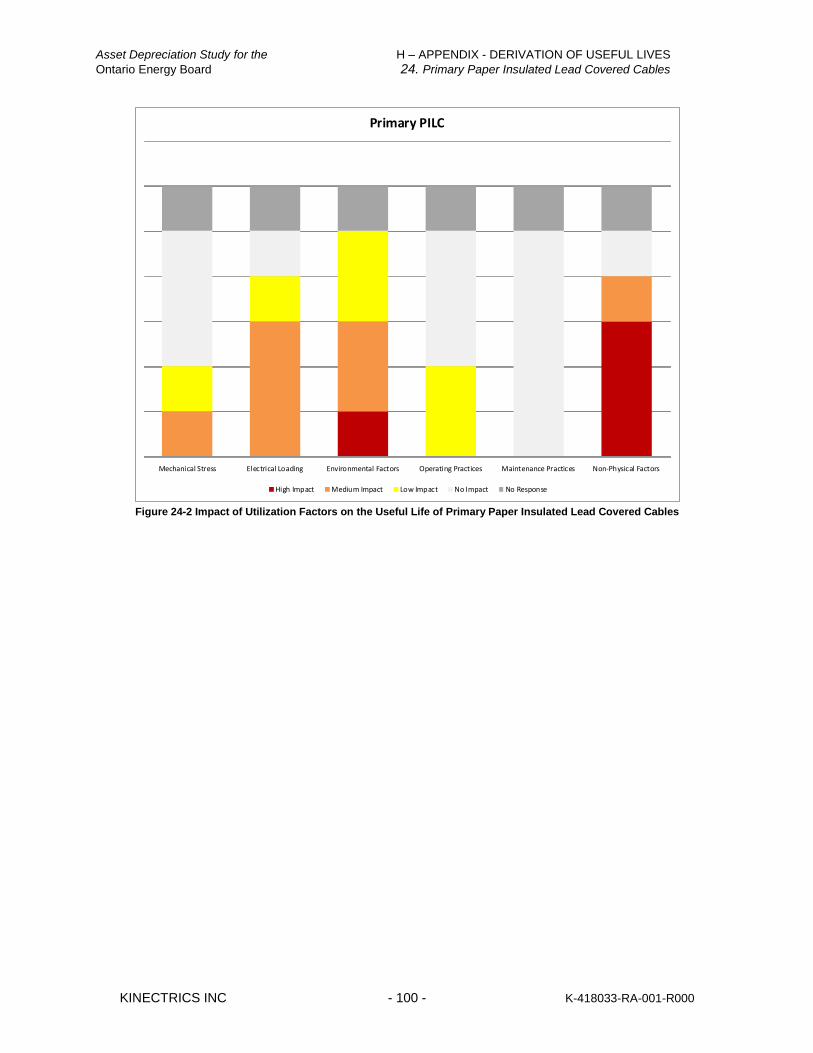
Asset Depreciation Study for the H – APPENDIX - DERIVATION OF USEFUL LIVES
Ontario Energy Board 24. Primary Paper Insulated Lead Covered Cables
KINECTRICS INC - 100 - K-418033-RA-001-R000
Mechanical Stress Electrical Loading Environmental Factors Operating Practices Maintenance Practices Non-Physical Factors
Primary PILC
High Impact Medium Impact Low Impact No Impact No Response
Figure 24-2 Impact of Utilization Factors on the Useful Life of Primary Paper Insulated Lead Covered Cables

Asset Depreciation Study for the H – APPENDIX - DERIVATION OF USEFUL LIVES
Ontario Energy Board 25. Primary Ethylene-Propylene Rubber Cables
KINECTRICS INC - 101 - K-418033-RA-001-R000
25. Primary Ethylene-Propylene Rubber Cables
25.1 Asset Description
Distribution underground cables are mainly used in urban areas where it is either impossible or extremely difficult to build overhead lines due to aesthetic, legal, environmental and safety reasons. This asset group includes ethylene-propylene rubber insulated cables.
25.1.1 Componentization Assumptions
For the purposes of this report, the Primary Ethylene-Propylene Rubber Cables has not been componentized.
25.1.2 System Hierarchy
Primary Ethylene-Propylene Rubber Cables is considered to be a part of the Underground Systems asset grouping.
25.2 Degradation Mechanism
For Ethylene-Propylene Rubber Cables (EPR) cables long term degradation can occur due to mechanical damage, overheating, or the impact of moisture ingress and chemical deterioration.
25.3 Useful Life
Based on the Industry Values and Utility Interviews the Useful Life Values, Minimum (MIN UL), Typical (TUL) and Maximum (MAX UL) for Primary Ethylene-Propylene Rubber Cables are displayed in Table 25-1.
Table 25-1 Useful Life Values for Primary Ethylene-Propylene Rubber Cables
MIN UL TUL MAX UL
20 25 25Primary Ethylene-Propylene
Rubber (EPR) Cables
ASSET
COMPONENTIZATION
USEFUL LIFE
25.3.1 Useful Life Data
This section displays the data used to determine the Useful Life Values for Primary Ethylene-Propylene Rubber Cables. One of the interviewed utilities gave Minimum, Typical and Maximum Useful Life (MIN UL, TUL and MAX UL) Values for Primary Ethylene-Propylene Rubber Cables (Figure 25-1).
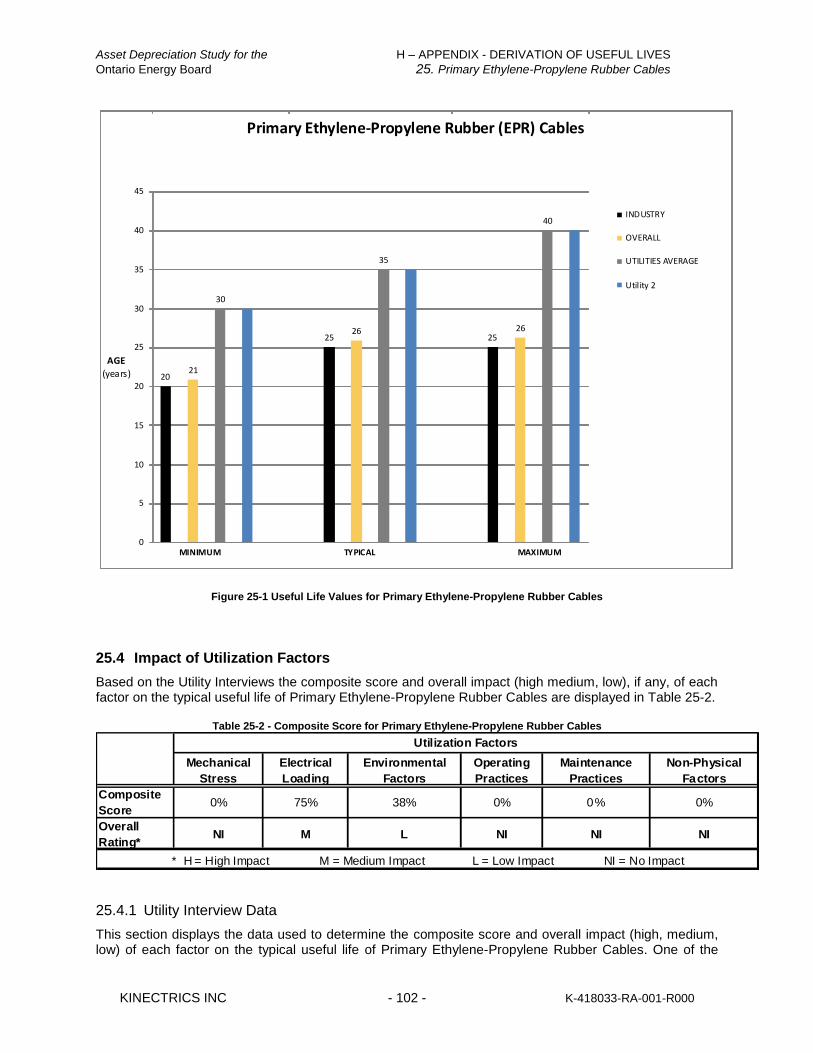
Asset Depreciation Study for the H – APPENDIX - DERIVATION OF USEFUL LIVES
Ontario Energy Board 25. Primary Ethylene-Propylene Rubber Cables
KINECTRICS INC - 102 - K-418033-RA-001-R000
2021
30
2526
35
2526
40
0
5
10
15
20
25
30
35
40
45
MINIMUM TYPICAL MAXIMUM
Primary Ethylene-Propylene Rubber (EPR) Cables
INDUSTRY
OVERALL
UTILITIES AVERAGE
Utility 2
AGE
(years)
Figure 25-1 Useful Life Values for Primary Ethylene-Propylene Rubber Cables
25.4 Impact of Utilization Factors
Based on the Utility Interviews the composite score and overall impact (high medium, low), if any, of each factor on the typical useful life of Primary Ethylene-Propylene Rubber Cables are displayed in Table 25-2.
Table 25-2 - Composite Score for Primary Ethylene-Propylene Rubber Cables
Mechanical
Stress
Electrical
Loading
Environmental
Factors
Operating
Practices
Maintenance
Practices
Non-Physical
Factors
Composite
Score0% 75% 38% 0% 0% 0%
Overall
Rating*NI M L NI NI NI
* H = High Impact M = Medium Impact L = Low Impact NI = No Impact
Utilization Factors
25.4.1 Utility Interview Data
This section displays the data used to determine the composite score and overall impact (high, medium, low) of each factor on the typical useful life of Primary Ethylene-Propylene Rubber Cables. One of the

Asset Depreciation Study for the H – APPENDIX - DERIVATION OF USEFUL LIVES
Ontario Energy Board 25. Primary Ethylene-Propylene Rubber Cables
KINECTRICS INC - 103 - K-418033-RA-001-R000
interviewed utilities provided their input regarding the UFs for Primary Ethylene-Propylene Rubber Cables (Figure 25-2).
Mechanical Stress Electrical Loading Environmental Factors Operating Practices Maintenance Practices Non-Physical Factors
Primary EPR
High Impact Medium Impact Low Impact No Impact No Response
Figure 25-2 Impact of Utilization Factors on the Useful Life of Primary Ethylene-Propylene Rubber Cables
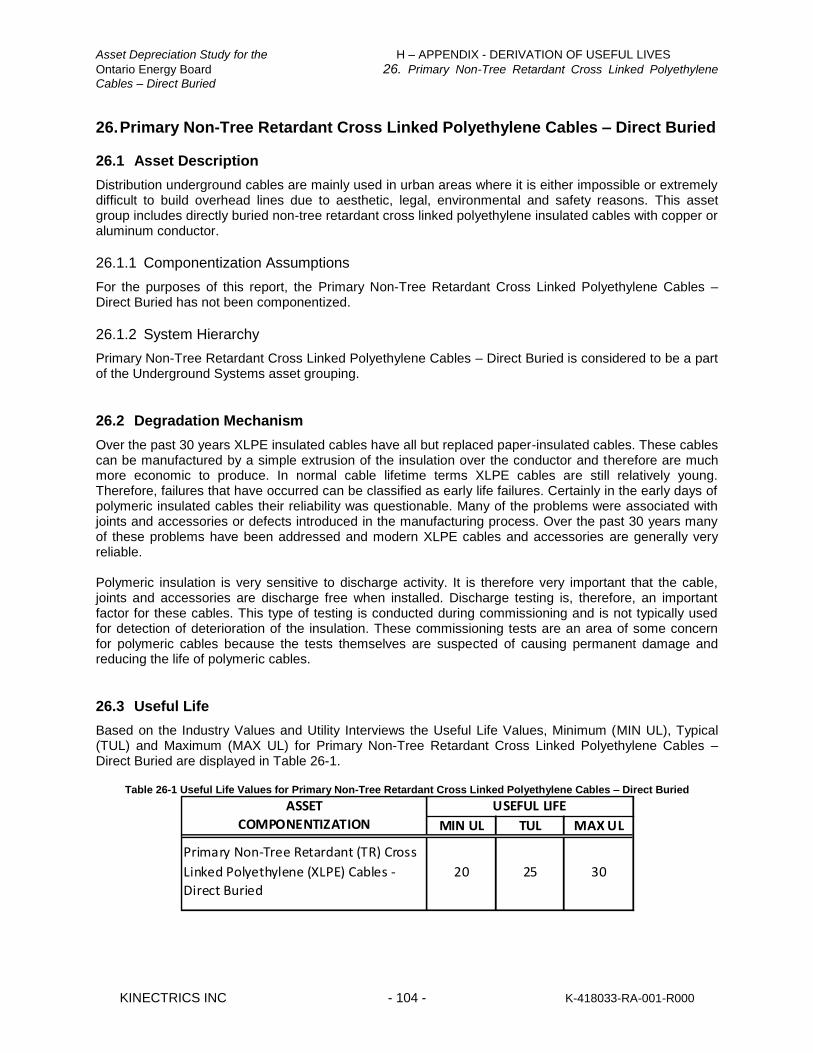
Asset Depreciation Study for the H – APPENDIX - DERIVATION OF USEFUL LIVES
Ontario Energy Board 26. Primary Non-Tree Retardant Cross Linked Polyethylene
Cables – Direct Buried
KINECTRICS INC - 104 - K-418033-RA-001-R000
26. Primary Non-Tree Retardant Cross Linked Polyethylene Cables – Direct Buried
26.1 Asset Description
Distribution underground cables are mainly used in urban areas where it is either impossible or extremely difficult to build overhead lines due to aesthetic, legal, environmental and safety reasons. This asset group includes directly buried non-tree retardant cross linked polyethylene insulated cables with copper or aluminum conductor.
26.1.1 Componentization Assumptions
For the purposes of this report, the Primary Non-Tree Retardant Cross Linked Polyethylene Cables – Direct Buried has not been componentized.
26.1.2 System Hierarchy
Primary Non-Tree Retardant Cross Linked Polyethylene Cables – Direct Buried is considered to be a part of the Underground Systems asset grouping.
26.2 Degradation Mechanism
Over the past 30 years XLPE insulated cables have all but replaced paper-insulated cables. These cables can be manufactured by a simple extrusion of the insulation over the conductor and therefore are much more economic to produce. In normal cable lifetime terms XLPE cables are still relatively young. Therefore, failures that have occurred can be classified as early life failures. Certainly in the early days of polymeric insulated cables their reliability was questionable. Many of the problems were associated with joints and accessories or defects introduced in the manufacturing process. Over the past 30 years many of these problems have been addressed and modern XLPE cables and accessories are generally very reliable. Polymeric insulation is very sensitive to discharge activity. It is therefore very important that the cable, joints and accessories are discharge free when installed. Discharge testing is, therefore, an important factor for these cables. This type of testing is conducted during commissioning and is not typically used for detection of deterioration of the insulation. These commissioning tests are an area of some concern for polymeric cables because the tests themselves are suspected of causing permanent damage and reducing the life of polymeric cables.
26.3 Useful Life
Based on the Industry Values and Utility Interviews the Useful Life Values, Minimum (MIN UL), Typical (TUL) and Maximum (MAX UL) for Primary Non-Tree Retardant Cross Linked Polyethylene Cables – Direct Buried are displayed in Table 26-1.
Table 26-1 Useful Life Values for Primary Non-Tree Retardant Cross Linked Polyethylene Cables – Direct Buried
MIN UL TUL MAX UL
20 25 30
Primary Non-Tree Retardant (TR) Cross
Linked Polyethylene (XLPE) Cables -
Direct Buried
ASSET
COMPONENTIZATION
USEFUL LIFE
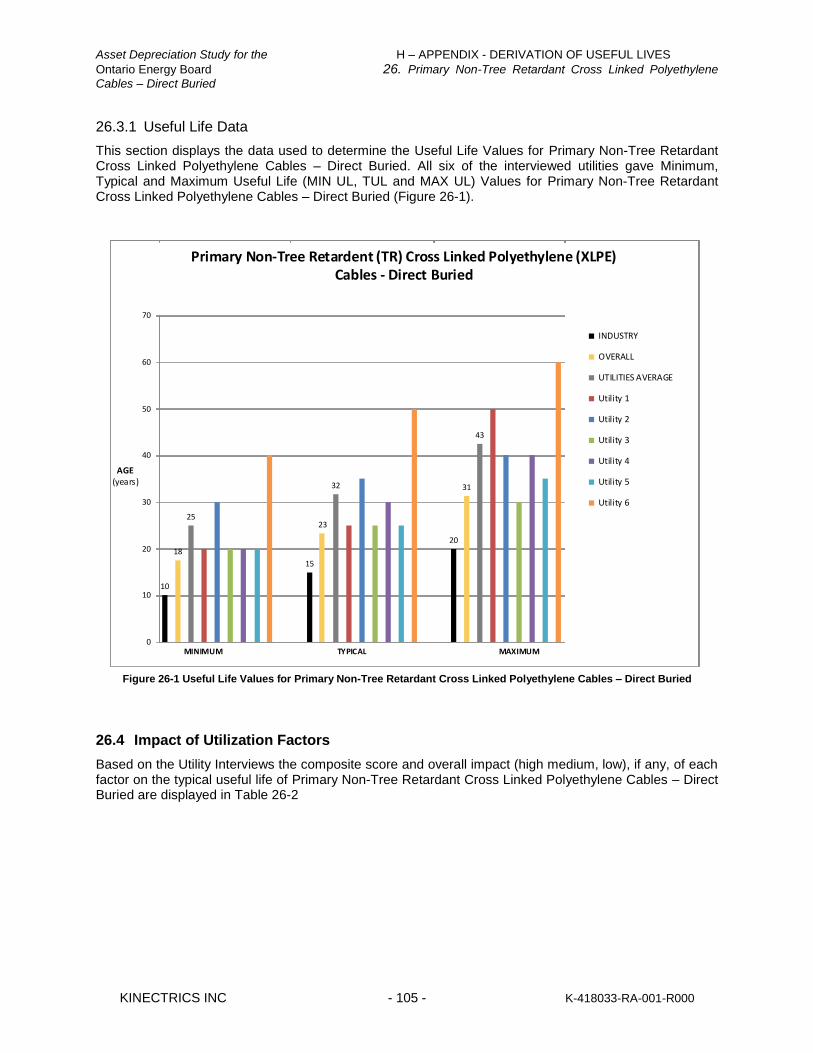
Asset Depreciation Study for the H – APPENDIX - DERIVATION OF USEFUL LIVES
Ontario Energy Board 26. Primary Non-Tree Retardant Cross Linked Polyethylene
Cables – Direct Buried
KINECTRICS INC - 105 - K-418033-RA-001-R000
26.3.1 Useful Life Data
This section displays the data used to determine the Useful Life Values for Primary Non-Tree Retardant Cross Linked Polyethylene Cables – Direct Buried. All six of the interviewed utilities gave Minimum, Typical and Maximum Useful Life (MIN UL, TUL and MAX UL) Values for Primary Non-Tree Retardant Cross Linked Polyethylene Cables – Direct Buried (Figure 26-1).
10
18
25
15
23
32
20
31
43
0
10
20
30
40
50
60
70
MINIMUM TYPICAL MAXIMUM
Primary Non-Tree Retardent (TR) Cross Linked Polyethylene (XLPE) Cables - Direct Buried
INDUSTRY
OVERALL
UTILITIES AVERAGE
Utility 1
Utility 2
Utility 3
Utility 4
Utility 5
Utility 6
AGE(years)
Figure 26-1 Useful Life Values for Primary Non-Tree Retardant Cross Linked Polyethylene Cables – Direct Buried
26.4 Impact of Utilization Factors
Based on the Utility Interviews the composite score and overall impact (high medium, low), if any, of each factor on the typical useful life of Primary Non-Tree Retardant Cross Linked Polyethylene Cables – Direct Buried are displayed in Table 26-2

Asset Depreciation Study for the H – APPENDIX - DERIVATION OF USEFUL LIVES
Ontario Energy Board 26. Primary Non-Tree Retardant Cross Linked Polyethylene
Cables – Direct Buried
KINECTRICS INC - 106 - K-418033-RA-001-R000
Table 26-2 - Composite Score for Primary Non-Tree Retardant Cross Linked Polyethylene Cables – Direct Buried
Mechanical
Stress
Electrical
Loading
Environmental
Factors
Operating
Practices
Maintenance
Practices
Non-Physical
Factors
Composite
Score54% 60% 71% 29% 19% 33%
Overall
Rating*M M M L L L
* H = High Impact M = Medium Impact L = Low Impact NI = No Impact
Utilization Factors
26.4.1 Utility Interview Data
This section displays the data used to determine the composite score and overall impact (high, medium, low) of each factor on the typical useful life of Primary Non-Tree Retardant Cross Linked Polyethylene Cables – Direct Buried. All six of the interviewed utilities provided their input regarding the UFs for Primary Non-Tree Retardant Cross Linked Polyethylene Cables – Direct Buried (Figure 26-2).
Mechanical Stress Electrical Loading Environmental Factors Operating Practices Maintenance Practices Non-Physical Factors
Primary XLPE DB
High Impact Medium Impact Low Impact No Impact
Figure 26-2 Impact of Utilization Factors on the Useful Life of Primary Non-Tree Retardant Cross Linked Polyethylene
Cables – Direct Buried

Asset Depreciation Study for the H – APPENDIX - DERIVATION OF USEFUL LIVES
Ontario Energy Board 27. Primary Non-Tree Retardant Cross Linked Polyethylene
Cables – In Duct
KINECTRICS INC - 107 - K-418033-RA-001-R000
27. Primary Non-Tree Retardant Cross Linked Polyethylene Cables – In Duct
27.1 Asset Description
Distribution underground cables are mainly used in urban areas where it is either impossible or extremely difficult to build overhead lines due to aesthetic, legal, environmental and safety reasons. This asset group includes non-tree retardant cross linked polyethylene insulated cables with copper or aluminum conductor installed in duct.
27.1.1 Componentization Assumptions
For the purposes of this report, the Primary Non-Tree Retardant Cross Linked Polyethylene Cables – In Duct has not been componentized.
27.1.2 System Hierarchy
Primary Non-Tree Retardant Cross Linked Polyethylene Cables – In Duct is considered to be a part of the Underground Systems asset grouping.
27.2 Degradation Mechanism
Over the past 30 years XLPE insulated cables have all but replaced paper-insulated cables. These cables can be manufactured by a simple extrusion of the insulation over the conductor and therefore are much more economic to produce. In normal cable lifetime terms XLPE cables are still relatively young. Therefore, failures that have occurred can be classified as early life failures. Certainly in the early days of polymeric insulated cables their reliability was questionable. Many of the problems were associated with joints and accessories or defects introduced in the manufacturing process. Over the past 30 years many of these problems have been addressed and modern XLPE cables and accessories are generally very reliable. Polymeric insulation is very sensitive to discharge activity. It is therefore very important that the cable, joints and accessories are discharge free when installed. Discharge testing is, therefore, an important factor for these cables. This type of testing is conducted during commissioning and is not typically used for detection of deterioration of the insulation. These commissioning tests are an area of some concern for polymeric cables because the tests themselves are suspected of causing permanent damage and reducing the life of polymeric cables.
27.3 Useful Life
Based on the Industry Values and Utility Interviews the Useful Life Values, Minimum (MIN UL), Typical (TUL) and Maximum (MAX UL) for Primary Non-Tree Retardant Cross Linked Polyethylene Cables – In Duct are displayed in Table 27-1.
Table 27-1 Useful Life Values for Primary Non-Tree Retardant Cross Linked Polyethylene Cables – In Duct
MIN UL TUL MAX UL
20 25 30Primary Non-TR XLPE Cables -
In Duct
ASSET
COMPONENTIZATION
USEFUL LIFE
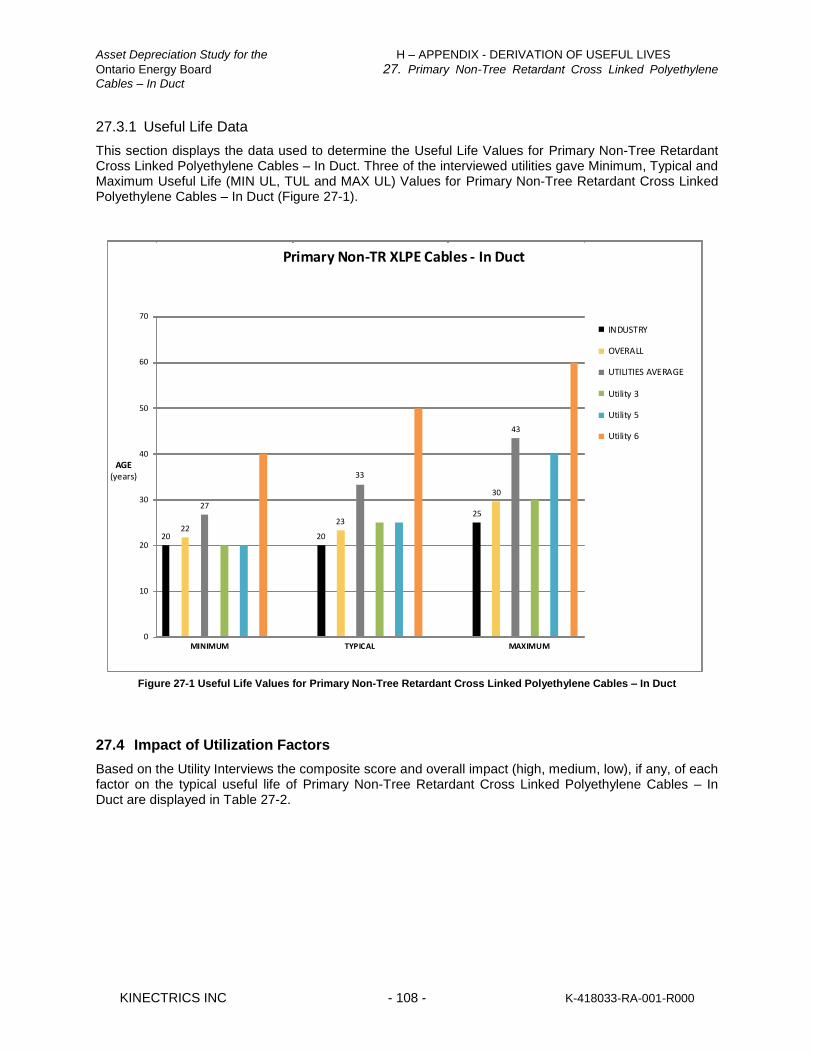
Asset Depreciation Study for the H – APPENDIX - DERIVATION OF USEFUL LIVES
Ontario Energy Board 27. Primary Non-Tree Retardant Cross Linked Polyethylene
Cables – In Duct
KINECTRICS INC - 108 - K-418033-RA-001-R000
27.3.1 Useful Life Data
This section displays the data used to determine the Useful Life Values for Primary Non-Tree Retardant Cross Linked Polyethylene Cables – In Duct. Three of the interviewed utilities gave Minimum, Typical and Maximum Useful Life (MIN UL, TUL and MAX UL) Values for Primary Non-Tree Retardant Cross Linked Polyethylene Cables – In Duct (Figure 27-1).
2022
27
20
23
33
25
30
43
0
10
20
30
40
50
60
70
MINIMUM TYPICAL MAXIMUM
Primary Non-TR XLPE Cables - In Duct
INDUSTRY
OVERALL
UTILITIES AVERAGE
Utility 3
Utility 5
Utility 6
AGE(years)
Figure 27-1 Useful Life Values for Primary Non-Tree Retardant Cross Linked Polyethylene Cables – In Duct
27.4 Impact of Utilization Factors
Based on the Utility Interviews the composite score and overall impact (high, medium, low), if any, of each factor on the typical useful life of Primary Non-Tree Retardant Cross Linked Polyethylene Cables – In Duct are displayed in Table 27-2.

Asset Depreciation Study for the H – APPENDIX - DERIVATION OF USEFUL LIVES
Ontario Energy Board 27. Primary Non-Tree Retardant Cross Linked Polyethylene
Cables – In Duct
KINECTRICS INC - 109 - K-418033-RA-001-R000
Table 27-2 - Composite Score for Primary Non-Tree Retardant Cross Linked Polyethylene Cables – In Duct
Mechanical
Stress
Electrical
Loading
Environmental
Factors
Operating
Practices
Maintenance
Practices
Non-Physical
Factors
Composite
Score71% 71% 71% 25% 38% 67%
Overall
Rating*M M M L L M
* H = High Impact M = Medium Impact L = Low Impact NI = No Impact
Utilization Factors
27.4.1 Utility Interview Data
This section displays the data used to determine the composite score and overall impact (high, medium, low) of each factor on the typical useful life of Primary Non-Tree Retardant Cross Linked Polyethylene Cables – In Duct. Three of the interviewed utilities provided their input regarding the UFs for Primary Non-Tree Retardant Cross Linked Polyethylene Cables – In Duct (Figure 27-2).
Mechanical Stress Electrical Loading Environmental Factors Operating Practices Maintenance Practices Non-Physical Factors
Primary XLPE in Duct
High Impact Medium Impact Low Impact No Impact No Response
Figure 27-2 Impact of Utilization Factors on the Useful Life of Primary Non-Tree Retardant Cross Linked Polyethylene
Cables – In Duct
Asset Depreciation Study for the H – APPENDIX - DERIVATION OF USEFUL LIVES
Ontario Energy Board 28. Primary Tree Retardant Cross Linked Polyethylene Cables
– Direct Buried
KINECTRICS INC - 110 - K-418033-RA-001-R000
28. Primary Tree Retardant Cross Linked Polyethylene Cables – Direct Buried
28.1 Asset Description
Distribution underground cables are mainly used in urban areas where it is either impossible or extremely difficult to build overhead lines due to aesthetic, legal, environmental and safety reasons. This asset group includes direct buried tree retardant cross linked polyethylene insulated cables with copper or aluminum conductor.
28.1.1 Componentization Assumptions
For the purposes of this report, the Primary Tree Retardant Cross Linked Polyethylene Cables – Direct Buried has not been componentized.
28.1.2 System Hierarchy
Primary Tree Retardant Cross Linked Polyethylene Cables – Direct Buried is considered to be a part of the Underground Systems asset grouping.
28.2 Degradation Mechanism
Over the past 30 years XLPE insulated cables have all but replaced paper-insulated cables. These cables can be manufactured by a simple extrusion of the insulation over the conductor and therefore are much more economic to produce. In normal cable lifetime terms XLPE cables are still relatively young. Therefore, failures that have occurred can be classified as early life failures. Certainly in the early days of polymeric insulated cables their reliability was questionable. Many of the problems were associated with joints and accessories or defects introduced in the manufacturing process. Over the past 30 years many of these problems have been addressed and modern XLPE cables and accessories are generally very reliable. Polymeric insulation is very sensitive to discharge activity. It is therefore very important that the cable, joints, splices and terminations are discharge free when installed. Discharge testing is, therefore, an important factor for these cables. This type of testing is conducted during commissioning and is not typically used for detection of deterioration of the insulation. These commissioning tests are an area of some concern for polymeric cables because the tests themselves are suspected of causing permanent damage and reducing the life of polymeric cables. Water treeing is the most significant degradation process for polymeric cables. The original design of cables with polymeric sheaths allowed water to penetrate and come into contact with the insulation. In the presence of electric fields water migration can result in treeing and ultimately breakdown. The rate of growth of water trees is dependent on the quality of the polymeric insulation and the manufacturing process. Any contamination voids or discontinuities will accelerate degradation. This is assumed to be the reason for poor reliability and relatively short lifetimes of early (non-tree retardant) polymeric cables. As manufacturing processes have improved and tree retardant cables have become the predominant underground cable type, the performance and ultimate life of this type of cable has also improved. The major degradation problems with the cable terminations concern mostly flashover and tracking associated with the outside and interior surfaces of joints, splices and terminations. . However, there are also problems of overheating at connections and voltage control at the end of the cable shield.

Asset Depreciation Study for the H – APPENDIX - DERIVATION OF USEFUL LIVES
Ontario Energy Board 28. Primary Tree Retardant Cross Linked Polyethylene Cables
– Direct Buried
KINECTRICS INC - 111 - K-418033-RA-001-R000
28.3 Useful Life
Based on the Industry Values and Utility Interviews the Useful Life Values, Minimum (MIN UL), Typical (TUL) and Maximum (MAX UL) for Primary Tree Retardant Cross Linked Polyethylene Cables – Direct Buried are displayed in Table 28-1.
Table 28-1 Useful Life Values for Primary Tree Retardant Cross Linked Polyethylene Cables – Direct Buried
MIN UL TUL MAX UL
25 30 35Primary TR XLPE Cables - Direct
Buried
ASSET
COMPONENTIZATION
USEFUL LIFE
28.3.1 Useful Life Data
This section displays the data used to determine the Useful Life Values for Primary Tree Retardant Cross Linked Polyethylene Cables – Direct Buried. Five of the interviewed utilities gave Minimum, Typical and Maximum Useful Life (MIN UL, TUL and MAX UL) Values for Primary Tree Retardant Cross Linked Polyethylene Cables – Direct Buried (Figure 28-1).
20
23
28
25
30
38
25
33
45
0
10
20
30
40
50
60
70
MINIMUM TYPICAL MAXIMUM
Primary TR XLPE Cables - Direct Buried
INDUSTRY
OVERALL
UTILITIES AVERAGE
Utility 1
Utility 2
Utility 3
Utility 5
Utility 6AGE
(years)
Figure 28-1 Useful Life Values for Primary Tree Retardant Cross Linked Polyethylene Cables – Direct Buried

Asset Depreciation Study for the H – APPENDIX - DERIVATION OF USEFUL LIVES
Ontario Energy Board 28. Primary Tree Retardant Cross Linked Polyethylene Cables
– Direct Buried
KINECTRICS INC - 112 - K-418033-RA-001-R000
28.4 Impact of Utilization Factors
Based on the Utility Interviews the composite score and overall impact (high, medium, low), if any, of each factor on the typical useful life of Primary Tree Retardant Cross Linked Polyethylene Cables – Direct Buried are displayed in Table 28-2.
Table 28-2 - Composite Score for Primary Tree Retardant Cross Linked Polyethylene Cables – Direct Buried
Mechanical
Stress
Electrical
Loading
Environmental
Factors
Operating
Practices
Maintenance
Practices
Non-Physical
Factors
Composite
Score50% 60% 70% 15% 15% 15%
Overall
Rating*M M M L L L
* H = High Impact M = Medium Impact L = Low Impact NI = No Impact
Utilization Factors
28.4.1 Utility Interview Data
This section displays the data used to determine the composite score and overall impact (high, medium, low) of each factor on the typical useful life of Primary Tree Retardant Cross Linked Polyethylene Cables – Direct Buried. Five of the interviewed utilities provided their input regarding the UFs for Primary Tree Retardant Cross Linked Polyethylene Cables – Direct Buried (Figure 28-2).
Mechanical Stress Electrical Loading Environmental Factors Operating Practices Maintenance Practices Non-Physical Factors
Primary TR XLPE DB
High Impact Medium Impact Low Impact No Impact No Response
Figure 28-2 Impact of Utilization Factors on the Useful Life of Primary Tree Retardant Cross Linked Polyethylene Cables –
Direct Buried
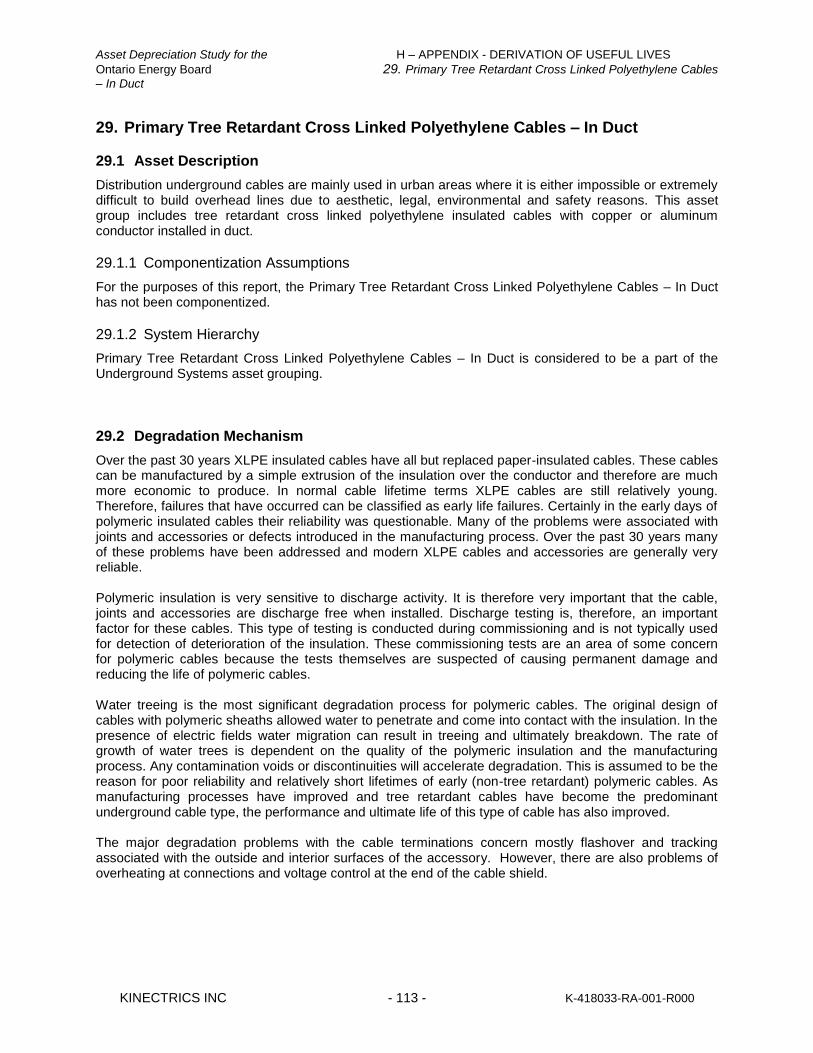
Asset Depreciation Study for the H – APPENDIX - DERIVATION OF USEFUL LIVES
Ontario Energy Board 29. Primary Tree Retardant Cross Linked Polyethylene Cables
– In Duct
KINECTRICS INC - 113 - K-418033-RA-001-R000
29. Primary Tree Retardant Cross Linked Polyethylene Cables – In Duct
29.1 Asset Description
Distribution underground cables are mainly used in urban areas where it is either impossible or extremely difficult to build overhead lines due to aesthetic, legal, environmental and safety reasons. This asset group includes tree retardant cross linked polyethylene insulated cables with copper or aluminum conductor installed in duct.
29.1.1 Componentization Assumptions
For the purposes of this report, the Primary Tree Retardant Cross Linked Polyethylene Cables – In Duct has not been componentized.
29.1.2 System Hierarchy
Primary Tree Retardant Cross Linked Polyethylene Cables – In Duct is considered to be a part of the Underground Systems asset grouping.
29.2 Degradation Mechanism
Over the past 30 years XLPE insulated cables have all but replaced paper-insulated cables. These cables can be manufactured by a simple extrusion of the insulation over the conductor and therefore are much more economic to produce. In normal cable lifetime terms XLPE cables are still relatively young. Therefore, failures that have occurred can be classified as early life failures. Certainly in the early days of polymeric insulated cables their reliability was questionable. Many of the problems were associated with joints and accessories or defects introduced in the manufacturing process. Over the past 30 years many of these problems have been addressed and modern XLPE cables and accessories are generally very reliable. Polymeric insulation is very sensitive to discharge activity. It is therefore very important that the cable, joints and accessories are discharge free when installed. Discharge testing is, therefore, an important factor for these cables. This type of testing is conducted during commissioning and is not typically used for detection of deterioration of the insulation. These commissioning tests are an area of some concern for polymeric cables because the tests themselves are suspected of causing permanent damage and reducing the life of polymeric cables. Water treeing is the most significant degradation process for polymeric cables. The original design of cables with polymeric sheaths allowed water to penetrate and come into contact with the insulation. In the presence of electric fields water migration can result in treeing and ultimately breakdown. The rate of growth of water trees is dependent on the quality of the polymeric insulation and the manufacturing process. Any contamination voids or discontinuities will accelerate degradation. This is assumed to be the reason for poor reliability and relatively short lifetimes of early (non-tree retardant) polymeric cables. As manufacturing processes have improved and tree retardant cables have become the predominant underground cable type, the performance and ultimate life of this type of cable has also improved. The major degradation problems with the cable terminations concern mostly flashover and tracking associated with the outside and interior surfaces of the accessory. However, there are also problems of overheating at connections and voltage control at the end of the cable shield.
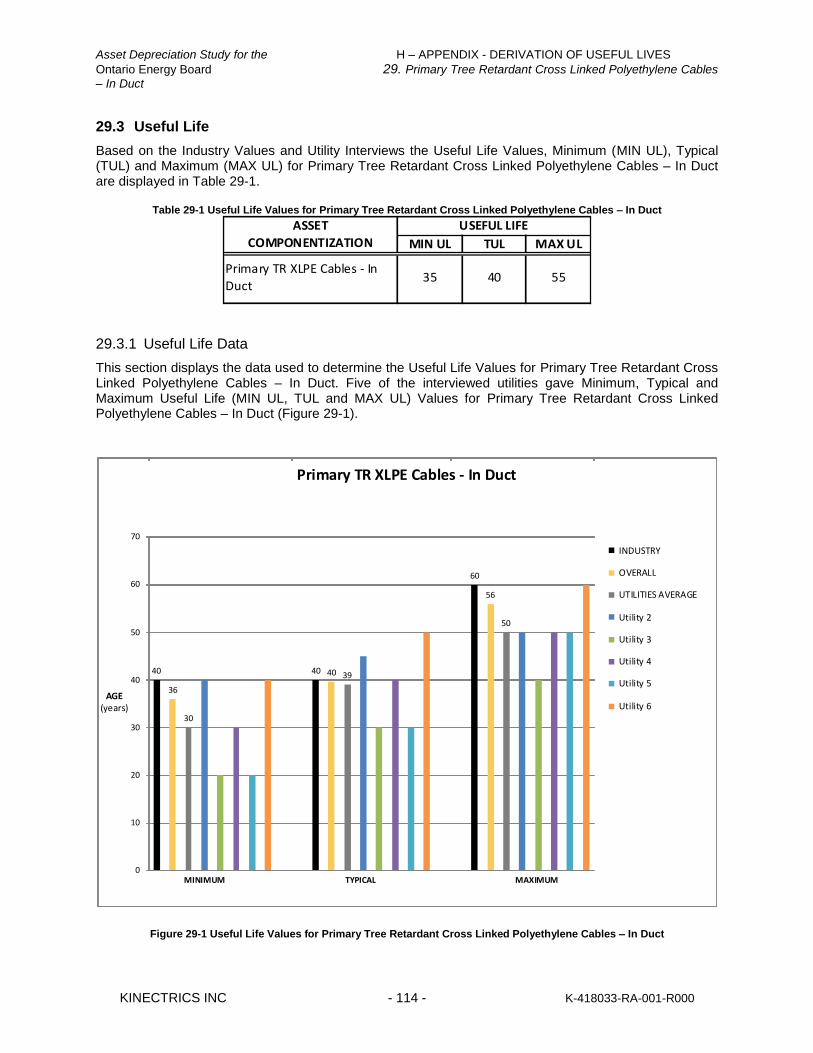
Asset Depreciation Study for the H – APPENDIX - DERIVATION OF USEFUL LIVES
Ontario Energy Board 29. Primary Tree Retardant Cross Linked Polyethylene Cables
– In Duct
KINECTRICS INC - 114 - K-418033-RA-001-R000
29.3 Useful Life
Based on the Industry Values and Utility Interviews the Useful Life Values, Minimum (MIN UL), Typical (TUL) and Maximum (MAX UL) for Primary Tree Retardant Cross Linked Polyethylene Cables – In Duct are displayed in Table 29-1.
Table 29-1 Useful Life Values for Primary Tree Retardant Cross Linked Polyethylene Cables – In Duct
MIN UL TUL MAX UL
35 40 55Primary TR XLPE Cables - In
Duct
ASSET
COMPONENTIZATION
USEFUL LIFE
29.3.1 Useful Life Data
This section displays the data used to determine the Useful Life Values for Primary Tree Retardant Cross Linked Polyethylene Cables – In Duct. Five of the interviewed utilities gave Minimum, Typical and Maximum Useful Life (MIN UL, TUL and MAX UL) Values for Primary Tree Retardant Cross Linked Polyethylene Cables – In Duct (Figure 29-1).
40
36
30
40 40 39
60
56
50
0
10
20
30
40
50
60
70
MINIMUM TYPICAL MAXIMUM
Primary TR XLPE Cables - In Duct
INDUSTRY
OVERALL
UTILITIES AVERAGE
Utility 2
Utility 3
Utility 4
Utility 5
Utility 6AGE
(years)
Figure 29-1 Useful Life Values for Primary Tree Retardant Cross Linked Polyethylene Cables – In Duct
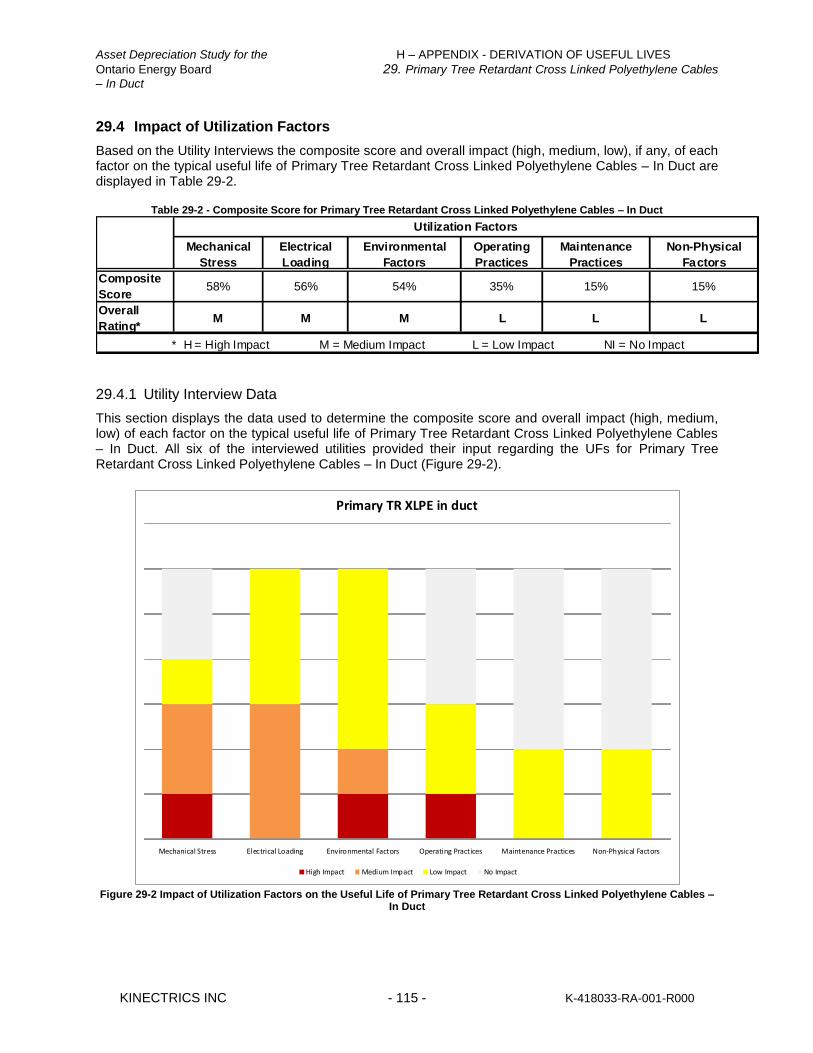
Asset Depreciation Study for the H – APPENDIX - DERIVATION OF USEFUL LIVES
Ontario Energy Board 29. Primary Tree Retardant Cross Linked Polyethylene Cables
– In Duct
KINECTRICS INC - 115 - K-418033-RA-001-R000
29.4 Impact of Utilization Factors
Based on the Utility Interviews the composite score and overall impact (high, medium, low), if any, of each factor on the typical useful life of Primary Tree Retardant Cross Linked Polyethylene Cables – In Duct are displayed in Table 29-2.
Table 29-2 - Composite Score for Primary Tree Retardant Cross Linked Polyethylene Cables – In Duct
Mechanical
Stress
Electrical
Loading
Environmental
Factors
Operating
Practices
Maintenance
Practices
Non-Physical
Factors
Composite
Score58% 56% 54% 35% 15% 15%
Overall
Rating*M M M L L L
* H = High Impact M = Medium Impact L = Low Impact NI = No Impact
Utilization Factors
29.4.1 Utility Interview Data
This section displays the data used to determine the composite score and overall impact (high, medium, low) of each factor on the typical useful life of Primary Tree Retardant Cross Linked Polyethylene Cables – In Duct. All six of the interviewed utilities provided their input regarding the UFs for Primary Tree Retardant Cross Linked Polyethylene Cables – In Duct (Figure 29-2).
Mechanical Stress Electrical Loading Environmental Factors Operating Practices Maintenance Practices Non-Physical Factors
Primary TR XLPE in duct
High Impact Medium Impact Low Impact No Impact
Figure 29-2 Impact of Utilization Factors on the Useful Life of Primary Tree Retardant Cross Linked Polyethylene Cables –
In Duct

Asset Depreciation Study for the H – APPENDIX - DERIVATION OF USEFUL LIVES
Ontario Energy Board 30. Secondary Paper Insulated Lead Covered Cables
KINECTRICS INC - 116 - K-418033-RA-001-R000
30. Secondary Paper Insulated Lead Covered Cables
30.1 Asset Description
Distribution underground cables are mainly used in urban areas where it is either impossible or extremely difficult to build overhead lines due to aesthetic, legal, environmental and safety reasons. Secondary underground cables are used to supply customer premises.
30.1.1 Componentization Assumptions
For the purposes of this report, the Secondary Paper Insulated Lead Covered Cables has not been componentized.
30.1.2 System Hierarchy
Secondary Paper Insulated Lead Covered Cables is considered to be a part of the Underground Systems asset grouping.
30.2 Degradation Mechanism
For Paper Insulated Lead Covered (PILC) cables, the two significant long-term degradation processes are corrosion of the lead sheath and dielectric degradation of the oil impregnated paper insulation. Isolated sites of corrosion resulting in moisture penetration or isolated sites of dielectric deterioration resulting in insulation breakdown can result in localized failures. However, if either of these conditions becomes widespread there will be frequent cable failures and the cable can be deemed to be at effective end-of-life.
30.3 Useful Life
Based on the Industry Values and Utility Interviews the Useful Life Values, Minimum (MIN UL), Typical (TUL) and Maximum (MAX UL) for Secondary Paper Insulated Lead Covered Cables are displayed in Table 30-1.
Table 30-1 Useful Life Values for Secondary Paper Insulated Lead Covered Cables
MIN UL TUL MAX UL
70 75 80Secondary PILC Cables
ASSET
COMPONENTIZATION
USEFUL LIFE
30.3.1 Useful Life Data
This section displays the data used to determine the Useful Life Values for Secondary Paper Insulated Lead Covered Cables. None of the interviewed utilities gave Minimum, Typical and Maximum Useful Life (MIN UL, TUL and MAX UL) Values for Secondary Paper Insulated Lead Covered Cables (Figure 30-1).
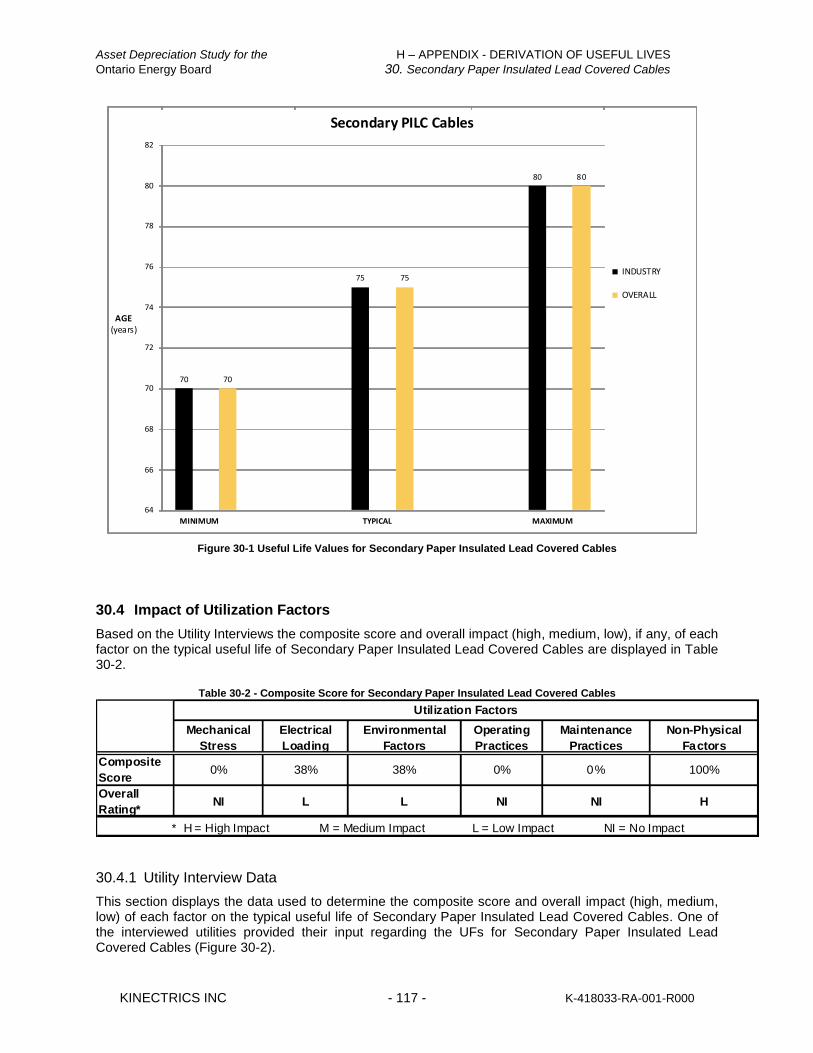
Asset Depreciation Study for the H – APPENDIX - DERIVATION OF USEFUL LIVES
Ontario Energy Board 30. Secondary Paper Insulated Lead Covered Cables
KINECTRICS INC - 117 - K-418033-RA-001-R000
70 70
75 75
80 80
64
66
68
70
72
74
76
78
80
82
MINIMUM TYPICAL MAXIMUM
Secondary PILC Cables
INDUSTRY
OVERALL
AGE(years)
Figure 30-1 Useful Life Values for Secondary Paper Insulated Lead Covered Cables
30.4 Impact of Utilization Factors
Based on the Utility Interviews the composite score and overall impact (high, medium, low), if any, of each factor on the typical useful life of Secondary Paper Insulated Lead Covered Cables are displayed in Table 30-2.
Table 30-2 - Composite Score for Secondary Paper Insulated Lead Covered Cables
Mechanical
Stress
Electrical
Loading
Environmental
Factors
Operating
Practices
Maintenance
Practices
Non-Physical
Factors
Composite
Score0% 38% 38% 0% 0% 100%
Overall
Rating*NI L L NI NI H
* H = High Impact M = Medium Impact L = Low Impact NI = No Impact
Utilization Factors
30.4.1 Utility Interview Data
This section displays the data used to determine the composite score and overall impact (high, medium, low) of each factor on the typical useful life of Secondary Paper Insulated Lead Covered Cables. One of the interviewed utilities provided their input regarding the UFs for Secondary Paper Insulated Lead Covered Cables (Figure 30-2).
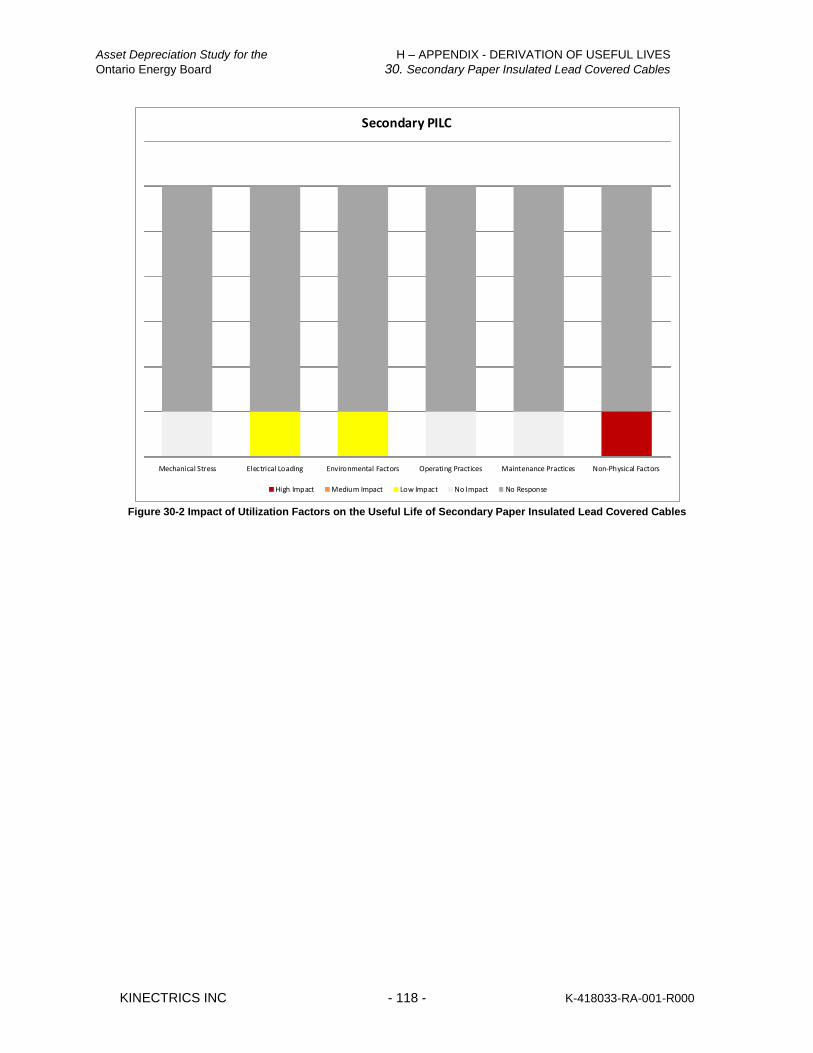
Asset Depreciation Study for the H – APPENDIX - DERIVATION OF USEFUL LIVES
Ontario Energy Board 30. Secondary Paper Insulated Lead Covered Cables
KINECTRICS INC - 118 - K-418033-RA-001-R000
Mechanical Stress Electrical Loading Environmental Factors Operating Practices Maintenance Practices Non-Physical Factors
Secondary PILC
High Impact Medium Impact Low Impact No Impact No Response
Figure 30-2 Impact of Utilization Factors on the Useful Life of Secondary Paper Insulated Lead Covered Cables

Asset Depreciation Study for the H – APPENDIX - DERIVATION OF USEFUL LIVES
Ontario Energy Board 31. Secondary Cables – Direct Buried
KINECTRICS INC - 119 - K-418033-RA-001-R000
31. Secondary Cables – Direct Buried
31.1 Asset Description
Secondary underground cables are used to supply customer premises.
31.1.1 Componentization Assumptions
For the purposes of this report, the Secondary Cables – Direct Buried has not been componentized.
31.1.2 System Hierarchy
Secondary Cables – Direct Buried is considered to be a part of the Underground Systems asset grouping.
31.2 Degradation Mechanism
Degradation of secondary cables is commonly due to mechanical damage, overloading and chemical and environmental impacts on the insulation material.
31.3 Useful Life
Based on the Industry Values and Utility Interviews the Useful Life Values, Minimum (MIN UL), Typical (TUL) and Maximum (MAX UL) for Secondary Cables – Direct Buried are displayed in Table 32-1.
Table 31-1 Useful Life Values for Secondary Cables – Direct Buried
MIN UL TUL MAX UL
25 35 40Secondary Cables - Direct
Buried
ASSET
COMPONENTIZATION
USEFUL LIFE
31.3.1 Useful Life Data
This section displays the data used to determine the Useful Life Values for Secondary Cables – Direct Buried. All six of the interviewed utilities gave Minimum, Typical and Maximum Useful Life (MIN UL, TUL and MAX UL) Values for Secondary Cables – Direct Buried (Figure 31-1).
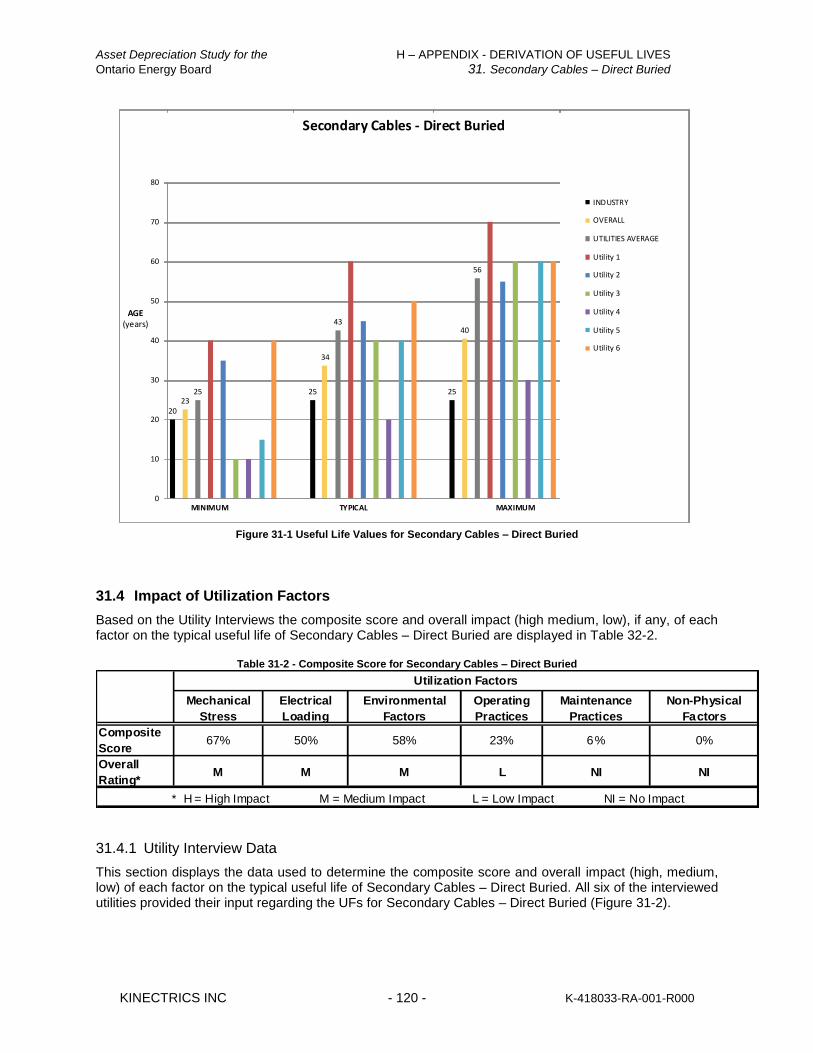
Asset Depreciation Study for the H – APPENDIX - DERIVATION OF USEFUL LIVES
Ontario Energy Board 31. Secondary Cables – Direct Buried
KINECTRICS INC - 120 - K-418033-RA-001-R000
2023
25 25
34
43
25
40
56
0
10
20
30
40
50
60
70
80
MINIMUM TYPICAL MAXIMUM
Secondary Cables - Direct Buried
INDUSTRY
OVERALL
UTILITIES AVERAGE
Utility 1
Utility 2
Utility 3
Utility 4
Utility 5
Utility 6
AGE(years)
Figure 31-1 Useful Life Values for Secondary Cables – Direct Buried
31.4 Impact of Utilization Factors
Based on the Utility Interviews the composite score and overall impact (high medium, low), if any, of each factor on the typical useful life of Secondary Cables – Direct Buried are displayed in Table 32-2.
Table 31-2 - Composite Score for Secondary Cables – Direct Buried
Mechanical
Stress
Electrical
Loading
Environmental
Factors
Operating
Practices
Maintenance
Practices
Non-Physical
Factors
Composite
Score67% 50% 58% 23% 6% 0%
Overall
Rating*M M M L NI NI
* H = High Impact M = Medium Impact L = Low Impact NI = No Impact
Utilization Factors
31.4.1 Utility Interview Data
This section displays the data used to determine the composite score and overall impact (high, medium, low) of each factor on the typical useful life of Secondary Cables – Direct Buried. All six of the interviewed utilities provided their input regarding the UFs for Secondary Cables – Direct Buried (Figure 31-2).
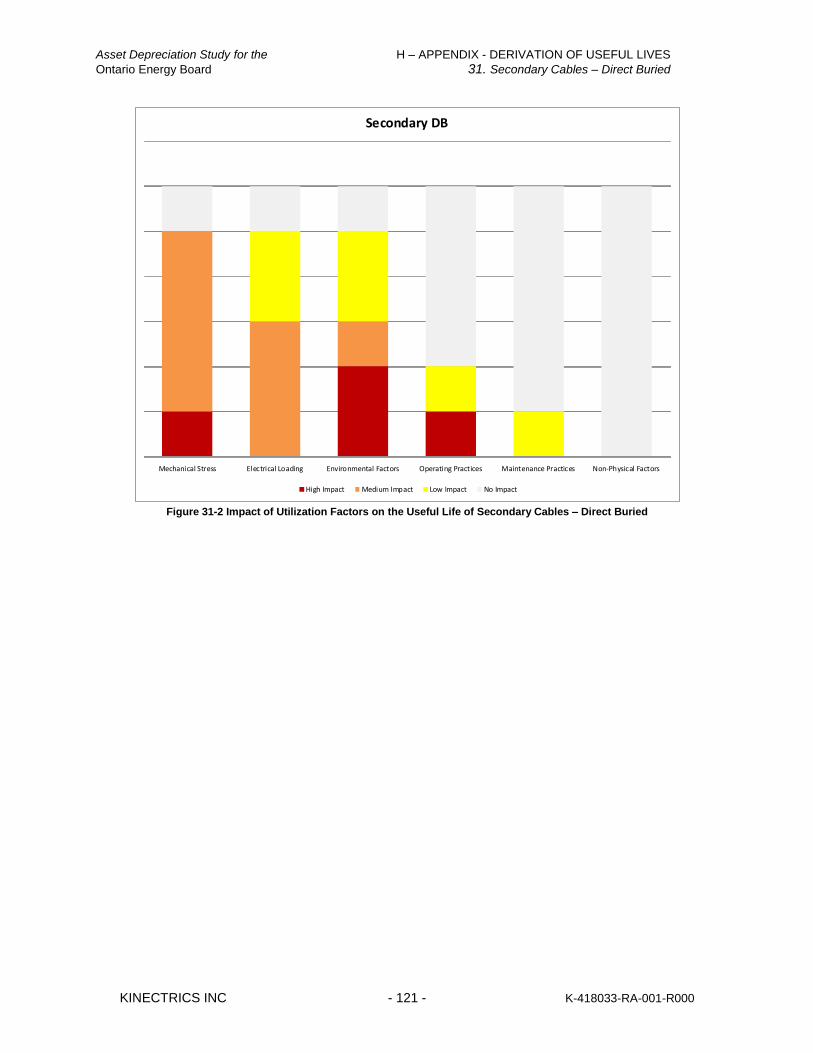
Asset Depreciation Study for the H – APPENDIX - DERIVATION OF USEFUL LIVES
Ontario Energy Board 31. Secondary Cables – Direct Buried
KINECTRICS INC - 121 - K-418033-RA-001-R000
Mechanical Stress Electrical Loading Environmental Factors Operating Practices Maintenance Practices Non-Physical Factors
Secondary DB
High Impact Medium Impact Low Impact No Impact
Figure 31-2 Impact of Utilization Factors on the Useful Life of Secondary Cables – Direct Buried
Asset Depreciation Study for the H – APPENDIX - DERIVATION OF USEFUL LIVES
Ontario Energy Board 32. Secondary Cables – In Duct
KINECTRICS INC - 122 - K-418033-RA-001-R000
32. Secondary Cables – In Duct
32.1 Asset Description
Secondary underground cables are used to supply customer premises.
32.1.1 Componentization Assumptions
For the purposes of this report, the Secondary Cables – In Duct has not been componentized.
32.1.2 System Hierarchy
Secondary Cables – In Duct is considered to be a part of the Underground Systems asset grouping.
32.2 Degradation Mechanism
Degradation of secondary cables is commonly due to mechanical damage, overloading and chemical and environmental impacts on the insulation material. Placement of the cable in duct mitigates some of the mechanical and chemical damage mechanisms.
32.3 Useful Life
Based on the Industry Values and Utility Interviews the Useful Life Values, Minimum (MIN UL), Typical (TUL) and Maximum (MAX UL) for Secondary Cables – In Duct are displayed in Table 33-1.
Table 32-1 Useful Life Values for Secondary Cables – In Duct
MIN UL TUL MAX UL
35 40 60Secondary Cables - In Duct
ASSET
COMPONENTIZATION
USEFUL LIFE
32.3.1 Useful Life Data
This section displays the data used to determine the Useful Life Values for Secondary Cables – In Duct. Five of the interviewed utilities gave Minimum, Typical and Maximum Useful Life (MIN UL, TUL and MAX UL) Values for Secondary Cables – In Duct (Figure 32-1).
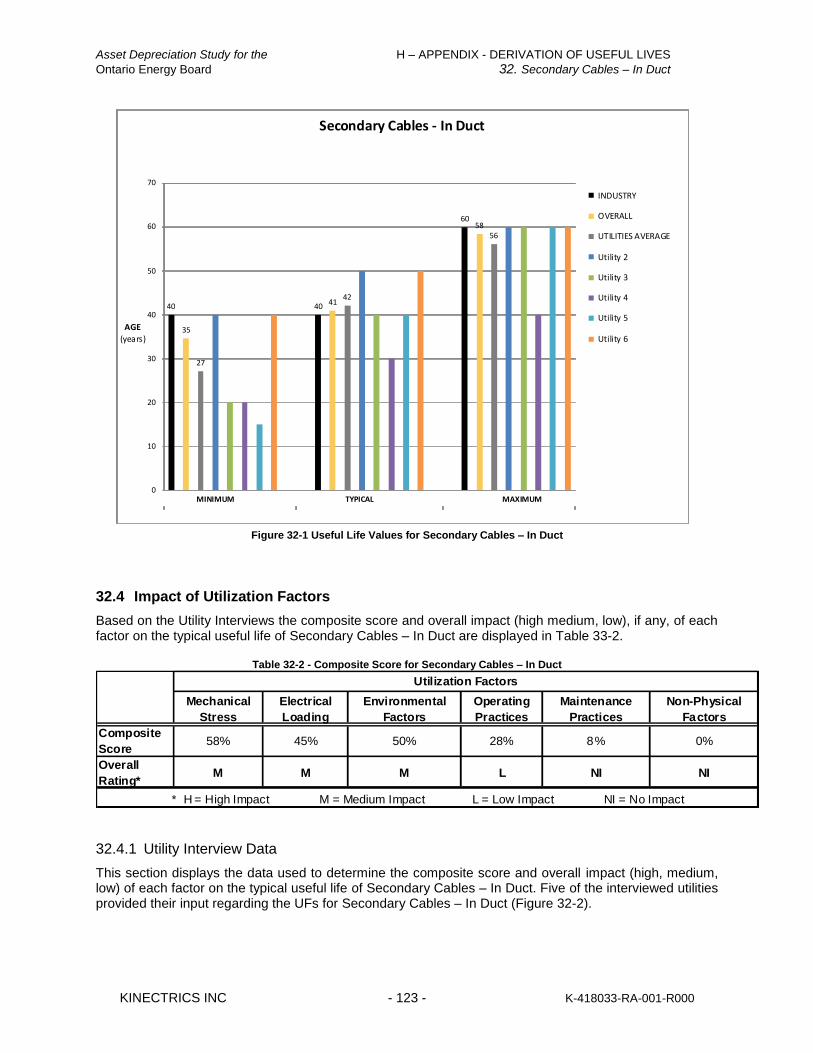
Asset Depreciation Study for the H – APPENDIX - DERIVATION OF USEFUL LIVES
Ontario Energy Board 32. Secondary Cables – In Duct
KINECTRICS INC - 123 - K-418033-RA-001-R000
40
35
27
40 4142
6058
56
0
10
20
30
40
50
60
70
MINIMUM TYPICAL MAXIMUM
Secondary Cables - In Duct
INDUSTRY
OVERALL
UTILITIES AVERAGE
Utility 2
Utility 3
Utility 4
Utility 5
Utility 6
AGE
(years)
Figure 32-1 Useful Life Values for Secondary Cables – In Duct
32.4 Impact of Utilization Factors
Based on the Utility Interviews the composite score and overall impact (high medium, low), if any, of each factor on the typical useful life of Secondary Cables – In Duct are displayed in Table 33-2.
Table 32-2 - Composite Score for Secondary Cables – In Duct
Mechanical
Stress
Electrical
Loading
Environmental
Factors
Operating
Practices
Maintenance
Practices
Non-Physical
Factors
Composite
Score58% 45% 50% 28% 8% 0%
Overall
Rating*M M M L NI NI
* H = High Impact M = Medium Impact L = Low Impact NI = No Impact
Utilization Factors
32.4.1 Utility Interview Data
This section displays the data used to determine the composite score and overall impact (high, medium, low) of each factor on the typical useful life of Secondary Cables – In Duct. Five of the interviewed utilities provided their input regarding the UFs for Secondary Cables – In Duct (Figure 32-2).

Asset Depreciation Study for the H – APPENDIX - DERIVATION OF USEFUL LIVES
Ontario Energy Board 32. Secondary Cables – In Duct
KINECTRICS INC - 124 - K-418033-RA-001-R000
Mechanical Stress Electrical Loading Environmental Factors Operating Practices Maintenance Practices Non-Physical Factors
Secondary In Duct
High Impact Medium Impact Low Impact No Impact No Response
Figure 32-2 Impact of Utilization Factors on the Useful Life of Secondary Cables – In Duct

Asset Depreciation Study for the H – APPENDIX - DERIVATION OF USEFUL LIVES
Ontario Energy Board 33. Network Transformers
KINECTRICS INC - 125 - K-418033-RA-001-R000
33. Network Transformers
33.1 Asset Description
Network transformers are special purpose distribution transformers, designed and constructed for successful operation in a parallel mode with a large number of transformers with similar characteristic. The primary winding of the transformers is connected in Delta configuration while the secondary is in grounded star configuration. The network transformers are provided with a primary disconnect, which has no current interrupting rating and is used merely as in isolating device after the transformer has been de-energized both from primary and secondary source. The secondary bushings are mounted on the side wall of the transformer in a throat, suitable for mounting of the network protector.
33.1.1 Componentization Assumptions
For the purposes of this report, the Network Transformers has been componentized so that the network protector is regarded as separated components. Therefore the Network Transformers has overall useful life values based and useful life values for the specific component, the network protector. Network protectors are special purpose low voltage air circuit breakers, designed for successful parallel operation of network transformers. Network protectors are fully self contained units, equipped with protective relays and instrument transformers to allow automatic closing and opening of the protector. The relays conduct a line test before initiating close command and allow closing of the breaker only if the associated transformer has the correct voltage condition in relation to the grid to permit flow of power from the transformer to the grid. If the conditions are not right, protector closing is blocked. The protector is also equipped with a reverse current relay that trips if the power flow reverses from its normal direction, i.e. if the power flows from grid into the transformer.
33.1.2 System Hierarchy
Network Transformers is considered to be a part of the Underground Systems asset grouping.
33.2 Degradation Mechanism
Since in a majority of the applications transformers are installed in below grade vaults, the transformer is designed for partially submersible operation with additional protection against corrosion. While network transformers are available in dry-type (cast coil and epoxy impregnation) designs, a vast majority of the network transformers employ mineral oil for insulation and cooling. The network transformer has a similar degradation mechanism to other distribution transformers. The life of the transformer’s internal insulation is related to temperature rise and duration. Therefore, the transformer life is affected by electrical loading profiles and length of service life. Other factors such as mechanical damage, exposure to corrosive salts, and voltage current surges also have strong effects. Therefore, a combination of condition, age, and load based criteria is commonly used to determine the useful remaining life. The breaker design in network protectors employs mechanical linkages, rollers, springs and cams for operation which require periodic maintenance. All network protectors are equipped with special load-side fuses, mounted either internally or external to the network protector housing. The fuses are intended to allow normal load current and overloads while providing backup protection in the event that the protector fails to open on reverse fault current (due to faults internal to the protector or near transformer low voltage terminals). Every time arcing occurs in open air within the network protector housing, whether due to operation of the air breaker or because of fuse blowing (except silver sand), a certain amount of metal vapour is liberated and dispersed over insulating parts. Fuses evidently liberate more vapour than
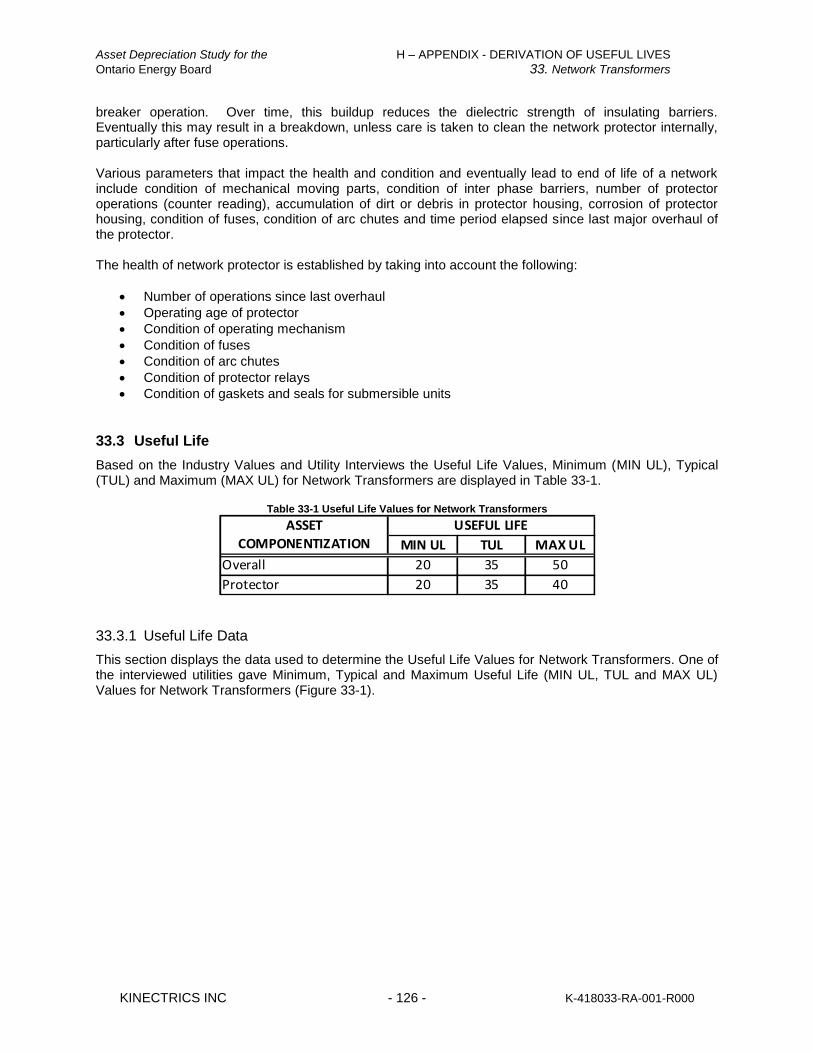
Asset Depreciation Study for the H – APPENDIX - DERIVATION OF USEFUL LIVES
Ontario Energy Board 33. Network Transformers
KINECTRICS INC - 126 - K-418033-RA-001-R000
breaker operation. Over time, this buildup reduces the dielectric strength of insulating barriers. Eventually this may result in a breakdown, unless care is taken to clean the network protector internally, particularly after fuse operations. Various parameters that impact the health and condition and eventually lead to end of life of a network include condition of mechanical moving parts, condition of inter phase barriers, number of protector operations (counter reading), accumulation of dirt or debris in protector housing, corrosion of protector housing, condition of fuses, condition of arc chutes and time period elapsed since last major overhaul of the protector. The health of network protector is established by taking into account the following:
Number of operations since last overhaul
Operating age of protector
Condition of operating mechanism
Condition of fuses
Condition of arc chutes
Condition of protector relays
Condition of gaskets and seals for submersible units
33.3 Useful Life
Based on the Industry Values and Utility Interviews the Useful Life Values, Minimum (MIN UL), Typical (TUL) and Maximum (MAX UL) for Network Transformers are displayed in Table 33-1.
Table 33-1 Useful Life Values for Network Transformers
MIN UL TUL MAX UL
20 35 50
20 35 40
Overall
Protector
ASSET
COMPONENTIZATION
USEFUL LIFE
33.3.1 Useful Life Data
This section displays the data used to determine the Useful Life Values for Network Transformers. One of the interviewed utilities gave Minimum, Typical and Maximum Useful Life (MIN UL, TUL and MAX UL) Values for Network Transformers (Figure 33-1).

Asset Depreciation Study for the H – APPENDIX - DERIVATION OF USEFUL LIVES
Ontario Energy Board 33. Network Transformers
KINECTRICS INC - 127 - K-418033-RA-001-R000
2022
45
3536
50 5052
70
0
10
20
30
40
50
60
70
80
MINIMUM TYPICAL MAXIMUM
Network Transformers Overall
INDUSTRY
OVERALL
UTILITIES AVERAGE
Utility 1
AGE
(years)
Figure 33-1 Useful Life Values for Network Transformers
33.4 Impact of Utilization Factors
Based on the Utility Interviews the composite score and overall impact (high medium, low), if any, of each factor on the typical useful life of Network Transformers are displayed in Table 33-2.
Table 33-2 - Composite Score for Network Transformers
Mechanical
Stress
Electrical
Loading
Environmental
Factors
Operating
Practices
Maintenance
Practices
Non-Physical
Factors
Composite
Score0% 38% 100% 0% 0% 0%
Overall
Rating*NI L H NI NI NI
* H = High Impact M = Medium Impact L = Low Impact NI = No Impact
Utilization Factors
33.4.1 Utility Interview Data
This section displays the data used to determine the composite score and overall impact (high, medium, low) of each factor on the typical useful life of Network Transformers. One of the interviewed utilities provided their input regarding the UFs for Network Transformers (Figure 33-2).
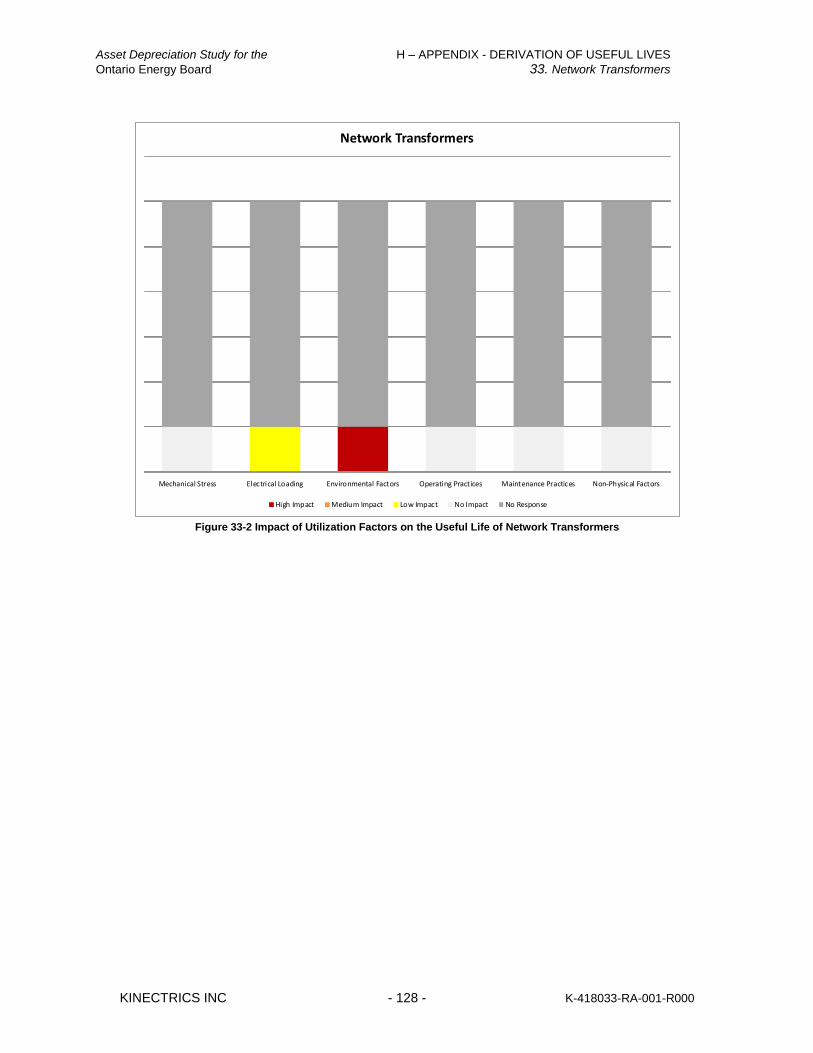
Asset Depreciation Study for the H – APPENDIX - DERIVATION OF USEFUL LIVES
Ontario Energy Board 33. Network Transformers
KINECTRICS INC - 128 - K-418033-RA-001-R000
Mechanical Stress Electrical Loading Environmental Factors Operating Practices Maintenance Practices Non-Physical Factors
Network Transformers
High Impact Medium Impact Low Impact No Impact No Response
Figure 33-2 Impact of Utilization Factors on the Useful Life of Network Transformers

Asset Depreciation Study for the H – APPENDIX - DERIVATION OF USEFUL LIVES
Ontario Energy Board 34. Pad-Mounted Transformers
KINECTRICS INC - 129 - K-418033-RA-001-R000
34. Pad-Mounted Transformers
34.1 Asset Description
Pad-Mounted transformers typically employ sealed tank construction and are liquid filled, with mineral insulating oil being the predominant liquid.
34.1.1 Componentization Assumptions
For the purposes of this report, the Pad-Mounted Transformers has not been componentized.
34.1.2 System Hierarchy
Pad-Mounted Transformers is considered to be a part of the Underground Systems asset grouping.
34.2 Degradation Mechanism
It has been demonstrated that the life of the transformer’s internal insulation is related to temperature rise and duration. Therefore, the transformer life is affected by electrical loading profiles and length of service life. Other factors such as mechanical damage, exposure to corrosive salts, and voltage current surges also have strong effects. Therefore, a combination of condition, age, and load based criteria is commonly used to determine the useful remaining life. In general, the following are considered when determining the health of the pad-mounted transformer:
Tank corrosion, condition of paint
Extent of oil leaks
Condition of bushings
Condition of padlocks, warning signs, etc.
Transfer operating age and winding temperature profile
34.3 Useful Life
Based on the Industry Values and Utility Interviews the Useful Life Values, Minimum (MIN UL), Typical (TUL) and Maximum (MAX UL) for Pad-Mounted Transformers are displayed in Table 34-1.
Table 34-1 Useful Life Values for Pad-Mounted Transformers
MIN UL TUL MAX UL
25 40 45Pad-Mounted Transformers
ASSET
COMPONENTIZATION
USEFUL LIFE
34.3.1 Useful Life Data
This section displays the data used to determine the Useful Life Values for Pad-Mounted Transformers. All six of the interviewed utilities gave Minimum, Typical and Maximum Useful Life (MIN UL, TUL and MAX UL) Values for Pad-Mounted Transformers (Figure 34-1).
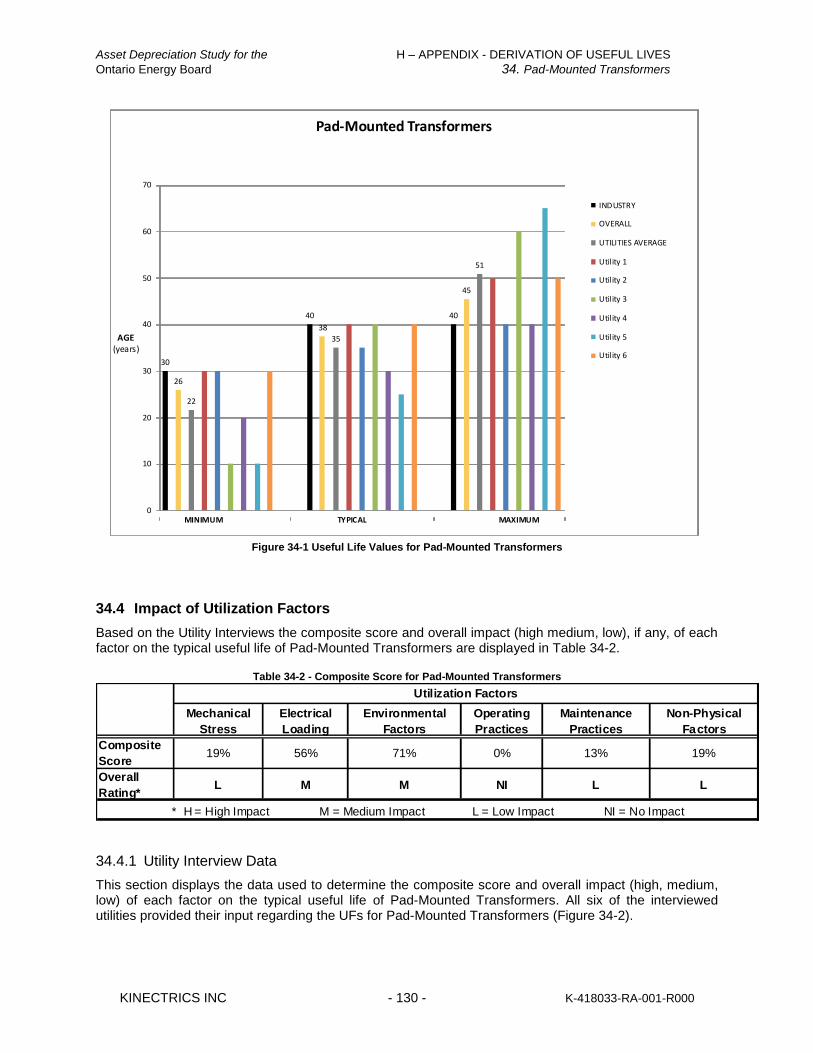
Asset Depreciation Study for the H – APPENDIX - DERIVATION OF USEFUL LIVES
Ontario Energy Board 34. Pad-Mounted Transformers
KINECTRICS INC - 130 - K-418033-RA-001-R000
30
26
22
40
38
35
40
45
51
0
10
20
30
40
50
60
70
MINIMUM TYPICAL MAXIMUM
Pad-Mounted Transformers
INDUSTRY
OVERALL
UTILITIES AVERAGE
Utility 1
Utility 2
Utility 3
Utility 4
Utility 5
Utility 6
AGE(years)
Figure 34-1 Useful Life Values for Pad-Mounted Transformers
34.4 Impact of Utilization Factors
Based on the Utility Interviews the composite score and overall impact (high medium, low), if any, of each factor on the typical useful life of Pad-Mounted Transformers are displayed in Table 34-2.
Table 34-2 - Composite Score for Pad-Mounted Transformers
Mechanical
Stress
Electrical
Loading
Environmental
Factors
Operating
Practices
Maintenance
Practices
Non-Physical
Factors
Composite
Score19% 56% 71% 0% 13% 19%
Overall
Rating*L M M NI L L
* H = High Impact M = Medium Impact L = Low Impact NI = No Impact
Utilization Factors
34.4.1 Utility Interview Data
This section displays the data used to determine the composite score and overall impact (high, medium, low) of each factor on the typical useful life of Pad-Mounted Transformers. All six of the interviewed utilities provided their input regarding the UFs for Pad-Mounted Transformers (Figure 34-2).
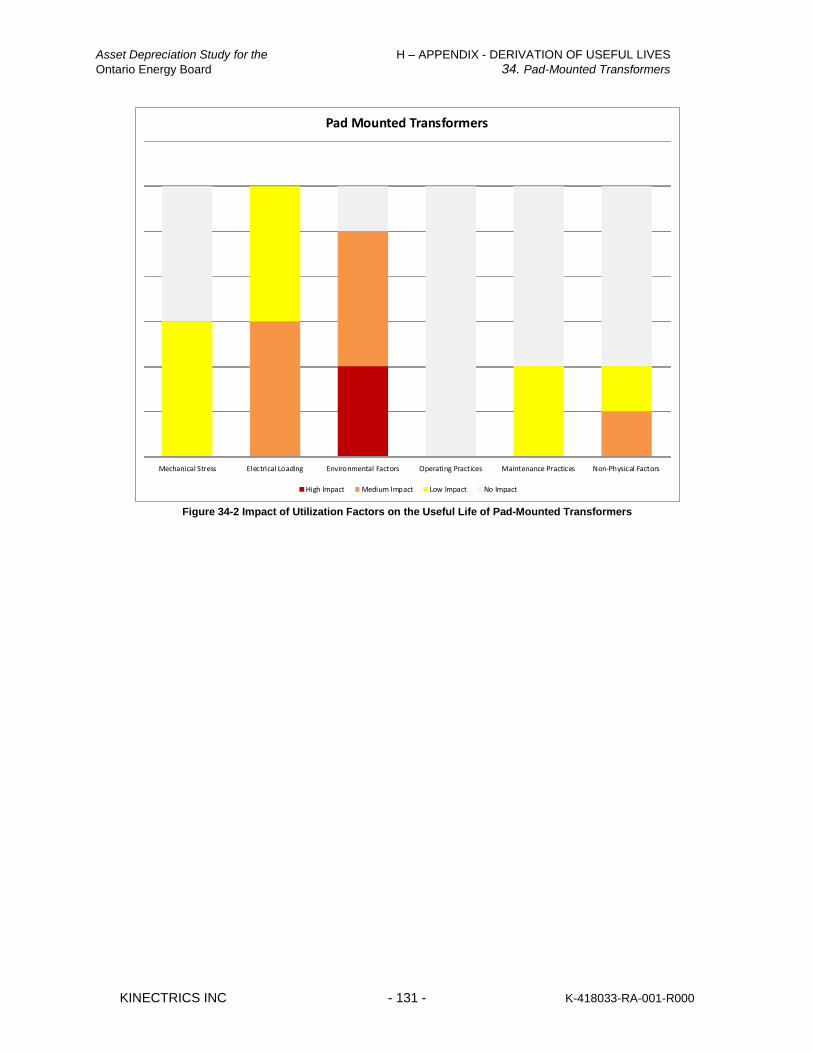
Asset Depreciation Study for the H – APPENDIX - DERIVATION OF USEFUL LIVES
Ontario Energy Board 34. Pad-Mounted Transformers
KINECTRICS INC - 131 - K-418033-RA-001-R000
Mechanical Stress Electrical Loading Environmental Factors Operating Practices Maintenance Practices Non-Physical Factors
Pad Mounted Transformers
High Impact Medium Impact Low Impact No Impact
Figure 34-2 Impact of Utilization Factors on the Useful Life of Pad-Mounted Transformers
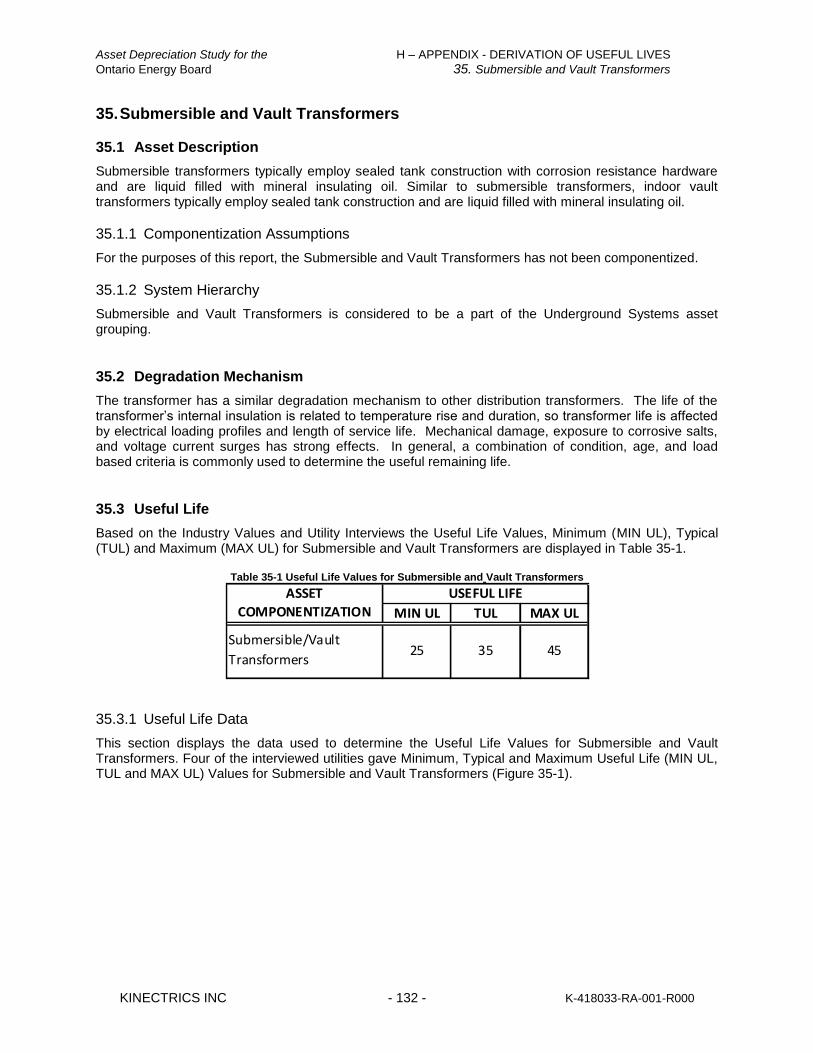
Asset Depreciation Study for the H – APPENDIX - DERIVATION OF USEFUL LIVES
Ontario Energy Board 35. Submersible and Vault Transformers
KINECTRICS INC - 132 - K-418033-RA-001-R000
35. Submersible and Vault Transformers
35.1 Asset Description
Submersible transformers typically employ sealed tank construction with corrosion resistance hardware and are liquid filled with mineral insulating oil. Similar to submersible transformers, indoor vault transformers typically employ sealed tank construction and are liquid filled with mineral insulating oil.
35.1.1 Componentization Assumptions
For the purposes of this report, the Submersible and Vault Transformers has not been componentized.
35.1.2 System Hierarchy
Submersible and Vault Transformers is considered to be a part of the Underground Systems asset grouping.
35.2 Degradation Mechanism
The transformer has a similar degradation mechanism to other distribution transformers. The life of the transformer’s internal insulation is related to temperature rise and duration, so transformer life is affected by electrical loading profiles and length of service life. Mechanical damage, exposure to corrosive salts, and voltage current surges has strong effects. In general, a combination of condition, age, and load based criteria is commonly used to determine the useful remaining life.
35.3 Useful Life
Based on the Industry Values and Utility Interviews the Useful Life Values, Minimum (MIN UL), Typical (TUL) and Maximum (MAX UL) for Submersible and Vault Transformers are displayed in Table 35-1.
Table 35-1 Useful Life Values for Submersible and Vault Transformers
MIN UL TUL MAX UL
25 35 45
ASSET
COMPONENTIZATION
USEFUL LIFE
Submersible/Vault
Transformers
35.3.1 Useful Life Data
This section displays the data used to determine the Useful Life Values for Submersible and Vault Transformers. Four of the interviewed utilities gave Minimum, Typical and Maximum Useful Life (MIN UL, TUL and MAX UL) Values for Submersible and Vault Transformers (Figure 35-1).
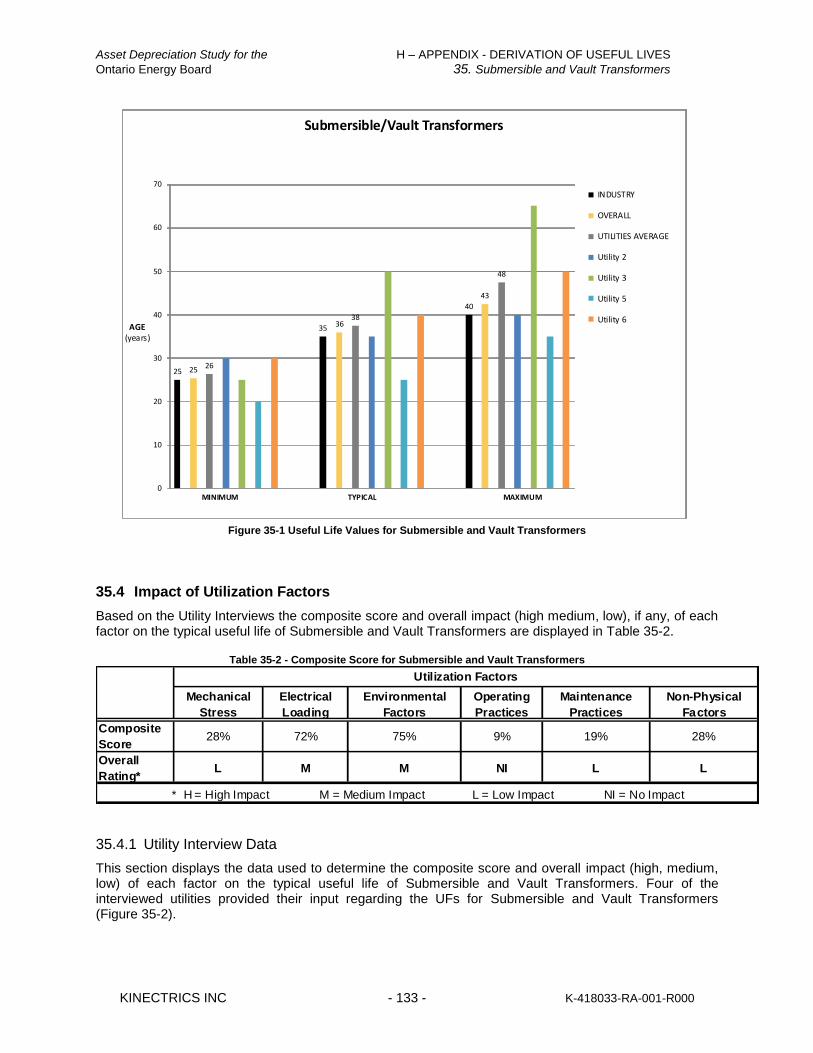
Asset Depreciation Study for the H – APPENDIX - DERIVATION OF USEFUL LIVES
Ontario Energy Board 35. Submersible and Vault Transformers
KINECTRICS INC - 133 - K-418033-RA-001-R000
25 25 26
35 3638
40
43
48
0
10
20
30
40
50
60
70
MINIMUM TYPICAL MAXIMUM
Submersible/Vault Transformers
INDUSTRY
OVERALL
UTILITIES AVERAGE
Utility 2
Utility 3
Utility 5
Utility 6AGE
(years)
Figure 35-1 Useful Life Values for Submersible and Vault Transformers
35.4 Impact of Utilization Factors
Based on the Utility Interviews the composite score and overall impact (high medium, low), if any, of each factor on the typical useful life of Submersible and Vault Transformers are displayed in Table 35-2.
Table 35-2 - Composite Score for Submersible and Vault Transformers
Mechanical
Stress
Electrical
Loading
Environmental
Factors
Operating
Practices
Maintenance
Practices
Non-Physical
Factors
Composite
Score28% 72% 75% 9% 19% 28%
Overall
Rating*L M M NI L L
* H = High Impact M = Medium Impact L = Low Impact NI = No Impact
Utilization Factors
35.4.1 Utility Interview Data
This section displays the data used to determine the composite score and overall impact (high, medium, low) of each factor on the typical useful life of Submersible and Vault Transformers. Four of the interviewed utilities provided their input regarding the UFs for Submersible and Vault Transformers (Figure 35-2).

Asset Depreciation Study for the H – APPENDIX - DERIVATION OF USEFUL LIVES
Ontario Energy Board 35. Submersible and Vault Transformers
KINECTRICS INC - 134 - K-418033-RA-001-R000
Mechanical Stress Electrical Loading Environmental Factors Operating Practices Maintenance Practices Non-Physical Factors
Submersible/Vault Transformers
High Impact Medium Impact Low Impact No Impact No Response
Figure 35-2 Impact of Utilization Factors on the Useful Life of Submersible and Vault Transformers
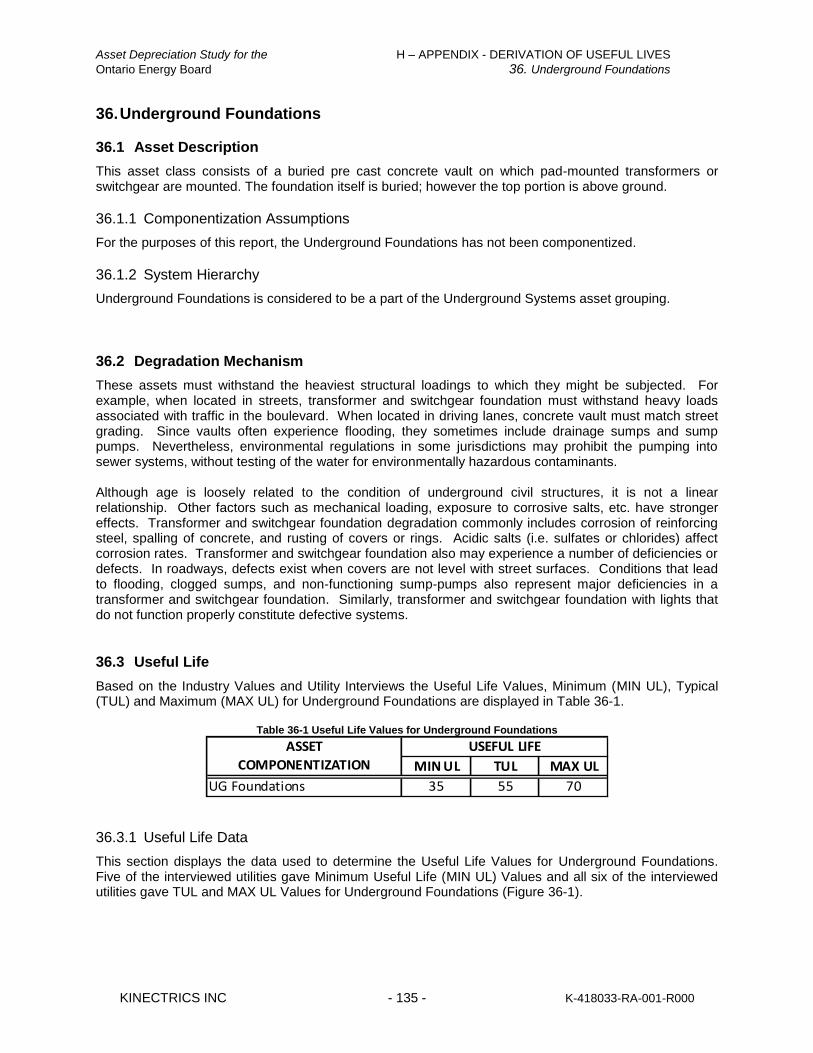
Asset Depreciation Study for the H – APPENDIX - DERIVATION OF USEFUL LIVES
Ontario Energy Board 36. Underground Foundations
KINECTRICS INC - 135 - K-418033-RA-001-R000
36. Underground Foundations
36.1 Asset Description
This asset class consists of a buried pre cast concrete vault on which pad-mounted transformers or switchgear are mounted. The foundation itself is buried; however the top portion is above ground.
36.1.1 Componentization Assumptions
For the purposes of this report, the Underground Foundations has not been componentized.
36.1.2 System Hierarchy
Underground Foundations is considered to be a part of the Underground Systems asset grouping.
36.2 Degradation Mechanism
These assets must withstand the heaviest structural loadings to which they might be subjected. For example, when located in streets, transformer and switchgear foundation must withstand heavy loads associated with traffic in the boulevard. When located in driving lanes, concrete vault must match street grading. Since vaults often experience flooding, they sometimes include drainage sumps and sump pumps. Nevertheless, environmental regulations in some jurisdictions may prohibit the pumping into sewer systems, without testing of the water for environmentally hazardous contaminants. Although age is loosely related to the condition of underground civil structures, it is not a linear relationship. Other factors such as mechanical loading, exposure to corrosive salts, etc. have stronger effects. Transformer and switchgear foundation degradation commonly includes corrosion of reinforcing steel, spalling of concrete, and rusting of covers or rings. Acidic salts (i.e. sulfates or chlorides) affect corrosion rates. Transformer and switchgear foundation also may experience a number of deficiencies or defects. In roadways, defects exist when covers are not level with street surfaces. Conditions that lead to flooding, clogged sumps, and non-functioning sump-pumps also represent major deficiencies in a transformer and switchgear foundation. Similarly, transformer and switchgear foundation with lights that do not function properly constitute defective systems.
36.3 Useful Life
Based on the Industry Values and Utility Interviews the Useful Life Values, Minimum (MIN UL), Typical (TUL) and Maximum (MAX UL) for Underground Foundations are displayed in Table 36-1.
Table 36-1 Useful Life Values for Underground Foundations
MIN UL TUL MAX UL
35 55 70
ASSET
COMPONENTIZATION
USEFUL LIFE
UG Foundations
36.3.1 Useful Life Data
This section displays the data used to determine the Useful Life Values for Underground Foundations. Five of the interviewed utilities gave Minimum Useful Life (MIN UL) Values and all six of the interviewed utilities gave TUL and MAX UL Values for Underground Foundations (Figure 36-1).

Asset Depreciation Study for the H – APPENDIX - DERIVATION OF USEFUL LIVES
Ontario Energy Board 36. Underground Foundations
KINECTRICS INC - 136 - K-418033-RA-001-R000
30
35
42
60
56
52
80
70
61
0
10
20
30
40
50
60
70
80
90
100
MINIMUM TYPICAL MAXIMUM
Underground Foundations
INDUSTRYOVERALLUTILITIES AVERAGEUtility 1Utility 2Utility 3Utility 4Utility 6
AGE(years)
Figure 36-1 Useful Life Values for Underground Foundations
36.4 Impact of Utilization Factors
Based on the Utility Interviews the composite score and overall impact (high medium, low), if any, of each factor on the typical useful life of Underground Foundations are displayed in Table 36-2.
Table 36-2 - Composite Score for Underground Foundations
Mechanical
Stress
Electrical
Loading
Environmental
Factors
Operating
Practices
Maintenance
Practices
Non-Physical
Factors
Composite
Score48% 6% 54% 13% 13% 48%
Overall
Rating*M NI M L L M
* H = High Impact M = Medium Impact L = Low Impact NI = No Impact
Utilization Factors
36.4.1 Utility Interview Data
This section displays the data used to determine the composite score and overall impact (high, medium, low) of each factor on the typical useful life of Underground Foundations. All six of the interviewed utilities provided their input regarding the UFs for Underground Foundations (Figure 36-2).
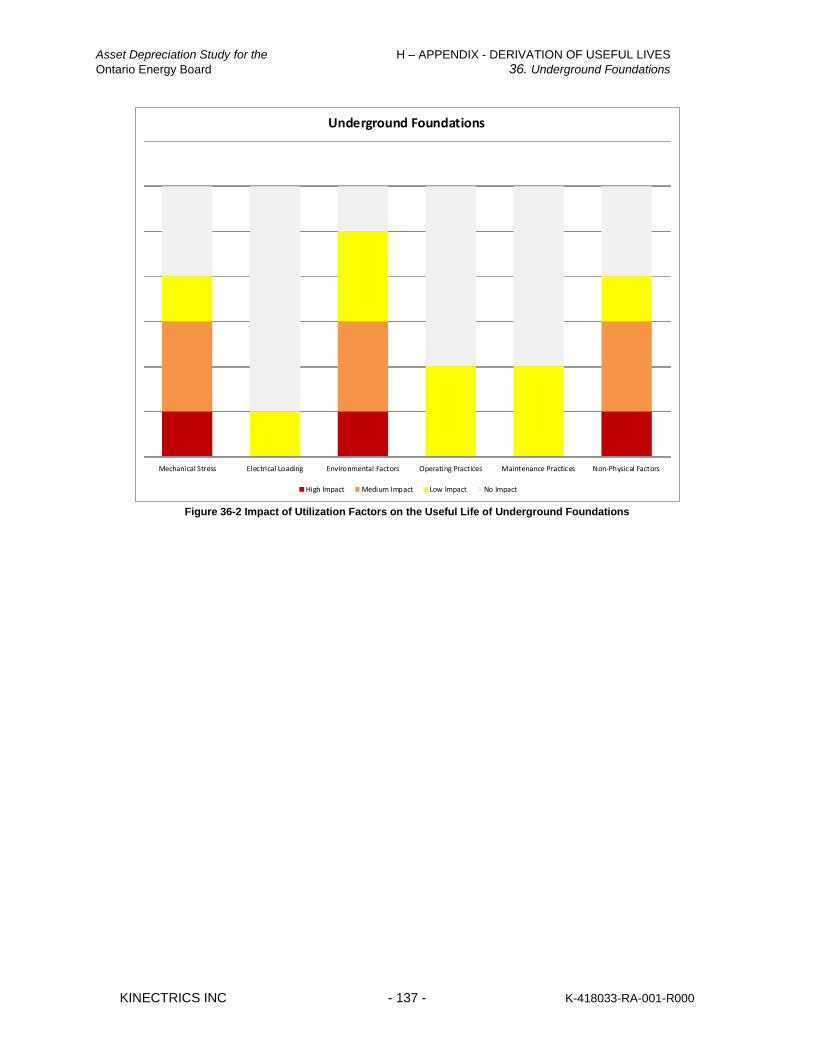
Asset Depreciation Study for the H – APPENDIX - DERIVATION OF USEFUL LIVES
Ontario Energy Board 36. Underground Foundations
KINECTRICS INC - 137 - K-418033-RA-001-R000
Mechanical Stress Electrical Loading Environmental Factors Operating Practices Maintenance Practices Non-Physical Factors
Underground Foundations
High Impact Medium Impact Low Impact No Impact
Figure 36-2 Impact of Utilization Factors on the Useful Life of Underground Foundations

Asset Depreciation Study for the H – APPENDIX - DERIVATION OF USEFUL LIVES
Ontario Energy Board 37. Underground Vaults
KINECTRICS INC - 138 - K-418033-RA-001-R000
37. Underground Vaults
37.1 Asset Description
Equipment vaults permit installation of transformers, switchgear or other equipment. They are often constructed out of reinforced or un-reinforced concrete. Vaults used for transformer installation are often equipped with ventilation grates to provide natural or forced cooling.
37.1.1 Componentization Assumptions
For the purposes of this report, the Underground Vaults has been componentized so that the roof is regarded as separated components. Therefore the Underground Vaults has overall useful life values based and useful life values for the specific component, the roof.
37.1.2 System Hierarchy
Underground Vaults is considered to be a part of the Underground Systems asset grouping.
37.2 Degradation Mechanism
Vaults should be capable of bearing the loads that are applied on them. As such, mechanical strength is a basic end of life parameter for a vault. Although age is loosely related to the condition of underground civil structures, it is not a linear relationship. Other factors such as mechanical loading, exposure to corrosive salts, etc. have a stronger effect. Degradation commonly includes corrosion of reinforcing steel, spalling of concrete, and rusting of covers or rings. Acidic salts (i.e. sulfates or chlorides) affect corrosion rates. In roadways, defects exist when covers are not level with street surfaces. Conditions that lead to flooding, clogged or non-functioning sump pumps also represent major deficiencies.
37.3 Useful Life
Based on the Industry Values and Utility Interviews the Useful Life Values, Minimum (MIN UL), Typical (TUL) and Maximum (MAX UL) for Underground Vaults are displayed in Table 37-1.
Table 37-1 Useful Life Values for Underground Vaults
MIN UL TUL MAX UL
40 60 80
20 30 45Roof
ASSET
COMPONENTIZATION
USEFUL LIFE
Overall
37.3.1 Useful Life Data
This section displays the data used to determine the Useful Life Values for Underground Vaults. Five of the interviewed utilities gave Minimum, Typical and Maximum Useful Life (MIN UL, TUL and MAX UL) Values for Underground Vaults (Figure 37-1).

Asset Depreciation Study for the H – APPENDIX - DERIVATION OF USEFUL LIVES
Ontario Energy Board 37. Underground Vaults
KINECTRICS INC - 139 - K-418033-RA-001-R000
40 4244
60 61 63
80 7876
0
20
40
60
80
100
120
MINIMUM TYPICAL MAXIMUM
UG Vaults
INDUSTRY
OVERALL
UTILITIES AVERAGE
Utility 1
Utility 2
Utility 3
Utility 5
Utility 6
AGE(years)
Figure 37-1 Useful Life Values for Underground Vaults
37.4 Impact of Utilization Factors
Based on the Utility Interviews the composite score and overall impact (high medium, low), if any, of each factor on the typical useful life of Underground Vaults are displayed in Table 37-2.
Table 37-2 - Composite Score for Underground Vaults
Mechanical
Stress
Electrical
Loading
Environmental
Factors
Operating
Practices
Maintenance
Practices
Non-Physical
Factors
Composite
Score58% 0% 63% 15% 23% 43%
Overall
Rating*M NI M L L L
* H = High Impact M = Medium Impact L = Low Impact NI = No Impact
Utilization Factors
37.4.1 Utility Interview Data
This section displays the data used to determine the composite score and overall impact (high, medium, low) of each factor on the typical useful life of Underground Vaults. Five of the interviewed utilities provided their input regarding the UFs for Underground Vaults (Figure 37-2).
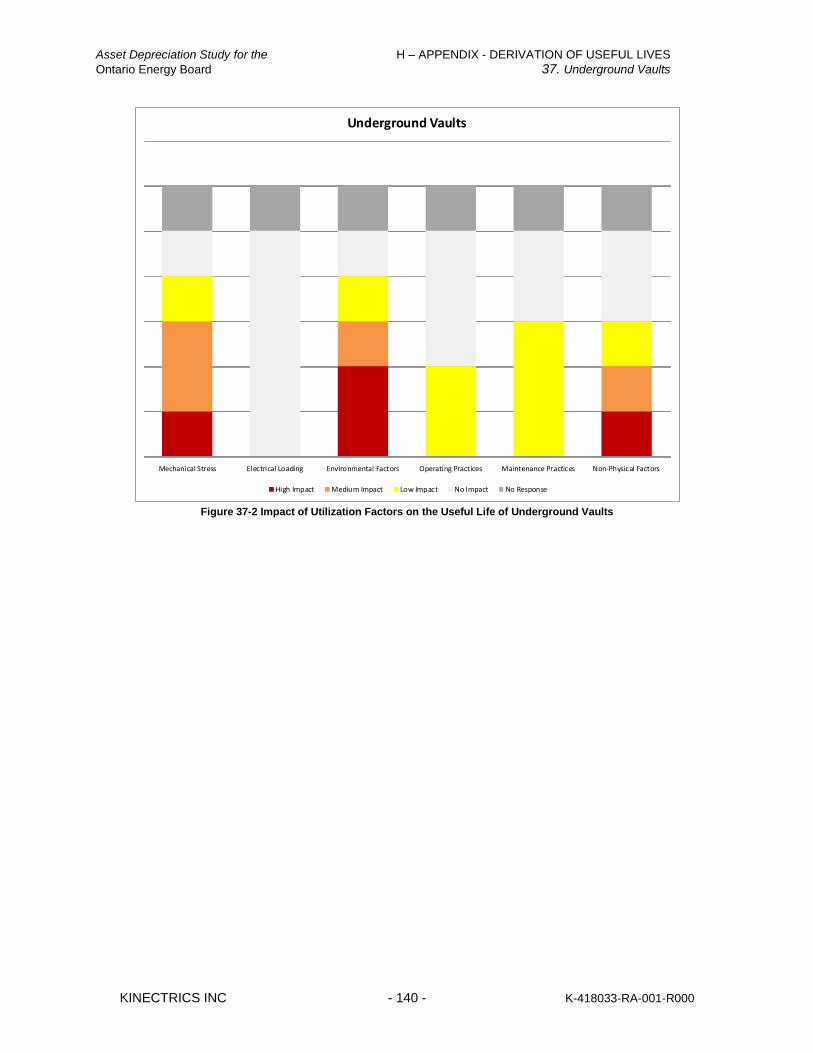
Asset Depreciation Study for the H – APPENDIX - DERIVATION OF USEFUL LIVES
Ontario Energy Board 37. Underground Vaults
KINECTRICS INC - 140 - K-418033-RA-001-R000
Mechanical Stress Electrical Loading Environmental Factors Operating Practices Maintenance Practices Non-Physical Factors
Underground Vaults
High Impact Medium Impact Low Impact No Impact No Response
Figure 37-2 Impact of Utilization Factors on the Useful Life of Underground Vaults
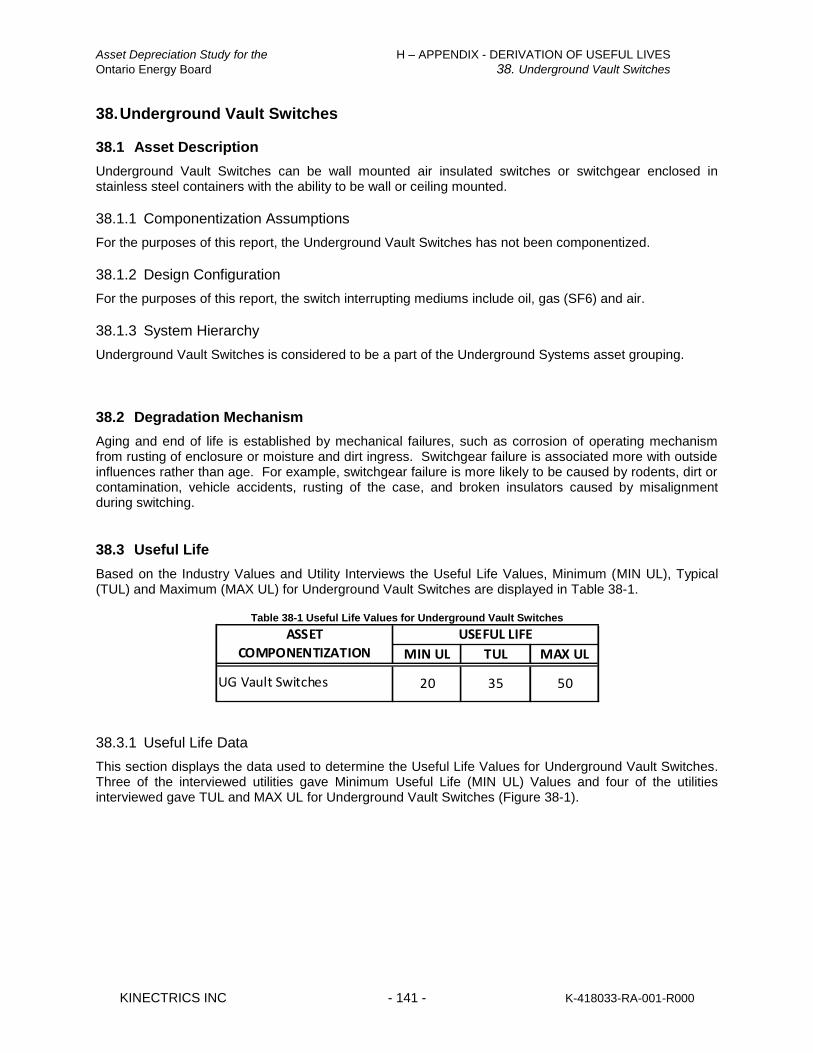
Asset Depreciation Study for the H – APPENDIX - DERIVATION OF USEFUL LIVES
Ontario Energy Board 38. Underground Vault Switches
KINECTRICS INC - 141 - K-418033-RA-001-R000
38. Underground Vault Switches
38.1 Asset Description
Underground Vault Switches can be wall mounted air insulated switches or switchgear enclosed in stainless steel containers with the ability to be wall or ceiling mounted.
38.1.1 Componentization Assumptions
For the purposes of this report, the Underground Vault Switches has not been componentized.
38.1.2 Design Configuration
For the purposes of this report, the switch interrupting mediums include oil, gas (SF6) and air.
38.1.3 System Hierarchy
Underground Vault Switches is considered to be a part of the Underground Systems asset grouping.
38.2 Degradation Mechanism
Aging and end of life is established by mechanical failures, such as corrosion of operating mechanism from rusting of enclosure or moisture and dirt ingress. Switchgear failure is associated more with outside influences rather than age. For example, switchgear failure is more likely to be caused by rodents, dirt or contamination, vehicle accidents, rusting of the case, and broken insulators caused by misalignment during switching.
38.3 Useful Life
Based on the Industry Values and Utility Interviews the Useful Life Values, Minimum (MIN UL), Typical (TUL) and Maximum (MAX UL) for Underground Vault Switches are displayed in Table 38-1.
Table 38-1 Useful Life Values for Underground Vault Switches
MIN UL TUL MAX UL
20 35 50UG Vault Switches
ASSET
COMPONENTIZATION
USEFUL LIFE
38.3.1 Useful Life Data
This section displays the data used to determine the Useful Life Values for Underground Vault Switches. Three of the interviewed utilities gave Minimum Useful Life (MIN UL) Values and four of the utilities interviewed gave TUL and MAX UL for Underground Vault Switches (Figure 38-1).
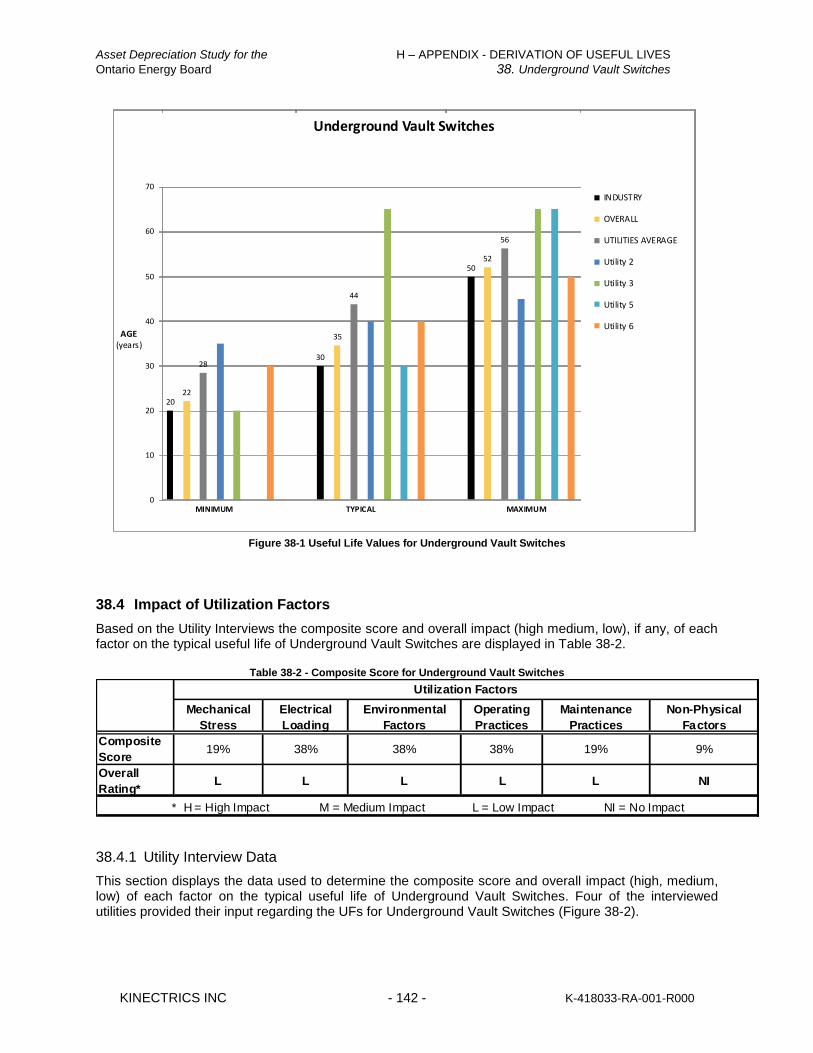
Asset Depreciation Study for the H – APPENDIX - DERIVATION OF USEFUL LIVES
Ontario Energy Board 38. Underground Vault Switches
KINECTRICS INC - 142 - K-418033-RA-001-R000
2022
2830
35
44
5052
56
0
10
20
30
40
50
60
70
MINIMUM TYPICAL MAXIMUM
Underground Vault Switches
INDUSTRY
OVERALL
UTILITIES AVERAGE
Utility 2
Utility 3
Utility 5
Utility 6AGE
(years)
Figure 38-1 Useful Life Values for Underground Vault Switches
38.4 Impact of Utilization Factors
Based on the Utility Interviews the composite score and overall impact (high medium, low), if any, of each factor on the typical useful life of Underground Vault Switches are displayed in Table 38-2.
Table 38-2 - Composite Score for Underground Vault Switches
Mechanical
Stress
Electrical
Loading
Environmental
Factors
Operating
Practices
Maintenance
Practices
Non-Physical
Factors
Composite
Score19% 38% 38% 38% 19% 9%
Overall
Rating*L L L L L NI
* H = High Impact M = Medium Impact L = Low Impact NI = No Impact
Utilization Factors
38.4.1 Utility Interview Data
This section displays the data used to determine the composite score and overall impact (high, medium, low) of each factor on the typical useful life of Underground Vault Switches. Four of the interviewed utilities provided their input regarding the UFs for Underground Vault Switches (Figure 38-2).
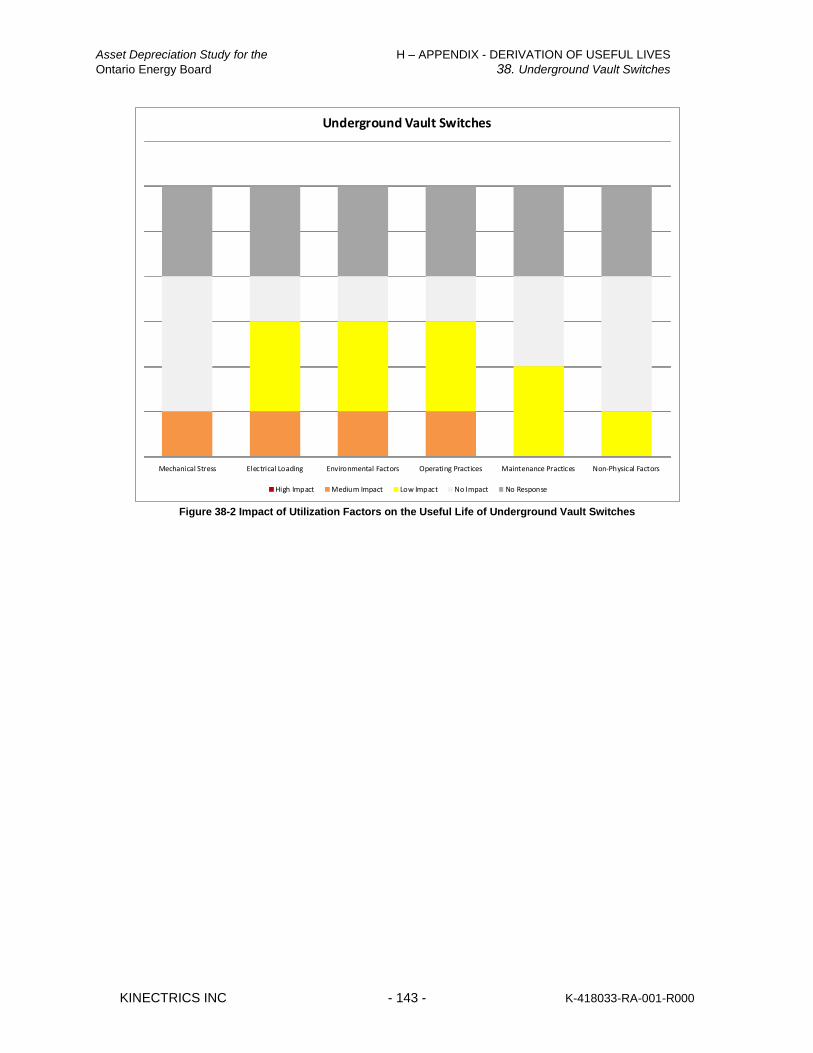
Asset Depreciation Study for the H – APPENDIX - DERIVATION OF USEFUL LIVES
Ontario Energy Board 38. Underground Vault Switches
KINECTRICS INC - 143 - K-418033-RA-001-R000
Mechanical Stress Electrical Loading Environmental Factors Operating Practices Maintenance Practices Non-Physical Factors
Underground Vault Switches
High Impact Medium Impact Low Impact No Impact No Response
Figure 38-2 Impact of Utilization Factors on the Useful Life of Underground Vault Switches
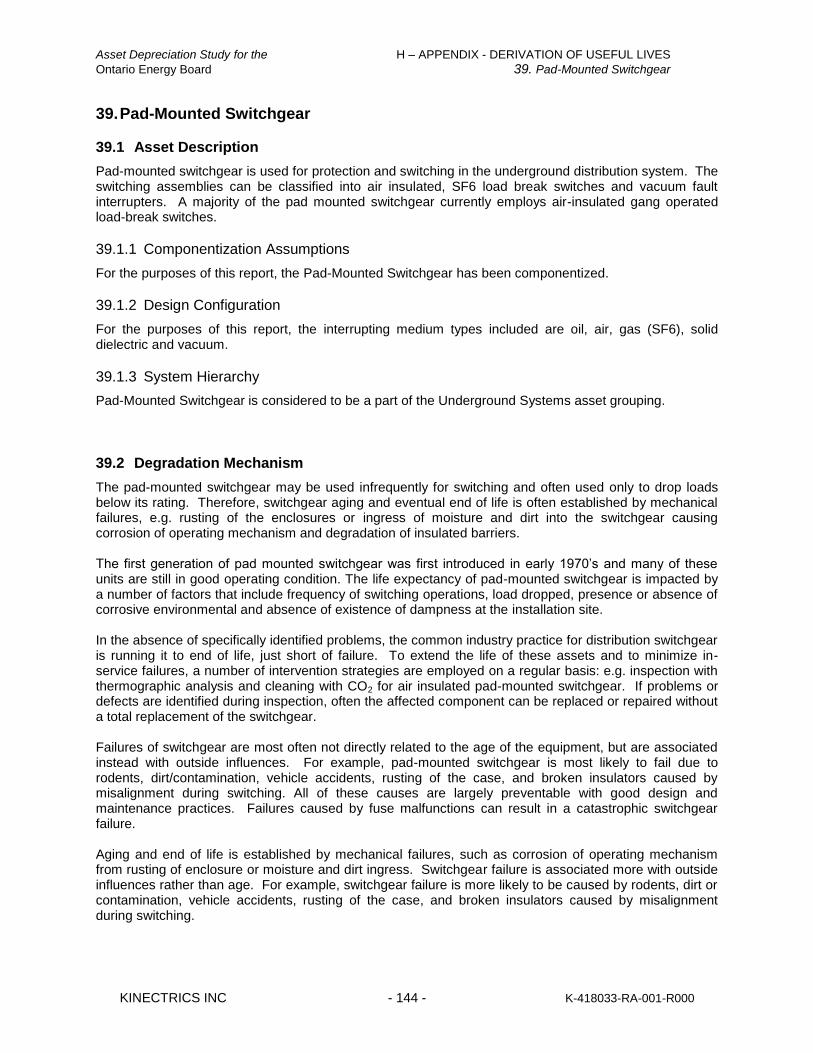
Asset Depreciation Study for the H – APPENDIX - DERIVATION OF USEFUL LIVES
Ontario Energy Board 39. Pad-Mounted Switchgear
KINECTRICS INC - 144 - K-418033-RA-001-R000
39. Pad-Mounted Switchgear
39.1 Asset Description
Pad-mounted switchgear is used for protection and switching in the underground distribution system. The switching assemblies can be classified into air insulated, SF6 load break switches and vacuum fault interrupters. A majority of the pad mounted switchgear currently employs air-insulated gang operated load-break switches.
39.1.1 Componentization Assumptions
For the purposes of this report, the Pad-Mounted Switchgear has been componentized.
39.1.2 Design Configuration
For the purposes of this report, the interrupting medium types included are oil, air, gas (SF6), solid dielectric and vacuum.
39.1.3 System Hierarchy
Pad-Mounted Switchgear is considered to be a part of the Underground Systems asset grouping.
39.2 Degradation Mechanism
The pad-mounted switchgear may be used infrequently for switching and often used only to drop loads below its rating. Therefore, switchgear aging and eventual end of life is often established by mechanical failures, e.g. rusting of the enclosures or ingress of moisture and dirt into the switchgear causing corrosion of operating mechanism and degradation of insulated barriers. The first generation of pad mounted switchgear was first introduced in early 1970’s and many of these units are still in good operating condition. The life expectancy of pad-mounted switchgear is impacted by a number of factors that include frequency of switching operations, load dropped, presence or absence of corrosive environmental and absence of existence of dampness at the installation site. In the absence of specifically identified problems, the common industry practice for distribution switchgear is running it to end of life, just short of failure. To extend the life of these assets and to minimize in-service failures, a number of intervention strategies are employed on a regular basis: e.g. inspection with thermographic analysis and cleaning with CO2 for air insulated pad-mounted switchgear. If problems or defects are identified during inspection, often the affected component can be replaced or repaired without a total replacement of the switchgear. Failures of switchgear are most often not directly related to the age of the equipment, but are associated instead with outside influences. For example, pad-mounted switchgear is most likely to fail due to rodents, dirt/contamination, vehicle accidents, rusting of the case, and broken insulators caused by misalignment during switching. All of these causes are largely preventable with good design and maintenance practices. Failures caused by fuse malfunctions can result in a catastrophic switchgear failure. Aging and end of life is established by mechanical failures, such as corrosion of operating mechanism from rusting of enclosure or moisture and dirt ingress. Switchgear failure is associated more with outside influences rather than age. For example, switchgear failure is more likely to be caused by rodents, dirt or contamination, vehicle accidents, rusting of the case, and broken insulators caused by misalignment during switching.

Asset Depreciation Study for the H – APPENDIX - DERIVATION OF USEFUL LIVES
Ontario Energy Board 39. Pad-Mounted Switchgear
KINECTRICS INC - 145 - K-418033-RA-001-R000
39.3 Useful Life
Based on the Industry Values and Utility Interviews the Useful Life Values, Minimum (MIN UL), Typical (TUL) and Maximum (MAX UL) for Pad-Mounted Switchgear are displayed in Table 39-1.
Table 39-1 Useful Life Values for Pad-Mounted Switchgear
MIN UL TUL MAX UL
20 30 45Pad-Mounted Switchgear
ASSET
COMPONENTIZATION
USEFUL LIFE
39.3.1 Useful Life Data
This section displays the data used to determine the Useful Life Values for Pad-Mounted Switchgear. All six of the interviewed utilities gave Minimum, Typical and Maximum Useful Life (MIN UL, TUL and MAX UL) Values for Pad-Mounted Switchgear (Figure 39-1).
20 20 21
3032
33
50
47
44
0
10
20
30
40
50
60
MINIMUM TYPICAL MAXIMUM
Pad-Mounted Switchgear
INDUSTRY
OVERALL
UTILITIES AVERAGE
Utility 1
Utility 2
Utility 3
Utility 4
Utility 5
Utility 6
AGE
(years)
Figure 39-1 Useful Life Values for Pad-Mounted Switchgear
39.4 Impact of Utilization Factors
Based on the Utility Interviews the composite score and overall impact (high medium, low), if any, of each factor on the typical useful life of Pad-Mounted Switchgear are displayed in Table 39-2.
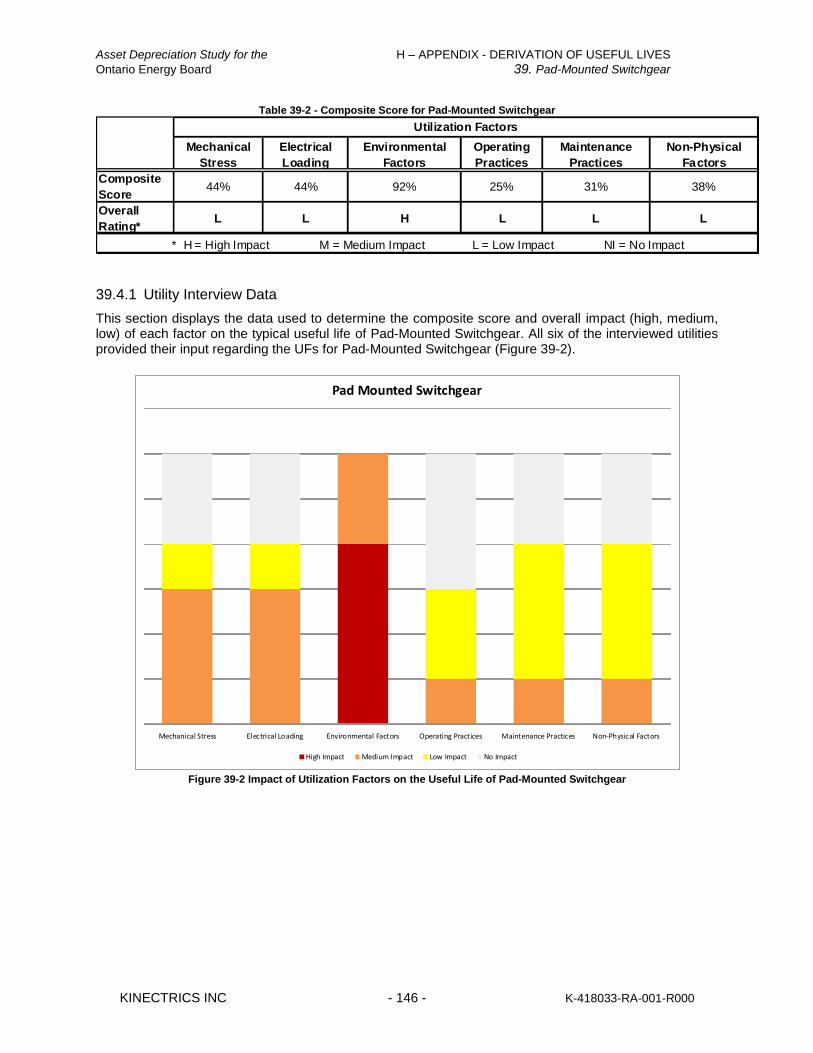
Asset Depreciation Study for the H – APPENDIX - DERIVATION OF USEFUL LIVES
Ontario Energy Board 39. Pad-Mounted Switchgear
KINECTRICS INC - 146 - K-418033-RA-001-R000
Table 39-2 - Composite Score for Pad-Mounted Switchgear
Mechanical
Stress
Electrical
Loading
Environmental
Factors
Operating
Practices
Maintenance
Practices
Non-Physical
Factors
Composite
Score44% 44% 92% 25% 31% 38%
Overall
Rating*L L H L L L
* H = High Impact M = Medium Impact L = Low Impact NI = No Impact
Utilization Factors
39.4.1 Utility Interview Data
This section displays the data used to determine the composite score and overall impact (high, medium, low) of each factor on the typical useful life of Pad-Mounted Switchgear. All six of the interviewed utilities provided their input regarding the UFs for Pad-Mounted Switchgear (Figure 39-2).
Mechanical Stress Electrical Loading Environmental Factors Operating Practices Maintenance Practices Non-Physical Factors
Pad Mounted Switchgear
High Impact Medium Impact Low Impact No Impact
Figure 39-2 Impact of Utilization Factors on the Useful Life of Pad-Mounted Switchgear
Asset Depreciation Study for the H – APPENDIX - DERIVATION OF USEFUL LIVES
Ontario Energy Board 40. Ducts
KINECTRICS INC - 147 - K-418033-RA-001-R000
40. Ducts
40.1 Asset Description
In areas such as road crossings, ducts provide a conduit for underground cables to travel. Ducts are sized as required and are usually two to six inches in diameter.
40.1.1 Componentization Assumptions
For the purposes of this report, the Ducts asset category has not been componentized.
40.1.2 Design Configuration
For the purposes of this report, the duct types included are clay, polyvinyl chloride (PVC), fiber reinforced epoxy (FRE), and high density polyethylene (HDPE).
40.1.3 System Hierarchy
Ducts are considered to be a part of the Underground Systems asset grouping.
40.2 Degradation Mechanism
The ducts connecting one utility chamber to another cannot easily be assessed for condition without excavating areas suspected of suffering failures. However, water ingress to a utility chamber that is otherwise in sound condition is a good indicator of a failure of a portion of the ductwork. Since there are no specific tests that can be conducted to determine duct integrity at reasonable cost, the duct system is typically treated on an ad hoc basis and repaired or replaced as is determined at the time of cable replacement or failure.
40.3 Useful Life
Based on the Industry Values and Utility Interviews the Useful Life Values, Minimum (MIN UL), Typical (TUL) and Maximum (MAX UL) for Ducts are displayed in Table 40-1.
Table 40-1 Useful Life Values for Ducts
MIN UL TUL MAX UL
30 50 85Ducts
ASSET
COMPONENTIZATION
USEFUL LIFE
40.3.1 Useful Life Data
This section displays the data used to determine the Useful Life Values for Ducts. Four of the interviewed utilities gave Minimum Useful Life (MIN UL) Values and five of the utilities interviewed gave TUL and MAX UL Values for Ducts (Figure 40-1).
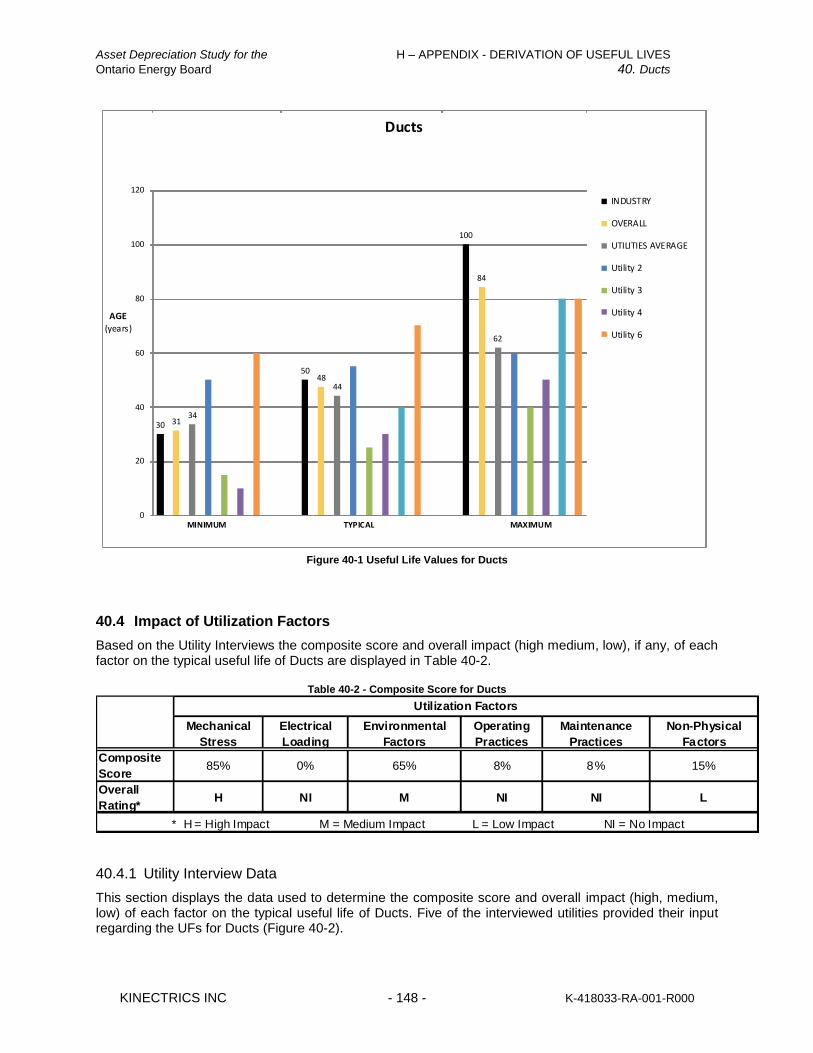
Asset Depreciation Study for the H – APPENDIX - DERIVATION OF USEFUL LIVES
Ontario Energy Board 40. Ducts
KINECTRICS INC - 148 - K-418033-RA-001-R000
30 3134
5048
44
100
84
62
0
20
40
60
80
100
120
MINIMUM TYPICAL MAXIMUM
Ducts
INDUSTRY
OVERALL
UTILITIES AVERAGE
Utility 2
Utility 3
Utility 4
Utility 6
AGE
(years)
Figure 40-1 Useful Life Values for Ducts
40.4 Impact of Utilization Factors
Based on the Utility Interviews the composite score and overall impact (high medium, low), if any, of each factor on the typical useful life of Ducts are displayed in Table 40-2.
Table 40-2 - Composite Score for Ducts
Mechanical
Stress
Electrical
Loading
Environmental
Factors
Operating
Practices
Maintenance
Practices
Non-Physical
Factors
Composite
Score85% 0% 65% 8% 8% 15%
Overall
Rating*H NI M NI NI L
* H = High Impact M = Medium Impact L = Low Impact NI = No Impact
Utilization Factors
40.4.1 Utility Interview Data
This section displays the data used to determine the composite score and overall impact (high, medium, low) of each factor on the typical useful life of Ducts. Five of the interviewed utilities provided their input regarding the UFs for Ducts (Figure 40-2).

Asset Depreciation Study for the H – APPENDIX - DERIVATION OF USEFUL LIVES
Ontario Energy Board 40. Ducts
KINECTRICS INC - 149 - K-418033-RA-001-R000
Mechanical Stress Electrical Loading Environmental Factors Operating Practices Maintenance Practices Non-Physical Factors
Ducts
High Impact Medium Impact Low Impact No Impact No Response
Figure 40-2 Impact of Utilization Factors on the Useful Life of Ducts

Asset Depreciation Study for the H – APPENDIX - DERIVATION OF USEFUL LIVES
Ontario Energy Board 41. Concrete Encased Duct Banks
KINECTRICS INC - 150 - K-418033-RA-001-R000
41. Concrete Encased Duct Banks
41.1 Asset Description
In areas such as road crossings, ducts provide a conduit for underground cables to travel. They are comprised of a number of ducts, in trench, and typically encased in concrete.
41.1.1 Componentization Assumptions
For the purposes of this report, the Concrete Encased Duct Banks asset category has not been componentized.
41.1.2 System Hierarchy
Concrete Encased Duct Banks are considered to be a part of the Underground Systems asset grouping.
41.2 Degradation Mechanism
The ducts connecting one utility chamber to another cannot easily be assessed for condition without excavating areas suspected of suffering failures. However, water ingress to a utility chamber that is otherwise in sound condition is a good indicator of a failure of a portion of the ductwork. Since there are no specific tests that can be conducted to determine duct integrity at reasonable cost, the duct system is typically treated on an ad hoc basis and repaired or replaced as is determined at the time of cable replacement or failure.
41.3 Useful Life
Based on the Industry Values and Utility Interviews the Useful Life Values, Minimum (MIN UL), Typical (TUL) and Maximum (MAX UL) for Concrete Encased Duct Banks are displayed in Table 41-1
Table 41-1 Useful Life Values for Concrete Encased Duct Banks
MIN UL TUL MAX UL
35 55 80Concrete Encased Duct
Banks
ASSET
COMPONENTIZATION
USEFUL LIFE
41.3.1 Useful Life Data
This section displays the data used to determine the Useful Life Values for Concrete Encased Duct Banks. Five of the interviewed utilities gave Minimum Useful Life (MIN UL) Values and all six of the utilities interviewed gave TUL and MAX UL Values for Concrete Encased Duct Banks (Figure 41-1).
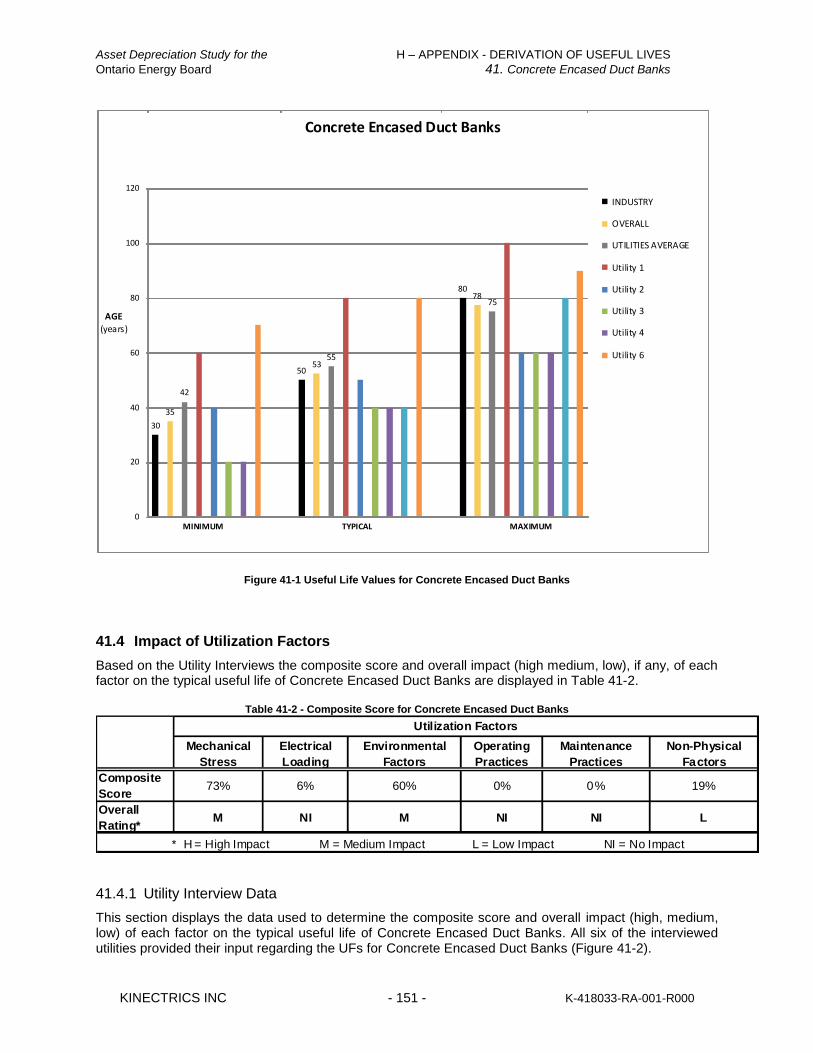
Asset Depreciation Study for the H – APPENDIX - DERIVATION OF USEFUL LIVES
Ontario Energy Board 41. Concrete Encased Duct Banks
KINECTRICS INC - 151 - K-418033-RA-001-R000
30
35
42
5053
55
8078
75
0
20
40
60
80
100
120
MINIMUM TYPICAL MAXIMUM
Concrete Encased Duct Banks
INDUSTRY
OVERALL
UTILITIES AVERAGE
Utility 1
Utility 2
Utility 3
Utility 4
Utility 6
AGE
(years)
Figure 41-1 Useful Life Values for Concrete Encased Duct Banks
41.4 Impact of Utilization Factors
Based on the Utility Interviews the composite score and overall impact (high medium, low), if any, of each factor on the typical useful life of Concrete Encased Duct Banks are displayed in Table 41-2.
Table 41-2 - Composite Score for Concrete Encased Duct Banks
Mechanical
Stress
Electrical
Loading
Environmental
Factors
Operating
Practices
Maintenance
Practices
Non-Physical
Factors
Composite
Score73% 6% 60% 0% 0% 19%
Overall
Rating*M NI M NI NI L
* H = High Impact M = Medium Impact L = Low Impact NI = No Impact
Utilization Factors
41.4.1 Utility Interview Data
This section displays the data used to determine the composite score and overall impact (high, medium, low) of each factor on the typical useful life of Concrete Encased Duct Banks. All six of the interviewed utilities provided their input regarding the UFs for Concrete Encased Duct Banks (Figure 41-2).
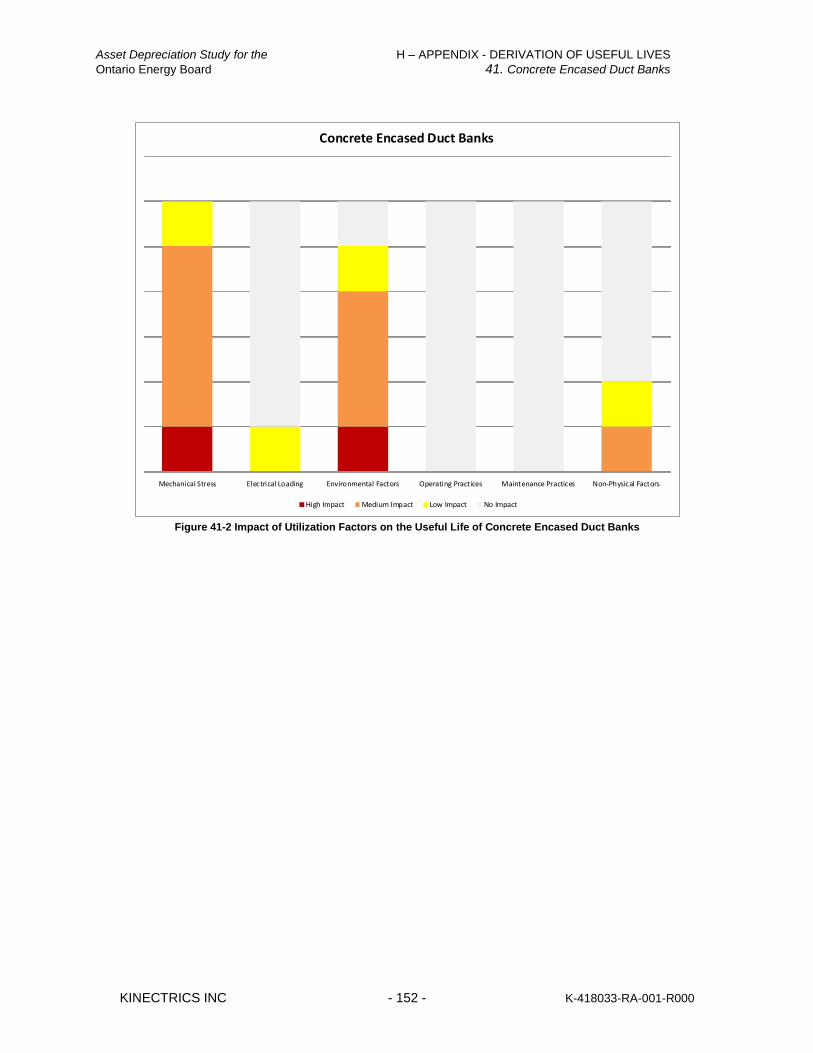
Asset Depreciation Study for the H – APPENDIX - DERIVATION OF USEFUL LIVES
Ontario Energy Board 41. Concrete Encased Duct Banks
KINECTRICS INC - 152 - K-418033-RA-001-R000
Mechanical Stress Electrical Loading Environmental Factors Operating Practices Maintenance Practices Non-Physical Factors
Concrete Encased Duct Banks
High Impact Medium Impact Low Impact No Impact
Figure 41-2 Impact of Utilization Factors on the Useful Life of Concrete Encased Duct Banks
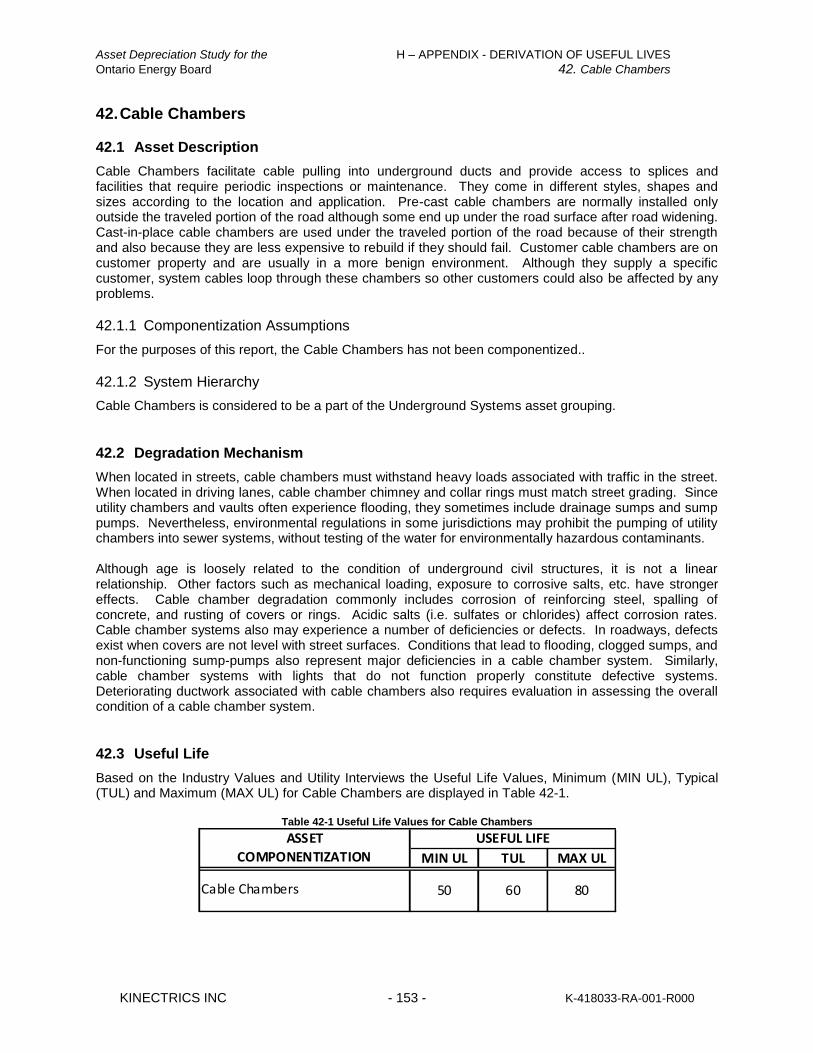
Asset Depreciation Study for the H – APPENDIX - DERIVATION OF USEFUL LIVES
Ontario Energy Board 42. Cable Chambers
KINECTRICS INC - 153 - K-418033-RA-001-R000
42. Cable Chambers
42.1 Asset Description
Cable Chambers facilitate cable pulling into underground ducts and provide access to splices and facilities that require periodic inspections or maintenance. They come in different styles, shapes and sizes according to the location and application. Pre-cast cable chambers are normally installed only outside the traveled portion of the road although some end up under the road surface after road widening. Cast-in-place cable chambers are used under the traveled portion of the road because of their strength and also because they are less expensive to rebuild if they should fail. Customer cable chambers are on customer property and are usually in a more benign environment. Although they supply a specific customer, system cables loop through these chambers so other customers could also be affected by any problems.
42.1.1 Componentization Assumptions
For the purposes of this report, the Cable Chambers has not been componentized..
42.1.2 System Hierarchy
Cable Chambers is considered to be a part of the Underground Systems asset grouping.
42.2 Degradation Mechanism
When located in streets, cable chambers must withstand heavy loads associated with traffic in the street. When located in driving lanes, cable chamber chimney and collar rings must match street grading. Since utility chambers and vaults often experience flooding, they sometimes include drainage sumps and sump pumps. Nevertheless, environmental regulations in some jurisdictions may prohibit the pumping of utility chambers into sewer systems, without testing of the water for environmentally hazardous contaminants. Although age is loosely related to the condition of underground civil structures, it is not a linear relationship. Other factors such as mechanical loading, exposure to corrosive salts, etc. have stronger effects. Cable chamber degradation commonly includes corrosion of reinforcing steel, spalling of concrete, and rusting of covers or rings. Acidic salts (i.e. sulfates or chlorides) affect corrosion rates. Cable chamber systems also may experience a number of deficiencies or defects. In roadways, defects exist when covers are not level with street surfaces. Conditions that lead to flooding, clogged sumps, and non-functioning sump-pumps also represent major deficiencies in a cable chamber system. Similarly, cable chamber systems with lights that do not function properly constitute defective systems. Deteriorating ductwork associated with cable chambers also requires evaluation in assessing the overall condition of a cable chamber system.
42.3 Useful Life
Based on the Industry Values and Utility Interviews the Useful Life Values, Minimum (MIN UL), Typical (TUL) and Maximum (MAX UL) for Cable Chambers are displayed in Table 42-1.
Table 42-1 Useful Life Values for Cable Chambers
MIN UL TUL MAX UL
50 60 80Cable Chambers
ASSET
COMPONENTIZATION
USEFUL LIFE

Asset Depreciation Study for the H – APPENDIX - DERIVATION OF USEFUL LIVES
Ontario Energy Board 42. Cable Chambers
KINECTRICS INC - 154 - K-418033-RA-001-R000
42.3.1 Useful Life Data
This section displays the data used to determine the Useful Life Values for Cable Chambers. Five of the interviewed utilities gave Minimum (Min UL) Values and all six of the utilities interviewed gave TUL and MAX UL for Cable Chambers (Figure 42-1).
5048
44
60 60 59
80 79 78
0
20
40
60
80
100
120
MINIMUM TYPICAL MAXIMUM
Cable Chambers
INDUSTRY
OVERALL
UTILITIES AVERAGE
Utility 1
Utility 2
Utility 3
Utility 4
Utility 6
AGE(years)
Figure 42-1 Useful Life Values for Cable Chambers
42.4 Impact of Utilization Factors
Based on the Utility Interviews the composite score and overall impact (high medium, low), if any, of each factor on the typical useful life of Cable Chambers are displayed in Table 42-2.

Asset Depreciation Study for the H – APPENDIX - DERIVATION OF USEFUL LIVES
Ontario Energy Board 42. Cable Chambers
KINECTRICS INC - 155 - K-418033-RA-001-R000
Table 42-2 - Composite Score for Cable Chambers
Mechanical
Stress
Electrical
Loading
Environmental
Factors
Operating
Practices
Maintenance
Practices
Non-Physical
Factors
Composite
Score58% 0% 92% 0% 19% 6%
Overall
Rating*M NI H NI L NI
* H = High Impact M = Medium Impact L = Low Impact NI = No Impact
Utilization Factors
42.4.1 Utility Interview Data
This section displays the data used to determine the composite score and overall impact (high, medium, low) of each factor on the typical useful life of Cable Chambers. All six of the interviewed utilities provided their input regarding the UFs for Cable Chambers (Figure 42-2).
Mechanical Stress Electrical Loading Environmental Factors Operating Practices Maintenance Practices Non-Physical Factors
Cable Chambers
High Impact Medium Impact Low Impact No Impact
Figure 42-2 Impact of Utilization Factors on the Useful Life of Cable Chambers

Asset Depreciation Study for the H – APPENDIX - DERIVATION OF USEFUL LIVES
Ontario Energy Board 43. Remote Supervisory Control and Data Acquisition
KINECTRICS INC - 156 - K-418033-RA-001-R000
43. Remote Supervisory Control and Data Acquisition
43.1 Asset Description
Supervisory Control and Data Acquisition (SCADA) refers to the centralized monitoring and control system of a facility. SCADA remote terminal units (RTUs) allow the master SCADA system to communication, often wirelessly, with field equipment. In general, RTUs collect digital and analog data from equipment, exchange information to the master system, and perform control functions on field devices. They are typically comprised of the following: power supply, CPU, I/O Modules, housing and chassis, communications interface, and software.
43.1.1 Componentization Assumptions
For the purposes of this report, the Remote Supervisory Control and Data Acquisition asset category has not been componentized.
43.1.2 System Hierarchy
Remote Supervisory Control and Data Acquisition is considered to be a part of the Monitoring and Control Systems asset grouping.
43.2 Degradation Mechanism
There are many factors that contribute to the end-of-life of RTUs. Utilities may choose to upgrade or replace older units that are no longer supported by vendors or where spare parts are no longer available. Because RTUs are essentially computer devices, they are prone to obsolescence. For example, older units may lack the ability to interface with Intelligent Electronic Devices (IEDs), be unable to support newer or modern communications media and/or protocols, or not allow for the quantity, resolution and accuracy of modern data acquisition. Legacy units may have limited ability of multiple master communication ports and protocols, or have an inability to segregate data into multiple RTU addresses based on priority.
43.3 Useful Life
Based on the Industry Values and Utility Interviews the Useful Life Values, Minimum (MIN UL), Typical (TUL) and Maximum (MAX UL) for Remote Supervisory Control and Data Acquisition are displayed in Table 43-1.
Table 43-1 Useful Life Values for Remote Supervisory Control and Data Acquisition
MIN UL TUL MAX UL
15 20 30Remote SCADA
ASSET
COMPONENTIZATION
USEFUL LIFE
43.3.1 Useful Life Data
This section displays the data used to determine the Useful Life Values for Remote Supervisory Control and Data Acquisition. Five of the interviewed utilities gave Minimum, Typical and Maximum Useful Life (MIN UL, TUL and MAX UL) Values for Remote Supervisory Control and Data Acquisition (Figure 43-1).

Asset Depreciation Study for the H – APPENDIX - DERIVATION OF USEFUL LIVES
Ontario Energy Board 43. Remote Supervisory Control and Data Acquisition
KINECTRICS INC - 157 - K-418033-RA-001-R000
10
13
17
2021
23
3029
28
0
5
10
15
20
25
30
35
40
MINIMUM TYPICAL MAXIMUM
Remote SCADA
INDUSTRY
OVERALL
UTILITIES AVERAGE
Utility 1
Utility 2
Utility 3
Utility 4
Utility 5
Utility 6
AGE(years)
Figure 43-1 Useful Life Values for Remote Supervisory Control and Data Acquisition
43.4 Impact of Utilization Factors
Based on the Utility Interviews the composite score and overall impact (high medium, low), if any, of each factor on the typical useful life of Remote Supervisory Control and Data Acquisition are displayed in Table 43-2.
Table 43-2 - Composite Score for Remote Supervisory Control and Data Acquisition
Mechanical
Stress
Electrical
Loading
Environmental
Factors
Operating
Practices
Maintenance
Practices
Non-Physical
Factors
Composite
Score0% 0% 19% 0% 44% 95%
Overall
Rating*NI NI L NI L H
* H = High Impact M = Medium Impact L = Low Impact NI = No Impact
Utilization Factors
43.4.1 Utility Interview Data
This section displays the data used to determine the composite score and overall impact (high, medium, low) of each factor on the typical useful life of Remote Supervisory Control and Data Acquisition. Five of the interviewed utilities provided their input regarding the UFs for Remote Supervisory Control and Data Acquisition (Figure 43-2).
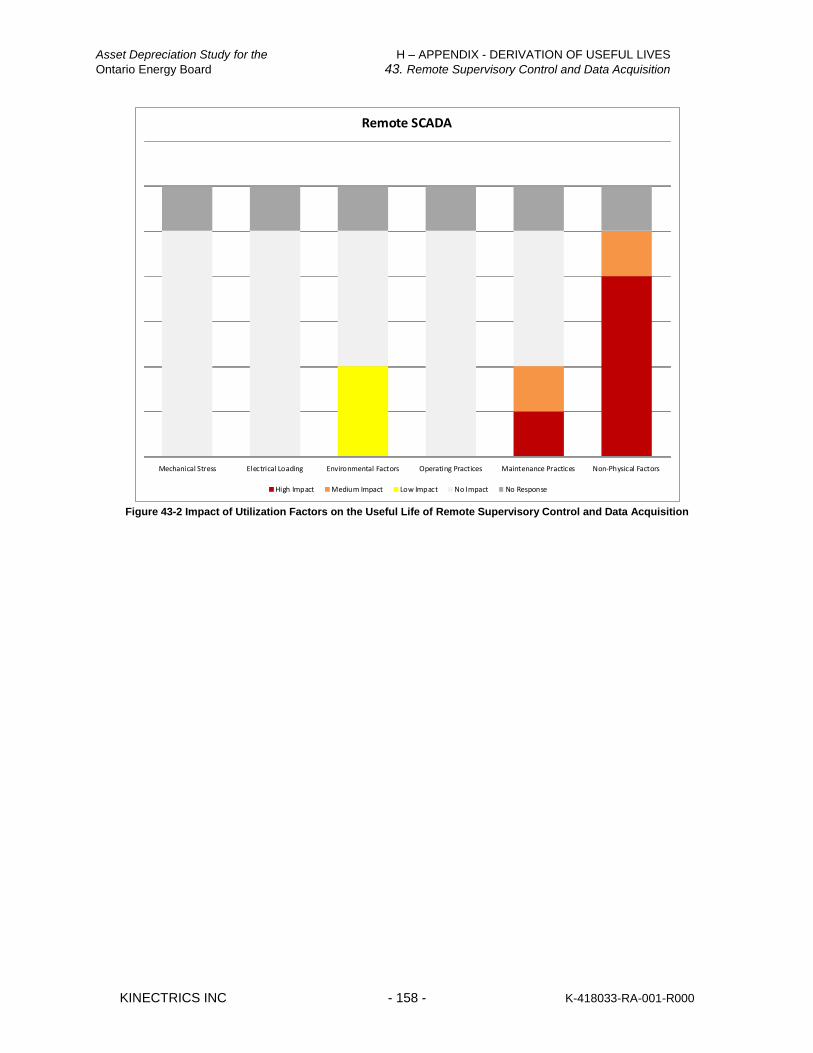
Asset Depreciation Study for the H – APPENDIX - DERIVATION OF USEFUL LIVES
Ontario Energy Board 43. Remote Supervisory Control and Data Acquisition
KINECTRICS INC - 158 - K-418033-RA-001-R000
Mechanical Stress Electrical Loading Environmental Factors Operating Practices Maintenance Practices Non-Physical Factors
Remote SCADA
High Impact Medium Impact Low Impact No Impact No Response
Figure 43-2 Impact of Utilization Factors on the Useful Life of Remote Supervisory Control and Data Acquisition

Asset Depreciation Study for the I – APPENDIX – PERCENT OF ASSETS IN THE USEFUL LIFE RANGE Ontario Energy Board
KINECTRICS INC - 159 - K-418033-RA-001-R000
I APPENDIX – PERCENT OF ASSETS IN THE USEFUL LIFE RANGE
This Appendix describes the statistical analysis that was performed to estimate the percentage of assets that fall within the useful life range (MIN UL – MAX UL). Note that the values of MIN UL and MAX UL were determined using industry research and utility interviews. The statistical analysis estimates the percentage of an a asset population that will fall in the useful life range. The following is discussed:
Review of definitions
Assumptions used in useful life analysis
Useful life range coverage
Sample calculation of useful life range
Definitions used in Useful Life Analysis for Utility Asset Groups
End-of-life - An asset reaches its end-of-life when it is considered unable to perform its functions as designed physically. Useful Life Range (MIN UL – MAX UL) - The asset life range that covers the end-of-life year data for the majority of the population in a specific asset group. Typical useful life (TUL) - The value that corresponds to the peak of failure probability density function (useful life distribution function in this project) for a specific asset category, assuming the failure distribution is of unimodal type (i.e. with only one global maximum). In mathematics, this value is called the mode. It is the value of end-of-life year datum that is most likely to be sampled at a single sampling, or the value that appears most frequently at a group sampling.
Mean useful life () - Probability weighted average value. It is the arithmetic average value of the end-of-life year data for a group of sampled assets, provided that the sample size is sufficiently large and representative. Minimum useful life (MIN UL) - The lower set value of useful life range. It refers to the age when a small percentage of assets reaches the physical end-of-life. In this project, it is defined as
MIN UL = – k (Equation 1)
Where k = √3 (defined in later section) standard deviation of useful life distribution
Maximum useful life (MAX UL) The upper set value of useful life range. It refers to the age when most of assets reach the physical end-of-life. In this project, it is defined as
MAX UL = + k (Equation 2)
Where k = √3 (defined in later section) standard deviation of useful life distribution

Asset Depreciation Study for the I – APPENDIX – PERCENT OF ASSETS IN THE USEFUL LIFE RANGE Ontario Energy Board
KINECTRICS INC - 160 - K-418033-RA-001-R000
Useful lifeTypical
MaximumMinimum
Useful life
distribution
Mean
k k
Assumptions in Useful Life Analysis for Utility Asset Groups
To facilitate the analysis on useful life range coverage for utility asset groups, the following assumptions are made based on the information obtained during utility interviews as well as the character of various types of asset groups.
A. In a utility, there are always some asset groups that have their useful life distribution curve
severely skewed to the either end of useful life range.
B. For all asset categories, the useful lives distribution is such that the mean (µ) is within k x
standard deviation ( from MIN UL and MAX UL, regardless of where TUL is relative to the mean
(µ).
C. For any specific asset group, the typical useful life is always captured within the useful life range.
D. For some asset groups, the typical values coincide with either minimum or maximum useful life
values.
Assumption A is based on the fact that, due to different degradation mechanisms and operation modes, some of the asset groups have some predominant factors than exclusively determine the probability of failure of the asset group, thus making the asset end-of-life not follow normal distribution or other symmetrical distributions. Assumption B is expanded from the special case where the asset end-of-life follows normal distribution. Under such condition, a utility needs to assign the same k coefficient to ensure that there is always a fixed percentage of asset population that is covered by the useful life range, regardless of how much the standard deviation is. If it is agreed that the same k coefficient is also adopted for the non symmetrical distribution, assumption B can be validated. Assumptions C and D are validated by the results of interviews with various utilities. In mathematics, it can be proven that the difference between the mean and the mode of a unimodal
distribution is less than or equal to the square root of three times the standard deviation ( ).
With assumptions A, B and C, it can be concluded that the k coefficients should be greater than or equal
to , applicable to all the asset groups.

Asset Depreciation Study for the I – APPENDIX – PERCENT OF ASSETS IN THE USEFUL LIFE RANGE Ontario Energy Board
KINECTRICS INC - 161 - K-418033-RA-001-R000
With all the above assumptions validated, it is reasonable to conclude that the useful life range provided
by utilities is within the interval between - and + .
Useful Life Range Coverage
For any uni-modal useful life distribution, the coverage of a specific useful life range can be calculated using Chebyshev’s inequality. Chebyshev’s Inequality
Let X be a random variable with mean value μ and finite variance σ2. Then for any real number k > 1,
where the above inequality refers to the probability of the shadowed area in the following diagram.
X
MaximumMinimum
F(X)
k k Therefore the coverage of a useful life range is 1-1/k
2.
For the useful life range specified in the previous section, it can be estimated that the range covers at
least of the whole population.
In case the useful life distribution is close to normal distribution for some asset groups, the percentage of data covered by the useful life range is determined by:
Where erf is the error function defined as
At k = , it can be calculated that the useful life range covers of the whole population.
In general, the percentage of the whole population covered by the useful life range defined in this study is between 66.7% and 91.7%.

Asset Depreciation Study for the I – APPENDIX – PERCENT OF ASSETS IN THE USEFUL LIFE RANGE Ontario Energy Board
KINECTRICS INC - 162 - K-418033-RA-001-R000
(This page has been intentionally left blank).

Asset Depreciation Study for the J – REFERENCES Ontario Energy Board
KINECTRICS INC - 163 - K-418033-RA-001-R000
J REFERENCES
[1] ABB, The Magnetically Actuated Circuit Breaker Reality, 1999
[2] Asenjo, J.C., Security in Automated Transmission and Distribution Systems, Authorization, Authentication, Integrity and Confidentiality, CISSP
[3] Australia, Buried Galvanized Steel, Industrial Galvanizers
[4] Barber, K. W. & Marazzato, H., Reliable Undergrounding of Electricity Supply in Asia, Olex Australia Pty Ltd, Asia Pacific Conference on MV Power Cable Technologies , 2005
[5] Birtwhistle, D. et. al. Application of Advanced Chemical Analysis Techniques to the Assessment of Composite Insulator Condition, CIGRE Session 2000
[6] Blake UK, Galvanizing, Which Protective Finish Do I Need on my Brackets
[7] Bradley, I. et al., Life-Cycle Management for System Protection, Hydro One Network Inc. 2007
[8] BRE et al., Key Application - Utility Poles/Telecommunication Masts/Airport Fences; PRECASTsearch, Structural precast concrete
[9] Calitz, J., Overhead Conductor Corrosion Study, dissertation at Tshwane University of Technology 2004
[10] Capiel Electric, Switchgear and SF6 Gas, HV-ESDD1-R1-1.02, 2002
[11] CIGRE WG 37.27, Ageing of the System: Impact on Planning, CIGRE Technical Brochure 176, December 2000, Paris.
[12] Clare, Advantages of Solid State Relays over Electro-Mechanical Relays, AN-145-R01, 2007
[13] Custom Power Company, BCF1 and BCF3 – Filtered Battery Chargers, Custom Power Company
[14] Dias, W.P.S., Useful Life of Buildings University of Moratuwa, 2003
[15] Eaton Corporation, Power System Studies, Field Services & Retrofits, Eaton Corporation, 2007
[16] EDA, Electricity Distribution Association Commentary on OEB’s Discussion Paper
[17] Edward II, W., A Perceptional Comparison of Wood in Separate Infrastructure Markets, Master’s Thesis, Virginia Tech, 1997
[18] ElectraNet, ElectraNet Consultance Services: Assessment of Asset Lives, May 2007
[19] EPRI, EPRI Distribution Cable Research Digest 2000, Electric Power Research Institute, Publication BR-110693, 1998
[20] Evaluation of substation communication architecture design, reliability and availability based on new IEC61850 standards (2008 – 2011)
[21] Fleischer, L.J, New Concept for Medium Voltage Gas Insulated Switchgear (GIS), Siemens, Electricity + Control, IDC Technologies, May 1999
Asset Depreciation Study for the J – REFERENCES Ontario Energy Board
KINECTRICS INC - 164 - K-418033-RA-001-R000
[22] Fleming, R. et al., In Service Performance Of EPR Cables Installed In The MLGW Electrical Distribution System, Insulated Conductor Committee, 2005
[23] Fortis Alberta, Capital vs. Expense – Review to Capitalized Maintenance Programs, FortisAlberta Inc., 2004
[24] Frear, D., Adjustment to Rates and Terms for Preexisting Subscriptions and Satellite Digital Audio Radio Services, Written Direct Testimony 2006
[25] General Electric Company, GE VR-1 Voltage Regulator, 2000
[26] Gill, P., Electrical Power Equipment Maintenance and Testing, CRC Press 2009
[27] Gouvea, M. R. et al., Design of Underground Vaults with Thermal Simulation of Transformer, 19th International Conference on Electricity Distribution, May 2007
[28] Havard, D.G et al, Aged ACSR Conductors Part II: Prediction of Remaining Life, IEEE Transactions on Power Delivery, vol. 7, no. 2, April 1992
[29] Hendley, G. D., Cold Shrink Termination Speeds Cable Installation, Texas Utilities Electric
[30] HindlePower, AT30 Series: Float Battery Chargers 3 Phase Input, HindlePower Inc.
[31] Hopkinson, P.J., Electrical Contacts for Off-Circuit Tap Changers for Oil Immersed Transformers, Technical Report for IEE/PES Transformers Committee, Denergized Tap Changers Working Group, 2005
[32] Hulsman, T. et al, 70 Years Experience with PVC Pipes, European Vinyl Corporation (Deautchland) GmbH
[33] IEEE, IEEE PES Transmission and Distribution Conference and Exposition Latin America, IEEE, 2006
[34] IP Sensing, Utility Guarantee for IP Sensing AMR/SCADA Products, IP Sensing Inc.
[35] Kinectrics, Due Diligence Review of Asset Condition and Operational and Environmental Issues, Kinectrics Inc, K-013945, 2008
[36] Kinectrics, Equipment Assessment Methodology, Kinectrics Inc, K-015268, 2008
[37] Kinectrics, Samtech, Analysis of ComEd Cross Arm Failure, Kinectrics Inc, August 23, 2007
[38] Kinectrics, Useful Life of Transmission/Distribution System Assets and Their Components, Kinectrics Inc., K-418238, 2009
[39] Lanan, K., Water Trees, Failure Mechanisms, and Management Strategies for Ageing Power Cables, Util-X, USA. Presented at E21C Conference, Brisbane, Australia, August 22, 2005.
[40] Landis + Gyr, Mandatory Rollout of Interval Meters for Electricity Customers, Draft Decision, Australia, 2004
[41] Le Bars, H., SF6 Switchgear Complies with Sustainable Environment, Schneider Electric, 2004
[42] Li, H., 7th Framework Programme - FP7, 2007
Asset Depreciation Study for the J – REFERENCES Ontario Energy Board
KINECTRICS INC - 165 - K-418033-RA-001-R000
[43] Lord, T. & Hodge Lord, G., On-Line Monitoring Technology Applied to HV Bushings, Lord Consulting 2005
[44] Marazzato, H. & Barber, K., Designs and Reliability of Underground Cables and Systems, Australian Power Transmission & Distribution magazine, Olex Engineering
[45] McDonald, G., Steel Pole Basic Training, Transmission & Distribution World 2006
[46] Naylor, P., Medium Voltage Cables Life Expectancy, General Cable New Zealand
[47] Newfoundland Power, Substation Strategic Plan, Newfoundland Power, 2006
[48] Oates, C. et al., Tapchanger for Distributed Power, 19th International Conference on Electricity Distribution CIRED 2007, May 2007
[49] Oliver, D., Steel Pole Pilot Program Sets New Standard at Arizona Public Service, Arizona Public Service
[50] Ontario Distribution System Code, March 15, 2009
[51] Piper, J.E., Handbook of Facility Assessment, Fairmont Press Inc., 2004
[52] Polimac, J. & Rahim, A., Numerical Relays – Where Are We Now, PB Power UK, 19th International conference on electricity distribution, Vienna, 2007
[53] Powertrusion International, Utility Pole Material Comparison, Powertrusion International Inc.
[54] Rempe, C., A Technical Report on the Service Life of Ground Rod Electrodes, ERICO, Inc., July 2003
[55] Renz, R., et. al., Vacuum Interrupts – Sealed for Life, 19th Century Conference on Electricity Distribution, May 2007
[56] Rockwell Automation, Solid State Relays, Rockwell Automation, 2009
[57] Roden, M., Composite Pole Support the Circuit of the Future, Southern California Edison, 2008
[58] Rolnd, N. and Magnier, P., Transformer Explosion and Fire, Guideline for Damage Cost Evaluation – Transformer Protector Financial Benefit, SERGI, 2004
[59] Shah, A. et al., Mechanisms to Provide Integrity in SCADA and PCS Devices, Carnegie Mellon University
[60] Sleeman Consulting, Coal Seam Gas Supply System - Screening of Potential Hazards, Sleeman Consulting, 2009
[61] Smekalov, Condition Assessment and Life Time Extension of Power Transformers, CIGRE session 2002
[62] TAMCO, 22kV Withdrawable Air Insulated Switchgear, TAMCO Ltd.
[63] Technical Bulletin of North American Wood Pole Council, Estimate Service Life of Wood Poles, 2008
[64] Thompson, M. J., Auxiliary DC Control Power System Design for Substations, SEL, 2007

Asset Depreciation Study for the J – REFERENCES Ontario Energy Board
KINECTRICS INC - 166 - K-418033-RA-001-R000
[65] Tower Talk Mall Reflector, Choosing Guy Wire, 2000
[66] Wan, N., Exceeding the 60 Year Life Expectancy from an Electronic Energy Meter, Metering Asia Pacific Conference, 2001
[67] Weidmann, J.S., Bushing Failure Rates/Mechanisms etc., 2002 LV Conference Presentation, 2002