assimaplc consolidated report and financial statements · pdf fileassimaplc consolidated...
TRANSCRIPT
ASSIMAPLC
CONSOLIDATED REPORT AND FINANCIAL STATEMENTS
FOR THE YEAR ENDED
31 DECEMBER 2012
Company No: 04426643
ASSIMAPLC
CONSOLIDATED REPORT AND FINANCIAL STATEMENTS
YEAR ENDED 31 DECEMBER 2012
CONTENTS
Chairman's statement
Directors' report
Independent Auditors' report
Consolidated income statement
Consolidated balance sheet
Parent company balance sheet
Consolidated statement of changes in shareholders' equity
Parent company statement of changes in shareholders' equity
Consolidated cash flow statement
Parent company cash flow statement
Notes to the financial statements
Page
1-2
3-5
6
7
8
9
10
10
11-12
13-14
15-33
ASSIMAPLC
CHAIRMAN'S STATEMENT
FOR THE YEAR ENDED 31 DECEMBER 2012
I am pleased to present a report of Assima's activities for the year ended 31 December 2012.
SUMMARY
2012 has confirmed the positive trend that emerged in 2010, with growth and increased profitability despite a negative global economic background. The key event of the year for the company has been the integration of the assets of Kaplan Learning Technologies. That acquisition has impacted our sales organisation in both the United States and the United Kingdom and has increased our research and development capabilities by 40% with the addition of a R&D Centre in Cape Town South Africa. The costs and hurdles of the integration have been fully absorbed and the operations are now fully merged.
On our core market (training solutions for ERP roll-outs) the competitive landscape has not been impacted by SAP's acquisition ofDatango, nor have we suffered from the cancellation of our eco-hub partnership with SAP, coming as a logical consequence of its deal with Datango. In an indirect way, the disappearance ofDatango as an independent competitor has increased Assima's visibility on the SAP customer base and we have made as many deals in this market as in prior years.
Our partnership with Accenture, especially strong in the US, has been very effective in 2012 and we expect an extension of our relationship with them in new areas. \Ve have also been able to establish new commercial partnerships in Germany with Atos and in the UK with IBM. Thanks to the latter, we have been able to sign our largest software deal of the year with a major industrial multinational British corporation.
This does not mean that 2012 has been an easy year, but as the figures I present later show, 2012 closes the first decade for Assima with a strong financial display.
REVENUE
In the year ended 31 December 2012 revenue has grown by 19% from £19,003,756 to £22,563,398. The revenue has been very evenly split between HI and H2, at 50%/50% with some missed opportunities in the US at the end of the year due to budget freezes.
For 2012, the geographical revenue split is: Europe and UK: 75% (2011: 78%) North America: 25% (2011: 22%)
In Europe, the largest contributing subsidiaries have been the United Kingdom (£6.2m against £4.2m), Germany (£3.4m against £3.1m), France (£2.3m against £1.7m) and Ireland (£2.0m against £1.9m). In Germany we have been able to really enter the market with our first significant software sales. The strong performance seen in most countries in Europe has mitigated the underperformance of Spain and Denmark where we faced difficulties and reduced activity in line with the local economic context. Our operations in the US have performed as we expected with 20% of top line growth and some prestigious new clients.
The revenue mix for 2012 is summarized as follows: Product (licence/maintenance): 48% (201 I: 39%) Training services: 52% (2011: 61 %)
The acquisition and integration of Kaplan assets and our organic growth in 2012 have positively rebalanced the structure of our revenue mix in favour of software, which is now even with consultancy revenue. In fact, in 2012, all our growth has been generated by our software business, with services being flat at £11m. This evolution is a strong priority and we expect the trend to be continued and accelerated in the coming years.
Partly thanks to the acquisition ofKLT, Assima has now an active customer base of more than 500 clients worldwide.
ASSIMAPLC
CHAIRMAN'S STATEMENT (continued)
FOR THE YEAR ENDED 31 DECEMBER 2012
INCOME STATEMENT
The EBITDA for the year ended 31 December 2012 was £3,356,921 against £2,384,141 for 2011, representing a 40% increase. In proportion to revenue, our EBITDA reached 14.8% in 2012 against 12.5% in 2011, so nearly back to our best historic levels.
The level of amortisation in 2012 has increased by 64% at £1, 177k mainly because ofthe impact of integrating Kaplan software assets. Depreciation in 2012 has more than doubled to £147k (against £58K in 2011) also impacted by integrating Kaplan depreciable assets.
Because of the high increases of amortisation and depreciation the pre-tax profit has not jumped by as much as the EBITDA with a growth of 25%, £2,020k against £1,609 for 2011. After tax, our net consolidated profit is £1,919k, 8% of revenue (against 1,489k the previous year).
This level of profitability is having a very positive impact on cash flow, with £14,067,862 of current assets as of 31 December 2012 (£10,266,695 in trade and other receivables and £3,793,212 in cash). It has to be emphasized that our cash situation is improving year on year (£3,739k in 2012, £3,540k in 2011, £2,248 in 2010), despite using cash for our last two acquisitions and spending in the region of £125k for our share buy-back program. This evolution is consistent with our cash-flow from operations, increasing year on year by 26%, from £2,195k to £2,766k.
DIVIDENDS
An interim dividend was declared and paid in April2012 of I euro cent per share (representing a total cost ofEuro 83K), as we did in in 2011 and 2010. A proposed interim dividend of the same amount shall be submitted to a board meeting before end of April, which is expected to be put in payment in May 2013.
ALTERNEXT LISTING
The Alternext market is still suffering from a lack ofliquidity and interest from Institutional Investors and has been badly hurt by the repeated crises in the Euro zone. The company's share price has been flat, ending at 5 Euros on 31 December 2012 with very little liquidity throughout the year.
As of31 December 2012 the company holds 96,230 shares in Treasury. The Board intends to ask the shareholders to approve the cancellation ofthese shares in 2013.
2013 PERSPECTIVES
The Board has approved a business plan for the period 2013-2015 with a focus on organic growth and profitability.
For 2013 this should translate into growth of20% ofEBITDA, with the aim to have a ratio of20% for EBITDA!Revenue at the end of the year. Based on our current strategic plan, we expect to reach Euro !Om ofEBITDA in 2015.
We are confident with this forecast thanks to the evolution of our revenue mix.
In 2013, our recurring software revenue should represent more than double our R&D costs. At the beginning ofthe year we have a strong pipeline of product sales opportunities in all our key subsidiaries and we expect to reach a record level of new software sales. This will be facilitated by the launch, in several steps, of our brand new solution Vimago, which we expect to be as recognised and value creating as our cloning technology. This new solution will allow us to leapfrog the competition with an innovative collaborative platform that will consolidate all of our existing products and provide a completely new range of solutions for empowering existing IT Systems. In addition to this positive background we should be able to amwunce in 2013 new partnerships with integrators and software publishers that will contribute to our market penetration and increased profitability with limited risk and cost.
To continue our international expansion we have opened a new subsidiary in The Netherlands in February 2013, to serve locally our clients on the Benelux market and we are still looking at new opportunities to accelerate our growth in new markets, through acquisitions or new subsidiaries.
Michel Balcaen Chah·man
18 April201}"":::_ ___ ~ ASSIMAPLC
2
DllRECTORS'REPORT
FOR THE YEAR ENDED 31 DECEMBER2012
The directors present their annual report together with the audited financial statements for the year ended 31 December 2012.
PRINCIPAL ACTIVITY
The principal activity of the group in the year was to develop and distribute productivity software for training, support and translation of or on ERP applications such as Oracle or SAP, and to deliver related consultancy services.
RESULTS AND DIVIDENDS
The results ofthe group for the year ended 31 December 2012 and the financial position at the year end are set out in the income statement and balance sheet on pages 7 and 9 respectively. An interim dividend has been declared and paid in 2012 of I euro cent per share, representing a total cost of€83,000 (£66,967) (2011: €83,000 (£73,803).
DllRECTORS
The directors who held office at 31 December 2012 were as follows:
AD Coates E Duneau JForwood MBalcaen
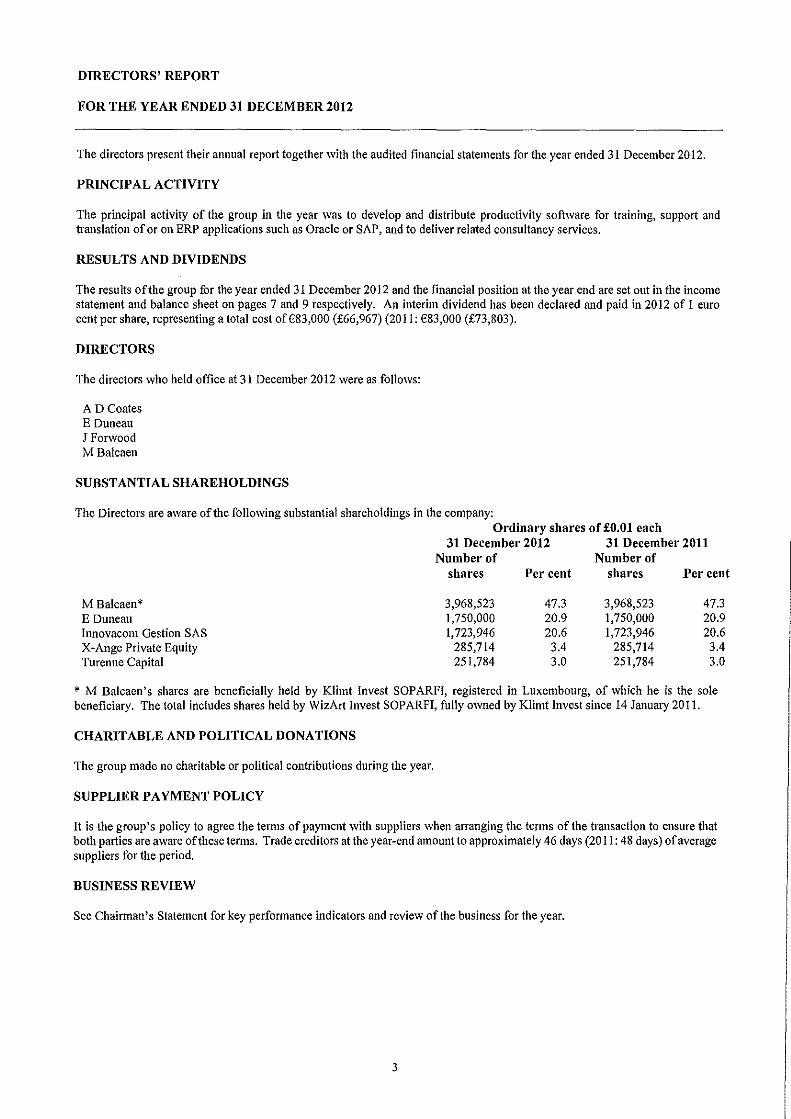
SUBSTANTIAL SHAREHOLDINGS
The Directors are aware of the following substantial shareholdings in the company: Ordinary shares of £0.01 each
31 December 2012 31 December 2011 Number of Number of
shares Per cent shares Per cent
MBalcaen* 3,968,523 47.3 3,968,523 47.3 E Duneau 1,750,000 20.9 1,750,000 20.9 Innovacom Gestion SAS 1,723,946 20.6 1,723,946 20.6 X-Ange Private Equity 285,714 3.4 285,714 3.4 Turenne Capital 251,784 3.0 251,784 3.0
• M Balcaen's shares are beneficially held by Klimt Invest SOPARFI, registered in Luxembourg, of which he is the sole beneficiary. The total includes shares held by WizArt Invest SOPARFI, fully owned by Klimt Invest since 14 January 201 I.
CHAR IT ABLE AND POLITICAL DONATIONS
The group made no charitable or political contributions during the year.
SUPPLIER PAYMENT POLICY
It is the group's policy to agree the terms of payment with suppliers when arranging the terms of the transaction to ensure that both parties are aware of these terms. Trade creditors at the year-end amount to approximately 46 days (2011: 48 days) of average suppliers for the period.
BUSINESS REVIEW
See Chairman's Statement for key performance indicators and review of the business for the year.
3
ASSIMAPLC
DIRECTORS' REPORT (continued)
FOR THE YEAR ENDED 31 DECEMBER 2012
BUSINESS REVIEW (continued)
RISKS
Liquidity risk
At 31 December 2012 the consolidated cash position was £3,739,212 and there is currently no procedure to centralise and manage cash by a treasury manager. The available cash is managed by subsidiary Financial Controllers under supervision of the Country General Manager and who together decide the optimum use of available cash. Country General Managers must respect the group policy which is to only invest for short periods (mainly on a monthly base) and only on monetary funds bearing no risk on capital. A consolidated cash analysis report for the group is prepared monthly by the CFO and reviewed with the Chairman.
Assima Pic has provided banking guarantees to several subsidiaries to facilitate negotiation of local credit lines. The amount of credit and covenants vary from country to country. The credit lines are only available for funding operations and not for investments.
Some subsidiaries have negotiated factoring facilities as follows:
Assima UK Limited: £500,000 from Nat\Vest Bank (Due to revenue concentration the maximum value of this facility may not be available)
There is a risk that the reduced levels of credit created by the global credit crunch may impact negatively one or more of the current banking arrangements. The group is fundamentally cash generative; therefore we do not anticipate the need for additional credit facilities in the foreseeable future to support our existing operations.
Interest rate risk
The company, nor any of its subsidiaries, has any debt subject to rate indexation. Hence there is no major impact on our finances from potential rate variations. The only impact could be on the cost of the invoice discounting facilities but this would be marginal.
Currency risk
The company has not implemented a specific policy to protect against currency fluctuations. The fact that the group is trading in the three main international currencies could have a negative impact on future results.
STATEMENT OF DIRECTORS' RESPONSIBILITIES
The Directors are responsible for preparing the group and parent company financial statements in accordance with applicable law and regulations.
Company Jaw requires the directors to prepare group and parent company financial statements for each financial year. Under that law the directors are required to prepare the group financial statements in accordance with International Financial Reporting Standards ("!FRS") as adopted by the EU.
The group financial statements are required by law and IFRSs as adopted by the EU to present fairly the financial position and performance of the group; the Companies Act 2006 provides in relation to such financial statements that references in the relevant part of that Act to financial statements giving a true and fair view are references to their achieving a fair presentation.
The parent company financial statements are required by law to give a true and fair view of the state of affairs of the parent company.
4

ASSIMAPLC
DIRECTORS' REPORT (continued)
FOR THE YEAR ENDED 31 DECEMBER 2012
STATEMENT OF DIRECTORS' RESPONSIBILITIES (continued)
In preparing each of the group and parent company financial statements the Directors are required to:
• select suitable accounting policies and apply them consistently; • make judgements and estimates that are reasonable and prudent; • for the group and parent company financial statements, state whether they have been prepared in accordance with IFRSs as
adopted by the EU; • prepare the financial statements on the going concem basis unless it is inappropriate to presume that the group and the parent
company will continue in business.
The Directors are responsible for keeping proper accounting records which disclose with reasonable accuracy at any time the financial position of the parent company and to enable them to ensure that the financial statements comply with the Companies Act 2006. They have general responsibility for taking such steps as are reasonably open to safeguard the assets of the group and to prevent and detect fraud and other irregularities.
Under applicable law and regulations, the Directors are also responsible for preparing a Director's Report to comply with that law and those regulations.
In determining how amounts are presented within terms in the profit and loss account and balance sheet, the Directors have had regard to the substance of the reported transaction or arrangement, in accordance with generally accepted accounting principles or practice.
So far, as each of the Directors is aware at the time the report is approved:
• there is no relevant audit information of which the company's auditors are not aware of; and • the Directors have taken all steps that they ought to have taken to make themselves aware of any relevant audit information
and to establish that the auditors are aware of that information.
GOING CONCERN
After making enquiries, the Directors have a reasonable expectation that the company has adequate resources to continue in operational existence for the foreseeable future.
AUDITORS
The company's auditors, haysmacintyre, have expressed a willingness to continue in office and a resolution reappointing them will be proposed at the Annual General Meeting in accordance with Section 485 of the Companies Act 2006.
SIGNED ON BEHALF OF THE BOARD ON 18 APRIL 2013
~
M'-"~ =s· Dir-ector
Register d Of~----------1 Ropemaker Street London EC2Y9AW
5
INDEPENDENT AUDITORS' REPORT TO THE SHAREHOLDERS OF
ASSIMAPLC
We have audited the fmancial statements of Assima Pic for the year ended 31 December 2012 which comprise the Consolidated Income Statement, the Consolidated and Company Statement of Changes in Shareholders Equity, the Consolidated and Company Balance Sheets, the Consolidated and Company Cash Flow Statements and the related notes. The financial reporting framework that has been applied in their preparation is applicable law and International Financial Reporting Standards (IFRSs) as adopted by the European Union and, as regards the parent company financial statements, as applied in accordance with the provisions of the Companies Act 2006.
This report is made solely to the company's members, as a body, in accordance with Chapter 3 of Part 16 of the Companies Act 2006. Our audit work has been undertaken so that we might state to the company's members those matters we are required to state to them in an Auditor's report and for no other purpose. To the fullest extent permitted by law, we do not accept or assume responsibility to anyone other than the company and the company's members as a body, for our audit work, for this report, or for the opinions we have formed.
Respective responsibilities of directors and auditors As explained more fully in the Directors' Responsibilities Statement set out on pages 4 - 5, the directors are responsible for the preparation of the financial statements and for being satisfied that they give a true and fair view. Our responsibility is to audit the financial statements in accordance with applicable law and International Standards on Auditing (UK and Ireland). Those standards require us to comply with the Auditing Practices Board's Ethical Standards for Auditors.
Scope of the audit of the financial statements An audit involves obtaining evidence about the amounts and disclosures in the financial statements sufficient to give reasonable assurance that the financial statements are free from material misstatement, whether caused by fraud or error. This includes an assessment of: whether the accounting policies are appropriate to the group's and the parent company's circumstances and have been consistently applied and adequately disclosed; the reasonableness of significant accounting estimates made by the directors; and the overall presentation of the financial statements. In addition, we read all the financial and non-financial information in the Directors' Report to identify material inconsistencies with the audited financial statements. If we become aware of any apparent material misstatements or inconsistencies we consider the implications for our repott.
Opinion on financial statements In our opinion:
o the fmancial statements give a true and fair view of the state of the group's and of the parent company's affairs as at 31 December 2012 and ofthe group's profit for the year then ended;
o the group financial statements have been properly prepared in accordance with IFRSs as adopted by the European Union; and
• the parent company financial statements have been properly prepared in accordance with IFRSs as adopted by the European Union and as applied in accordance with the provisions of the Companies Act 2006; and
• the financial statements have been prepared in accordance with the requirements of the Companies Act 2006 and, as regards the group financial statements, Article 4 of the lAS Regulation.
Opinion on other matter prescribed by the Companies Act 2006 In our opinion the information given in the Directors' Report for the financial year for which the financial statements are prepared is consistent with the financial statements.
Matters on which we are required to report by exception We have nothing to repott in respect of the following matters where the Companies Act 2006 requires us to report to you if, in our opinion:
• adequate accounting records have not been kept by the parent company, or returns adequate for our audit have not been received from branches not visited by us; or
o the parent company financial statements are not in agreement with the accounting records and returns; or • certain disclosures of directors' remuneration specified by law are not made; or o we have not received all the information and explanations we require for our audit.
A,i .. (;Ji A~d~Senior statutory auditor) for and on behalf of haysmacintyre, Statutory Auditor
18 April 2013 6
Fairfax House 15 Fulwood Place London WCIV6AY
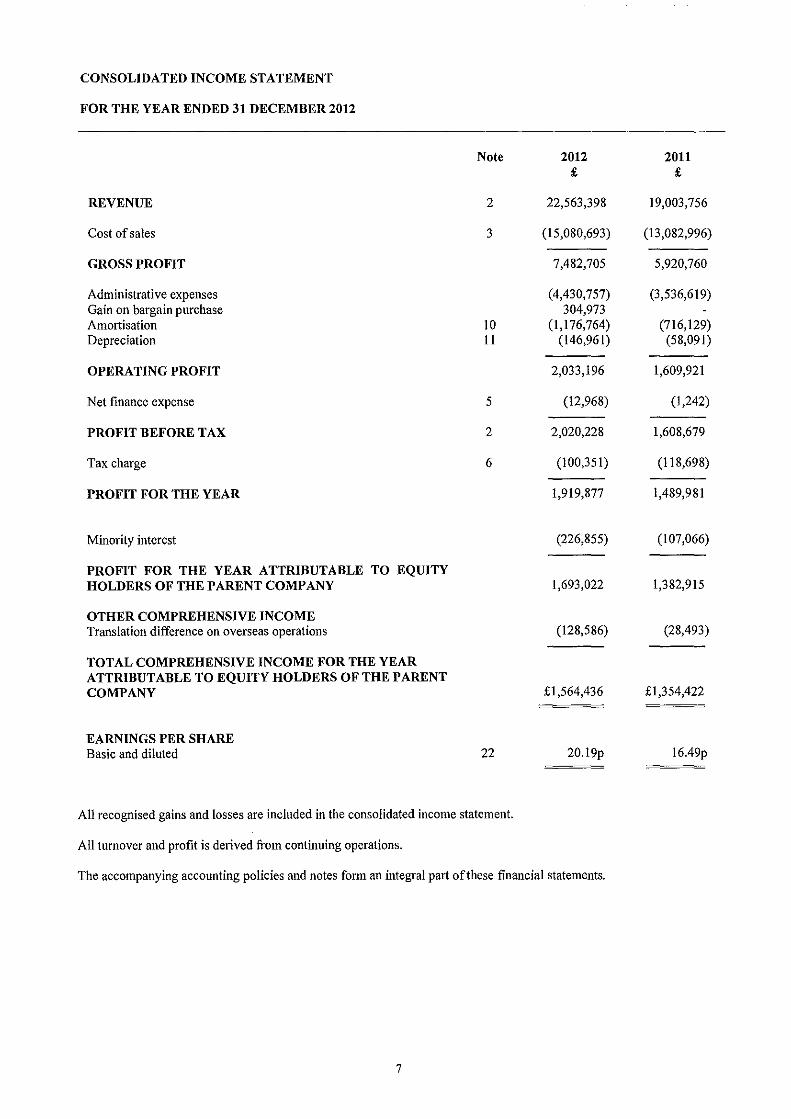
CONSOLIDATED INCOME STATEMENT
FOR THE YEAR ENDED 31 DECEMBER 2012
Note 2012 2011 £ £
REVENUE 2 22,563,398 19,003,756
Cost of sales 3 (15,080,693) (13,082,996)
GROSS PROFIT 7,482,705 5,920,760
Administrative expenses (4,430,757) (3,536,619) Gain on bargain purchase 304,973 Amortisation 10 (1,176,764) (716,129) Depreciation 11 (146,961) (58,091)
OPERATING PROFIT 2,033,196 1,609,921
Net fmance expense 5 (12,968) (1,242)
PROFIT BEFORE TAX 2 2,020,228 1,608,679
Tax charge 6 (100,351) (118,698)
PROFIT FOR THE YEAR 1,919,877 1,489,981
Minority interest (226,855) (107,066)
PROFIT FOR THE YEAR ATTRIBUTABLE TO EQUITY HOLDERS OF THE PARENT COMPANY 1,693,022 1,382,915
OTHER COMPREHENSIVE INCOME Translation difference on overseas operations (128,586) (28,493)
TOTAL COMPREHENSIVE INCOME FOR THE YEAR ATTRIBUTABLE TO EQUITY HOLDERS OF THE PARENT COMPANY £1,564,436 £1,354,422
EARNINGS PER SHARE Basic and diluted 22 20.19p 16.49p
All recognised gains and losses are included in the consolidated income statement.
All turnover and profit is derived from continuing operations.
The accompanying accounting policies and notes form an integral part of these financial statements.
7
ASSIMAPLC COMPANY NO: 04426643
CONSOLIDATED BALANCE SHEET
AT 31 DECEMBER 2012
2012 2011 Note £ £
ASSETS Non-current assets Goodwill 9 5,379,242 5,420,173 Intangible assets 10 5,666,061 3,773,864 Property, plant and equipment 11 379,452 295,240 Deferred tax assets 134,648 50,153
11,559,403 9,539,430
Current assets Trade and other receivables 13 10,266,695 7,499,272 Current tax assets 61,955 25,849 Cash and cash equivalents 14,19 3,739,212 3,540,689
14,067,862 11,065,810
2 £25,627,265 £20,605,240
EQUITY Capital and reserves attributable to the company's equity shareholders Called up share capital 15 83,839 83,839 Capital redemption reserve 1,611 1,611 Share premium account 10,794,543 10,794,543 Other reserves (362,462) (238,791) Retained earnings 4,373,373 2,942,442 Minority interest 297,517 139,048
Total equity 15,188,421 13,722,692
LIABILITIES Non-current liabilities Deferred tax liabilities 16 980,669 986,493
Current liabilities Bank overdrafts 194,260 199,985 Trade and other payables 17,19 8,839,664 5,522,210 Current tax liabilities 424,251 173,860
9,458,175 5,896,055
Total liabilities 2 10,438,844 6,882,548
Total equity and liabilities £25,627,265 £20,605,240
The financial statements were approved and authorised for issue by the Board of Directors on 18 April2013 and were signed below on its behalf by:
M Balcaen Director
The accompanying accounting policies and notes form an integral part of these financial statements.
8
ASSIMAPLC COMPANY NO: 04426643
PARENT COMPANY BALANCE SHEET
AT 31 DECEMBER 2012
2012 2011 Note £ £
ASSETS Non-current assets Intangible assets 10 121,773 367,974 Property, plant and equipment 11 Investments 12 8,886,560 8,886,560
9,008,333 9,254,534
Current assets Trade and other receivables 13 2,626,292 2,642,427 Current tax asset 25,849 25,849 Cash and cash equivalents 14 291,878 636,599
2,944,019 3,304,875
£ll,952,352 £12,559,409
EQUITY Capital and reserves attributable to the company's Equity shareholders Called up share capital 15 83,839 83,839 Capital redemption reserve 1,6ll 1,611 Share premium account 10,794,543 10,794,543 Other reserve (362,462) (238,791) Retained earnings I, 184,516 1,460,862
Total equity 11,702,047 12,102,064
LIABILITIES Non-current liabilities Deferred tax liabilities 16 14,4ll 36,852
Current liabilities Trade and other payables 17 235,894 420,493 Current tax liabilities
235,894 420,493
Total liabilities 250,305 457,345
Total equity and liabilities £ll,952,352 £12,559,409
The fmancial statements were approved and authorised for issue by the Board of Directors on 18 April 2013 and were signed below on its behalf by:
M Balcaen Director
The accompanying accounting policies and notes form an integral part of these fmancial statements.
9
ASSIMAPLC
CONSOLIDATED STATEMENT OF CHANGES IN SHAREHOLDERS' EQUITY
FOR THE YEAR ENDED 31 DECEMBER 2012
Retained earnings Capital
Share Redemption Share Other Retained Translation Minority Capital reserve premium reserve profitl(loss) reserve Interest Total
£ £ £ £ £ £ £ £
Balance at 1 January 2011 83,839 1,611 10,794,543 (94,417) 1,193,416 468,407 12,447,399 Total comprehensive income 1,382,915 (28,493) 1,354,422 Dividends paid (73,803) (73,803) Net movement in treasury shares (144,374) (144,374) Minority interest on acquisition 31,982 31,982 Minority interest for the year 107,066 107,066
Balance at 31 December 2011 £83,839 £1,611 £10,794,54 £(238,791 £2,502,528 £439,914 £139,048 £13,722,692 3 )
Total comprehensive income 1,693,022 (128,586) 1,564,436 Dividends paid (66,967) (66,967) Net movement in treasury shares (123,671) (123,671) Minority interest for the year 226,855 226,855 Dividends paid to Minority Shareholders (66,538) (66,538) (133,076) Currency Translation on Minority Interest (1,848) (1,848)
Balance at 31 December 2012 £83,839 £1,611 £10,794,54 £ £4,062,045 £311,328 £297,517 £15,188,421 3 (362,462)
=
PARENT COMPANY STATEMENT OF CHANGES IN SHAREHOLDERS' EQUITY
Capital Share Redemption Share Other Retained
Capital reserve Premium Reserve Earnings Total £ £ £ £ £ £
Balance at 1 January 2011 83,839 1,611 10,794,543 (94,417) 1,513,524 12,299,100 Total comprehensive income 21,141 21,141 Dividends paid (73,803) (73,803) Net movement in treasury shares (144,374) (144,374)
Balance at 31 December 2011 £83,839 £1,611 £10,794,543 £(238,791) £1,460,862 £12,102,064
Total comprehensive income (209,379) (209,379) Dividends paid (66,967) (66,967) Net movement in treasury shares (123,671) (123,671)
Balance at 31 December 2012 £83,839 £1,611 £10,794,543 £(362,462) £1,184,516 £11,702,047
The accompanying accounting policies and notes form an integral part of these financial statements.
10
ASSIMAPLC
CONSOLIDATED CASH FLOW STATEMENT
FOR THE YEAR ENDED 31 DECEMBER 2012
Cash flows from operating activities Profit for the period Acijustmentsfor: Tax charge Loss on the sale of fixed assets Finance expenditure Gain on bargain purchase Depreciation and amOitisation Decrease/(increase) in trade and other receivables (Decrease )/increase in trade and other payables
Cash generated from operations Tax paid
Net cash generated from operating activities
Cash flows from investing activities Purchases of property, plant and equipment Purchases of intangible assets Cash acquired with subsidimy undertaking Purchase of subsidiary undertaking Net interest paid
Net cash used in investing activities
Cash flows from financing activities Net purchase of treasury shares Dividends paid to subsidiary minority interest Dividends paid to company's shareholders
Net cash used in fmancing activities
Net increase in cash and bank overdrafts Exchange rate differences Cash and bank overdrafts at beginning of year
Cash and bank overdrafts at end of year
RECONCILIATION OF NET CASH FLOW TO NET FUNDS
Increase in cash in the year Exchange rate differences
Movement in net funds in the year
Net funds at beginning of year
Net funds at end of year
Note 2012 £
1,919,877
100,351
12,968 (304,973)
1,323,725 (1,799,957) 1,842,431
3,094,422 (328,570)
2,765,852
(136,640) (636,121)
21 604,691 21 (2,008,723)
(12,968)
(2,189,761)
(123,671) (133,076) (66,967)
(323,714)
252,377 (48,129)
3,340,704
£3,544,952
The accompanying accounting policies and notes form an integral part of these financial statements.
11
2011 £
1,489,981
118,698 31,122
1,242
773,815 1,452,953
(1,153,667)
2,714,144 (519,373)
2,194,771
(307,086) (409,358) 231,508
(180,767) (1,242)
(666,945)
(144,374)
(73,802)
(218,176)
1,309,650 (11,273)
2,042,327
£3,340,704
2012 £
250,061 (45,813)
204,248
£3,340,704
£3,544,952

ASSIMAPLC
NOTES TO THE CONSOLIDATED CASH FLOW STATEMENT
FOR THE YEAR ENDED 31 DECEMBER 2012
1. ANALYSIS OF CHANGES IN NET DEBT
At Exchange rate At 1 January 2012 Cash flows differences 31 December 2012
£ £ £ £
Cash at bank and in hand 3,540,689 252,377 (53,854) 3,739,212 Bank overdraft (199,985) 5,725 (194,260)
£3,340,704 252,377 (48,129) £3,544,952
12
ASSIMAPLC
PARENT COMPANY CASH FLOW STATEMENT
FOR THE YEAR ENDED 31 DECEMBER 2012
Cash flows from operating activities (Loss)/Profit for the period Adjustments for: Tax credit Finance (income )/expenses Dividends received from subsidiary undertakings Depreciation and amortisation Decrease in trade and other receivables Decrease in trade and other payables
Cash (used in)/generated from operations Tax paid
Net cash (used in)/generated from operating activities
Cash flows from investing activities Dividends received from subsidiary undertakings Investment in subsidiary Net interest receivedl(paid)
Net cash generated from investing activities
Cash flows from financing activities Net purchase of treasury shares Dividends paid to company's shareholders
Net cash used in financing activities
Net increase in cash and bank overdrafts Cash and bank overdrafts at beginning of year
Cash and bank overdrafts at end of year
RECONCILIATION OF NET CASH FLOW TO NET FUNDS
Increase in cash in the year
Movement in net funds in the year
Net funds at beginning of year
Net funds at end of year
Note Yearto31 December 2012
£
(209,378)
(22,441) (4,162)
(60,757) 246,201
16,135 (184,600)
(219,002)
(219,002)
60,757
4,162
64,919
(123,671) (66,967)
(190,638)
(344,721) 636,599
£291,878
The accompanying accounting policies and notes form an integral part of these fmancial statements.
13
Year to 31 December 2011
£
21,141
(68,295) 3,834
(185,310) 314,283
1,118,315 (622,401)
581,567 (273,450)
308,117
185,310 (180,767)
(3,834)
709
(144,374) (73,803)
(218,177)
90,649 545,950
£636,599
2012 £
(344,721)
(344,721)
636,599
£291,878

ASSIMAPLC
NOTES TO THE PARENT CASH FLOW STATEMENT
FOR THE YEAR ENDED 31 DECEMBER 2012
l. ANALYSIS OF CHANGES IN NET DEBT At At 1 January 2012 Cash flows 31 December 2012
Cash at bank and in hand £636,599 £ (344,721) £291,878
14
ASSIMAPLC
NOTES TO THE FINANCIAL STATEMENTS
FOR THE YEAR ENDED 31 DECEMBER 2012
l. ACCOUNTING POLICIES
(i) Basis of accounting These financial statements have been prepared in accordance with those !FRS standards and lFRIC interpretations issued and effective or issued and early adopted as at the time of preparing these statements (April2013). The policies set out below have been consistently applied to all the years presented.
These financial statements have been prepared under the historical cost convention, and posted in United Kingdom British Pounds.
The group has reasonable fmancial resources together with long term contracts with a number of customers across different geographic areas. As a consequence, the directors believe that the group is well placed to manage its business risks successfully despite the current uncertain economic conditions.
After making enquiries, the directors have a reasonable expectation that the company and the group have adequate resources to continue in operational existence for the foreseeable future. Accordingly, they continue to adopt the going concern basis in preparing the annual report and accounts.
(ii) Basis of consolidation The Group financial statements consolidate the accounts of the company and its subsidiary undertakings made up to 31 December 2012. As provided by section 408 of the Companies Act 2006, a separate income statement for the parent company has not been presented.
All intercompany balances and transactions have been eliminated in full. Subsidiary undertakings are accounted for from the effective date of acquisition until the effective date of disposal.
(iii) Segment reporting The company has three reportable business operations which are:
a) The provision of change management and education support services for companies undergoing complex business or technological change.
b) The licensing of change management and education support software and the ongoing maintenance of the software solutions licensed to companies.
Segmental reporting is produced on a geographical basis by place of sale and by revenue source.
(iv) Revenue recognition Revenue comprises the fair value of the sale of goods and services, net of value added tax, rebates and discounts.
(v) Property, plant and equipment Property, plant and equipment are stated at cost less depreciation. Depreciation is calculated to write down the cost of all tangible fixed assets by equal monthly instalments over their estimated useful lives at the following rates-
Furniture, fittings and equipment w 33% straight line
(vi) Goodwill and business combinations Business combinations on or after 1 January 2004 are accounted for under IFRS 3 ("Business combinations") using the purchase method. Any excess of the cost of business combinations over the group's interest in the net fair value of the identifiable assets, liabilities and contingent liabilities is recognised in the balance sheet as goodwill and is not amortised.
After initial recognition, goodwill is not amortised but is stated at cost less any accumulated impairment loss, with the carrying value being reviewed for impairment, at least annually and whenever events or changes in circumstances indicate that the carrying value may be impaired.
For the purpose of impairment testing, goodwill is allocated to the related cash generating units monitored by management. \Vhere the recoverable amount of the cash generating unit is less than its carrying amount, including goodwill, an impairment loss is recognised in the income statement.
15
ASSIMAPLC
NOTES TO THE FINANCIAL STATEMENTS (continued)
FOR THE YEAR ENDED 31 DECEMBER2012
1. ACCOUNTING POLICIES (continued)
(vii) Goodwill and business combinations (continued) Intangible assets are tested annually for impairment and other non-current assets are tested where an indication of impairment arises. The assessment of impairment is made by comparing the carrying amount of cash generating units (including any associated goodwill) to the higher of their value in use and their fair value. Value in use represents the net present value of future discounted cash flows.
Any impairment of non-current assets are recognised in the income statement and as above, are reviewed for impairment.
(vii) Intangible fixed assets Intangible fixed assets are stated at cost less amortisation less impairment losses. Amortisation, where appropriate, is calculated to write down the cost of intangible fixed assets by equal monthly instalments over their estimated useful lives at the following rates-
Brand names Intellectual property (Assima UK) Intellectual property (others) Development costs
20% straight line 25% straight line I 0% straight line 25% straight line
At present, customer lists are not being amortised as they are deemed to have an indefinite useful economic life due to the group's history of retaining and generating recurring sales from these customers.
(viii) Foreign currencies Transactions in foreign currencies are recorded at the rate ruling at the date of the transaction. Monetary assets and liabilities denominated in foreign currencies are retranslated at the rate of exchange ruling at the balance sheet date. The group has a number of different functional currencies including Sterling, Euro, US Dollar, Danish Kroner, Swiss Franc and Canadian Dollar.
The exchange rates used at 31 December 2012 were £1 ~ €1.23, £1 ~ US$1.635, £1 ~ CAN$1.62, £1 ~ CHFI.49, £1 ~ DK9.20.
(ix) Operating lease agreements Rentals applicable to operating leases where substantially all of the benefits and risks of ownership remain with the lessor are charged to profit and loss account as incurred.
(x) Deferred taxation Deferred tax is provided in full, using the liability method, on temporary differences arising between the tax bases of assets and liabilities and their carrying values in the financial statements. The deferred tax is not accounted for if it arises from initial recognition of an asset or liability in a transaction, other than a business combination, that at the time of the transaction does not affect either the accounting or taxable profit or loss. Deferred tax is determined using tax rates (and laws) that have been enacted or substantially enacted by the balance sheet date and are expected to apply when the related deferred tax asset is realised or the deferred tax liability is settled.
Deferred tax assets are recognised to the extent that it is probable that future taxable profit will be available against which temporary differences can be utilised.
(xi) Trade and other receivables Trade and other receivables are recognised and carried at original invoice value less an allowance for any uncollectible amounts. An estimate for doubtful debts is made when collection of the full amount is no longer probable. Bad debts are written off when identified.
(xii) Investments Investments in subsidiary undertakings are stated at cost less provisions for impairment.
(xiii) Cash and cash equivalents Cash and cash equivalents includes cash in hand, deposit held at call with banks, other short-term highly liquid investments with original maturities of three months or less, and bank overdrafts. Bank overdrafts are shown within borrowings in current liabilities on the balance sheet.
16

ASSIMAPLC
NOTES TO THE FINANCIAL STATEMENTS (continued)
FOR THE YEAR ENDED 31 DECEMBER 2012
1. ACCOUNTING POLICIES (continued)
2.
(xiv) Key sources of estimation uncertainty The preparation of fmancial statements requires management and the Board of Directors to make estimates and judgments that affect reported amounts of assets, liabilities, revenues and expenses, and related disclosure of contingent assets and liabilities. These estimates are based on historical experience and various other assumptions that management and the Board believe are reasonable under the circumstances, the results of which form the basis for making judgments about the carrying values of assets and liabilities that are not readily apparent from other sources. Actual results may differ from these estimates under different assumptions or conditions, significantly impacting earnings and fmancial position.
Management believes that the following areas, all of which are discussed and separately marked in the respective sections of Note 1 "Accounting Policies," comprise the most difficult, subjective or complex judgments it has to make in the preparation of the fmancial statements: valuation of intangible and other non-current assets, deferred taxation, and collecting trade receivables.
SEGMENTAL ANALYSIS
Year ended 31 December 2012:
Revenue Canada United Kingdom Germany Switzerland us Denmark Ireland Spain France South Africa
Operating profit Canada United Kingdom- Parent company United Kingdom- operations Germany Switzerland us Denmark Ireland Spain France Luxembourg South Africa
Net finance income
Profit before taxation
Services and Software revenue
£
106,005 3,601,735 3,366,391 (220,380)
1,894,561 552,957
1,974,452 32,273
381,223 114,104
£11,803,321
17
Maintenance and Licence revenue
£
339,135 2,628,587
1,458 1,331,063 3,217,558
657,766 12,961
384,866 1,933,395
253,288
£10,760,077
Total £
445,140 6,230,322 3,367,849 1,110,683 5,112,119 1,210,723 1,987,413
417,139 2,314,618
367,392
£22,563,398
£ 182,242
{1,753,083) 1,736,815
608,649 {1,696,433) 1,852,379
(22,605) 102,450 156,942 750,950 (11,653) 126,543
2,033,196
(12,968)
£2,020,228
ASSIMAPLC
NOTES TO THE FINANCIAL STATEMENTS (continued)
FOR THE YEAR ENDED 31 DECEMBER 2012
2. SEGMENTAL ANALYSIS (continued) Capital Depreciation and expenditure Amortisation
Capital expenditure, depreciation and amortisation £ £ Year ended 31 December 2012
Canada 1,739 1,208 United Kingdom 37,375 532,941 Germany 15,603 10,342 Switzerland 637,303 405,193 us 57,816 50,004 Denmark 9,134 53,363 Ireland 1,539 11,352 Spain 957 France 12,252 236,048 South Africa 22,317
£772,761 £1,323,725
At 31 December 2012 Assets Liabilities Net assets
£ £ £
Canada 324,921 214,723 110,198 United Kingdom 5,043,455 2,391,615 2,651,840 Germany 1,175,077 749,231 425,846 Switzerland 3,848,813 2,097,440 1,751,373
us 3,712,063 1,540,669 2,171,394 Denmark 1,945,925 666,867 1,279,058 Ireland 2,074,028 551,785 1,522,243 Spain 172,641 19,770 152,871 France 6,871,342 2,057,582 4,813,760 Luxembourg 415,220 11,626 403,594 South Africa 44,140 137,536 (93,396)
£25,627,625 £10,438,844 £15,188,781
Services and Maintenance and Software revenue Licence revenue Total
£ £ £ Year ended 31 December 2011
Revenue Canada 116,503 349,519 466,022 United Kingdom 3,334,314 881,460 4,215,774 Germany 3,112,246 24,246 3,136,492 Switzerland 30,507 1,252,902 1,283,409 us 2,027,302 2,130,178 4,157,480 Denmark 968,884 757,677 1,726,561 Ireland 1,640,085 13,902 1,653,987 Spain 50,511 584,066 634,577 France 225,727 1,503,727 1,729,454 Luxembourg
£11,506,079 £7,497,677 £19,003,756
18
ASSIMAPLC
NOTES TO THE FINANCIAL STATEMENTS (continued)
FOR THE YEAR ENDED 31 DECEMBER 2012
2. SEGMENTAL ANALYSIS (continued)
Ope.-ating profit
Canada United Kingdom- Parent company United Kingdom- operations Germany Switzerland us Denmark Ireland Spain France Luxembourg
Net finance income
Profit before taxation
Capital expenditure, depreciation and amortisation Year ended 31 December 2011
Canada United Kingdom Germany Switzerland us Denmark Ireland Spain France Luxembourg
At 31 December 2011
Canada United Kingdom Germany Switzerland us Denmark Ireland Spain France Luxembourg
19
Assets £
364,816 2,693,017
984,882 3,114,073 2,137,163 2,169,720 1,879,718
308,057 6,545,731
408,063
£20,605,240
£
176,527 (l ,872, 757)
879,695 160,770
(479,521) 1,825,437
3,522 I 17,638 371,518 438,948 (I 1,856)
1,609,921
(1,242)
£1,608,679
Capital Depreciation and expenditure amortisation
£ £
4,019 1,474 4,247 593,607
11,035 6,002 409,358 96,128
51,559 4,354 194,746 46,750
16,717 11,542 1,203
24,763 12,755
£716,444 £773,815
Liabilities Net assets £ £
(231,142) 133,674 (1,041,196) 1,651,821
(651,330) 333,552 (1,254,834) 1,859,239
(773,717) 1,363,446 (670,173) 1,499,547 (398,233) 1,481,485 (112,362) 195,695
(1,737,488) 4,808,243 (12,073) 395,990
£(6,882,548) £13,722,692
ASSIMAPLC
NOTES TO THE FINANCIAL STATEMENTS (continued)
FOR THE YEAR ENDED 31 DECEMBER 2012
3. COST OF SALES 2012 2011 £ £
\Vages, salaries and associated expenditure 10,810,141 9,144,824 Subcontractor labour 3,804,499 3,409,470 Other 466,053 528,702
£15,080,693 £13,082,996
4. EXPENSES BY NATURE
Employee benefit expense (see below) 10,103,515 9,634,342 Depreciation 146,961 57,686 Amortisation 1,176,764 716,129 Operating lease rentals 449,619 551,916 Exchange loss/(gain) 154,347 (99,406) Auditors' remuneration -audit fees 28,000 28,000 -auditing of accounts of subsidiaries of the company
pursuant to legislation 17,750 15,950 - other services relating to taxation 3,500 8,000
Employee benefit expense (including directors) Wages and salaries 8,656,584 8,229,408 Social security costs 1,233,147 1,209,383 Pension contributions 213,784 195,551
£10,103,515 £9,634,342
The average number of persons (including directors) employed by the group during the year was as follows: Office and administration 188 145
Key management remuneration Salaries £420,000 £331,194
The key management figure includes only directors. The highest paid director received £120,000 (2011: £118,225) in annual remuneration.
20
ASSIMAPLC
NOTES TO THE FINANCIAL STATEMENTS (continued)
FOR THE YEAR ENDED 31 DECEMBER 2012
5. NET FINANCE EXPENSE 2012 2011 £ £
Interest receivable and similar income 9,354 20,642 Interest payable and other charges (22,322) (21,884)
£(12,968) £(1,242)
6. TAXATION
(a) The taxation charge comprises:
Corporation tax 261,187 118,698
Current tax 542,855 264,460 Movement in deferred tax liability (note 16) (358,009) (128,208) Movement in deferred tax asset (84,495) (17,554)
£100,351 £118,698
(b) The tax assessed in the year is different from the standard rate of corporation tax in the UK of24% in 2012 and 26.5% in 2011. The differences are explained below:
Profit on ordinary activities before tax £2,020,228 £1,608,679
Profit on ordinary activities before tax multiplied by the standard companies' rate of tax in the UK 484,855 426,300
Effects of: Capital allowances in excess of depreciation 13,324 (842) Expenditure not deductible for tax purposes 244,156 (949) Gain on bargain purchase (73,194) Expense adjustment (144,692) 46,352 Other timing differences 45,583 Difference relating to overseas tax rates (262,994) (180,139) Tax credit relating to research and development (30,210) (168,453) Utilisation of loss brought forward (3,249) (162,716) Losses carried forward 117,187 105,841 Marginal relief 16,280 42,298 Withholding tax charge against corporation tax ll,006 Adjustment to tax charge in respect of previous periods (306,695)
Taxation charge £100,351 £118,698
(c) Factors which may affect future tax charges
Certain of the group companies have tax losses carried forward that may reduce future tax charges.
7. DIVIDENDS TO EQUITY SHAREHOLDERS 2012 2011
Dividends paid £66,967 £73,803
21
ASSIMAPLC
NOTES TO THE FINANCIAL STATEMENTS (continued)
FOR THE YEAR ENDED 31 DECEMBER 2012
8. PROFIT ATTRIBUTABLE TO ASSIMAPLC
9.
10.
The loss after taxation for the financial year dealt with in the financial statements of the parent company, Assima Plc, was £209,379 (2011: profit £21,141). As permitted by section 408 Companies Act 2006, no separate income statement is presented for the parent company.
GOODWILL Purchased Consolidated GROUP goodwill goodwill Total
£ £ £ COST At 1 January 2011 877,306 4,415,669 5,292,975 Additions 140,394 140,394 Exchange rate difference (13,196) (13,196)
At 31 December 2011 864,110 4,556,063 5,420,173 Exchange rate difference (40,931) (40,931)
At 31 December 2012 823,179 4,556,063 5,379,242
NET BOOK VALUE At 31 December 2012 £823,179 £4,556,063 £5,379,242
At 31 December 2011 £864,110 £4,556,063 £5,420,173
Goodwill is not amortised, but tested annually for impairment with the recoverable amount being determined from value in use calculations. The key assumptions for the value in use calculations are those regarding the discount growth rates and changes in income and costs.
INTANGIBLE FIXED ASSETS Customer GROUP Brand Intellectual lists and Development
Names Property royalties expenditure Total £ £ £ £ £
Cost or valuation At I January 20 II 84,338 3, 123,511 1,420,062 3,413,192 8,041,103 Additions 409,358 409,358
At 31 December 20 II 84,338 3,123,511 1,420,062 3,822,550 8,450,461 Additions 636,121 636,121 Acquired on acquisition (note 21) 1,565,173 863,930 2,429,103 Disposal (190,468) (190,468)
At 31 December 2012 84,338 3,123,511 2,985,235 5,132,133 11,325,217
Amortisation At I January 20 II 80,994 1,573,604 2,308,691 3,963,289 Charge in the year 3,344 302,949 409,836 716,129 Exchange rate difference (2,821) (2,821)
At31 December2011 84,338 1,876,553 2,715,706 4,676,597 Charge in the year 302,949 873,815 I, 176,764 Exchange rate difference (3,737) (3,737) Disposal (190,468) (190,468)
At 31 December 2012 84,338 2,179,502 3,395,316 5,659,156
Net Book Value At 31 December 2012 £944,009 £2,985,235 £1,736,817 £5,666,061
At 31 December 2011 £1,246,958 £1,420,062 £1,106,844 £3,773,864
22
ASSIMAPLC
NOTES TO THE FINANCIAL STATEMENTS (continued)
FOR THE YEAR ENDED 31 DECEMBER 2012
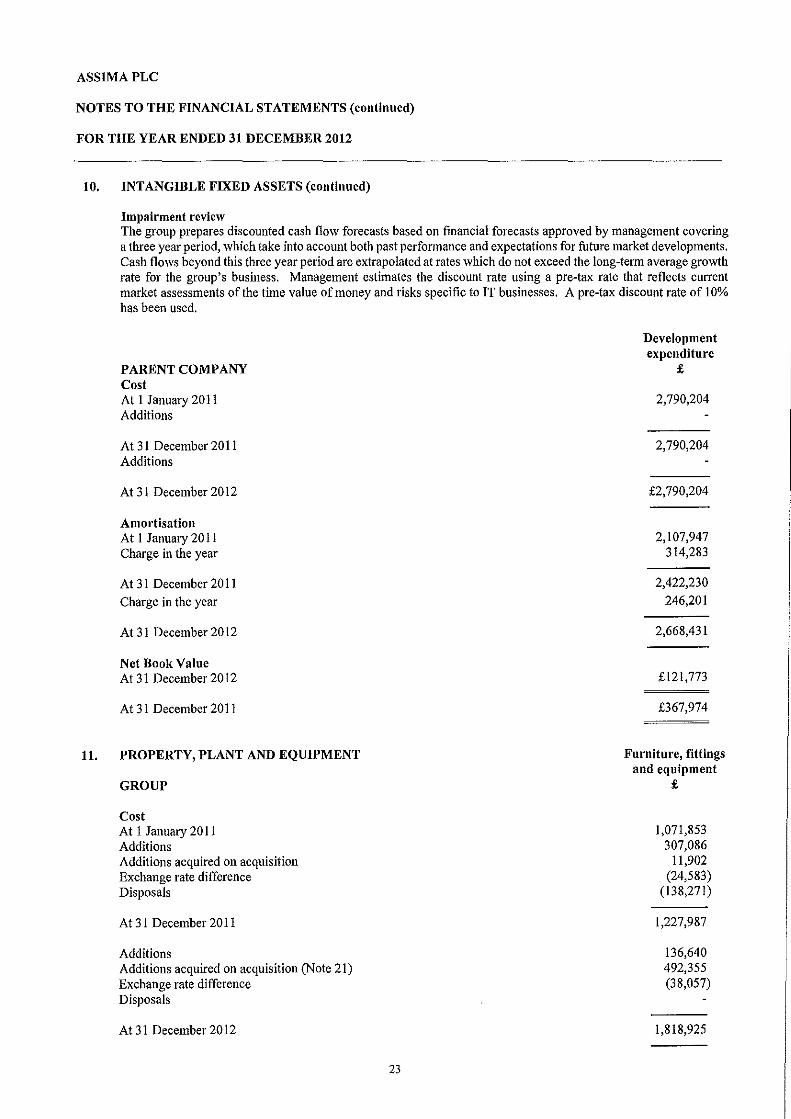
10. INTANGIBLE FIXED ASSETS (continued)
11.
Impairment review The group prepares discounted cash flow forecasts based on financial forecasts approved by management covering a three year period, which take into account both past perfonnance and expectations for future market developments. Cash flows beyond this three year period are extrapolated at rates which do not exceed the long-term average growth rate for the group's business. Management estimates the discount rate using a pre-tax rate that reflects current market assessments of the time value of money and risks specific to IT businesses. A pre-tax discount rate of I 0% has been used.
PARENT COMPANY Cost At I January 2011 Additions
At 31 December 20 II Additions
At31 December2012
Amortisation At I January 2011 Charge in the year
At 31 December 20 II
Charge in the year
At31 December2012
Net Book Value At 31 December 2012
At 31 December 2011
PROPERTY, PLANT AND EQUIPMENT
GROUP
Cost At I January 20 II Additions Additions acquired on acquisition Exchange rate difference Disposals
At 31 December 20 II
Additions Additions acquired on acquisition (Note 21) Exchange rate difference Disposals
At 31 December 2012
23
Development expenditure
£
2,790,204
2,790,204
£2,790,204
2,107,947 314,283
2,422,230 246,201
2,668,431
£121,773
£367,974
Furniture, fittings and equipment
£
1,071,853 307,086
11,902 (24,583)
(138,271)
1,227,987
136,640 492,355 (38,057)
1,818,925
ASSIMAPLC
NOTES TO THE FINANCIAL STATEMENTS (continued)
FOR THE YEAR ENDED 31 DECEMBER 2012
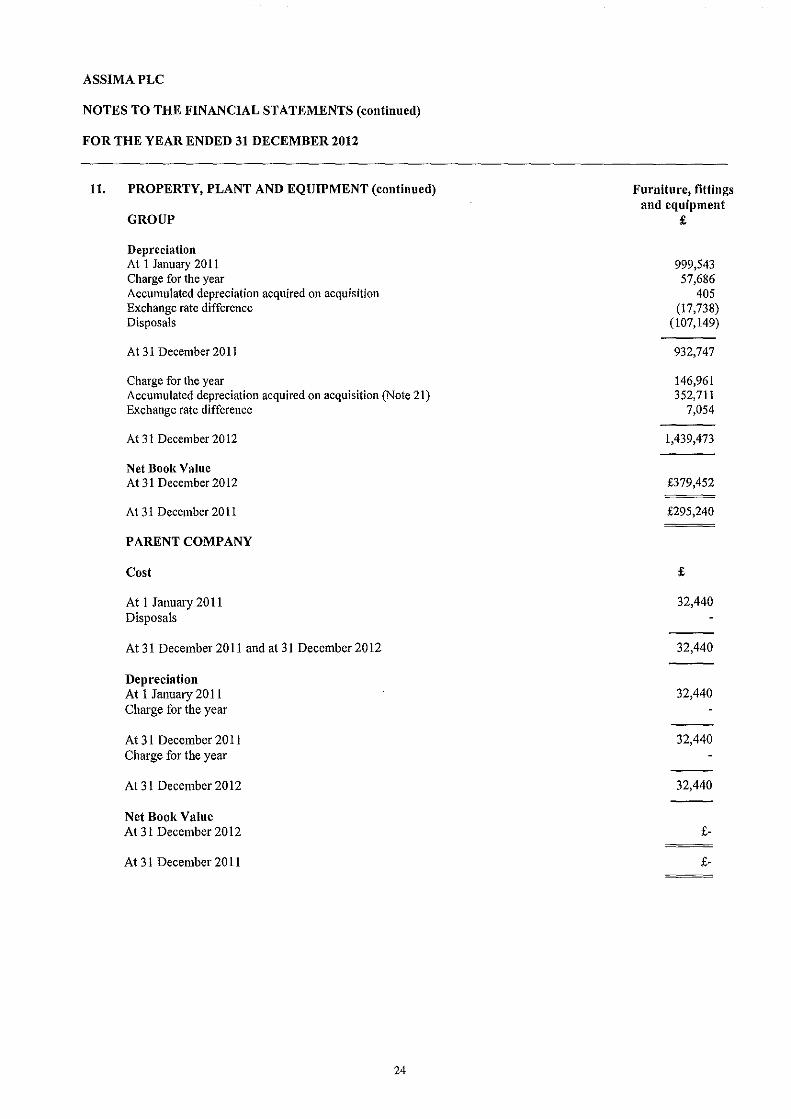
11. PROPERTY, PLANT AND EQUIPMENT (continued)
GROUP
Depreciation At I January 20 II Charge for the year Accumulated depreciation acquired on acquisition Exchange rate difference Disposals
At 31 December 2011
Charge for the year Accumulated depreciation acquired on acquisition (Note 21) Exchange rate difference
At 31 December 2012
Net Book Value At 31 December 2012
At 31 December 2011
PARENT COMPANY
Cost
At 1 January 2011 Disposals
At 31 December 2011 and at 31 December 2012
Depreciation At 1 January2011 Charge for the year
At 31 December 2011 Charge for the year
At31 December2012
Net Book Value At31 December2012
At 31 December 2011
24
Furniture, fittings and equipment
£
999,543 57,686
405 (17,738)
(107,149)
932,747
146,961 352,711
7,054
1,439,473
£379,452
£295,240
£
32,440
32,440
32,440
32,440
32,440
£-
£-
ASSIMAPLC
NOTES TO THE FINANCIAL STATEMENTS (continued)
FOR THE YEAR ENDED 31 DECEMBER 2012
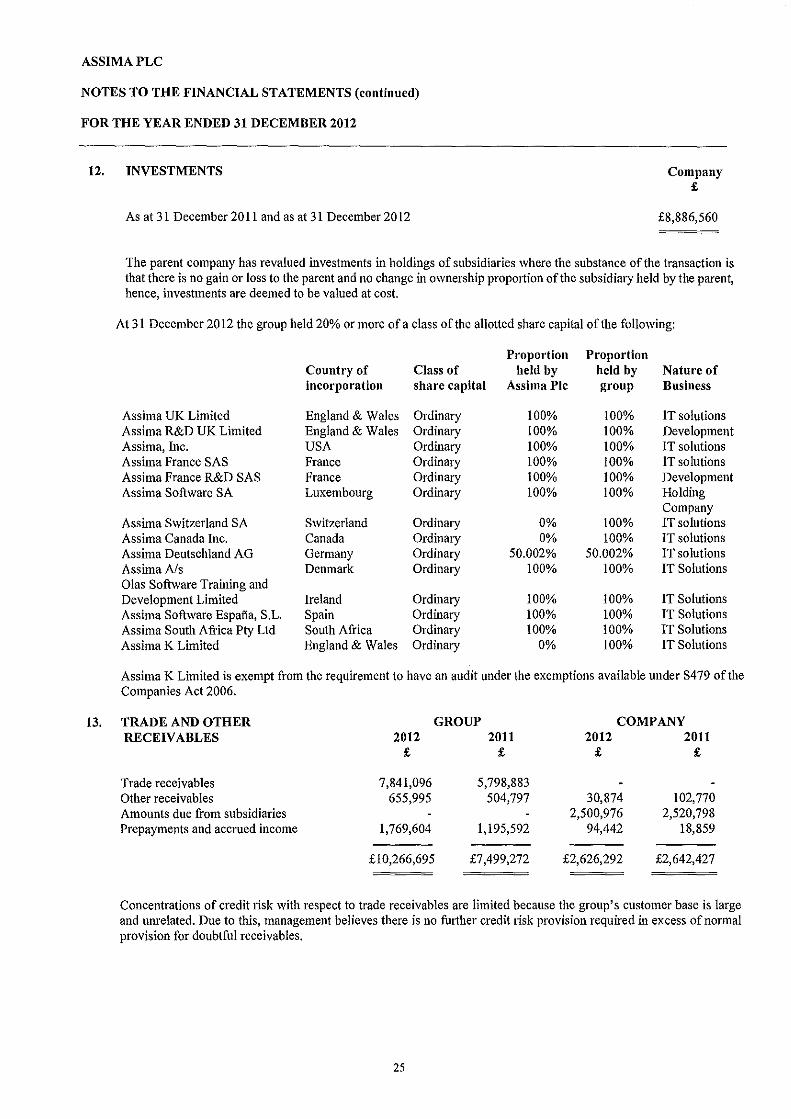
12. INVESTMENTS Company £
13.
As at 31 December 20 11 and as at 31 December 20 12 £8,886,560
The parent company has revalued investments in holdings of subsidiaries where the substance of the transaction is that there is no gain or loss to the parent and no change in ownership proportion of the subsidiary held by the parent, hence, investments are deemed to be valued at cost.
At 31 December 2012 the group held 20% or more of a class of the allotted share capital of the following:
Proportion Proportion Country of Class of held by held by Nature of incorporation share capital Assima Pic group Business
Assima UK Limited England & Wales Ordinary 100% 100% IT solutions Assima R&D UK Limited England & Wales Ordinary 100% 100% Development Assima, Inc. USA Ordinary 100% 100% IT solutions Assima France SAS France Ordinary 100% 100% IT solutions Assima France R&D SAS France Ordinary 100% 100% Development Assima Software SA Luxembourg Ordinary 100% 100% Holding
Company Assima Switzerland SA Switzerland Ordinary 0% 100% IT solutions Assima Canada Inc. Canada Ordinary 0% 100% IT solutions Assima Deutschland AG Germany Ordinary 50.002% 50.002% IT solutions AssimaA/s Denmark Ordinary 100% 100% IT Solutions Olas Software Training and Development Limited Ireland Ordinary 100% 100% IT Solutions Assima Software Espafia, S.L. Spain Ordinary 100% 100% IT Solutions Assima South Africa Pty Ltd South Africa Ordinary 100% 100% IT Solutions Assima K Limited England & Wales Ordinary 0% 100% IT Solutions
Assima K Limited is exempt from the requirement to have an audit under the exemptions available under S479 of the Companies Act 2006.
TRADE AND OTHER GROUP COMPANY RECEIVABLES 2012 2011 2012 2011
£ £ £ £
Trade receivables 7,841,096 5,798,883 Other receivables 655,995 504,797 30,874 102,770 Amounts due from subsidiaries 2,500,976 2,520,798 Prepayments and accrued income 1,769,604 1,195,592 94,442 18,859
£10,266,695 £7,499,272 £2,626,292 £2,642,427
Concentrations of credit risk with respect to trade receivables are limited because the group's customer base is large and umelated. Due to this, management believes there is no further credit risk provision required in excess of normal provision for doubtful receivables.
25
ASSIMAPLC
NOTES TO THE FINANCIAL STATEMENTS (continued)
FOR THE YEAR ENDED 31 DECEMBER 2012
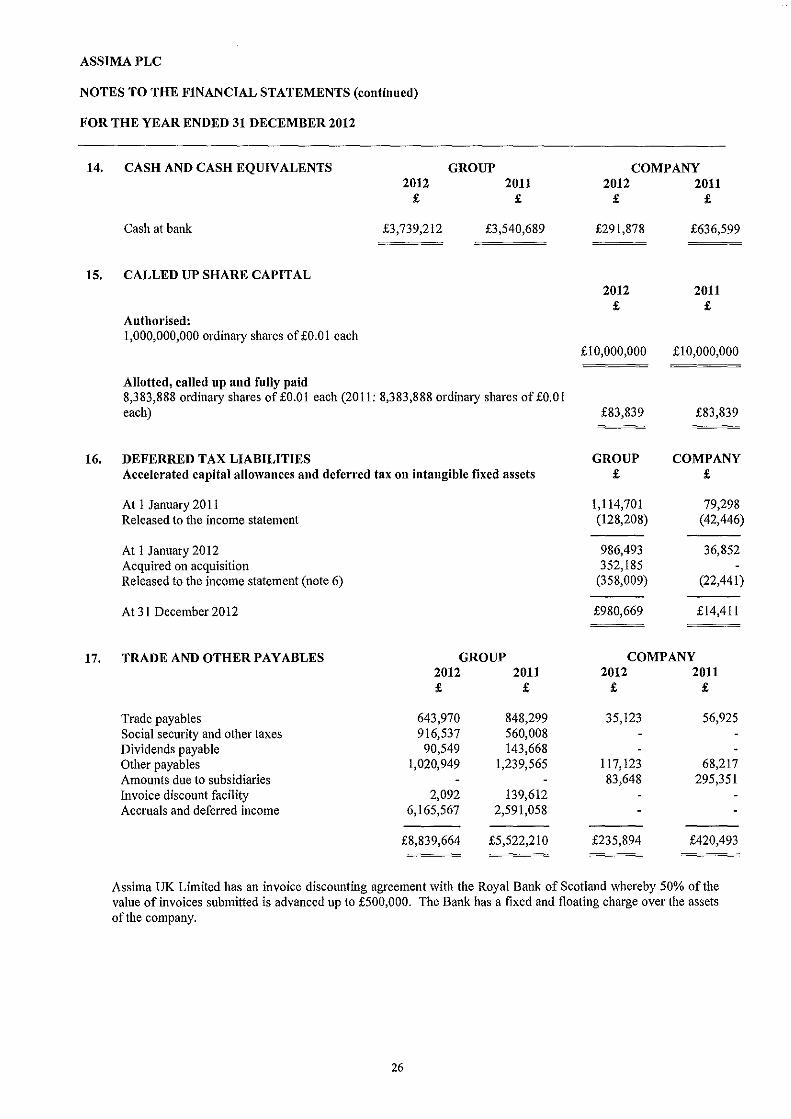
14. CASH AND CASH EQUIVALENTS
Cash at bank
15. CALLED UP SHARE CAPITAL
Authorised: 1,000,000,000 ordinary shares of £0.01 each
Allotted, called up and fully paid
2012 £
£3,739,212
GROUP 2011
£
£3,540,689
8,383,888 ordinaty shares of £0.01 each (2011; 8,383,888 ordinary shares of £0.01 each)
16. DEFERRED TAX LIABILITIES Accelerated capital allowances and deferred tax on intangible fixed assets
At I January 20 11 Released to the income statement
At I January 2012 Acquired on acquisition Released to the income statement (note 6)
At 31 December 2012
17. TRADEANDOTHERPAYABLES
Trade payables Social security and other taxes Dividends payable Other payables Amounts due to subsidiaries Invoice discount facility Accruals and deferred income
GROUP 2012 2011 £ £
643,970 848,299 916,537 560,008 90,549 143,668
1,020,949 1,239,565
2,092 139,612 6,165,567 2,591,058
£8,839,664 £5,522,210
COMPANY 2012 2011
£ £
£291,878
2012 £
£10,000,000
£83,839
GROUP £
1,114,701 (128,208)
986,493 352,185
(358,009)
£980,669
£636,599
2011 £
£10,000,000
£83,839
COMPANY £
79,298 (42,446)
36,852
(22,441)
£14,411
COMPANY 2012 2011
£ £
35,123 56,925
117,123 68,217 83,648 295,351
£235,894 £420,493
Assirna UK Limited has an invoice discounting agreement with the Royal Bank of Scotland whereby 50% of the value of invoices submitted is advanced up to £500,000. The Bank has a fixed and floating charge over the assets of the company.
26
ASSIMAPLC
NOTES TO THE FINANCIAL STATEMENTS (continued)
FOR THE YEAR ENDED 31 DECEMBER 2012
18. OPERATING LEASE COMMITMENTS
At 3 I December 2012, the company had commitments under non-cancellable operating leases as set out below:-
No later than I year I to 2 years 2 to 5 years
19. FINANCIAL RISK MANAGEMENT
GROUP 2012 2011
£ £
£725,694 £706,188
£1,089,214
£517,960 £198,815 £820,018
COMPANY 2012 2011 £ £
£523,472 £523,472 £610,732
£175,344
The group's activities give rise to a number of financial risks: market risk, credit risk and liquidity risk Market risk includes foreign exchange risk and cash flow and fair value interest rate risk. The group has in place risk management policies that seek to limit the adverse effects on the financial performance.
Foreign exchange risk The group has transactional cun·ency exposures arising from sales or purchases by operating subsidiaries in currencies other than the subsidiaries' functional currency.
The main impact offoreign exchange risk on the group's results arises from the translation into sterling of the results of operations outside ofthe UK.
Financial instruments Aside from infrequent currency hedges the group does not use derivative financial instruments and has no debt. The company finances its operations simply using bank balances and overdraft, plus debtors and creditors. The cash flow is regularly monitored and the overdraft is occasionally extended to meet requirements as they arise.
Capital risk management The group manages capital and for the purpose of proper capital structure, in accordance with the economic conditions present on the market, decides if the retained earnings should be distributed to shareholders. The group's principal capital management objective is that of maximisation of returns to shareholders. Management seek to manage capital in order to meet this objective through organic growth, acquisitions and other strategies as deemed appropriate. Objectives, policies and processes have not been changed during the year ended 3 I December 2012 nor for the year ending 3 I December 201 I.
Significant accounting policies Details ofthe significant accounting policies and methods adopted, including the criteria for recognition, the basis of measm·ement and the basis on which income and expenses are recognised, in respect of each class of fmancial asset, fmancialliability and equity instrument are disclosed in note I to the fmancial statements.
Accounting policies for financial instruments are applied on the following Balance Sheet items:
All of the group's assets and liabilities have been classified as other financial liabilities. The group does not have assets and liabilities which are classified as "Held at Fair value through profit and loss".
Fair value of fmancial instruments
The fair values of financial assets and financial liabilities with standard terms and conditions and traded on active liquid markets is determined with reference to quoted market price; • the fair value of financial assets and financial liabilities with standard terms and conditions and traded on active
liquid markets is determined with reference to quoted market price; • the fair value of other financial assets and financial liabilities (excluding derivative instruments) is detennined in
accordance with generally accepted pricing models based on discounted cash flow analysis using prices from observable current market transactions and dealer quotes for similar instruments;
27
ASSIMAPLC
NOTES TO THE FINANCIAL STATEMENTS (continued)
FOR THE YEAR ENDED 31 DECEMBER 2012
19. FINANCIAL RISK MANAGEMENT (continued)
Significant accounting policies (continued)
The group applied the following methods and assumptions during the estimation offair value of financial instruments:
Receivables and deposits at banks For assets which mature within 3 months, canying value is similar to fair value due to shortness of these instruments. For longer-term assets, contracted interest rates do not significantly defer from current market interest rates, and as such their fair value is similar to its carrying value.
Short term liabilities Fair value of sh01t term liabilities is similar to its canying value due to shortness of these instruments. For long term liabilities, contracted interest rates do not significantly defer from current market interest rates, and as such their fair value is similar to its carrying value.
Otherfinancial instruments Financial instruments of the group which are not valuated at fair value are trade accounts receivable, other receivables, trade accounts payable and other payables. Historic canying value of assets and liabilities, including the provisions, which are in accordance with the usual business conditions, is similar to its fair value.
Financial risk management objectives The group's management monitors and manages the financial risks relating to the operations of the group tbrough intemal risk reports provided to the Assima group which analyse exposures by degree and magnitude of risks. These risks include market risk (including currency risk, fair value interest rate risk and price risk), credit risk, liquidity risk and cash flow interest rate risk.
(a) Liquidity risk At 31 December 2012 the consolidated cash position was £3,739,212 and there is currently no procedure to centralise and manage cash by a treasury manager. The available cash is managed by subsidiary Financial Controllers under supervision of the Countty General Manager who together decide the optimum use of available cash. Country General Managers must respect the group policy which is to only invest for short periods (mainly on a monthly base) and only on monetary funds bearing no risk on capital. Assima Pic has provided banking guarantees to several subsidiaries to facilitate the negotiation of local credit lines. The amount of credit and covenant varies from country to country. The credit lines are only available for funding operations and not for investments.
Assima UK, Ltd. has negotiated a factoring facility from Royal Bank of Scotland for a maximum of £500,000.
There is a risk that the restt·icted access to credit generated by the global credit crunch may impact negatively one or several current banking arrangements. We do not anticipate the need for additional credit facilities in the foreseeable future to support our existing operations.
The group fmances itself through retained eamings. The group is fundamentally cash-generative and manages its liquid resources so as to obtain the best available rates of return on cash investments, whilst retaining access to those resources. Cash that is not needed for short term requirements is deposited for periods of one month (or more), based on the Directors' assessment of prevailing interest rate trends, the interest rates available and the liquid resource requirements of the group. In addition, cash is placed on instant access deposit with the group's bankers, which is available for shorter-term requirements.
28
ASSIMAPLC
NOTES TO THE FINANCIAL STATEMENTS (continued)
FOR THE YEAR ENDED 31 DECEMBER 2012
19. FINANCIAL RISK MANAGEMENT (continued)
(a) Liquidity risk (continued)
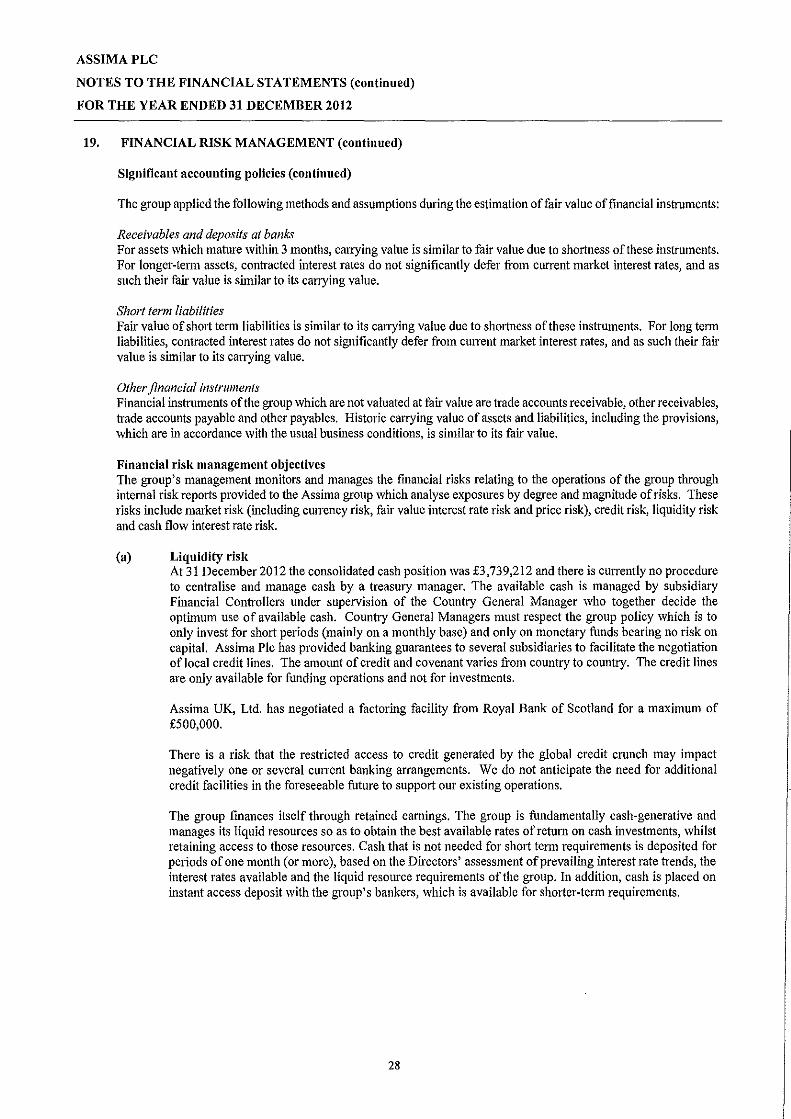
The following are maturities of financial liabilities, including estimated contractual interest payments.
2012
Trade payables Social security and other taxes Dividends payable Other payables Invoice discount facility Accruals and deferred income
Total
2011
Trade payab1es Social security and other taxes Dividends payable Other payables Invoice discount facility Accruals and deferred income
Total
(b) Interest rate risk
Carrying Amount
£
643,970 916,537 90,549
1,020,949 2,092
6,165,567
£8,839,664
Carrying Amount
£
848,299 560,008 143,668
1,239,565 139,612
2,591,058
£5,522,210
Contractual 6 months Cash flow or less
£ £
643,970 643,970 916,537 916,537
90,549 90,549 1,020,949 1,020,949
2,092 2,092 6,165,567 6,165,567
£8,839,664 £8,839,664
Contractual 6 months Cash flow or less
£ £
848,299 848,299 560,008 560,008 143,668 143,668
1,239,565 1,239,565 139,612 139,612
2,591,058 2,591,058
£5,522,210 £5,522,210
Neither, the company, nor any of its subsidiaries, has any debt subject to rate indexation. Hence there is no major impact on our finances from potential rate variations. The only impact could be on the cost of the invoice discounting facilities but this would be marginal unless there would be an increase ofthe several points on the Bank of England or LIB OR rates.
(c) Currency risk The company has not implemented a specific policy to protect against currency fluctuations. The fact that the group is trading in the three main international currencies could have a negative impact.
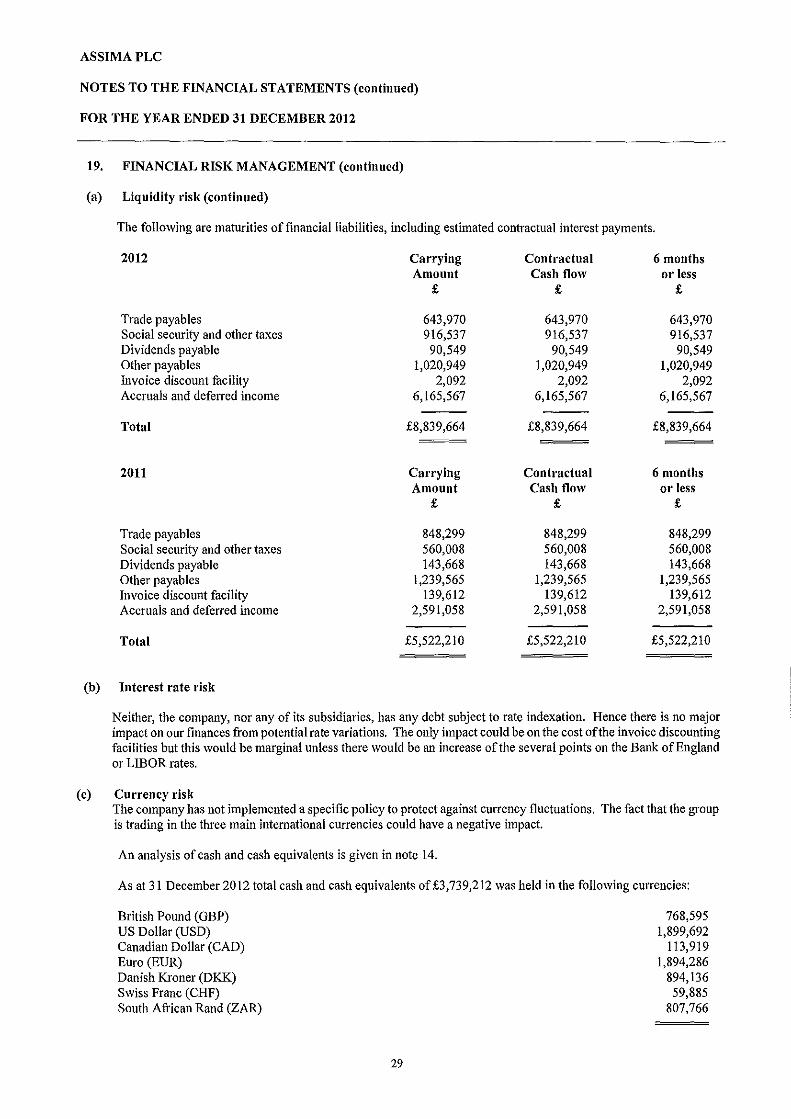
An analysis of cash and cash equivalents is given in note 14.
As at 31 December 2012 total cash and cash equivalents of £3,739,212 was held in the following currencies:
British Pound (GBP) US Dollar (USD) Canadian Dollar (CAD) Euro (EUR) Danish Kroner (DKK) Swiss Franc (CHF) South African Rand (ZAR)
29
768,595 1,899,692
113,919 1,894,286
894,136 59,885
807,766

ASSIMAPLC
NOTES TO THE FINANCIAL STATEMENTS (continued)
FOR THE YEAR ENDED 31 DECEMBER 2012
19. FINANCIAL RISK MANAGEMENT (continued)
(c) Currency risk (continued) The Directors do not generally consider it necessary to enter into derivative fmancial instruments to manage the exchange risk arising from its operations, but from time to time when the Directors consider foreign currencies are weak and it is known that there will be a requirement to purchase those currencies, forward arrangements are entered into. One currency hedge transaction was entered into in the year ended 31 December 2011. This transaction closed in early 2011 and the resultant €117,668 loss recognised in full as at 31 December 20 II.
(d) Credit risk management Credit risk refers to the risk that the counterparty will default on its contractual obligations resulting in financial loss to the group. The group has adopted a policy of only dealing with creditworthy counterparties and obtaining sufficient collateral, where appropriate, as a means of mitigating the risk of fmancial loss from defaults. The group only transacts with entities with good credibility. The group uses other publicly available financial information and its own trading records to rate its major customers. The group's exposure and the credit ratings of its counterparties are continuously monitored and the aggregate value of transaction concluded is spread amongst approved counterparties. Credit exposure is controlled by counterparty limits that are review and approved by the group's management.
The group does not have any significant credit risk exposure to any single counterparty or any group of counterparties having similar characteristics. The group defines counterparties as having similar characteristics if they are related entities. Concentration of credit risk did not exceed 5% of gross monetary assets at any time during the year. The credit risk on liquid funds and derivative fmancial instruments is limited because the counterparties are banks with credit-ratings assigned by international credit-rating agencies.
The carrying amount of financial assets exposed to credit risk is as follows.
Current financial assets Trade and other receivables Cash and cash equivalents
Trade receivables ageing by segment
Geographical area
Europe Non Europe
Total
Less provisions
Total
Total Current £ £
6,401,215 4,312,487 1,662,203 1,444,311
8,063,418 5,756,798
(222,322)
7,841,096 5,756,798
20. CONTINGENT LIABILITIES AND OTHER LIABILITIES
30 days Past due
£
736,429 117,779
854,208
854,208
2012 2011 £ £
£10,266,695 £3,739,212
60 days Past due
£
309,125 78,678
387,803
387,803
£7,499,272 £3,540,689
90 days Past due
£
1,043,174 21,435
1,064,609
(222,322)
842,287
The group has no contingent or other liabilities, other than those already disclosed in the financial statements at year end.
30

ASSIMAPLC
NOTES TO THE FINANCIAL STATEMENTS (continued)
FOR THE YEAR ENDED 31 DECEMBER 2012
21. PURCHASE OF SUBSIDIARY UNDERTAKING
On 9 February 2012 Assima Inc acquired a 100% of the share capital of Kaplan IT, Inc., a company registered in the USA for a cash consideration of$3,193,870 (£2,008,723). At the time, Kaplan IT Inc had subsidiary companies is the UK and SA. (together the "Kaplan Group")
The fair value of the net assets and liabilities acquired on the purchase of Kaplan at 9 February 2012 were:
Gain on bargain purchase Customer lists and royalties (Note 10) Development expenditure (Note 1 0) Property, plant & equipment (Note II) Trade and other receivables Cash and cash equivalents Trade and other payables Deferred tax liability
The fair value of the assets in the Kaplan Group were valued by Brand Finance Pic.
£
(304,973) 1,565,173
863,930 139,644 967,466 604,691
(1,475,023) (352,185)
£2,008,723
On 9 February 2012, the shares of Kaplan SA was transferred to Assima Switzerland and the shares in Kaplan IT were transferred to Assima UK.
On 9 February 2012, all development expenditure in the Kaplan Group was transferred to Assima Switzerland and the remaining trade and assets of Kaplan IT Inc were transferred to Assima Inc.
During the year Kaplan IT Limited, was renamed Assima K Limited
On 1 October 2012, all the remaining assets of Assima K Limited were transferred to Assima UK Limited and Assima K was made dormant at this time.
Due to the complexity of the hive ups in the group it is impractical to separately identifY the turnover, operating profit and profit before tax that the Kaplan Group contributed to consolidated Assima Pic position.
22. EARNINGS PER SHARE
The earnings per share of20.19p (31 December 2011: 16.49p) has been calculated on the weighted average number of shares in issue during the period namely 8,383,888 (2011: 8,383,888) and profit of £1,693,022 (2011: profit £1,382,915).
23. TREASURY SHARES
On I January 2012, the company held 64,730 treasury shares.
This portfolio has evolved as follows: • Purchase of31,600 treasury shares
On December 2012, the company held 96,230 treasury shares.
All the Assima shares have been bought at a minimum price of €3 .16 and a maximum price of €5 .00.
31
ASSIMAPLC
NOTES TO THE FINANCIAL STATEMENTS (continued)
FOR THE YEAR ENDED 31 DECEMBER 2012
24. STANDARDS ISSUED BUT NOT YET EFFECTIVE
Standards issued but not yet effective up to the date of issuance of the company's financial statements are listed below. This listing is of standards and interpretations issued, which the company reasonably expects to be applicable at a future date. The company intends to adopt those standards when they become effective. The company does not expect the impact of such changes on the financial statements to be material.
IFRS 9 Financial Instruments: Classification and Measurement
IFRS 9 as issued reflects the first phase of the IASBs work on the replacement of lAS 39 and applies to classification and measurement of financial assets as defined in lAS 39. The standard is effective for annual periods beginning on or after I Januaty 2013. In subsequent phases, the IASB will address classification and measurement of financial liabilities, hedge accounting and derecognition. The completion ofthis project is expected in early 2012. The adoption ofthe first phase of!FRS 9 will have an effect on the classification and measurement ofthe company's financial assets. The company will quantifY the effect in conjunction with the other phases, when issued, to present a comprehensive picture.
IFRS 10 Consolidated Financial Statements
The objective of IFRS I 0 is to establish principles for the presentation and preparation of consolidated financial statements when an entity controls one or more other entities. The standard is effective for annual periods beginning on or after I January 2013. The standard may be applied to an earlier accounting period, but, where doing so, entities must disclose that the standard is early adopted and must also apply !FRS II 'Joint Anangements', IFRS 12 'Disclosures of Interests in Other Entities', lAS 27 'Separate Financial Statements', and lAS 28 'Investments in Associates and Joint Ventures'.
IFRS 12 Disclosure of Interests in Other Entities
The objective of IFRS 12 is to requh'e the disclosure of infoiTnation that enables users of fmancial statements to evaluate:
• the nature of, and risks associated with, its interests in other entities
• the effects of those interests on its financial position, financial perfoiTnance and cash flows.
!FRS 12 is applicable to annual reporting periods beginning on or after I Januruy 2013. Early application is permitted.
Entities are encouraged to voluntarily provide the infoiTnation requh'ed by !FRS 12 prior to its adoption. Providing some ofthe disclosures requh'ed by IFRS 12 does not compel an entity to comply with all of the requirements of the !FRS or to also apply
lAS 1 Presentation of Items of Other Comprehensive Income
The amendments to lAS I change the grouping of items presented in other comprehensive income.
Items that could be reclassified (or recycled) to profit or loss at a future point in time would be presented separately from items that will never be reclassified. The amendment affects presentation only and therefore has no impact on the Group's fmancial position or perfonnance. The amendments to lAS I are effective for annual periods beginning on or after I July 2012 and will therefore be applied in the Group's frrst annual report after becoming effective.
32
ASSIMAPLC
NOTES TO THE FINANCIAL STATEMENTS (continued)
FOR THE YEAR ENDED 31 DECEMBER 2012
24. STANDARDS ISSUED BUT NOT YET EFFECTIVE (continued)
!FRS 13 Fair Value Measurement
IFRS 13 is designed to be a single source of guidance under !FRS for all fair value measmements. !FRS 13 will not change when an entity is required to use fair value, but rather provides guidance on how to measure fair value under IFRS when fair value is required or pennitted.
The Group is currently assessing the impact that this standard will have on the fmancial position and perfonnance, but based on the preliminary analyses, no material impact is expected. This standard is effective for annual periods beginning on or after I January 2013.
25. RELATED PARTY TRANSACTIONS
During the year, dividends in the amount of€49,990 were paid to Directors.
33