associations between screen time and lower psychological well … · terpersonal relationships,...
TRANSCRIPT

Contents lists available at ScienceDirect
Preventive Medicine Reports
journal homepage: www.elsevier.com/locate/pmedr
Associations between screen time and lower psychological well-beingamong children and adolescents: Evidence from a population-based studyJean M. Twengea,⁎, W. Keith Campbellba San Diego State University, United States of AmericabUniversity of Georgia, United States of America
A B S T R A C T
Previous research on associations between screen time and psychological well-being among children and adolescents has been conflicting, leading some researchersto question the limits on screen time suggested by physician organizations. We examined a large (n=40,337) national random sample of 2- to 17-year-old childrenand adolescents in the U.S. in 2016 that included comprehensive measures of screen time (including cell phones, computers, electronic devices, electronic games, andTV) and an array of psychological well-being measures. After 1 h/day of use, more hours of daily screen time were associated with lower psychological well-being,including less curiosity, lower self-control, more distractibility, more difficulty making friends, less emotional stability, being more difficult to care for, and inabilityto finish tasks. Among 14- to 17-year-olds, high users of screens (7+h/day vs. low users of 1 h/day) were more than twice as likely to ever have been diagnosed withdepression (RR 2.39, 95% CI 1.54, 3.70), ever diagnosed with anxiety (RR 2.26, CI 1.59, 3.22), treated by a mental health professional (RR 2.22, CI 1.62, 3.03) orhave taken medication for a psychological or behavioral issue (RR 2.99, CI 1.94, 4.62) in the last 12months. Moderate use of screens (4 h/day) was also associatedwith lower psychological well-being. Non-users and low users of screens generally did not differ in well-being. Associations between screen time and lower psy-chological well-being were larger among adolescents than younger children.
1. Introduction
A growing proportion of children and adolescents' leisure time isspent with screens including smartphones, tablets, gaming consoles,and televisions (Common Sense Media, 2015; Twenge et al., 2019),raising concerns about the effect of screen time on well-being amongparents, health professionals, and educators (e.g., Kardaras, 2017).These concerns have prompted physician organizations such as theAmerican Academy of Pediatrics (AAP) to recommend that parentslimit children's daily screen time, with specific time limits for preschoolchildren and a general suggestion of limiting time on screens for olderchildren and adolescents (Radesky and Christakis, 2016). In addition,the World Health Organization recently decided to include gamingdisorder in the 11th revision of the International Classification of Dis-eases (WHO, 2018).
Associations between screen time and poor health outcomes suchas obesity and lack of exercise have been well-documented (e.g.,Chiasson et al., 2016; de Jong et al., 2013; Dumuid et al., 2017;Poitras et al., 2017). However, research exploring associations be-
tween screen time and more psychological aspects of well-beingamong children and adolescents has been inconsistent. Some studiesfind significant associations between screen time and low well-being(Babic et al., 2017; Page et al., 2010; Romer et al., 2013; Rosen et al.,2014; Twenge et al., 2018a,b; Yang et al., 2013), while others find nulleffects or even benefits with greater screen time (Granic et al., 2014;Odgers, 2018; Przybylski and Weinstein, 2018; Valkenburg and Peter,2009). Thus, some have suggested that more research is needed beforeconcluding that screen time limits are justified, arguing that valuablephysician appointment time should not be devoted to discussingscreen time without sufficient evidence for significant associationswith well-being (Przybylski and Weinstein, 2017, 2018). Some re-searchers have made similar statements about the WHO characterizinggaming disorder as a mental health issue, maintaining that associa-tions between gaming and psychological well-being are not sub-stantial or consistent enough to justify such a classification (Davis,2018; van Rooij et al., 2018).
Theories and research on psychological well-being support thenotion of a broad concept including emotional stability, positive in-
https://doi.org/10.1016/j.pmedr.2018.10.003Received 9 September 2018; Received in revised form 30 September 2018; Accepted 14 October 2018
⁎ Corresponding author at: Department of Psychology, San Diego State University, 5500 Campanile Drive, San Diego, CA 92182-4611, United States of America.E-mail address: [email protected] (J.M. Twenge).
Preventive Medicine Reports 12 (2018) 271–283
Available online 18 October 20182211-3355/ © 2018 The Authors. Published by Elsevier Inc. This is an open access article under the CC BY license (http://creativecommons.org/licenses/BY/4.0/).

terpersonal relationships, self-control, and indicators of flourishing(Diener et al., 1999; Ryff, 1995) as well as diagnoses of mood dis-orders such as anxiety or depression (Manderscheid et al., 2010). Lowemotional stability, disrupted relationships, and low self-control haveall been implicated in greater morbidity and mortality (Graham et al.,2017; Shipley et al., 2007; Shor et al., 2013; Turiano et al., 2015), andmental health issues such as mood disorders are a significant riskfactor for morbidity and mortality, including via non-suicidal self-harm behaviors, suicide attempts, and completed suicides (Hawtonet al., 2013; Murray et al., 2012).
In terms of prevention, establishing possible causes and outcomes oflow psychological well-being is especially important for child andadolescent populations. Half of mental health problems develop byadolescence (Erskine et al., 2015). Thus, there is an acute need toidentify factors linked to mental health issues that are amenable tointervention in this population, as most antecedents (e.g., genetic pre-disposition, trauma, poverty) are difficult or impossible to influence.Compared to these more intractable antecedents of mental health, howchildren and adolescents spend their leisure time is more amenable tochange.
To our knowledge, few if any previous studies have examined abroad array of psychological well-being items in relation to screen time.Moreover, although other studies have examined associations betweenscreen time and symptoms of anxiety and depression, no previous studywe know of has examined associations between screen time and actualdiagnoses of anxiety or depression or reports of professional treatmentfor mental health issues. Furthermore, it is crucial for measures ofscreen time to include not just television but more recently introduceddigital media including electronic gaming, smartphones, tablets, andcomputers. In addition, studies using the same items to assess severalage groups of children and adolescents are rare, which is unfortunate as
Table 1Approximate hours a day of screen use by age group, U.S., 2016.
2 to 5 6 to 10 11 to 13 14 to 17 d
TV and video games 1.46 (1.09) 1.53 (1.10) 1.80 (1.39) 1.89 (1.39) 0.34Electronic devices 0.82 (0.96) 1.25 (1.11) 2.00 (1.40) 2.70 (1.53) 1.46Total screen time 2.28 (1.72) 2.78 (1.95) 3.80 (2.36) 4.59 (2.50) 1.06
Note: 1. SDs in parentheses.
0
0.5
1
1.5
2
2.5
3
3.5
4
4.5
5
2 3 4 5 6 7 8 9 10 11 12 13 14 15 16 17
Appr
oxim
ate
hour
s a
day
Age in years
Total screen!meElectronicdevicesTV & videogames
Fig. 1. Hours per day spent on all screens, electronic devices, and TV and video games by individual years of age, U.S., 2016. Error bars are±1 SE.
J.M. Twenge, W.K. Campbell Preventive Medicine Reports 12 (2018) 271–283
272
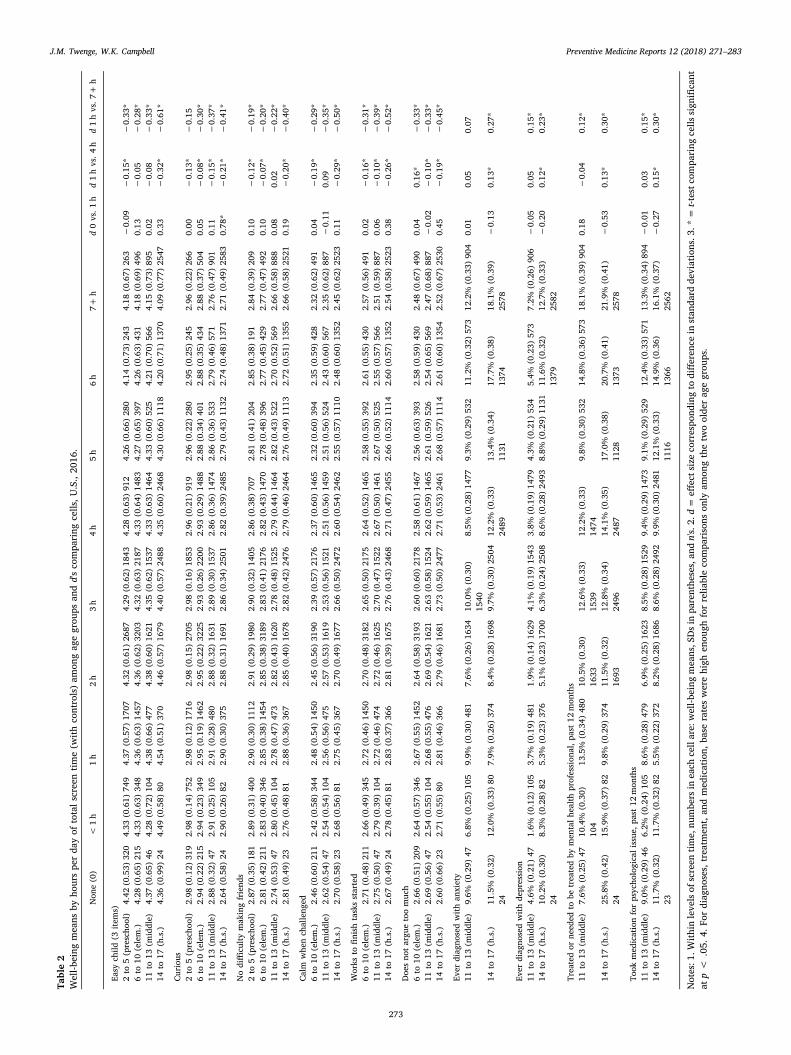
Table2
Well-b
eing
mea
nsby
hourspe
rda
yof
totals
cree
ntim
e(w
ithco
ntrols)am
ongag
egrou
psan
dd'sco
mpa
ring
cells
,U.S.,20
16.
Non
e(0)
<1h
1h
2h
3h
4h
5h
6h
7+h
d0vs.1
hd1hvs.4
hd1hvs.7
+h
Easy
child
(3ite
ms)
2to
5(prescho
ol)
4.42
(0.53)
320
4.33
(0.61)
749
4.37
(0.57)
1707
4.32
(0.61)
2687
4.29
(0.62)
1843
4.28
(0.63)
912
4.26
(0.66)
280
4.14
(0.73)
243
4.18
(0.67)
263
−0.09
−0.15
*−
0.33
*6to
10(elem.)
4.28
(0.65)
215
4.33
(0.63)
348
4.36
(0.63)
1457
4.36
(0.62)
3203
4.32
(0.63)
2187
4.33
(0.64)
1483
4.27
(0.65)
397
4.26
(0.63)
431
4.18
(0.69)
496
0.13
−0.05
−0.28
*11
to13
(middle)
4.37
(0.65)
464.28
(0.72)
104
4.38
(0.66)
477
4.38
(0.60)
1621
4.35
(0.62)
1537
4.33
(0.63)
1464
4.33
(0.60)
525
4.21
(0.70)
566
4.15
(0.73)
895
0.02
−0.08
−0.33
*14
to17
(h.s.)
4.36
(0.99)
244.49
(0.58)
804.54
(0.51)
370
4.46
(0.57)
1679
4.40
(0.57)
2488
4.35
(0.60)
2468
4.30
(0.66)
1118
4.20
(0.71)
1370
4.09
(0.77)
2547
0.33
−0.32
*−
0.61
*
Curiou
s2to
5(prescho
ol)
2.98
(0.12)
319
2.98
(0.14)
752
2.98
(0.12)
1716
2.98
(0.15)
2705
2.98
(0.16)
1853
2.96
(0.21)
919
2.96
(0.22)
280
2.95
(0.25)
245
2.96
(0.22)
266
0.00
−0.13
*−
0.15
6to
10(elem.)
2.94
(0.22)
215
2.94
(0.23)
349
2.95
(0.19)
1462
2.95
(0.22)
3225
2.93
(0.26)
2200
2.93
(0.29)
1488
2.88
(0.34)
401
2.88
(0.35)
434
2.88
(0.37)
504
0.05
−0.08
*−
0.30
*11
to13
(middle)
2.88
(0.32)
472.91
(0.25)
105
2.91
(0.28)
480
2.88
(0.32)
1631
2.89
(0.30)
1537
2.86
(0.36)
1474
2.86
(0.36)
533
2.79
(0.46)
571
2.76
(0.47)
901
0.11
−0.15
*−
0.37
*14
to17
(h.s.)
2.64
(0.58)
242.90
(0.26)
822.90
(0.30)
375
2.88
(0.31)
1691
2.86
(0.34)
2501
2.82
(0.39)
2485
2.79
(0.43)
1132
2.74
(0.48)
1371
2.71
(0.49)
2583
0.78
*−
0.21
*−
0.41
*
Nodifficu
ltymak
ingfriend
s2to
5(prescho
ol)
2.87
(0.35)
181
2.89
(0.31)
400
2.90
(0.30)
1112
2.91
(0.29)
1980
2.90
(0.32)
1405
2.86
(0.38)
707
2.81
(0.41)
204
2.85
(0.38)
191
2.84
(0.39)
209
0.10
−0.12
*−
0.19
*6to
10(elem.)
2.81
(0.42)
211
2.83
(0.40)
346
2.85
(0.38)
1454
2.85
(0.38)
3189
2.83
(0.41)
2176
2.82
(0.43)
1470
2.78
(0.48)
396
2.77
(0.45)
429
2.77
(0.47)
492
0.10
−0.07
*−
0.20
*11
to13
(middle)
2.74
(0.53)
472.80
(0.45)
104
2.78
(0.47)
473
2.82
(0.43)
1620
2.78
(0.48)
1525
2.79
(0.44)
1464
2.82
(0.43)
522
2.70
(0.52)
569
2.66
(0.58)
888
0.08
0.02
−0.22
*14
to17
(h.s.)
2.81
(0.49)
232.76
(0.48)
812.88
(0.36)
367
2.85
(0.40)
1678
2.82
(0.42)
2476
2.79
(0.46)
2464
2.76
(0.49)
1113
2.72
(0.51)
1355
2.66
(0.58)
2521
0.19
−0.20
*−
0.40
*
Calm
whe
nch
alleng
ed6to
10(elem.)
2.46
(0.60)
211
2.42
(0.58)
344
2.48
(0.54)
1450
2.45
(0.56)
3190
2.39
(0.57)
2176
2.37
(0.60)
1465
2.32
(0.60)
394
2.35
(0.59)
428
2.32
(0.62)
491
0.04
−0.19
*−
0.29
*11
to13
(middle)
2.62
(0.54)
472.54
(0.54)
104
2.56
(0.56)
475
2.57
(0.53)
1619
2.53
(0.56)
1521
2.51
(0.56)
1459
2.51
(0.56)
524
2.43
(0.60)
567
2.35
(0.62)
887
−0.11
0.09
−0.35
*14
to17
(h.s.)
2.70
(0.58)
232.68
(0.56)
812.75
(0.45)
367
2.70
(0.49)
1677
2.66
(0.50)
2472
2.60
(0.54)
2462
2.55
(0.57)
1110
2.48
(0.60)
1352
2.45
(0.62)
2523
0.11
−0.29
*−
0.50
*
Works
tofin
ishtasksstarted
6to
10(elem.)
2.71
(0.48)
211
2.66
(0.49)
345
2.72
(0.46)
1450
2.70
(0.48)
3182
2.65
(0.50)
2175
2.64
(0.52)
1465
2.58
(0.55)
392
2.61
(0.55)
430
2.57
(0.56)
491
0.02
−0.16
*−
0.31
*11
to13
(middle)
2.75
(0.50)
472.79
(0.39)
104
2.72
(0.46)
474
2.72
(0.46)
1625
2.70
(0.47)
1522
2.67
(0.50)
1461
2.67
(0.50)
525
2.55
(0.57)
566
2.51
(0.59)
887
0.06
−0.10
*−
0.39
*14
to17
(h.s.)
2.67
(0.49)
242.78
(0.45)
812.83
(0.37)
366
2.81
(0.39)
1675
2.76
(0.43)
2468
2.71
(0.47)
2455
2.66
(0.52)
1114
2.60
(0.57)
1352
2.54
(0.58)
2523
0.38
−0.26
*−
0.52
*
Doe
sno
targu
etoomuc
h6to
10(elem.)
2.66
(0.51)
209
2.64
(0.57)
346
2.67
(0.55)
1452
2.64
(0.58)
3193
2.60
(0.60)
2178
2.58
(0.61)
1467
2.56
(0.63)
393
2.58
(0.59)
430
2.48
(0.67)
490
0.04
0.16
*−
0.33
*11
to13
(middle)
2.69
(0.56)
472.54
(0.55)
104
2.68
(0.55)
476
2.69
(0.54)
1621
2.63
(0.58)
1524
2.62
(0.59)
1465
2.61
(0.59)
526
2.54
(0.65)
569
2.47
(0.68)
887
−0.02
−0.10
*−
0.33
*14
to17
(h.s.)
2.60
(0.66)
232.71
(0.55)
802.81
(0.46)
366
2.79
(0.46)
1681
2.73
(0.50)
2477
2.71
(0.53)
2461
2.68
(0.57)
1114
2.61
(0.60)
1354
2.52
(0.67)
2530
0.45
−0.19
*−
0.45
*
Ever
diag
nosedwith
anxiety
11to
13(m
iddle)
9.6%
(0.29)
476.8%
(0.25)
105
9.9%
(0.30)
481
7.6%
(0.26)
1634
10.0%
(0.30)
1540
8.5%
(0.28)
1477
9.3%
(0.29)
532
11.2%
(0.32)
573
12.2%
(0.33)
904
0.01
0.05
0.07
14to
17(h.s.)
11.5%
(0.32)
2412
.0%
(0.33)
807.9%
(0.26)
374
8.4%
(0.28)
1698
9.7%
(0.30)
2504
12.2%
(0.33)
2489
13.4%
(0.34)
1131
17.7%
(0.38)
1374
18.1%
(0.39)
2578
−0.13
0.13
*0.27
*
Ever
diag
nosedwith
depression
11to
13(m
iddle)
4.6%
(0.21)
471.6%
(0.12)
105
3.7%
(0.19)
481
1.9%
(0.14)
1629
4.1%
(0.19)
1543
3.8%
(0.19)
1479
4.3%
(0.21)
534
5.4%
(0.23)
573
7.2%
(0.26)
906
−0.05
0.05
0.15
*14
to17
(h.s.)
10.2%
(0.30)
248.3%
(0.28)
825.3%
(0.23)
376
5.1%
(0.23)
1700
6.3%
(0.24)
2508
8.6%
(0.28)
2493
8.8%
(0.29)
1131
11.6%
(0.32)
1379
12.7%
(0.33)
2582
−0.20
0.12
*0.23
*
Trea
tedor
need
edto
betrea
tedby
men
talh
ealth
profession
al,p
ast12
mon
ths
11to
13(m
iddle)
7.6%
(0.25)
4710
.4%
(0.30)
104
13.5%
(0.34)
480
10.5%
(0.30)
1633
12.6%
(0.33)
1539
12.2%
(0.33)
1474
9.8%
(0.30)
532
14.8%
(0.36)
573
18.1%
(0.39)
904
0.18
−0.04
0.12
*
14to
17(h.s.)
25.8%
(0.42)
2415
.9%
(0.37)
829.8%
(0.29)
374
11.5%
(0.32)
1693
12.8%
(0.34)
2496
14.1%
(0.35)
2487
17.0%
(0.38)
1128
20.7%
(0.41)
1373
21.9%
(0.41)
2578
−0.53
0.13
*0.30
*
Took
med
icationforpsyc
hologica
lissue
,past1
2mon
ths
11to
13(m
iddle)
9.0%
(0.29)
466.2%
(0.24)
105
8.6%
(0.28)
479
6.9%
(0.25)
1623
8.5%
(0.28)
1529
9.4%
(0.29)
1473
9.1%
(0.29)
529
12.4%
(0.33)
571
13.3%
(0.34)
894
−0.01
0.03
0.15
*14
to17
(h.s.)
11.7%
(0.32)
2311
.7%
(0.32)
825.5%
(0.22)
372
8.2%
(0.28)
1686
8.6%
(0.28)
2492
9.9%
(0.30)
2481
12.1%
(0.33)
1116
14.9%
(0.36)
1366
16.1%
(0.37)
2562
−0.27
0.15
*0.30
*
Notes:1
.With
inleve
lsof
screen
time,
numbe
rsin
each
cellare:
well-b
eing
mea
ns,S
Dsinpa
renthe
ses,an
dn's.2.d=
effects
izeco
rrespo
ndingto
diffe
renc
ein
stan
dard
deviations.3
.*=t-testc
ompa
ring
cells
sign
ifica
ntatp<
.05.
4.Fo
rdiag
noses,
trea
tmen
t,an
dmed
ication,
base
rateswerehigh
enou
ghforrelia
bleco
mpa
risons
only
amon
gthetw
oolde
rag
egrou
ps.
J.M. Twenge, W.K. Campbell Preventive Medicine Reports 12 (2018) 271–283
273

age may be a significant moderator of associations between screen timeand psychological well-being.
The current research aims to examine associations between screentime and a diverse array of measures of psychological well-being (in-cluding emotional stability, relationships with caregivers, self-control,diagnoses of mood disorders, and treatment of mental health issues)among a large population-based survey of the caregivers of childrenand adolescents ages 2 to 17 collected in 2016 in the U.S.
2. Method
2.1. Participants
Participants were the caregivers of 44,734 children and adoles-cents 2 years of age and older in the U.S. in the National Survey ofChildren's Health (NSCH) conducted in 2016 by the U.S. CensusBureau. As many items on psychological well-being were asked only ofcaregivers with children ages 2 and over, we restricted our analyses to
children ages 2 to 17.Households were contacted by mail at random to identify those with
children or adolescents 17 years old or younger. In every household,one child was randomly selected to be the subject of the survey. Thesurvey was administered either online or on paper, with an over-sampling of children with special health care needs. The response ratewas 40.7%. Data are publicly available on the NSCH website.
We excluded children and adolescents with at least one of 8 majorconditions that might affect their day-to-day functioning: Autism,blindness, cerebral palsy, deafness, Down Syndrome, developmentaldelay, epilepsy, or intellectual disability (mental retardation), as thesewere related to both well-being and to screen time. For example, among14- to 17-year-olds, 33% of those with zero daily use of screens had oneof these conditions, compared to an overall 10.1% base rate. The sur-vey's comprehensive screener for special health care needs could not beused as it also includes those who receive any mental health care ser-vices, which is a variable of interest. These exclusions resulted in asample n of 40,337.
Fig. 2. Mean score on the easy child index (1–5), by age and level of screen time, with controls, U.S., 2016. Error bars are± 1 SE.
J.M. Twenge, W.K. Campbell Preventive Medicine Reports 12 (2018) 271–283
274

In the final sample, the children and adolescents were 49.8% maleand 50.2% female and were 71% White, 16% Hispanic, 6% Black, and7% other. Family income was widely distributed, with 9% of childrenbelow the 100% poverty level and 44% with family incomes at the400% level or more. The sample was designed to be nationally re-presentative of all U.S. children at these ages but underrepresents somegroups due to lower response rates.
We grouped children and adolescents into four categories based onage that roughly correspond to educational levels: Preschoolers 2 to5 years old (n=9361), elementary schoolers 6 to 10 years old(n=10,668), middle schoolers 11 to 13 years old (n=7555), and highschoolers 14 to 17 years old (n=12,753). These categories also cor-respond to the structure of the survey, with some questions only askedof the caregivers of preschool children and others asked only of children6 years of age and up.
2.2. Measures
The survey asked two items about screen time. First, “On an average
weekday, about how much time does [child's name] spend in front of aTV watching TV programs, videos, or playing video games?” Second,“On an average weekday, about how much time does [child's name]spend with computers, cell phones, handheld video games, and otherelectronic devices, doing things other than schoolwork?” For both, re-sponse choices were recoded to none=0, less than an hour= 0.5, anhour= 1, 2 h= 2, 3 h= 3, and 4 or more hours= 5. For means, seeTable 1.
We added together the estimated number of hours spent on TV/video games and on digital media devices to create a measure of totalscreen time and recoded the results into 8 categories: None (no screentime),< 1 h (0.01 to 0.99), 1 h (1.00 to 1.49), 2 h (1.50 to 2.49), 3 h(2.50 to 3.49), 4 h (3.50 to 4.49), 5 h (4.50 to 5.49), 6 h (5.50 to 6.49)and 7 h or more (6.50 and higher). Among the two older groups, veryfew reported no screen time at all (n=46 for 11- to 13-year-olds andn=24 for 14- to 17-year-olds), so these cells should be interpreted withcaution.
We examined all items in the NSCH survey that measured psycho-logical well-being, broadly construed (see Supplemental material for
Fig. 3. Percentage not curious or interested in learning new things, by age and level of screen time, with controls, U.S., 2016. Error bars are±1 SE.
J.M. Twenge, W.K. Campbell Preventive Medicine Reports 12 (2018) 271–283
275

item wording including response choices). Most items did not correlatehighly enough to be combined into scales and are thus analyzed assingle items. The exceptions were three items measuring how easy thechild is and four items measuring self-control. We coded all items sothat higher scores indicated higher well-being.
2.3. Analysis plan
Analyses included controls for possible confounding variables: childrace (dummy variables for Black, Hispanic, and Other, with non-Hispanic White as the comparison group), child sex, child age, house-hold adults' highest grade completed (continuous, using the detaileditem including college education), family poverty ratio (a measure offamily income), and family structure (living with two biological/adoptive parents vs. not). We did not weight analyses and did not re-place missing data.
For items on a continuum, we report means in tables and percentlow in well-being in figures; categorical items (e.g., yes or no, such asdiagnoses of anxiety or depression) are reported as percentages in both.The tables report effect sizes (d, or difference in terms of standard de-viations) as well as p-values for t-tests comparing means at differentlevels of use. The text reports relative risk (RR) with 95% confidenceintervals (CIs) for dichotomized items.
We first examine items asked of caregivers of several ages of chil-dren and then those asked only of caregivers of preschool children.Given the curvilinear relationship between screen time and well-beingfound in previous research (Przybylski and Weinstein, 2017; Twengeet al., 2018b), we identified the inflection point at which the trend inwell-being moved from positive to negative to inform our analyses(Simonsohn, 2017). Thus, we compare no use to low levels of use, lowuse to moderate use, and low use to high use.
Fig. 4. Percentage who do not stay calm when challenged, by age and level of screen time, with controls, U.S., 2016. Error bars are± 1 SE.
J.M. Twenge, W.K. Campbell Preventive Medicine Reports 12 (2018) 271–283
276

3. Results
3.1. Age differences in screen time
Total screen time averaged 3.20 h a day (SD=2.40) and was pro-gressively higher among older children, primarily driven by more timespent on electronic devices (see Table 1 and Fig. 1). The largest increasein screen time occurred between elementary school and middle school.By high school (ages 14 to 17), adolescents spent 4 h and 35min a daywith screens according to caregivers' reports.
3.2. Screen time and well-being
The association between screen time and well-being was not linearand showed an inflection point at 1 h/day of use for most measures (seeTable 2 and Figs. 2–6). With one exception (the item on curiosity), well-
being did not differ significantly between those spending no time onscreens and those spending an hour a day. After an hour a day, how-ever, increasing screen time was generally linked to progressively lowerpsychological well-being. In terms of relative risk (RR), high users ofscreens (7+ h/day) carried twice the risk of low well-being as low users(1 h/day), including not staying calm (e.g., among 14- to 17-year-olds,RR 2.08, 95% CI 1.72, 2.50), not finishing tasks (RR 2.53, CI 2.01,3.20), not being curious (RR 2.72, CI 2.00, 3.71), and arguing too muchwith caregivers (RR 2.34, CI 1.85, 2.97; see Figs. 2–6). High (vs. low)users of screens were also described as more difficult to care for. Effectsizes were generally larger among adolescents than among children.
In most cases, moderate users of screens (4 h/day) were also sig-nificantly lower in well-being than low users (1 h/day), though withlower effect sizes (see Table 2). Among 14- to 17-year-olds, moderateusers (vs. low users) were 78% more likely to not be curious (RR 1.78,CI 1.30, 2.43), 60% more likely to not stay calm when challenged (RR
Fig. 5. Percentage who do not finish tasks started, by age and level of screen time, with controls, U.S., 2016. Error bars are±1 SE.
J.M. Twenge, W.K. Campbell Preventive Medicine Reports 12 (2018) 271–283
277

1.60, CI 1.32, 1.93), 66% more likely to not finish tasks they started (RR1.66, CI 1.31, 2.11), and 57% more likely to argue too much with theircaregivers (RR 1.57, CI 1.24, 2.00; see Figs. 2–6). As with the com-parisons between low and high use, differences in well-being betweenlow and moderate users were smaller among younger children thanamong older adolescents.
3.3. Screen time and diagnoses of anxiety and depression
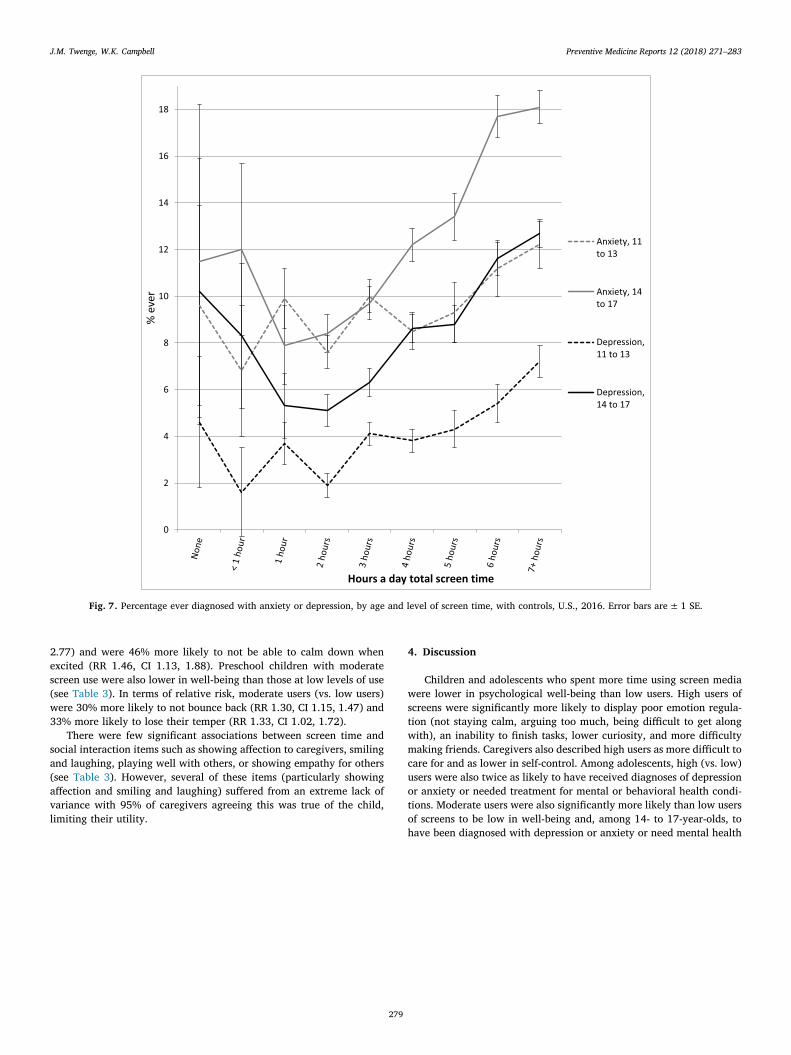
High users of screens were also significantly more likely to havebeen diagnosed with anxiety or depression. Fourteen to 17-year-oldsspending 7+h/day with screens (vs. 1 h/day) were more than twice aslikely to ever have been diagnosed with depression (RR 2.39, 95% CI1.54, 3.70) or anxiety (RR 2.26, CI 1.59, 3.22; see Fig. 7). High users ofscreens were also more likely to have seen or needed to have been seenby a mental health professional (RR 2.22, CI 1.62, 3.03), and morelikely to have taken medication for a psychological issue (RR 2.99, CI
1.94, 4.62; see Fig. 8) in the last 12months. Moderate use was alsolinked to a greater risk of depression (RR 1.61, CI 1.03, 2.52) and an-xiety diagnoses (RR 1.52, CI 1.06, 2.18) among 14- to 17-year-olds,though not among 11- to 13-year-olds.
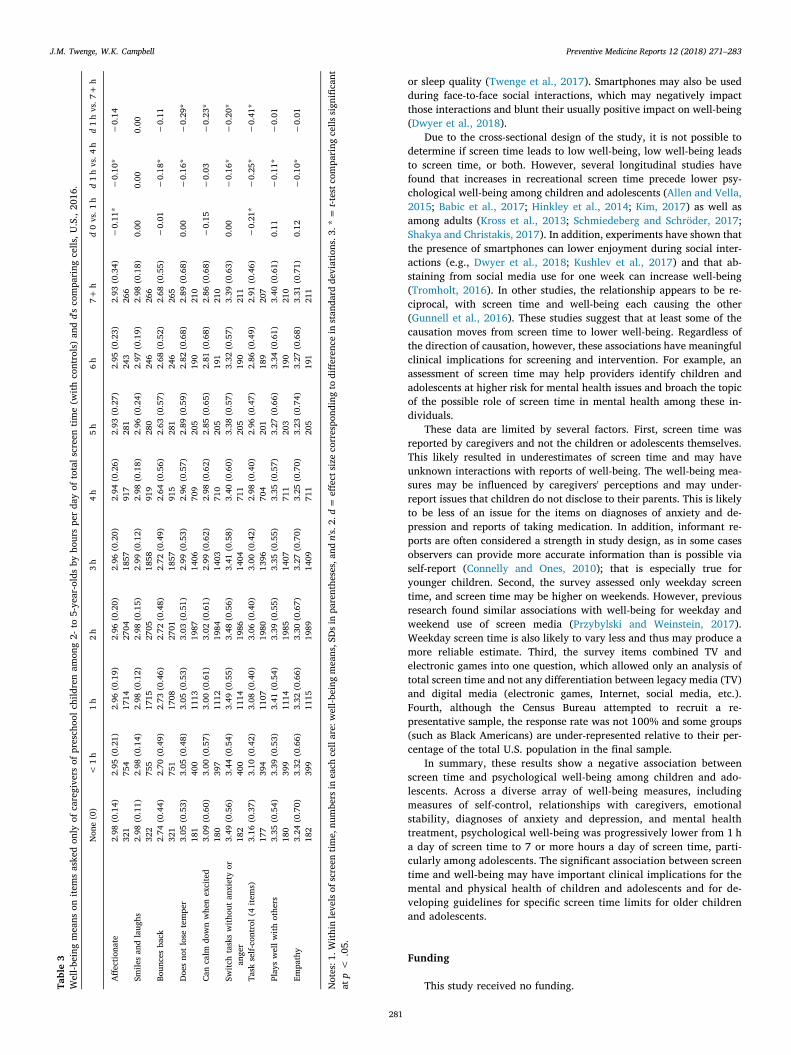
3.4. Screen time and well-being items asked only of caregivers of preschoolchildren
We next examined the items asked only of caregivers of preschoolchildren. High users of screens were more likely to lose their temper,less likely to calm down when excited, and less likely to switch taskswithout anxiety or anger (see Table 3 and Fig. 9). The largest effect sizeappeared for self-control (d=−0.41), which included perseverance,sitting still, completing simple tasks, and not becoming distracted; bothhigh and moderate users of screens displayed significantly lower self-control than low users. In terms of relative risk, high (vs. low) users ofscreens were twice as likely to often lose their temper (RR 1.99, CI 1.44,
Fig. 6. Percentage who argue too much with their caregivers, by age and level of screen time, with controls, U.S., 2016. Error bars are± 1 SE.
J.M. Twenge, W.K. Campbell Preventive Medicine Reports 12 (2018) 271–283
278
2.77) and were 46% more likely to not be able to calm down whenexcited (RR 1.46, CI 1.13, 1.88). Preschool children with moderatescreen use were also lower in well-being than those at low levels of use(see Table 3). In terms of relative risk, moderate users (vs. low users)were 30% more likely to not bounce back (RR 1.30, CI 1.15, 1.47) and33% more likely to lose their temper (RR 1.33, CI 1.02, 1.72).
There were few significant associations between screen time andsocial interaction items such as showing affection to caregivers, smilingand laughing, playing well with others, or showing empathy for others(see Table 3). However, several of these items (particularly showingaffection and smiling and laughing) suffered from an extreme lack ofvariance with 95% of caregivers agreeing this was true of the child,limiting their utility.
4. Discussion
Children and adolescents who spent more time using screen mediawere lower in psychological well-being than low users. High users ofscreens were significantly more likely to display poor emotion regula-tion (not staying calm, arguing too much, being difficult to get alongwith), an inability to finish tasks, lower curiosity, and more difficultymaking friends. Caregivers also described high users as more difficult tocare for and as lower in self-control. Among adolescents, high (vs. low)users were also twice as likely to have received diagnoses of depressionor anxiety or needed treatment for mental or behavioral health condi-tions. Moderate users were also significantly more likely than low usersof screens to be low in well-being and, among 14- to 17-year-olds, tohave been diagnosed with depression or anxiety or need mental health
Fig. 7. Percentage ever diagnosed with anxiety or depression, by age and level of screen time, with controls, U.S., 2016. Error bars are±1 SE.
J.M. Twenge, W.K. Campbell Preventive Medicine Reports 12 (2018) 271–283
279

treatment. Non-users generally did not significantly differ in well-beingfrom low users of screens.
The AAP recommendations set specific screen time limits only forchildren 5 years of age and younger. One set of researchers questionedthese limits based on null correlations between screen time and fourwell-being items included in the 2011 NSCH (Przybylski and Weinstein,2018). However, the more comprehensive set of well-being items in the2016 NSCH produces significant associations between screen time andwell-being on 18 of 19 indicators, providing substantial support forscreen time limits. Notably, we found that the association betweenscreen time and low well-being was larger for adolescents than foryounger children, consistent with at least one earlier study (Rosenet al., 2014). This suggests that the AAP and other organizations fo-cused on public health might consider extending recommendations forspecific limits on screen time to preteens and teens.
It is worth speculating about why the associations between screentime and psychological well-being were larger among adolescents.One possibility is that adolescents, compared to younger children, are
considerably more likely to have social media accounts and to spendmore time online. Peer relationships are particularly important foradolescents (Fuligni and Eccles, 1993), and if social media replacesface-to-face interaction, that may have a negative impact on well-being and mental health. Time spent on social media, gaming, andonline is more strongly correlated with low well-being than watchingTV/videos, and TV/videos are the more common screen activity foryounger children (Rosen et al., 2014). Unfortunately, associationswith well-being for TV vs. other screen activities cannot be de-termined in this dataset as time spent on TV and electronic gamingwas included in the same item.
Adolescents are also more likely than younger children to have theirown smartphone (Rosen et al., 2014), which allows the use of tech-nology in more situations. This may increase the possibility of Internetaddiction, excessive gaming, or problematic social media use, whichhas been linked to low well-being (Satici and Uysal, 2015). It may alsoincrease the impact on sleep, as smartphones may be brought into thebedroom or even the bed, with negative impacts on sleep duration and/
Fig. 8. Percentage receiving mental health treatment and percentage taking medication for psychological issues during the last 12months, by age and level of screentime, with controls, U.S., 2016. Error bars are± 1 SE.
J.M. Twenge, W.K. Campbell Preventive Medicine Reports 12 (2018) 271–283
280
or sleep quality (Twenge et al., 2017). Smartphones may also be usedduring face-to-face social interactions, which may negatively impactthose interactions and blunt their usually positive impact on well-being(Dwyer et al., 2018).
Due to the cross-sectional design of the study, it is not possible todetermine if screen time leads to low well-being, low well-being leadsto screen time, or both. However, several longitudinal studies havefound that increases in recreational screen time precede lower psy-chological well-being among children and adolescents (Allen and Vella,2015; Babic et al., 2017; Hinkley et al., 2014; Kim, 2017) as well asamong adults (Kross et al., 2013; Schmiedeberg and Schröder, 2017;Shakya and Christakis, 2017). In addition, experiments have shown thatthe presence of smartphones can lower enjoyment during social inter-actions (e.g., Dwyer et al., 2018; Kushlev et al., 2017) and that ab-staining from social media use for one week can increase well-being(Tromholt, 2016). In other studies, the relationship appears to be re-ciprocal, with screen time and well-being each causing the other(Gunnell et al., 2016). These studies suggest that at least some of thecausation moves from screen time to lower well-being. Regardless ofthe direction of causation, however, these associations have meaningfulclinical implications for screening and intervention. For example, anassessment of screen time may help providers identify children andadolescents at higher risk for mental health issues and broach the topicof the possible role of screen time in mental health among these in-dividuals.
These data are limited by several factors. First, screen time wasreported by caregivers and not the children or adolescents themselves.This likely resulted in underestimates of screen time and may haveunknown interactions with reports of well-being. The well-being mea-sures may be influenced by caregivers' perceptions and may under-report issues that children do not disclose to their parents. This is likelyto be less of an issue for the items on diagnoses of anxiety and de-pression and reports of taking medication. In addition, informant re-ports are often considered a strength in study design, as in some casesobservers can provide more accurate information than is possible viaself-report (Connelly and Ones, 2010); that is especially true foryounger children. Second, the survey assessed only weekday screentime, and screen time may be higher on weekends. However, previousresearch found similar associations with well-being for weekday andweekend use of screen media (Przybylski and Weinstein, 2017).Weekday screen time is also likely to vary less and thus may produce amore reliable estimate. Third, the survey items combined TV andelectronic games into one question, which allowed only an analysis oftotal screen time and not any differentiation between legacy media (TV)and digital media (electronic games, Internet, social media, etc.).Fourth, although the Census Bureau attempted to recruit a re-presentative sample, the response rate was not 100% and some groups(such as Black Americans) are under-represented relative to their per-centage of the total U.S. population in the final sample.
In summary, these results show a negative association betweenscreen time and psychological well-being among children and ado-lescents. Across a diverse array of well-being measures, includingmeasures of self-control, relationships with caregivers, emotionalstability, diagnoses of anxiety and depression, and mental healthtreatment, psychological well-being was progressively lower from 1 ha day of screen time to 7 or more hours a day of screen time, parti-cularly among adolescents. The significant association between screentime and well-being may have important clinical implications for themental and physical health of children and adolescents and for de-veloping guidelines for specific screen time limits for older childrenand adolescents.
Funding
This study received no funding.Table3
Well-b
eing
mea
nson
itemsaske
don
lyof
caregive
rsof
presch
oolc
hildrenam
ong2-
to5-ye
ar-oldsby
hourspe
rda
yof
totals
cree
ntim
e(w
ithco
ntrols)an
dd'sco
mpa
ring
cells
,U.S.,20
16.
Non
e(0)
<1h
1h
2h
3h
4h
5h
6h
7+h
d0vs.1
hd1hvs.4
hd1hvs.7
+h
Affe
ctiona
te2.98
(0.14)
321
2.95
(0.21)
754
2.96
(0.19)
1714
2.96
(0.20)
2704
2.96
(0.20)
1857
2.94
(0.26)
917
2.93
(0.27)
281
2.95
(0.23)
243
2.93
(0.34)
266
−0.11
*−
0.10
*−
0.14
Smile
san
dlaug
hs2.98
(0.11)
322
2.98
(0.14)
755
2.98
(0.12)
1715
2.98
(0.15)
2705
2.99
(0.12)
1858
2.98
(0.18)
919
2.96
(0.24)
280
2.97
(0.19)
246
2.98
(0.18)
266
0.00
0.00
0.00
Boun
cesba
ck2.74
(0.44)
321
2.70
(0.49)
751
2.73
(0.46)
1708
2.72
(0.48)
2701
2.72
(0.49)
1857
2.64
(0.56)
915
2.63
(0.57)
281
2.68
(0.52)
246
2.68
(0.55)
265
−0.01
−0.18
*−
0.11
Doe
sno
tlose
tempe
r3.05
(0.53)
181
3.05
(0.48)
400
3.05
(0.53)
1113
3.03
(0.51)
1987
2.99
(0.53)
1406
2.96
(0.57)
709
2.89
(0.59)
205
2.82
(0.68)
190
2.89
(0.68)
210
0.00
−0.16
*−
0.29
*
Canca
lmdo
wnwhe
nex
cited
3.09
(0.60)
180
3.00
(0.57)
397
3.00
(0.61)
1112
3.02
(0.61)
1984
2.99
(0.62)
1403
2.98
(0.62)
710
2.85
(0.65)
205
2.81
(0.68)
191
2.86
(0.68)
210
−0.15
−0.03
−0.23
*
Switc
htaskswith
outan
xietyor
ange
r3.49
(0.56)
182
3.44
(0.54)
400
3.49
(0.55)
1114
3.48
(0.56)
1986
3.41
(0.58)
1404
3.40
(0.60)
711
3.38
(0.57)
205
3.32
(0.57)
190
3.39
(0.63)
211
0.00
−0.16
*−
0.20
*
Task
self-co
ntrol(
4ite
ms)
3.16
(0.37)
177
3.10
(0.42)
394
3.08
(0.40)
1107
3.06
(0.40)
1980
3.00
(0.42)
1396
2.98
(0.40)
704
2.96
(0.47)
201
2.86
(0.49)
189
2.91
(0.46)
207
−0.21
*−
0.25
*−
0.41
*
Play
swellw
ithothe
rs3.35
(0.54)
180
3.39
(0.53)
399
3.41
(0.54)
1114
3.39
(0.55)
1985
3.35
(0.55)
1407
3.35
(0.57)
711
3.27
(0.66)
203
3.34
(0.61)
190
3.40
(0.61)
210
0.11
−0.11
*−
0.01
Empa
thy
3.24
(0.70)
182
3.32
(0.66)
399
3.32
(0.66)
1115
3.30
(0.67)
1989
3.27
(0.70)
1409
3.25
(0.70)
711
3.23
(0.74)
205
3.27
(0.68)
191
3.31
(0.71)
211
0.12
−0.10
*−
0.01
Notes:1
.With
inleve
lsof
screen
time,
numbe
rsin
each
cellare:
well-b
eing
mea
ns,S
Dsinpa
renthe
ses,an
dn's.2.d=
effects
izeco
rrespo
ndingto
diffe
renc
ein
stan
dard
deviations.3
.*=t-testc
ompa
ring
cells
sign
ifica
ntatp<
.05.
J.M. Twenge, W.K. Campbell Preventive Medicine Reports 12 (2018) 271–283
281

Conflict of interest statement
The authors declare that there are no conflicts of interest.
Appendix A. Supplementary data
Supplementary data to this article can be found online at https://doi.org/10.1016/j.pmedr.2018.10.003.
References
Allen, M.S., Vella, S.A., 2015. Screen-based sedentary behaviour and psychosocial well-being in childhood: cross-sectional and longitudinal associations. Ment. Health andPhys. Act. 9, 41–47.
Babic, M.J., Smith, J.J., Morgan, P.J., Eather, N., Plotnikoff, R.C., Lubans, D.R., 2017.Longitudinal associations between changes in screen-time and mental health out-comes in adolescents. Ment. Health and Phys. Act. 12, 124–131.
Chiasson, M.A., Scheinmann, R., Hartel, D., et al., 2016. Predictors of obesity in a cohortof children enrolled in WIC as infants and retained to 3 years of age. J. CommunityHealth 41, 127–133.
Common Sense Media, 2015. Landmark report: U.S. teens use an average of nine hours ofmedia per day, tweens use six hours. https://www.commonsensemedia.org/about-us/news/press-releases/landmark-report-us-teens-use-an-average-of-nine-hours-of-media-per-day.
Connelly, B.S., Ones, D.S., 2010. An other perspective on personality: meta-analytic in-tegration of observers' accuracy and predictive validity. Psychol. Bull. 136,1092–1122.
Davis, N., 2018. Screen Time Harm to Children is Unproven, Say Experts. The Guardian.https://www.theguardian.com/science/2018/jun/21/screen-time-harm-to-children-is-unproven-say-experts (June 21).
de Jong, E., Visscher, T.L.S., HiraSing, R.A., Heymans, M.W., Seidell, J.C., Renders, C.M.,2013. Association between TV viewing, computer use and overweight, determinantsand competing activities of screen time in 4- to 13-year-old children. Int. J. Obes. 37,47–53.
Diener, E., Suh, E.M., Lucas, R.E., Smith, H.L., 1999. Subjective well-being: three decadesof progress. Psychol. Bull. 125, 276–302.
Dumuid, D., Olds, T., Lewis, L.K., et al., 2017. Health-related quality of life and lifestyle
behavior clusters in school-aged children from 12 countries. J. Pediatr. 183, 178–183.Dwyer, R., Kushlev, K., Dunn, E., 2018. Smartphone use undermines enjoyment of face-to-
face social interactions. J. Exp. Soc. Psychol. 78, 233–239.Erskine, H., Moffitt, T., Copeland, W., et al., 2015. A heavy burden on young minds: the
global burden of mental and substance use disorders in children and youth. Psychol.Med. 45, 1551–1563.
Fuligni, A.J., Eccles, J.S., 1993. Perceived parent-child relationships and early adoles-cents' orientation toward peers. Dev. Psychol. 29, 622–632.
Graham, E.K., Rutsohn, J.P., Turiano, N.A., et al., 2017. Personality predicts mortalityrisk: an integrative data analysis of 15 international longitudinal studies. J. Res. Pers.70, 174–186.
Granic, I., Lobel, A., Engels, R.E., 2014. The benefits of playing video games. Am. Psychol.69, 66–78.
Gunnell, K.E., Flament, M.F., Buchholz, A., et al., 2016. Examining the bidirectional re-lationship between physical activity, screen time, and symptoms of anxiety and de-pression over time during adolescence. Prev. Med. 88, 147–152.
Hawton, K., Casanas, I., Conabella, C., Haw, C., Saunders, K., 2013. Risk factors forsuicide in individuals with depression: a systematic review. J. Affect. Disord. 147,17–28.
Hinkley, T., Verbestel, V., Ahrens, W., et al., 2014. Early childhood electronic media useas a predictor of poorer well-being: a prospective cohort study. JAMA Pediatr. 168,485–492.
Kardaras, N., 2017. Glow Kids: How Screen Addition is Hijacking Our Kids – And How toBreak the Trance. St. Martin's Griffin, New York.
Kim, H.H., 2017. The impact of online social networking on adolescent psychologicalwell-being (WB): a population-level analysis of Korean school-aged children. Int. J.Adolesc. Youth 22, 364–376.
Kross, E., Verduyn, P., Demiralp, E., et al., 2013. Facebook use predicts declines in sub-jective well-being in young adults. PLoS One 8, e69841.
Kushlev, K., Proulx, J.E., Dunn, E.W., 2017. Digitally connected, socially disconnected:the effects of relying on technology rather than other people. Comput. Hum. Behav.76, 68–74.
Manderscheid, R.W., Ryff, C.D., Freeman, E.J., McKnight-Eily, L.R., Dhingra, S., Strine,T.W., 2010. Evolving definitions of mental illness and wellness. Prev. Chronic Dis. 7,A19.
Murray, C.J.L., Vos, T., Lozano, R., et al., 2012. Disability-adjusted life years (DALYs) for291 diseases and injuries in 21 regions, 1990–2010: a systematic analysis for theGlobal Burden of Disease Study 2010. Lancet 380, 2197–2223.
Odgers, C., 2018. Smartphones are bad for some teens, not all. Nature 554, 432–434(February 22).
Page, A.S., Cooper, A.R., Griew, P., Jago, R.P., 2010. Children's screen viewing is related
Fig. 9. Percentage who do not bounce back, often lose their temper, or cannot calm down when excited or wound up, by total screen time, 2- to 5-year-old children,with controls, U.S., 2016. Error bars are±1 SE.
J.M. Twenge, W.K. Campbell Preventive Medicine Reports 12 (2018) 271–283
282

to physiological difficulties irrespective of physical activity. Pediatrics 126,1011–1017.
Poitras, V.J., Gray, C.E., Janssen, X., et al., 2017. Systematic review of the relationshipsbetween sedentary behaviour and health indicators in the early years (0–4 years).BMC Public Health 17, 868.
Przybylski, A.K., Weinstein, N., 2017. A large-scale test of the Goldilocks hypothesis:quantifying the relations between digital-screen use and the mental well-being ofadolescents. Psychol. Sci. 28, 204–215.
Przybylski, A.K., Weinstein, N., 2018. Digital screen time limits and young children'spsychological well-being: evidence from a population-based study. Child Dev.
Radesky, J., Christakis, D., 2016. Media and young minds. Policy statement of theAmerican Academy of Pediatrics. Pediatrics 138.
Romer, D., Bagdasarov, Z., More, E., 2013. Older versus newer media and the well-beingof United States youth: results from a national longitudinal panel. J. Adolesc. Health52, 613–619.
Rosen, L.D., Lim, A.F., Felt, J., et al., 2014. Media and technology use predicts ill-beingamong children, preteens and teenagers independent of the negative health impactsof exercise and eating habits. Comput. Hum. Behav. 35, 364–375.
Ryff, C.D., 1995. Psychological well-being in adult life. Curr. Dir. Psychol. Sci. 4, 99–104.Satici, S.A., Uysal, R., 2015. Well-being and problematic Facebook use. Comput. Hum.
Behav. 49, 185–190.Schmiedeberg, C., Schröder, J., 2017. Leisure activities and life satisfaction: an analysis
with German panel data. Appl. Res. Qual. Life 12, 137–151.Shakya, H.B., Christakis, N.A., 2017. Association of Facebook use with compromised well-
being: a longitudinal study. Am. J. Epidemiol. 185, 203–211.Shipley, B.A., Weiss, A., Der, G., Taylor, M.D., Deary, I.J., 2007. Neuroticism, extraver-
sion, and mortality in the UK Health and Lifestyle Survey: a 21-year prospectivecohort study. Psychosom. Med. 69, 923–931.
Shor, E., Roelfs, D.J., Yogev, T., 2013. The strength of family ties: a meta-analysis and
meta-regression of self-reported social support and mortality. Soc. Networks 35,626–638.
Simonsohn, U., 2017. Two-lines: the first valid test of U-shaped relationships. http://urisohn.com/papers/u_shape.pdf.
Tromholt, M., 2016. The Facebook experiment: quitting Facebook leads to higher levels ofwell-being. Cyberpsychol. Behav. Soc. Netw. 19, 661–666.
Turiano, N.A., Chapman, B.P., Gruenewald, T.L., Mroczek, D.K., 2015. Personality andthe leading behavioral contributors of mortality. Health Psychol. 34, 51–60.
Twenge, J.M., Krizan, Z., Hisler, G., 2017. Decreases in self-reported sleep durationamong U.S. adolescents 2009–2015 and links to new media screen time. Sleep Med.39, 47–53.
Twenge, J.M., Joiner, T.E., Rogers, M.L., Martin, G.N., 2018a. Increases in depressivesymptoms, suicide-related outcomes, and suicide rates among U.S. adolescents after2010 and links to increased new media screen time. Clin. Psychol. Sci. 6, 3–17.
Twenge, J.M., Martin, G.N., Campbell, W.K., 2018b. Decreases in psychological well-being among American adolescents after 2012 and links to screen time during the riseof smartphone technology. Emotion 18, 765–780.
Twenge, J.M., Martin, G.N., Spitzberg, B.H., 2019. Trends in U.S. adolescents' media use,1976–2016: the rise of digital media, the decline of TV, and the (near) demise ofprint. Psychol. Pop. Media Cult.
Valkenburg, P.M., Peter, J., 2009. Social consequences of the Internet for adolescents: adecade of research. Curr. Dir. Psychol. Sci. 18, 1–5.
van Rooij, A.J., Ferguson, C.J., Colder Carras, M., et al., 2018. A weak scientific basis forgaming disorder: let us err on the side of caution. J. Behav. Addict. 7, 1–9.
WHO: World Health Organization, 2018. Gaming disorder: online Q&A. http://www.who.int/features/qa/gaming-disorder/en/ (January).
Yang, F., Helgason, A.R., Sigfusdottir, I.D., Kristjansson, A.L., 2013. Electronic screen useand mental well-being of 10–12-year-old children. Eur. J. Pub. Health 23, 492–498.
J.M. Twenge, W.K. Campbell Preventive Medicine Reports 12 (2018) 271–283
283