aster plan for chennai port
TRANSCRIPT
Master Plan Report - Final March 2017
MASTER PLAN FOR CHENNAI PORT

Master Plan for Chennai Port
Prepared for
Ministry of Shipping / Indian Ports Association
Transport Bhawan,
Sansad Marg,
New Delhi,110001
www.shipping.nic.in
1st Floor, South Tower, NBCC Place
B. P Marg, Lodi Road
New Delhi - 110 003
www.ipa.nic.in
Prepared by
AECOM India Private Limited 9th Floor, Infinity Tower C, DLF Cyber City, DLF Phase II, Gurgaon, Haryana, India, Pin 122002, India Telephone: +91 124 4830100, Fax: +91 124 4830108 www.aecom.com
March 2017
© AECOM India Private Limited 2017
The information contained in this document produced by AECOM India Private Limited is solely for the use of the Client identified
on the cover sheet for the purpose for which it has been prepared and AECOM India Private Limited undertakes no duty to or
accepts any responsibility to any third party who may rely upon this document.
All rights reserved. No section or element of this document may be removed from this document, reproduced, electronically stored
or transmitted in any form without the written permission of AECOM India Private Limited.

Final Report
Quality Information
Client: Ministry of Shipping / Indian Ports Association Contract No. (if any):
Project Title: SAGARMALA: Master Plan for Chennai Port Project No.: DELD15005
Document No: DELD15005-REP-0000-CP-1005
SharePoint Ref:
Controlled Copy No:
Document Title: Master Plan for Chennai Port
Covering Letter/ Transmittal Ref. No: Date of Issue: 31 March 2017
Revision, Review and Approval Records
F. Master Plan for Chennai Port - Final
ASM 31.03.2017
SG 31.03.2017
SG 31.03.2017
E. Master Plan for Chennai Port - Final
ASM 19.09.2016
SJ 19.09.2016
SG 19.09.2016
D. Master Plan for Chennai Port - Final
ASM 25.08.2016
SJ 25.08.2016
SG 26.08.2016
C. Master Plan for Chennai Port - Final
ASM 20.07.2016
SJ 21.07.2016
SG 21.07.2016
B. Master Plan for Chennai Port - Final
SJ 10.06.2016
ASM 12.06.2016
SG 15.06.2016
A. Master Plan for Chennai Port - Draft SJ
04.02.2016 ASM
04.02.2016 SG
04.02.2016
Revision Description Prepared by/
date Reviewed by/
date Approved by/
date
Document Revision Register
Issue no.
Date of issue
Revision Details Revision By Name &
Position
1. 15.06.2016 Incorporating comments on draft Master Plan report
Hemanth Jayaraman Manager
2. 21.07.2016 Incorporating comments on Final Master Plan report
Hemanth Jayaraman Manager
3. 26.08.2016 Incorporating comments on Final Master Plan report
Hemanth Jayaraman Manager
4. 19.09.2016 Incorporating comments on Final Master Plan report
Amit Magadum
Associate
5. 31.03.2017 Revised as per Berthing Policy Details Amit Magadum
Associate
SAGARMALA: Master Plan for Chennai Port i Final Report
Table of Contents
EXECUTIVE SUMMARY ................................................................................................................................... VII
PORT CAPACITY – CURRENT STATUS AND FUTURE AUGMENTATION ...................................................................................... IX
PORT CONNECTIVITY ................................................................................................................................................. XII
1.0 INTRODUCTION .................................................................................................................................. 1-1
BACKGROUND ........................................................................................................................................... 1-1
SCOPE OF WORK ....................................................................................................................................... 1-2
OUTLINE OF THE REPORT ............................................................................................................................. 1-3
PRESENT SUBMISSION ................................................................................................................................ 1-3
2.0 THE PORT AND SITE CONDITIONS ....................................................................................................... 2-1
CHENNAI PORT AS AT PRESENT ..................................................................................................................... 2-1
RAIL AND ROAD CONNECTIVITY .................................................................................................................... 2-2
2.2.1 Road Connectivity ......................................................................................................................... 2-2
2.2.2 Rail Connectivity ........................................................................................................................... 2-2
SITE CONDITIONS ....................................................................................................................................... 2-3
2.3.1 Meteorology ................................................................................................................................. 2-3
Winds ............................................................................................................................................ 2-3
Rainfall .......................................................................................................................................... 2-4
Air Temperature ............................................................................................................................ 2-4
2.3.2 Oceanography ............................................................................................................................... 2-4
Tides .............................................................................................................................................. 2-4
Currents ........................................................................................................................................ 2-4
Waves ........................................................................................................................................... 2-4
3.0 DETAILS OF EXISTING FACILITIES......................................................................................................... 3-1
EXISTING FACILITIES ................................................................................................................................... 3-1
BHARATHI DOCK (BD) ................................................................................................................................ 3-2
3.2.1 POL Berths - BD I and BD III ........................................................................................................... 3-2
3.2.2 Berth BD II ..................................................................................................................................... 3-3
3.2.3 Chennai Container Terminal Pvt Ltd. (CCTPL) ............................................................................... 3-3
DR. AMBEDKAR DOCK (AD) ........................................................................................................................ 3-4
3.3.1 North Quay and West Quay Berths ............................................................................................... 3-5
3.3.2 South Quay Berths ........................................................................................................................ 3-6
3.3.3 Chennai International Container Terminal Pvt. Ltd. (CITPL) ......................................................... 3-6
JAWAHAR DOCK (JD) ................................................................................................................................. 3-7
3.4.1 JD East Berths (JD II, JD IV & JD VI) ............................................................................................... 3-8
3.4.2 JD West Berths (JD I, JD III & JD V) ................................................................................................ 3-8
OTHER FACILITIES AT THE PORT .................................................................................................................... 3-9
BULK LIQUID STORAGE & LINKAGES .............................................................................................................. 3-9
3.6.1 Tankage & Linkage on the Northern Side ..................................................................................... 3-9
3.6.2 Tankage & Linkage on the Southern Side ................................................................................... 3-11

SAGARMALA: Master Plan for Chennai Port ii Final Report
4.0 PERFORMANCE, OPTIONS FOR DEBOTTLENECKING & CAPACITY ASSESSMENT .................................. 4-1
GENERAL.................................................................................................................................................. 4-1
PERFORMANCE OF THE BERTHS .................................................................................................................... 4-1
BCG BENCHMARKING STUDY ....................................................................................................................... 4-5
4.3.1 Observations on CCTPL ................................................................................................................. 4-5
4.3.2 Observations on Edible Oil Traffic ................................................................................................. 4-6
4.3.3 Observations on Fertiliser Traffic .................................................................................................. 4-7
MEASURES FOR CAPACITY ENHANCEMENT ...................................................................................................... 4-7
CAPACITY ASSESSMENT OF EXISTING FACILITIES ............................................................................................... 4-7
5.0 DETAILS OF ONGOING DEVELOPMENTS ............................................................................................. 5-1
GENERAL.................................................................................................................................................. 5-1
DEVELOPMENT OF COASTAL TERMINAL NEAR NORTHERN SHELTERING ARM .......................................................... 5-2
CONSTRUCTION OF COASTAL ROAD ALONG THE SEA SHORE ............................................................................... 5-3
TWO NUMBERS OF EXIM GODOWNS ............................................................................................................ 5-4
6.0 TRAFFIC PROJECTIONS ........................................................................................................................ 6-1
GENERAL.................................................................................................................................................. 6-1
MAJOR COMMODITIES AND THEIR PROJECTIONS .............................................................................................. 6-1
6.2.1 Containers ..................................................................................................................................... 6-1
6.2.2 POL ................................................................................................................................................ 6-3
6.2.3 Steel .............................................................................................................................................. 6-4
6.2.4 Limestone ...................................................................................................................................... 6-4
COASTAL SHIPPING POTENTIAL ..................................................................................................................... 6-5
7.0 CAPACITY AUGMENTATION REQUIREMENTS ..................................................................................... 7-1
REQUIREMENT FOR CAPACITY EXPANSION ...................................................................................................... 7-1
8.0 ROAD AND RAIL - INTERNAL NETWORK AND EXTERNAL CONNECTIVITY ............................................ 8-1
GENERAL.................................................................................................................................................. 8-1
MODAL SPLIT OF TRAFFIC ............................................................................................................................ 8-2
INTERNAL ROAD NETWORK .......................................................................................................................... 8-3
8.3.1 Overview ....................................................................................................................................... 8-3
8.3.2 Interconnectivity of CCTPL and CITPL Terminals ........................................................................... 8-5
8.3.3 Interconnectivity of Ambedkar and Jawahar Docks ...................................................................... 8-6
IMPROVEMENTS TO THE INTERNAL ROAD NETWORK ......................................................................................... 8-7
8.4.1 Widening of Arterial Road & Construction of a ROB ..................................................................... 8-7
8.4.2 Truck Parking Yard for the Two Container Terminals ................................................................... 8-8
EXTERNAL ROAD CONNECTIVITY ................................................................................................................... 8-9
8.5.1 Chennai Ennore Port Road Connectivity Project (formerly EMRIP) ............................................. 8-11
8.5.2 Maduravoyal Elevated Corridor .................................................................................................. 8-12
INTERNAL RAILWAY NETWORK ................................................................................................................... 8-13
8.6.1 Overview ..................................................................................................................................... 8-13
8.6.2 Port Marshalling Yard ................................................................................................................. 8-13
8.6.3 Jawahar Dock, CITPL & CONCOR Linkage ................................................................................... 8-14
8.6.4 Bharathi Dock – BD II Berth ........................................................................................................ 8-15
8.6.5 Constraints at the Marshalling Yard ........................................................................................... 8-16
SAGARMALA: Master Plan for Chennai Port iii Final Report
8.6.6 Laying of 3rd and 4th Line from Royapuram ................................................................................. 8-17
8.6.7 Common Railway Yard for Containers ........................................................................................ 8-18
ONGOING AND PLANNED PROJECTS FOR CONNECTIVITY .................................................................................. 8-20
9.0 SCOPE FOR FUTURE CAPACITY EXPANSION ........................................................................................ 9-1
DEVELOPMENT OF A BUNKERING TERMINAL .................................................................................................... 9-1
9.1.1 Bunkering Industry – An Overview ................................................................................................ 9-1
Singapore ...................................................................................................................................... 9-2
Fujairah ......................................................................................................................................... 9-3
9.1.2 Indian Scenario in Bunkering ........................................................................................................ 9-4
9.1.3 Bunkering at Chennai Port ............................................................................................................ 9-7
9.1.4 Proposed Bunker Terminal ............................................................................................................ 9-9
Suggested Framework .................................................................................................................. 9-9
Traffic Potential ............................................................................................................................ 9-9
Location of the Terminal ............................................................................................................. 9-10
Selection of Design Tanker .......................................................................................................... 9-11
The Berthing Facility ................................................................................................................... 9-12
Approach Trestle ......................................................................................................................... 9-13
Area for Tank Farm ..................................................................................................................... 9-13
CRUDE OIL IMPORTS ................................................................................................................................ 9-13
POL PRODUCTS ...................................................................................................................................... 9-16
EDIBLE OIL ............................................................................................................................................. 9-16
STEEL PRODUCTS & OTHER DRY BULK ......................................................................................................... 9-17
CONTAINERS ........................................................................................................................................... 9-18
UTILISATION OF BOAT BASIN AND TIMBER POND ........................................................................................... 9-19
9.7.1 Existing Details ............................................................................................................................ 9-19
9.7.2 Option 1 – Ship Repair Facilities .................................................................................................. 9-20
9.7.3 Option 2 – Development of Marina ............................................................................................ 9-21
DEVELOPMENT OF NAVAL BERTH NORTH OF BHARATHI DOCK .......................................................................... 9-23
10.0 SHELF OF NEW PROJECTS AND PHASING .......................................................................................... 10-1
ONGOING PROJECTS ................................................................................................................................. 10-1
PROJECTS TO BE COMPLETED BY YEAR 2020 ................................................................................................. 10-1
PROJECTS TO BE COMPLETED BY YEAR 2025 ................................................................................................. 10-3
APPENDIX 1 - BCG BENCHMARKING STUDY FOR CHENNAI PORT TRUST ....................................................... - 1 -
APPENDIX 2 – PORT CAPACITY ANALYSIS OF CHENNAI PORT ........................................................................ - 2 -
SAGARMALA: Master Plan for Chennai Port iv Final Report
List of Figures
Figure 1.1 Aim of Sagarmala Development .................................................................................. 1-1
Figure 1.2 Governing Principles of Our Approach ........................................................................ 1-2
Figure 1.3 Port Led Developments ............................................................................................... 1-2
Figure 2.1 Chennai Port Location ................................................................................................. 2-1
Figure 2.2 Rail and Road Connectivity to Chennai Port ............................................................... 2-2
Figure 2.3 Wind Rose Diagram ..................................................................................................... 2-3
Figure 2.4 Wave Rose Diagram .................................................................................................... 2-5
Figure 3.1 Location of the Three Docks ........................................................................................ 3-1
Figure 3.2 POL Berths - BD I & BD III ........................................................................................... 3-2
Figure 3.3 Berth BD II ................................................................................................................... 3-3
Figure 3.4 Chennai Container Terminal (CCTPL) ........................................................................ 3-4
Figure 3.5 North Quay and West Quay Berths ............................................................................. 3-5
Figure 3.6 South Quay Berths ...................................................................................................... 3-6
Figure 3.7 Chennai International Container Terminal (CITPL) ..................................................... 3-7
Figure 3.8 Jawahar Dock Berths ................................................................................................... 3-8
Figure 3.9 Tank Farms of IOC, IMC & Kaleesuwari – Near Gate No. 2 ..................................... 3-10
Figure 3.10 Tank Farm of Integrated Service Point – Near Gate No. 3 ....................................... 3-10
Figure 3.11 Tank Farms of MFL, IMC, JRE, AVR & KRL Near SQ II & JD II ............................... 3-12
Figure 3.12 Tank Farms of Suraj Agro & Oswal at JD East ......................................................... 3-12
Figure 5.1 Layout Details of Chennai Port Showing the Ongoing Developments ........................ 5-1
Figure 5.2 Location, Layout and Details of the Coastal Terminal ................................................. 5-2
Figure 5.3 Layout and Alignment of the Coastal Road ................................................................. 5-3
Figure 5.4 Location of Two EXIM Godowns ................................................................................. 5-4
Figure 6.1 Hinterland of Chennai Port .......................................................................................... 6-2
Figure 6.2 EXIM Container Generating Hinterland ....................................................................... 6-2
Figure 6.3 Container Traffic at Chennai Port ................................................................................ 6-3
Figure 6.4 POL Traffic at Chennai Port ......................................................................................... 6-4
Figure 6.5 Coastal Shipping Potential to Chennai Port ................................................................ 6-6
Figure 6.6 Coastal Shipping of Cement to Chennai Port .............................................................. 6-6
Figure 8.1 Internal Road Connectivity – All Gates and their Connectivity .................................... 8-3
Figure 8.2 Internal Road Connectivity – from Gate no. 1 to Bharathi Dock .................................. 8-3
Figure 8.3 Internal Road Connectivity – Dr. Ambedkar Dock and Jawahar Dock ........................ 8-4
Figure 8.4 Internal Road Connectivity – Marshalling Yard to Gate no. 10 ................................... 8-4
Figure 8.5 Internal Road Connectivity of CCTPL and CITPL Terminals ...................................... 8-6
Figure 8.6 Road Connectivity of Jawahar Dock and Dr. Ambedkar Dock .................................... 8-7
Figure 8.7 Proposed Truck Parking Area for CCTPL ................................................................... 8-9
Figure 8.8 National Highway Network Linking Chennai .............................................................. 8-10
Figure 8.9 Outer & Inner Ring Roads Bypassing Chennai City .................................................. 8-11
Figure 8.10 Location and Alignment of Maduravoyal Elevated Corridor ...................................... 8-12
Figure 8.11 Overall Port Railway Network .................................................................................... 8-13
Figure 8.12 Railwy Network at the Marshalling Yard .................................................................... 8-14
Figure 8.13 Railway Network Linking CITPL, JD EAST, JD WEST and CONCOR Yard ............ 8-15
Figure 8.14 Railway Network at BD II Yard at Bharathi Dock ....................................................... 8-16

SAGARMALA: Master Plan for Chennai Port v Final Report
Figure 8.15 The Proposed 3rd & 4th Line from Royapuram ......................................................... 8-17
Figure 8.16 Proposed Common Rail Yard .................................................................................... 8-19
Figure 8.17 Proposed Common Rail Yard wrt Existing Container Terminals ............................... 8-19
Figure 9.1 Significant Bunker Ports – Singapore and Fujairah ..................................................... 9-2
Figure 9.2 Location and Layout of Existing Bunker Jetty .............................................................. 9-8
Figure 9.3 Location and Layout of Existing Bunker Jetty .............................................................. 9-8
Figure 9.4 Locations of the Berthing Facility & Area for Tank Farm ........................................... 9-10
Figure 9.5 A Typical 1,600 T Bunker Tanker .............................................................................. 9-12
Figure 9.6 Location & Layout of the Bunkering Facility with Approach ...................................... 9-12
Figure 9.7 Route of the New 42” Pipeline ................................................................................... 9-14
Figure 9.8 Location of the SBM .................................................................................................. 9-15
Figure 9.9 Layout of Boat Basin/Timber Pond ............................................................................ 9-19
Figure 9.10 Proposed Layout of Boat Basin/Timber Pond – Shiplift ............................................ 9-21
Figure 9.11 Proposed Layout of Marina at Timber Pond / Boat Basin ......................................... 9-22
Figure 9.12 Indicative Layout Plan for Development of Navy Berth north of Bharati Dock .......... 9-23

SAGARMALA: Master Plan for Chennai Port vi Final Report
List of Tables
Table 1 ..................................................................................................................................................... x
Table 2 .................................................................................................................................................... xi
Table 3 .................................................................................................................................................... xi
Table 4 Road connectivity infrastructure ................................................................................................. xii
Table 5 ................................................................................................................................................... xiii
Table 6 ................................................................................................................................................... xiii
Table 3.1 Details of Bharathi Dock Berths ...................................................................................... 3-2
Table 3.2 Berths at Dr. Ambedkar Dock .......................................................................................... 3-4
Table 3.3 Berths at Jawahar Dock .................................................................................................. 3-7
Table 3.4 Cargo Handling Equipment at the Port ........................................................................... 3-9
Table 3.5 Cargo Storage Facilities at the Port ................................................................................ 3-9
Table 3.6 Cargo Storage Facilities at the Port .............................................................................. 3-11
Table 3.7 Details of Tank Farms within Port Custom Bound Area Southern Side Near SQ II and JD
II 3-13
Table 4.1 Cargo Handled during last 5 Years (MT) ........................................................................ 4-1
Table 4.2 Performance of Liquid Berths During 2014 - 2015 .......................................................... 4-2
Table 4.3 Performance of North Quay & West Quay Berths During 2014-15 ................................. 4-2
Table 4.4 Performance of South Quay Berths During 2014-15 ...................................................... 4-3
Table 4.5 Performance of Container Terminals During 2014-15 .................................................... 4-3
Table 4.6 Performance of Jawahar Dock - West Quay Berths During 2014-15 ............................. 4-4
Table 4.7 Performance of Jawahar Dock - East Quay Berths During 2014-15 .............................. 4-4
Table 4.8 Capacity of Berths ........................................................................................................... 4-8
Table 6.1 Traffic Projection.............................................................................................................. 6-5
Table 6.2 Chennai Port – New Oppoirtunities Possible via Coastal Shipping ................................ 6-7
Table 7.1 Capacity Augmentation Required (MTPA) ...................................................................... 7-1
Table 8.1 Modal Split of Traffic Handled (MT)................................................................................. 8-2
Table 8.2 List of Ongoing Connectivity Projects ........................................................................... 8-20
Table 8.3 List of Recommended Connectivity Projects ................................................................. 8-20
Table 9.1 Singapore Bunker Sales (in '000 T) ................................................................................ 9-2
Table 9.2 All India Tax Applicability on Bunkers (%) ....................................................................... 9-5
Table 9.3 Bunker Prices at Indian Ports .......................................................................................... 9-6
Table 9.4 Bunker Traffic at Chennai Port ........................................................................................ 9-7
Table 9.5 Chennai Port Vessel Traffic & Bunker Requirements ..................................................... 9-9
Table 9.6 Size of Some of the Bunker Tankers Operating in Singapore ...................................... 9-11
Table 9.7 Ship Shore Cargo Handling Equipment ........................................................................ 9-17
Table 10.1 Ongoing Projects ........................................................................................................... 10-1
Table 10.2 Projects to be completed by Year 2020 ........................................................................ 10-1
Table 10.3 Projects to be completed by Year 2025 ........................................................................ 10-3
SAGARMALA: Master Plan for Chennai Port vii Final Report
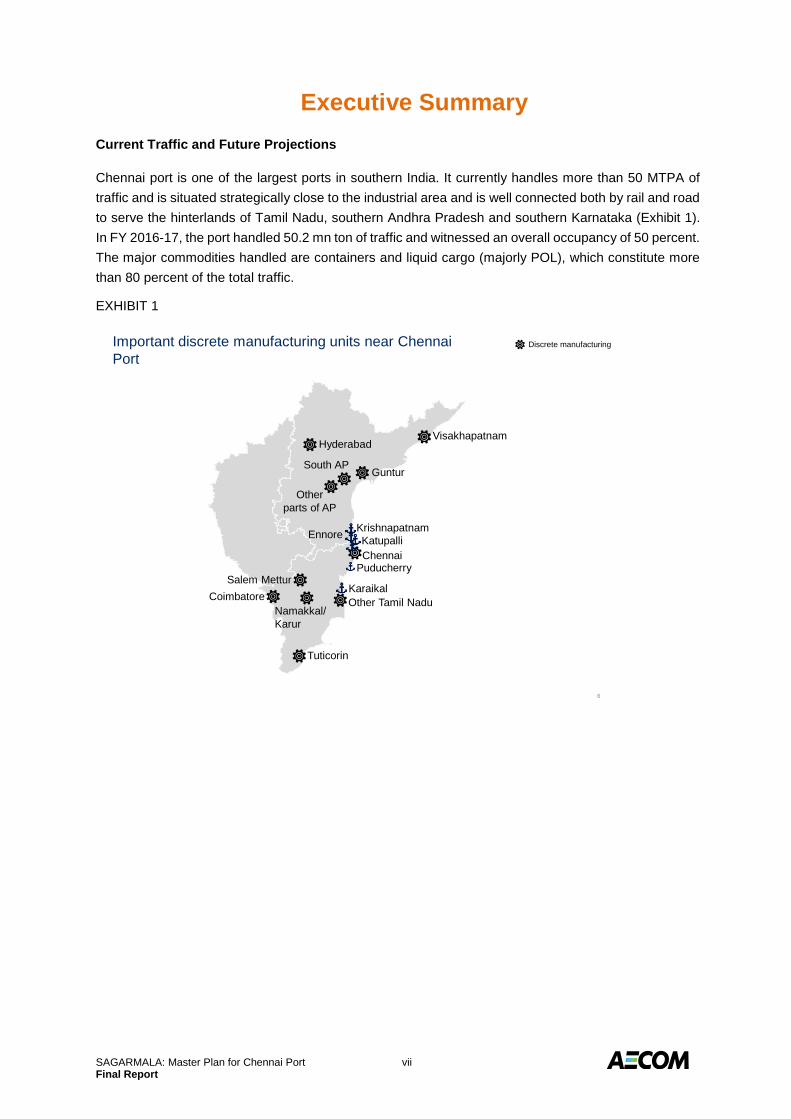
Executive Summary
Current Traffic and Future Projections
Chennai port is one of the largest ports in southern India. It currently handles more than 50 MTPA of
traffic and is situated strategically close to the industrial area and is well connected both by rail and road
to serve the hinterlands of Tamil Nadu, southern Andhra Pradesh and southern Karnataka (Exhibit 1).
In FY 2016-17, the port handled 50.2 mn ton of traffic and witnessed an overall occupancy of 50 percent.
The major commodities handled are containers and liquid cargo (majorly POL), which constitute more
than 80 percent of the total traffic.
EXHIBIT 1
6
Important discrete manufacturing units near Chennai
Port
Krishnapatnam
Chennai
Other Tamil Nadu
Tuticorin
Coimbatore
Namakkal/
Karur
VisakhapatnamHyderabad
South APGuntur
Other
parts of AP
EnnoreKatupalli
KaraikalSalem Mettur
Discrete manufacturing
Puducherry

SAGARMALA: Master Plan for Chennai Port viii Final Report
Exhibit 2 shows the commodity-wise split of the FY 2016-17 traffic.
EXHIBIT 2
The traffic handled is projected to be 48.3 MTPA by 2020. Exhibit 3 summarizes the traffic potential for
key commodities for the port. The traffic projections are based on the OD study conducted in 2015-16.
Actual traffic may vary depending on realization of the assumptions made in the OD study and any other
developments not accounted for in the study1.
1 All traffic projections in this section are based on the Origin Destination study – National Perspective Plan
Traffic handled at Chennai Port between April 2016 and March 2017
50.2
13.6
7.5
28.9
Liquid Total
0
Fertilizers Coal (Thermal
and Coking)
OthersContainers
0.3
MTPA
SAGARMALA: Master Plan for Chennai Port ix Final Report
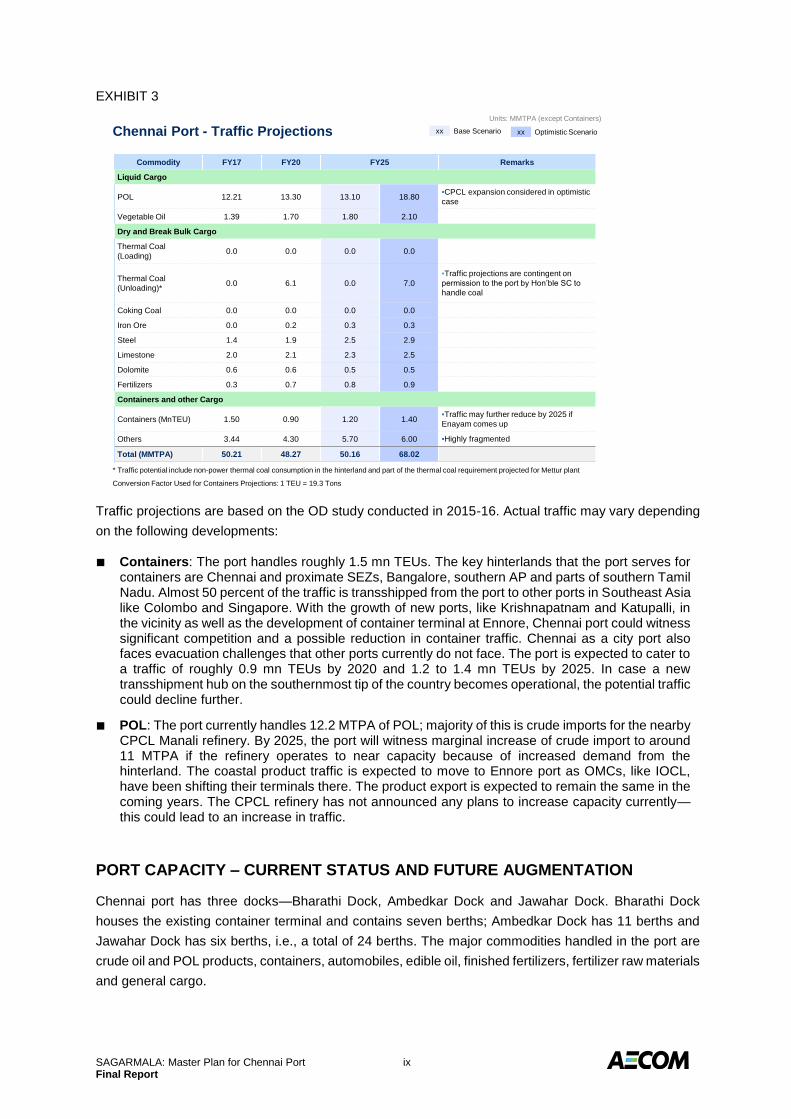
EXHIBIT 3
Traffic projections are based on the OD study conducted in 2015-16. Actual traffic may vary depending
on the following developments:
■ Containers: The port handles roughly 1.5 mn TEUs. The key hinterlands that the port serves for containers are Chennai and proximate SEZs, Bangalore, southern AP and parts of southern Tamil Nadu. Almost 50 percent of the traffic is transshipped from the port to other ports in Southeast Asia like Colombo and Singapore. With the growth of new ports, like Krishnapatnam and Katupalli, in the vicinity as well as the development of container terminal at Ennore, Chennai port could witness significant competition and a possible reduction in container traffic. Chennai as a city port also faces evacuation challenges that other ports currently do not face. The port is expected to cater to a traffic of roughly 0.9 mn TEUs by 2020 and 1.2 to 1.4 mn TEUs by 2025. In case a new transshipment hub on the southernmost tip of the country becomes operational, the potential traffic could decline further.
■ POL: The port currently handles 12.2 MTPA of POL; majority of this is crude imports for the nearby CPCL Manali refinery. By 2025, the port will witness marginal increase of crude import to around 11 MTPA if the refinery operates to near capacity because of increased demand from the hinterland. The coastal product traffic is expected to move to Ennore port as OMCs, like IOCL, have been shifting their terminals there. The product export is expected to remain the same in the coming years. The CPCL refinery has not announced any plans to increase capacity currently—this could lead to an increase in traffic.
PORT CAPACITY – CURRENT STATUS AND FUTURE AUGMENTATION
Chennai port has three docks—Bharathi Dock, Ambedkar Dock and Jawahar Dock. Bharathi Dock
houses the existing container terminal and contains seven berths; Ambedkar Dock has 11 berths and
Jawahar Dock has six berths, i.e., a total of 24 berths. The major commodities handled in the port are
crude oil and POL products, containers, automobiles, edible oil, finished fertilizers, fertilizer raw materials
and general cargo.
Chennai Port - Traffic ProjectionsUnits: MMTPA (except Containers)
Conversion Factor Used for Containers Projections: 1 TEU = 19.3 Tons
xx Base Scenario xx Optimistic Scenario
* Traffic potential include non-power thermal coal consumption in the hinterland and part of the thermal coal requirement projected for Mettur plant
Commodity FY17 FY20 FY25 Remarks
Liquid Cargo
POL 12.21 13.30 13.10 18.80▪CPCL expansion considered in optimistic
case
Vegetable Oil 1.39 1.70 1.80 2.10
Dry and Break Bulk Cargo
Thermal Coal
(Loading)0.0 0.0 0.0 0.0
Thermal Coal
(Unloading)*0.0 6.1 0.0 7.0
▪Traffic projections are contingent on
permission to the port by Hon’ble SC to
handle coal
Coking Coal 0.0 0.0 0.0 0.0
Iron Ore 0.0 0.2 0.3 0.3
Steel 1.4 1.9 2.5 2.9
Limestone 2.0 2.1 2.3 2.5
Dolomite 0.6 0.6 0.5 0.5
Fertilizers 0.3 0.7 0.8 0.9
Containers and other Cargo
Containers (MnTEU) 1.50 0.90 1.20 1.40▪Traffic may further reduce by 2025 if
Enayam comes up
Others 3.44 4.30 5.70 6.00 ▪Highly fragmented
Total (MMTPA) 50.21 48.27 50.16 68.02

SAGARMALA: Master Plan for Chennai Port x Final Report
Table 1 summarizes the existing capacity of the port as of 31st March 2017, based on the “Berthing
Policy for Dry Bulk Cargo for Major Ports” released by the Ministry of Shipping in June 2016.
TABLE 1
Commodity Berths Rated Capacity (MTPA)
General Cargo NQ 1.0
WQ 1-4 8.3
CQ 2.2
SQ 1-2 4.0
JD 1-6 22.1
Liquid BD1 6.7
BD2 2.8
BD3 25.7
Container SCB1-3 29.5
CTB1-4 31.3
Total 133.6
The desired occupancy for berths handling non-containerized cargo is considered to be 70 percent and
85 percent for berths handling containerized cargo (due to pre-determined scheduling). Future projects
could be planned after considering the existing rated capacity at desired occupancy level.
SAGARMALA: Master Plan for Chennai Port xi Final Report
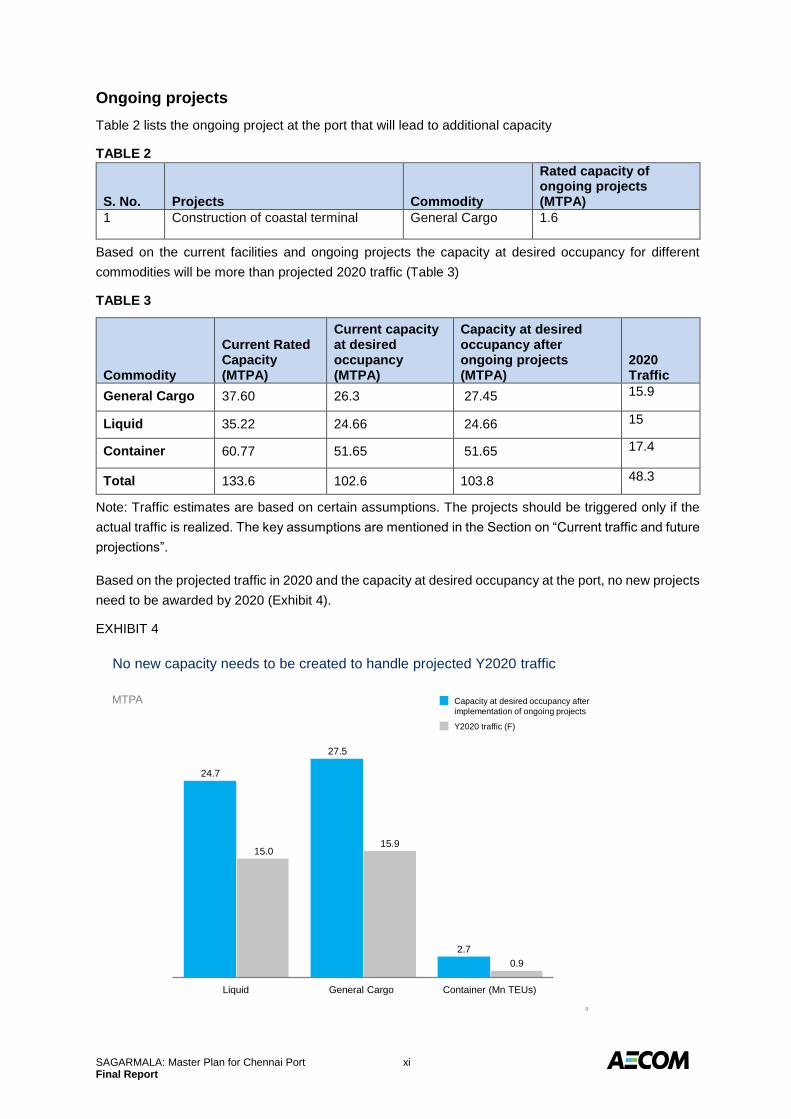
Ongoing projects
Table 2 lists the ongoing project at the port that will lead to additional capacity
TABLE 2
S. No. Projects Commodity
Rated capacity of ongoing projects (MTPA)
1 Construction of coastal terminal General Cargo 1.6
Based on the current facilities and ongoing projects the capacity at desired occupancy for different
commodities will be more than projected 2020 traffic (Table 3)
TABLE 3
Commodity
Current Rated Capacity (MTPA)
Current capacity at desired occupancy (MTPA)
Capacity at desired occupancy after ongoing projects (MTPA)
2020 Traffic
General Cargo 37.60 26.3 27.45 15.9
Liquid 35.22 24.66 24.66 15
Container 60.77 51.65 51.65 17.4
Total 133.6 102.6 103.8 48.3
Note: Traffic estimates are based on certain assumptions. The projects should be triggered only if the
actual traffic is realized. The key assumptions are mentioned in the Section on “Current traffic and future
projections”.
Based on the projected traffic in 2020 and the capacity at desired occupancy at the port, no new projects
need to be awarded by 2020 (Exhibit 4).
EXHIBIT 4
9
No new capacity needs to be created to handle projected Y2020 traffic
MTPA
2.7
27.5
24.7
0.9
15.915.0
Container (Mn TEUs)General CargoLiquid
Capacity at desired occupancy after
implementation of ongoing projects
Y2020 traffic (F)
SAGARMALA: Master Plan for Chennai Port xii Final Report
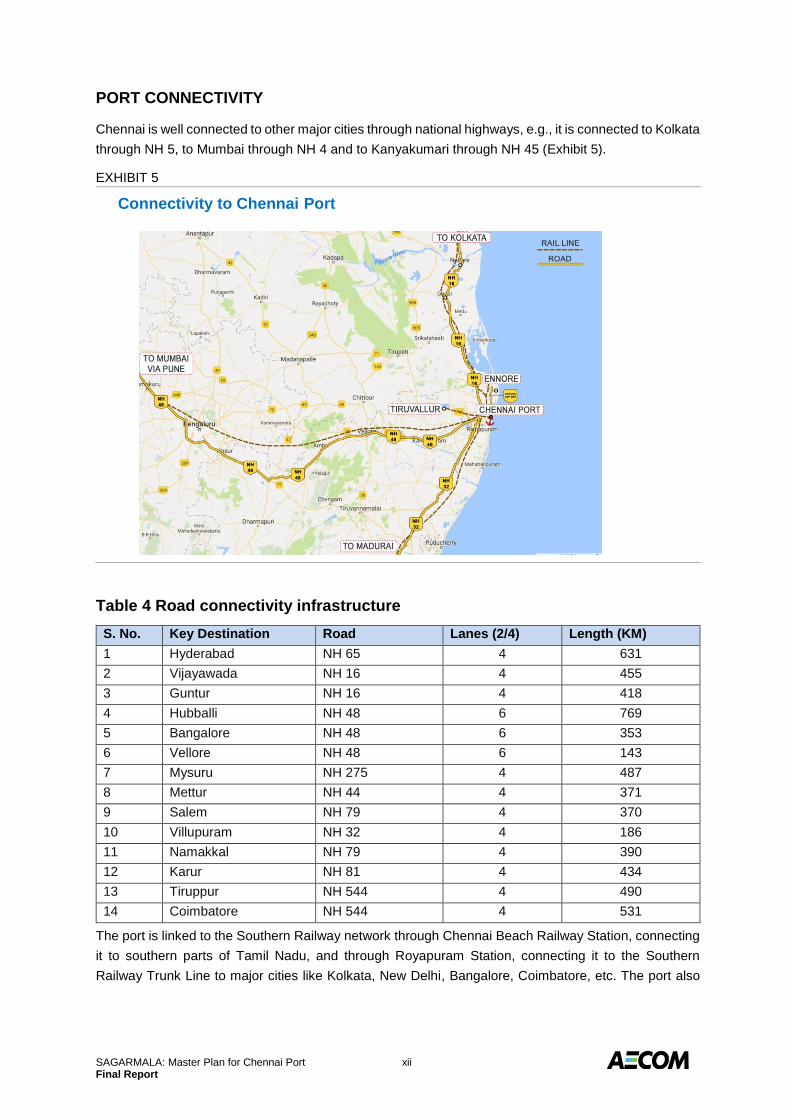
PORT CONNECTIVITY
Chennai is well connected to other major cities through national highways, e.g., it is connected to Kolkata
through NH 5, to Mumbai through NH 4 and to Kanyakumari through NH 45 (Exhibit 5).
EXHIBIT 5
Table 4 Road connectivity infrastructure
S. No. Key Destination Road Lanes (2/4) Length (KM)
1 Hyderabad NH 65 4 631
2 Vijayawada NH 16 4 455
3 Guntur NH 16 4 418
4 Hubballi NH 48 6 769
5 Bangalore NH 48 6 353
6 Vellore NH 48 6 143
7 Mysuru NH 275 4 487
8 Mettur NH 44 4 371
9 Salem NH 79 4 370
10 Villupuram NH 32 4 186
11 Namakkal NH 79 4 390
12 Karur NH 81 4 434
13 Tiruppur NH 544 4 490
14 Coimbatore NH 544 4 531
The port is linked to the Southern Railway network through Chennai Beach Railway Station, connecting
it to southern parts of Tamil Nadu, and through Royapuram Station, connecting it to the Southern
Railway Trunk Line to major cities like Kolkata, New Delhi, Bangalore, Coimbatore, etc. The port also
Connectivity to Chennai Port
SAGARMALA: Master Plan for Chennai Port xiii Final Report
has an internal rail network of about 70 km.
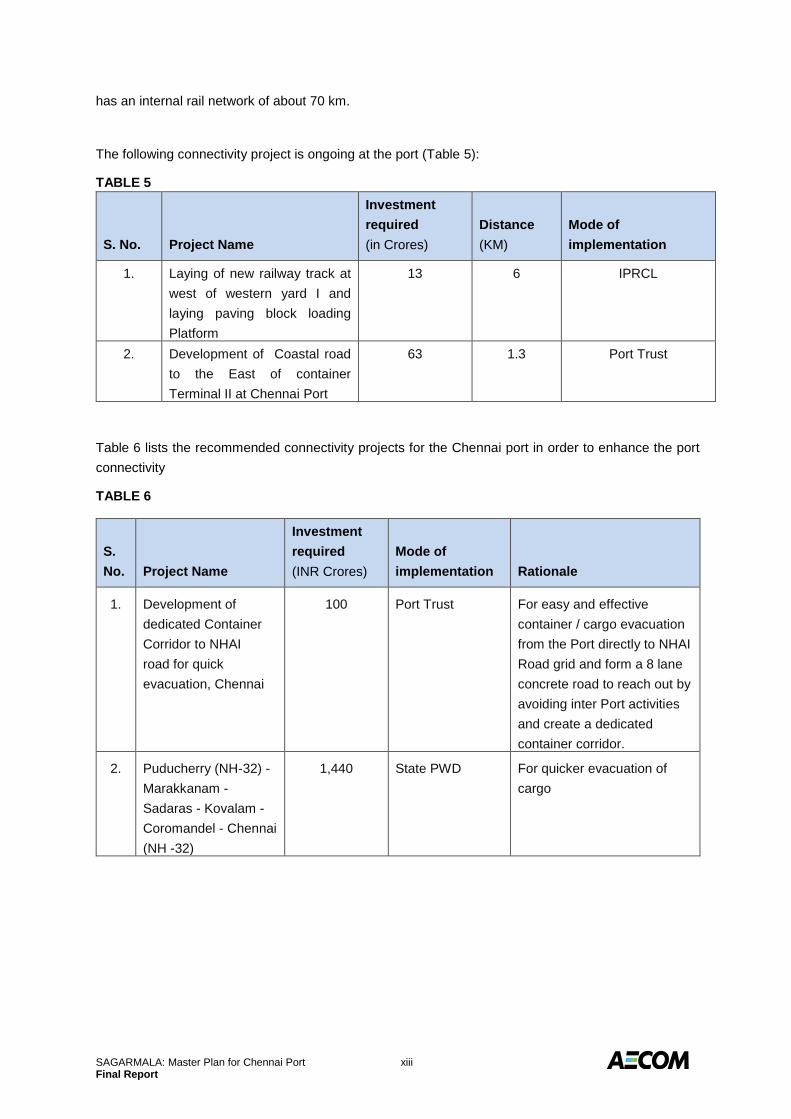
The following connectivity project is ongoing at the port (Table 5):
TABLE 5
S. No. Project Name
Investment
required
(in Crores)
Distance
(KM)
Mode of
implementation
1. Laying of new railway track at
west of western yard I and
laying paving block loading
Platform
13 6 IPRCL
2. Development of Coastal road
to the East of container
Terminal II at Chennai Port
63 1.3 Port Trust
Table 6 lists the recommended connectivity projects for the Chennai port in order to enhance the port
connectivity
TABLE 6
S.
No. Project Name
Investment
required
(INR Crores)
Mode of
implementation Rationale
1. Development of
dedicated Container
Corridor to NHAI
road for quick
evacuation, Chennai
100 Port Trust For easy and effective
container / cargo evacuation
from the Port directly to NHAI
Road grid and form a 8 lane
concrete road to reach out by
avoiding inter Port activities
and create a dedicated
container corridor.
2. Puducherry (NH-32) -
Marakkanam -
Sadaras - Kovalam -
Coromandel - Chennai
(NH -32)
1,440 State PWD For quicker evacuation of
cargo
SAGARMALA: Master Plan for Chennai Port 1-1 Final Report
1.0 INTRODUCTION
Background
The Sagarmala initiative is one of the most important and strategic imperatives to realize India’s
economic aspirations. The overall objective of the project is to evolve a model of port-led development,
whereby Indian ports become a major contributor to the country’s GDP.
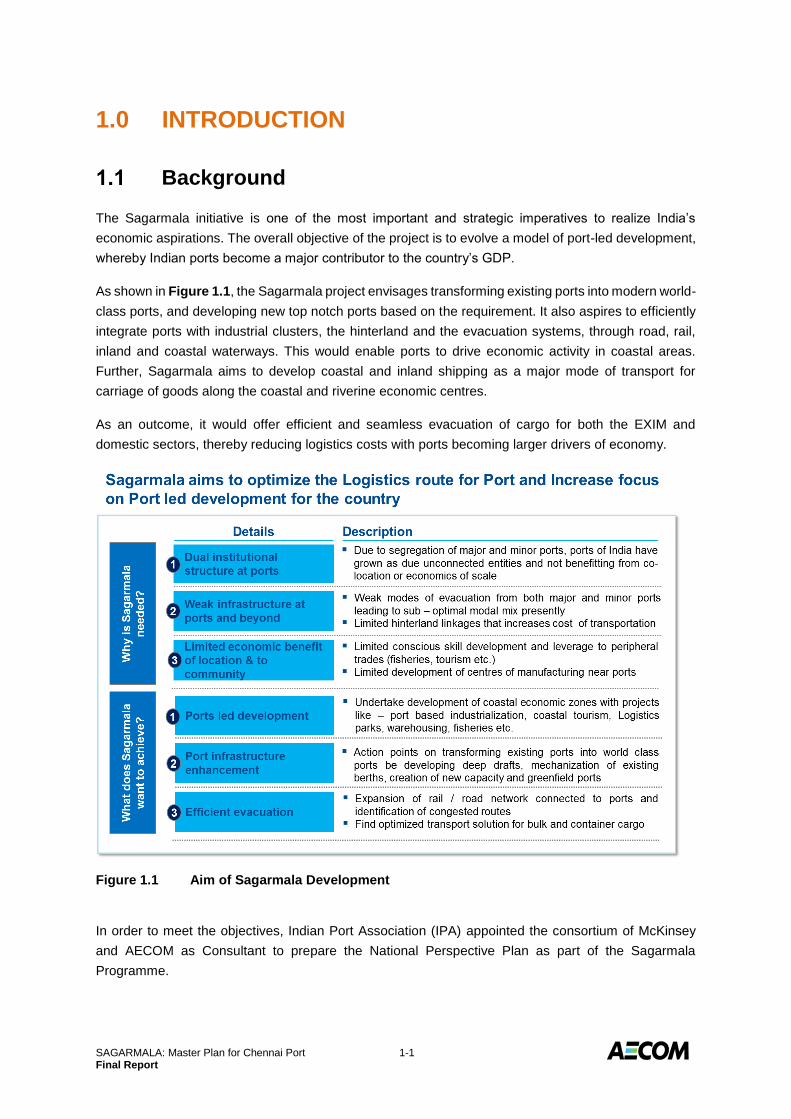
As shown in Figure 1.1, the Sagarmala project envisages transforming existing ports into modern world-
class ports, and developing new top notch ports based on the requirement. It also aspires to efficiently
integrate ports with industrial clusters, the hinterland and the evacuation systems, through road, rail,
inland and coastal waterways. This would enable ports to drive economic activity in coastal areas.
Further, Sagarmala aims to develop coastal and inland shipping as a major mode of transport for
carriage of goods along the coastal and riverine economic centres.
As an outcome, it would offer efficient and seamless evacuation of cargo for both the EXIM and
domestic sectors, thereby reducing logistics costs with ports becoming larger drivers of economy.
Figure 1.1 Aim of Sagarmala Development
In order to meet the objectives, Indian Port Association (IPA) appointed the consortium of McKinsey
and AECOM as Consultant to prepare the National Perspective Plan as part of the Sagarmala
Programme.
SAGARMALA: Master Plan for Chennai Port 1-2 Final Report
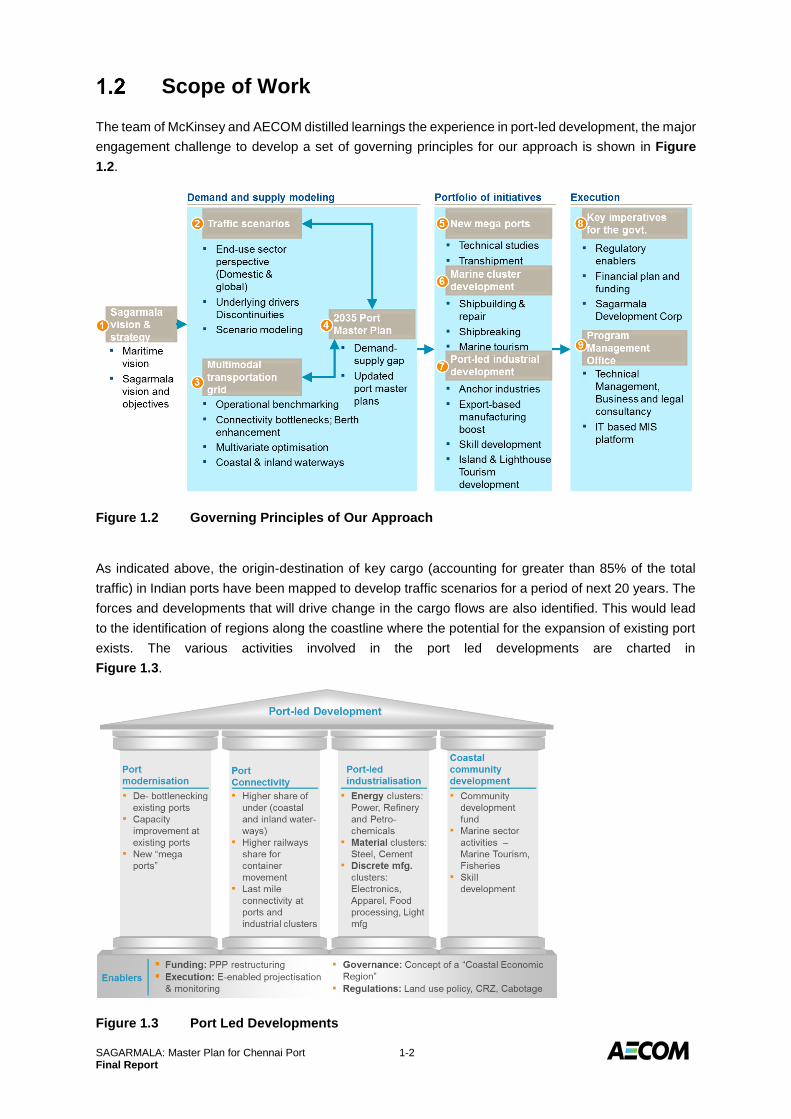
Scope of Work
The team of McKinsey and AECOM distilled learnings the experience in port-led development, the major
engagement challenge to develop a set of governing principles for our approach is shown in Figure
1.2.
Figure 1.2 Governing Principles of Our Approach
As indicated above, the origin-destination of key cargo (accounting for greater than 85% of the total
traffic) in Indian ports have been mapped to develop traffic scenarios for a period of next 20 years. The
forces and developments that will drive change in the cargo flows are also identified. This would lead
to the identification of regions along the coastline where the potential for the expansion of existing port
exists. The various activities involved in the port led developments are charted in
Figure 1.3.
Figure 1.3 Port Led Developments
SAGARMALA: Master Plan for Chennai Port 1-3 Final Report
As part of the assignment, we were also expected to coordinate with the team working on
“Benchmarking Operational Improvement Roadmap for Major Ports in India” study (which is being
carried out simultaneously along with this assignment) and identify current and future logistic constraints
(at the Major Ports) for the top 85% cargo categories based on analysis of current port capacity,
productivity levels in comparison to international benchmark and evacuation bottlenecks in the logistics
chain. This understanding would be an input in defining the 2035 Master Plan for each port.
Accordingly, this Master Plan report has been prepared taking into consideration the inputs provided
on the future traffic and the benchmarking and operational improvements suggested for this port.
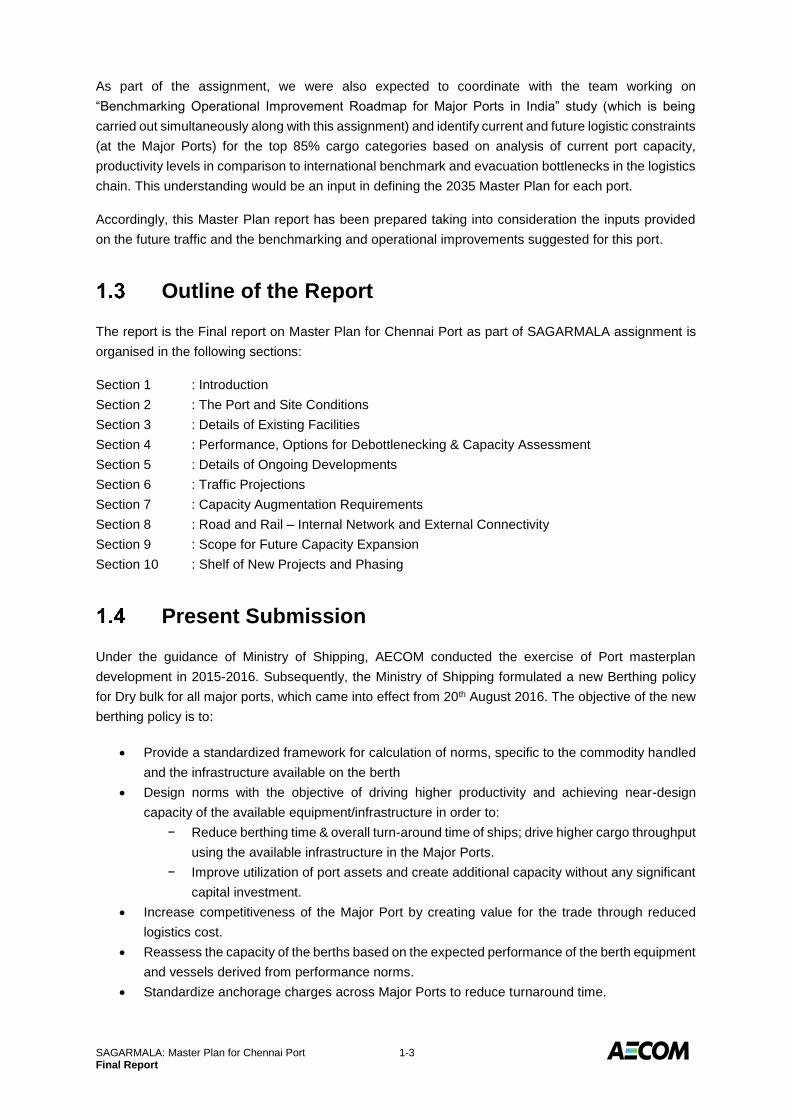
Outline of the Report
The report is the Final report on Master Plan for Chennai Port as part of SAGARMALA assignment is
organised in the following sections:
Section 1 : Introduction
Section 2 : The Port and Site Conditions
Section 3 : Details of Existing Facilities
Section 4 : Performance, Options for Debottlenecking & Capacity Assessment
Section 5 : Details of Ongoing Developments
Section 6 : Traffic Projections
Section 7 : Capacity Augmentation Requirements
Section 8 : Road and Rail – Internal Network and External Connectivity
Section 9 : Scope for Future Capacity Expansion
Section 10 : Shelf of New Projects and Phasing
Present Submission
Under the guidance of Ministry of Shipping, AECOM conducted the exercise of Port masterplan
development in 2015-2016. Subsequently, the Ministry of Shipping formulated a new Berthing policy
for Dry bulk for all major ports, which came into effect from 20th August 2016. The objective of the new
berthing policy is to:
Provide a standardized framework for calculation of norms, specific to the commodity handled
and the infrastructure available on the berth
Design norms with the objective of driving higher productivity and achieving near-design
capacity of the available equipment/infrastructure in order to:
− Reduce berthing time & overall turn-around time of ships; drive higher cargo throughput
using the available infrastructure in the Major Ports.
− Improve utilization of port assets and create additional capacity without any significant
capital investment.
Increase competitiveness of the Major Port by creating value for the trade through reduced
logistics cost.
Reassess the capacity of the berths based on the expected performance of the berth equipment
and vessels derived from performance norms.
Standardize anchorage charges across Major Ports to reduce turnaround time.
SAGARMALA: Master Plan for Chennai Port 1-4 Final Report
Following the methodology of Dry bulk as per the berthing policy, approach has also been laid out for
other commodities – break bulk, liquid, and containers to get a comprehensive view of the port capacity.
This is proposed to be added to the berthing policy to make it a comprehensive document for port
capacity rating.
In line with the above, the capacity of the ports have been rated using a scientific approach. Due to this
change in approach, the masterplans have been revised to reflect the revised capacity and additional
projects that may be required thereafter based on the traffic projections.
This document is the revised Master Plan for Chennai Port based on the above.
SAGARMALA: Master Plan for Chennai Port 2-1 Final Report
2.0 THE PORT AND SITE CONDITIONS
Chennai Port as at Present
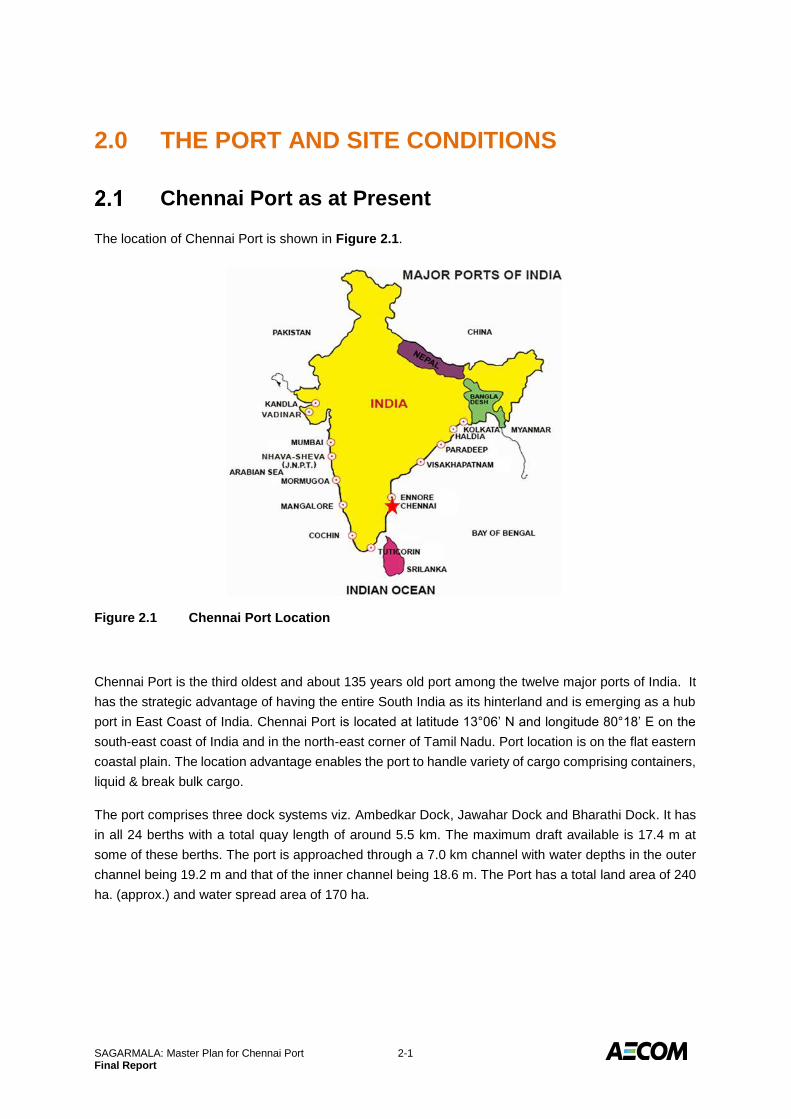
The location of Chennai Port is shown in Figure 2.1.
Figure 2.1 Chennai Port Location
Chennai Port is the third oldest and about 135 years old port among the twelve major ports of India. It
has the strategic advantage of having the entire South India as its hinterland and is emerging as a hub
port in East Coast of India. Chennai Port is located at latitude 13°06’ N and longitude 80°18’ E on the
south-east coast of India and in the north-east corner of Tamil Nadu. Port location is on the flat eastern
coastal plain. The location advantage enables the port to handle variety of cargo comprising containers,
liquid & break bulk cargo.
The port comprises three dock systems viz. Ambedkar Dock, Jawahar Dock and Bharathi Dock. It has
in all 24 berths with a total quay length of around 5.5 km. The maximum draft available is 17.4 m at
some of these berths. The port is approached through a 7.0 km channel with water depths in the outer
channel being 19.2 m and that of the inner channel being 18.6 m. The Port has a total land area of 240
ha. (approx.) and water spread area of 170 ha.
SAGARMALA: Master Plan for Chennai Port 2-2 Final Report
Rail and Road Connectivity
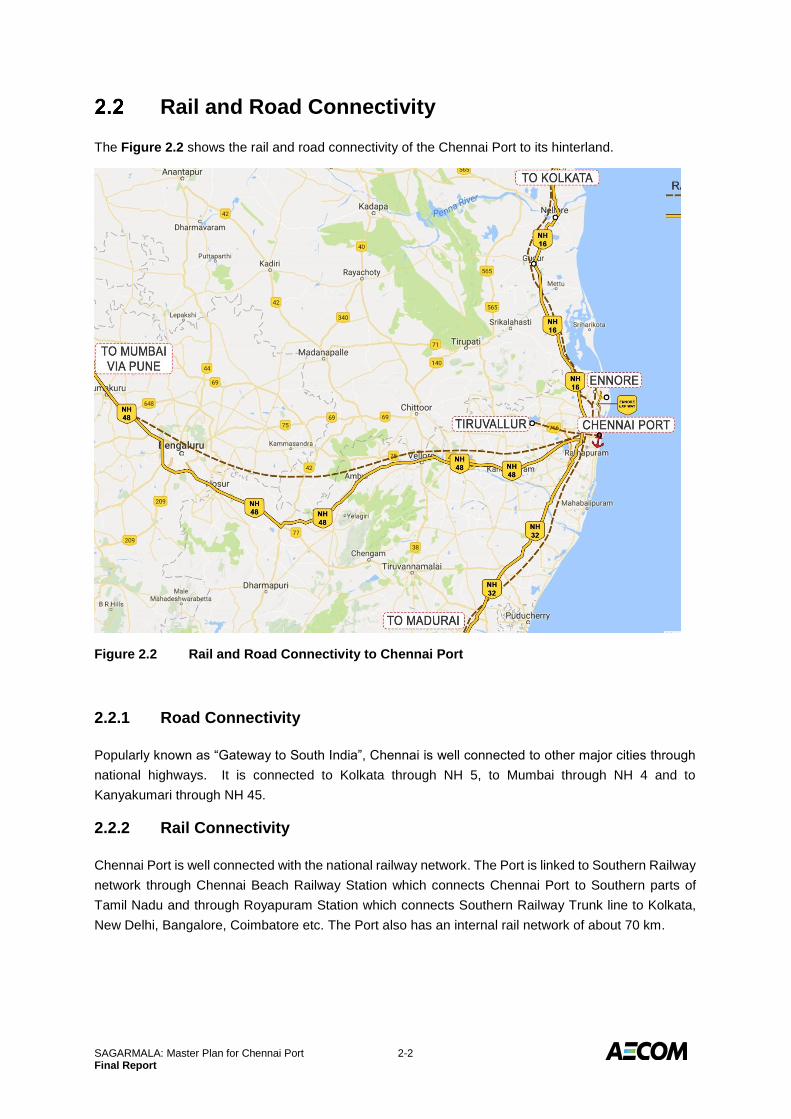
The Figure 2.2 shows the rail and road connectivity of the Chennai Port to its hinterland.
Figure 2.2 Rail and Road Connectivity to Chennai Port
2.2.1 Road Connectivity
Popularly known as “Gateway to South India”, Chennai is well connected to other major cities through
national highways. It is connected to Kolkata through NH 5, to Mumbai through NH 4 and to
Kanyakumari through NH 45.
2.2.2 Rail Connectivity
Chennai Port is well connected with the national railway network. The Port is linked to Southern Railway
network through Chennai Beach Railway Station which connects Chennai Port to Southern parts of
Tamil Nadu and through Royapuram Station which connects Southern Railway Trunk line to Kolkata,
New Delhi, Bangalore, Coimbatore etc. The Port also has an internal rail network of about 70 km.

SAGARMALA: Master Plan for Chennai Port 2-3 Final Report
Site Conditions
2.3.1 Meteorology
The climate in the region has a typical monsoon character. Two monsoons dominate the climate - the
SW summer monsoon and the NE winter monsoon. The summer monsoon starts around May and
holds on until September. The NE monsoon starts by the latter half of October and lasts until February.
The summer monsoon is stronger than the winter monsoon and the months between both monsoons
form a transition period of calmer weather. Storms occur particularly in autumn months.
Winds
The wind rose indicating the wind climate near Chennai is given in Figure 2.3.
Figure 2.3 Wind Rose Diagram
The geographical position of the coast makes the region to experience the NE monsoon between
October to February and the SW monsoon from May to September. South to southeast wind directions
also occur frequently, mainly during the transition period between the two monsoons
The wind conditions that prevail in deep water during the monsoons are summarized below.
NE monsoon:
o Wind direction: 49 - 87°, relative to the North.
o Wind speed: 5.8 - 7.5 m/s
SW monsoon
o Wind direction: 153 - 263° relative to the North.
o Wind speed: 2 - 12 m/s
SAGARMALA: Master Plan for Chennai Port 2-4 Final Report
Rainfall
Region gets rainfall during October and November from NE Monsoon. During this time, temperatures
are lower and humidity is still high. June to September may receive certain amount of rainfall as well.
The pre-monsoon rainfall is almost uniform throughout the district. The coastal regions receive more
rainfall than the interior ones. NE and SW monsoons are the major donors, with 54% and 36%
contribution each to the total annual rainfall. During normal monsoon, the district receives a rainfall of
around 1,200 mm.
Air Temperature
The average monthly air temperature varies between 37° C in May and June to about 29° C during
December and January. The average minimum temperature varies between 28° C in May and June to
21° C in January and February. The highest recorded temperature is 43° C and the lowest recorded
temperature is 15° C.
2.3.2 Oceanography
Tides
The tides at Chennai are semi-diurnal with a tidal range, relative to the Chart Datum (CD), as follows:
Highest high water level (HHWL) + 1.50 m
Mean high water springs (MHWS) + 1.10 m
Mean high water neaps (MHWN) + 0.80 m
Mean Sea Level (MSL ) + 0.54 m
Mean low water neaps (MLWN) + 0.40 m
Mean low water springs (MLWS) + 0.10 m
Lowest low water (LLWL) - 0.10 m
Currents
Chennai Port has observed the following current patterns in their area:
In January the current sets South Westward or Northward at a rate of 1 to 1.5 knots. But it is irregular
in February (Northward parallel with the coast 1.5 knots). During March, April and May the current sets
Northward from 1 to 3 knots. In June variable but sometimes Southward and weak in July and in August
southward or against the wind from 2 to 3 knots at times. In September the current sets South and
South-westwards and in October Southerly along the coast. In November and December the current
sets South Westerly or Southerly along the coast.
Waves
As the near-shore area off Chennai is sheltered from the westerly winds by the mainland, the strong
southerly to westerly winds during the southwest monsoon do not cause high waves due to the limited
fetch available. Consequently, the wave conditions at Chennai are moderate.
Waves at Chennai approach predominantly from two directions:

SAGARMALA: Master Plan for Chennai Port 2-5 Final Report
135° N during March - September, and
90° N during November – January.
During the transition period (during February and October), waves approach from 115° N. The wave
height is around 2.5 – 3 m with a wave period of 10 s during northeast monsoon and 2 - 2.5 m with a
wave period of 6 s during southwest monsoon.
The wave rose diagram for offshore Chennai is shown in Figure 2.4.
Figure 2.4 Wave Rose Diagram

SAGARMALA: Master Plan for Chennai Port 3-1 Final Report
3.0 DETAILS OF EXISTING FACILITIES
Existing Facilities
Chennai Port has three Docks - Bharathi Dock, Ambedkar Dock and Jawahar Dock. The existing
Container Terminal is situated in Bharathi Dock. Bharathi Dock contains 7 berths; Ambedkar Dock
contains 11 berths and Jawahar Dock contains 6 berths, all totalling to 24 berths. The major
commodities handled in the Port are Crude oil & POL products, Containers, Automobiles, Edible oil
finished Fertilizers, Fertilizer Raw Materials, and general cargo. The location of these docks is shown
in the following Figure 3.1.
Figure 3.1 Location of the Three Docks
Entrance Channel
Length of Channel - About 7 km
Depth of Inner Channel - 18.6 m at chart datum
Depth of Outer Channel - 19.2 m at chart datum
Width of Channel - The width of channel gradually increases from 244 m to 410 m at the bent portion, then maintains a constant width of 305 m
Outer Harbour
Eastern Breakwater - 590 m
Northern Breakwater - 460 m
Outer Arm - 1,000 m
Upper Pitch Revetment - 950 m
The details of these docks along with their berths are brought out hereunder:

SAGARMALA: Master Plan for Chennai Port 3-2 Final Report
Bharathi Dock (BD)
Bharathi Dock is a relatively new addition to the port having been constructed during the late sixties and
early seventies. It provides handling facilities for POL, edible oil and containers. The entrance to the
Dock is 350 m wide. Particulars of berths at Bharathi Dock have been presented in Table 3.1.
Table 3.1 Details of Bharathi Dock Berths
Name Commodity Length
(m)
Draft
(m)
BD - I POL 356 14.6
BD - II Edible Oil/ POL 382 16.5
BD - III POL - Crude 325 16.5
CTB I Containers 200 13.4
CTB II Containers 200 13.4
CTB III Containers 200 13.4
CTB IV Containers 285 13.4
3.2.1 POL Berths - BD I and BD III
The POL berths are shown in Figure 3.2. BD I (commissioned in 1972) has been designed to handle
tankers up to 100,000 DWT while BD III (commissioned in 1986) has been designed for 140,000 DWT
tankers. BD I have been provided with 5 × 12” marine loading arms while BD III has been provided with
4 × 16” + 2 × 12” marine loading arms. Both the berths are served by 1 × 30” pipeline for crude oil; 1 ×
20” pipeline for white oils and 2 × 14” pipeline for black oils. There are separate service lines for
LDO/FO/LO bunkers. The berths are provided with firefighting facilities including tower monitors served
by a separate firefighting pump house with requisite pumps and connecting pipelines. Reception
facilities, in accordance with MARPOL convention, have been provided for receiving ballast, sludge and
slop.
Figure 3.2 POL Berths - BD I & BD III
SAGARMALA: Master Plan for Chennai Port 3-3 Final Report
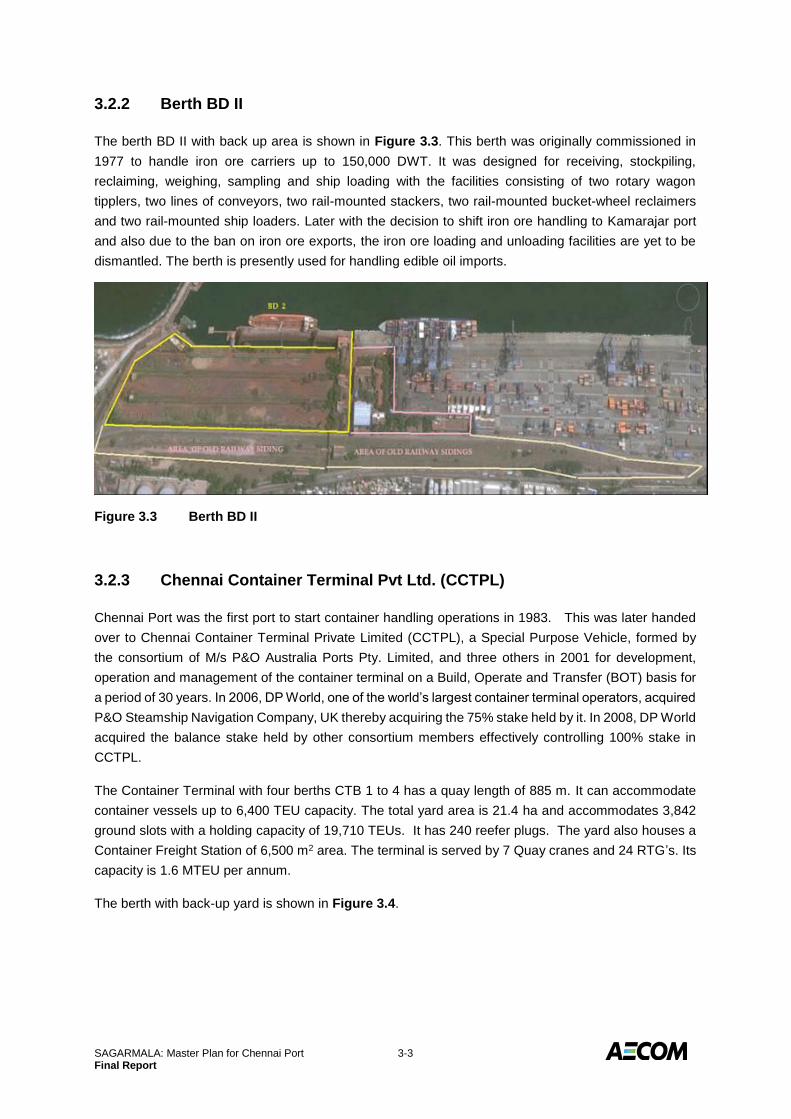
3.2.2 Berth BD II
The berth BD II with back up area is shown in Figure 3.3. This berth was originally commissioned in
1977 to handle iron ore carriers up to 150,000 DWT. It was designed for receiving, stockpiling,
reclaiming, weighing, sampling and ship loading with the facilities consisting of two rotary wagon
tipplers, two lines of conveyors, two rail-mounted stackers, two rail-mounted bucket-wheel reclaimers
and two rail-mounted ship loaders. Later with the decision to shift iron ore handling to Kamarajar port
and also due to the ban on iron ore exports, the iron ore loading and unloading facilities are yet to be
dismantled. The berth is presently used for handling edible oil imports.
Figure 3.3 Berth BD II
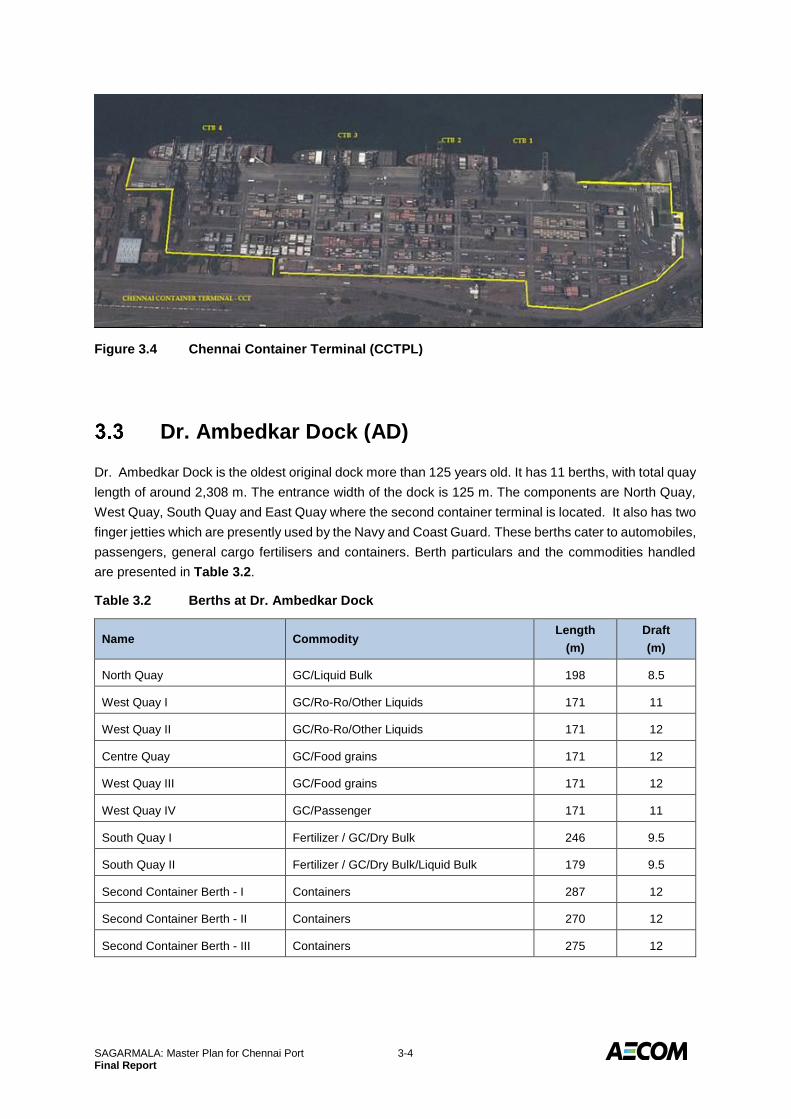
3.2.3 Chennai Container Terminal Pvt Ltd. (CCTPL)
Chennai Port was the first port to start container handling operations in 1983. This was later handed
over to Chennai Container Terminal Private Limited (CCTPL), a Special Purpose Vehicle, formed by
the consortium of M/s P&O Australia Ports Pty. Limited, and three others in 2001 for development,
operation and management of the container terminal on a Build, Operate and Transfer (BOT) basis for
a period of 30 years. In 2006, DP World, one of the world’s largest container terminal operators, acquired
P&O Steamship Navigation Company, UK thereby acquiring the 75% stake held by it. In 2008, DP World
acquired the balance stake held by other consortium members effectively controlling 100% stake in
CCTPL.
The Container Terminal with four berths CTB 1 to 4 has a quay length of 885 m. It can accommodate
container vessels up to 6,400 TEU capacity. The total yard area is 21.4 ha and accommodates 3,842
ground slots with a holding capacity of 19,710 TEUs. It has 240 reefer plugs. The yard also houses a
Container Freight Station of 6,500 m2 area. The terminal is served by 7 Quay cranes and 24 RTG’s. Its
capacity is 1.6 MTEU per annum.
The berth with back-up yard is shown in Figure 3.4.
SAGARMALA: Master Plan for Chennai Port 3-4 Final Report
Figure 3.4 Chennai Container Terminal (CCTPL)
Dr. Ambedkar Dock (AD)
Dr. Ambedkar Dock is the oldest original dock more than 125 years old. It has 11 berths, with total quay
length of around 2,308 m. The entrance width of the dock is 125 m. The components are North Quay,
West Quay, South Quay and East Quay where the second container terminal is located. It also has two
finger jetties which are presently used by the Navy and Coast Guard. These berths cater to automobiles,
passengers, general cargo fertilisers and containers. Berth particulars and the commodities handled
are presented in Table 3.2.
Table 3.2 Berths at Dr. Ambedkar Dock
Name Commodity Length
(m)
Draft
(m)
North Quay GC/Liquid Bulk 198 8.5
West Quay I GC/Ro-Ro/Other Liquids 171 11
West Quay II GC/Ro-Ro/Other Liquids 171 12
Centre Quay GC/Food grains 171 12
West Quay III GC/Food grains 171 12
West Quay IV GC/Passenger 171 11
South Quay I Fertilizer / GC/Dry Bulk 246 9.5
South Quay II Fertilizer / GC/Dry Bulk/Liquid Bulk 179 9.5
Second Container Berth - I Containers 287 12
Second Container Berth - II Containers 270 12
Second Container Berth - III Containers 275 12

SAGARMALA: Master Plan for Chennai Port 3-5 Final Report
3.3.1 North Quay and West Quay Berths
The berths with their back up area /sheds are shown in the Figure 3.5.
Figure 3.5 North Quay and West Quay Berths
The NQ berth is used for handling general cargo and edible oil. WQ 1 & WQ 2 is used to handle car
carriers for automobile exports. These berths have a backup area of over 65,500 m2 in two plots. CB
and WQ 3 are used for handling general cargo and food grains. They have transit sheds behind. WQ 4
handles general cargo as well as passengers. For this purpose, it is provided with a passenger station
with all infrastructures. The entire WQ berths are provided with 2 Jessop Cranes and 2 L&T cranes all
of 15 T capacity.
SAGARMALA: Master Plan for Chennai Port 3-6 Final Report
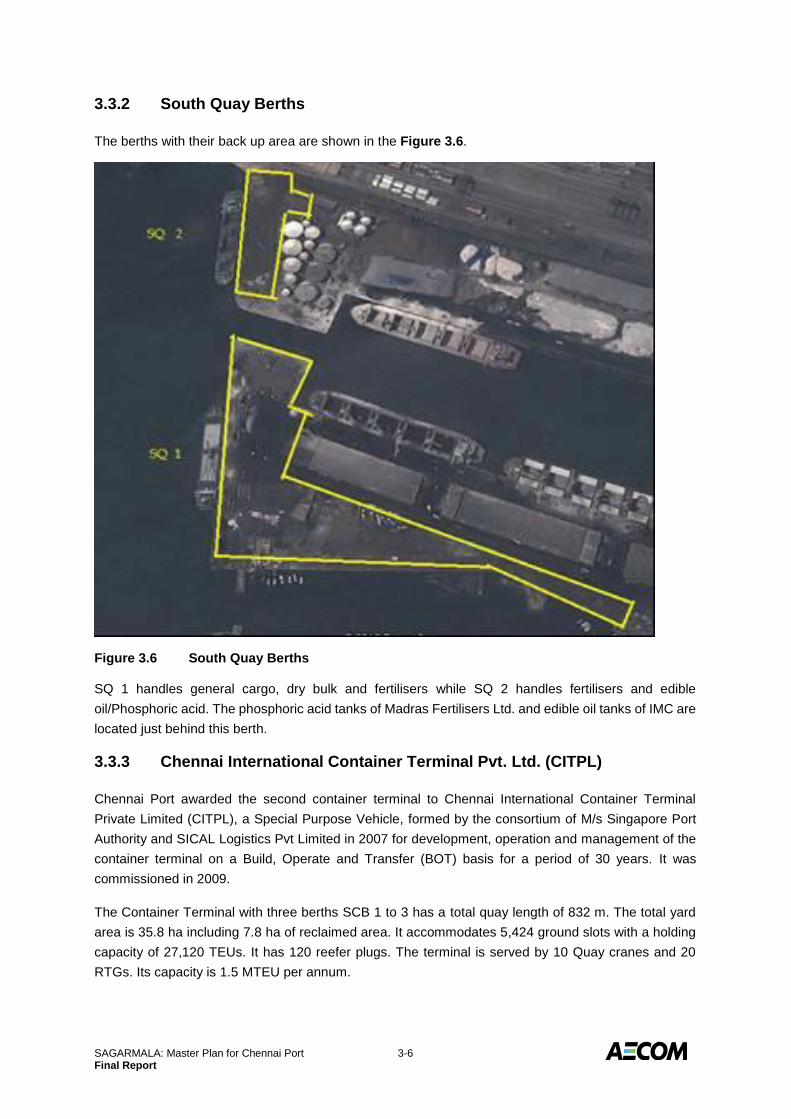
3.3.2 South Quay Berths
The berths with their back up area are shown in the Figure 3.6.
Figure 3.6 South Quay Berths
SQ 1 handles general cargo, dry bulk and fertilisers while SQ 2 handles fertilisers and edible
oil/Phosphoric acid. The phosphoric acid tanks of Madras Fertilisers Ltd. and edible oil tanks of IMC are
located just behind this berth.
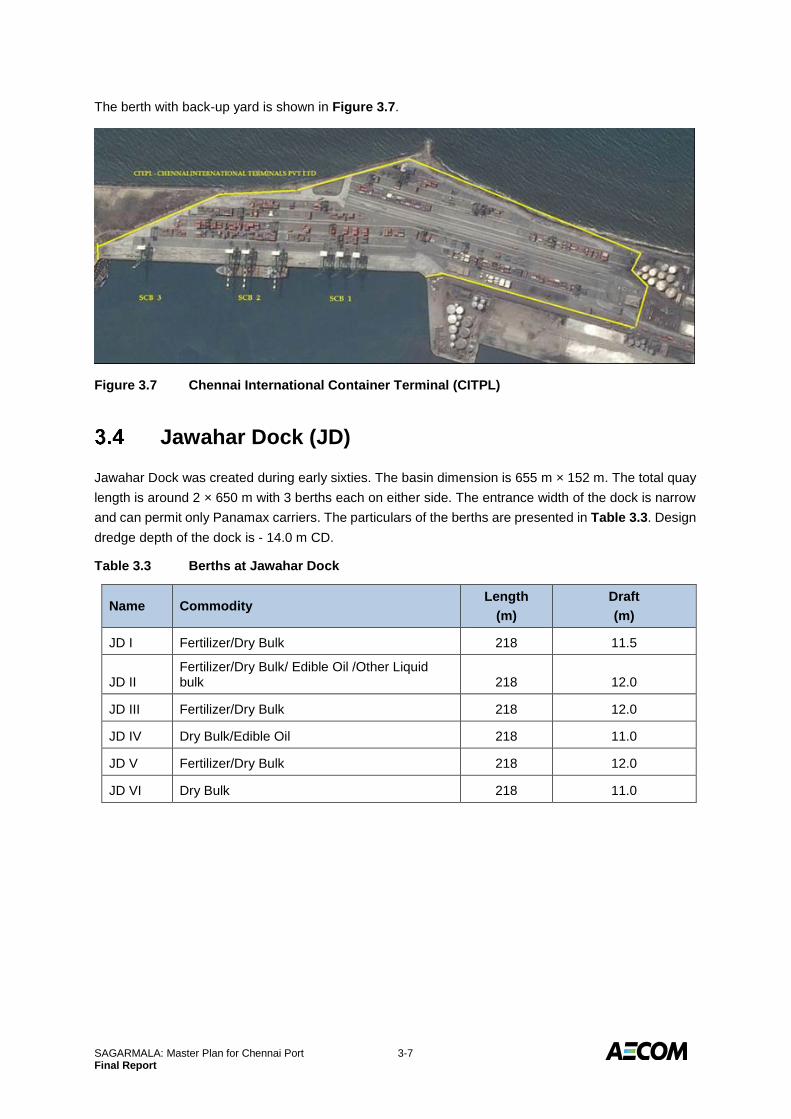
3.3.3 Chennai International Container Terminal Pvt. Ltd. (CITPL)
Chennai Port awarded the second container terminal to Chennai International Container Terminal
Private Limited (CITPL), a Special Purpose Vehicle, formed by the consortium of M/s Singapore Port
Authority and SICAL Logistics Pvt Limited in 2007 for development, operation and management of the
container terminal on a Build, Operate and Transfer (BOT) basis for a period of 30 years. It was
commissioned in 2009.
The Container Terminal with three berths SCB 1 to 3 has a total quay length of 832 m. The total yard
area is 35.8 ha including 7.8 ha of reclaimed area. It accommodates 5,424 ground slots with a holding
capacity of 27,120 TEUs. It has 120 reefer plugs. The terminal is served by 10 Quay cranes and 20
RTGs. Its capacity is 1.5 MTEU per annum.
SAGARMALA: Master Plan for Chennai Port 3-7 Final Report
The berth with back-up yard is shown in Figure 3.7.
Figure 3.7 Chennai International Container Terminal (CITPL)
Jawahar Dock (JD)
Jawahar Dock was created during early sixties. The basin dimension is 655 m × 152 m. The total quay
length is around 2 × 650 m with 3 berths each on either side. The entrance width of the dock is narrow
and can permit only Panamax carriers. The particulars of the berths are presented in Table 3.3. Design
dredge depth of the dock is - 14.0 m CD.
Table 3.3 Berths at Jawahar Dock
Name Commodity Length
(m)
Draft
(m)
JD I Fertilizer/Dry Bulk 218 11.5
JD II Fertilizer/Dry Bulk/ Edible Oil /Other Liquid bulk 218 12.0
JD III Fertilizer/Dry Bulk 218 12.0
JD IV Dry Bulk/Edible Oil 218 11.0
JD V Fertilizer/Dry Bulk 218 12.0
JD VI Dry Bulk 218 11.0
SAGARMALA: Master Plan for Chennai Port 3-8 Final Report
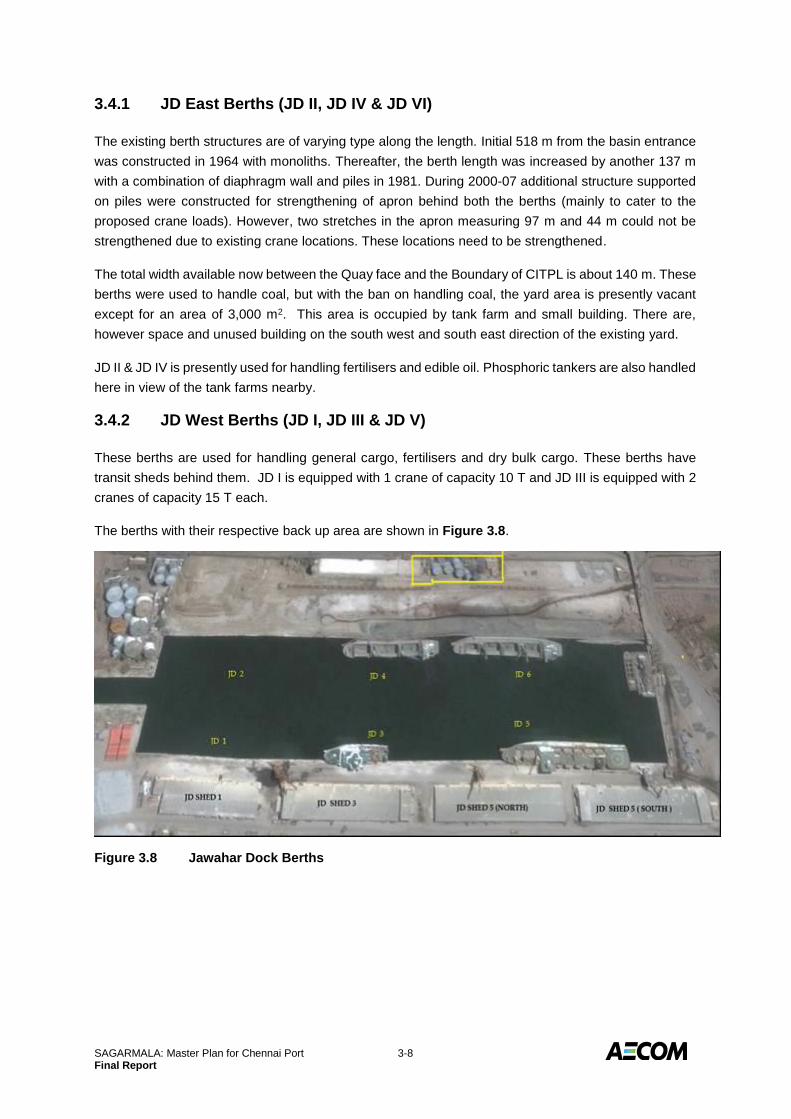
3.4.1 JD East Berths (JD II, JD IV & JD VI)
The existing berth structures are of varying type along the length. Initial 518 m from the basin entrance
was constructed in 1964 with monoliths. Thereafter, the berth length was increased by another 137 m
with a combination of diaphragm wall and piles in 1981. During 2000-07 additional structure supported
on piles were constructed for strengthening of apron behind both the berths (mainly to cater to the
proposed crane loads). However, two stretches in the apron measuring 97 m and 44 m could not be
strengthened due to existing crane locations. These locations need to be strengthened.
The total width available now between the Quay face and the Boundary of CITPL is about 140 m. These
berths were used to handle coal, but with the ban on handling coal, the yard area is presently vacant
except for an area of 3,000 m2. This area is occupied by tank farm and small building. There are,
however space and unused building on the south west and south east direction of the existing yard.
JD II & JD IV is presently used for handling fertilisers and edible oil. Phosphoric tankers are also handled
here in view of the tank farms nearby.
3.4.2 JD West Berths (JD I, JD III & JD V)
These berths are used for handling general cargo, fertilisers and dry bulk cargo. These berths have
transit sheds behind them. JD I is equipped with 1 crane of capacity 10 T and JD III is equipped with 2
cranes of capacity 15 T each.
The berths with their respective back up area are shown in Figure 3.8.
Figure 3.8 Jawahar Dock Berths
SAGARMALA: Master Plan for Chennai Port 3-9 Final Report
Other Facilities at the Port
The cargo handling equipment’s available at the Port are indicated vide Table 3.4, as under:
Table 3.4 Cargo Handling Equipment at the Port
S. No. Equipment Numbers Capacity
1. Floating Crane 1 150 T
2. Diesel Electric Locomotive 10 700 HP – 8 Nos.
1,400 HP – 2 Nos.
3. Harbour Mobile Crane 2 100 T
The cargo storage facilities available at the port are indicated in Table 3.5.
Table 3.5 Cargo Storage Facilities at the Port
Transit Shed / Over Flow shed 7 no. – 30,693 m2
Warehouse 5 no. – 30,138 m2
Container Freight Station 3 no. – 40,644 m2
Open Space 3,84,611 m2
Container Parking Yard 2,50,600 m2
Bulk Liquid Storage & Linkages
In Chennai port the liquid bulk traffic is almost 25 % of the total traffic. The traffic comprises mainly crude
oil for the Manali Refinery of Chennai Petroleum Corporation Ltd., POL product exports, Edible
oil/Molasses and chemicals. While crude oil and POL products are handled at BD I & BD III,
Molasses/Edible oil are handled at BD II, NQ, WQ 1 , WQ 2, SQ II, JD II & JD IV. Some of the agencies
have their own tankage within the port custom bound area while some others are having their tankage
outside the port limits. The details of the tankages and linkage are given hereunder.
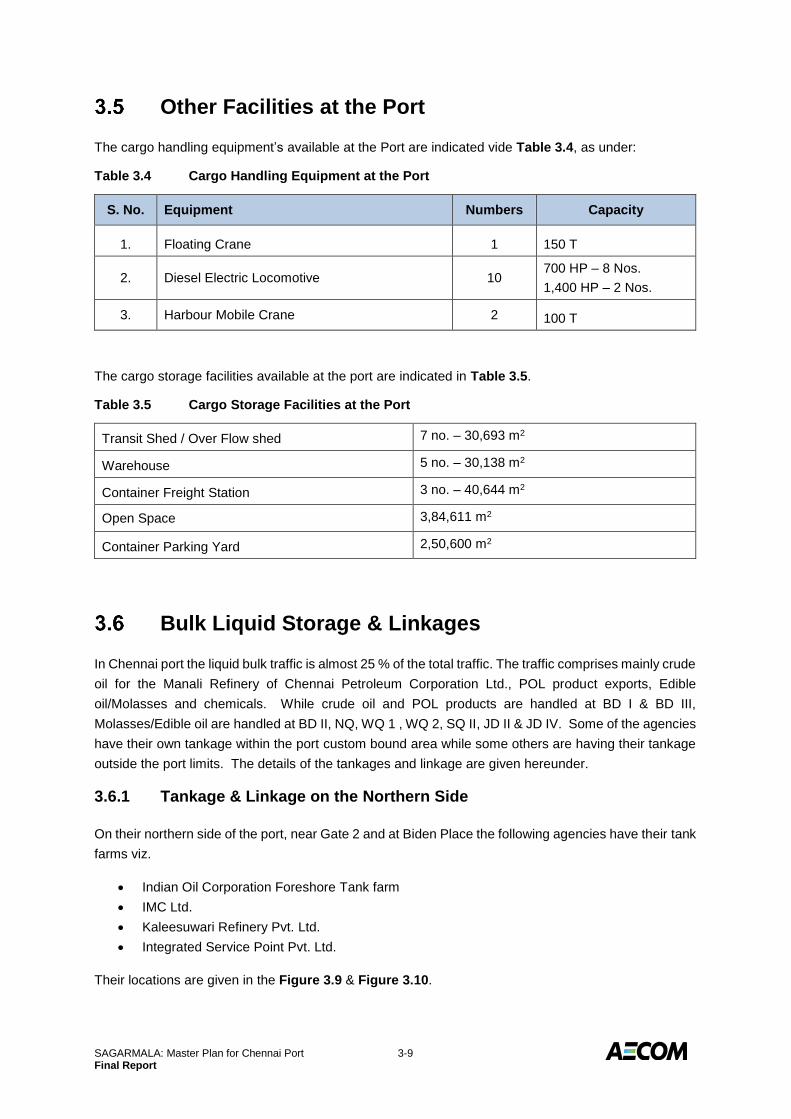
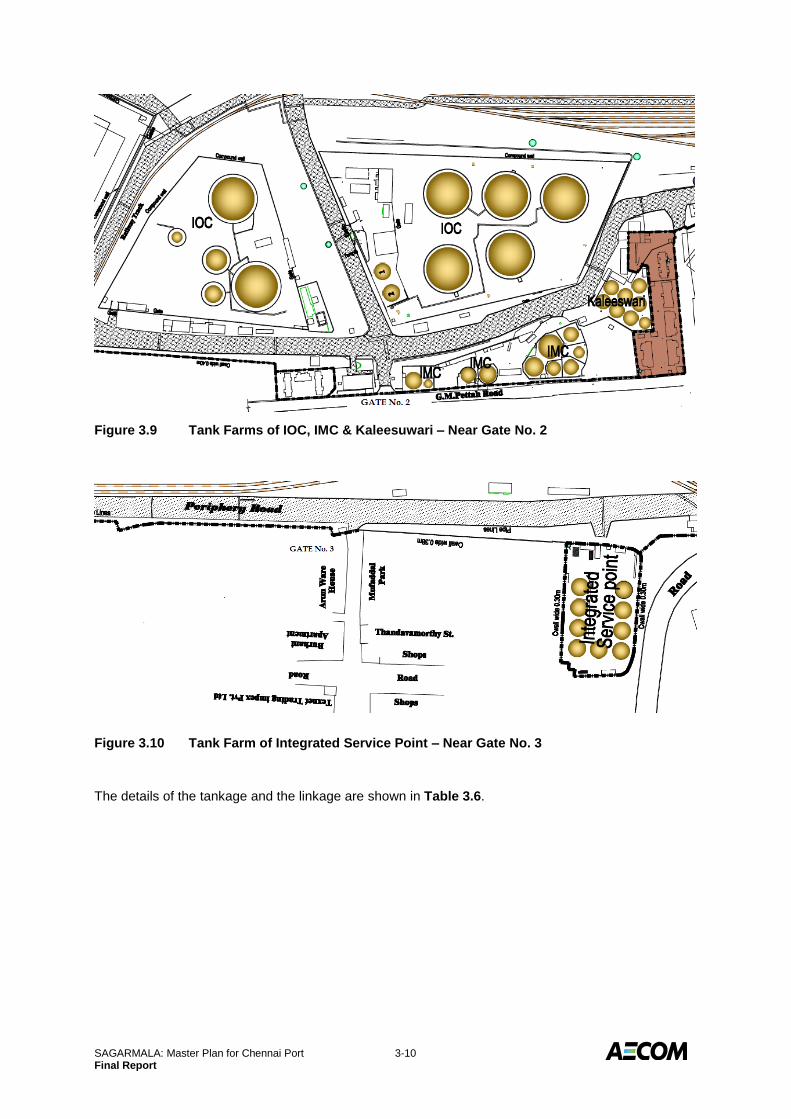
3.6.1 Tankage & Linkage on the Northern Side
On their northern side of the port, near Gate 2 and at Biden Place the following agencies have their tank
farms viz.
Indian Oil Corporation Foreshore Tank farm
IMC Ltd.
Kaleesuwari Refinery Pvt. Ltd.
Integrated Service Point Pvt. Ltd.
Their locations are given in the Figure 3.9 & Figure 3.10.
SAGARMALA: Master Plan for Chennai Port 3-10 Final Report
Figure 3.9 Tank Farms of IOC, IMC & Kaleesuwari – Near Gate No. 2
Figure 3.10 Tank Farm of Integrated Service Point – Near Gate No. 3
The details of the tankage and the linkage are shown in Table 3.6.

SAGARMALA: Master Plan for Chennai Port 3-11 Final Report
Table 3.6 Cargo Storage Facilities at the Port
Berth Pipelines
BD I 1 x 20" + 1 x 16" + 3 x 14"
BD III 1 x 20" + 2 x 14"
Molasses BD I 1 x 12" + 1 x 8"
Edbile Oil BD II 1 x 12" + 2 x 8"
3 Kaleesuwari Refinery Pvt Ltd. Edible Oil 8 23,000 BD II 1 x 12"
4 Integrated Service Point Pvt. Ltd. Edible Oil 9 18,000 NQ - WQ 1 1 x 14" + 1 x 10"
BD I 1 x 30"
BD III 1 x 30"
LSHS BD III 1 x 16"
Bitumen BD II 1 x 12"
3 TCL Chemical BD III 1 x 8"
BD II 1 x 12"+ 1 x 8"
NQ - WQ 2 1 x 8"
5 KTV Edible Oil BD II 1 x 10"
2 Hindustan Petroleum Corporation Ltd.
4 Ruchi Edible Oil
1 Chennai Petroleum Corporation Ltd. Crude Oil
2 IMC Ltd.. 11 33,402
Outside Custom bound Area
Details of Tank farm within Port Custom bound Area
Northern side near GATE No. 2
LinkageS.No. Name of Licensee
No. of
Tanks
Total
Capacity (kL)Product
Indian Oil Corporation Ltd. 10 91,0541 POL Products
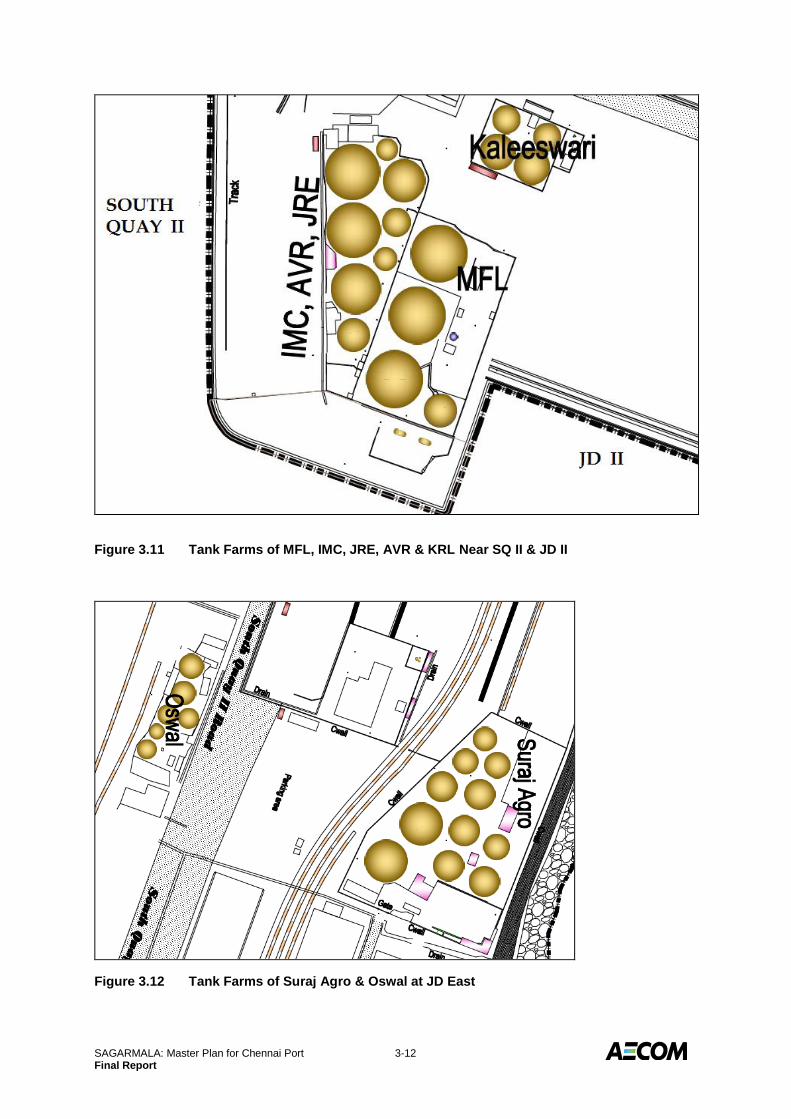
3.6.2 Tankage & Linkage on the Southern Side
On their southern side of the port, near SQ II & JD II the following agencies have their tank farms viz.
IMC Ltd.
JRE Tank Terminals Pvt. Ltd.
Kaleesuwari Refinery Pvt. Ltd.
Madras Fertilisers Ltd.
Oswal Oils & Vanaspati Industries
Suraj Agro Infrastructure (India) Pvt. Ltd.
AVR Storage Tank Terminals Pvt. Ltd.
Their locations are given in the Figure 3.11 & Figure 3.12.
SAGARMALA: Master Plan for Chennai Port 3-12 Final Report
Figure 3.11 Tank Farms of MFL, IMC, JRE, AVR & KRL Near SQ II & JD II
Figure 3.12 Tank Farms of Suraj Agro & Oswal at JD East

SAGARMALA: Master Plan for Chennai Port 3-13 Final Report
The details of the tankage and the linkage are given in the following Table 3.7.
Table 3.7 Details of Tank Farms within Port Custom Bound Area Southern Side Near SQ II and JD II
Berth Pipelines
1 Madras Fertilisers Ltd. Phosphoric Acid 3 18,180JD IV 1 x 12"
Molasses SQ II - JD II 1 x 18" + 1 x 10"
Edbile Oil SQ II 1 x 6"
3AVR Storage Tank Terminals Pvt .
Ltd.Edible Oil 4 12,121
4 JRE Tank Terminals Pvt. Ltd. Molasses 1 5,834
5 Kaleesuwari Refinery Pvt. Ltd. Edible oil 4 11,796 SQ II 1 x 8"
Non Hazardous JD II - JD IV 1 x 18" + 1 x 8"
Edible Oil SQ II 1 x 8"
JD II - JD IV 2 x 8"
JD II - JD VI 1 x 8"
2 IMC Ltd. 4 11,470
S. No. Name of Licensee ProductNo. of
Tanks
Total Capacity
(kL)
Linkages
6Suraj Agro Infrastructure (I) Pvt.
Ltd.11 45,700
7 Owal Oils & Vanaspati Industries Edible Oil 6 9,966
SAGARMALA: Master Plan for Chennai Port 4-1 Final Report
4.0 PERFORMANCE, OPTIONS FOR DEBOTTLENECKING & CAPACITY ASSESSMENT
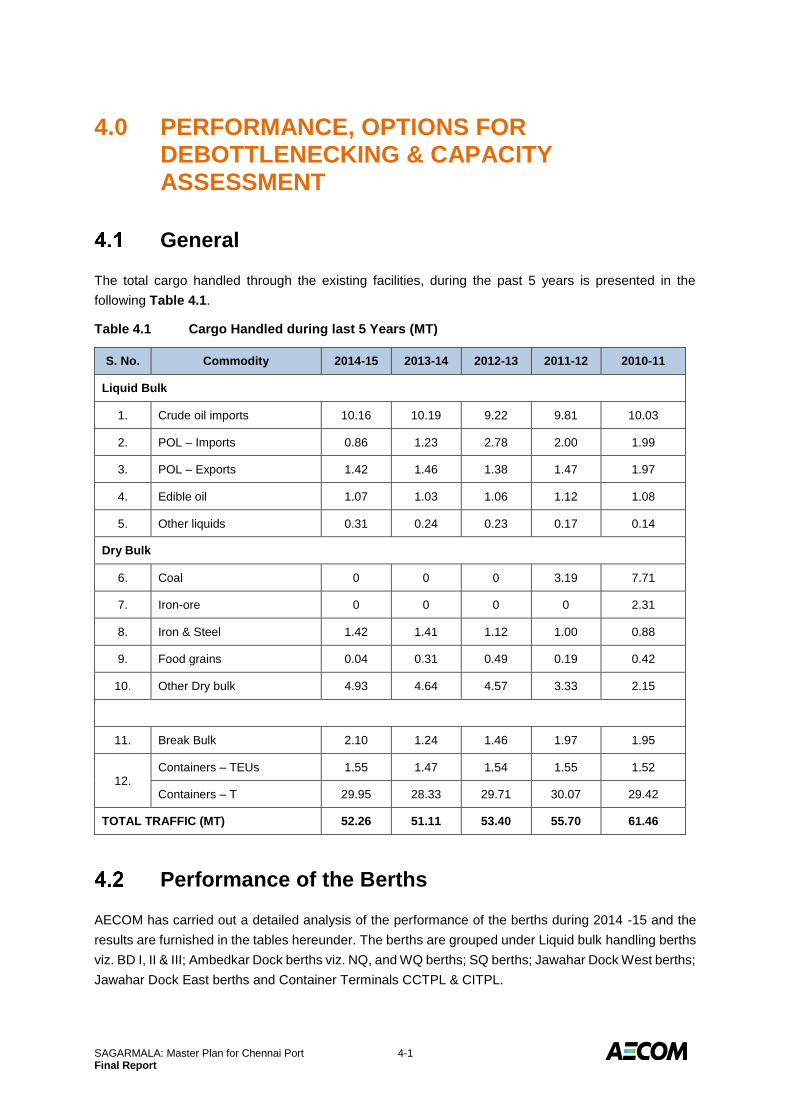
General
The total cargo handled through the existing facilities, during the past 5 years is presented in the
following Table 4.1.
Table 4.1 Cargo Handled during last 5 Years (MT)
S. No. Commodity 2014-15 2013-14 2012-13 2011-12 2010-11
Liquid Bulk
1. Crude oil imports 10.16 10.19 9.22 9.81 10.03
2. POL – Imports 0.86 1.23 2.78 2.00 1.99
3. POL – Exports 1.42 1.46 1.38 1.47 1.97
4. Edible oil 1.07 1.03 1.06 1.12 1.08
5. Other liquids 0.31 0.24 0.23 0.17 0.14
Dry Bulk
6. Coal 0 0 0 3.19 7.71
7. Iron-ore 0 0 0 0 2.31
8. Iron & Steel 1.42 1.41 1.12 1.00 0.88
9. Food grains 0.04 0.31 0.49 0.19 0.42
10. Other Dry bulk 4.93 4.64 4.57 3.33 2.15
11. Break Bulk 2.10 1.24 1.46 1.97 1.95
12. Containers – TEUs 1.55 1.47 1.54 1.55 1.52
Containers – T 29.95 28.33 29.71 30.07 29.42
TOTAL TRAFFIC (MT) 52.26 51.11 53.40 55.70 61.46
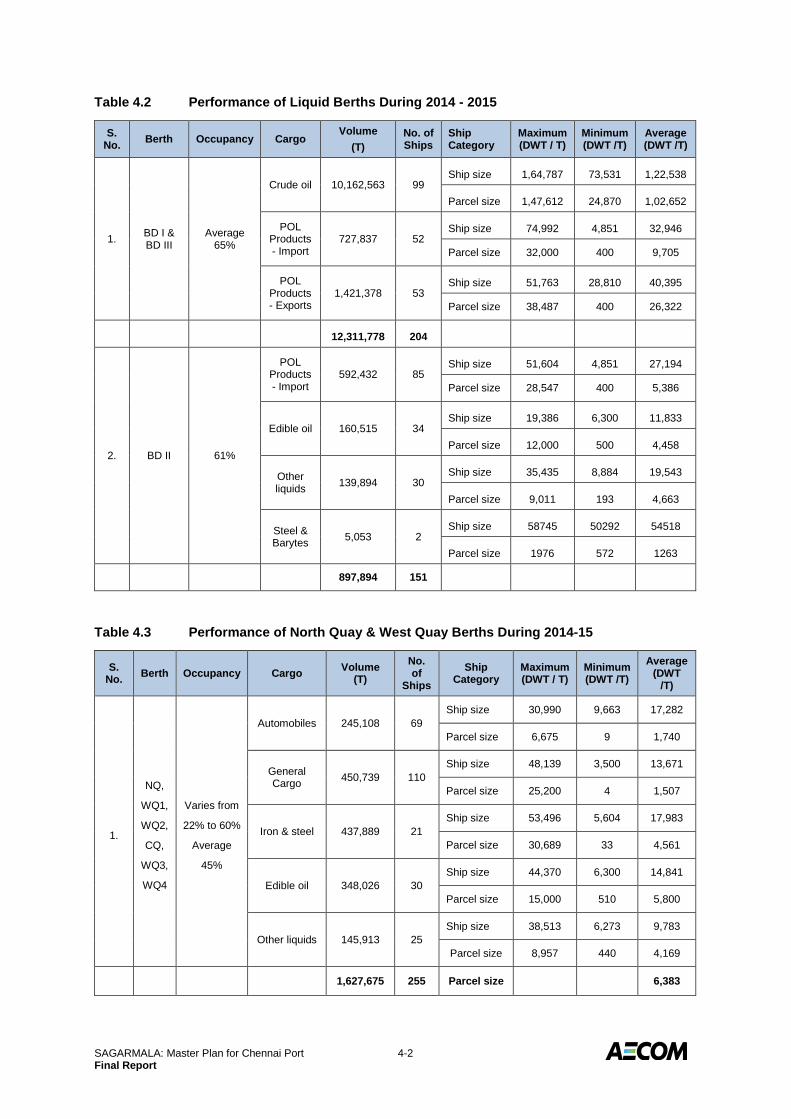
Performance of the Berths
AECOM has carried out a detailed analysis of the performance of the berths during 2014 -15 and the
results are furnished in the tables hereunder. The berths are grouped under Liquid bulk handling berths
viz. BD I, II & III; Ambedkar Dock berths viz. NQ, and WQ berths; SQ berths; Jawahar Dock West berths;
Jawahar Dock East berths and Container Terminals CCTPL & CITPL.
SAGARMALA: Master Plan for Chennai Port 4-2 Final Report
Table 4.2 Performance of Liquid Berths During 2014 - 2015
S. No.
Berth Occupancy Cargo Volume
(T)
No. of Ships
Ship Category
Maximum (DWT / T)
Minimum (DWT /T)
Average (DWT /T)
1. BD I & BD III
Average 65%
Crude oil 10,162,563 99 Ship size 1,64,787 73,531 1,22,538
Parcel size 1,47,612 24,870 1,02,652
POL Products - Import
727,837 52 Ship size 74,992 4,851 32,946
Parcel size 32,000 400 9,705
POL Products - Exports
1,421,378 53 Ship size 51,763 28,810 40,395
Parcel size 38,487 400 26,322
12,311,778 204
2. BD II 61%
POL Products - Import
592,432 85 Ship size 51,604 4,851 27,194
Parcel size 28,547 400 5,386
Edible oil 160,515 34 Ship size 19,386 6,300 11,833
Parcel size 12,000 500 4,458
Other liquids
139,894 30 Ship size 35,435 8,884 19,543
Parcel size 9,011 193 4,663
Steel & Barytes
5,053 2 Ship size 58745 50292 54518
Parcel size 1976 572 1263
897,894 151
Table 4.3 Performance of North Quay & West Quay Berths During 2014-15
S. No.
Berth Occupancy Cargo Volume
(T)
No. of
Ships
Ship Category
Maximum (DWT / T)
Minimum (DWT /T)
Average (DWT
/T)
1.
NQ,
WQ1,
WQ2,
CQ,
WQ3,
WQ4
Varies from
22% to 60%
Average
45%
Automobiles 245,108 69
Ship size 30,990 9,663 17,282
Parcel size 6,675 9 1,740
General Cargo
450,739 110
Ship size 48,139 3,500 13,671
Parcel size 25,200 4 1,507
Iron & steel 437,889 21
Ship size 53,496 5,604 17,983
Parcel size 30,689 33 4,561
Edible oil 348,026 30
Ship size 44,370 6,300 14,841
Parcel size 15,000 510 5,800
Other liquids 145,913 25
Ship size 38,513 6,273 9,783
Parcel size 8,957 440 4,169
1,627,675 255 Parcel size 6,383

SAGARMALA: Master Plan for Chennai Port 4-3 Final Report
Table 4.4 Performance of South Quay Berths During 2014-15
S. No.
Berth Occupancy Cargo Volume
(T) No. of Ships
Ship Category
Maximum (DWT / T)
Minimum (DWT /T)
Average (DWT /T)
1.
SQ 1
& SQ
2
Average
57%
Iron & Steel 300,407 19
Ship size 49,326 6,544 23,913
Parcel size 30,090 38 3,851
Cut stone 142,773 3 Ship size 63301 27321 49075
Parcel size 34891 21600 28555
Fertilisers Raw &
Finished 130,383 5
Ship size 34,938 9,839 25,201
Parcel size 30,414 5,900 16,298
Edible oil 61,887 15 Ship size 19997 11321 15659
Parcel size 10698 550 4126
Barytes 51,006 3 Ship size 11606 10700 11153
Parcel size 34746 1260 17002
General Cargo
201,691 67
Ship size 50,363 2,300 13,884
Parcel size 29,280 27 2,318
888,147 112 7930
Table 4.5 Performance of Container Terminals During 2014-15
S. No.
Berth Occupancy Cargo Volume
(T) No. of Ships
Ship Category
Maximum (DWT / T)
Minimum (DWT /T)
Average (DWT /T)
1.
CCTPL - CTB 1 to 4
Average 26%
Containers 862,595 393
Ship size 67,686 9,944 38,008
Parcel size
2,866 2 1,061
2.
CITPL - SCB 1 to 3
Average 42%
Containers 719,745 369 Ship size 62,649 1,778 22,836
Parcel size
2,957 1 856
1,582,340 762

SAGARMALA: Master Plan for Chennai Port 4-4 Final Report
Table 4.6 Performance of Jawahar Dock - West Quay Berths During 2014-15
S. No. Berth Occupancy Cargo
Volume in T
No. of Ships
Ship Category
Maximum DWT / T
Minimum
DWT / T
Average
DWT /T
1.
JD 1
JD 3
JD 5
Varies from
41% to 63%
Average
53%
Limestone 2,484,274 47
Ship size 63,351 47,286 54,454
Parcel size 54,170 10,000 40,873
Dolomite & Barytes
817,469 21
Ship size 61,344 23,524 44,795
Parcel size
54,868 2,790 34,061
Fertiliser - Raw &
Finished 515,992 22
Ship size 57,572 20,479 41,105
Parcel size
45,000 4,399 22,434
Iron & steel 429,818 16
Ship size 53,208 8,241 32,546
Parcel size
37,249 34 8,955
General Cargo
319,729 29
Ship size 61,498 7,802 26,940
Parcel size
53,830 19 8,198
4,567,282 135 Parcel size
33,832
Table 4.7 Performance of Jawahar Dock - East Quay Berths During 2014-15
S. No
Berth Occupancy Cargo Volume
(T) No. of Ships
Ship Category
Maximum DWT / T
Minimum
DWT /T
Average
DWT /T
1.
JD 2
JD 4
JD 6
Varies from
55% to 96%
Average
73%
Cement Clinker & Limestone
393,433 18
Ship size 56,719 6,261 24,492
Parcel size 50,537 5,750 19,672
Dolomite & Barytes
363,831 9
Ship size 58,811 26,482 47,475
Parcel size
52,983 8,761 33,076
Edible oil 279,925 41
Ship size 50,844 6,337 17,305
Parcel size
12,500 300 4,117
General Cargo
863,528 32
Ship size 58,642 5,014 34,734
Parcel size
48,100 75 24,672
Fertiliser Raw
Materials 19,800 1
Ship size 35050 - -
Parcel size
19800 - -
CBFS 2,849
1
Ship size 2931 - -
Parcel size
2849 - -
1,923,366 102 Parcel size
18,856

SAGARMALA: Master Plan for Chennai Port 4-5 Final Report
The following observations are made from this analysis:
Almost 80 % of the port traffic is handled at the two oil jetties (crude oil & POL products) and
the two container terminals.
Automobiles are handled at the two WQ berths 1 & 2 which have the requisite back up area for
parking the cars units.
Edible oil is handled at BD II, NQ, SQ 2 and JD 2 berths as the related tank farms are located
in two sectors – one near Gate 2 and the other on the east side of JD.
Fertiliser materials – raw as well as finished are handled at SQ 2 and JD 2 berths.
BCG Benchmarking Study
BCG, as part of their benchmarking study, has looked into the operation of the berths and has suggested
various measures for improving the performance. The report of BCG pertaining to Chennai Port is given
in the Appendix 1. The key observations are as follows:
4.3.1 Observations on CCTPL
Evacuation is a major challenge for Chennai port with large queue lengths of trailers observed from the
container terminal gates. It has been found out that the yard productivity is the key constraint on
evacuation. It has been observed that the yard throughput (measured as the no. of export TEUs moving
in through the terminal gate) is inversely related to berth productivity (measured as the no. of TEUs
handled in the berths). When large vessel berths in the terminal, the resources get deployed in the quay
side to load/ unload containers from the vessel. This results in shortage of resources on the yard side
and hence the number of containers moved from export trailers to yard drops significantly. To cope with
this, the terminals proceed to close export gates to stop further inflow of export trailers to the container
yard. This phenomenon can be corroborated from the fact that high berth productivity periods coincide
with long duration of gate closures. The terminal needs to either boost their RTGC productivity to 15
moves / hr or employ additional RTGCs.
Optimal yard space is critical for maintain yard productivity. Shortage of yard space in this terminal is
identified as a driving factor for low yard productivity that leads to congestion in the port. At present, the
CCTPL yard has 3,940 ground slots for containers. The analysis carried out shows the optimal number
of ground slots required in CCTPL is ~4,400. Adding 460 ground slots with an optimal ground slot
density of ~200 would require a yard space of ~22 Ha. Hence 4-5 Ha of additional yard space should
be provided to CCTPL for allowing proper yard management. This additional yard space can be
provided by utilizing currently unused space near CCTPL terminal. This area would require minimum
alterations before it can be handed over to DP World.
SAGARMALA: Master Plan for Chennai Port 4-6 Final Report
Modal shift of cargo from road to rail can help reduce pressure on roads for evacuation and hence ease
the congestion issue in and around Chennai port. It will help the port to circumvent all issues with road
infrastructure and traffic congestion outside the port boundary. At present, 0.07 M TEU of container
cargo gets evacuated through rail. Chennai hinterland has four existing ICDs – Bangalore (Whitefield),
Tondiarpet, Arakkonam and Irrungatukottai. Out of the four ICDs, only the Bangalore ICD currently has
rake services to Chennai. The logistics cost for moving containers through rail from Bangalore ICD is
higher than the cost for moving containers through road by ~Rs. 2,500 per TEU. This is in spite of the
fact that the rail freight of Rs. 9,000 is lower than the road freight of Rs. 12,000 in this route. The
additional rail yard handling cost, trailer cost for the last mile connectivity and the mark up charged by
the liners for ICD bound cargo contribute to the difference in logistics cost. Additional charges are levied
on CONCOR for the rake operations by the Chennai port and the railways. All these additional charges
add up to ~Rs. 1,300. The port should waive its haulage charge, repositioning charge, port service
charge completely on rake operations. This will have result in a loss of revenue for the port but will be
critical for retention of container traffic.
The port must develop a common rail yard from where both terminals can move their cargo. Preliminary
studies in the port has identified land parcel available near the current marshalling yard as the ideal
location for building the common container yard. The yard would have space to handle up to 0.75 MTEU
per year and would also have adequate equipment to maintain high productivity levels. The common
yard will make running of mixed rakes viable. It will reduce the turnaround time for rakes by ~10 hours.
This will allow rake operators to run rakes more frequently and hence increase the maximum rail
throughput by 26%. It will also result in higher savings for the rail operator.
4.3.2 Observations on Edible Oil Traffic
In recent times, Chennai port has lost part of its edible oil traffic to Krishnapatnam. This is despite the
fact that Krishnapatnam is farther from the plant locations than Chennai; hence it has higher logistics
cost. But Krishnapatnam has compensated for the higher logistics cost by lowering the port charges on
edible oil It has developed a practice of benchmarking its charges to the port charges in Chennai. This
allows Krishnapatnam to offer lower prices to customers who can shift their traffic from Chennai to
Krishnapatnam. Chennai port should also assign a team to track prices charged by Krishnapatnam and
other ports. The pricing of port charges should be revised based on what competitors are charging the
customers for the same cargo. In case of Edible oil Chennai port must reduce its port charges by more
than Rs. 15/ T to attract additional volumes to the port. The study shows that port charges for
Krishnapatnam are ~Rs. 35/ T lower than Chennai. Overall cost of handling edible oil in Chennai is
costlier by Rs. 15/ T which translates to ~Rs. 2 lakhs per ship for an average edible oil carrier. Higher
cost and evacuation issues in Chennai have made customers move to Krishnapatnam.

SAGARMALA: Master Plan for Chennai Port 4-7 Final Report
Madurai is farther from Chennai port than VOC port. The freight of carrying Edible oil from Madurai to
Chennai is estimated to be around Rs. 1300/ T as compared to Madurai to Tuticorin freight of Rs. 700/
T. The higher freights make it infeasible for customers in Madurai cluster to use Chennai port. Running
edible oil rakes from Madurai to Chennai can reduce the freight cost by Rs. 900/ T. This will reduce the
overall logistics cost of handling edible oil in Chennai port to match that of the VOC port. Railways
require a minimum of 6 rakes per month to start the service. This translates to a volume of ~15,000 T
per month. Madurai cluster can attract >20,000 T of edible oil volume per month, which would require
monthly service of 8-9 rakes. Moving edible oil in rakes will require storage of edible oil in the port till
adequate quantity gets aggregated for filling one rake. It will be critical to develop adequate local storage
facilities (tankers) in the port. Long-term land leases should be awarded to attract customers to invest
in their tank farms in the port.
4.3.3 Observations on Fertiliser Traffic
Productivity of fertilizer handling facility in the Chennai port can be improved by mechanization of
fertilizer handling facility in the port. Mechanized unloading of fertilizer for ships to conveyor belts can
increase productivity by ~40% and match Krishnapatnam's productivity levels. To complement
mechanical handling, Chennai port should also create mechanical bagging facility. As Chennai can
realistically capture 0.5-0.7 MT of fertilizer cargo, the port should aim to develop a bagging plant of
capacity 0.5 MT. Chennai is also well connected by rail network to the hinterland areas and distribution
centres. Evacuation of rail can be explored further. The bagging plant must be located at vicinity of the
existing rail yard
Measures for Capacity Enhancement
The observations made by BCG are examined and those that are appropriate and are feasible of
execution have been considered in the subsequent sections based on the future traffic projections.
Capacity Assessment of Existing Facilities
The capacity of any existing port facilities depends on a combination of number of factors like the type
of cargo handled, the DWT of the vessel, the vessel parcel size, the permissible berth occupancy, the
type of handling facilities, the productivity of human resources both handling and managerial, the
traditions and practices obtained etc.
The current capacity of Chennai port is worked out, based on capacity rating of all berths handling
different types of commodities including container, liquid and general cargo (break bulk and dry bulk),
as per guidelines provided in Berthing Policy for Dry Bulk Cargo for Major Ports, 2017.
The rated berth capacity and the capacity at desired occupancy based on sustainable occupancy rate
of 85% for containers and 70% for rest of the cargoes) are given in Table 4.8 below:

SAGARMALA: Master Plan for Chennai Port 4-8 Final Report
Table 4.8 Capacity of Berths
S. No. Berths Commodity Rated Capacity
(MTPA) Capacity at Desired Occupancy
(MTPA)
1. NQ General Cargo 1.04 0.73
2. WQ General Cargo 8.28 5.80
3. CQ General Cargo 2.21 1.55
4. SQ General Cargo 4.00 2.80
5. JD General Cargo 22.07 15.45
6. BD1 Liquid 6.71 4.69
7. BD2 Liquid 2.83 1.98
8. BD3 Liquid 25.69 17.98
9. SCB1-3 Container 29.50 25.07
10. CTB1-4 Container 31.27 26.58
Total 133.6 102.63
The detailed methodology of arriving at the port capacity and the calculations are provided in Appendix
2.

SAGARMALA: Master Plan for Chennai Port 5-1 Final Report
5.0 DETAILS OF ONGOING DEVELOPMENTS
General
In recent times, in order to meet the growing traffic demands, Chennai Port has initiated action for
creating additional terminal facilities. The ongoing projects are
Development of Coastal Terminal near Northern sheltering arm;
Construction of a Coastal road with necessary shore protection along the sea shore to the old
harbour entrance; and
Two numbers of Exim Godowns in order to enhance the stacking facility of EXIM cargo (Agri
and Food grains).
The locations of these facilities are shown in Figure 5.1.
Figure 5.1 Layout Details of Chennai Port Showing the Ongoing Developments
The details of these facilities are brought out hereunder:
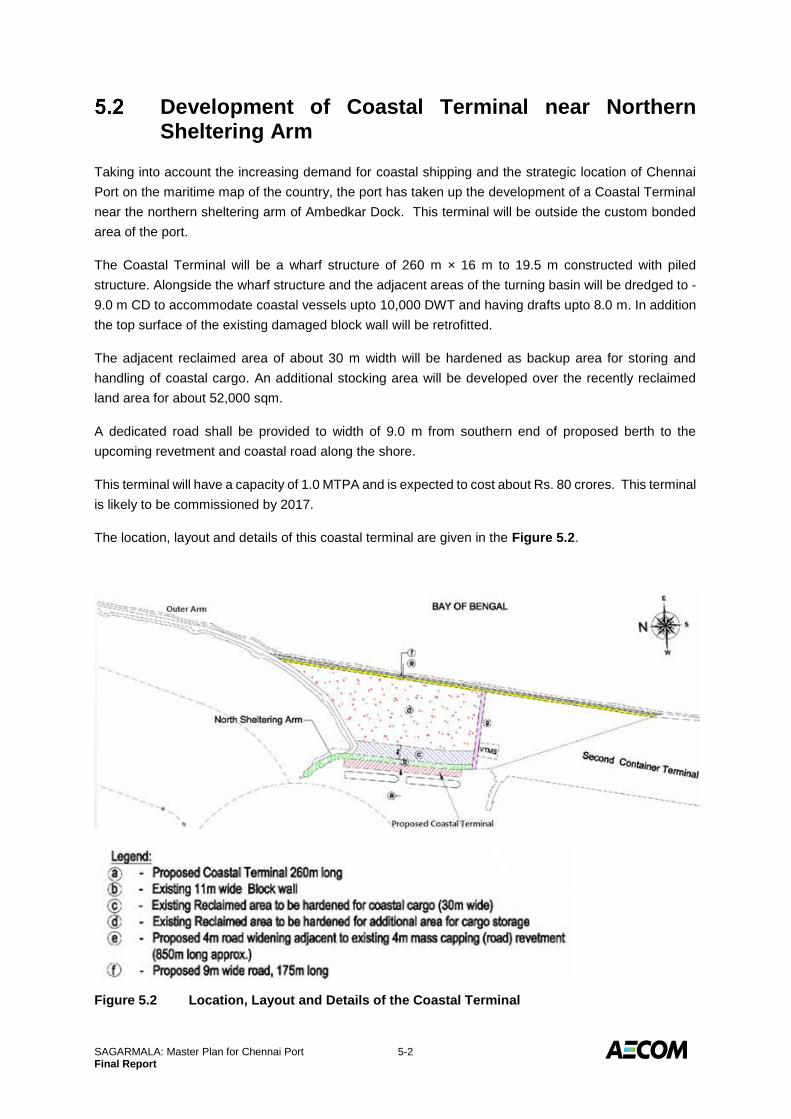
SAGARMALA: Master Plan for Chennai Port 5-2 Final Report
Development of Coastal Terminal near Northern Sheltering Arm
Taking into account the increasing demand for coastal shipping and the strategic location of Chennai
Port on the maritime map of the country, the port has taken up the development of a Coastal Terminal
near the northern sheltering arm of Ambedkar Dock. This terminal will be outside the custom bonded
area of the port.
The Coastal Terminal will be a wharf structure of 260 m × 16 m to 19.5 m constructed with piled
structure. Alongside the wharf structure and the adjacent areas of the turning basin will be dredged to -
9.0 m CD to accommodate coastal vessels upto 10,000 DWT and having drafts upto 8.0 m. In addition
the top surface of the existing damaged block wall will be retrofitted.
The adjacent reclaimed area of about 30 m width will be hardened as backup area for storing and
handling of coastal cargo. An additional stocking area will be developed over the recently reclaimed
land area for about 52,000 sqm.
A dedicated road shall be provided to width of 9.0 m from southern end of proposed berth to the
upcoming revetment and coastal road along the shore.
This terminal will have a capacity of 1.0 MTPA and is expected to cost about Rs. 80 crores. This terminal
is likely to be commissioned by 2017.
The location, layout and details of this coastal terminal are given in the Figure 5.2.
Figure 5.2 Location, Layout and Details of the Coastal Terminal

SAGARMALA: Master Plan for Chennai Port 5-3 Final Report
Construction of Coastal Road along the Sea Shore
In order to facilitate the evacuation of coastal cargo outside the custom bonded area, the Port Trust has
undertaken the work of formation of a Coastal Road with necessary shore protection on the eastern
periphery from INS Adyar to the old Harbour entrance.
From the north tower of old harbour entrance, a concrete road of 850 m length was provided while
constructing the rubble mound revetment at east of east quay during 2008 and this road leads to the
Outer Protection Arm Breakwater. In the absence of an access road in the portion between M/s Suraj
Agro Industries and old harbour entrance, the port does not have access to the Outer Protection Arm
breakwater and revetment at East Quay for any immediate rectification or repair works and to carry out
further development works. Therefore, the port personnel and vehicles have to pass through the area
leased to the 2nd Container Terminal Operator, M/s CITPL with the consent of the Licensee.
Hence, the port planned to provide an exclusive road access east of the 2nd Container Terminal area
after carrying out the shore protection in the left out portion of coastal road. Due to instability of the
shore area at left out portion of coastal road, it is proposed to provide two lane traffic (8 m width) after
adequately strengthening the existing revetment along the eastern side of the M/s CITPL compound
from M/s Suraj Agro Industries to Old Harbour Entrance. The core stone and armour layer below the
existing revetment shall be the base for forming the road on top. The estimated cost of the project is Rs.
63 cr and the work is in progress. The location and alignment of this coastal road is shown in the Figure
5.3.
Figure 5.3 Layout and Alignment of the Coastal Road
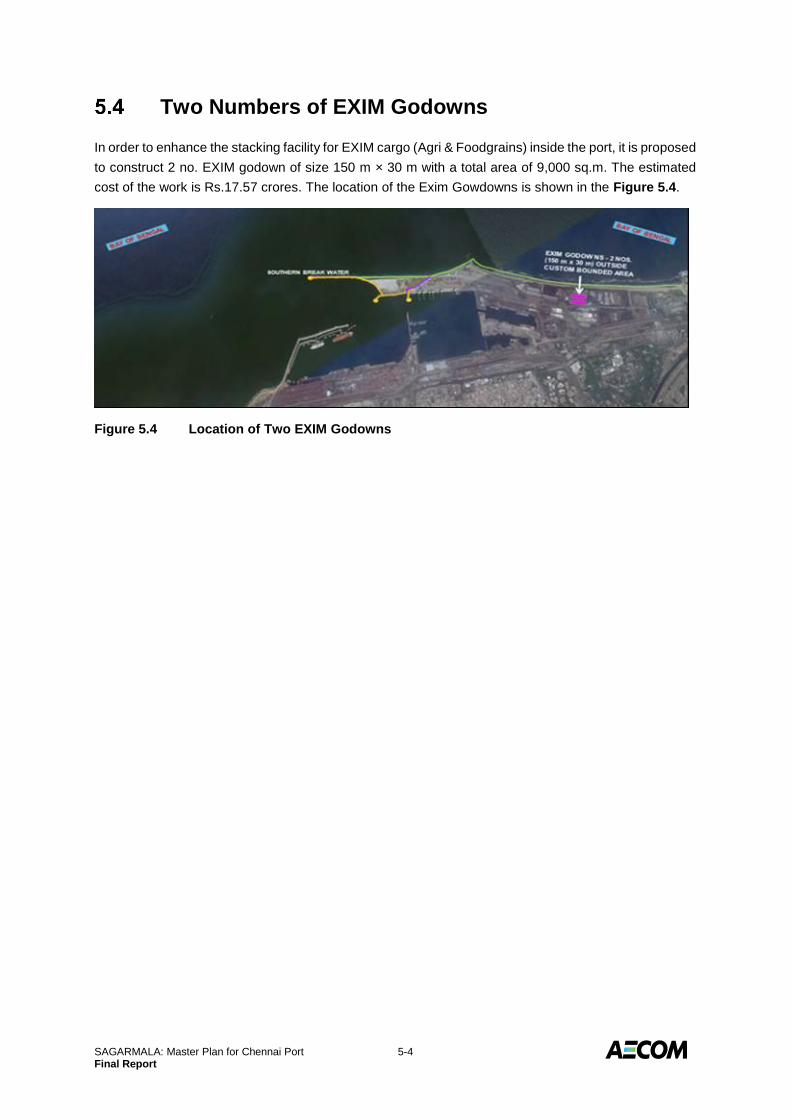
SAGARMALA: Master Plan for Chennai Port 5-4 Final Report
Two Numbers of EXIM Godowns
In order to enhance the stacking facility for EXIM cargo (Agri & Foodgrains) inside the port, it is proposed
to construct 2 no. EXIM godown of size 150 m × 30 m with a total area of 9,000 sq.m. The estimated
cost of the work is Rs.17.57 crores. The location of the Exim Gowdowns is shown in the Figure 5.4.
Figure 5.4 Location of Two EXIM Godowns

SAGARMALA: Master Plan for Chennai Port 6-1 Final Report
6.0 TRAFFIC PROJECTIONS
General
The port of Chennai is one of the largest major ports in the Southern part of the country. It currently
handles more than 50 MTPA of traffic and is situated strategically and well connected both by rail and
road to serve the hinterlands of Tamil Nadu, Southern Andhra Pradesh and Southern Karnataka.
The port is also one of the major container ports in the country handling more than 1.5 MTEUs across
the two terminals. Along with containers the port also handles large volumes of POL, Limestone, Steel
and dolomite.
The origin-destination of key cargo (accounting for greater than 85% of the total traffic) for all Indian
ports and development of traffic scenarios for a period of next 20 years has been carried out by
McKinsey & Co. as mandated for this project. Accordingly, based on a macro-level analysis the future
traffic for Chennai up to 2035 has be derived as presented in this section.
Major Commodities and their Projections
6.2.1 Containers
The port handles roughly 1.55 MTEUs with an export import balanced slightly tilted towards import
(~55%). The key hinterlands that the port serves for containers are Chennai and close by SEZs,
Bangalore, Southern AP and parts of Southern Tamil Nadu. Large portion of the traffic (~50-60%) is
transhipped from the port to other ports in South East Asia like Colombo and Singapore.
Going into the future, with the growth of new ports in the vicinity of Chennai like Krishnapatnam, Katupalli
as well as the development of container terminal at Ennore, we expect significant share of volumes to
be taken away from Chennai. The port is expected to cater to traffic of roughly 0.9 MTEUs by 2020, 1.2-
1.4 MTEUs by 2025 and 2.0-2.4 MTEUs by 2035.
In the case of a new transhipment hub coming up on the Southern tip of the country the potential traffic
is expected to further decline owing the fact that most of the South Tamil Nadu containers will go directly
to the transhipment hub.
The Figure 6.1 below show the split of the container traffic from the different hinterlands as well as the
projected growth.

SAGARMALA: Master Plan for Chennai Port 6-2 Final Report
Figure 6.1 Hinterland of Chennai Port
Figure 6.2 EXIM Container Generating Hinterland
Tamil Nadu is the primary hinterland of Chennai port with small
traffic from Bangalore and Hyderabad
0
15
0
95
0
43
75
0
94
43
0
0
North East
Chhatisgarh
Orissa
Uttaranchal
Bihar/Jharkhand
Madhya Pradesh
Andhra Pradesh
Kerala
Karnataka
Rajasthan
West Bengal
Uttar Pradesh 228
Gujarat 552
Tamil Nadu
Maharashtra 2,121
NCR+Punjab 936
0
18
0
0
0
70
0
0
0
0
0
54
448
274
262
1,264
0
0
0
0
0
0
65
0
0
0
0
0
0
0
163
1,240
0
14
0
0
0
14
0
0
0
60
0
0
0
107
169
329
0
0
0
0
0
0
0
0
66
0
0
0
0
0
0
484
7
0
12
0
85
0
0
0
0
0
0
0
0
0
0
458
0
0
0
0
0
0
0
0
0
0
0
0
0
0
0
351
0
15
69
0
8
29
0
0
0
0
0
0
0
0
0
110
0
0
0
0
0
0
0
0
50
0
0
0
0
0
0
0
SOURCE: APMT; Expert interviews
JNPT Mundra Chennai Pipavav Tuticorin Haldia Cochin
Visakha-
patnam Mangalore
EXIM container
volumes, ‘000
TEUs, FY14
Port total
Primary hinterland
of port
CONTAINERCOMMODITY TRAFFIC
4,202 2,390 1,468 693 551 562 351 263 50
Million TEUs,
FY14
SOURCE: APMT; IPA statistics; Stakeholder interviews
25-50 80-200
≤25 50-80 >200
EXIM container volumes,
‘000 TEUs, FY14
xx Volume handled, in MTEUs
EXIM container generating hinterlands for Chennai port
Chennai currently handles ~15% of total
EXIM container traffic
~50-60% of Chennai traffic gets transshipped
CONTAINERCOMMODITY TRAFFIC
Chennai
Mumbai
Delhi
Other Tamil Nadu
Tuticorin
Pune
Bangalore
Ludhiana
Ahmedabad
Kolkata
VapiNasik
South
Maharashtra
Gurgaon
Kochi
Noida
Greater Noida
Ghaziabad
Faridabad
Other UP
Aurangabad
Vadodara Nagpur
Surat
Hyderabad
Panipat
Other Haryana Moradabad
Rajkot
Kanpur/
Varanasi
Indore
Coimbatore
Jaipur
Other WB
Other Uttranchal
Durgapur
Ajmer
Haldia
Allepey
Agra
Meerut/Muzafarnagar
Other Kerala
Jodhpur
Kollam
Visakhapatnam
Kota
Kutch
Bhubaneswar
Jamshedpur
Bikaner
Tonk-Sawai Madhavpur
Other Bihar/
Jharkhand
Other Rajasthan
Other Punjab
South
AP
Other MP
Other
Chhattisgarh
Udaipur
Jalandhar
RaipurJharsuguda
Bhilwara
Guntur
Other Karnataka
Amritsar
Hubli
Salem
Mettur
Other
parts of AP
Bhopal
Mysore
Belgaum
Mangalore
Baddi
Guwahati
Other
Orissa
Namakkal/
Karur
1.5
Chennai
Other Tamil
Nadu
Tuticorin
Bangalore
Kochi
Hyderabad
Coimbatore
Allepey
Other Kerala
Kollam
South
AP
Guntur
Other Karnataka
Hubli
Salem
Mettur
Other
parts of AP
Mysore
Belgaum
Mangalore
Namakkal/
Karur
1.5
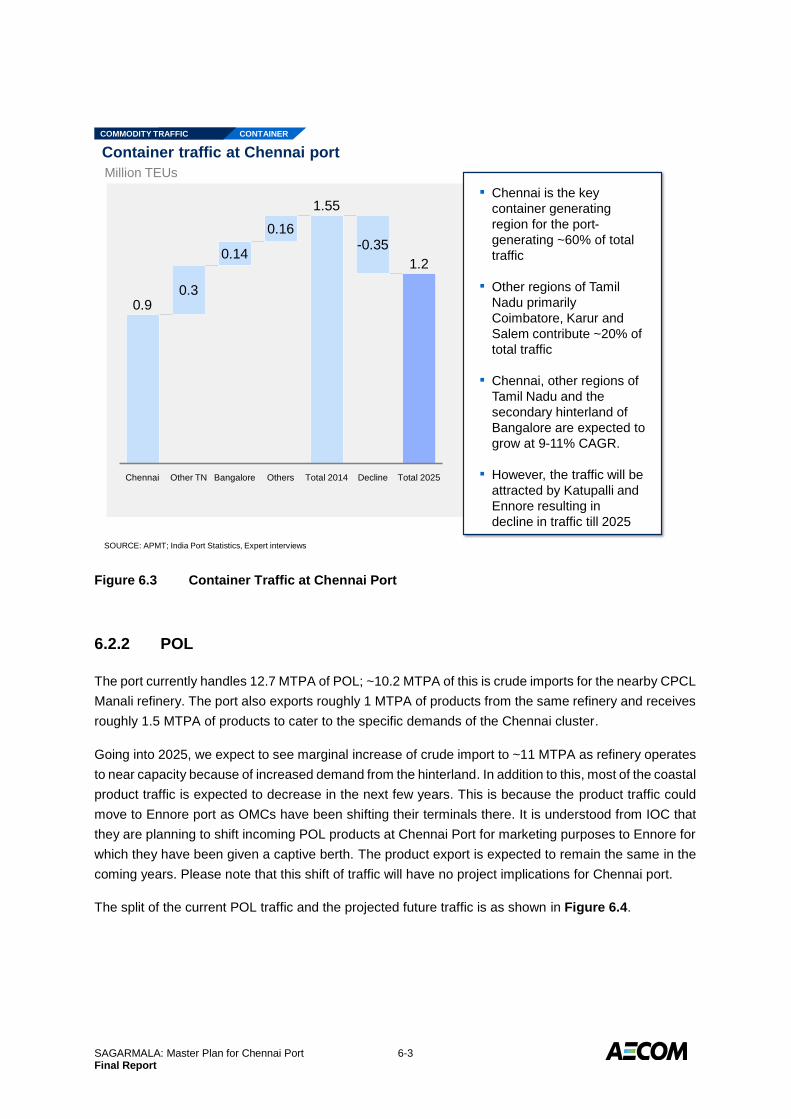
SAGARMALA: Master Plan for Chennai Port 6-3 Final Report
Figure 6.3 Container Traffic at Chennai Port
6.2.2 POL
The port currently handles 12.7 MTPA of POL; ~10.2 MTPA of this is crude imports for the nearby CPCL
Manali refinery. The port also exports roughly 1 MTPA of products from the same refinery and receives
roughly 1.5 MTPA of products to cater to the specific demands of the Chennai cluster.
Going into 2025, we expect to see marginal increase of crude import to ~11 MTPA as refinery operates
to near capacity because of increased demand from the hinterland. In addition to this, most of the coastal
product traffic is expected to decrease in the next few years. This is because the product traffic could
move to Ennore port as OMCs have been shifting their terminals there. It is understood from IOC that
they are planning to shift incoming POL products at Chennai Port for marketing purposes to Ennore for
which they have been given a captive berth. The product export is expected to remain the same in the
coming years. Please note that this shift of traffic will have no project implications for Chennai port.
The split of the current POL traffic and the projected future traffic is as shown in Figure 6.4.
Container traffic at Chennai port
SOURCE: APMT; India Port Statistics, Expert interviews
Million TEUs
BangaloreOther TN
0.9
0.16
Others
0.14
0.3
1.55
Chennai
1.2
Total 2025Decline
-0.35
Total 2014
CONTAINERCOMMODITY TRAFFIC
▪ Chennai is the key
container generating
region for the port-
generating ~60% of total
traffic
▪ Other regions of Tamil
Nadu primarily
Coimbatore, Karur and
Salem contribute ~20% of
total traffic
▪ Chennai, other regions of
Tamil Nadu and the
secondary hinterland of
Bangalore are expected to
grow at 9-11% CAGR.
▪ However, the traffic will be
attracted by Katupalli and
Ennore resulting in
decline in traffic till 2025

SAGARMALA: Master Plan for Chennai Port 6-4 Final Report
Figure 6.4 POL Traffic at Chennai Port
6.2.3 Steel
The port current handles ~1.4 MTPA of steel roughly divided 50-50 in terms export and imports. The
imports cater to vibrant auto industry in the vicinity of the port.
The overall volume of steel handled at the port is expected to grow to ~2 MTPA by 2020, ~2-3 MTPA
by 2025 and ~3-5 MTPA by 2035.
6.2.4 Limestone
The port also imports large amounts of limestone to cater to the cement industry in the Chennai area.
The current volume of limestone handled by the port is roughly 2.6 MTPA. However, the volume has
declined to 2.25 MT during 2015-16 and it is learnt from JSW sources (Major importers of Limestone /
Dolomite) that they are contemplating on alternate indigenous resources to replace Limestone /
Dolomite. The projected traffic at the port is hence expected to decline in the future.
The overall commodity wise projections for the port are as shown in Table 6.1.
1.51.2
10.2
0.7
1.4
11.0
POL traffic at Chennai port
SOURCE: Indian Petroleum and Natural Gas Statistics 2013-14; Basic Port Statistics of India 2013-14
Crude POL product
EXIM
POL product
coastal
2013-14 traffic Estimated traffic in 2025
(Base case)

SAGARMALA: Master Plan for Chennai Port 6-5 Final Report
Table 6.1 Traffic Projection
Coastal Shipping Potential
Chennai is strategically positioned to serve the large demand hinterland of Chennai and the adjoining
areas through coastal shipping. Steel and cement can be major commodities to Chennai in case coastal
shipping revolution takes place in the country. In case a central AP port comes up in the near future
roughly 5 MTPA can be imported in the area to support constructions in view of the diminishing reserves
of limestone in the state.
Steel: ~1 MTPA of steel can be coastally shipped to Chennai port by 2025 to cater to the
demand of the immediate hinterland of Chennai and southern Andhra Pradesh. Odisha will
be the key source state for this movement.
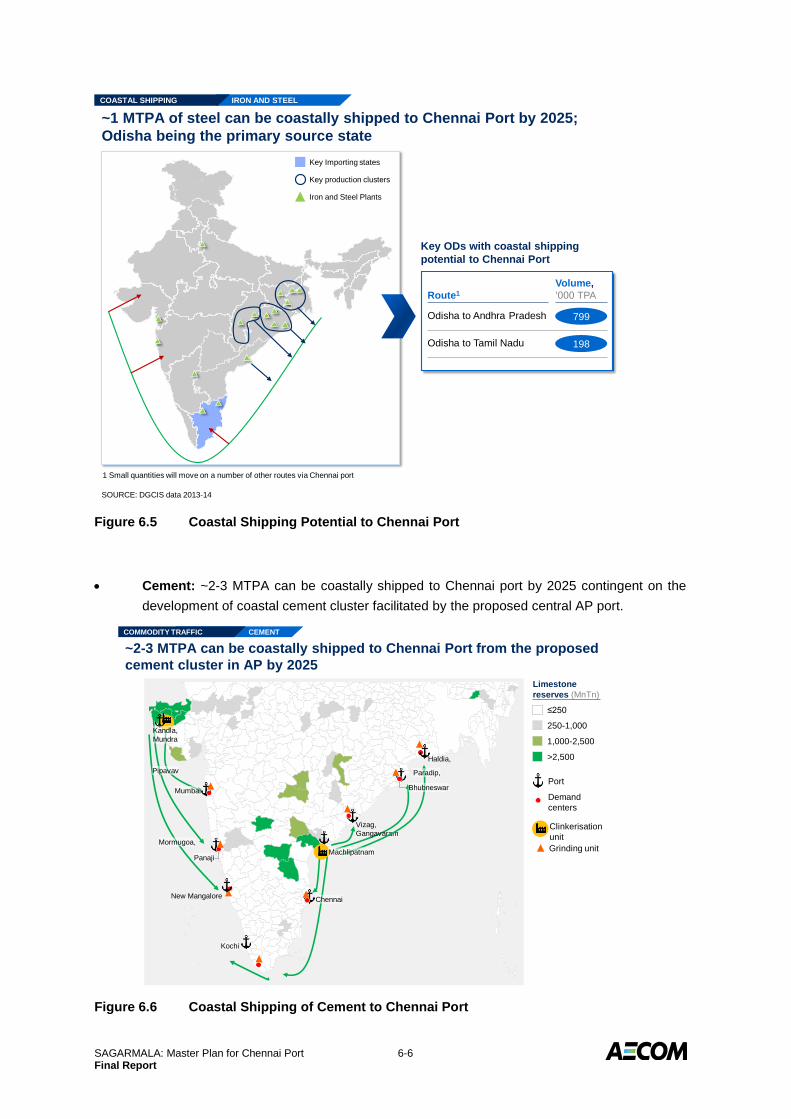
SAGARMALA: Master Plan for Chennai Port 6-6 Final Report
Figure 6.5 Coastal Shipping Potential to Chennai Port
Cement: ~2-3 MTPA can be coastally shipped to Chennai port by 2025 contingent on the
development of coastal cement cluster facilitated by the proposed central AP port.
Figure 6.6 Coastal Shipping of Cement to Chennai Port
~1 MTPA of steel can be coastally shipped to Chennai Port by 2025;
Odisha being the primary source state
IRON AND STEELCOASTAL SHIPPING
SOURCE: DGCIS data 2013-14
Iron and Steel Plants
Key Importing states
Key production clusters
Route1
Volume,
‘000 TPA
Odisha to Andhra Pradesh 799
Odisha to Tamil Nadu 198
Key ODs with coastal shipping
potential to Chennai Port
1 Small quantities will move on a number of other routes via Chennai port
~2-3 MTPA can be coastally shipped to Chennai Port from the proposed
cement cluster in AP by 2025
Port
Demand
centers
Limestone
reserves (MnTn)
Clinkerisation
unit
Grinding unit
≤250
250-1,000
1,000-2,500
>2,500Haldia,
Vizag,
Gangavaram
New Mangalore
Pipavav
Mumbai
Mormugoa,
Kochi
Chennai
Machlipatnam
Paradip,
Panaji
Bhubneswar
Kandla,
Mundra
CEMENTCOMMODITY TRAFFIC
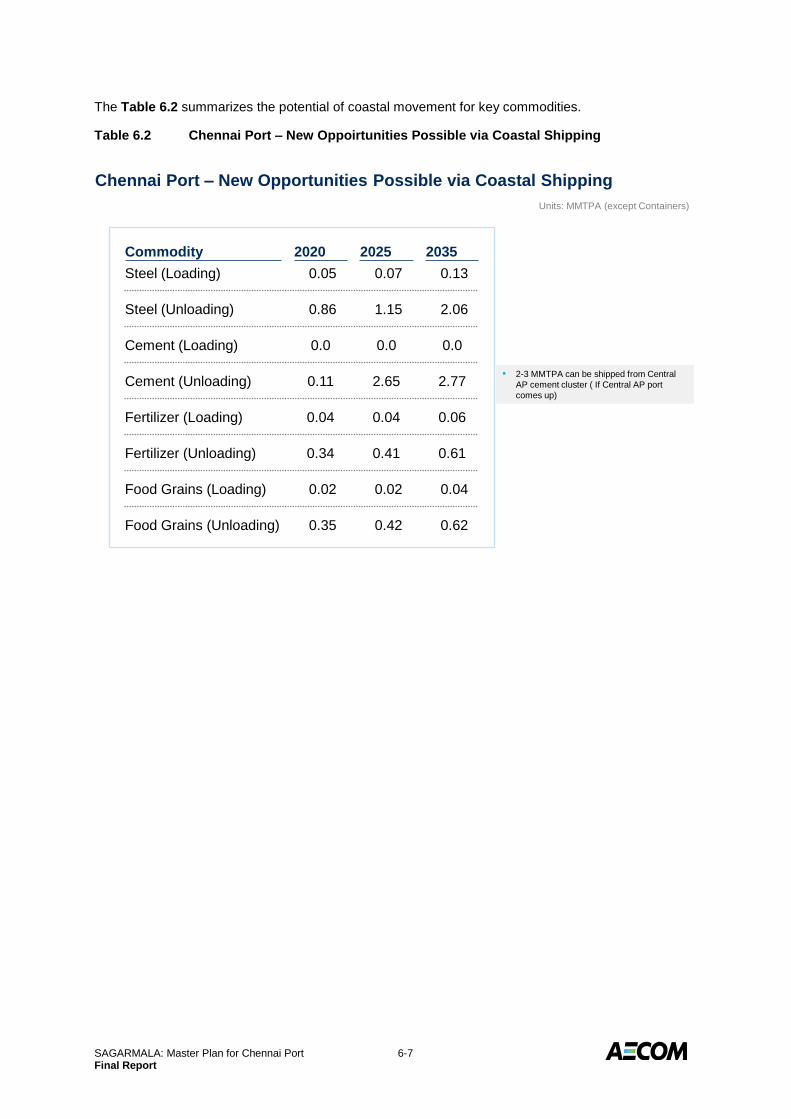
SAGARMALA: Master Plan for Chennai Port 6-7 Final Report
The Table 6.2 summarizes the potential of coastal movement for key commodities.
Table 6.2 Chennai Port – New Oppoirtunities Possible via Coastal Shipping
Steel (Loading)
Steel (Unloading)
Cement (Loading)
Cement (Unloading)
Fertilizer (Loading)
Fertilizer (Unloading)
Food Grains (Loading)
Food Grains (Unloading)
0.05
0.86
0.0
0.11
0.04
0.34
0.02
0.35
0.07
1.15
0.0
2.65
0.04
0.41
0.02
0.42
Commodity 2020 2025 2035
0.13
2.06
0.0
2.77
0.06
0.61
0.04
0.62
Units: MMTPA (except Containers)
Chennai Port – New Opportunities Possible via Coastal Shipping
▪ 2-3 MMTPA can be shipped from Central
AP cement cluster ( If Central AP port
comes up)
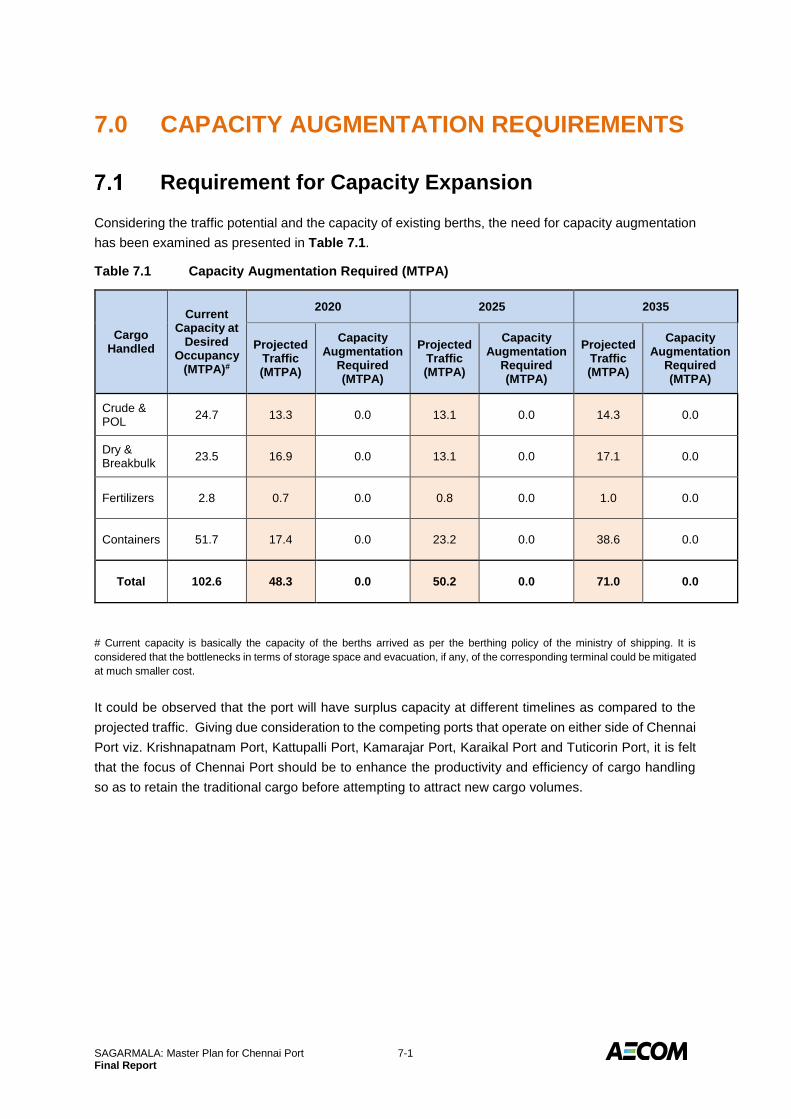
SAGARMALA: Master Plan for Chennai Port 7-1 Final Report
7.0 CAPACITY AUGMENTATION REQUIREMENTS
Requirement for Capacity Expansion
Considering the traffic potential and the capacity of existing berths, the need for capacity augmentation
has been examined as presented in Table 7.1.
Table 7.1 Capacity Augmentation Required (MTPA)
Cargo Handled
Current Capacity at
Desired Occupancy
(MTPA)#
2020 2025 2035
Projected Traffic (MTPA)
Capacity Augmentation
Required (MTPA)
Projected Traffic (MTPA)
Capacity Augmentation
Required (MTPA)
Projected Traffic (MTPA)
Capacity Augmentation
Required (MTPA)
Crude & POL
24.7 13.3 0.0 13.1 0.0 14.3 0.0
Dry & Breakbulk
23.5 16.9 0.0 13.1 0.0 17.1 0.0
Fertilizers 2.8 0.7 0.0 0.8 0.0 1.0 0.0
Containers 51.7 17.4 0.0 23.2 0.0 38.6 0.0
Total 102.6 48.3 0.0 50.2 0.0 71.0 0.0
# Current capacity is basically the capacity of the berths arrived as per the berthing policy of the ministry of shipping. It is
considered that the bottlenecks in terms of storage space and evacuation, if any, of the corresponding terminal could be mitigated
at much smaller cost.
It could be observed that the port will have surplus capacity at different timelines as compared to the
projected traffic. Giving due consideration to the competing ports that operate on either side of Chennai
Port viz. Krishnapatnam Port, Kattupalli Port, Kamarajar Port, Karaikal Port and Tuticorin Port, it is felt
that the focus of Chennai Port should be to enhance the productivity and efficiency of cargo handling
so as to retain the traditional cargo before attempting to attract new cargo volumes.

SAGARMALA: Master Plan for Chennai Port 8-1 Final Report
8.0 ROAD AND RAIL - INTERNAL NETWORK AND EXTERNAL CONNECTIVITY
General
For the efficient performance of a port, the effective internal network of road and rail as well as external
connectivity to the national highway and trunk railway routes are essential to ensure faster receipt and
evacuation of cargo. Accordingly, the existing situation at Chennai Port and their proposals are
described in the following sub sections. The rails and roads are been connected to Chennai Port to its
hinderlands as shown in Figure 8.1.
Figure 8.1 Rail and Road Connectivity
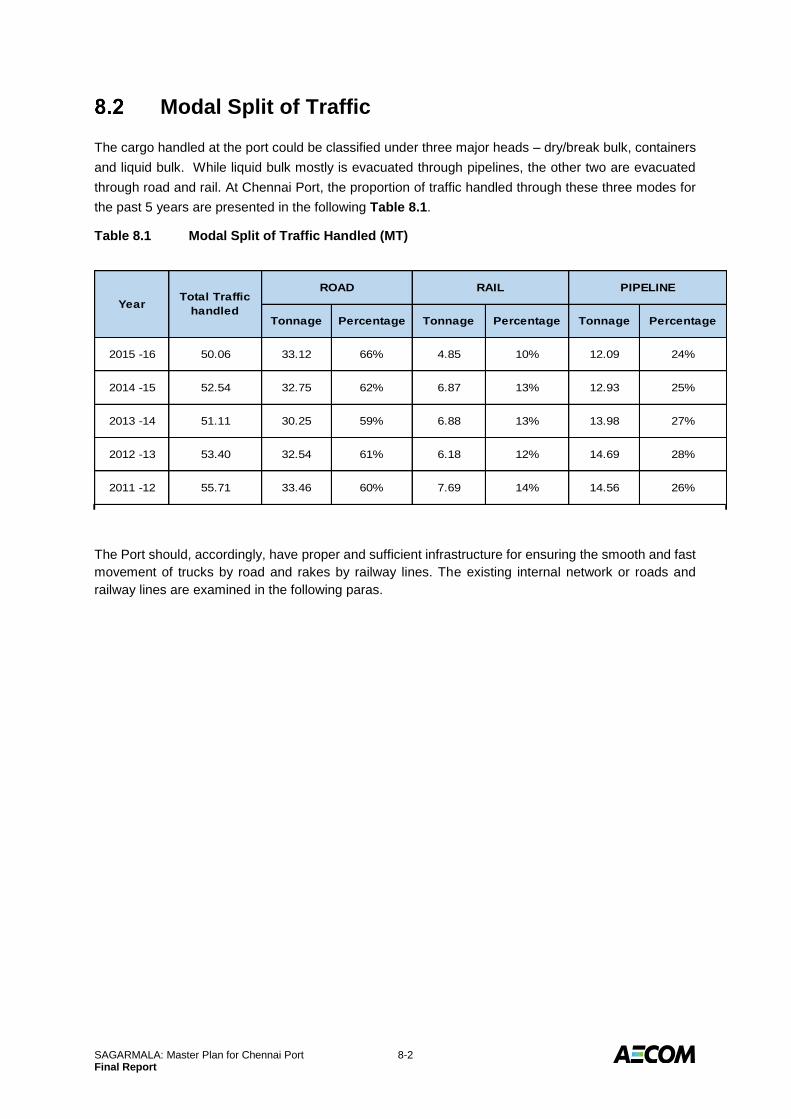
SAGARMALA: Master Plan for Chennai Port 8-2 Final Report
Modal Split of Traffic
The cargo handled at the port could be classified under three major heads – dry/break bulk, containers
and liquid bulk. While liquid bulk mostly is evacuated through pipelines, the other two are evacuated
through road and rail. At Chennai Port, the proportion of traffic handled through these three modes for
the past 5 years are presented in the following Table 8.1.
Table 8.1 Modal Split of Traffic Handled (MT)
Tonnage Percentage Tonnage Percentage Tonnage Percentage
2015 -16 50.06 33.12 66% 4.85 10% 12.09 24%
2014 -15 52.54 32.75 62% 6.87 13% 12.93 25%
2013 -14 51.11 30.25 59% 6.88 13% 13.98 27%
2012 -13 53.40 32.54 61% 6.18 12% 14.69 28%
2011 -12 55.71 33.46 60% 7.69 14% 14.56 26%
RAIL
YearTotal Traffic
handled
ROAD PIPELINE
The Port should, accordingly, have proper and sufficient infrastructure for ensuring the smooth and fast
movement of trucks by road and rakes by railway lines. The existing internal network or roads and
railway lines are examined in the following paras.

SAGARMALA: Master Plan for Chennai Port 8-3 Final Report
Internal Road Network
8.3.1 Overview
The Port has in all 10 Gates for entry and exit. Gate no. 1 & 10 are well connected. Gate no. 2, 3, 5 & 7
opens into small arterial roads, while Gate no. 8 is non-functional. Gate No. 4, 6 & 9 are railway gates
which connect to the Southern Railway lines.
The location of the Gates and their connectivity is shown in the following Figure 8.2.
Figure 8.2 Internal Road Connectivity – All Gates and their Connectivity
The detailed internal road network linking the various gates and the docks inside the port are shown in
the Figure 8.3, Figure 8.4 and Figure 8.5.
Figure 8.3 Internal Road Connectivity – from Gate no. 1 to Bharathi Dock
Bharathi Dock

SAGARMALA: Master Plan for Chennai Port 8-4 Final Report
Figure 8.4 Internal Road Connectivity – Dr. Ambedkar Dock and Jawahar Dock
Figure 8.5 Internal Road Connectivity – Marshalling Yard to Gate no. 10
Dr. Ambedkar Dock
Marshalling Yard
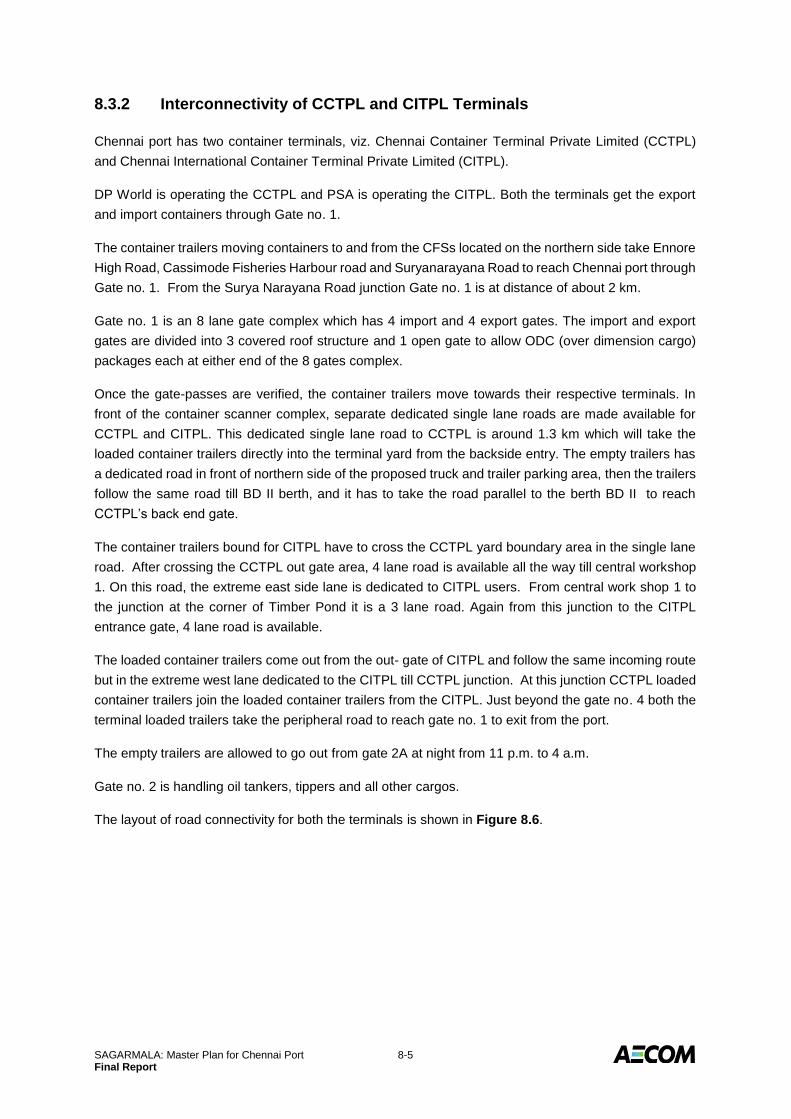
SAGARMALA: Master Plan for Chennai Port 8-5 Final Report
8.3.2 Interconnectivity of CCTPL and CITPL Terminals
Chennai port has two container terminals, viz. Chennai Container Terminal Private Limited (CCTPL)
and Chennai International Container Terminal Private Limited (CITPL).
DP World is operating the CCTPL and PSA is operating the CITPL. Both the terminals get the export
and import containers through Gate no. 1.
The container trailers moving containers to and from the CFSs located on the northern side take Ennore
High Road, Cassimode Fisheries Harbour road and Suryanarayana Road to reach Chennai port through
Gate no. 1. From the Surya Narayana Road junction Gate no. 1 is at distance of about 2 km.
Gate no. 1 is an 8 lane gate complex which has 4 import and 4 export gates. The import and export
gates are divided into 3 covered roof structure and 1 open gate to allow ODC (over dimension cargo)
packages each at either end of the 8 gates complex.
Once the gate-passes are verified, the container trailers move towards their respective terminals. In
front of the container scanner complex, separate dedicated single lane roads are made available for
CCTPL and CITPL. This dedicated single lane road to CCTPL is around 1.3 km which will take the
loaded container trailers directly into the terminal yard from the backside entry. The empty trailers has
a dedicated road in front of northern side of the proposed truck and trailer parking area, then the trailers
follow the same road till BD II berth, and it has to take the road parallel to the berth BD II to reach
CCTPL’s back end gate.
The container trailers bound for CITPL have to cross the CCTPL yard boundary area in the single lane
road. After crossing the CCTPL out gate area, 4 lane road is available all the way till central workshop
1. On this road, the extreme east side lane is dedicated to CITPL users. From central work shop 1 to
the junction at the corner of Timber Pond it is a 3 lane road. Again from this junction to the CITPL
entrance gate, 4 lane road is available.
The loaded container trailers come out from the out- gate of CITPL and follow the same incoming route
but in the extreme west lane dedicated to the CITPL till CCTPL junction. At this junction CCTPL loaded
container trailers join the loaded container trailers from the CITPL. Just beyond the gate no. 4 both the
terminal loaded trailers take the peripheral road to reach gate no. 1 to exit from the port.
The empty trailers are allowed to go out from gate 2A at night from 11 p.m. to 4 a.m.
Gate no. 2 is handling oil tankers, tippers and all other cargos.
The layout of road connectivity for both the terminals is shown in Figure 8.6.
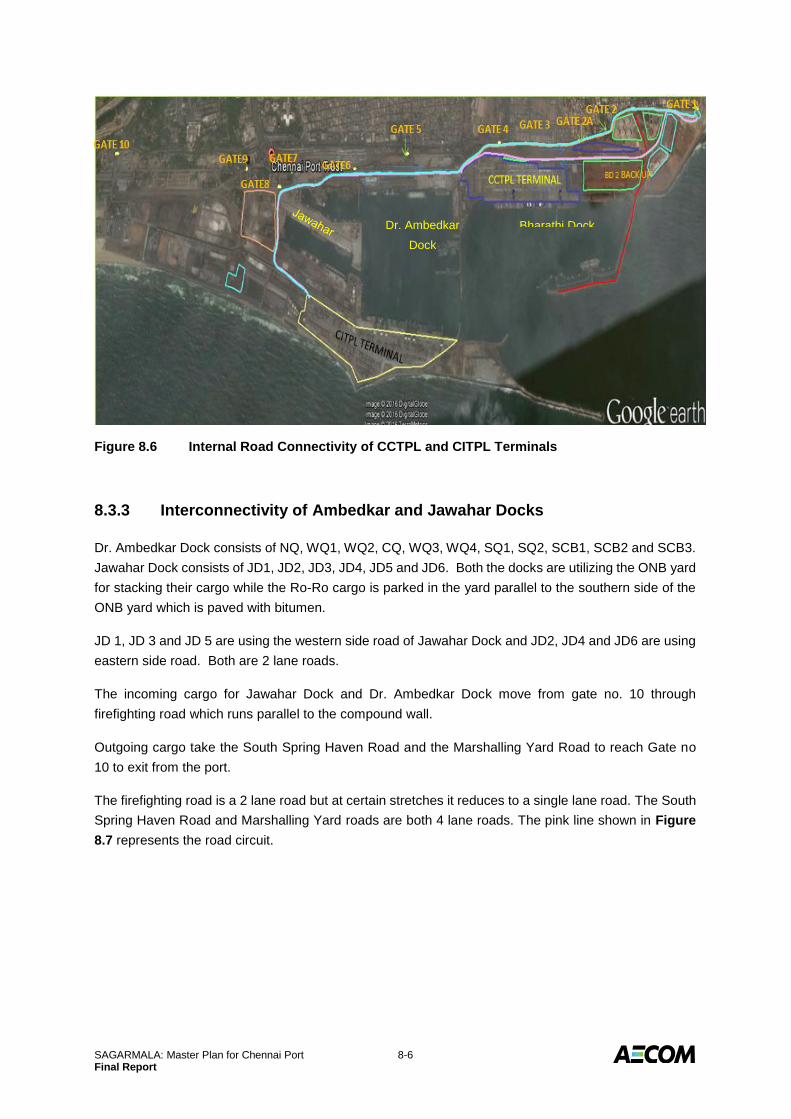
SAGARMALA: Master Plan for Chennai Port 8-6 Final Report
Figure 8.6 Internal Road Connectivity of CCTPL and CITPL Terminals
8.3.3 Interconnectivity of Ambedkar and Jawahar Docks
Dr. Ambedkar Dock consists of NQ, WQ1, WQ2, CQ, WQ3, WQ4, SQ1, SQ2, SCB1, SCB2 and SCB3.
Jawahar Dock consists of JD1, JD2, JD3, JD4, JD5 and JD6. Both the docks are utilizing the ONB yard
for stacking their cargo while the Ro-Ro cargo is parked in the yard parallel to the southern side of the
ONB yard which is paved with bitumen.
JD 1, JD 3 and JD 5 are using the western side road of Jawahar Dock and JD2, JD4 and JD6 are using
eastern side road. Both are 2 lane roads.
The incoming cargo for Jawahar Dock and Dr. Ambedkar Dock move from gate no. 10 through
firefighting road which runs parallel to the compound wall.
Outgoing cargo take the South Spring Haven Road and the Marshalling Yard Road to reach Gate no
10 to exit from the port.
The firefighting road is a 2 lane road but at certain stretches it reduces to a single lane road. The South
Spring Haven Road and Marshalling Yard roads are both 4 lane roads. The pink line shown in Figure
8.7 represents the road circuit.
Dr. Ambedkar
Dock
Bharathi Dock
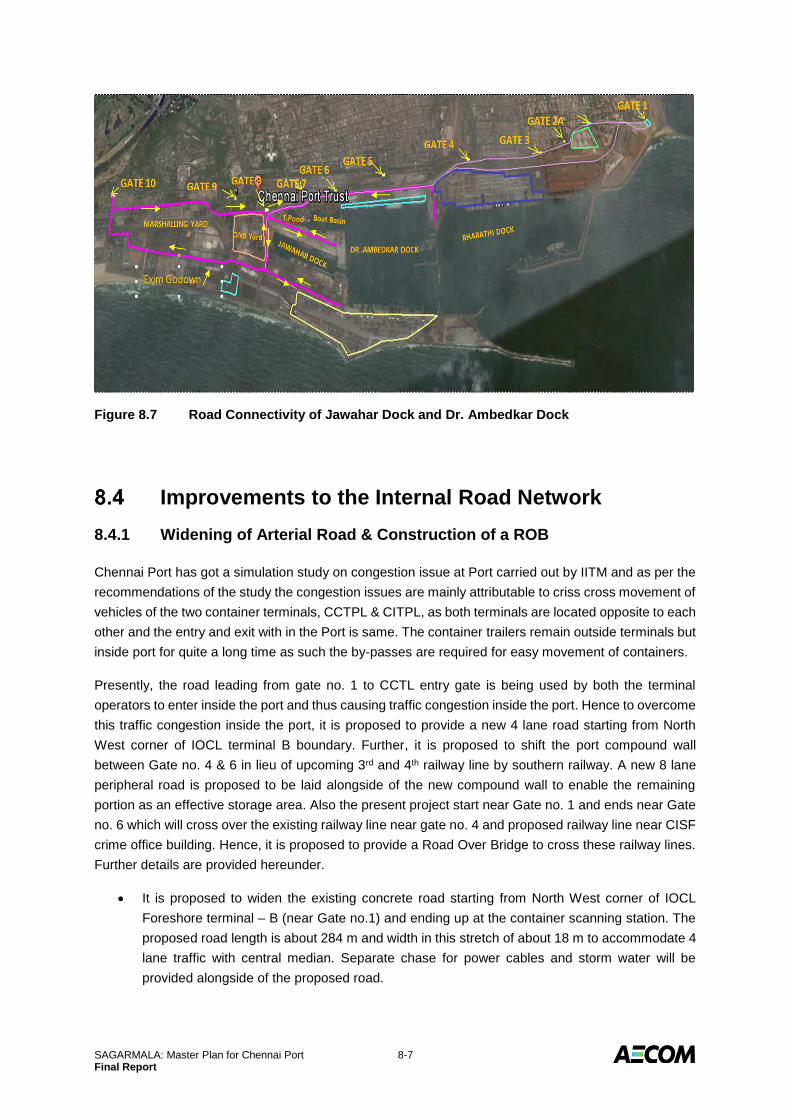
SAGARMALA: Master Plan for Chennai Port 8-7 Final Report
Figure 8.7 Road Connectivity of Jawahar Dock and Dr. Ambedkar Dock
Improvements to the Internal Road Network
8.4.1 Widening of Arterial Road & Construction of a ROB
Chennai Port has got a simulation study on congestion issue at Port carried out by IITM and as per the
recommendations of the study the congestion issues are mainly attributable to criss cross movement of
vehicles of the two container terminals, CCTPL & CITPL, as both terminals are located opposite to each
other and the entry and exit with in the Port is same. The container trailers remain outside terminals but
inside port for quite a long time as such the by-passes are required for easy movement of containers.
Presently, the road leading from gate no. 1 to CCTL entry gate is being used by both the terminal
operators to enter inside the port and thus causing traffic congestion inside the port. Hence to overcome
this traffic congestion inside the port, it is proposed to provide a new 4 lane road starting from North
West corner of IOCL terminal B boundary. Further, it is proposed to shift the port compound wall
between Gate no. 4 & 6 in lieu of upcoming 3rd and 4th railway line by southern railway. A new 8 lane
peripheral road is proposed to be laid alongside of the new compound wall to enable the remaining
portion as an effective storage area. Also the present project start near Gate no. 1 and ends near Gate
no. 6 which will cross over the existing railway line near gate no. 4 and proposed railway line near CISF
crime office building. Hence, it is proposed to provide a Road Over Bridge to cross these railway lines.
Further details are provided hereunder.
It is proposed to widen the existing concrete road starting from North West corner of IOCL
Foreshore terminal – B (near Gate no.1) and ending up at the container scanning station. The
proposed road length is about 284 m and width in this stretch of about 18 m to accommodate 4
lane traffic with central median. Separate chase for power cables and storm water will be
provided alongside of the proposed road.
SAGARMALA: Master Plan for Chennai Port 8-8 Final Report
From container scanning station, it is proposed to provide new four lane road for 1,542 m length
and 18 m width alongside of the new eastern side boundary of IOCL Foreshore terminal A’ upto
the existing loco shed.
From existing loco shed to CISF crime office building, it is proposed to provide a new 4 lane
concrete road of 18 m width in eastern side of the existing peripheral road leaving a gap of 2 m
for proposed oil pipe line of IOCL. All the above stretches will have cable chase and storm water
drain arrangement.
From E - FLT service station (near CCTL exit gate ) to gate no. 6, it is proposed to provide 36
m wide eight lane road for 1,104 m length with 1.5 m wide foot path on both the sides with storm
water drainage arrangements alongside of the proposed compound wall between E -FLT
service station and gate no. 6. It is proposed to provide 13 m space in width alongside of the
new compound wall between gate no. 4 & 6 left for proposed railway track connecting northern
and southern part of the port. However, as the alignment of the internal railway lines connecting
the port to the 3rd & 4th lines of Southern Railway is yet to be finalised, the adequacy of this 13
m wide corridor cannot be confirmed at this stage.
It is also proposed, a four lane Road Over Bridge of width 18 m (approx.) for existing railway
crossing at gate no. 4 and proposed railway crossing near CISF crime office building. The 4
lane ROB consist of 500 m length bridge length portion with 200 m length ramp portion on both
ends of Bridge. (Total ROB length is 900 m). Financial Assistance of Rs.100 cr. is expected for
the entire scheme from Government in the form of grant in aid.
8.4.2 Truck Parking Yard for the Two Container Terminals
At present, the overall incoming traffic at Gate no. 1 is moving towards their respective terminals to
unload the loaded containers or to fetch the loaded containers. In this process, the trailers and trucks
without proper pass or paper work also move along with the trailers and trucks having proper pass and
paper work which leads to the confusion and congestion in the roads leading to the terminals. Moreover,
trucks and trailers are parked randomly on the side of busy roads and on open lands which obstructs
the moving traffic.
The trailers should be discouraged from parking inside the Port area as it leads to idling trailers being
parked within the port. With the introduction of RFID, only those vehicles with work proof shall be
permitted inside the port. It is suggested to provide parking areas for each terminal separately.
Suggested Parking Yard for CCTPL Trailers
The proposed location is situated near gate no 1 and adjacent to the compound wall of CFS
and container scanner complex. Out of the total 5.8 ha area available in this location, 2 ha has
been suggested for locating tank farms for bunkering. In the balance 3.8 ha area, it is possible
to park about 750 trailers.
Suggested Parking Yard for CITPL Trailers
There is not adequate space within custom bound area. However, a small buffer area for 50 –
60 trailers may be created as a common user facility for exigencies.

SAGARMALA: Master Plan for Chennai Port 8-9 Final Report
Facilities like canteen, bathrooms, toilets and rest rooms need to be provided at these parking yards.
Check-post shall be established to allow the vehicles out of the proposed parking area only if they
possess the complete paper work to fetch or unload the containers from the both the terminals. This,
in-turn, will reduce the queuing and congestion in the roads leading to the terminals.
Figure 8.8 Proposed Truck Parking Area for CCTPL
External Road Connectivity
Popularly known as “Gateway to South India”, Chennai is well connected to other major cities in the
north, west, south and north-east through National Highways. The directly connected Highways are NH
48 (NH 4), NH 16 (NH 5) & NH 132 (NH 45). The road network linking Chennai to some of the major
cities and industrial / cargo generating clusters is shown in Figure 8.9.
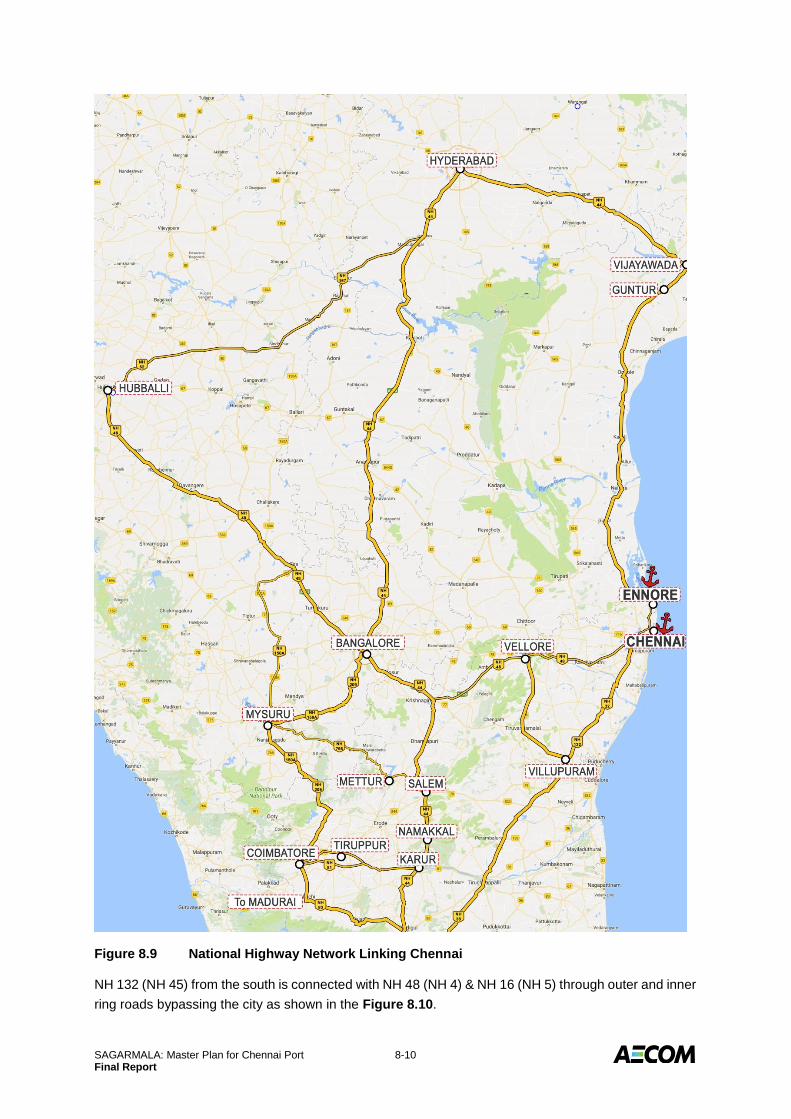
SAGARMALA: Master Plan for Chennai Port 8-10 Final Report
Figure 8.9 National Highway Network Linking Chennai
NH 132 (NH 45) from the south is connected with NH 48 (NH 4) & NH 16 (NH 5) through outer and inner
ring roads bypassing the city as shown in the Figure 8.10.

SAGARMALA: Master Plan for Chennai Port 8-11 Final Report
Figure 8.10 Outer & Inner Ring Roads Bypassing Chennai City
The stretch of 15 to 20 km from north, west and south to Chennai port from the National Highways are
clogged and constrained by traffic restrictions. Heavy port traffic is permitted only during nights. The
ring roads circumventing the city have helped but increased the distance and costs against marginal
savings in haulage time. Hence there is a need to upgrade the port linkage to these highways to ease
cargo movement. Accordingly, two schemes were proposed for evacuating cargo from the port through
the north as well as from the south. They are: Chennai Ennore Road Connectivity Project on the northern
side and Maduravoyal elevated corridor on the south. These are detailed hereunder.
8.5.1 Chennai Ennore Port Road Connectivity Project (formerly EMRIP)
The Chennai Port Road Connectivity Project (formerly EMRIP) was planned to improve the northern
connectivity of the Port to the National Highway network by strengthening the connecting roads from
the Port. This project is expected by a Special Purpose Vehicle comprising NHAI, ChPT, KPL and GoTN
at the current estimated cost of Rs. 600 crores. The project network covers 30.1 km with 6.0 km of
Ennore Expressway, 1.6 km of Ennore Expressway (inside Fishing Harbour), 9 km of Thirvottiyur –
Ponneri - Panchetty road (TPP) and 5.4 km of Manali Oil Refinery Road (MORR). The project also
involved construction of groynes along the seashore for coastal protection. The Equity contribution of
ChPT is Rs. 139.80 crores. and debt contribution is Rs.110.68 crores. ChPT has already paid its entire
equity amount.
The contract for executing this work was awarded to a joint venture of M/s Coastal and SPL during June
2011, at a contract value of Rs. 253.47 crores. As of date about 90% of the work has been completed
and the balance is pending due to non-shifting of Project Affected Families (PAF’s) from the alignment
of road in two small stretches by GoTN. Both NHAI and ChPT are pursuing with the state government
for speedy action in this regard.

SAGARMALA: Master Plan for Chennai Port 8-12 Final Report
8.5.2 Maduravoyal Elevated Corridor
This road is envisaged for the smooth movement of the commercial traffic to and from Chennai Port on
the southern side. All the traffic will get distributed to the three national highways NH 132 (NH45), NH
48 (NH4) & NH 16 (NH5) from Maduravoyal. It is proposed that this elevated road will follow the banks
of river Cooum for the entire length. The project corridor commences at Chennai port (Gate 10) near
War Memorial and ends near Maduravoyal Municipal Office, at km 13 at NH48 (NH4). The total length
of this road will be about 17.5 km. The location and alignment of this elevated corridor is shown in
Figure 8.11.
Figure 8.11 Location and Alignment of Maduravoyal Elevated Corridor
The project was included under NHDP VII and is being executed through NHAI. The Project proponents
are NHAI, ChPT and GoTN. The present estimated cost is Rs. 1,815 crores with Rs. 1,345 crores
towards civil works and Rs. 470 crores towards R&R activities. ChPT and GoTN will be sharing the
costs of land acquisition and R&R equally.
Project starts from War Memorial gate of Chennai Port and runs upto Maduravoyal for a length of 19.01
km, which runs along Cooum river bank upto Koyambedu and the balance stretch along NH 4 thereafter.
The BOT tender was awarded to M/s Soma Enterprise Ltd., Hyderabad during January 2009, for a
concession period of 15 years (including 3 year construction period). After progressing for about 15%
the project has landed up in litigation. PWD, GoTN has issued a stoppage notice stating that certain
conditions have been violated. On consequent events, NHAI filed a WP in the High Court of Madras
against the stop notice by GoTN and as a one of the respondents Chennai Port also filed a counter and
additional counter affidavits. After hearing proceedings, the judgment has been delivered by in favour
of Chennai Port and NHAI. However, a SLP has been filed by CE, PWD, GoTN in Hon’ble Supreme
Court against the judgment delivered by the High Court. The case is still pending.

SAGARMALA: Master Plan for Chennai Port 8-13 Final Report
Internal Railway Network
8.6.1 Overview
Chennai Port is served with two rail entry / exit arrangements connecting Indian Railway network - one
connecting Chennai Beach Station to the Port Marshalling yard at the southern end through Gate no.
9; and the other connecting Royapuram Station with Bharathi Dock at the northern end through Gate
no. 4. Bharathi Dock linkage was mainly for handling iron ore at BD II berth. As of date, the iron ore
traffic has been stopped and this Gate no. 4 remains closed. The overall port railway network is shown
in the Figure 8.12.
Figure 8.12 Overall Port Railway Network
8.6.2 Port Marshalling Yard
Port Marshalling yard is at the southern end of the port and is connected to the Southern Railway
network through Chennai Beach station with a single line. This Marshalling yard distributes the railway
traffic to the various docks inside the port. Port Marshalling yard is the feeding yard for the second
Container Terminal, Jawahar Dock and CONCOR yards. In addition, this yard also handles loading /
unloading of Port’s other general cargo handled in Eastern and Western yards. The layout of Port
Marshalling yard is such that entry/ exit to all sidings and Chennai Beach are on the Northern end of
this yard.
Incoming trains with electric locos are received at the eastern end of the yard and the electric engine is
released. Port owned diesel locos shunt the rakes to the various feeder yards like CONCOR yard or
CITPL yard or for handling general cargo for placement. After unloading / loading, the rake is brought
back to the Central yard by the Port’s diesel loco and forms a train. The train is attached with electric
loco and dispatched to Chennai beach station through Gate no. 9.
This marshalling yard consists of 4 lines of Eastern yard, 6 lines of Central Yard and one line of Western
Yard. The railway network at the Marshalling Yard is shown in Figure 8.13.
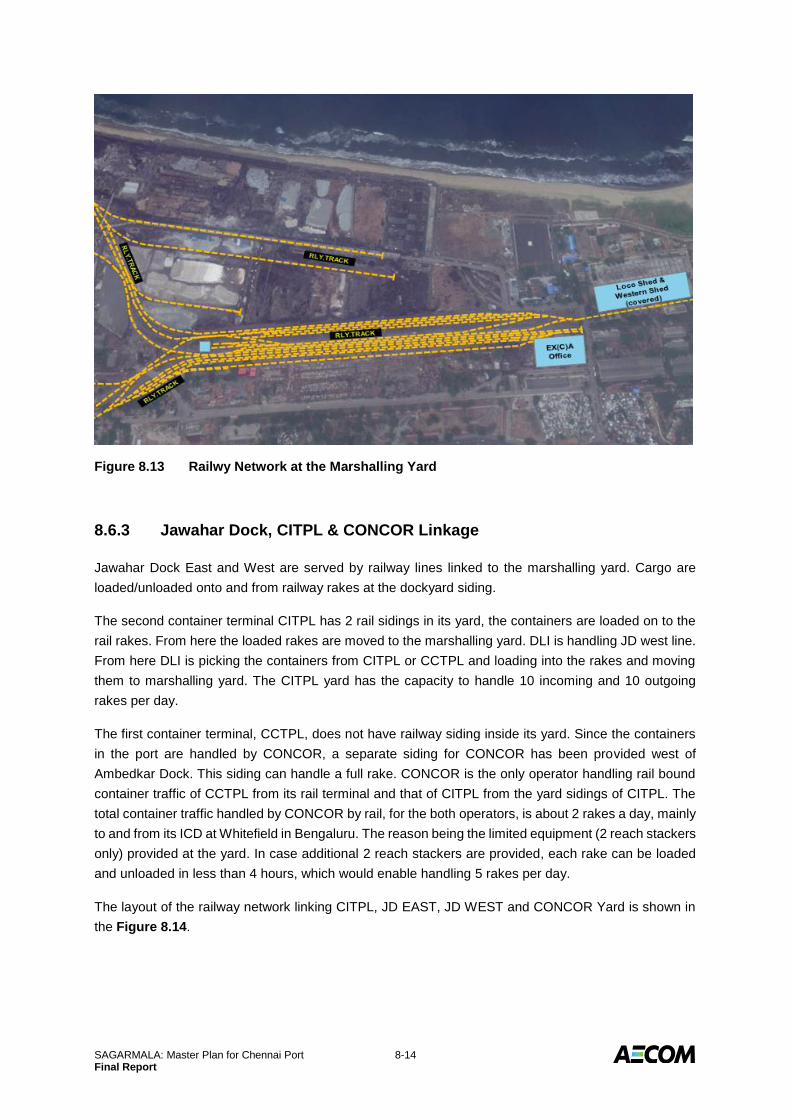
SAGARMALA: Master Plan for Chennai Port 8-14 Final Report
Figure 8.13 Railwy Network at the Marshalling Yard
8.6.3 Jawahar Dock, CITPL & CONCOR Linkage
Jawahar Dock East and West are served by railway lines linked to the marshalling yard. Cargo are
loaded/unloaded onto and from railway rakes at the dockyard siding.
The second container terminal CITPL has 2 rail sidings in its yard, the containers are loaded on to the
rail rakes. From here the loaded rakes are moved to the marshalling yard. DLI is handling JD west line.
From here DLI is picking the containers from CITPL or CCTPL and loading into the rakes and moving
them to marshalling yard. The CITPL yard has the capacity to handle 10 incoming and 10 outgoing
rakes per day.
The first container terminal, CCTPL, does not have railway siding inside its yard. Since the containers
in the port are handled by CONCOR, a separate siding for CONCOR has been provided west of
Ambedkar Dock. This siding can handle a full rake. CONCOR is the only operator handling rail bound
container traffic of CCTPL from its rail terminal and that of CITPL from the yard sidings of CITPL. The
total container traffic handled by CONCOR by rail, for the both operators, is about 2 rakes a day, mainly
to and from its ICD at Whitefield in Bengaluru. The reason being the limited equipment (2 reach stackers
only) provided at the yard. In case additional 2 reach stackers are provided, each rake can be loaded
and unloaded in less than 4 hours, which would enable handling 5 rakes per day.
The layout of the railway network linking CITPL, JD EAST, JD WEST and CONCOR Yard is shown in
the Figure 8.14.

SAGARMALA: Master Plan for Chennai Port 8-15 Final Report
Figure 8.14 Railway Network Linking CITPL, JD EAST, JD WEST and CONCOR Yard
8.6.4 Bharathi Dock – BD II Berth
Bharathi Dock – BD II is served by rail connectivity through Royapuram Railway station. A railway yard
with 5 reception lines, 4 dispatch lines and unloading facilities with tippling arrangements are available,
mainly handling iron ore for exports. Since Chennai port is banned from handling iron ore and coal due
to environmental issues, this railway yard area and railway lines are kept idle and Gate no. 4 exit / entry
lines are non-operational.
The layout of the railway network as existing at BD II yard is shown in the Figure 8.15.

SAGARMALA: Master Plan for Chennai Port 8-16 Final Report
Figure 8.15 Railway Network at BD II Yard at Bharathi Dock
8.6.5 Constraints at the Marshalling Yard
Some of the major constraints in Port Marshalling yard are:
As per present yard design, only Eastern Yard 2, 3, 4 is meant for reception of rakes and they
are fully wired. Each line has a designed length to accommodate only 58 wagons with brake
van and power loco. Eastern Yard 1 siding is used for loading/unloading & Centre Yard 1 line
is utilized for Southern Railway Loco as escape line and also as a crossover for the movements
between Reception and Despatch yard. Centre Yard 2, 3, 4, 5, 6 are despatch lines which are
top wired along with Western Yard 1. Even if the despatch yards are fully wired, sufficient track
length is not available at the southern end, for loco to escape, due to the existing road leading
to Gate No. 10.
All the feeder sidings and Chennai Beach station which is the gate way for rail movement are
on the northern end of the yard with a result, a Z type movement at the Port Marshalling yard is
inevitable
Independent entry and exist arrangements to each of the feeder sidings is not available resulting
in criss-cross movements and avoidable detentions.
Availability of a single line for movement to and from Chennai Beach Railway station which is
the only entry / exit point of Chennai Port at present
It is suggested that all the 11 lines could planned to be wired in a period manner depending upon the
traffic growth.

SAGARMALA: Master Plan for Chennai Port 8-17 Final Report
8.6.6 Laying of 3rd and 4th Line from Royapuram
In order to remove the constraints at the marshalling yard and also to enhance the movement of railway
rakes, Southern Railway have come up with a proposal to introduce 3rd and 4th line from Royapuram
to Madras Beach Station which will be further extended upto the Port Marshalling Yard. For this purpose
they have requested for the release of 1.67 Ha of port land between Royapuram and Madras Beach
Station. In exchange they are prepared to hand over equivalent area to the Port. This proposal has
been approved both by the MoS and the Ministry of Railways.
Southern railway has requested the port to construct the compound wall as a deposit work and also
requested to allow them to carry out the construction of 3rd & 4th tracks. The shifting of existing
boundary wall by about 13 m towards the periphery road is going on and the construction work is under
progress. After the completion of the work, these new lines will ease the railway operations through the
marshalling yard. This proposal is shown in the Figure 8.16.
Figure 8.16 The Proposed 3rd & 4th Line from Royapuram
It is further suggested that Doubling of track be also taken up at Gate no. 9, so that 3rd and 4th line of
southern railway are connected to the ChPT lines for enhanced evacuation of cargo through rail mode.

SAGARMALA: Master Plan for Chennai Port 8-18 Final Report
8.6.7 Common Railway Yard for Containers
The port is presently developing a common rail yard in the area west of marshalling yard. The basic
purpose of this yard is to aggregate the containers from both the terminals at one location to ensure
faster turnaround of rakes. It will also allow handling of DFCC (Dedicated Freight Corridor Corporation)
rakes which will be double the length of the current rakes.
This common railway yard is being executed by IPRCL (Indian Port Rail Corporation Ltd.) a SPV formed
by Major Ports and RVNL. IPRCL have appointed RITES as the PMC for executing this work. The yard
will have two lines on either side of a 700 m × 30 m platform with a main railway line and a reserve line.
The common rail terminal shall have the following components:
Sidings for receipt/dispatch of DFCC rakes.
Roads for movement of ITVs in the yard area and rail yard.
stacking space adjacent to rail yard
RTGs at the Yard area
ITVs, other equipment, utilities.
The proposal envisages a full rake loading and avoid cutting of rakes so that the rakes can be released
immediately. The concept is to have “Engine on load” which will ease operations. ChPT is at present
handling 4 to 7 rakes per day. The proposed common siding is top (partially) wired. Hence, Diesel Loco
has to be provided by Southern Railway for placing full rake as direct placement at the common railway
yard instead of the rake going to Reception Yard (Eastern Yard) and to be placed in multiple shunts or
otherwise the rake has to be pushed from Chennai Beach to Marshalling Yard having Brake Van on the
southern side with Southern Railway to enable loading the wagons directly on reception of the rake.
With the proposed new platform the number of operations will increase and may be able to handle 10 -
15 rakes per day. The yard would have space to handle up to 0.75 MTEU per year and would also have
adequate equipment to maintain high productivity levels. The proposed common yard is as shown in
the Figure 8.17.

SAGARMALA: Master Plan for Chennai Port 8-19 Final Report
Figure 8.17 Proposed Common Rail Yard
The relative locations of the common railway container yard and the two container terminals are shown
in the Figure 8.18.
Figure 8.18 Proposed Common Rail Yard wrt Existing Container Terminals
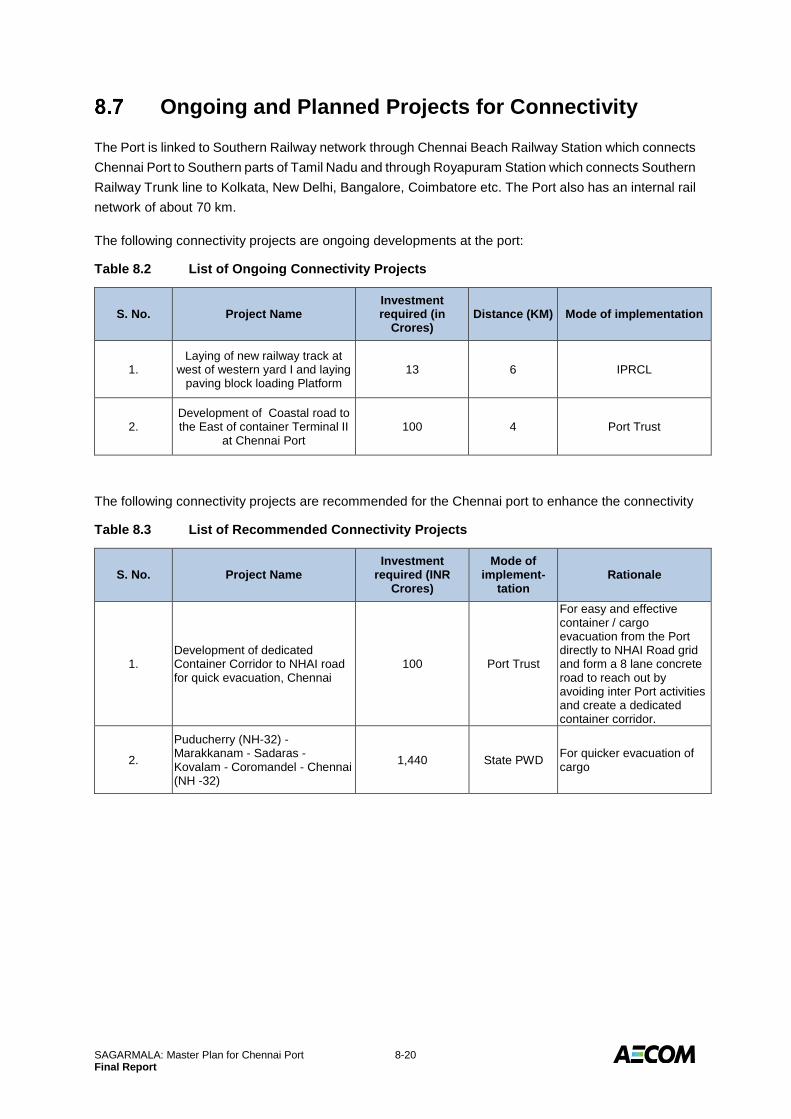
SAGARMALA: Master Plan for Chennai Port 8-20 Final Report
Ongoing and Planned Projects for Connectivity
The Port is linked to Southern Railway network through Chennai Beach Railway Station which connects
Chennai Port to Southern parts of Tamil Nadu and through Royapuram Station which connects Southern
Railway Trunk line to Kolkata, New Delhi, Bangalore, Coimbatore etc. The Port also has an internal rail
network of about 70 km.
The following connectivity projects are ongoing developments at the port:
Table 8.2 List of Ongoing Connectivity Projects
S. No. Project Name Investment required (in
Crores) Distance (KM) Mode of implementation
1. Laying of new railway track at
west of western yard I and laying paving block loading Platform
13 6 IPRCL
2. Development of Coastal road to the East of container Terminal II
at Chennai Port 100 4 Port Trust
The following connectivity projects are recommended for the Chennai port to enhance the connectivity
Table 8.3 List of Recommended Connectivity Projects
S. No. Project Name Investment
required (INR Crores)
Mode of implement-
tation Rationale
1. Development of dedicated Container Corridor to NHAI road for quick evacuation, Chennai
100 Port Trust
For easy and effective container / cargo evacuation from the Port directly to NHAI Road grid and form a 8 lane concrete road to reach out by avoiding inter Port activities and create a dedicated container corridor.
2.
Puducherry (NH-32) - Marakkanam - Sadaras - Kovalam - Coromandel - Chennai (NH -32)
1,440 State PWD For quicker evacuation of cargo

SAGARMALA: Master Plan for Chennai Port 9-1 Final Report
9.0 SCOPE FOR FUTURE CAPACITY EXPANSION
Development of a Bunkering Terminal
9.1.1 Bunkering Industry – An Overview
Fuel utilized by shipping companies for fuelling their marine fleet is commonly referred to as bunker fuel.
In the bunker industry, there are two primary kinds of fuels currently being used; distillate fuel and
residual fuel. Among the two, residual fuel account for around 75% of global bunker consumption. Ships
use heavy fuel oil to power their engines, and lighter fuels such as diesel or gas-oil to power the
generators that run their lights and other electrical utilities.
The marine fuel grades have been broadly segmented into four major categories: IFO 380, IFO 180,
IFO Others, and MDO/MGO. The IFO Others segment includes fuel grades IFO 500, IFO 700, LS 380,
and LS 180. With majority of ship engines capable of combusting IFO 380, it is currently the most
popular in the bunker market and is the most traded marine fuel oil grade globally. It is easily available
at all bunkering destinations in the world, and is more economical when compared to other fuel grades.
The specifications for all types of marine fuel are set out in the International Standard ISO 8217-1996.
It is a commercial standard and is not a mandatory one. Subsequently, it was revised in 2005. The
latest version was released in June, 2010. Most major suppliers in major ports supply fuels conforming
to IS 8217 -2005. If buyer and supplier agree, fuel can be supplied to IS 8217 -2005 or even ISO 8217-
1996. There are only very limited people conforming to 2010 version. These cover IFO 40 cst to IFO
380 cst; MGO and MDO.
The requirement for bunker fuel is relatively high in bulk and general cargo vessels. While the major
demand from bulk carriers has been recently exhibiting a decreasing trend, the requirement for bunker
fuel in the container ships segment is anticipated to grow at a substantial rate in the future.
Selection of the right type fuel is of significant importance to the safety of the ship (substandard fuel can
cause severe damage to the ship’s engine) and its profitable operation. Bunker fuel costs account for
approximately 60% to 70% of the total voyage expenditure for a vessel. Ship operators, while taking
fuel, look for the following three important aspects, viz. that the bunkers they buy are of sufficient quality
to allow use without any problems; that they can get their bunkers at a good price; and that they buy at
the most cost-effective location on their ship’s itineraries. This implies that for any bunkering business
to thrive, these three aspects are to be satisfied. This also implies that to meet the demand for bunkers
there needs to be a corresponding supply source.
With this background, an overview of the region around the Indian sub-continent is made as this is more
relevant for this specific study. India lies in between the two significant bunker ports viz. Singapore
and Fujairah as shown in the Figure 9.1. While Singapore is the world’s largest bunker port at 45 MTPA
of bunker sales, Fujairah is the second with 25 MTPA bunker sales.

SAGARMALA: Master Plan for Chennai Port 9-2 Final Report
Figure 9.1 Significant Bunker Ports – Singapore and Fujairah
Singapore
Geographically, Singapore enjoys a crucial locational advantage as all the vessels sailing from the West
to Southeast pass by it making it an ideal stopping point for bunker calls. As of date, Singapore is the
busiest and also the leading bunker port in the world with over 581 MT of cargo traffic and over 45 MT
of bunker deliveries in a year, which is around one sixth to one seventh of the total quantity of marine
fuel sold annually around the world.
The following Table 9.1 gives the statistics relating to the types and volumes of bunker supplied at
Singapore during the past five years.
Table 9.1 Singapore Bunker Sales (in '000 T)
Year Total MGO MDO MFO
180 cst MFO
380 cst MFO
500 cst LSMGO
LSFO 180 cst
LSFO 380 cst
LSFO 500 cst
Others
2011 43,153.6 1,569.6 6.6 1,641.0 34,122.1 5,577.7 N.A. N.A. N.A. N.A. 236.6
2012 42,685.4 1,454.2 2.2 1,247.0 33,685.5 6,225.4 N.A. N.A. N.A. N.A. 71.1
2013 42,682.2 1,182.9 2.0 950.2 32,070.2 7,661.5 190.9 1.8 541.1 15.0 66.5
2014 42,416.8 1,023.8 1.9 747.6 31,812.7 8,106.0 287.4 2.0 412.6 4.9 18.0
2015 45,155.5 936.2 1.5 673.4 34,106.8 8,599.7 784.4 0.5 23.7 0.2 29.2
While there is a steady demand for bunkers, there should be a corresponding steady supply. Singapore
is home to an impressive cluster of refineries including Shell, Mobil and Singapore Refining Company.
With refining capacity totalling almost 1.4 million barrels per day, Singapore generally has plenty of
availability, keeping prices down and making it the cheapest bunker port in Southeast Asia.

SAGARMALA: Master Plan for Chennai Port 9-3 Final Report
There are over 100 bunker suppliers/traders operating from Singapore. There are about 230 bunker
tankers with sizes ranging from a minimum 290 T to a maximum 6,500 T serving the bunker trade.
In order to enhance the quality assurance, Singapore Port has put into effect a standard bunkering
procedure, setting out a minimum standard of bunker delivery. Bunker receiving ships and bunker
tankers are required to follow this procedure. Otherwise, chances of a claim recovery can be difficult in
cases of dispute. The Singapore Bunkering Procedure was a world-first when it was introduced in 1992.
The Singapore Standard CP 60 (Code of Practice for bunkering by Bunker barges/ tankers) applies
when bunkers are being delivered by bunker tankers to ships and lays down the minimum
documentation and equipment requirements and, verification during a bunkering operation. It covers
pre-delivery, actual delivery and post-delivery documentation. All bunker suppliers and bunker craft
operators are licensed by the Maritime Authority of Singapore (MPA) to comply with the SS CP 60 as a
licensing requirement. There is another Standard SS CP 77 (Code of Practice for Bunker Surveying).
This sets out the procedures and the documentation and equipment requirements of a bunkering
operation between a bunker barge/tanker and a vessel. It covers pre-delivery and post-delivery checks
and documentation.
Fujairah
Fujairah is the second largest bunkering port in the world next to Singapore with bunker traffic of about
25 MT during 2015.
This bunker market came into prominence as a result of the Iran/Iraq war in the 1980’s. Full scale
operations started in 1983. The area known as the ‘Fujairah bunker market’ encompasses the three
ports of Khor Fakkan, Kalba and Fujairah itself, all located on the east coast of the UAE
Fujairah’s biggest advantage is its location. Fujairah and the neighbouring port of Khor Fakkan are
located about 70 nm from the Straits of Hormuz. This strategic location attracts ships traders from the
Persian Gulf to anchor here for provisions, bunkers, repair and technical support, spares and stores
before proceeding on long voyages.
Fujairah boasts good, open, safe anchorages with ample vessel space. Favourable weather conditions
and good strategic location for crew changes and maintenance work at facilities such as Dubai dry
docks also attract vessels. So important is bunkering in the region that the anchorages off Fujairah are
demarcated for different purposes. There is a particular area called ‘Bravo’ anchorage used solely for
normal bunkering operations.
Fujairah Offshore Anchorage Area (FOAA), located 10 nm offshore, has earned an international
reputation establishing Fujairah as one of the largest bunkering and marine logistics hub. There are
about 40 bunker suppliers and a fleet of more than 100 independently owned and professionally
operated Supply vessels based in the port service the Port and the Anchorage. The average stem size
is higher than at other major bunkering ports due to the large number of bigger vessels like VLCCs,
tankers and gas carriers bunkering here. The average pumping rate is in the range of 300 to 350 TPH
except during winter when it is lower.
SAGARMALA: Master Plan for Chennai Port 9-4 Final Report
At least 95% of bunkers are delivered offshore. Bunker barges vary in size from 40,000 DWT to 2,000
DWT. There is a great flexibility for time and location of bunker delivery. All bunker barges are self-
propelled. Bunkering in international waters is beyond control.
There is no bunker fuel indigenously available at Fujairah and Khor Fakkan. Most suppliers import from
refineries in Bahrain, Saudi Arabia and Iran – often straight run material. All suppliers in this market
have to import product and store it afloat or ashore. This adds to the costs of running a bunker operation
in this market, and also demands careful forward planning by the operators if continuity of supplies is to
be achieved.
However, the International Petroleum Investment Company (IPIC) refinery with a processing capacity
of about 200,000 bpd is expected to be on stream in 2016. This will further boost the bunker sales at
Fujairah.
9.1.2 Indian Scenario in Bunkering
It is ironical that India, lying in between the two large bunker markets of Singapore and Fujairah, is yet
to establish itself as a recognised bunkering destination. It has to be noticed that India is a major supplier
of bunker cargoes to Singapore. It has to realise its potential as a major bunker supplier.
Administrative problems coupled with uncompetitive prices compared to direct rivals at Fujairah and
Singapore have often been blamed for the relatively slow progress made by the country’s bunker sector.
In this context, reference is invited to a presentation made by Indian Oil Corporation Ltd. at an
international conference in Colombo during September, 2015 on “Indian Bunker Sector Developments”.
In this they have listed out the negative points restricting the growth of bunker traffic in India. These are
presented hereunder:
India lies in between the two strong bunkering hubs of Singapore & Fujairah
Different tax structure at different states. Vat is applicable on Bunker supply to FG vessels being
deemed export. Exemption / reductions obtained from few States after prolonged follow ups.
Distributed potential in India leading to multiple expenditure for creating facilities for much
smaller volumes as against concentric potential at Singapore & Fujairah
Desired grades of bunker fuel are not available at all ports
Port specific restrictions/regulations on bunkering beyond daylight, physical supervision and
lengthy documentations
Barges are not allowed to be used as floating storage of bonded bunker fuel
Bunkering at OPL (Off Port Limits) is not permitted by ports. At OPL vessels need not come
inside the port and save on port charges and time.
Loading of bonded bunker is allowed against specific vessels with specific approval for which
nominations are received.
In another presentation made by Matrix Bharat (a Joint venture between BPCL and Matrix Marine Fuels
Pet Ltd., a subsidiary of Mabanaft, a leading oil trading company based at Germany) at Delhi on India
Maritime Day in February, 2014, the way forward for bunkering in India has been indicated viz.

SAGARMALA: Master Plan for Chennai Port 9-5 Final Report
Dedicated Barge loading Jetty at ports
Barges with higher capacity and better pumping rate.
Ex pipe bunker delivery facilities at ports
Proactive steps by port authorities for setting up bunkering facilities and reduced port charges
and wharfages.
Tax concessions and duty draw backs on bonded bunker deliveries
Simplified customs & excise formalities
Floating storage for quicker delivery
Formation of Bunker Association
In recent times, the situation has improved. As an important step, the tax structure has been modified
favourably by the states. The applicable taxes in the various states for bunkering are brought out in the
following Table 9.2.
Table 9.2 All India Tax Applicability on Bunkers (%)
State Port
Foreign Coastal
IFO MGO IFO MGO
West Bengal Kolkata / Haldia 1.5 17 5 17
Odisha Dhamra / Paradip 5 23 13.5 23
Andhra Pradesh Visakhapatnam / Gangavaram / Kakinada / Krishnapatnam
4 22.25 4 22.25
Tamil Nadu Kattupalli / Ennore / Chennai / Karaikal / Tuticorin
4 4 5 21.43
Kerala Cochin 0.5 0.51 5 24.52
Karnataka New Mangalore / Karwar 1 1 14.5 16.65
Goa Mormugao 1 4 12.5 22
Maharashtra
Mumbai
0 0 12.5
24
Jawaharlal Nehru 21
Gujarat Kandla / Mundra / Pipavav / Hazira / Dahej
5 24.63 5 24.63
[Courtesy: IOCL presentation on “Indian Bunker Sector Developments”.at Colombo]
Note: Andhra Pradesh has reduced the taxes on bunkers to foreign vessels from 14% to 4% effective February, 2016.
As a result, the prices of bunkers at Indian Ports have come down with shrinking differential as compared
to Singapore & Fujairah. This is brought out in the following Table 9.3, as presented by IOCL in the
Colombo Conference.
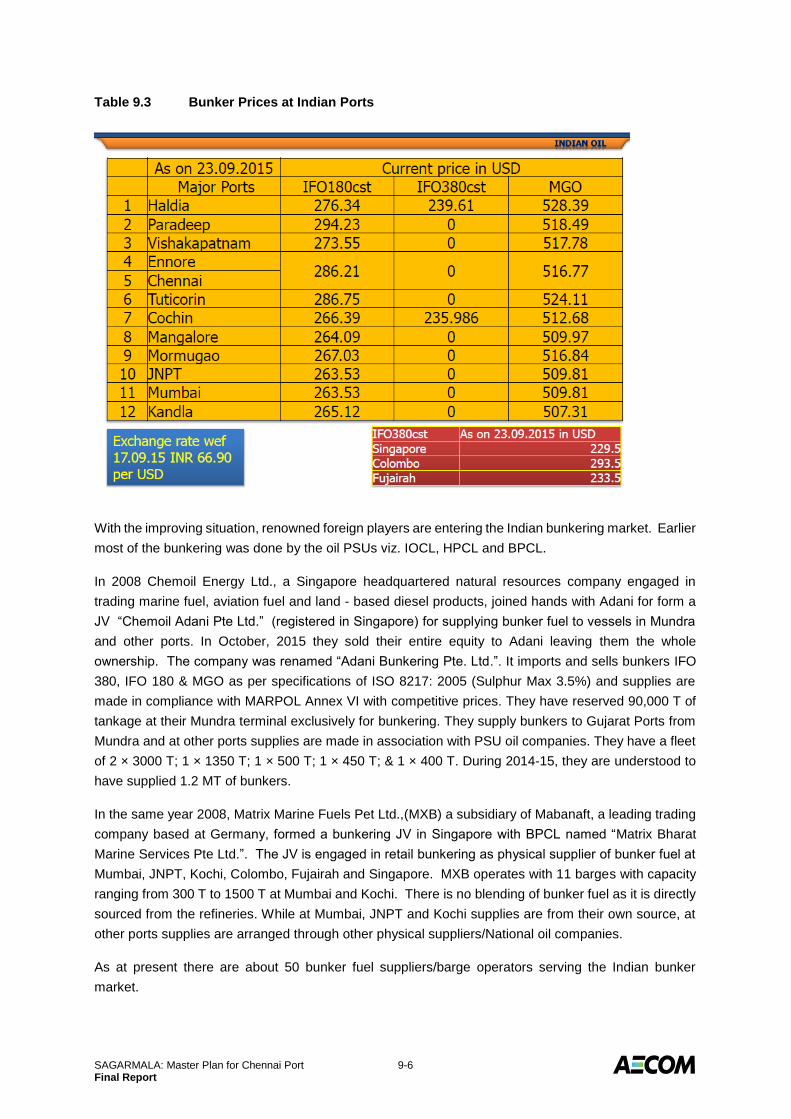
SAGARMALA: Master Plan for Chennai Port 9-6 Final Report
Table 9.3 Bunker Prices at Indian Ports
With the improving situation, renowned foreign players are entering the Indian bunkering market. Earlier
most of the bunkering was done by the oil PSUs viz. IOCL, HPCL and BPCL.
In 2008 Chemoil Energy Ltd., a Singapore headquartered natural resources company engaged in
trading marine fuel, aviation fuel and land - based diesel products, joined hands with Adani for form a
JV “Chemoil Adani Pte Ltd.” (registered in Singapore) for supplying bunker fuel to vessels in Mundra
and other ports. In October, 2015 they sold their entire equity to Adani leaving them the whole
ownership. The company was renamed “Adani Bunkering Pte. Ltd.”. It imports and sells bunkers IFO
380, IFO 180 & MGO as per specifications of ISO 8217: 2005 (Sulphur Max 3.5%) and supplies are
made in compliance with MARPOL Annex VI with competitive prices. They have reserved 90,000 T of
tankage at their Mundra terminal exclusively for bunkering. They supply bunkers to Gujarat Ports from
Mundra and at other ports supplies are made in association with PSU oil companies. They have a fleet
of 2 × 3000 T; 1 × 1350 T; 1 × 500 T; 1 × 450 T; & 1 × 400 T. During 2014-15, they are understood to
have supplied 1.2 MT of bunkers.
In the same year 2008, Matrix Marine Fuels Pet Ltd.,(MXB) a subsidiary of Mabanaft, a leading trading
company based at Germany, formed a bunkering JV in Singapore with BPCL named “Matrix Bharat
Marine Services Pte Ltd.”. The JV is engaged in retail bunkering as physical supplier of bunker fuel at
Mumbai, JNPT, Kochi, Colombo, Fujairah and Singapore. MXB operates with 11 barges with capacity
ranging from 300 T to 1500 T at Mumbai and Kochi. There is no blending of bunker fuel as it is directly
sourced from the refineries. While at Mumbai, JNPT and Kochi supplies are from their own source, at
other ports supplies are arranged through other physical suppliers/National oil companies.
As at present there are about 50 bunker fuel suppliers/barge operators serving the Indian bunker
market.
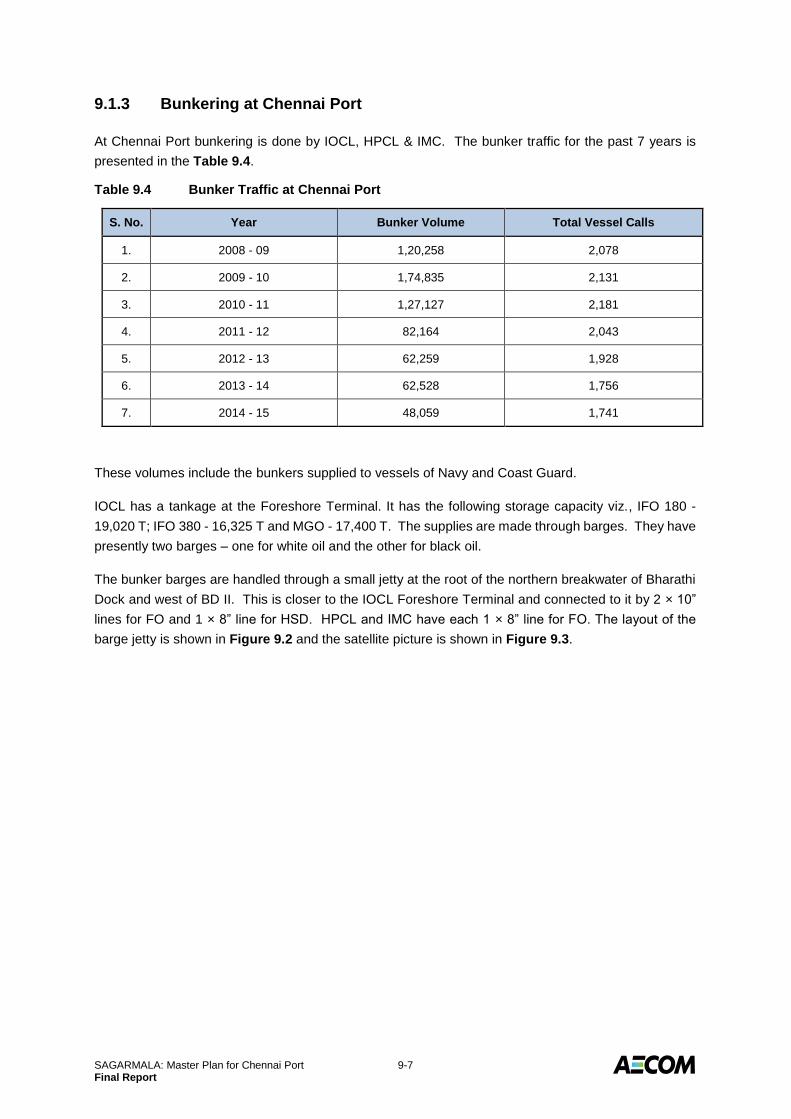
SAGARMALA: Master Plan for Chennai Port 9-7 Final Report
9.1.3 Bunkering at Chennai Port
At Chennai Port bunkering is done by IOCL, HPCL & IMC. The bunker traffic for the past 7 years is
presented in the Table 9.4.
Table 9.4 Bunker Traffic at Chennai Port
S. No. Year Bunker Volume Total Vessel Calls
1. 2008 - 09 1,20,258 2,078
2. 2009 - 10 1,74,835 2,131
3. 2010 - 11 1,27,127 2,181
4. 2011 - 12 82,164 2,043
5. 2012 - 13 62,259 1,928
6. 2013 - 14 62,528 1,756
7. 2014 - 15 48,059 1,741
These volumes include the bunkers supplied to vessels of Navy and Coast Guard.
IOCL has a tankage at the Foreshore Terminal. It has the following storage capacity viz., IFO 180 -
19,020 T; IFO 380 - 16,325 T and MGO - 17,400 T. The supplies are made through barges. They have
presently two barges – one for white oil and the other for black oil.
The bunker barges are handled through a small jetty at the root of the northern breakwater of Bharathi
Dock and west of BD II. This is closer to the IOCL Foreshore Terminal and connected to it by 2 × 10”
lines for FO and 1 × 8” line for HSD. HPCL and IMC have each 1 × 8” line for FO. The layout of the
barge jetty is shown in Figure 9.2 and the satellite picture is shown in Figure 9.3.

SAGARMALA: Master Plan for Chennai Port 9-8 Final Report
Figure 9.2 Location and Layout of Existing Bunker Jetty
Figure 9.3 Location and Layout of Existing Bunker Jetty
While IOCL supplies Furnace Oil (FO) and High Flash High Speed Diesel (HFHSD) meeting stringent
BIS specifications, it also offers the entire range of SERVO brand marine grade lubricants. It has also
started supplying Bonded 380 cst FO bunker fuel from Chennai from May 2009 as per ISO 8217:2005
specifications. The price of this product is internationally competitive. These products are available
locally through the refinery at Manali of Chennai Petroleum Corporation Ltd., a unit of IOCL.

SAGARMALA: Master Plan for Chennai Port 9-9 Final Report
Last year Chennai Customs Department allowed OPL (Off Port Limits) bunkering through a public notice
outlining the procedures for bunker supply at anchorages/outer anchorages.
Along with this, Chennai Port is trying to set up an exclusive bunker terminal which crucial infrastructure
was missing all these years. During March 2013, the Port signed a concession agreement with “Chennai
Bunkering Terminal Pvt Ltd.” a SPV formed by IMC Ltd. to develop a barge handling jetty under PPP
mode. The licensee was expected to construct a jetty of 150 m × 15 m east of BD II with shore
connection for handling bunker barges and edible oil vessels. But the licensee did not proceed with the
project as planned and hence the Port has cancelled the license.
It is now proposed to develop an exclusive and integrated bunker terminal with berthing facilities and
reserved land area for setting up bunker storage tanks.
9.1.4 Proposed Bunker Terminal
Suggested Framework
It is suggested that the Port can construct the berthing facility on its own instead of passing through the
PPP mode. This berthing facility can be used by all the agencies interested in carrying out bunkering
business at the Port for berthing their bunker tankers on first-come first- served basis. The Port can
also reserve certain land area nearby for interested agencies to set up their storage tanks. The Port
can provide ROW for requisite pipelines from the storage tanks to this berth. This will encourage better
participation and fair play in the business.
Traffic Potential
It can be seen that during 2009 -10, Chennai Port experienced the maximum bunker traffic of about
1.75 lakh T. This was even without the basic infrastructure required. Subsequently, though, the volumes
gradually dropped down. Now with the permission for OPL bunkering and with exclusive bunker
terminal there is good prospects of the traffic picking up.
Matrix Bharat have indicated the potential for bunkering assuming stem sizes of 800 T for container
vessels; 500 T for liquid bulk vessels; 400 T for break bulk and other vessels and 300 T for bulk carriers.
The category wise vessel traffic at Chennai Port for the past 5 years is presented in the following Table
9.5. Taking the average and applying the stem volumes, the potential is established.
Table 9.5 Chennai Port Vessel Traffic & Bunker Requirements
Vessel Category 2010 -
11 2011 - 12 2012 - 13
2013 - 14
2014 - 15
Avg Stem Bunker Need
Dry Bulk carriers 309 223 183 165 175 211 300 63,300
Liquid Bulk carriers
502 507 460 429 427 465 500 2,32,500
Break bulk vessels
500 437 499 430 426 458 400 1,83,200
Container vessels
812 789 786 780 762 786 800 6,28,800
Total 2,123 1,956 1,928 1,804 1,790 1,920 11,07,800

SAGARMALA: Master Plan for Chennai Port 9-10 Final Report
This gives a very optimistic picture of all vessels taking bunkers leading to a total traffic of over 1.0
MTPA. This may not happen. A realistic estimate of certain percentage taking the bunker could be taken
– gradually growing from 10% onwards.
On the other hand, IOCL assumes a mean figure of 120 T stem per vessel which gives the possible
traffic as 0.23 MTPA. This definitely appear feasible considering the earlier traffic of 1.75 lakh T during
2009-10.
Location of the Terminal
It is proposed to locate the berthing facilities east of the existing barge jetty and parallel to the pipeline
trestle leading to BD I & BD III. An area of about 2 ha can be made available for interested agencies
for setting up their bunker tankage on the reclaimed land at the root of the northern breakwater of
Bharathi Dock and east of the CFS. The location of the berthing facility and the area for the tank farm
are shown in the following Figure 9.4.
Figure 9.4 Locations of the Berthing Facility & Area for Tank Farm

SAGARMALA: Master Plan for Chennai Port 9-11 Final Report
Selection of Design Tanker
From the information about the leading bunker suppliers at Indian Ports, Adani has 6 bunker tankers of
sizes ranging from 400 T to 3000 T. Matrix Bharat has 11 bunker tankers of size ranging from 300 T to
1500 T. Most of the others have smaller tankers of size in the range of 300 T to 500 T. The sizes of
some of the bunker tankers operating at Singapore are given in the Table 9.6.
Table 9.6 Size of Some of the Bunker Tankers Operating in Singapore
S. No. Name of vessel DWT LOA (m) Beam (m) Draft (m)
1. Marine Protector 420 30 8.0 3.2
2. Northeast Progress 620 49 8.3 3.0
3. Pacific Honour 1,502 73 12.0
4. Foresa 1,650 67 13.5 4.0
5. Marine Priority 1,783 50 12.0 4.0
6. Marine Promise 2,074 50 12.0 4.0
7. Crown Fortune 2,984 78 15.0 3.9
8. Global Duri 3,123 89 13.0 5.7
9. Marine Matrix 3,865 101 18.0 5.0
10. Kitek 9 3,911 96 14.0 5.8
11. Southern Pec 6 4,700 100 15.0 5.5
12. Sea Swift 4,998 92 15.0 5.6
13. Pacific Wise 4,999 90 16.0 5.0
14. Sea Frontier 4,999 104 15.0 4.0
The picture of a typical 1,600 T bunker tanker is given in Figure 9.5.
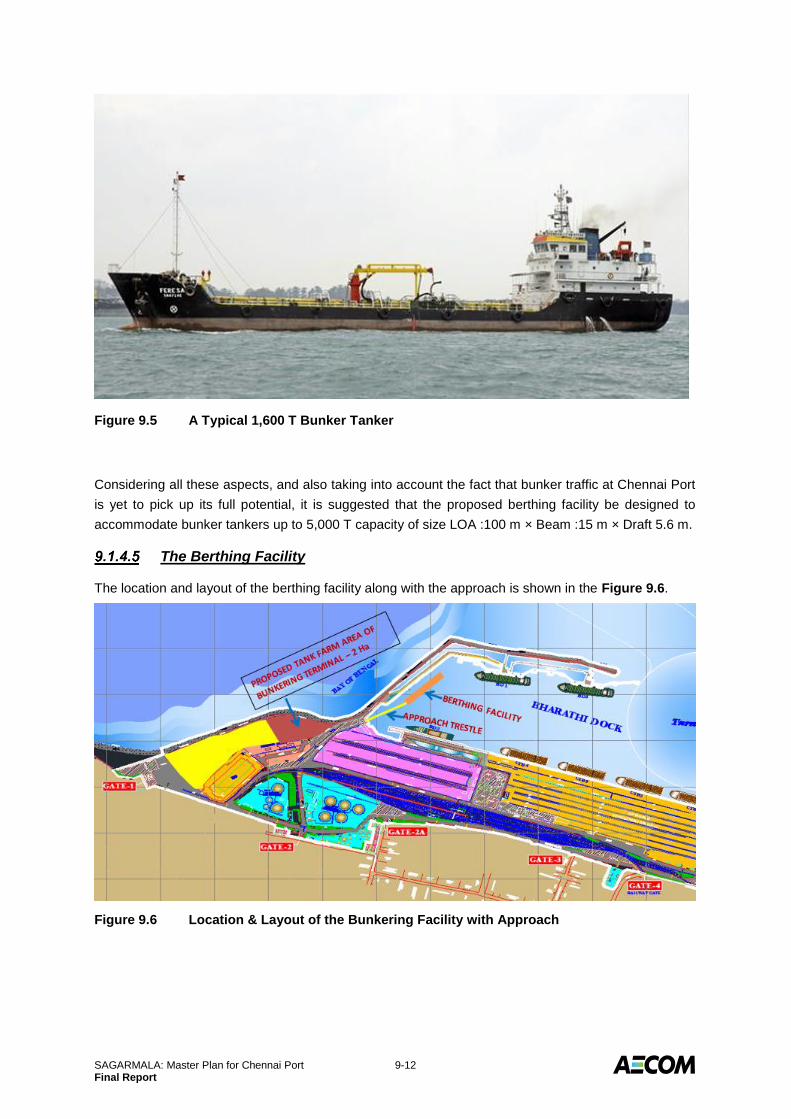
SAGARMALA: Master Plan for Chennai Port 9-12 Final Report
Figure 9.5 A Typical 1,600 T Bunker Tanker
Considering all these aspects, and also taking into account the fact that bunker traffic at Chennai Port
is yet to pick up its full potential, it is suggested that the proposed berthing facility be designed to
accommodate bunker tankers up to 5,000 T capacity of size LOA :100 m × Beam :15 m × Draft 5.6 m.
The Berthing Facility
The location and layout of the berthing facility along with the approach is shown in the Figure 9.6.
Figure 9.6 Location & Layout of the Bunkering Facility with Approach

SAGARMALA: Master Plan for Chennai Port 9-13 Final Report
The berthing facility will be of an open piled structure with RCC cast–in-situ bored piles. Considering
that the bunker tankers will be of a varied size, it is recommended to have a continuous berthing face
so that two smaller tankers could be berthed concurrently. The length of the jetty will be 130 m
considering the maximum tanker size of 100 m LOA. The structure will be designed to handle tankers
of 5,000 DWT. The width of the jetty will be 15 m. The jetty will be provided with 30 T bollards at 15 m
intervals and 600 mm super arch rubber fenders, also at 15 m centres. Though the structure will be
designed for vessels up to 5.6 m draft, during the initial stages smaller vessels of less than 4 m draft
will be operational. Since the available depth at this area is about 5 m no dredging will be required.
The topside facilities on the berthing jetty will just consist of a pipeline manifold with a continuous header
with flanges at the centre of the berth and at quarter points so that two smaller tankers side by side and
one large tanker could be handled. The transfer will be through rubber hoses only. The incoming
pipelines of the various agencies will be linked to this header.
Approach Trestle
The berthing jetty will be connected to the shore by an approach trestle of 40 m length. It will have a 5
m wide roadway and a 2.5 m wide pipe rack. This will also be of open piled structure.
Area for Tank Farm
It is recommended that an area of about 2 ha. at the reclaimed land at the root of the northern breakwater
of Bharathi Dock as shown in Figure 9.6 be earmarked for location of bunker tank farm by interested
agencies. This area could accommodate about 25,000 kL to 30,000 kL tankage with all infrastructures.
IOCL has its own tankages at the Foreshore Terminal. This additional area will encourage interested
agencies to set up their own tankage and use the berthing facility. This will also facilitate enhancing the
bunker traffic at Chennai Port.
Crude Oil Imports
Chennai Port is presently handling the crude oil imports for the Manali Refinery of Chennai Petroleum
Corporation Ltd. Chennai Petroleum Corporation Ltd. (CPCL) has a refinery at Manali with a present
refining capacity of 11.1 MTPA consequent to the various debottlenecking initiatives as well as addition
of Crude Distillation Units 2 and 3. The refinery imported 10.19 MT of crude during 2013-14 and 10.16
MT during 2014-15. The crude imports are handled through berth BD III in Bharathi Dock of Chennai
Port. This berth is designed to handle suezmax tankers up to 150,000 DWT with 16.5 m draft. During
2014-15, out of the 10.16 MT handled, about 80% of the quantity was handled through suezmax tankers
with an average parcel size of about 138,000 T.
CPCL had a proposal to increase the refining capacity by another 6 MTPA and for this purpose they
considered a SBM terminal off Ennore for handling VLCC’s. However, this project has been put on hold
for the present.

SAGARMALA: Master Plan for Chennai Port 9-14 Final Report
CPCL is currently laying a new 42” crude oil pipeline from the port to the refinery as the existing 30”
pipeline, which was laid during 1969 when the refinery was commissioned, has developed leaks causing
safety concerns. CPCL has initiated action the construction work. This pipeline will be laid from the BD
III berth in Bharathi Dock of Chennai Port up to the refinery running for a length of about 17 km. The
line will be laid along the Ennore Highway and Manali Highway. The relative locations of the refinery,
Chennai port crude oil berth and the route of the new 42” pipeline are all shown in the Figure 9.7.
Figure 9.7 Route of the New 42” Pipeline
In view of this development, it has been suggested that if a SBM is located south of the earlier location
with the feasibility of routing the submarine pipeline in such a way that the landfall point is located near
Ernavoor at the junction of Ennore Highway and Manali Highway, this will avoid having a tankfarm at
Ennore and laying a 23 km long cross country line within the city limits.
At Ernavoor the submarine pipeline from the SBM could be hooked with new the 42” pipeline leading to
the refinery tankage. This SBM will have a double advantage – even with the present traffic, CPCL
stand to gain through freight advantage which could be in the range of US $ 3 /T; as and when the
refinery capacity expands, this SBM will be able to handle the entire crude imports, which BD III will not
be able to handle.
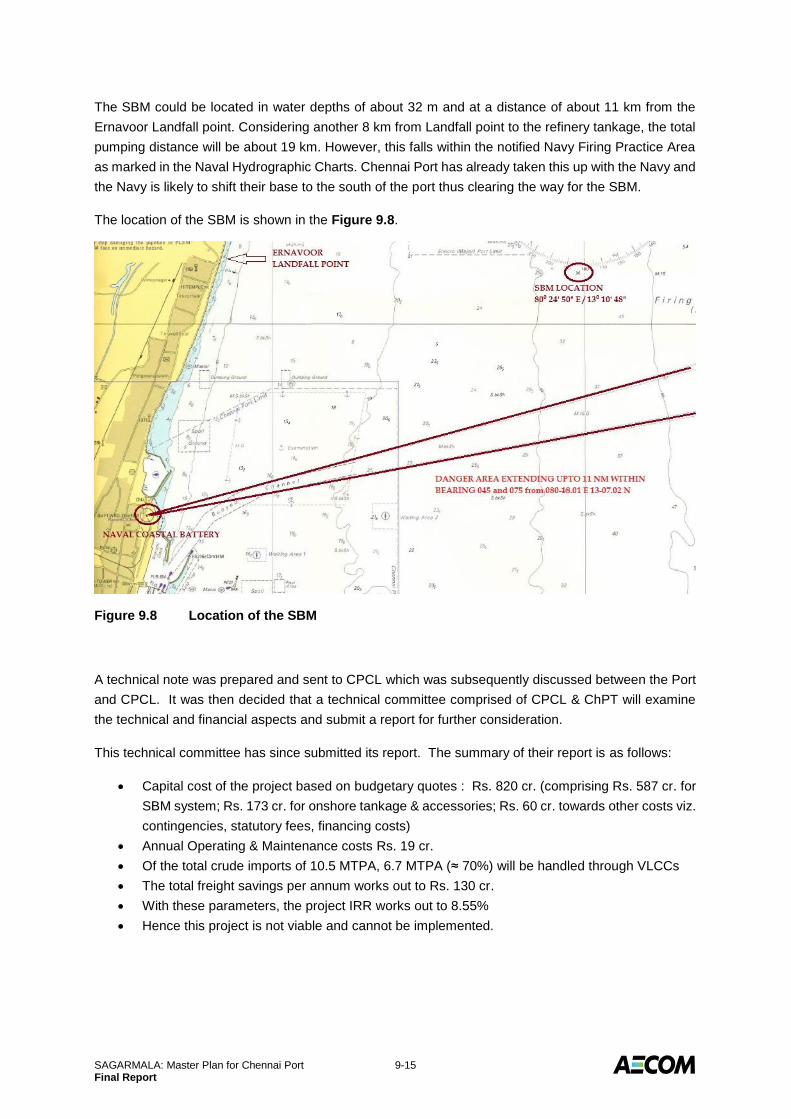
SAGARMALA: Master Plan for Chennai Port 9-15 Final Report
The SBM could be located in water depths of about 32 m and at a distance of about 11 km from the
Ernavoor Landfall point. Considering another 8 km from Landfall point to the refinery tankage, the total
pumping distance will be about 19 km. However, this falls within the notified Navy Firing Practice Area
as marked in the Naval Hydrographic Charts. Chennai Port has already taken this up with the Navy and
the Navy is likely to shift their base to the south of the port thus clearing the way for the SBM.
The location of the SBM is shown in the Figure 9.8.
Figure 9.8 Location of the SBM
A technical note was prepared and sent to CPCL which was subsequently discussed between the Port
and CPCL. It was then decided that a technical committee comprised of CPCL & ChPT will examine
the technical and financial aspects and submit a report for further consideration.
This technical committee has since submitted its report. The summary of their report is as follows:
Capital cost of the project based on budgetary quotes : Rs. 820 cr. (comprising Rs. 587 cr. for
SBM system; Rs. 173 cr. for onshore tankage & accessories; Rs. 60 cr. towards other costs viz.
contingencies, statutory fees, financing costs)
Annual Operating & Maintenance costs Rs. 19 cr.
Of the total crude imports of 10.5 MTPA, 6.7 MTPA (≈ 70%) will be handled through VLCCs
The total freight savings per annum works out to Rs. 130 cr.
With these parameters, the project IRR works out to 8.55%
Hence this project is not viable and cannot be implemented.
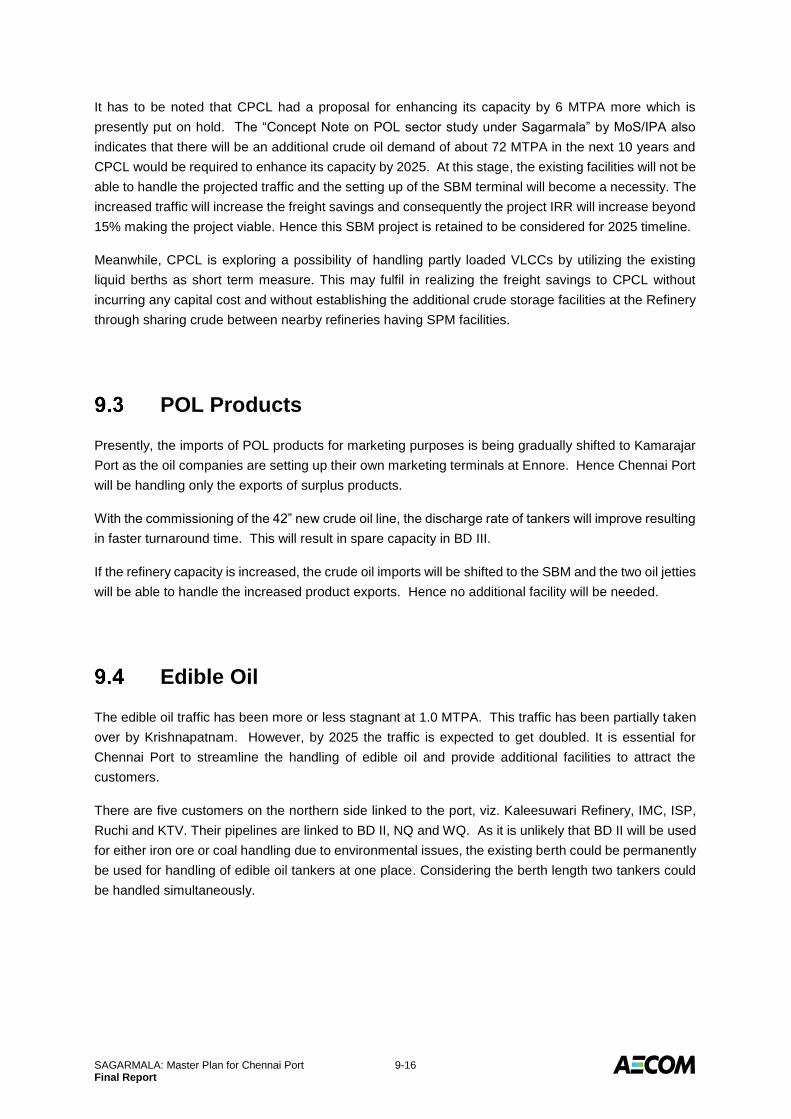
SAGARMALA: Master Plan for Chennai Port 9-16 Final Report
It has to be noted that CPCL had a proposal for enhancing its capacity by 6 MTPA more which is
presently put on hold. The “Concept Note on POL sector study under Sagarmala” by MoS/IPA also
indicates that there will be an additional crude oil demand of about 72 MTPA in the next 10 years and
CPCL would be required to enhance its capacity by 2025. At this stage, the existing facilities will not be
able to handle the projected traffic and the setting up of the SBM terminal will become a necessity. The
increased traffic will increase the freight savings and consequently the project IRR will increase beyond
15% making the project viable. Hence this SBM project is retained to be considered for 2025 timeline.
Meanwhile, CPCL is exploring a possibility of handling partly loaded VLCCs by utilizing the existing
liquid berths as short term measure. This may fulfil in realizing the freight savings to CPCL without
incurring any capital cost and without establishing the additional crude storage facilities at the Refinery
through sharing crude between nearby refineries having SPM facilities.
POL Products
Presently, the imports of POL products for marketing purposes is being gradually shifted to Kamarajar
Port as the oil companies are setting up their own marketing terminals at Ennore. Hence Chennai Port
will be handling only the exports of surplus products.
With the commissioning of the 42” new crude oil line, the discharge rate of tankers will improve resulting
in faster turnaround time. This will result in spare capacity in BD III.
If the refinery capacity is increased, the crude oil imports will be shifted to the SBM and the two oil jetties
will be able to handle the increased product exports. Hence no additional facility will be needed.
Edible Oil
The edible oil traffic has been more or less stagnant at 1.0 MTPA. This traffic has been partially taken
over by Krishnapatnam. However, by 2025 the traffic is expected to get doubled. It is essential for
Chennai Port to streamline the handling of edible oil and provide additional facilities to attract the
customers.
There are five customers on the northern side linked to the port, viz. Kaleesuwari Refinery, IMC, ISP,
Ruchi and KTV. Their pipelines are linked to BD II, NQ and WQ. As it is unlikely that BD II will be used
for either iron ore or coal handling due to environmental issues, the existing berth could be permanently
be used for handling of edible oil tankers at one place. Considering the berth length two tankers could
be handled simultaneously.
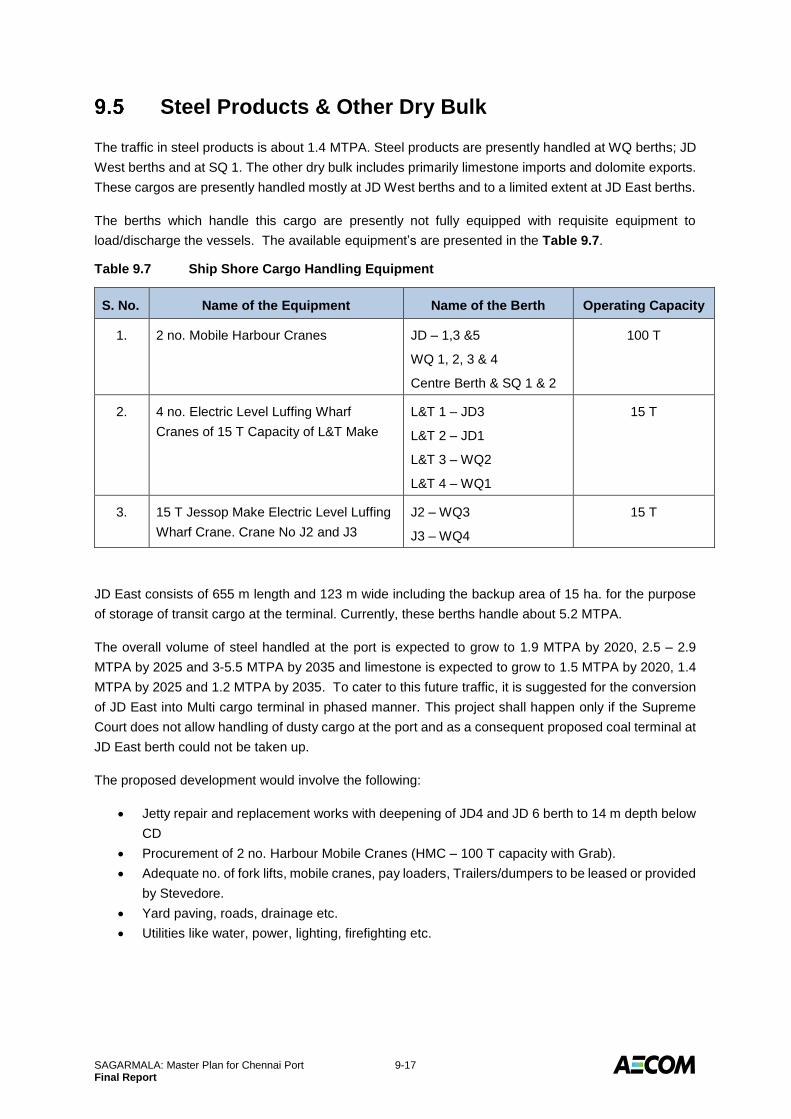
SAGARMALA: Master Plan for Chennai Port 9-17 Final Report
Steel Products & Other Dry Bulk
The traffic in steel products is about 1.4 MTPA. Steel products are presently handled at WQ berths; JD
West berths and at SQ 1. The other dry bulk includes primarily limestone imports and dolomite exports.
These cargos are presently handled mostly at JD West berths and to a limited extent at JD East berths.
The berths which handle this cargo are presently not fully equipped with requisite equipment to
load/discharge the vessels. The available equipment’s are presented in the Table 9.7.
Table 9.7 Ship Shore Cargo Handling Equipment
S. No. Name of the Equipment Name of the Berth Operating Capacity
1. 2 no. Mobile Harbour Cranes JD – 1,3 &5
WQ 1, 2, 3 & 4
Centre Berth & SQ 1 & 2
100 T
2. 4 no. Electric Level Luffing Wharf
Cranes of 15 T Capacity of L&T Make
L&T 1 – JD3
L&T 2 – JD1
L&T 3 – WQ2
L&T 4 – WQ1
15 T
3. 15 T Jessop Make Electric Level Luffing
Wharf Crane. Crane No J2 and J3
J2 – WQ3
J3 – WQ4
15 T
JD East consists of 655 m length and 123 m wide including the backup area of 15 ha. for the purpose
of storage of transit cargo at the terminal. Currently, these berths handle about 5.2 MTPA.
The overall volume of steel handled at the port is expected to grow to 1.9 MTPA by 2020, 2.5 – 2.9
MTPA by 2025 and 3-5.5 MTPA by 2035 and limestone is expected to grow to 1.5 MTPA by 2020, 1.4
MTPA by 2025 and 1.2 MTPA by 2035. To cater to this future traffic, it is suggested for the conversion
of JD East into Multi cargo terminal in phased manner. This project shall happen only if the Supreme
Court does not allow handling of dusty cargo at the port and as a consequent proposed coal terminal at
JD East berth could not be taken up.
The proposed development would involve the following:
Jetty repair and replacement works with deepening of JD4 and JD 6 berth to 14 m depth below
CD
Procurement of 2 no. Harbour Mobile Cranes (HMC – 100 T capacity with Grab).
Adequate no. of fork lifts, mobile cranes, pay loaders, Trailers/dumpers to be leased or provided
by Stevedore.
Yard paving, roads, drainage etc.
Utilities like water, power, lighting, firefighting etc.
SAGARMALA: Master Plan for Chennai Port 9-18 Final Report
The proposed berths would be able to handle 2 to 3 ships simultaneously which could be handled either
by ship’s gear or by deploying the mobile harbour cranes. As these berths would mainly handle iron and
steel products, aluminium ingots, pig iron, fertilizers, sugar etc., the average handling rate between ship
to shore transfer shall be around 8,000 TPH. With mechanisation and development of integrated
backup space the cargo would be handled more efficiently with faster turnaround of ships. The overall
capacity of the berths would improve to about 6.2 MPTA. The overall capital cost of development is
estimated as about Rs. 200 crores.
While JD east can cater to handling of proposed traffic for steel and other dry bulk, the possibility of
utilising the BD II berth and the backup space for a fully mechanised fertilizer terminal could also be
explored in case the fertilizer traffic picks up as a result of improved coastal shipping.
Containers
The container traffic also has been stagnating at about 1.5 MTEU for the past few years. This is only
about 50% of the available capacity. The reasons are primarily due to the problems in evacuation of
the containers and the competition from nearby ports. BCG has identified the problem and has
suggested a couple of remedial measures.
One is to encourage the operator of CCTPL to increase the yard equipment to balance the dockside
operations and the yard operations so as to ensure the smooth flow of containers. There is also a need
to provide additional yard space for CCTPL. Since the iron ore terminal has been decommissioned, coal
terminal can be developed at BD II in case the Supreme Court allows it. If a Coal Terminal cannot be
developed, then the backup area of BD II may be allotted to CCTPL as additional stack yard.
The second is to develop a common railway yard to increase the volume of evacuation by rail to ease
the road congestion. This yard could be developed in the southern side of the port where sufficient area
is available for laying additional railway sidings.

SAGARMALA: Master Plan for Chennai Port 9-19 Final Report
Utilisation of Boat Basin and Timber Pond
9.7.1 Existing Details
The Boat basin/Timber pond is a shallow basin located in the southwest end of Ambedkar dock with a
combined water spread area of about 60,000 m2 out of which 13,000 m2 constitutes timber pond. The
depths in Boat basin vary from 4 m to 8 m which suits the navigational needs of port crafts. The Timber
pond is much shallower with depths varying up to 4.0 m below chart datum. However, in the
present times it is not of any substantial use. It appears to have been created during the first and second
decades of last century.
The Boat basin is primarily used for parking of port crafts and for their afloat repairs. There is a slipway
meant for underwater repairs of port crafts like tugs. In addition, there are small slipways meant for
repair of small launches in a portion of boat basin called DPC yard as also some ramps for beaching of
Catamarans. The Timber pond, an extension of boat basin with water spread having even shallower
draft, was meant for handling of timber in the olden days. This activity is however not in vogue for the
last over 50 years and was more in use as a shelter for small boats. The layout of boat basin follows a
very irregular shape and appears as if it was created and developed based on the instincts and needs
from time to time in the first half of last century. The layout is shown in the
Figure 9.9.
Figure 9.9 Layout of Boat Basin/Timber Pond
There are couple of alternative usages of this prime land and waterfront available to the port. These are
discussed below.
SAGARMALA: Master Plan for Chennai Port 9-20 Final Report
9.7.2 Option 1 – Ship Repair Facilities
Chennai port has already got a feasibility report prepared by a consultant for developing ship
repair/building facilities at Boat basin/timber pond. Based on the feasibility study, considering the length
of the waterfront and the size of the basin area, Ship Repair facility could be developed not only to
provide the required service to the shipping industry but also to maximize the Port revenue.
The advantage of the proposed project is the ready-made availability of basic infrastructure like water
area, land area, a small slipway, the covered workshop facilities, access road, which could attract a
future entrepreneur who can utilise these for start-up phase till the main facilities are built.
Based on the corresponding ship repair numbers and the ship calls to the ports on east coast, the ship
repair traffic forecast have been arrived. Based on the above it is estimated that proposed dry docking
facilities at Chennai port could share about 25% to 30% of the traffic.
In addition, it may be noted that the Indian vessels are the major sources of revenue for the Colombo
dockyard. The main reasons for which the Indian vessels travel to Colombo is congestion at Indian
docks as well as prompt repairs available at Colombo free of pre-berthing delays. Approximate number
of vessels in the total ship-repair traffic at Colombo was 90, 80, 90, 110 and 80 in the years 2008, 2009,
2010, 2011 and 2012 respectively. It could be well assumed that the proposed dry docking facility could
attract about 25% of the traffic diverted to Colombo by way of offering competitive facilities at faster
turnaround time at competing rates.
Various alternatives with graving dock options and ship lift options were studied by the consultant, and
it could be observed that graving dock option, though could handle larger ship size, and does not offer
adequate dry dock days to meet the projected throughput of ship repair and ship building. The ship lift
alternative offers the best solution to provide adequate dry and wet berths for ship repair as well as ship
building activities duly optimising the limited available backup area. In this alternative, the side transfer
arrangement has been proposed instead of longitudinal transfer. This allows for providing total 5 dry
berths and also additional area for locating workshop facilities.
The proposed ship repair facilities with Shiplift system are shown in the Figure 9.10.
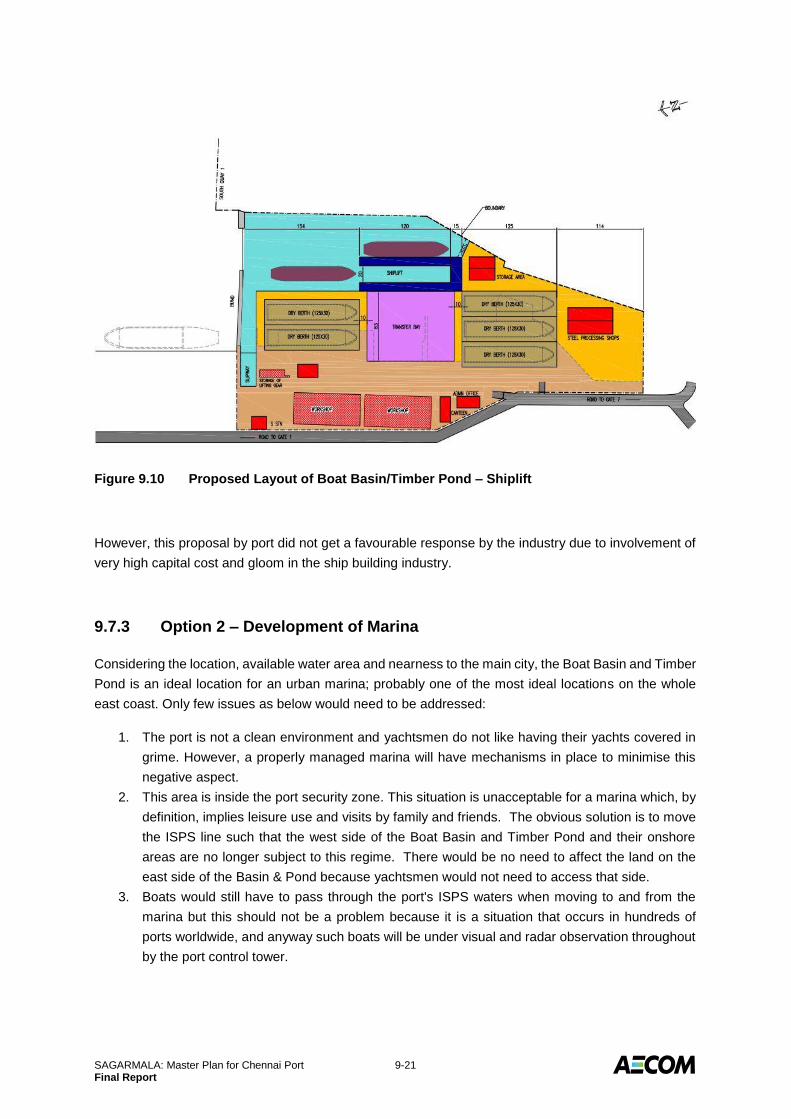
SAGARMALA: Master Plan for Chennai Port 9-21 Final Report
Figure 9.10 Proposed Layout of Boat Basin/Timber Pond – Shiplift
However, this proposal by port did not get a favourable response by the industry due to involvement of
very high capital cost and gloom in the ship building industry.
9.7.3 Option 2 – Development of Marina
Considering the location, available water area and nearness to the main city, the Boat Basin and Timber
Pond is an ideal location for an urban marina; probably one of the most ideal locations on the whole
east coast. Only few issues as below would need to be addressed:
1. The port is not a clean environment and yachtsmen do not like having their yachts covered in
grime. However, a properly managed marina will have mechanisms in place to minimise this
negative aspect.
2. This area is inside the port security zone. This situation is unacceptable for a marina which, by
definition, implies leisure use and visits by family and friends. The obvious solution is to move
the ISPS line such that the west side of the Boat Basin and Timber Pond and their onshore
areas are no longer subject to this regime. There would be no need to affect the land on the
east side of the Basin & Pond because yachtsmen would not need to access that side.
3. Boats would still have to pass through the port's ISPS waters when moving to and from the
marina but this should not be a problem because it is a situation that occurs in hundreds of
ports worldwide, and anyway such boats will be under visual and radar observation throughout
by the port control tower.
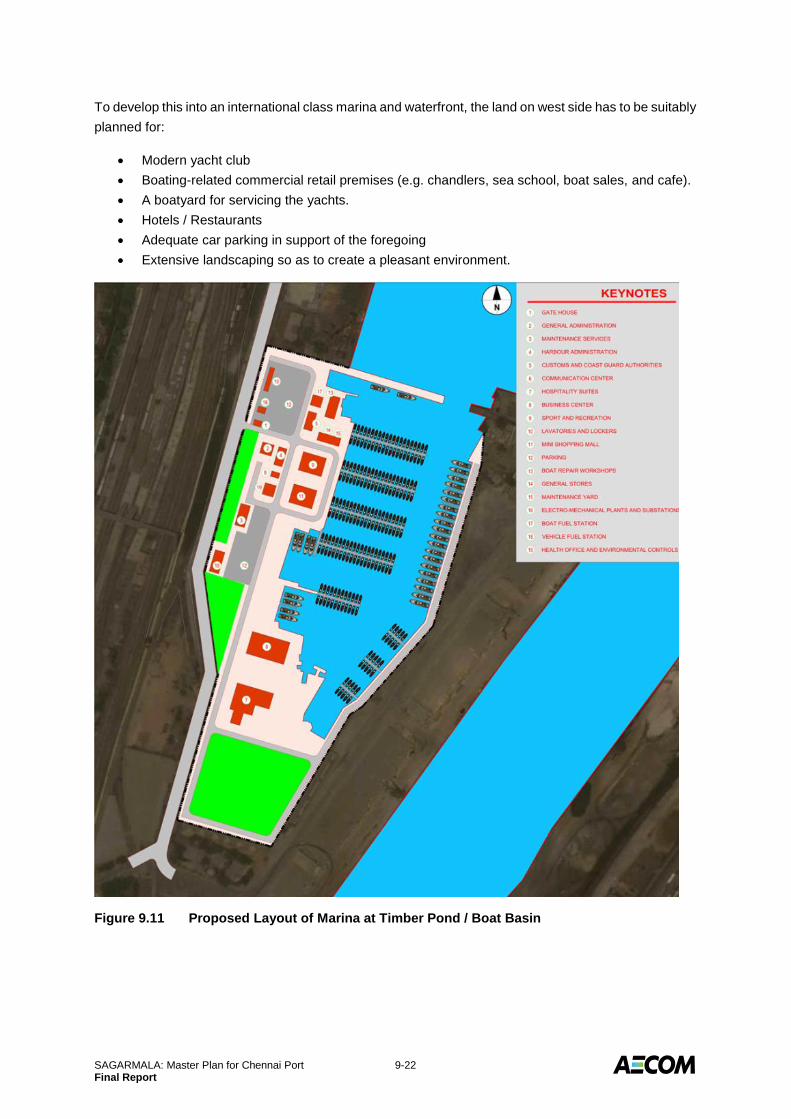
SAGARMALA: Master Plan for Chennai Port 9-22 Final Report
To develop this into an international class marina and waterfront, the land on west side has to be suitably
planned for:
Modern yacht club
Boating-related commercial retail premises (e.g. chandlers, sea school, boat sales, and cafe).
A boatyard for servicing the yachts.
Hotels / Restaurants
Adequate car parking in support of the foregoing
Extensive landscaping so as to create a pleasant environment.
Figure 9.11 Proposed Layout of Marina at Timber Pond / Boat Basin

SAGARMALA: Master Plan for Chennai Port 9-23 Final Report
Development of Naval Berth North of Bharathi Dock
There is a requirement from India Navy to get additional berthing and repair facilities for their vessels.
It is proposed that an outer harbour to the Chennai port could be developed. The Navy berth can be
developed in the shelter of new breakwater extending northward from the existing eastern breakwater
of Bharathi Dock for a length of 700 m with a 140 m long protective arm at the northern tip. Naval berth
of 550 m length is proposed with backup area of 100 m width developed between the berth and
breakwater by reclamation.
The indicative layout plan of the Navy Berth is as shown in Figure 9.12.
Figure 9.12 Indicative Layout Plan for Development of Navy Berth north of Bharati Dock
The overall layout can be further refined once the explicit requirements from Navy are known.

SAGARMALA: Master Plan for Chennai Port 10-1 Final Report
10.0 SHELF OF NEW PROJECTS AND PHASING
As part of the Chennai Port Master Plan several projects have been identified which need to be taken
up in phased manner with the built up in traffic. The proposed phasing, capacity addition and the likely
investments are discussed in paragraphs below.
It may be noted that apart from these projects there could be several other projects which port would
be implementing as part of the routine operations and maintenance of the port facilities. Further the
phasing proposed is not cast in stone but could be reviewed periodically and revised based on the
economic scenario and demand for port at that particular point of time.
Ongoing Projects
The details of the projects which have already been awarded and development is ongoing are given
below in Table 10.1.
Table 10.1 Ongoing Projects
S. No. Project Name Capacity Addition (MTPA)
Investment Required
(INR in Crores)
Mode of Implementation
1. Laying of new railway track at west of western yard I and laying paving block loading Platform
- 13 Port’s Funds
2. Development of Coastal Terminal 1.1 80 Port's funds
Projects to be completed by Year 2020
The details of the projects which are envisaged to be completed by year 2020 are given in Table 10.2.
Table 10.2 Projects to be completed by Year 2020
S. No. Project Name Capacity Addition (MTPA)
Investment Required
(INR in Crores)
Mode of Implementation
1. Development of Bunker Berth at Bharathi Dock
1.0 44 Port's funds
2.
Development of Dry Dock at Timber Pond/Boat basin or Development of Marina
- 500 PPP
3. Strengthening of JD 4 & 6 berths - 10 Port's funds
4. Development of Paved Storage Yards at Chennai Port
- 54 Port’s funds

SAGARMALA: Master Plan for Chennai Port 10-2 Final Report
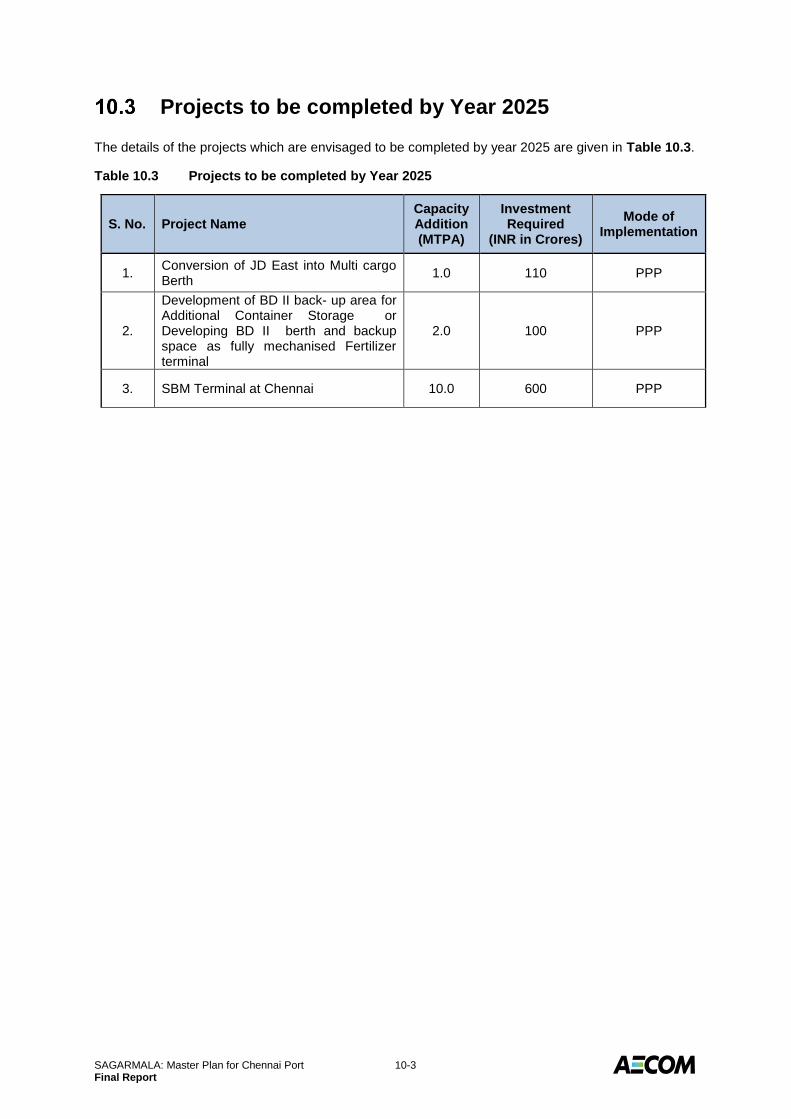
SAGARMALA: Master Plan for Chennai Port 10-3 Final Report
Projects to be completed by Year 2025
The details of the projects which are envisaged to be completed by year 2025 are given in Table 10.3.
Table 10.3 Projects to be completed by Year 2025
S. No. Project Name Capacity Addition (MTPA)
Investment Required
(INR in Crores)
Mode of Implementation
1. Conversion of JD East into Multi cargo Berth
1.0 110 PPP
2.
Development of BD II back- up area for Additional Container Storage or Developing BD II berth and backup space as fully mechanised Fertilizer terminal
2.0 100 PPP
3. SBM Terminal at Chennai 10.0 600 PPP

SAGARMALA: Master Plan for Chennai Port - 1 - Final Report
Appendix 1 - BCG Benchmarking Study
for Chennai Port Trust

Final Report
Project Unnati 113
5 Chennai Port Deep-dive
5.1 Port overview
One of the oldest ports in the country, the Chennai port is a legacy port located on the East Coast in Tamil Nadu,
India. The Chennai port has been officially operational since 1881, though maritime trade began much earlier in
1639 on the undeveloped shore. Most of the berths are owned and operated by the port- POL berths (BD1 and
BD3); general and liquid bulk (NQ); fertilizer and dry bulk (JD1 to JD6); general, RO-RO, liquid and passenger
berths (WQ1 to WQ4); only the container berths are on concession to private players PSA and DPW.
Figure 143: Berths and container terminals at Chennai port
Of late, profitability has been a major challenge for the Chennai port. Incurring losses since 2011, the Chennai
port suffered significant losses in 2014, amounting to more than Rs. 170 crores., However, there have been signs
of recovery with the port turning profitable in 2015.
Figure 144: Profitability trend of Chennai port
Note: Years considered are Financial Years i.e. April to MarchSource: Client data. BCG Analysis.
(40)
(180)
(111)
186
10462 44
134
(26)(36)
26
-200
-100
0
100
200
300
2014
-174
6
2013
18
2012
22
2011
68
Rs. crore
2010
211
2015
23
Operating prof it/loss
Non-operating prof it/loss

Final Report
Project Unnati 114
Chennai port’s operational expenditure (Opex) has increased by 1% in spite of fall in volumes. The increase in
Opex has mostly been driven by the increase in salary and wage expenses. Compared to most other major ports,
Chennai port has been able to control increase in operating expenditure.
Figure 145: Operational expense trend of Chennai port
The decline in traffic volume has been driven by the disappearance of iron ore and coal. Iron ore export was
banned in 2012, while coal was moved out of the city to Ennore because of environmental concerns in 2013. POL
& container cargo has also remained flat. As a result the overall traffic volume in the port has declined.
Figure 146: Volume and revenue trends of Chennai port
66 66 82 74
5261 49 33 39
35
2930
30 31 3130
64
339
368 357376 387
387
6055
57504146 48
0
100
200
300
400
500
600
533
580565
594
565
594
+1%
9 5
4
13 12
2012
INR cr
2010 2011 201520142013
12
Salaries & Wages
Stores
Off ice & Admin
Depreciation
Operation & Maintenance
Other expenditure
2329 30 30 28 30
13
14 13 13 1314
7
89
98
38
10
8
5
0
20
40
60
611
2010
2
1 56
2013
0
2014
51
2012
53
00
1
0
1
0
61
1
2011
Traffic
(in Mn MT)
53
2015
1
-3%
ContainerCoalOthers
Iron-oreEdible Oil POL
Iron-ore export
banned
Coal moved out to
Ennore from
Chennai
Operating
Revenue
(in Rs cr)
718 684 627 631 600 699
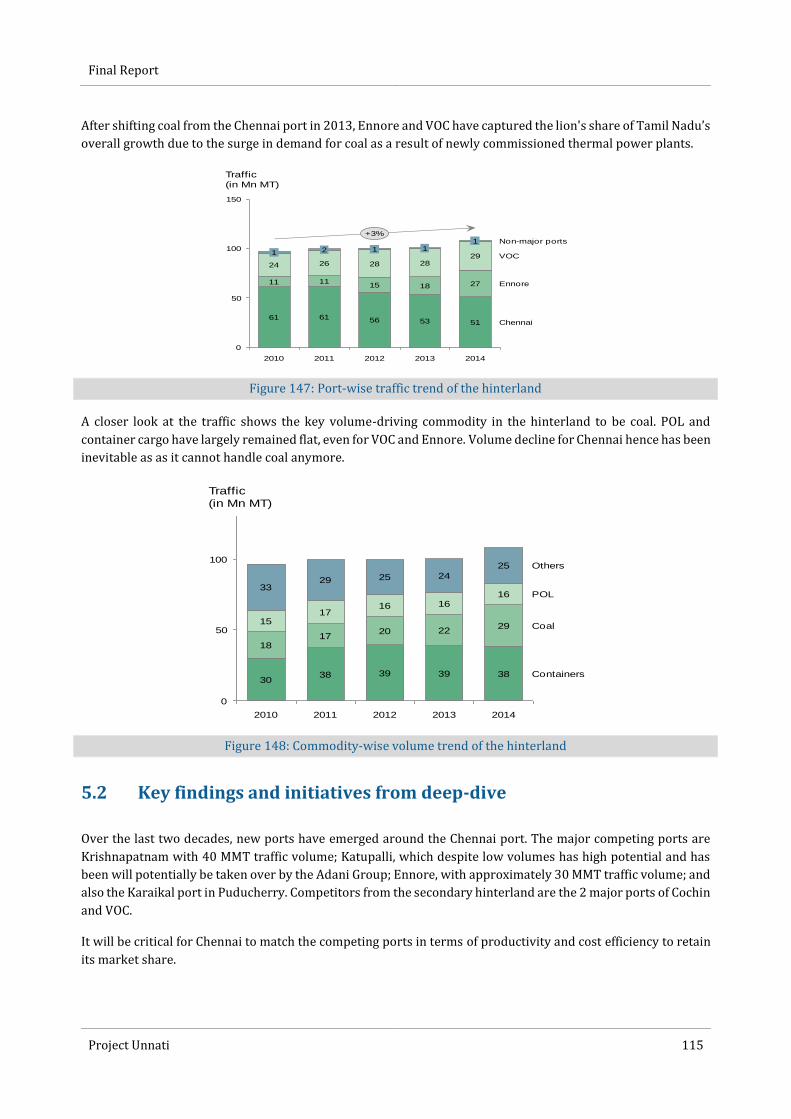
Final Report
Project Unnati 115
After shifting coal from the Chennai port in 2013, Ennore and VOC have captured the lion's share of Tamil Nadu’s
overall growth due to the surge in demand for coal as a result of newly commissioned thermal power plants.
Figure 147: Port-wise traffic trend of the hinterland
A closer look at the traffic shows the key volume-driving commodity in the hinterland to be coal. POL and
container cargo have largely remained flat, even for VOC and Ennore. Volume decline for Chennai hence has been
inevitable as as it cannot handle coal anymore.
Figure 148: Commodity-wise volume trend of the hinterland
5.2 Key findings and initiatives from deep-dive
Over the last two decades, new ports have emerged around the Chennai port. The major competing ports are
Krishnapatnam with 40 MMT traffic volume; Katupalli, which despite low volumes has high potential and has
been will potentially be taken over by the Adani Group; Ennore, with approximately 30 MMT traffic volume; and
also the Karaikal port in Puducherry. Competitors from the secondary hinterland are the 2 major ports of Cochin
and VOC.
It will be critical for Chennai to match the competing ports in terms of productivity and cost efficiency to retain
its market share.
50
100
0
150
2014
28
1
+3%
20112010
Traffic
(in Mn MT)
2012
Non-major ports
VOC
Chennai
Ennore
5361
29
11
28
2013
6151
1511
2
27
24 26
1
1
18
56
1
100
0
50
39
29
29
38 39
25
38
33
17
25
30
20
1616 POL
15
18
24
2012
17
Traffic
(in Mn MT)
2013
Coal
20112010 2014
Others
Containers
16
22
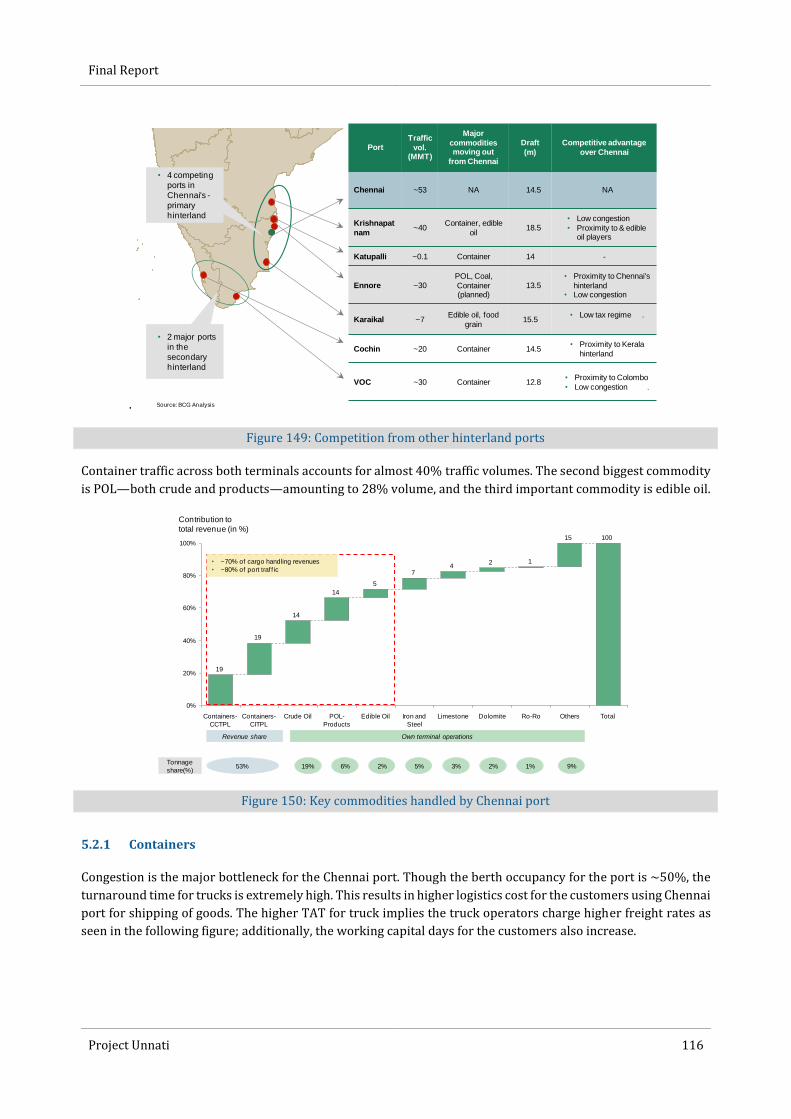
Final Report
Project Unnati 116
.
Figure 149: Competition from other hinterland ports
Container traffic across both terminals accounts for almost 40% traffic volumes. The second biggest commodity
is POL—both crude and products—amounting to 28% volume, and the third important commodity is edible oil.
Figure 150: Key commodities handled by Chennai port
5.2.1 Containers
Congestion is the major bottleneck for the Chennai port. Though the berth occupancy for the port is ~50%, the
turnaround time for trucks is extremely high. This results in higher logistics cost for the customers using Chennai
port for shipping of goods. The higher TAT for truck implies the truck operators charge higher freight rates as
seen in the following figure; additionally, the working capital days for the customers also increase.
Source: BCG Analysis
Port
Traffic
vol.(MMT)
Major
commodities moving out
from Chennai
Draft
(m)
Competitive advantage
over Chennai
Chennai ~53 NA 14.5 NA
Krishnapat
nam~40
Container, edible
oil18.5
• Low congestion
• Proximity to & edible oil players
Katupalli ~0.1 Container 14 -
Ennore ~30
POL, Coal,
Container (planned)
13.5
• Proximity to Chennai's
hinterland• Low congestion
Karaikal ~7Edible oil, food
grain15.5
• Low tax regime .
Cochin ~20 Container 14.5• Proximity to Kerala
hinterland
VOC ~30 Container 12.8• Proximity to Colombo
• Low congestion .
• 2 major ports
in the
secondary
hinterland
• 4 competing
ports in
Chennai's -
primary
hinterland
10015
124
7
5
14
14
19
19
0%
20%
40%
60%
80%
100%
Contribution to
total revenue (in %)
Ro-Ro TotalOthersDolomiteLimestoneIron and
Steel
Edible OilPOL-
Products
Crude OilContainers-
CITPL
Containers-
CCTPL
Revenue share Own terminal operations
Tonnage
share(%)53% 19% 2% 1%2% 5% 3%6%
• ~70% of cargo handling revenues
• ~80% of port traf f ic
9%
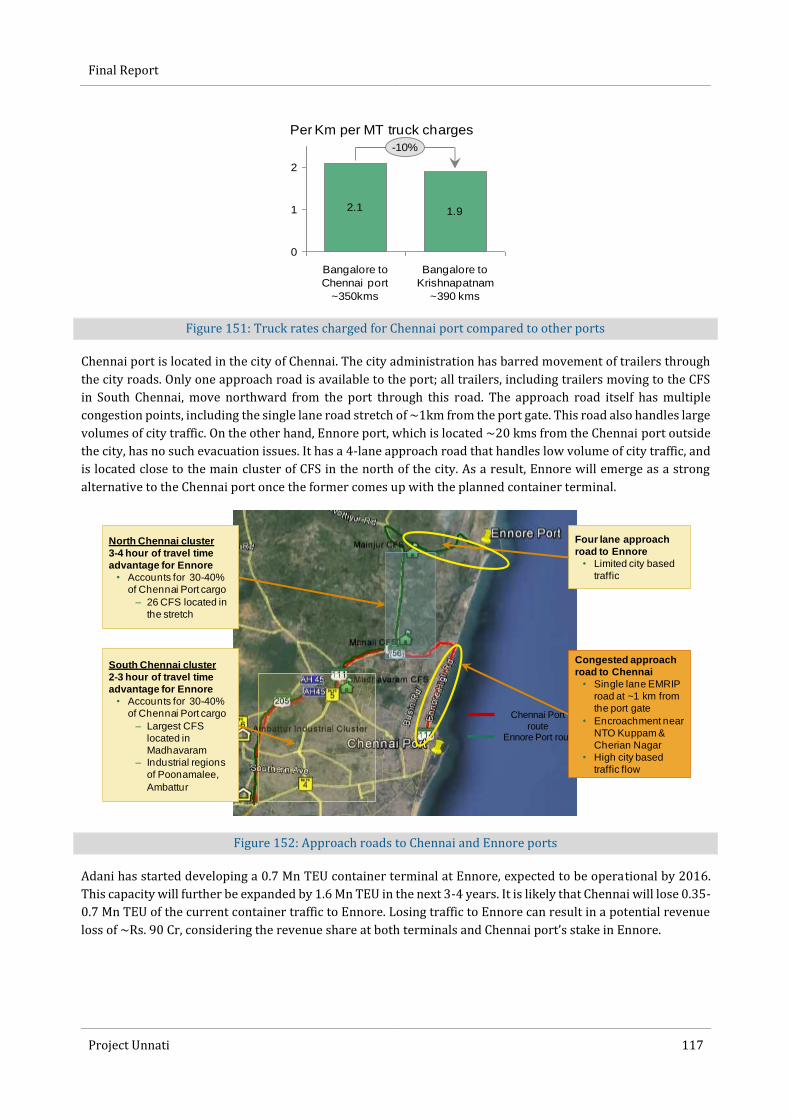
Final Report
Project Unnati 117
Figure 151: Truck rates charged for Chennai port compared to other ports
Chennai port is located in the city of Chennai. The city administration has barred movement of trailers through
the city roads. Only one approach road is available to the port; all trailers, including trailers moving to the CFS
in South Chennai, move northward from the port through this road. The approach road itself has multiple
congestion points, including the single lane road stretch of ~1km from the port gate. This road also handles large
volumes of city traffic. On the other hand, Ennore port, which is located ~20 kms from the Chennai port outside
the city, has no such evacuation issues. It has a 4-lane approach road that handles low volume of city traffic, and
is located close to the main cluster of CFS in the north of the city. As a result, Ennore will emerge as a strong
alternative to the Chennai port once the former comes up with the planned container terminal.
Figure 152: Approach roads to Chennai and Ennore ports
Adani has started developing a 0.7 Mn TEU container terminal at Ennore, expected to be operational by 2016.
This capacity will further be expanded by 1.6 Mn TEU in the next 3-4 years. It is likely that Chennai will lose 0.35-
0.7 Mn TEU of the current container traffic to Ennore. Losing traffic to Ennore can result in a potential revenue
loss of ~Rs. 90 Cr, considering the revenue share at both terminals and Chennai port’s stake in Ennore.
2.1 1.9
0
1
2
Per Km per MT truck charges
-10%
Bangalore to
Krishnapatnam
~390 kms
Bangalore to
Chennai port
~350kms
Chennai Port
routeEnnore Port route
North Chennai cluster
3-4 hour of travel time
advantage for Ennore
• Accounts for 30-40%
of Chennai Port cargo
– 26 CFS located in
the stretch
South Chennai cluster
2-3 hour of travel time
advantage for Ennore
• Accounts for 30-40%
of Chennai Port cargo
– Largest CFS
located in
Madhavaram
– Industrial regions
of Poonamalee,
Ambattur
Congested approach
road to Chennai
• Single lane EMRIP
road at ~1 km from
the port gate
• Encroachment near
NTO Kuppam &
Cherian Nagar
• High city based
traffic flow
Four lane approach
road to Ennore
• Limited city based
traffic
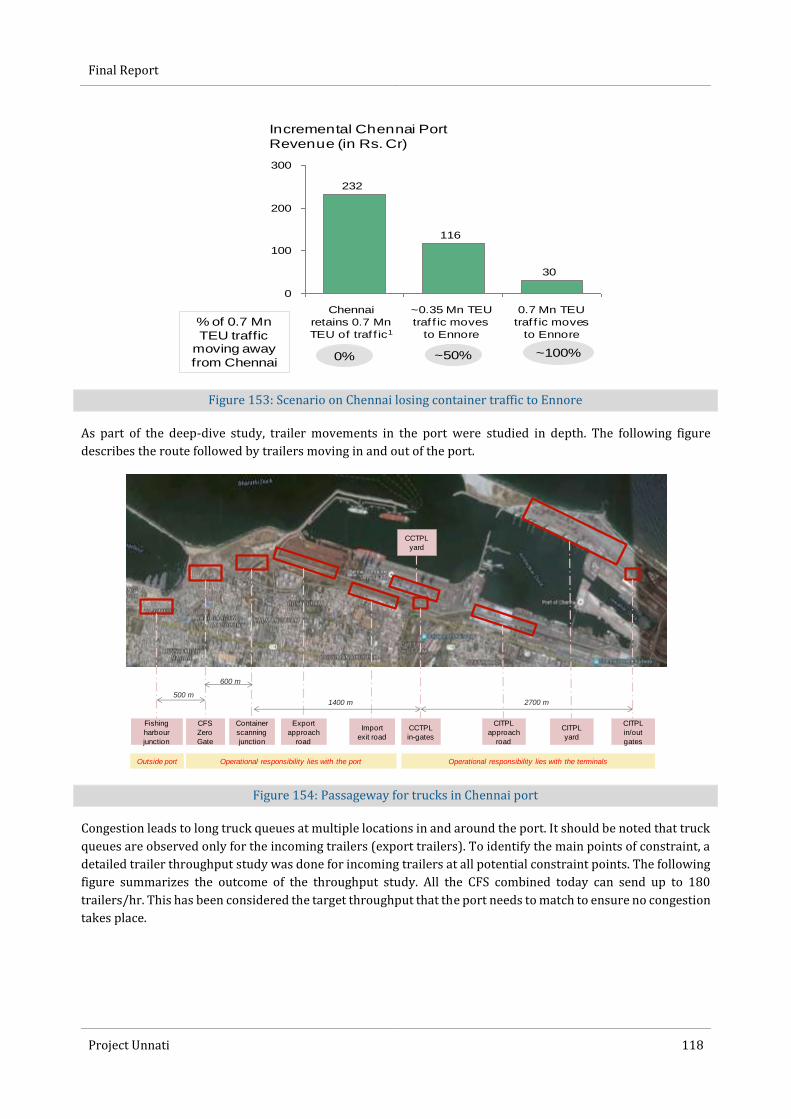
Final Report
Project Unnati 118
Figure 153: Scenario on Chennai losing container traffic to Ennore
As part of the deep-dive study, trailer movements in the port were studied in depth. The following figure
describes the route followed by trailers moving in and out of the port.
Figure 154: Passageway for trucks in Chennai port
Congestion leads to long truck queues at multiple locations in and around the port. It should be noted that truck
queues are observed only for the incoming trailers (export trailers). To identify the main points of constraint, a
detailed trailer throughput study was done for incoming trailers at all potential constraint points. The following
figure summarizes the outcome of the throughput study. All the CFS combined today can send up to 180
trailers/hr. This has been considered the target throughput that the port needs to match to ensure no congestion
takes place.
30
116
232
0
100
200
300
Incremental Chennai Port
Revenue (in Rs. Cr)
0.7 Mn TEU
traf f ic moves
to Ennore
~0.35 Mn TEU
traf f ic moves
to Ennore
Chennai
retains 0.7 Mn
TEU of traf f ic1
0% ~50% ~100%
% of 0.7 Mn
TEU traffic moving away
from Chennai
CFS
Zero
Gate
Fishing
harbour
junction
Export
approach
road
Import
exit road
CCTPL
in-gates
CCTPL
yard
CITPL
approach
road
CITPL
yard
CITPL
in/out
gates
Container
scanning
junction
500 m1400 m
600 m
2700 m
Operational responsibility lies with the terminalsOperational responsibility lies with the portOutside port

Final Report
Project Unnati 119
Figure 155: Truck throughput analysis at key congestion points
5.2.1.1 Yard Analysis
5.2.1.1.1 Initiative: CHPT 1.1 Monitor and incentivize yard productivity of private terminals
Initiative Overview
Evacuation is a major challenge for the Chennai port with large queues of trailers from the container terminal
gates. The throughput analysis of trailers from CFS to the container terminals (CCTPL and CITPL), clearly point
to yard productivity as the key constraint on evacuation at the Chennai port. Yards of the two terminals process
~80 trailers per hour on an average, which is often lower than the trailer inflow rate. This results in trailers
queuing up at the terminal gates. Improving yard productivity is critical for solving the congestion issue at the
port.
Key Findings
The yard throughput (measured as the number of export TEUs moving in through the terminal gate) is inversely
related to berth productivity (measured as the number of TEUs handled at the berths). When a large vessel
berths in the terminal, the resources get deployed in the quay side to load/unload containers from the vessel.
This results in shortage of resources on the yard side and, hence, the number of containers moved from the
export trailers to the yard drops significantly. To cope with this, the terminals proceed to close the export gates
to stop further inflow of export trailers to the container yard. This phenomenon can be corroborated from the
fact that high berth productivity periods coincide with long duration of gate closures. The following figure
correlates berth and yard productivity of CCTPL; similar behavior is also observed for CITPL yard.
80
100
120
140
120
180
0
50
100
150
200
Fishing harbour junctionCFS/CWC/
Factory
180
Avg. Throughput
(in trucks per hour)1
YardGate ProcessesContainer
scanning junction
Gate zero
1. The yard throughput has been calculated based on RTGC productivity observed at both the terminals with 1 vessel at the berth on 4 different daysSource: BCG Analysis
B A
Outside port area Under port control Under terminal control
4 days of
observation
of RTGC
moves
Based on
port
information
Based on 2
hours of
observation
Based on 2
hours of
observation
Based on 1
hour of
observation
Based on
12 hours of
time
studies
Target

Final Report
Project Unnati 120
Figure 156: Relation between berth throughput, gate throughput and gate closures
The higher duration of gate closures during periods of high berth productivity indicate a shortage of equipment
at the disposal of the terminal operators. The following figure analyses adequacy of RTGCs in CCTPL. As the ratio
of QC to RTGC is similar for both terminals, the following analysis holds true for CITPL as well.
Figure 157: Balance analysis on RTGC availability for yard operations
There are 8 QCs in CCTPL that can operate at a productivity of 26 moves/hr. In a scenario where multiple vessels
are berthing in the terminal and all 8 QCs are operational simultaneously, the berth productivity goes up to ~208
moves per hour. The yard of CCTPL has 21 RTGCs, which run at an average productivity rate of 10 moves/hr.
Thus all RTGCs cumulatively account for ~210 moves per hour. Hence, in a scenario where 8 QCs are operational,
all RTGCs would need to get deployed at the quay side. This clearly points to lack of RTGCs to handle yard
operations.
In an average scenario where one vessel has berthed at the terminal, 6-7 RTCGs get employed for moving
containers from the export trailers to the yard. The RTGC productivity analysis (as shown in the figure below)
takes into account this average scenario.
0
1,000
2,000
3,000
Throughput (in TEU)
2522201811105321
June '15
28764 8 9 12 13 19 21 23 24 26 2714 15 16 17
1. The correlation factor was found to be -0.47. Data used here is from the DP world terminal.2. Data for month of June only consideredSource: BCG Analysis. Client data
Berth
Gate
Gate
closure
duration
(in
hours)
0 4 5 0 5 0 0 0 1 10 11 0 0 0 5 0 3 3 0 5 9 5 4 150 2 4 0
Source: BCG analysis. Client data.
8 QCs
X
26 moves/hr
=
208 moves/hr
Be
rth
2B
ert
h 1
Berth Yard Gate intake
21 RTGCs
=
10 moves/hr
/
208 moves/hr
8 QCs
0 RTGCs
x
10 moves/hr
/
0 moves/hr
21 RTGCs
DPW example
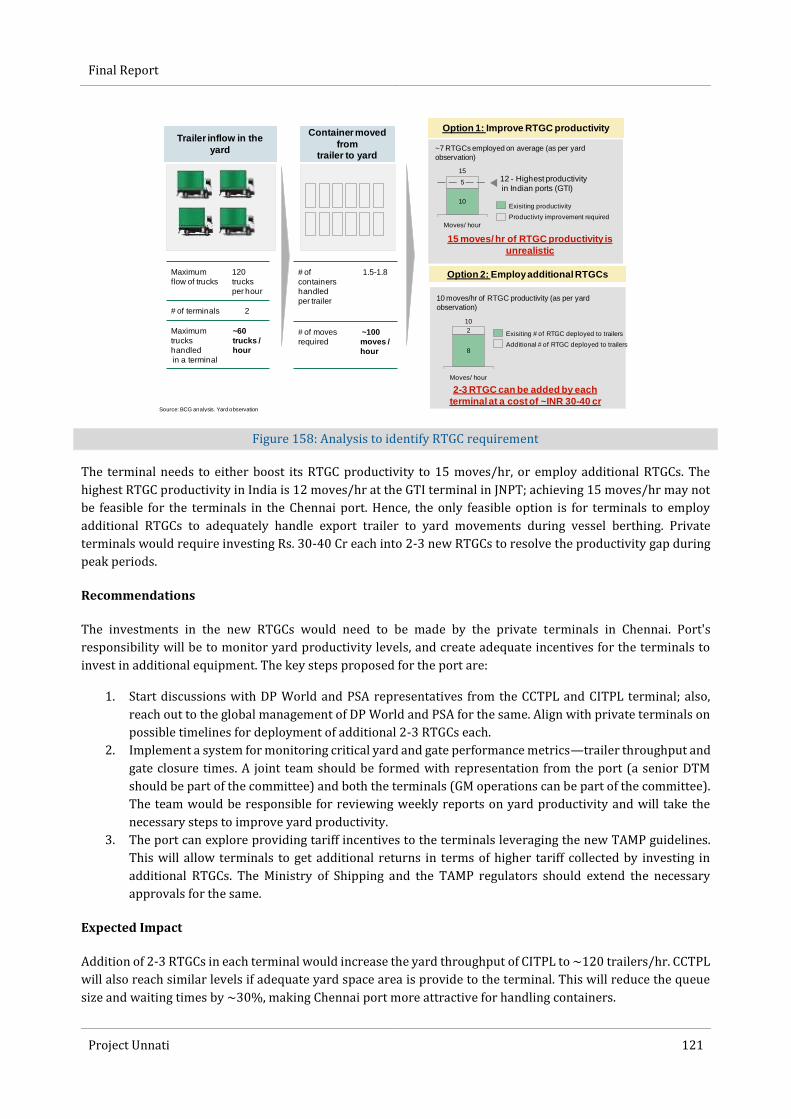
Final Report
Project Unnati 121
Figure 158: Analysis to identify RTGC requirement
The terminal needs to either boost its RTGC productivity to 15 moves/hr, or employ additional RTGCs. The
highest RTGC productivity in India is 12 moves/hr at the GTI terminal in JNPT; achieving 15 moves/hr may not
be feasible for the terminals in the Chennai port. Hence, the only feasible option is for terminals to employ
additional RTGCs to adequately handle export trailer to yard movements during vessel berthing. Private
terminals would require investing Rs. 30-40 Cr each into 2-3 new RTGCs to resolve the productivity gap during
peak periods.
Recommendations
The investments in the new RTGCs would need to be made by the private terminals in Chennai. Port's
responsibility will be to monitor yard productivity levels, and create adequate incentives for the terminals to
invest in additional equipment. The key steps proposed for the port are:
1. Start discussions with DP World and PSA representatives from the CCTPL and CITPL terminal; also,
reach out to the global management of DP World and PSA for the same. Align with private terminals on
possible timelines for deployment of additional 2-3 RTGCs each.
2. Implement a system for monitoring critical yard and gate performance metrics—trailer throughput and
gate closure times. A joint team should be formed with representation from the port (a senior DTM
should be part of the committee) and both the terminals (GM operations can be part of the committee).
The team would be responsible for reviewing weekly reports on yard productivity and will take the
necessary steps to improve yard productivity.
3. The port can explore providing tariff incentives to the terminals leveraging the new TAMP guidelines.
This will allow terminals to get additional returns in terms of higher tariff collected by investing in
additional RTGCs. The Ministry of Shipping and the TAMP regulators should extend the necessary
approvals for the same.
Expected Impact
Addition of 2-3 RTGCs in each terminal would increase the yard throughput of CITPL to ~120 trailers/hr. CCTPL
will also reach similar levels if adequate yard space area is provide to the terminal. This will reduce the queue
size and waiting times by ~30%, making Chennai port more attractive for handling containers.
Source: BCG analysis. Yard observation
Option 1: Improve RTGC productivity
Option 2: Employ additional RTGCs
10
5
15
12 - Highest productivity
in Indian ports (GTI)
Moves/ hour
Productivty improvement required
Exisiting productivity
~7 RTGCs employed on average (as per yard
observation)
15 moves/ hr of RTGC productivity is
unrealistic
8
2
10
Moves/ hour
Exisiting # of RTGC deployed to trailers
Additional # of RTGC deployed to trailers
10 moves/hr of RTGC productivity (as per yard
observation)
2-3 RTGC can be added by each
terminal at a cost of ~INR 30-40 cr
Maximum
flow of trucks
120
trucks
per hour
# of terminals 2
Maximum
trucks
handled
in a terminal
~60
trucks /
hour
Trailer inflow in the
yard
Container moved
from trailer to yard
# of
containers
handled
per trailer
1.5-1.8
# of moves
required
~100
moves /
hour
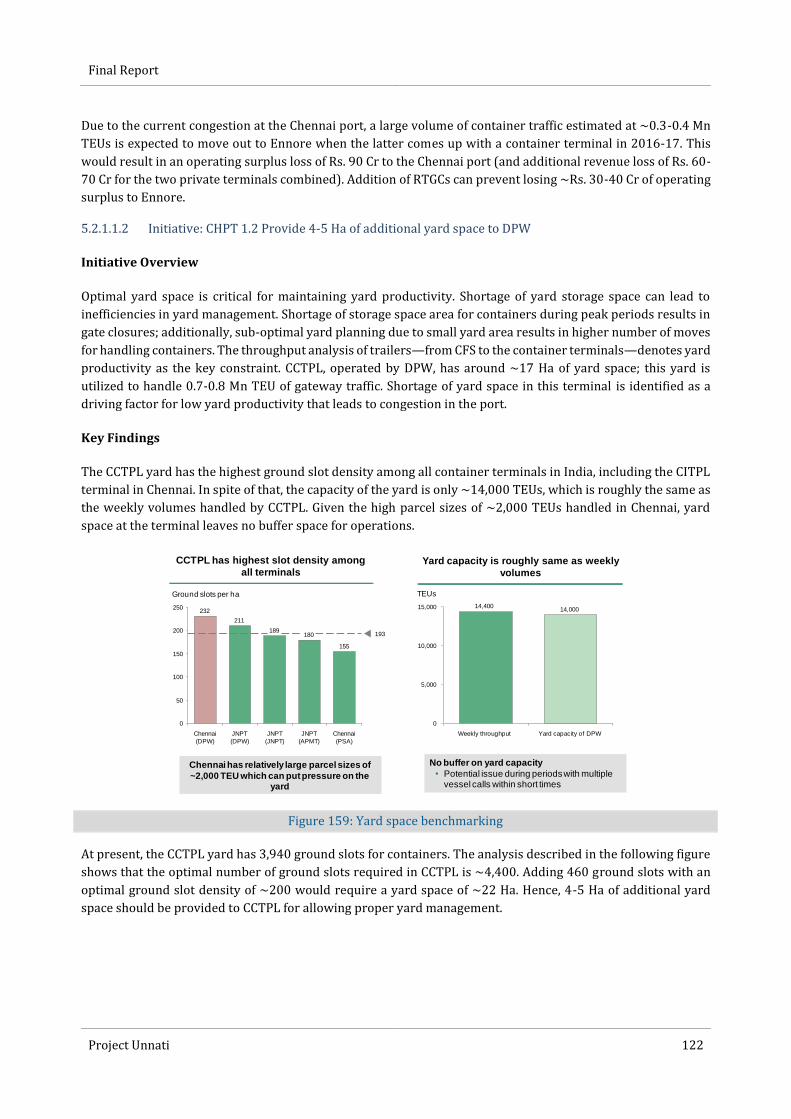
Final Report
Project Unnati 122
Due to the current congestion at the Chennai port, a large volume of container traffic estimated at ~0.3-0.4 Mn
TEUs is expected to move out to Ennore when the latter comes up with a container terminal in 2016-17. This
would result in an operating surplus loss of Rs. 90 Cr to the Chennai port (and additional revenue loss of Rs. 60-
70 Cr for the two private terminals combined). Addition of RTGCs can prevent losing ~Rs. 30-40 Cr of operating
surplus to Ennore.
5.2.1.1.2 Initiative: CHPT 1.2 Provide 4-5 Ha of additional yard space to DPW
Initiative Overview
Optimal yard space is critical for maintaining yard productivity. Shortage of yard storage space can lead to
inefficiencies in yard management. Shortage of storage space area for containers during peak periods results in
gate closures; additionally, sub-optimal yard planning due to small yard area results in higher number of moves
for handling containers. The throughput analysis of trailers—from CFS to the container terminals—denotes yard
productivity as the key constraint. CCTPL, operated by DPW, has around ~17 Ha of yard space; this yard is
utilized to handle 0.7-0.8 Mn TEU of gateway traffic. Shortage of yard space in this terminal is identified as a
driving factor for low yard productivity that leads to congestion in the port.
Key Findings
The CCTPL yard has the highest ground slot density among all container terminals in India, including the CITPL
terminal in Chennai. In spite of that, the capacity of the yard is only ~14,000 TEUs, which is roughly the same as
the weekly volumes handled by CCTPL. Given the high parcel sizes of ~2,000 TEUs handled in Chennai, yard
space at the terminal leaves no buffer space for operations.
Figure 159: Yard space benchmarking
At present, the CCTPL yard has 3,940 ground slots for containers. The analysis described in the following figure
shows that the optimal number of ground slots required in CCTPL is ~4,400. Adding 460 ground slots with an
optimal ground slot density of ~200 would require a yard space of ~22 Ha. Hence, 4-5 Ha of additional yard
space should be provided to CCTPL for allowing proper yard management.
Yard capacity is roughly same as weekly
volumes
CCTPL has highest slot density among
all terminals
155
180189
211
232
0
50
100
150
200
250
Ground slots per ha
JNPT
(DPW)
193
Chennai
(PSA)
JNPT
(APMT)
JNPT
(JNPT)
Chennai
(DPW)
Chennai has relatively large parcel sizes of
~2,000 TEU which can put pressure on the yard
14,00014,400
0
5,000
10,000
15,000
Weekly throughput
TEUs
Yard capacity of DPW
No buffer on yard capacity
• Potential issue during periods with multiple vessel calls within short times
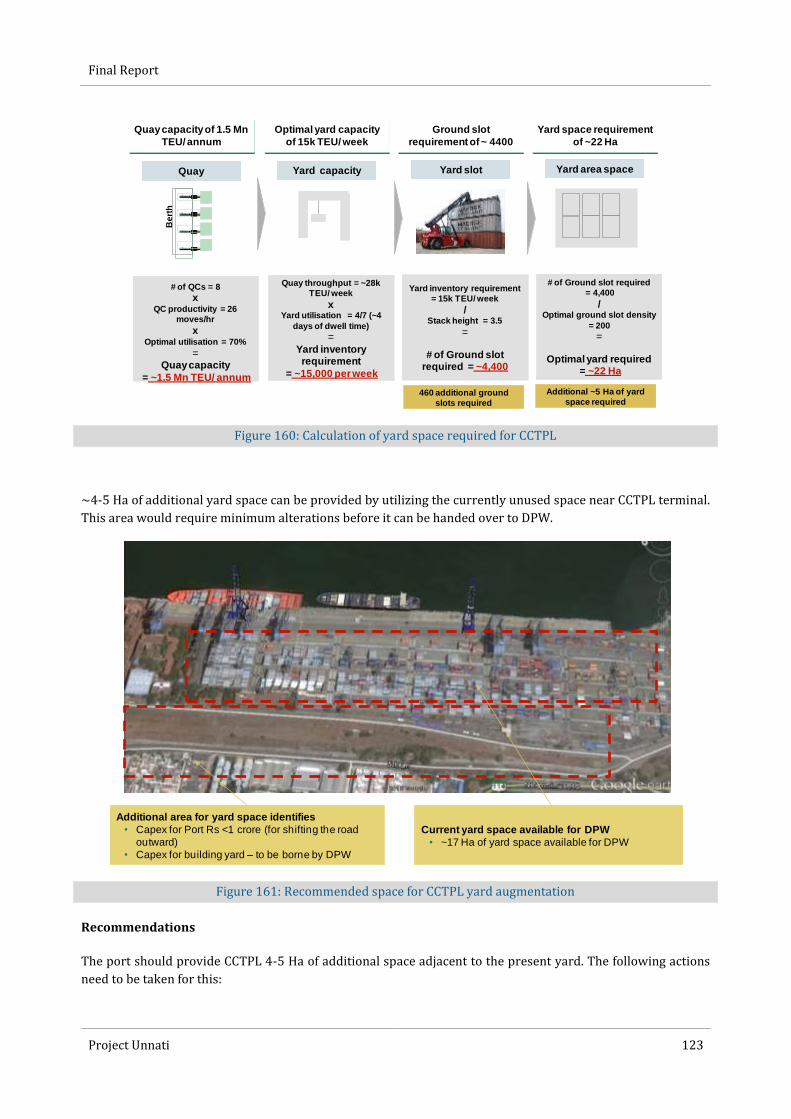
Final Report
Project Unnati 123
Figure 160: Calculation of yard space required for CCTPL
~4-5 Ha of additional yard space can be provided by utilizing the currently unused space near CCTPL terminal.
This area would require minimum alterations before it can be handed over to DPW.
Figure 161: Recommended space for CCTPL yard augmentation
Recommendations
The port should provide CCTPL 4-5 Ha of additional space adjacent to the present yard. The following actions
need to be taken for this:
Quay capacity of 1.5 Mn
TEU/ annum
Be
rth
Quay
# of QCs = 8
xQC productivity = 26
moves/hr
xOptimal utilisation = 70%
=Quay capacity
= ~1.5 Mn TEU/ annum
Optimal yard capacity
of 15k TEU/ week
Yard capacity
Quay throughput = ~28k
TEU/ week
xYard utilisation = 4/7 (~4
days of dwell time)
=
Yard inventory requirement
= ~15,000 per week
Ground slot
requirement of ~ 4400
Yard slot
Yard inventory requirement
= 15k TEU/ week
/Stack height = 3.5
=
# of Ground slot required = ~4,400
Yard space requirement
of ~22 Ha
Yard area space
# of Ground slot required
= 4,400
/Optimal ground slot density
= 200
=
Optimal yard required= ~22 Ha
460 additional ground
slots required
Additional ~5 Ha of yard
space required
Additional area for yard space identifies
• Capex for Port Rs <1 crore (for shifting the road
outward)
• Capex for building yard – to be borne by DPW
Current yard space available for DPW
• ~17 Ha of yard space available for DPW

Final Report
Project Unnati 124
1. Finalize on the mode of transfer of additional land to the terminal. There are two potential options for
awarding additional space—the first option involves revising the concession agreement of CCTPL to
include awarding additional space to DP World. Redrafting of concession agreement will take time and
is a long term solution. To expedite the process of awarding additional space to CCTPL, we suggest an
alternate option—CCTPL currently holds ~3 Ha of land near the customs area inside the port. This land
is not contiguous with the current CCTPL yard, and can be swapped with an equal area of land near the
terminal as suggested in the figure above. This can be completed without altering the concession
agreement.
2. Secure commitment from the terminal to invest in developing the yard in the additional space, and
guarantee usage of the space for container storage. The port can also negotiate higher gate productivity
targets (and higher minimum guaranteed volume) in case a new agreement is drafted.
3. Clear existing structures in the land to be handed over to CCTPL, and develop new terminal boundaries.
Explore if a new road needs to be developed around the CCTPL terminal.
Expected Impact
Additional yard space for CCTPL will ease pressure on yard management for the terminal during peak periods.
It will also provide buffer space for the terminal, allowing flexibility in yard operations. With the new space,
CCTPL's yard capacity would match the 1.5 Mn TEU capacity of its berths.
Due to the current congestion in the Chennai port, a large volume of container traffic estimated at ~0.3-0.4 Mn
TEU is expected to move out to Ennore when its container terminal becomes operational in 2016-17. This would
result in an operating surplus loss of Rs. 90 Cr to the Chennai port (and additional revenue loss of Rs. 60-70 Cr
for the two private terminals combined). Addition of storage space in CCTPL can prevent losing ~Rs. 15-20 Cr
of operating surplus to Ennore.
5.2.1.2 Gate analysis
Truck turnaround times inside the port can be substantially improved by streamlining the gate processes at the
terminal gates. In the course of the study, detailed time analysis of the gate processes for both the container
terminals were carried out. This involved recording observations of truck processing times for all activities at
the gate, and identifying processes that record highest processing times.
5.2.1.2.1 Initiative: CHPT 1.3 Frontload pre-gate processing and entry of trailer details to CFS
Initiative Overview
The throughput analysis of trailers—from the CFS to the terminal—identified terminal gate processes as the
second largest constraint to evacuation. The current throughput potential for the terminal gates is observed to
be ~100 trailers/hour (for export trailers for both the terminals combined). If the yard productivity improves
to the targeted levels, the gate processes would become the new constraint. To realize the benefit of
improvement in yard productivity, the gate throughput must also improve to >120 trailers/hr levels.
Key Findings
Observations of processing times at the terminal gates reveal that, on an average, it takes ~365 seconds for
completion of all gate processes for each trailer. The split of the processing time across different activities at the
gate reveal two activities—surveyor verification and gate checker processing take ~240 seconds for completion.
The following figure details out the gate processing times:

Final Report
Project Unnati 125
Figure 162: Truck flow throughput analysis
As per the current process during the pre-gate check, the gate checker positioned at the terminal gate needs to
enter multiple fields of information in the system. The snapshot of the system used in CCTPL is provided in the
following figure. The information fields such as ISO code, proof of delivery, seal number, shipping line name, and
the vessel specifications are entered by the gate checker. This requires an average time of ~120 seconds. The
surveyor is also required to record vehicle number, seal number, etc. At present, the surveyor writes it down in
a paper form. The following figure describes these activities in detail:
Figure 163: Activities to be frontloaded to CFS
1. Numbers have been normalized based on 2014-15 traffic figures at PSA and DPW terminals to arrive at the average processing timesNote: Based on time studies conducted at DPW and PSA export gates (~12 hours). No. of trucks observed: 21 at CCTPL and 23 at CITPLSource: BCG Analysis
365120
30
50
30
120
105
0
100
200
300
400
Weighted average processing
time (in seconds)1
Total gate
lead time
Gate checker
processing
Drive to gateCustoms
processes
Drive to
customs
Surveyor
verif ication
document
handover
to surveyor
Truck stop
at surveyor
3
1
Room for automation
and f rontloading of
key processes to CFS
Frontloading of key
processes to CFS
Insuf f icient customs
of f icials hamper dedicated
kiosks at each gate
Processing stagesIntermediate time lost
2
Eliminating manual data entry at the
surveyor can save another 25%
Vehicle number and seal number are being
entered manually by the surveyor
The same should be frontloaded to CFS
• Can be enforced by implementing fines on trucks that don't comply
• The checks can be done at the zero gate itself
120 90
-25%
Processing time
(before)Processing time
(af ter)
Enforcing pre-gate of trucks at CFS's
can reduce the gate lead time by ~30%1
CFS's have all the information necessary to
complete the pre-gate
• Major data-fields entered
– ISO code, POD, Seal number and Shipping
line information
1. Based on observation of 44 trucks-21 trucks at CCTPL and 23 trucks at CITPL. More than 70% of the trucks get the pre-gate done at the terminal gates2. Shows the CITPL pre-gate form. CCTPL pre-gate form also requires similar details Source: BCG Analysis
Pre-advice form2
120 85-29%
Checker processing
time (before)Checker processing
time (af ter)
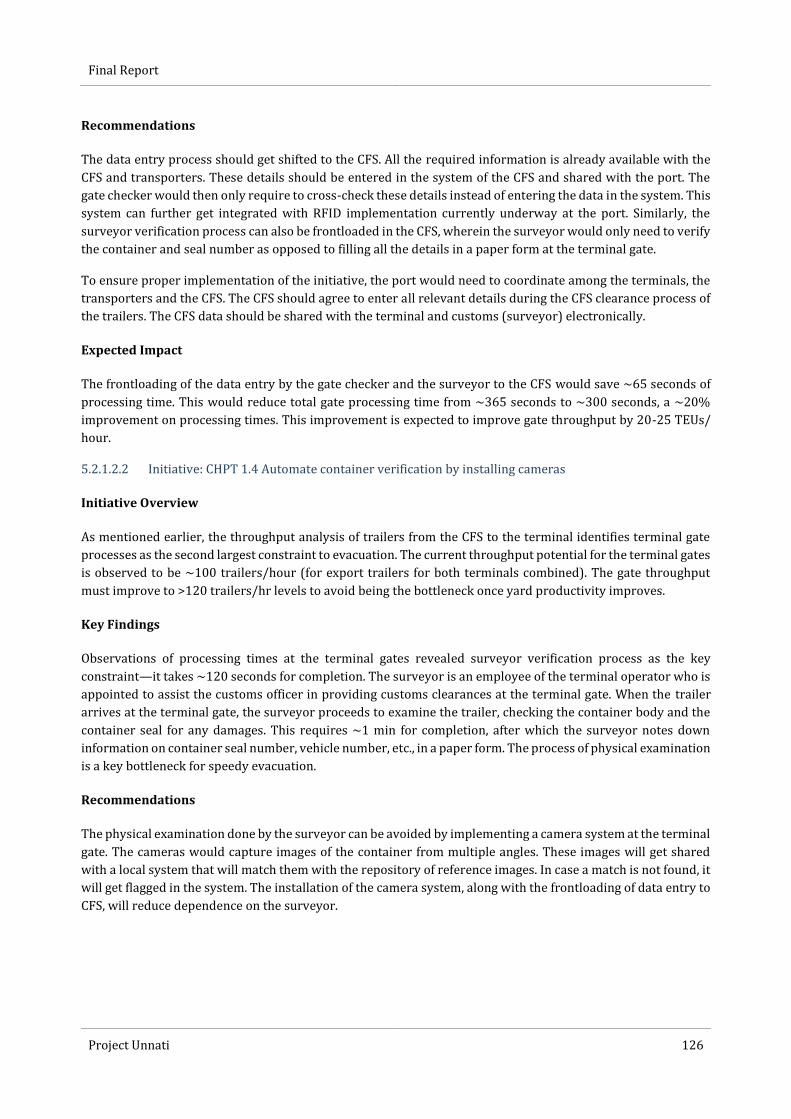
Final Report
Project Unnati 126
Recommendations
The data entry process should get shifted to the CFS. All the required information is already available with the
CFS and transporters. These details should be entered in the system of the CFS and shared with the port. The
gate checker would then only require to cross-check these details instead of entering the data in the system. This
system can further get integrated with RFID implementation currently underway at the port. Similarly, the
surveyor verification process can also be frontloaded in the CFS, wherein the surveyor would only need to verify
the container and seal number as opposed to filling all the details in a paper form at the terminal gate.
To ensure proper implementation of the initiative, the port would need to coordinate among the terminals, the
transporters and the CFS. The CFS should agree to enter all relevant details during the CFS clearance process of
the trailers. The CFS data should be shared with the terminal and customs (surveyor) electronically.
Expected Impact
The frontloading of the data entry by the gate checker and the surveyor to the CFS would save ~65 seconds of
processing time. This would reduce total gate processing time from ~365 seconds to ~300 seconds, a ~20%
improvement on processing times. This improvement is expected to improve gate throughput by 20-25 TEUs/
hour.
5.2.1.2.2 Initiative: CHPT 1.4 Automate container verification by installing cameras
Initiative Overview
As mentioned earlier, the throughput analysis of trailers from the CFS to the terminal identifies terminal gate
processes as the second largest constraint to evacuation. The current throughput potential for the terminal gates
is observed to be ~100 trailers/hour (for export trailers for both terminals combined). The gate throughput
must improve to >120 trailers/hr levels to avoid being the bottleneck once yard productivity improves.
Key Findings
Observations of processing times at the terminal gates revealed surveyor verification process as the key
constraint—it takes ~120 seconds for completion. The surveyor is an employee of the terminal operator who is
appointed to assist the customs officer in providing customs clearances at the terminal gate. When the trailer
arrives at the terminal gate, the surveyor proceeds to examine the trailer, checking the container body and the
container seal for any damages. This requires ~1 min for completion, after which the surveyor notes down
information on container seal number, vehicle number, etc., in a paper form. The process of physical examination
is a key bottleneck for speedy evacuation.
Recommendations
The physical examination done by the surveyor can be avoided by implementing a camera system at the terminal
gate. The cameras would capture images of the container from multiple angles. These images will get shared
with a local system that will match them with the repository of reference images. In case a match is not found, it
will get flagged in the system. The installation of the camera system, along with the frontloading of data entry to
CFS, will reduce dependence on the surveyor.
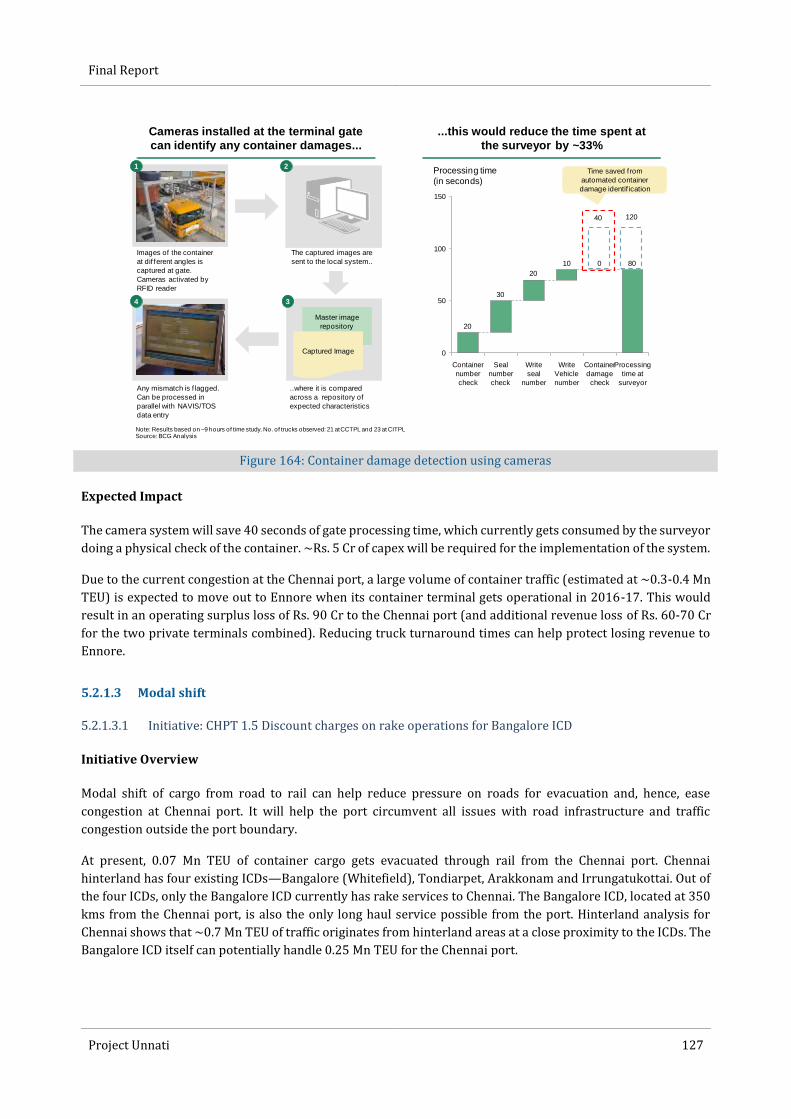
Final Report
Project Unnati 127
Figure 164: Container damage detection using cameras
Expected Impact
The camera system will save 40 seconds of gate processing time, which currently gets consumed by the surveyor
doing a physical check of the container. ~Rs. 5 Cr of capex will be required for the implementation of the system.
Due to the current congestion at the Chennai port, a large volume of container traffic (estimated at ~0.3-0.4 Mn
TEU) is expected to move out to Ennore when its container terminal gets operational in 2016-17. This would
result in an operating surplus loss of Rs. 90 Cr to the Chennai port (and additional revenue loss of Rs. 60-70 Cr
for the two private terminals combined). Reducing truck turnaround times can help protect losing revenue to
Ennore.
5.2.1.3 Modal shift
5.2.1.3.1 Initiative: CHPT 1.5 Discount charges on rake operations for Bangalore ICD
Initiative Overview
Modal shift of cargo from road to rail can help reduce pressure on roads for evacuation and, hence, ease
congestion at Chennai port. It will help the port circumvent all issues with road infrastructure and traffic
congestion outside the port boundary.
At present, 0.07 Mn TEU of container cargo gets evacuated through rail from the Chennai port. Chennai
hinterland has four existing ICDs—Bangalore (Whitefield), Tondiarpet, Arakkonam and Irrungatukottai. Out of
the four ICDs, only the Bangalore ICD currently has rake services to Chennai. The Bangalore ICD, located at 350
kms from the Chennai port, is also the only long haul service possible from the port. Hinterland analysis for
Chennai shows that ~0.7 Mn TEU of traffic originates from hinterland areas at a close proximity to the ICDs. The
Bangalore ICD itself can potentially handle 0.25 Mn TEU for the Chennai port.
Cameras installed at the terminal gate
can identify any container damages...
...this would reduce the time spent at
the surveyor by ~33%
Note: Results based on ~9 hours of time study. No. of trucks observed: 21 at CCTPL and 23 at CITPLSource: BCG Analysis
80010
20
30
20
0
50
100
150
Processing time
(in seconds)
Processing
time at
surveyor
Container
damage
check
Write
Vehicle
number
Write
seal
number
Seal
number
check
Container
number
check
40 120
Time saved f rom
automated container
damage identif ication
1 2
Master image
repository
Captured Image
3
Images of the container
at dif ferent angles is
captured at gate.
Cameras activated by
RFID reader
The captured images are
sent to the local system..
..where it is compared
across a repository of
expected characteristics
Any mismatch is f lagged.
Can be processed in
parallel with NAVIS/TOS
data entry
4

Final Report
Project Unnati 128
Figure 165: Volume potential for ICDs near Chennai
Key Findings
The logistics cost for moving containers through rail from the Bangalore ICD is higher than the cost of moving
containers through road by ~Rs. 2,500 per TEU. This is in spite of the fact that rail freight of Rs. 9,000 is lower
than the road freight of Rs. 12,000 in this route. The additional rail yard handling cost, trailer cost for the last
mile connectivity, and the mark-up charged by the liners for ICD bound cargo contribute to the difference in
logistics cost.
Figure 166: Logistics cost comparison between rail and road
19%
50
0
100
Chennai (DPW)
3%
Chennai (PSA)JNPT
81%
7%
Mode of evacuation(%)
97%93%
Rail evacuation Road evacuation
0.07 Mn TEU (5 %) of cargo evacuated through
rail; lower than JNPT (19%)
4 operational ICDs – Bangalore, Irrungatukottai,
Arakkonam, Tondirpet available in the hinterland
region
• Only Bangalore ICD has operational rakes
Railway track for running 4-6 rakes/day available
Both terminals has access to rail
• Common CONCOR yard for DPW, on-dock rail yard
for PSA
Further expansion of tracks planned inside the port
Size of hinterland
Hinterland
potentially tapped
by rail
Nellore
Sriperumbudur
Chennai cityVelloreBangalore
Tambaram
AmburHosur
Chittoor
KanchipuramKrishnagiri
Medak
Khammam
Tirupur
Hoskote
Sholingur
Long haul Potential: ~0.25 Mn TEUs
Short Haul Potential: ~0.45 Mn TEUs
Infrastructure in place for rail movement
~0.7 Mn TEU of Chennai port cargo is located
at a proximity to ICDs
Rail transportation is INR ~2,500 more expensive than road
5,000
6,500
9,000
4,0006,000
5,000
12,000
0
10,000
20,000
30,000
Cost in INR
Road through Manali CFS
1,000
23,000
25,500
Rail through Whitef ield ICD
+2,500
Simulation for cargo to Chennai port to Hosur cargo
Markup by liners for ICD bookingCFS/ ICD handling
Drayage
Freight
Port Handling
Increased rail freight charges
• Additional charges levied by railways
and port on Concor
ICD to factory freight charges
• INR 4-6,000 truck cost for ICD to
factory movement
Mark-up by liners
• Rail cargo is booked to ICD instead of
port itself by importer; liners markup
INR ~1,000 for ICD booking
1
3
4
CY to RY handling charges
• Additional INR Rs 1,500 charged for
rail cargo
2
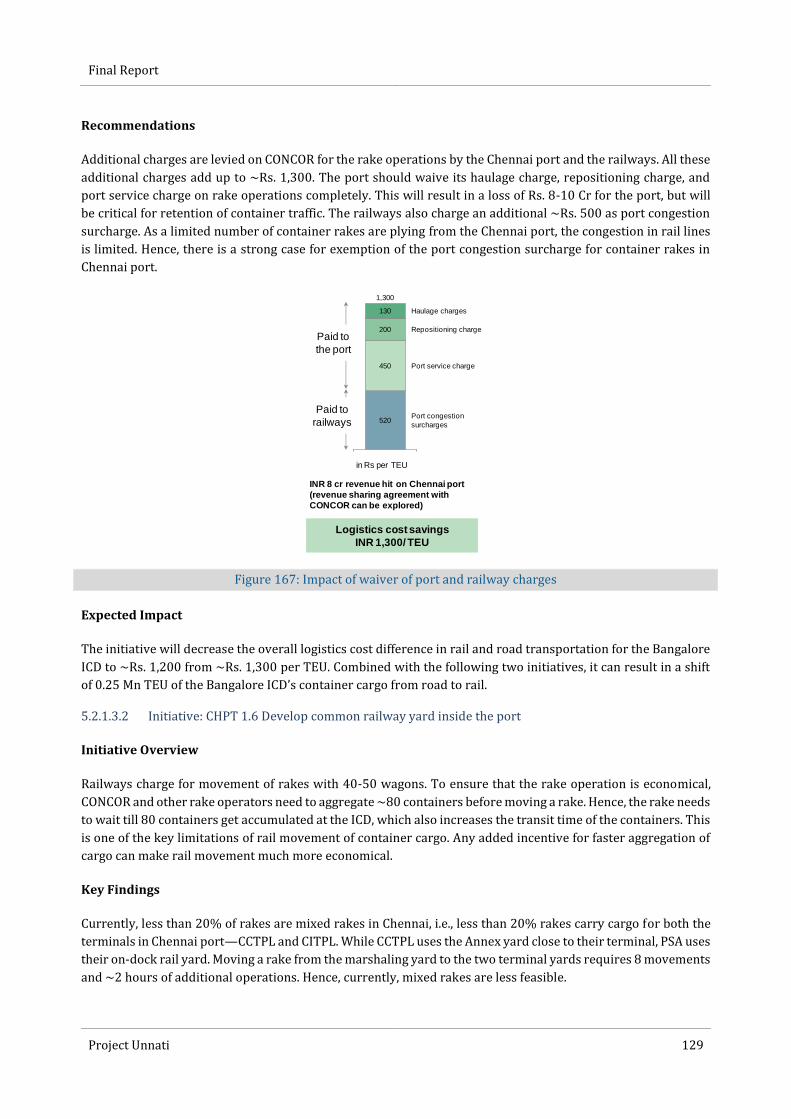
Final Report
Project Unnati 129
Recommendations
Additional charges are levied on CONCOR for the rake operations by the Chennai port and the railways. All these
additional charges add up to ~Rs. 1,300. The port should waive its haulage charge, repositioning charge, and
port service charge on rake operations completely. This will result in a loss of Rs. 8-10 Cr for the port, but will
be critical for retention of container traffic. The railways also charge an additional ~Rs. 500 as port congestion
surcharge. As a limited number of container rakes are plying from the Chennai port, the congestion in rail lines
is limited. Hence, there is a strong case for exemption of the port congestion surcharge for container rakes in
Chennai port.
Figure 167: Impact of waiver of port and railway charges
Expected Impact
The initiative will decrease the overall logistics cost difference in rail and road transportation for the Bangalore
ICD to ~Rs. 1,200 from ~Rs. 1,300 per TEU. Combined with the following two initiatives, it can result in a shift
of 0.25 Mn TEU of the Bangalore ICD’s container cargo from road to rail.
5.2.1.3.2 Initiative: CHPT 1.6 Develop common railway yard inside the port
Initiative Overview
Railways charge for movement of rakes with 40-50 wagons. To ensure that the rake operation is economical,
CONCOR and other rake operators need to aggregate ~80 containers before moving a rake. Hence, the rake needs
to wait till 80 containers get accumulated at the ICD, which also increases the transit time of the containers. This
is one of the key limitations of rail movement of container cargo. Any added incentive for faster aggregation of
cargo can make rail movement much more economical.
Key Findings
Currently, less than 20% of rakes are mixed rakes in Chennai, i.e., less than 20% rakes carry cargo for both the
terminals in Chennai port—CCTPL and CITPL. While CCTPL uses the Annex yard close to their terminal, PSA uses
their on-dock rail yard. Moving a rake from the marshaling yard to the two terminal yards requires 8 movements
and ~2 hours of additional operations. Hence, currently, mixed rakes are less feasible.
Repositioning charge200
Port congestion
surcharges
Port service charge
520
450
1,300
130 Haulage charges
Logistics cost savings
INR 1,300/ TEU
in Rs per TEU
Paid to
the port
Paid to
railways
INR 8 cr revenue hit on Chennai port
(revenue sharing agreement with
CONCOR can be explored)

Final Report
Project Unnati 130
Each rake spends up to 20 hours of waiting time in the container yard waiting for adequate volume of cargo to
arrive. A mixed rake that carries cargo for both terminals will allow faster aggregation and, hence, will reduce
the waiting time for rakes.
Figure 168: Rake analysis
Recommendations
The port must develop a common rail yard for both the terminals to move their cargo. Preliminary studies in the
port have identified land parcel available near the current marshaling yard as the ideal location for building the
common container yard. The yard would have space to handle up to 0.75 Mn TEU per year, and would also have
adequate equipment to maintain high productivity levels.
The common yard will make running mixed rakes viable. It will reduce the turnaround time for rakes by ~10
hours. This will allow rake operators to run rakes more frequently and, hence, increase the maximum rail
throughput by 26%. It will also result in higher savings for the rail operator.
Mixed rakes not preferred by Concor
due to additional movements
High waiting time of rakes due to low
aggregation
8 rake movements for a mixed rake
• Adds a handling time of ~2 hours within the port
Less than 20 % of rakes from Bangalore ICD are mixed rakes
4820
6
16
6
0
10
20
30
40
50
Transit timeHandling
in ICD
Handling
in Port
Hours
Waiting
time
Total
Time taken for a round-trip journey
Gate 4Marshalling
Yard
Annex Yard
(DPW)
Marshalling
Yard
Marshalling
Yard
Marshalling
YardGate 4
Annex Yard
(DPW)
Mixed rakes can substantially improve
aggregation and reduce waiting time
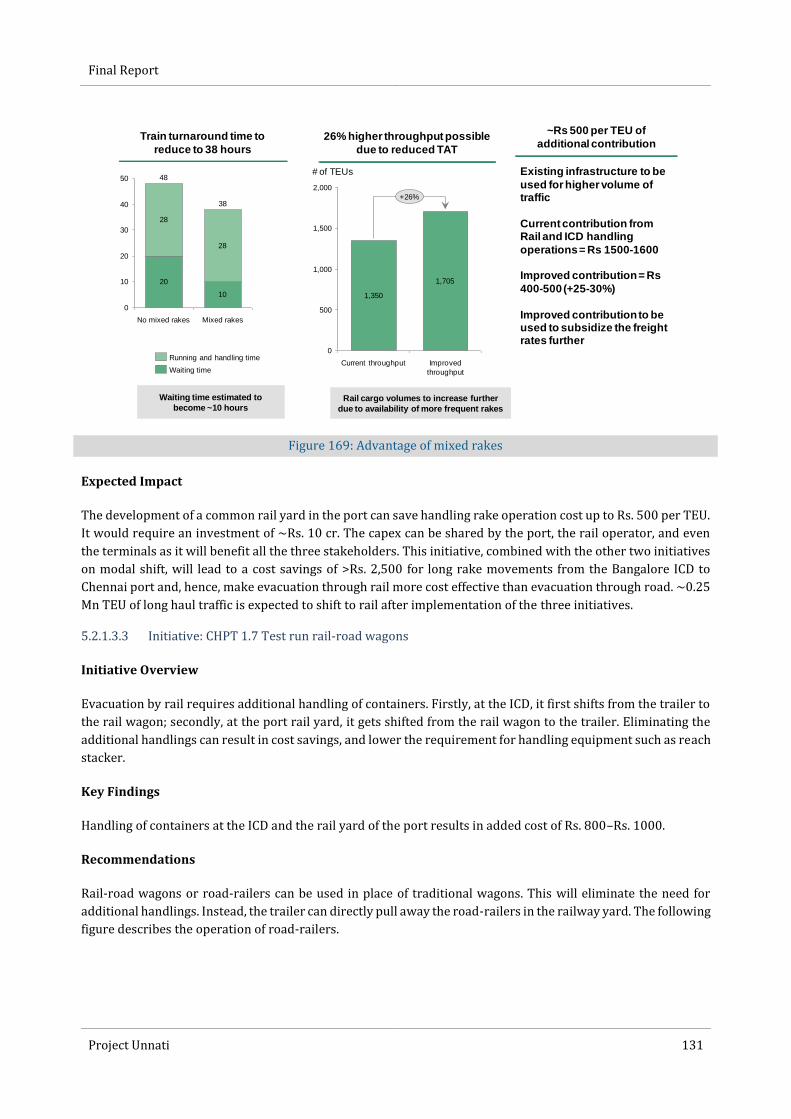
Final Report
Project Unnati 131
Figure 169: Advantage of mixed rakes
Expected Impact
The development of a common rail yard in the port can save handling rake operation cost up to Rs. 500 per TEU.
It would require an investment of ~Rs. 10 cr. The capex can be shared by the port, the rail operator, and even
the terminals as it will benefit all the three stakeholders. This initiative, combined with the other two initiatives
on modal shift, will lead to a cost savings of >Rs. 2,500 for long rake movements from the Bangalore ICD to
Chennai port and, hence, make evacuation through rail more cost effective than evacuation through road. ~0.25
Mn TEU of long haul traffic is expected to shift to rail after implementation of the three initiatives.
5.2.1.3.3 Initiative: CHPT 1.7 Test run rail-road wagons
Initiative Overview
Evacuation by rail requires additional handling of containers. Firstly, at the ICD, it first shifts from the trailer to
the rail wagon; secondly, at the port rail yard, it gets shifted from the rail wagon to the trailer. Eliminating the
additional handlings can result in cost savings, and lower the requirement for handling equipment such as reach
stacker.
Key Findings
Handling of containers at the ICD and the rail yard of the port results in added cost of Rs. 800–Rs. 1000.
Recommendations
Rail-road wagons or road-railers can be used in place of traditional wagons. This will eliminate the need for
additional handlings. Instead, the trailer can directly pull away the road-railers in the railway yard. The following
figure describes the operation of road-railers.
26% higher throughput possible
due to reduced TAT
~Rs 500 per TEU of
additional contribution
Existing infrastructure to be
used for higher volume of traffic
Current contribution from Rail and ICD handling
operations = Rs 1500-1600
Improved contribution = Rs
400-500 (+25-30%)
Improved contribution to be used to subsidize the freight rates further
1,350
1,705
0
500
1,000
1,500
2,000
# of TEUs
+26%
Improved
throughput
Current throughput
Waiting time estimated to
become ~10 hours Rail cargo volumes to increase further
due to availability of more frequent rakes
Train turnaround time to
reduce to 38 hours
20
10
28
28
0
10
20
30
40
50
38
48
No mixed rakes Mixed rakes
Running and handling time
Waiting time

Final Report
Project Unnati 132
Figure 170: Process of operation of road-railers
Road-railers are extensively operated in the US. Multiple services are run by private rail service companies like
Triple Crown Services, which is a Norfolk Southern's subsidiary. Other services in the US are run by Union Pacific,
BNSF etc. In Canada, Canadian National (CN) run roadrailer services. Roadrailers are also used in Austria and
Brazil.
`
The road-railers are relevant for lighter cargo and hence are suited for 60-70% of Chennai's cargo including
cargo handled by auto companies, paper importers etc. The road-railer concept is relatively new to India. It is
currently getting tested by Kirloskar. Chennai port would provide an excellent opportunity to test-run road-
railers. The investment into road-railers should be borne by rail operators; port would need to provide
infrastructure support to run the road-railers. In the initial phase, the port would need to subsidize road-railer
operations by waiing off rail related charges.
Expected Impact
The usage of road-railers can save handling cost up to Rs. 800 per TEU. This initiative, combined with the other
two initiatives, will lead to a cost savings of >Rs. 2,500 for long-rake movements from the Bangalore ICD to the
Chennai port and, hence, make evacuation through rail more cost effective than evacuation through road. ~0.25
Mn TEU of long haul traffic is expected to shift to rail after implementation of the three initiatives.
Process of operation
• Starting at the rear of the train, a trailer is
attached to a rail bogie.
• One by one, trailers are raised on their own
hydraulic system, bogies attached, and then attached to the car behind.
• Finally a coupler is attached to the first trailer and the train is ready to depart
1
2
3
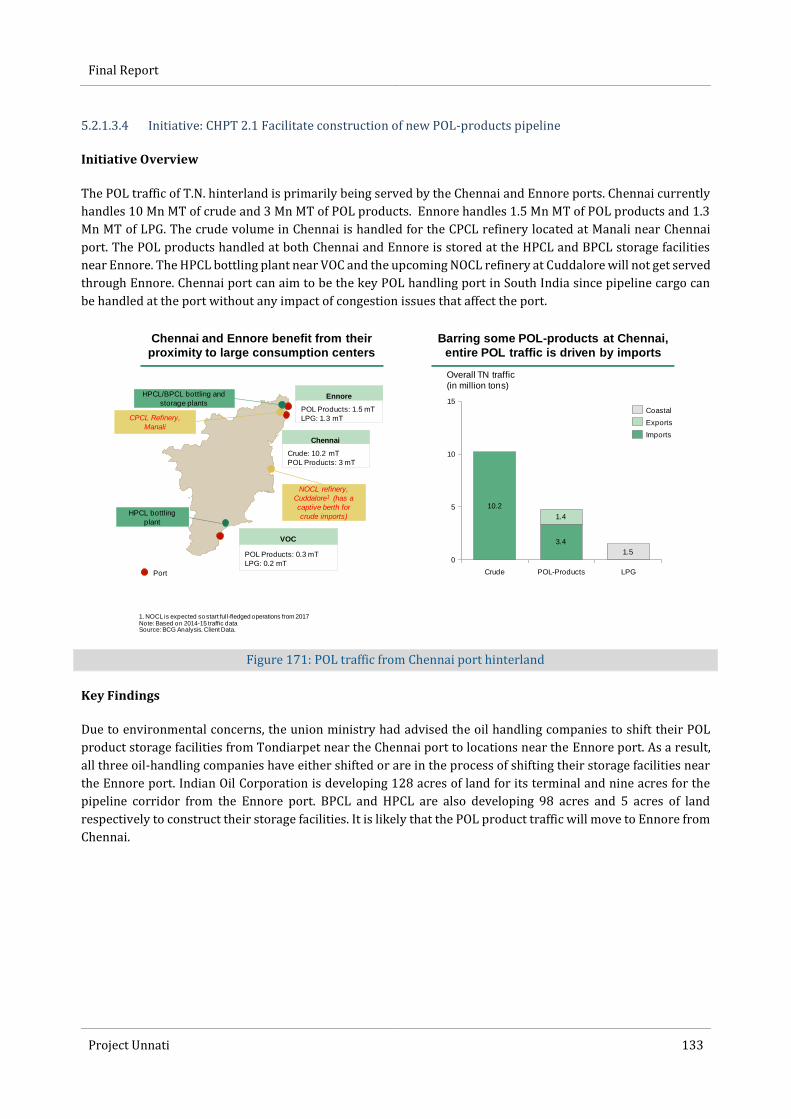
Final Report
Project Unnati 133
5.2.1.3.4 Initiative: CHPT 2.1 Facilitate construction of new POL-products pipeline
Initiative Overview
The POL traffic of T.N. hinterland is primarily being served by the Chennai and Ennore ports. Chennai currently
handles 10 Mn MT of crude and 3 Mn MT of POL products. Ennore handles 1.5 Mn MT of POL products and 1.3
Mn MT of LPG. The crude volume in Chennai is handled for the CPCL refinery located at Manali near Chennai
port. The POL products handled at both Chennai and Ennore is stored at the HPCL and BPCL storage facilities
near Ennore. The HPCL bottling plant near VOC and the upcoming NOCL refinery at Cuddalore will not get served
through Ennore. Chennai port can aim to be the key POL handling port in South India since pipeline cargo can
be handled at the port without any impact of congestion issues that affect the port.
Figure 171: POL traffic from Chennai port hinterland
Key Findings
Due to environmental concerns, the union ministry had advised the oil handling companies to shift their POL
product storage facilities from Tondiarpet near the Chennai port to locations near the Ennore port. As a result,
all three oil-handling companies have either shifted or are in the process of shifting their storage facilities near
the Ennore port. Indian Oil Corporation is developing 128 acres of land for its terminal and nine acres for the
pipeline corridor from the Ennore port. BPCL and HPCL are also developing 98 acres and 5 acres of land
respectively to construct their storage facilities. It is likely that the POL product traffic will move to Ennore from
Chennai.
Chennai and Ennore benefit from their
proximity to large consumption centers
Barring some POL-products at Chennai,
entire POL traffic is driven by imports
POL Products: 0.3 mT
LPG: 0.2 mT
VOC
Crude: 10.2 mT
POL Products: 3 mT
Chennai
POL Products: 1.5 mT
LPG: 1.3 mT
Ennore
CPCL Refinery,
Manali
HPCL/BPCL bottling and
storage plants
HPCL bottling
plant
10.2
3.4
1.4
1.50
5
10
15
Crude
Overall TN traffic
(in million tons)
POL-Products LPG
Exports
Imports
Coastal
1. NOCL is expected so start full-fledged operations from 2017Note: Based on 2014-15 traffic dataSource: BCG Analysis. Client Data.
Port
NOCL refinery,
Cuddalore1 (has a
captive berth for
crude imports)
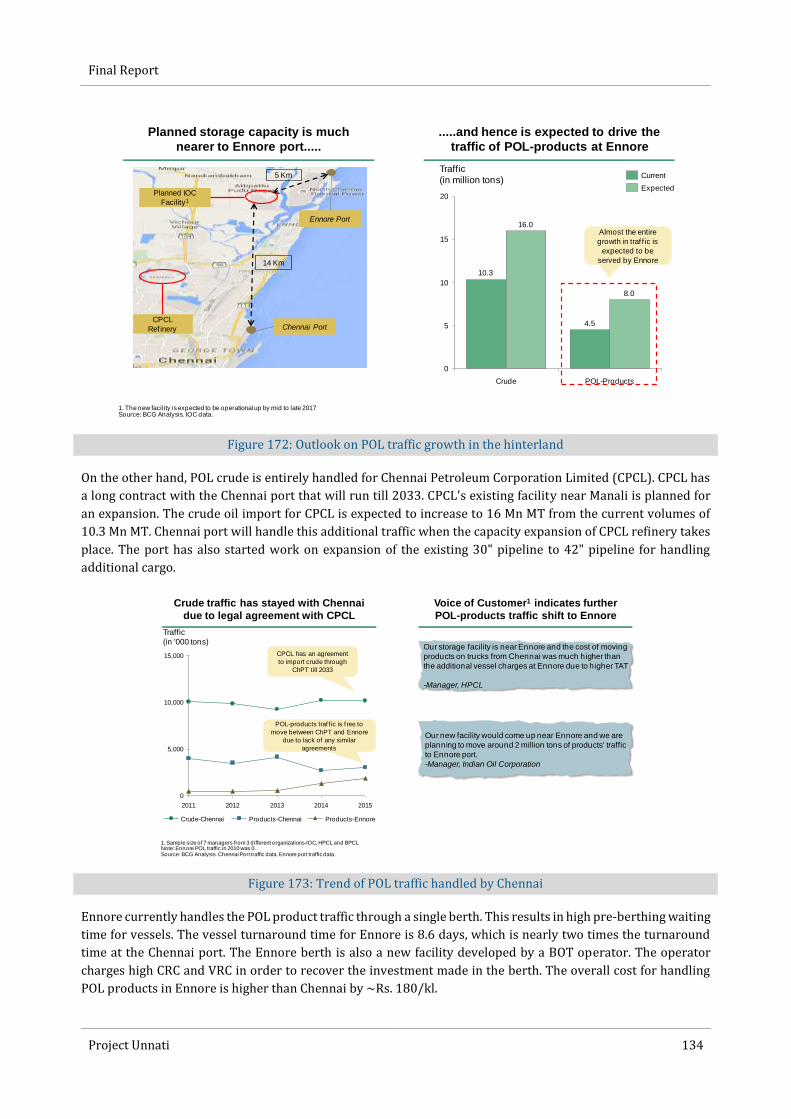
Final Report
Project Unnati 134
Figure 172: Outlook on POL traffic growth in the hinterland
On the other hand, POL crude is entirely handled for Chennai Petroleum Corporation Limited (CPCL). CPCL has
a long contract with the Chennai port that will run till 2033. CPCL's existing facility near Manali is planned for
an expansion. The crude oil import for CPCL is expected to increase to 16 Mn MT from the current volumes of
10.3 Mn MT. Chennai port will handle this additional traffic when the capacity expansion of CPCL refinery takes
place. The port has also started work on expansion of the existing 30" pipeline to 42" pipeline for handling
additional cargo.
Figure 173: Trend of POL traffic handled by Chennai
Ennore currently handles the POL product traffic through a single berth. This results in high pre-berthing waiting
time for vessels. The vessel turnaround time for Ennore is 8.6 days, which is nearly two times the turnaround
time at the Chennai port. The Ennore berth is also a new facility developed by a BOT operator. The operator
charges high CRC and VRC in order to recover the investment made in the berth. The overall cost for handling
POL products in Ennore is higher than Chennai by ~Rs. 180/kl.
Planned storage capacity is much
nearer to Ennore port.....
.....and hence is expected to drive the
traffic of POL-products at Ennore
4.5
10.3
8.0
16.0
0
5
10
15
20
Traffic
(in million tons)
POL-ProductsCrude
Expected
Current
CPCL
Ref inery
Planned IOC
Facility1
Chennai Port
Ennore Port
14 Km
5 Km
1. The new facility is expected to be operational up by mid to late 2017Source: BCG Analysis. IOC data.
Almost the entire
growth in traf f ic is
expected to be
served by Ennore
0
5,000
10,000
15,000
2011 2012 2013 2014 2015
Traffic
(in '000 tons)
Crude traffic has stayed with Chennai
due to legal agreement with CPCL
Voice of Customer1 indicates further
POL-products traffic shift to Ennore
1. Sample size of 7 managers from 3 different organizations-IOC, HPCL and BPCLNote: Ennore POL traffic in 2010 was 0.Source: BCG Analysis. Chennai Port traffic data. Ennore port traffic data.
Products-EnnoreCrude-Chennai Products-Chennai
Our storage facility is near Ennore and the cost of moving
products on trucks from Chennai was much higher than
the additional vessel charges at Ennore due to higher TAT
-Manager, HPCL
Our new facility would come up near Ennore and we are
planning to move around 2 million tons of products' traffic
to Ennore port.
-Manager, Indian Oil Corporation
CPCL has an agreement
to import crude through
ChPT till 2033
POL-products traf f ic is f ree to
move between ChPT and Ennore
due to lack of any similar
agreements
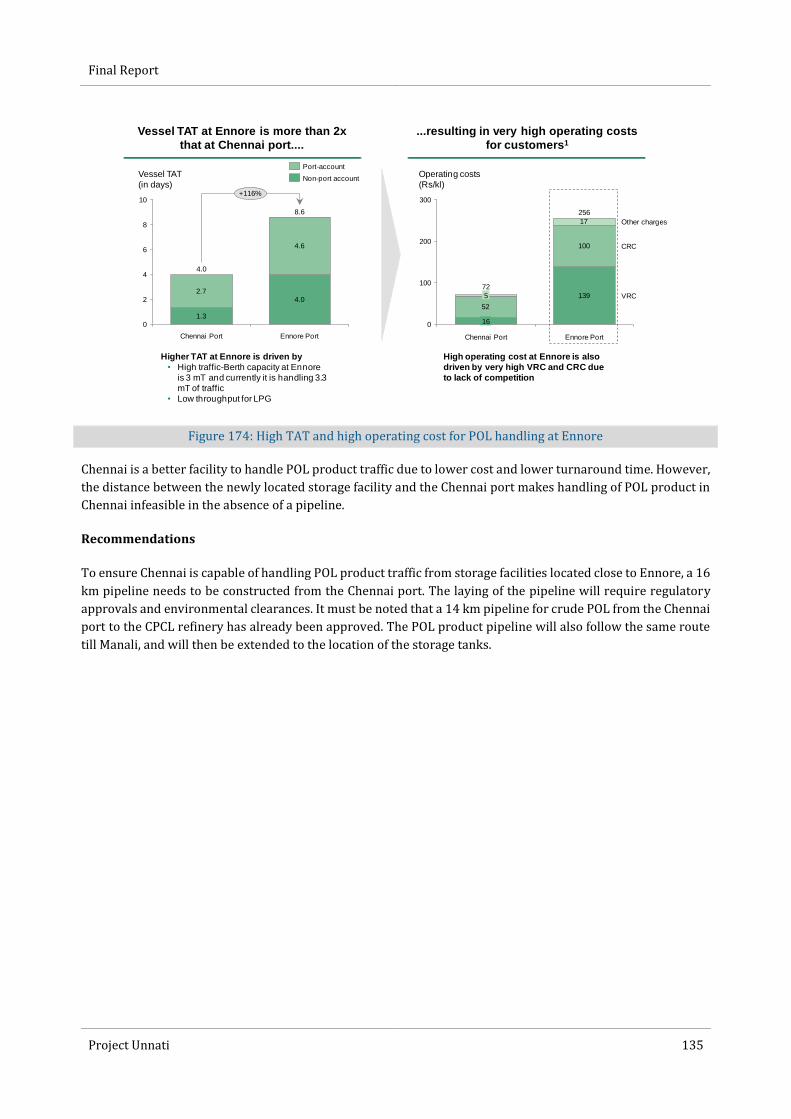
Final Report
Project Unnati 135
Figure 174: High TAT and high operating cost for POL handling at Ennore
Chennai is a better facility to handle POL product traffic due to lower cost and lower turnaround time. However,
the distance between the newly located storage facility and the Chennai port makes handling of POL product in
Chennai infeasible in the absence of a pipeline.
Recommendations
To ensure Chennai is capable of handling POL product traffic from storage facilities located close to Ennore, a 16
km pipeline needs to be constructed from the Chennai port. The laying of the pipeline will require regulatory
approvals and environmental clearances. It must be noted that a 14 km pipeline for crude POL from the Chennai
port to the CPCL refinery has already been approved. The POL product pipeline will also follow the same route
till Manali, and will then be extended to the location of the storage tanks.
Vessel TAT at Ennore is more than 2x
that at Chennai port....
...resulting in very high operating costs
for customers1
Higher TAT at Ennore is driven by
• High traffic-Berth capacity at Ennore
is 3 mT and currently it is handling 3.3
mT of traffic
• Low throughput for LPG
High operating cost at Ennore is also
driven by very high VRC and CRC due
to lack of competition
4.02.7
4.6
1.30
2
4
6
8
10
Vessel TAT
(in days)+116%
Ennore Port
8.6
Chennai Port
4.0
Non-port account
Port-account
139
100
52
17
0
100
200
300
Operating costs
(Rs/kl)
VRC
CRC
Chennai Port
Other charges
72
16
5
Ennore Port
256

Final Report
Project Unnati 136
Figure 175: Construction of pipeline from Chennai to storage facility
The Chennai port will have a capacity for handling 5 MTPA POL products without any further expansion of
berths. This capacity is readily available and does not require any further investment.
Expected Impact
The pipeline would require an investment of ~Rs. 300 crores. This investment will be made by the oil-handling
firms. Alternatively, new berths can be added in Ennore. Cost of construction of a new berth will be ~Rs. 650
crores. The investment in this berth is supposed to be made by IOCL. As summarized in the figure below, the POL
operations in Chennai will offer a higher contribution of ~Rs. 70/MT than the BOT operator-run berth at Ennore
to the respective port. The IRR is higher for construction of the pipeline as compared to development of a new
berth.
The pipeline can be built over land to
the storage facility near Ennore...
...and can utilize the expected idle berth
capacity at the POL berths at ChPT
Using the idle capacity at Chennai port
• Reduces the need for fresh capital investment
by ~300 crores (the pipeline would cost ~350
crores as against ~650 crores for a single 5
million tons berth at Ennore)
• Results in lower lead time for adding additional
capacity as the pipeline can be built much faster
than the new berth
1.5
3.5
0
1
2
3
4
Expected idle capacity at
ChPT in 2018 (million tons/year)1
BD-3 (Crude berth)BD-1 (Products berth )
1. Assumes that the construction of the new crude pipeline would be completed by 2018Note: It is assumed that the new crude pipeline would be completed by 2018Source: BCG analysis. Client data
14 KmChennai
Port
Storage
tanks
Ennore
Port
5 Km
CPCL
ref inery
2 Km
Regulatory approvals would be required to lay the
pipeline
• Pipeline from CPCL to storage area can be
leveraged
• Fresh approvals for crude pipeline can also be
leveraged to get approvals for products pipelines
Capacity at BD-1. Assumes
that the entire traf f ic would
move out in the absence of
pipeline
Capacity unlock at BD-3 f rom
crude pipeline upgrade
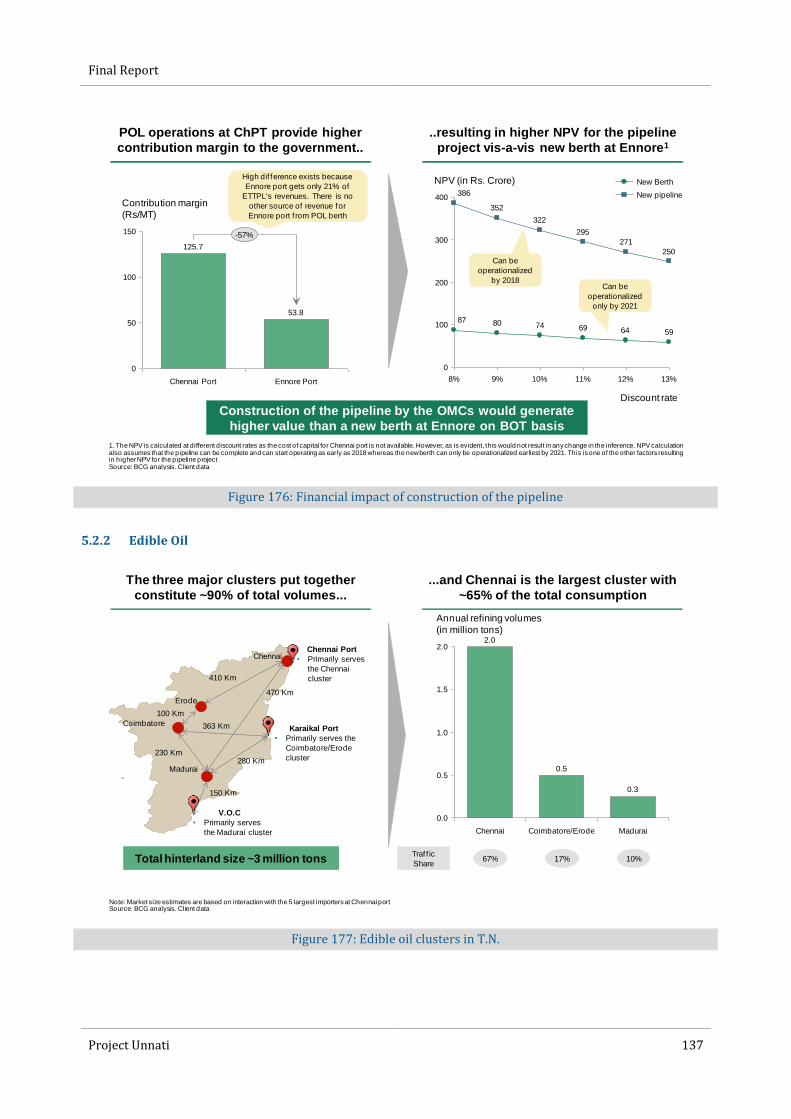
Final Report
Project Unnati 137
Figure 176: Financial impact of construction of the pipeline
5.2.2 Edible Oil
Figure 177: Edible oil clusters in T.N.
POL operations at ChPT provide higher
contribution margin to the government..
..resulting in higher NPV for the pipeline
project vis-a-vis new berth at Ennore1
596469748087
250
271
295
322
352
386
0
100
200
300
400
8% 9% 10% 11% 12% 13%
NPV (in Rs. Crore)
Discount rate
1. The NPV is calculated at different discount rates as the cost of capital for Chennai port is not available. However, as is evident, this would not result in any change in the inference. NPV calculation also assumes that the pipeline can be complete and can start operating as early as 2018 whereas the new berth can only be operationalized earliest by 2021. This is one of the other factors resulting in higher NPV for the pipeline projectSource: BCG analysis. Client data
53.8
125.7
0
50
100
150
Contribution margin
(Rs/MT)
Ennore PortChennai Port
-57%
New pipeline
New Berth
Can be
operationalized
by 2018Can be
operationalized
only by 2021
High dif ference exists because
Ennore port gets only 21% of
ETTPL's revenues. There is no
other source of revenue for
Ennore port f rom POL berth
Construction of the pipeline by the OMCs would generate
higher value than a new berth at Ennore on BOT basis
The three major clusters put together
constitute ~90% of total volumes...
...and Chennai is the largest cluster with
~65% of the total consumption
Chennai
Coimbatore
Madurai
Erode
Note: Market size estimates are based on interaction with the 5 largest importers at Chennai portSource: BCG analysis. Client data
0.3
0.5
2.0
0.0
0.5
1.0
1.5
2.0
Annual refining volumes
(in million tons)
MaduraiCoimbatore/ErodeChennai
410 Km
100 Km
230 Km
Total hinterland size ~3 million tons
V.O.C
• Primarily serves
the Madurai cluster
Karaikal Port
• Primarily serves the
Coimbatore/Erode
cluster
Chennai Port
• Primarily serves
the Chennai
cluster
363 Km
150 Km
Traf f ic
Share67% 17% 10%
470 Km
280 Km

Final Report
Project Unnati 138
5.2.2.1 Initiative: CHPT 3.1 Match the port charges to competition for edible oil
Initiative Overview
Chennai has been losing edible oil cargo to the competitor ports over the last 5 years. In 2011, Chennai had a
volume share of 65%, which has now declined to 33%. The biggest gainer in that period has been
Krishnapatnam, which has grown its edible oil cargo volumes by nearly 4 times over the last 5 years. This growth
has been primarily driven by the Chennai edible oil cluster. Chennai can target to win back some share of the
edible oil traffic that has moved to Krishnapatnam.
Figure 178: Loss of Chennai's market share to competitors
Key Findings
Krishnapatnam is farther from the plant locations than Chennai, therefore, it has higher logistics cost.
Krishnapatnam has compensated for the higher logistics cost by lowering the port charges on edible oil. The
following figure shows that port charges for Krishnapatnam is ~Rs. 35 per MT lower than Chennai. Overall cost
of handling edible oil in Chennai is costlier by Rs. 15 per MT, which translates to ~Rs. 2 lakhs per ship for an
average edible oil carrier. Higher cost and evacuation issues in Chennai have made customers move to
Krishnapatnam.
0.0
0.5
1.0
1.5
20152014201320122011
Traffic (in
million tonnes)1
Chennai port
market
share
64.8% 55.2% 40.9% 38.7% 33.4%
Krishnapatnam VOC ChennaiKaraikal
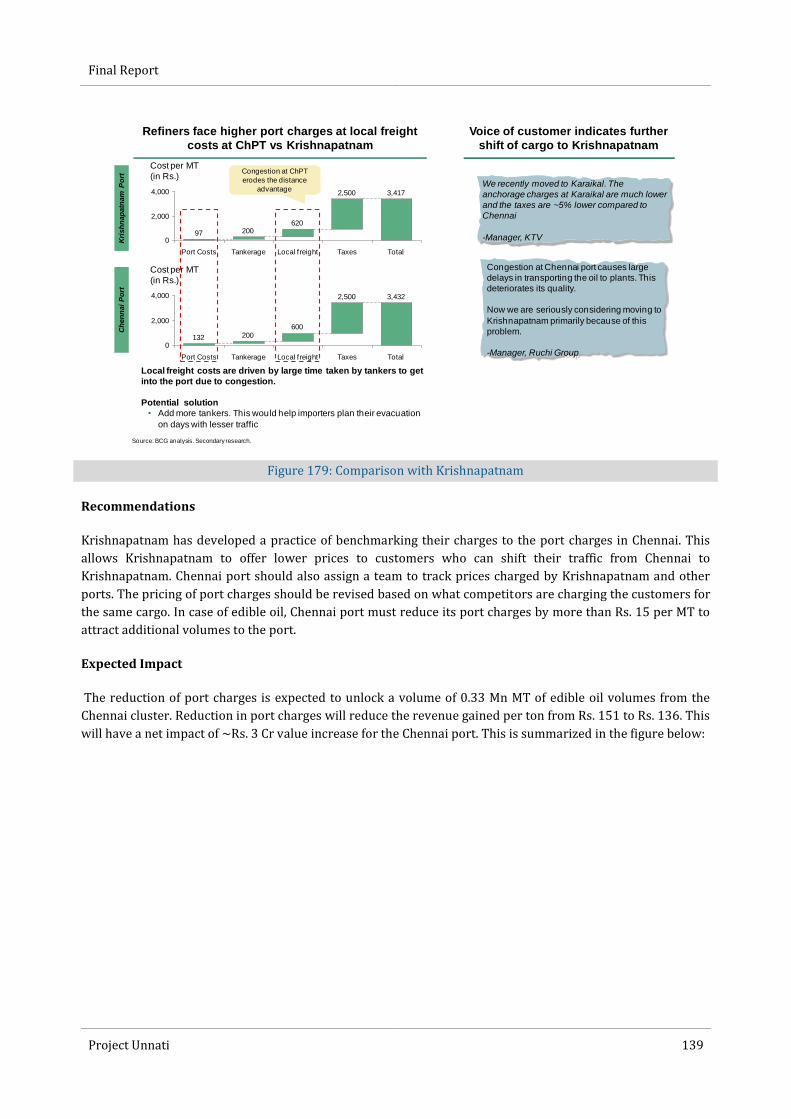
Final Report
Project Unnati 139
Figure 179: Comparison with Krishnapatnam
Recommendations
Krishnapatnam has developed a practice of benchmarking their charges to the port charges in Chennai. This
allows Krishnapatnam to offer lower prices to customers who can shift their traffic from Chennai to
Krishnapatnam. Chennai port should also assign a team to track prices charged by Krishnapatnam and other
ports. The pricing of port charges should be revised based on what competitors are charging the customers for
the same cargo. In case of edible oil, Chennai port must reduce its port charges by more than Rs. 15 per MT to
attract additional volumes to the port.
Expected Impact
The reduction of port charges is expected to unlock a volume of 0.33 Mn MT of edible oil volumes from the
Chennai cluster. Reduction in port charges will reduce the revenue gained per ton from Rs. 151 to Rs. 136. This
will have a net impact of ~Rs. 3 Cr value increase for the Chennai port. This is summarized in the figure below:
Refiners face higher port charges at local freight
costs at ChPT vs Krishnapatnam
Voice of customer indicates further
shift of cargo to Krishnapatnam
We recently moved to Karaikal. The
anchorage charges at Karaikal are much lower
and the taxes are ~5% lower compared to
Chennai
-Manager, KTV
Congestion at Chennai port causes large
delays in transporting the oil to plants. This
deteriorates its quality.
Now we are seriously considering moving to
Krishnapatnam primarily because of this
problem.
-Manager, Ruchi Group
Source: BCG analysis. Secondary research.
3,4172,500
62020097
0
2,000
4,000
Cost per MT
(in Rs.)
TotalTaxesLocal f reightTankeragePort Costs
3,4322,500
600200132
0
2,000
4,000
Port Costs
Cost per MT
(in Rs.)
Tankerage TotalLocal f reight Taxes
Kri
sh
nap
atn
am
Po
rtC
hen
nai
Po
rt
Congestion at ChPT
erodes the distance
advantage
Local freight costs are driven by large time taken by tankers to get
into the port due to congestion.
Potential solution
• Add more tankers. This would help importers plan their evacuation
on days with lesser traffic
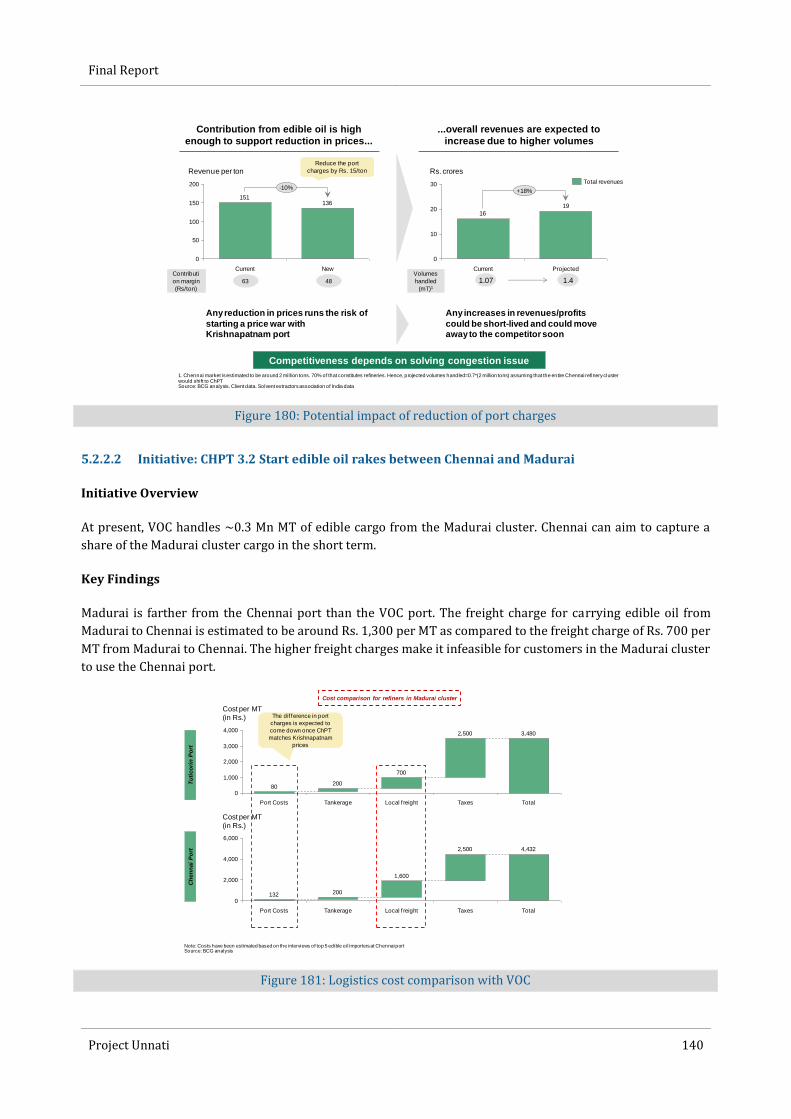
Final Report
Project Unnati 140
Figure 180: Potential impact of reduction of port charges
5.2.2.2 Initiative: CHPT 3.2 Start edible oil rakes between Chennai and Madurai
Initiative Overview
At present, VOC handles ~0.3 Mn MT of edible cargo from the Madurai cluster. Chennai can aim to capture a
share of the Madurai cluster cargo in the short term.
Key Findings
Madurai is farther from the Chennai port than the VOC port. The freight charge for carrying edible oil from
Madurai to Chennai is estimated to be around Rs. 1,300 per MT as compared to the freight charge of Rs. 700 per
MT from Madurai to Chennai. The higher freight charges make it infeasible for customers in the Madurai cluster
to use the Chennai port.
Figure 181: Logistics cost comparison with VOC
Contribution from edible oil is high
enough to support reduction in prices...
...overall revenues are expected to
increase due to higher volumes
1. Chennai market is estimated to be around 2 million tons. 70% of that constitutes refineries. Hence, projected volumes handled=0.7*(2 million tons) assuming that the entire Chennai refinery cluster would shift to ChPTSource: BCG analysis. Client data. Solvent extractors association of India data
19
16
0
10
20
30+18%
ProjectedCurrent
Rs. crores
Total revenues
Volumes
handled
(mT)11.07 1.4
136151
0
50
100
150
200
Revenue per ton
Current New
-10%
Contributi
on margin
(Rs/ton)
63 48
Reduce the port
charges by Rs. 15/ton
Competitiveness depends on solving congestion issue
Any reduction in prices runs the risk of
starting a price war with Krishnapatnam port
Any increases in revenues/profits
could be short-lived and could move away to the competitor soon
3,4802,500
700
20080
0
1,000
2,000
3,000
4,000
Cost per MT
(in Rs.)
TotalTaxesLocal f reightTankeragePort Costs
Tu
tico
rin
Po
rtC
hen
nai
Po
rt 4,4322,500
1,600
2001320
2,000
4,000
6,000
Tankerage Local f reight TaxesPort Costs Total
Cost per MT
(in Rs.)
Cost comparison for refiners in Madurai cluster
The dif ference in port
charges is expected to
come down once ChPT
matches Krishnapatnam
prices
Note: Costs have been estimated based on the interviews of top 5 edible oil importers at Chennai portSource: BCG analysis
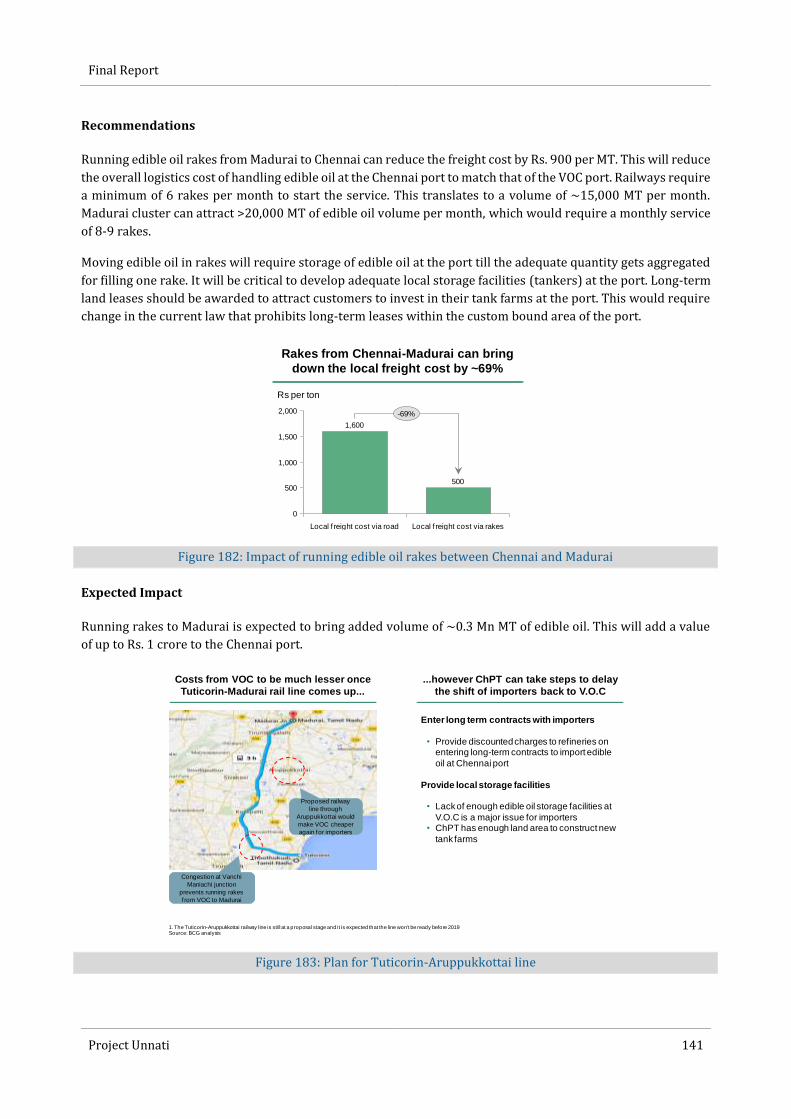
Final Report
Project Unnati 141
Recommendations
Running edible oil rakes from Madurai to Chennai can reduce the freight cost by Rs. 900 per MT. This will reduce
the overall logistics cost of handling edible oil at the Chennai port to match that of the VOC port. Railways require
a minimum of 6 rakes per month to start the service. This translates to a volume of ~15,000 MT per month.
Madurai cluster can attract >20,000 MT of edible oil volume per month, which would require a monthly service
of 8-9 rakes.
Moving edible oil in rakes will require storage of edible oil at the port till the adequate quantity gets aggregated
for filling one rake. It will be critical to develop adequate local storage facilities (tankers) at the port. Long-term
land leases should be awarded to attract customers to invest in their tank farms at the port. This would require
change in the current law that prohibits long-term leases within the custom bound area of the port.
Figure 182: Impact of running edible oil rakes between Chennai and Madurai
Expected Impact
Running rakes to Madurai is expected to bring added volume of ~0.3 Mn MT of edible oil. This will add a value
of up to Rs. 1 crore to the Chennai port.
Figure 183: Plan for Tuticorin-Aruppukkottai line
Rakes from Chennai-Madurai can bring
down the local freight cost by ~69%
500
1,600
0
500
1,000
1,500
2,000
Rs per ton
Local f reight cost via rakesLocal f reight cost via road
-69%
Costs from VOC to be much lesser once
Tuticorin-Madurai rail line comes up...
...however ChPT can take steps to delay
the shift of importers back to V.O.C
Congestion at Vanchi
Maniachi junction
prevents running rakes
f rom VOC to Madurai
Proposed railway
line through
Aruppukkottai would
make VOC cheaper
again for importers
Enter long term contracts with importers
• Provide discounted charges to refineries on entering long-term contracts to import edible
oil at Chennai port
Provide local storage facilities
• Lack of enough edible oil storage facilities at
V.O.C is a major issue for importers• ChPT has enough land area to construct new
tank farms
1. The Tuticorin-Aruppukkottai railway line is still at a proposal stage and it is expected that the line won't be ready before 2019Source: BCG analysis
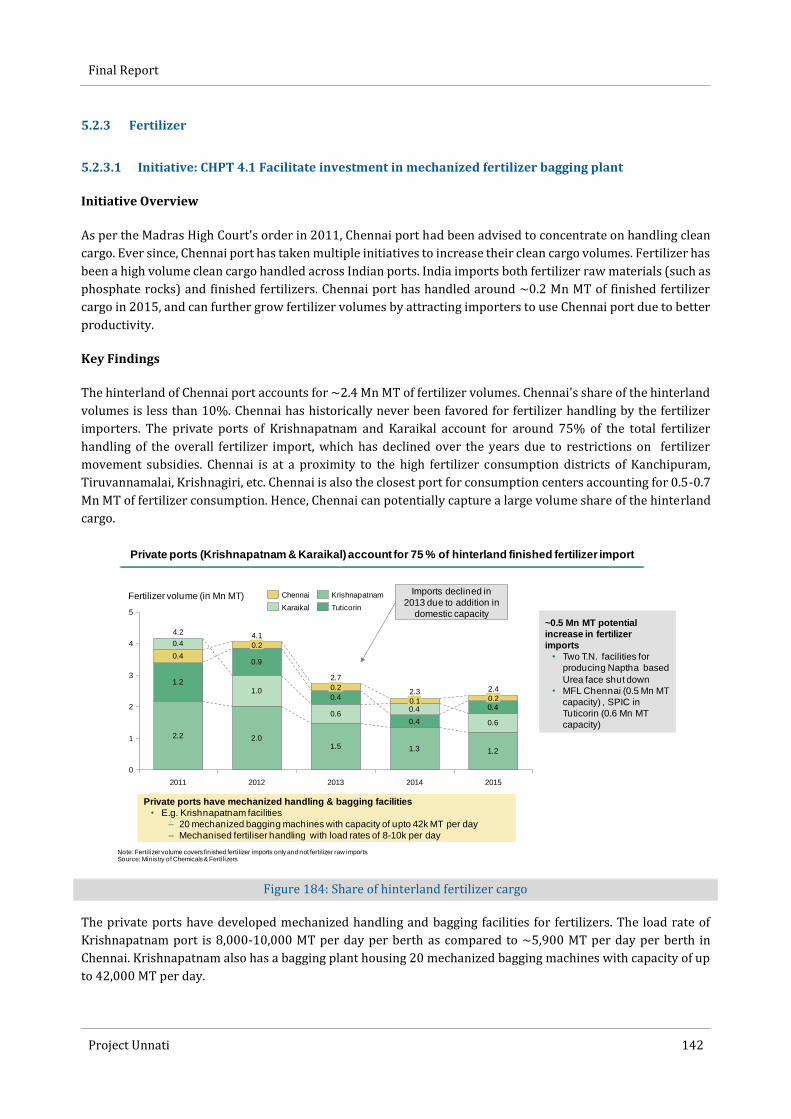
Final Report
Project Unnati 142
5.2.3 Fertilizer
5.2.3.1 Initiative: CHPT 4.1 Facilitate investment in mechanized fertilizer bagging plant
Initiative Overview
As per the Madras High Court's order in 2011, Chennai port had been advised to concentrate on handling clean
cargo. Ever since, Chennai port has taken multiple initiatives to increase their clean cargo volumes. Fertilizer has
been a high volume clean cargo handled across Indian ports. India imports both fertilizer raw materials (such as
phosphate rocks) and finished fertilizers. Chennai port has handled around ~0.2 Mn MT of finished fertilizer
cargo in 2015, and can further grow fertilizer volumes by attracting importers to use Chennai port due to better
productivity.
Key Findings
The hinterland of Chennai port accounts for ~2.4 Mn MT of fertilizer volumes. Chennai's share of the hinterland
volumes is less than 10%. Chennai has historically never been favored for fertilizer handling by the fertilizer
importers. The private ports of Krishnapatnam and Karaikal account for around 75% of the total fertilizer
handling of the overall fertilizer import, which has declined over the years due to restrictions on fertilizer
movement subsidies. Chennai is at a proximity to the high fertilizer consumption districts of Kanchipuram,
Tiruvannamalai, Krishnagiri, etc. Chennai is also the closest port for consumption centers accounting for 0.5-0.7
Mn MT of fertilizer consumption. Hence, Chennai can potentially capture a large volume share of the hinterland
cargo.
Figure 184: Share of hinterland fertilizer cargo
The private ports have developed mechanized handling and bagging facilities for fertilizers. The load rate of
Krishnapatnam port is 8,000-10,000 MT per day per berth as compared to ~5,900 MT per day per berth in
Chennai. Krishnapatnam also has a bagging plant housing 20 mechanized bagging machines with capacity of up
to 42,000 MT per day.
Private ports (Krishnapatnam & Karaikal) account for 75 % of hinterland finished fertilizer import
2.2 2.01.5 1.3 1.2
1.21.0
0.60.4 0.6
0.40.9
0.4
0.4 0.4
0.4
0
1
2
3
4
5
4.2
2014
0.2
4.1
2011 2012
0.2
2.4
Fertilizer volume (in Mn MT)
0.2
0.1
2.3
2.7
20152013
Karaikal Tuticorin
KrishnapatnamChennai Imports declined in
2013 due to addition in
domestic capacity~0.5 Mn MT potential
increase in fertilizer
imports
• Two T.N. facilities for
producing Naptha based
Urea face shut down
• MFL Chennai (0.5 Mn MT
capacity) , SPIC in
Tuticorin (0.6 Mn MT
capacity)
Private ports have mechanized handling & bagging facilities
• E.g. Krishnapatnam facilities
– 20 mechanized bagging machines with capacity of upto 42k MT per day
– Mechanised fertiliser handling with load rates of 8-10k per day
Note: Fertilizer volume covers finished fertilizer imports only and not fertilizer raw importsSource: Ministry of Chemicals & Fertilizers
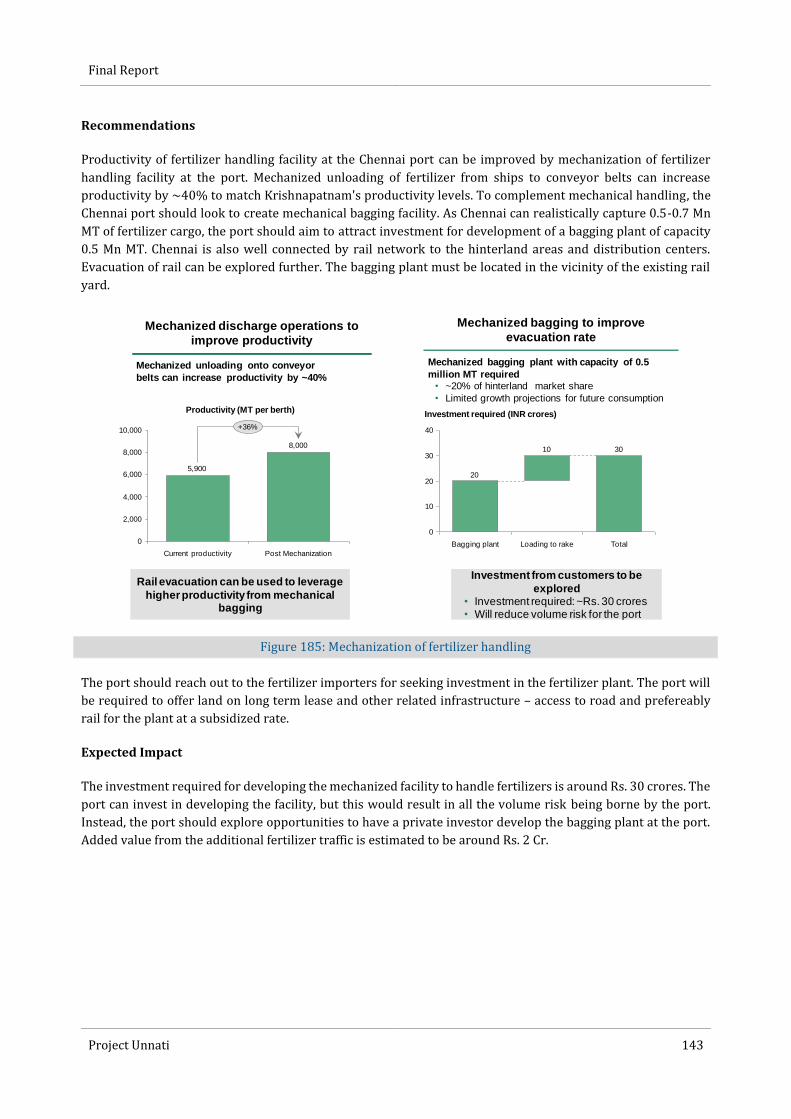
Final Report
Project Unnati 143
Recommendations
Productivity of fertilizer handling facility at the Chennai port can be improved by mechanization of fertilizer
handling facility at the port. Mechanized unloading of fertilizer from ships to conveyor belts can increase
productivity by ~40% to match Krishnapatnam's productivity levels. To complement mechanical handling, the
Chennai port should look to create mechanical bagging facility. As Chennai can realistically capture 0.5-0.7 Mn
MT of fertilizer cargo, the port should aim to attract investment for development of a bagging plant of capacity
0.5 Mn MT. Chennai is also well connected by rail network to the hinterland areas and distribution centers.
Evacuation of rail can be explored further. The bagging plant must be located in the vicinity of the existing rail
yard.
Figure 185: Mechanization of fertilizer handling
The port should reach out to the fertilizer importers for seeking investment in the fertilizer plant. The port will
be required to offer land on long term lease and other related infrastructure – access to road and prefereably
rail for the plant at a subsidized rate.
Expected Impact
The investment required for developing the mechanized facility to handle fertilizers is around Rs. 30 crores. The
port can invest in developing the facility, but this would result in all the volume risk being borne by the port.
Instead, the port should explore opportunities to have a private investor develop the bagging plant at the port.
Added value from the additional fertilizer traffic is estimated to be around Rs. 2 Cr.
Mechanized discharge operations to
improve productivity
Mechanized unloading onto conveyor
belts can increase productivity by ~40%
Mechanized bagging to improve
evacuation rate
Mechanized bagging plant with capacity of 0.5
million MT required
• ~20% of hinterland market share
• Limited growth projections for future consumption
Rail evacuation can be used to leverage
higher productivity from mechanical bagging
Investment from customers to be
explored• Investment required: ~Rs. 30 crores• Will reduce volume risk for the port
8,000
5,900
0
2,000
4,000
6,000
8,000
10,000 +36%
Post MechanizationCurrent productivity
Productivity (MT per berth)
3010
20
0
10
20
30
40
Investment required (INR crores)
TotalLoading to rakeBagging plant

SAGARMALA: Master Plan for Chennai Port - 2 - Final Report
Appendix 2 – Port Capacity Analysis of
Chennai Port
Port capacity analysis of Chennai Port

i
Contents
Background 1 Objective 1 Current Situation 2
Key definitions 3 Rated capacity of Chennai port 4 Productivity of port 5
Under-utilized projects 5 Upcoming capacity 5
Traffic projections and future capacity 6 ANNEXURE 1 – Equipment List Considered 8 ANNEXURE 2 – Re-rating methodology 9
ANNEXURE 3 – Detailed calculations for berth-wise capacity
ratings 10
1
Click here to enter text.
Port capacity analysis of Chennai Port Background
BACKGROUND
Ministry of Shipping introduced in 2016 the Berthing Policy for Dry Bulk Cargo for
Major Ports1 (henceforth referred to as “berthing policy document for dry bulk”) provides
a standardized framework for calculation of capacity norms for berths handling dry bulk
cargo. The approach is based on the specific commodity being handled along with the
equipment available on the berth. The current document extends the guidelines to cover
other cargo types in addition to dry bulk (containers, break bulk and liquid) to provide a
more comprehensive framework for calculation of the port capacity. The approach
followed for rating of different types of berths are provided in Annexure 2 of the
document.
OBJECTIVE
■ To rate the current capacity of port based on guidelines provided in Berthing Policy
for Dry Bulk Cargo for Major Ports, 2016. To calculate the total cargo handling
capacity based on capacity rating of all berths handling different types of
commodities including container, liquid and general cargo (break bulk and dry
bulk).
■ To streamline and maintain consistency in the capacity rating process across the
major ports
■ To calculate the total cargo handling capacity based on ongoing and priority projects
to decide a course of action on future capex investment
1 Notified on June 16, 2016

2
CURRENT SITUATION
In FY 16-17, Chennai port handled 50.2 Mn tons of traffic and witnessed an overall
occupancy of ~50%. The major commodities handled are containers and liquid cargo
(majorly P.O.L.), which make up >80% of the total traffic. The commodity split of the
traffic in FY16-17 was:
EXHIBIT 1
As per the capacity published by the Ministry of Shipping, Chennai port’s capacity is
93.4 MTPA2 with the following commodity-wise split:
2 As of March 31, 2017
Traffic handled at Chennai Port between April 2016 and March 2017
50.2
13.6
7.5
28.9
Liquid Total
00
Fertilizers Coal (Thermal
and Coking)
OthersContainers
0.3
Iron Ore
MTPA
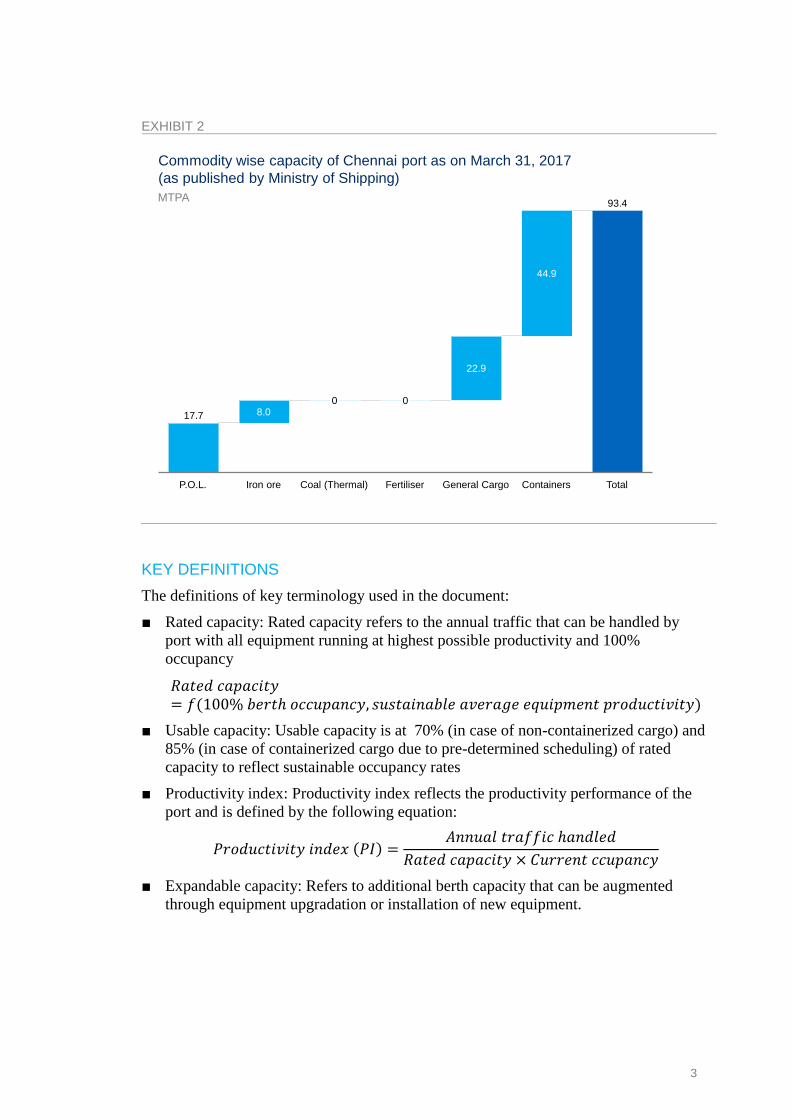
3
EXHIBIT 2
KEY DEFINITIONS
The definitions of key terminology used in the document:
■ Rated capacity: Rated capacity refers to the annual traffic that can be handled by
port with all equipment running at highest possible productivity and 100%
occupancy
𝑅𝑎𝑡𝑒𝑑 𝑐𝑎𝑝𝑎𝑐𝑖𝑡𝑦= 𝑓(100% 𝑏𝑒𝑟𝑡ℎ 𝑜𝑐𝑐𝑢𝑝𝑎𝑛𝑐𝑦, 𝑠𝑢𝑠𝑡𝑎𝑖𝑛𝑎𝑏𝑙𝑒 𝑎𝑣𝑒𝑟𝑎𝑔𝑒 𝑒𝑞𝑢𝑖𝑝𝑚𝑒𝑛𝑡 𝑝𝑟𝑜𝑑𝑢𝑐𝑡𝑖𝑣𝑖𝑡𝑦)
■ Usable capacity: Usable capacity is at 70% (in case of non-containerized cargo) and
85% (in case of containerized cargo due to pre-determined scheduling) of rated
capacity to reflect sustainable occupancy rates
■ Productivity index: Productivity index reflects the productivity performance of the
port and is defined by the following equation:
𝑃𝑟𝑜𝑑𝑢𝑐𝑡𝑖𝑣𝑖𝑡𝑦 𝑖𝑛𝑑𝑒𝑥 (𝑃𝐼) =𝐴𝑛𝑛𝑢𝑎𝑙 𝑡𝑟𝑎𝑓𝑓𝑖𝑐 ℎ𝑎𝑛𝑑𝑙𝑒𝑑
𝑅𝑎𝑡𝑒𝑑 𝑐𝑎𝑝𝑎𝑐𝑖𝑡𝑦 × 𝐶𝑢𝑟𝑟𝑒𝑛𝑡 𝑐𝑐𝑢𝑝𝑎𝑛𝑐𝑦
■ Expandable capacity: Refers to additional berth capacity that can be augmented
through equipment upgradation or installation of new equipment.
Commodity wise capacity of Chennai port as on March 31, 2017
(as published by Ministry of Shipping)
22.9
8.0
93.4
17.7
44.9
TotalGeneral CargoFertiliserP.O.L. Iron ore Containers
0
Coal (Thermal)
0
MTPA
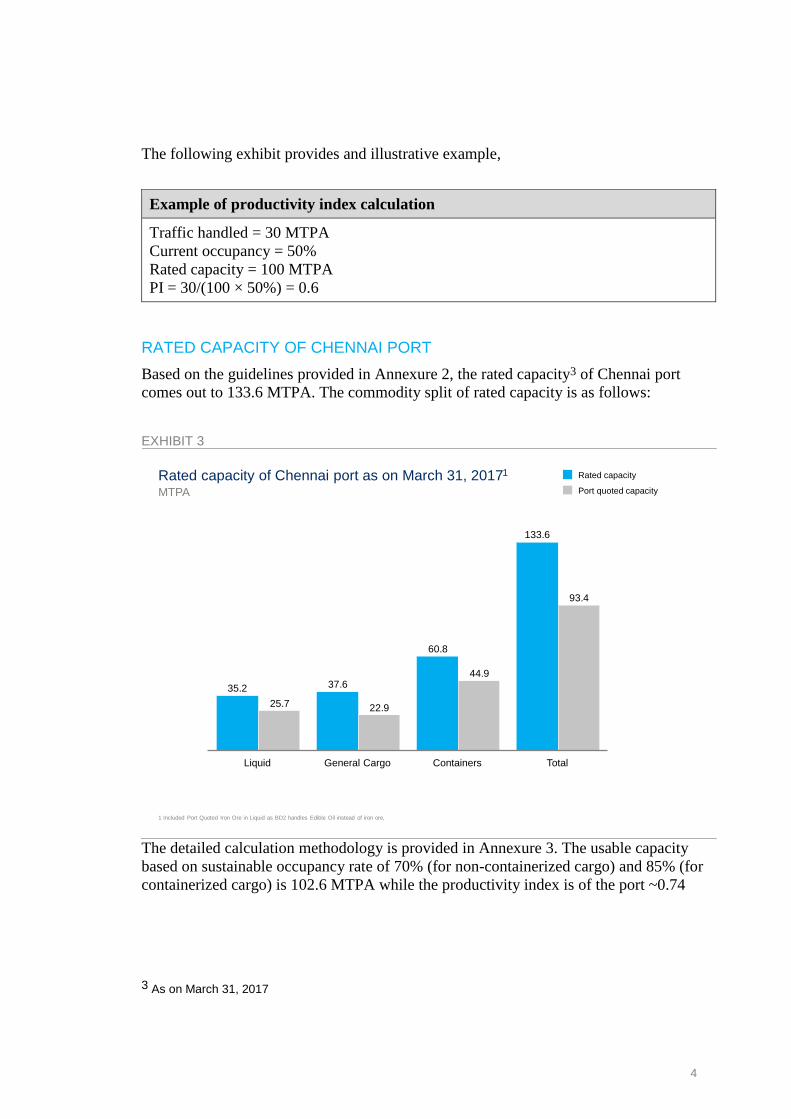
4
The following exhibit provides and illustrative example,
Example of productivity index calculation
Traffic handled = 30 MTPA
Current occupancy = 50%
Rated capacity = 100 MTPA
PI = 30/(100 × 50%) = 0.6
RATED CAPACITY OF CHENNAI PORT
Based on the guidelines provided in Annexure 2, the rated capacity3 of Chennai port
comes out to 133.6 MTPA. The commodity split of rated capacity is as follows:
EXHIBIT 3
The detailed calculation methodology is provided in Annexure 3. The usable capacity
based on sustainable occupancy rate of 70% (for non-containerized cargo) and 85% (for
containerized cargo) is 102.6 MTPA while the productivity index is of the port ~0.74
3 As on March 31, 2017
Rated capacity of Chennai port as on March 31, 20171
133.6
60.8
37.635.2
93.4
44.9
22.925.7
Liquid TotalContainersGeneral Cargo
Rated capacity
Port quoted capacityMTPA
1 Included Port Quoted Iron Ore in Liquid as BD2 handles Edible Oil instead of iron ore,
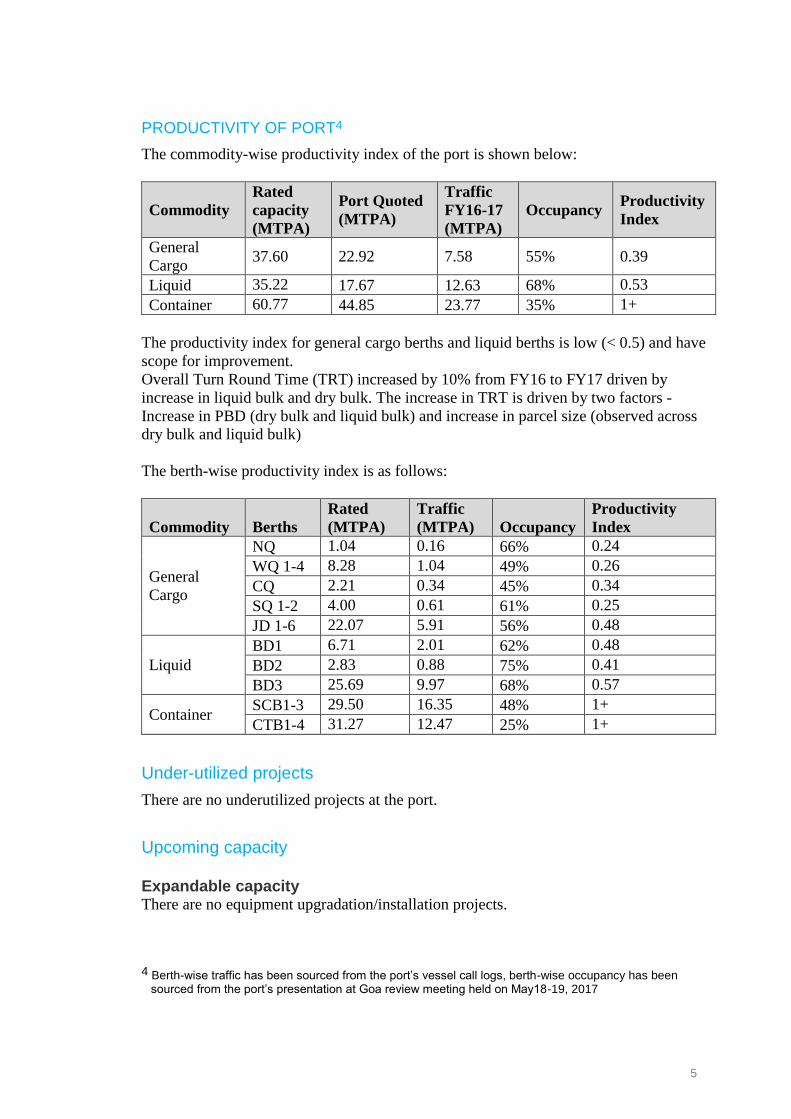
5
PRODUCTIVITY OF PORT4
The commodity-wise productivity index of the port is shown below:
Commodity
Rated
capacity
(MTPA)
Port Quoted
(MTPA)
Traffic
FY16-17
(MTPA)
Occupancy Productivity
Index
General
Cargo 37.60 22.92 7.58 55% 0.39
Liquid 35.22 17.67 12.63 68% 0.53
Container 60.77 44.85 23.77 35% 1+
The productivity index for general cargo berths and liquid berths is low (< 0.5) and have
scope for improvement.
Overall Turn Round Time (TRT) increased by 10% from FY16 to FY17 driven by
increase in liquid bulk and dry bulk. The increase in TRT is driven by two factors -
Increase in PBD (dry bulk and liquid bulk) and increase in parcel size (observed across
dry bulk and liquid bulk)
The berth-wise productivity index is as follows:
Commodity Berths
Rated
(MTPA)
Traffic
(MTPA) Occupancy
Productivity
Index
General
Cargo
NQ 1.04 0.16 66% 0.24
WQ 1-4 8.28 1.04 49% 0.26
CQ 2.21 0.34 45% 0.34
SQ 1-2 4.00 0.61 61% 0.25
JD 1-6 22.07 5.91 56% 0.48
Liquid
BD1 6.71 2.01 62% 0.48
BD2 2.83 0.88 75% 0.41
BD3 25.69 9.97 68% 0.57
Container SCB1-3 29.50 16.35 48% 1+
CTB1-4 31.27 12.47 25% 1+
Under-utilized projects
There are no underutilized projects at the port.
Upcoming capacity
Expandable capacity There are no equipment upgradation/installation projects.
4 Berth-wise traffic has been sourced from the port’s vessel call logs, berth-wise occupancy has been
sourced from the port’s presentation at Goa review meeting held on May18-19, 2017
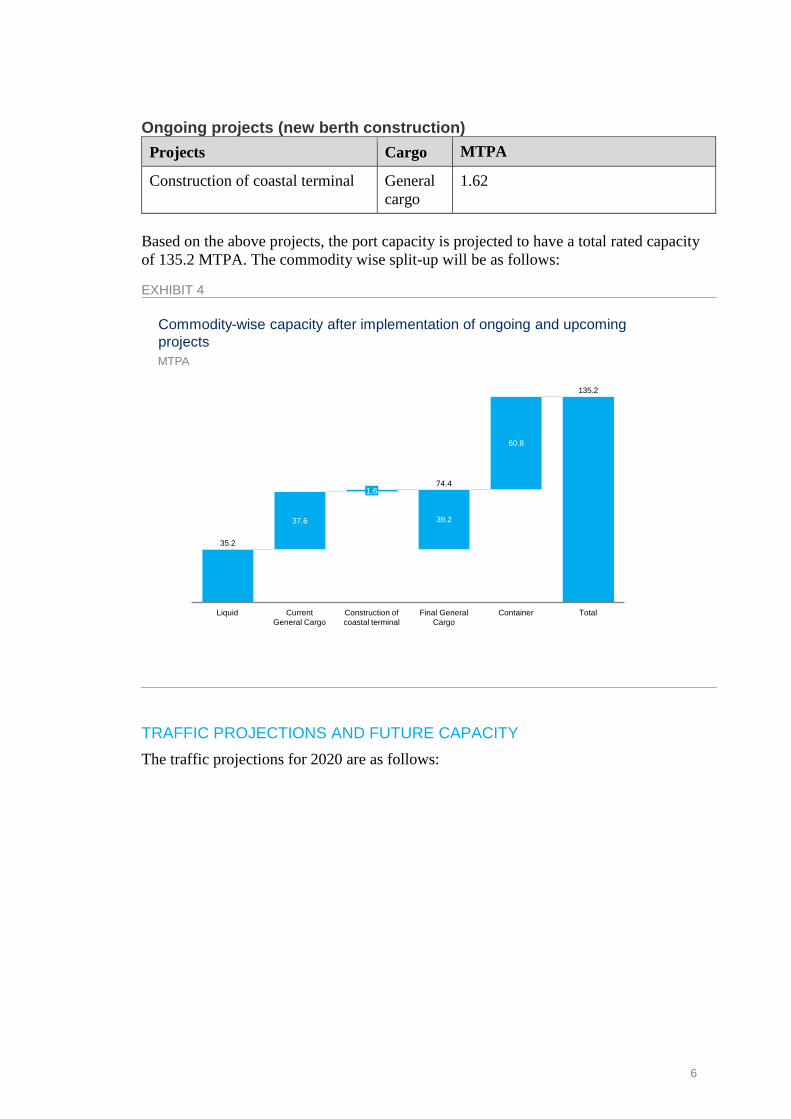
6
Ongoing projects (new berth construction)
Projects Cargo MTPA
Construction of coastal terminal General
cargo
1.62
Based on the above projects, the port capacity is projected to have a total rated capacity
of 135.2 MTPA. The commodity wise split-up will be as follows:
EXHIBIT 4
TRAFFIC PROJECTIONS AND FUTURE CAPACITY
The traffic projections for 2020 are as follows:
MTPA
Commodity-wise capacity after implementation of ongoing and upcoming
projects
135.2
35.2
60.8
37.6 39.2
Total
1.6
Liquid Current
General Cargo
Construction of
coastal terminal
Final General
Cargo
Container
74.4
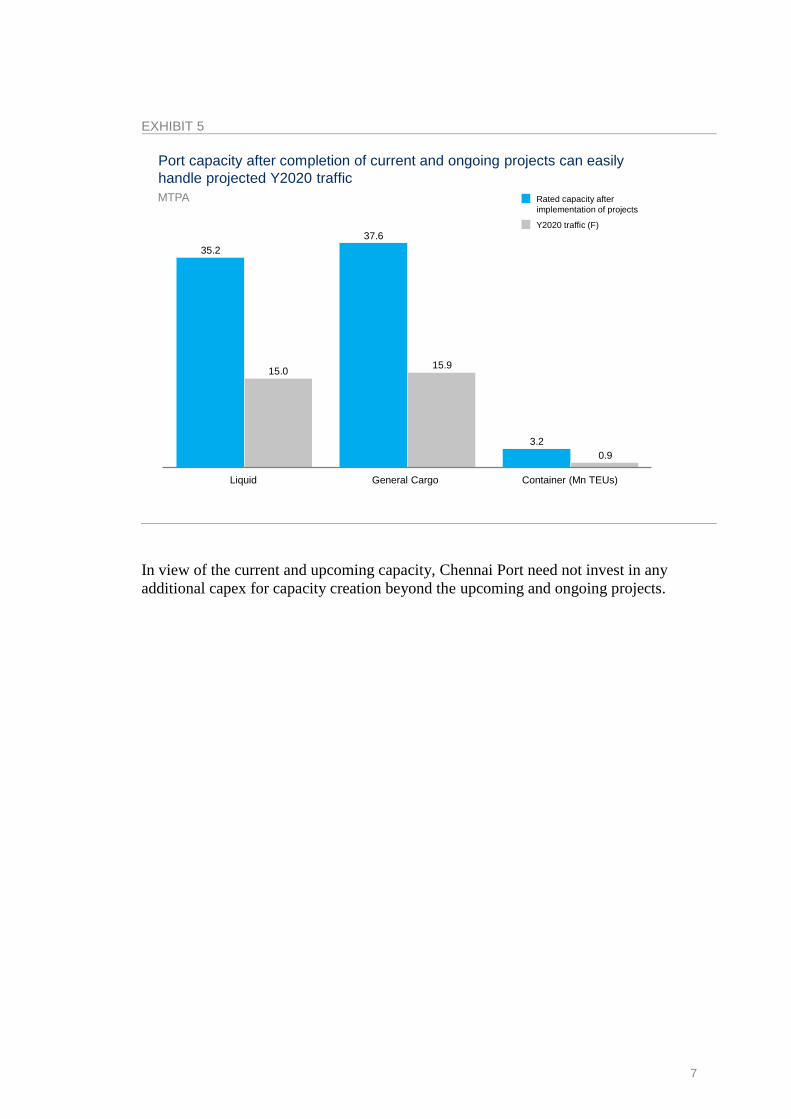
7
EXHIBIT 5
In view of the current and upcoming capacity, Chennai Port need not invest in any
additional capex for capacity creation beyond the upcoming and ongoing projects.
Port capacity after completion of current and ongoing projects can easily
handle projected Y2020 traffic
MTPA
3.2
37.6
35.2
0.9
15.915.0
Container (Mn TEUs)General CargoLiquid
Y2020 traffic (F)
Rated capacity after
implementation of projects
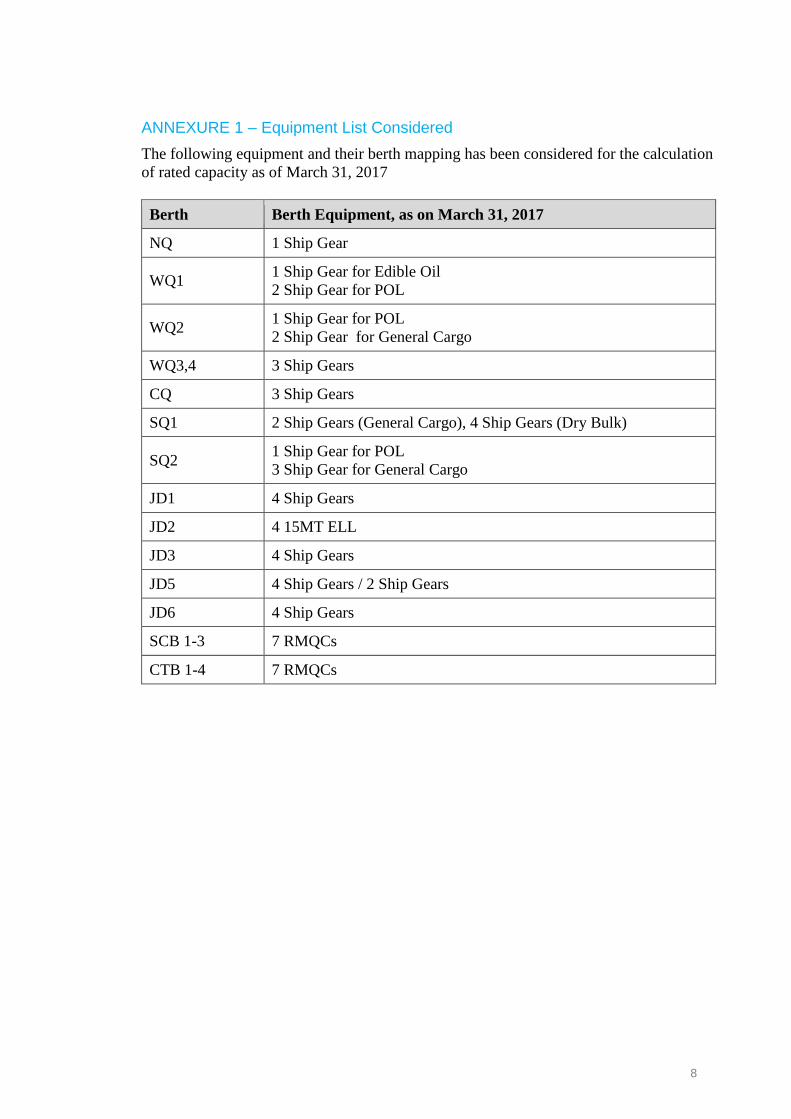
8
ANNEXURE 1 – Equipment List Considered
The following equipment and their berth mapping has been considered for the calculation
of rated capacity as of March 31, 2017
Berth Berth Equipment, as on March 31, 2017
NQ 1 Ship Gear
WQ1 1 Ship Gear for Edible Oil
2 Ship Gear for POL
WQ2 1 Ship Gear for POL
2 Ship Gear for General Cargo
WQ3,4 3 Ship Gears
CQ 3 Ship Gears
SQ1 2 Ship Gears (General Cargo), 4 Ship Gears (Dry Bulk)
SQ2 1 Ship Gear for POL
3 Ship Gear for General Cargo
JD1 4 Ship Gears
JD2 4 15MT ELL
JD3 4 Ship Gears
JD5 4 Ship Gears / 2 Ship Gears
JD6 4 Ship Gears
SCB 1-3 7 RMQCs
CTB 1-4 7 RMQCs
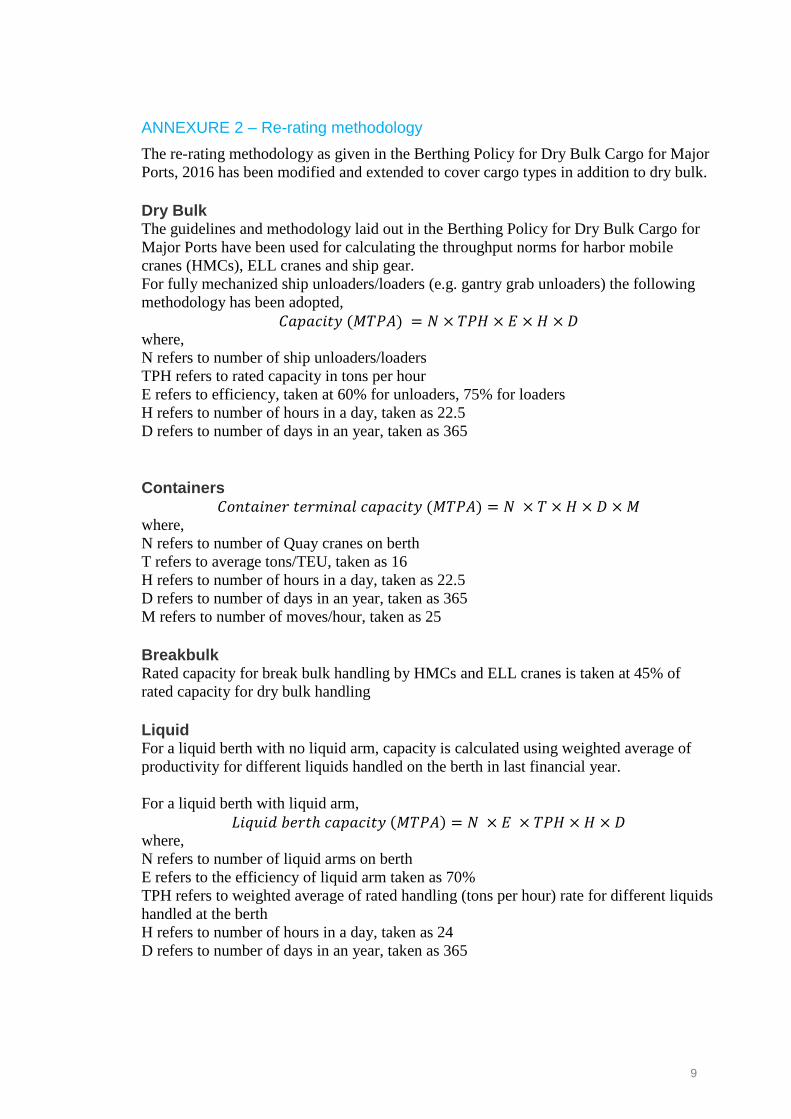
9
ANNEXURE 2 – Re-rating methodology
The re-rating methodology as given in the Berthing Policy for Dry Bulk Cargo for Major
Ports, 2016 has been modified and extended to cover cargo types in addition to dry bulk.
Dry Bulk The guidelines and methodology laid out in the Berthing Policy for Dry Bulk Cargo for
Major Ports have been used for calculating the throughput norms for harbor mobile
cranes (HMCs), ELL cranes and ship gear.
For fully mechanized ship unloaders/loaders (e.g. gantry grab unloaders) the following
methodology has been adopted,
𝐶𝑎𝑝𝑎𝑐𝑖𝑡𝑦 (𝑀𝑇𝑃𝐴) = 𝑁 × 𝑇𝑃𝐻 × 𝐸 × 𝐻 × 𝐷 where,
N refers to number of ship unloaders/loaders
TPH refers to rated capacity in tons per hour
E refers to efficiency, taken at 60% for unloaders, 75% for loaders
H refers to number of hours in a day, taken as 22.5
D refers to number of days in an year, taken as 365
Containers 𝐶𝑜𝑛𝑡𝑎𝑖𝑛𝑒𝑟 𝑡𝑒𝑟𝑚𝑖𝑛𝑎𝑙 𝑐𝑎𝑝𝑎𝑐𝑖𝑡𝑦 (𝑀𝑇𝑃𝐴) = 𝑁 × 𝑇 × 𝐻 × 𝐷 × 𝑀
where,
N refers to number of Quay cranes on berth
T refers to average tons/TEU, taken as 16
H refers to number of hours in a day, taken as 22.5
D refers to number of days in an year, taken as 365
M refers to number of moves/hour, taken as 25
Breakbulk Rated capacity for break bulk handling by HMCs and ELL cranes is taken at 45% of
rated capacity for dry bulk handling
Liquid For a liquid berth with no liquid arm, capacity is calculated using weighted average of
productivity for different liquids handled on the berth in last financial year.
For a liquid berth with liquid arm,
𝐿𝑖𝑞𝑢𝑖𝑑 𝑏𝑒𝑟𝑡ℎ 𝑐𝑎𝑝𝑎𝑐𝑖𝑡𝑦 (𝑀𝑇𝑃𝐴) = 𝑁 × 𝐸 × 𝑇𝑃𝐻 × 𝐻 × 𝐷 where,
N refers to number of liquid arms on berth
E refers to the efficiency of liquid arm taken as 70%
TPH refers to weighted average of rated handling (tons per hour) rate for different liquids
handled at the berth
H refers to number of hours in a day, taken as 24
D refers to number of days in an year, taken as 365
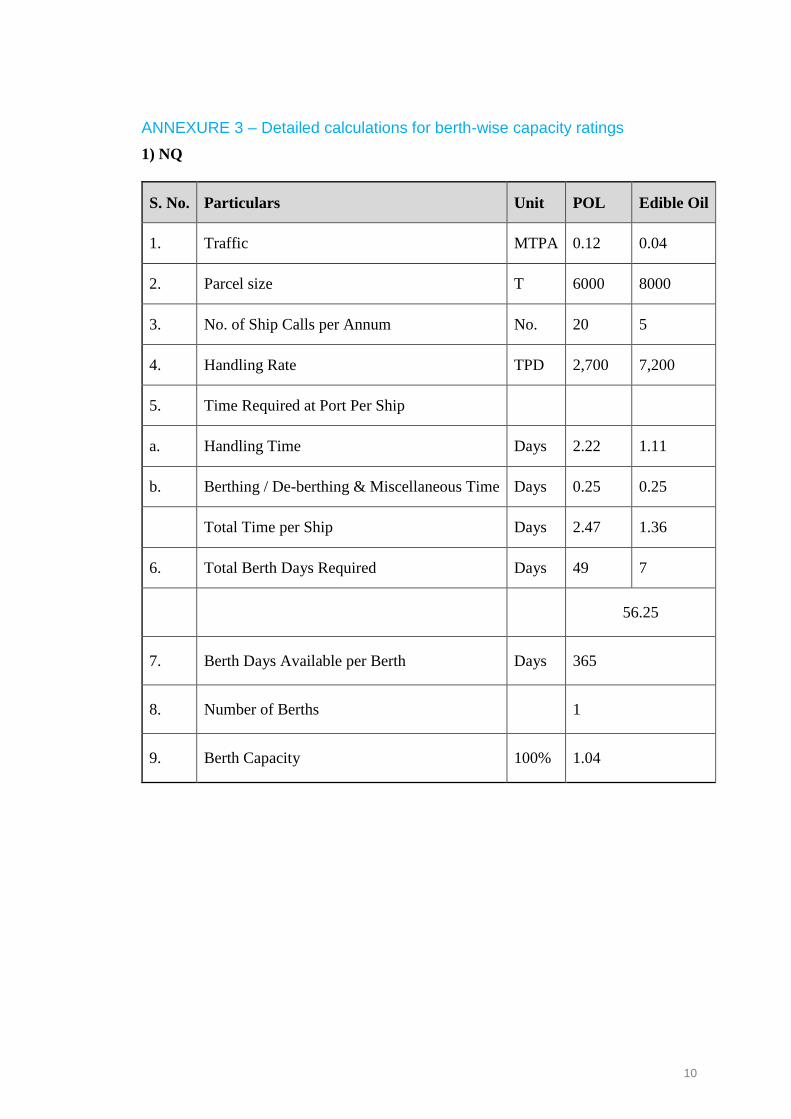
10
ANNEXURE 3 – Detailed calculations for berth-wise capacity ratings
1) NQ
S. No. Particulars Unit POL Edible Oil
1. Traffic MTPA 0.12 0.04
2. Parcel size T 6000 8000
3. No. of Ship Calls per Annum No. 20 5
4. Handling Rate TPD 2,700 7,200
5. Time Required at Port Per Ship
a. Handling Time Days 2.22 1.11
b. Berthing / De-berthing & Miscellaneous Time Days 0.25 0.25
Total Time per Ship Days 2.47 1.36
6. Total Berth Days Required Days 49 7
56.25
7. Berth Days Available per Berth Days 365
8. Number of Berths 1
9. Berth Capacity 100% 1.04

11
2) WQ 1
S.
No. Particulars Unit
General
Cargo POL
1. Traffic MTPA 0.2 0.16
2. Parcel size T 8000 6000
3. No. of Ship Calls per Annum No. 25 27
4. Handling Rate TPD 5,400
3,600
5. Time Required at Port Per Ship
a. Handling Time Days 1.48 1.67
b. Berthing / Deberthing & Miscellaneous
Time Days 0.25 0.25
Total Time per Ship Days 1.73 1.92
6. Total Berth Days Required Days 43 51
94
7. Berth Days Available per Berth Days 365
8. Number of Berths 1
9. Berth Capacity 100% 1.39
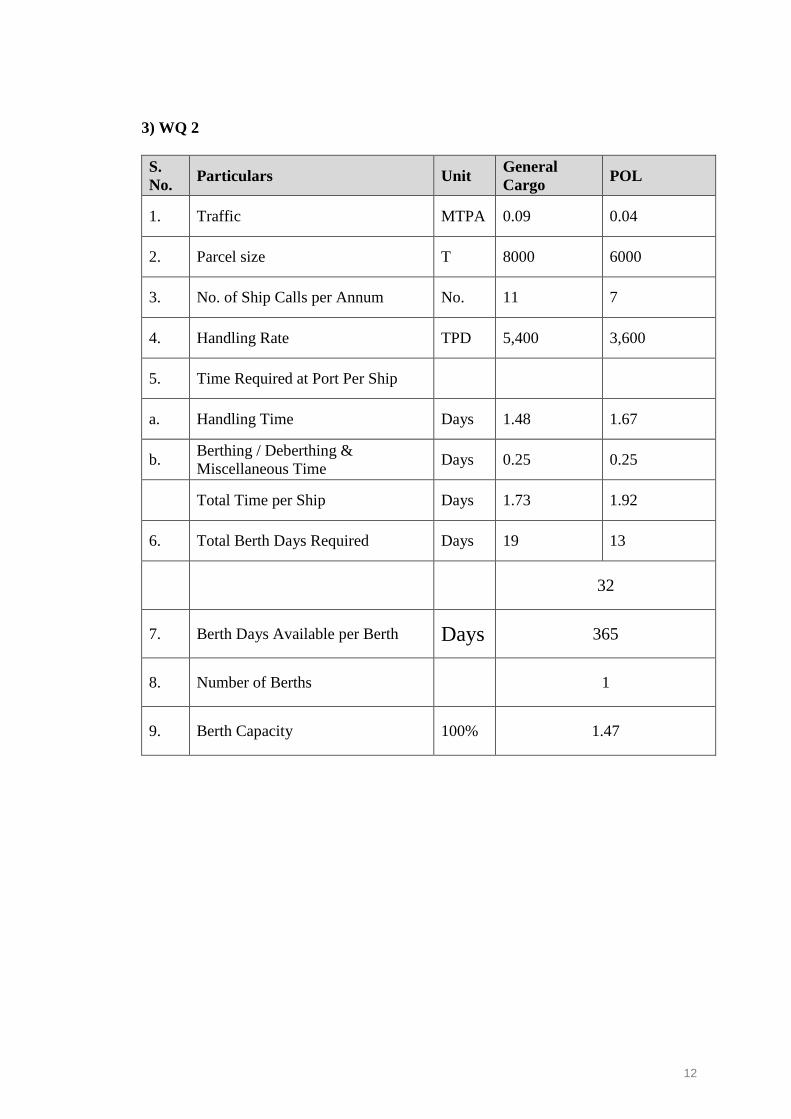
12
3) WQ 2
S.
No. Particulars Unit
General
Cargo POL
1. Traffic MTPA 0.09 0.04
2. Parcel size T 8000 6000
3. No. of Ship Calls per Annum No. 11 7
4. Handling Rate TPD 5,400 3,600
5. Time Required at Port Per Ship
a. Handling Time Days 1.48 1.67
b. Berthing / Deberthing &
Miscellaneous Time Days 0.25 0.25
Total Time per Ship Days 1.73 1.92
6. Total Berth Days Required Days 19 13
32
7. Berth Days Available per Berth Days 365
8. Number of Berths 1
9. Berth Capacity 100% 1.47
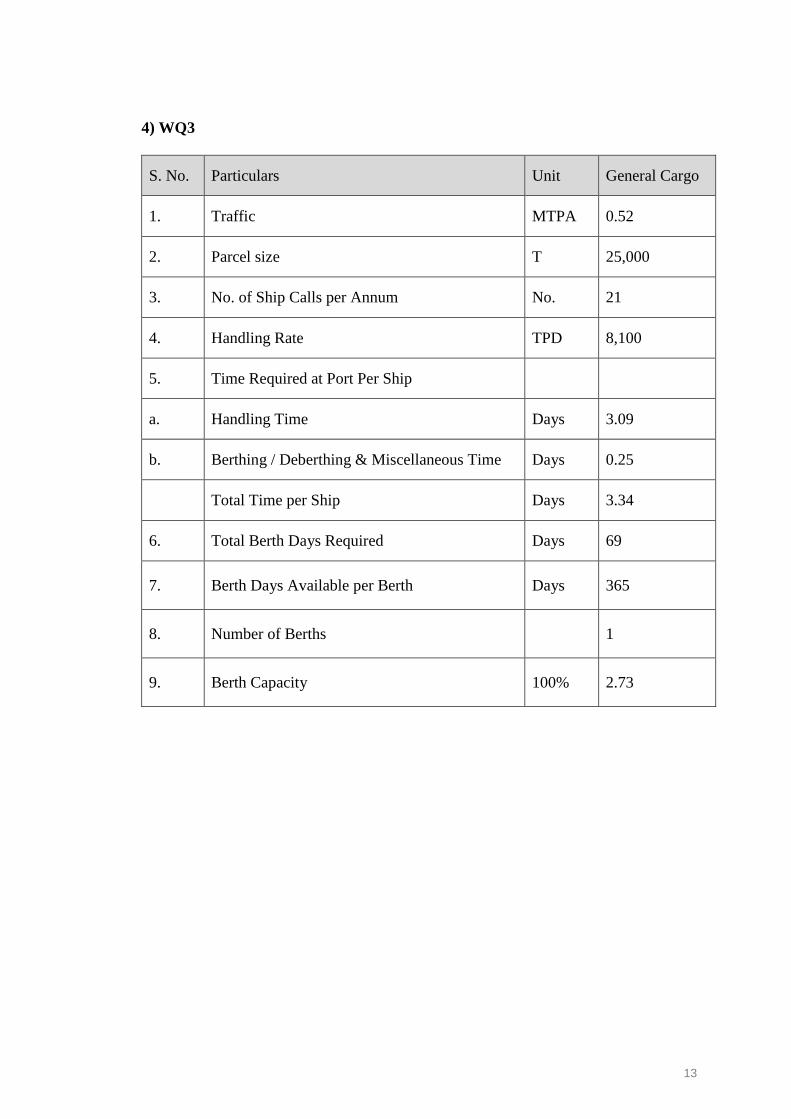
13
4) WQ3
S. No. Particulars Unit General Cargo
1. Traffic MTPA 0.52
2. Parcel size T 25,000
3. No. of Ship Calls per Annum No. 21
4. Handling Rate TPD 8,100
5. Time Required at Port Per Ship
a. Handling Time Days 3.09
b. Berthing / Deberthing & Miscellaneous Time Days 0.25
Total Time per Ship Days 3.34
6. Total Berth Days Required Days 69
7. Berth Days Available per Berth Days 365
8. Number of Berths 1
9. Berth Capacity 100% 2.73

14
5) WQ 4
S. No. Particulars Unit General Cargo
1. Traffic MTPA 0.20
2. Parcel size T 20,000
3. No. of Ship Calls per Annum No. 10
4. Handling Rate TPD 8,100
5. Time Required at Port Per Ship
a. Handling Time Days 2.47
b. Berthing / Deberthing & Miscellaneous Time Days 0.25
Total Time per Ship Days 2.72
6. Total Berth Days Required Days 27
7. Berth Days Available per Berth Days 365
8. Number of Berths 1
9. Berth Capacity 100% 2.68
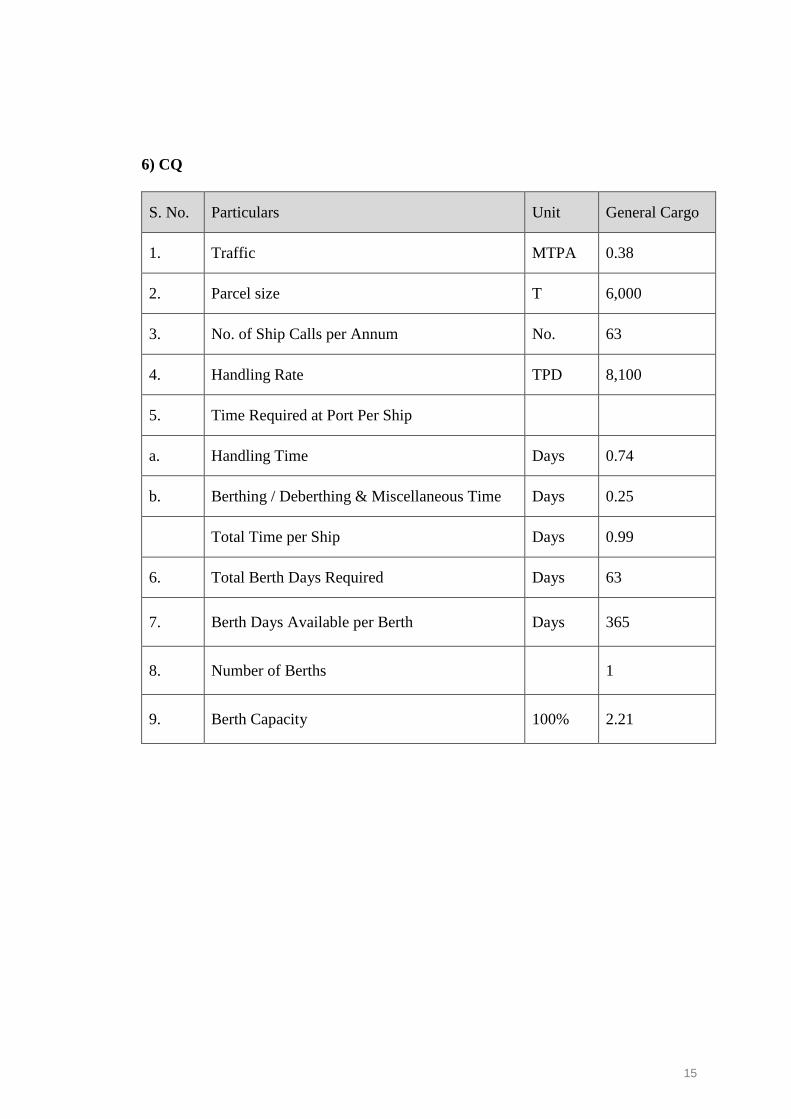
15
6) CQ
S. No. Particulars Unit General Cargo
1. Traffic MTPA 0.38
2. Parcel size T 6,000
3. No. of Ship Calls per Annum No. 63
4. Handling Rate TPD 8,100
5. Time Required at Port Per Ship
a. Handling Time Days 0.74
b. Berthing / Deberthing & Miscellaneous Time Days 0.25
Total Time per Ship Days 0.99
6. Total Berth Days Required Days 63
7. Berth Days Available per Berth Days 365
8. Number of Berths 1
9. Berth Capacity 100% 2.21

16
7) SQ1
S.
No. Particulars Unit
General
Cargo
Other Dry
bulk
1. Traffic MTPA 0.25
0.25
2. Parcel size T
8,000
25,000
3. No. of Ship Calls per Annum No. 31 10
4. Handling Rate TPD 5,400 18,000
5. Time Required at Port Per Ship
a. Handling Time Days 1.48 1.39
b. Berthing / Deberthing &
Miscellaneous Time Days 0.25 0.25
Total Time per Ship Days 1.73 1.64
6. Total Berth Days Required Days 54 16
70
7. Berth Days Available per Berth Days 365
8. Number of Berths 1
9. Berth Capacity 100% 2.59

17
8) SQ2
Particulars Unit General Cargo POL
Traffic MTPA 0.05 0.13
Parcel size T
8,000
12,000
No. of Ship Calls per Annum No. 6 11
Handling Rate TPD 8,100 3,600
Time Required at Port Per Ship
Handling Time Days 0.99 3.33
Berthing / Deberthing &
Miscellaneous Time Days 0.25 0.25
Total Time per Ship Days 1.24 3.58
Total Berth Days Required Days 8 39
47
Berth Days Available per Berth Days 365
Number of Berths 1
Berth Capacity 100% 1.41

18
9) JD1
S. No. Particulars Unit Dry Bulk
1. Traffic MTPA 0.59
2. Parcel size T 25,000
3. No. of Ship Calls per Annum No. 24
4. Handling Rate TPD 12,849
5. Time Required at Port Per Ship
a. Handling Time Days 1.95
b. Berthing / Deberthing & Miscellaneous Time Days 0.25
Total Time per Ship Days 2.20
6. Total Berth Days Required Days 52
52
7. Berth Days Available per Berth Days 365
8. Number of Berths 1
9. Berth Capacity 100% 4.16
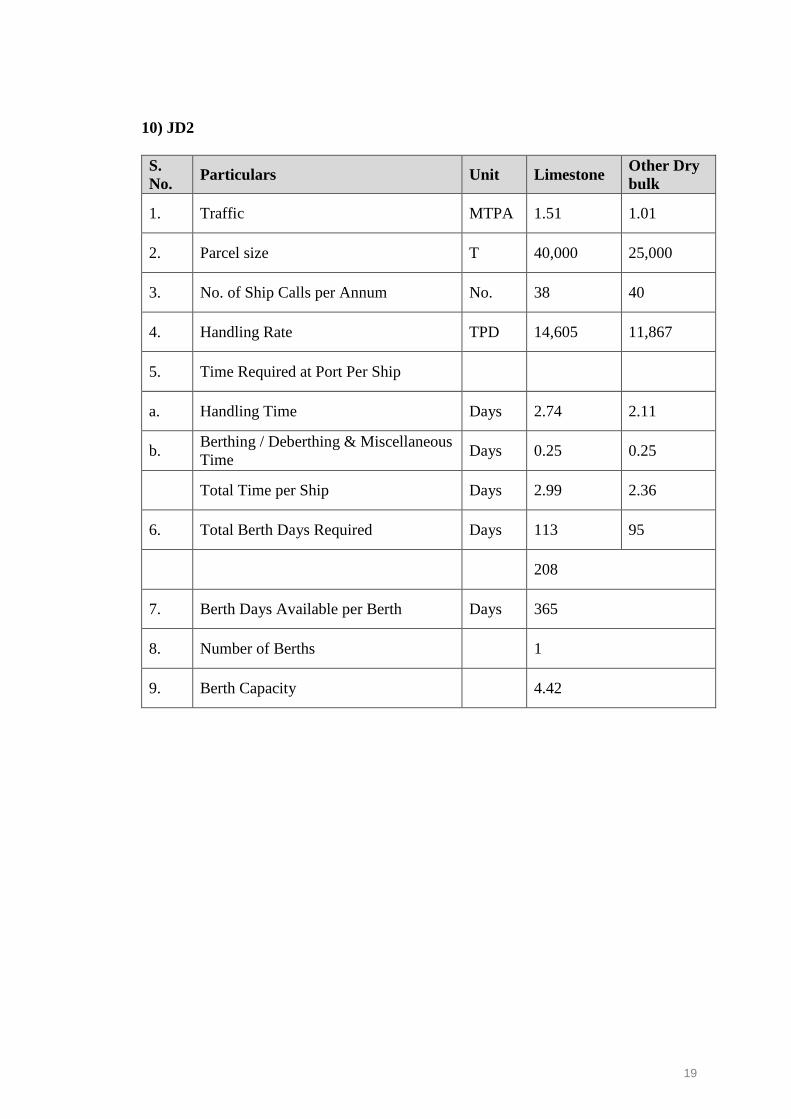
19
10) JD2
S.
No. Particulars Unit Limestone
Other Dry
bulk
1. Traffic MTPA 1.51 1.01
2. Parcel size T 40,000 25,000
3. No. of Ship Calls per Annum No. 38 40
4. Handling Rate TPD 14,605 11,867
5. Time Required at Port Per Ship
a. Handling Time Days 2.74 2.11
b. Berthing / Deberthing & Miscellaneous
Time Days 0.25 0.25
Total Time per Ship Days 2.99 2.36
6. Total Berth Days Required Days 113 95
208
7. Berth Days Available per Berth Days 365
8. Number of Berths 1
9. Berth Capacity 4.42

20
11) JD3
S. No. Particulars Unit Dry Bulk
1. Traffic MTPA 0.54
2. Parcel size T 45,000
3. No. of Ship Calls per Annum No. 12
4. Handling Rate TPD 12,691
5. Time Required at Port Per Ship
a. Handling Time Days 3.55
b. Berthing / Deberthing & Miscellaneous Time Days 0.25
Total Time per Ship Days 3.80
6. Total Berth Days Required Days 46
7. Berth Days Available per Berth Days 365
8. Number of Berths 1
9. Berth Capacity 100% 4.33

21
12) JD4
S.
No. Particulars Unit
General Cargo
Dry Bulk
1. Traffic MTPA 0.30 0.39
2. Parcel size T 8,000 25,000
3. No. of Ship Calls per Annum No. 38 16
4. Handling Rate TPD 5,400 18,000
5. Time Required at Port Per Ship
a. Handling Time Days 1.48 1.39
b. Berthing / Deberthing &
Miscellaneous Time Days 0.25 0.25
Total Time per Ship Days 1.73 1.64
6. Total Berth Days Required Days 65 26
90
7. Berth Days Available per Berth Days 365
8. Number of Berths 1
9. Berth Capacity 2.78
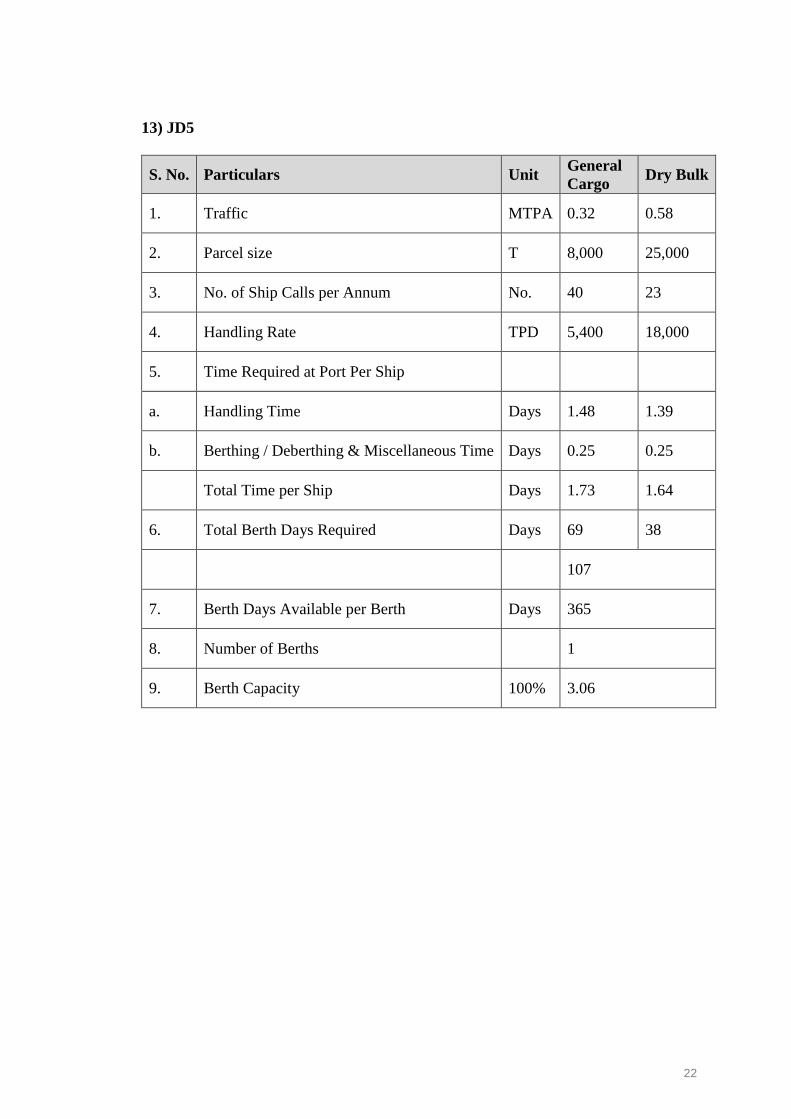
22
13) JD5
S. No. Particulars Unit General
Cargo Dry Bulk
1. Traffic MTPA 0.32 0.58
2. Parcel size T 8,000 25,000
3. No. of Ship Calls per Annum No. 40 23
4. Handling Rate TPD 5,400 18,000
5. Time Required at Port Per Ship
a. Handling Time Days 1.48 1.39
b. Berthing / Deberthing & Miscellaneous Time Days 0.25 0.25
Total Time per Ship Days 1.73 1.64
6. Total Berth Days Required Days 69 38
107
7. Berth Days Available per Berth Days 365
8. Number of Berths 1
9. Berth Capacity 100% 3.06
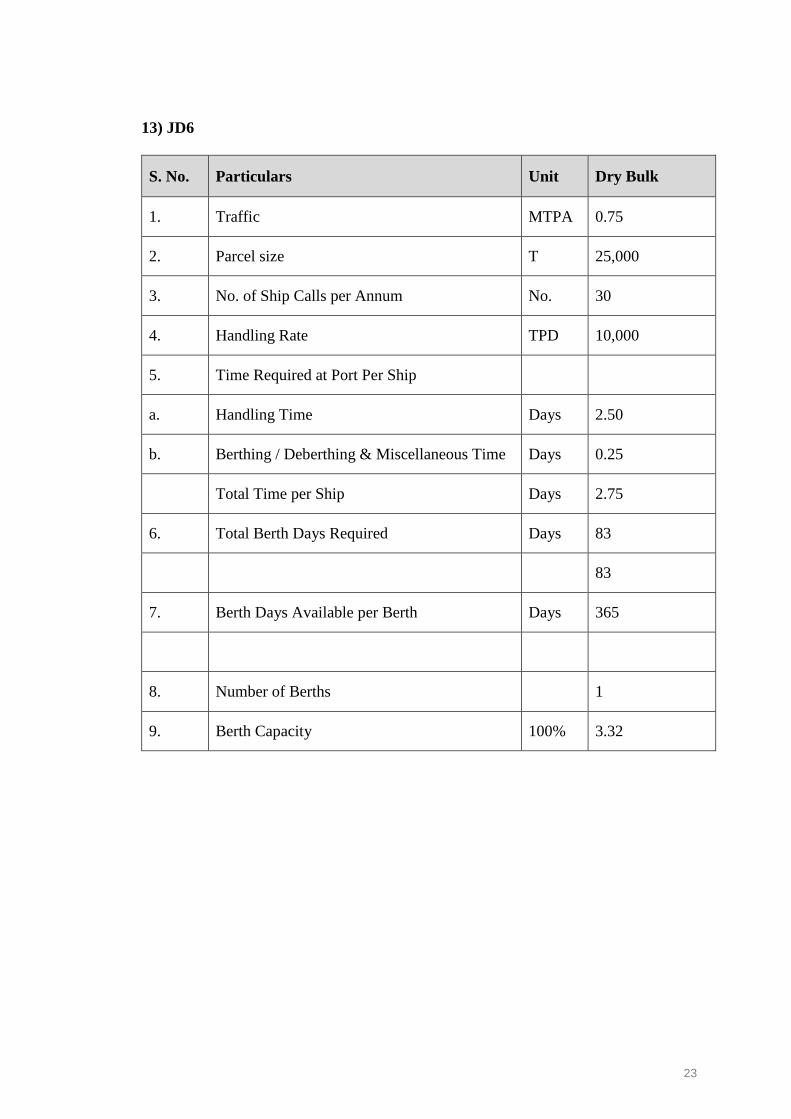
23
13) JD6
S. No. Particulars Unit Dry Bulk
1. Traffic MTPA 0.75
2. Parcel size T 25,000
3. No. of Ship Calls per Annum No. 30
4. Handling Rate TPD 10,000
5. Time Required at Port Per Ship
a. Handling Time Days 2.50
b. Berthing / Deberthing & Miscellaneous Time Days 0.25
Total Time per Ship Days 2.75
6. Total Berth Days Required Days 83
83
7. Berth Days Available per Berth Days 365
8. Number of Berths 1
9. Berth Capacity 100% 3.32

24
14) BD1
S.
No. Particulars Unit Crude POL
1. Traffic MTPA 0.19 1.81
2. Parcel size T
50,000
16,000
3. No. of Ship Calls per Annum No. 4 113
4. Handling Rate TPD 63,000 23,625
5. Time Required at Port Per Ship
a. Handling Time Days 0.79 0.68
b. Berthing / Deberthing &
Miscellaneous Time Days 0.25 0.25
Total Time per Ship Days 1.04 0.93
6. Total Berth Days Required Days 4 105
109
7. Berth Days Available per Berth Days 365
8. Number of Berths 1
9. Berth Capacity 100% 6.71

25
15) BD2
S. No. Particulars Unit POL
1. Traffic MTPA 0.86
2. Parcel size T 8,000
3. No. of Ship Calls per Annum No. 108
4. Handling Rate TPD 10,238
5. Time Required at Port Per Ship
a. Handling Time Days 0.78
b. Berthing / Deberthing & Miscellaneous Time Days 0.25
Total Time per Ship Days 1.03
6. Total Berth Days Required Days 111
7. Berth Days Available per Berth Days 365
8. Number of Berths 1
9. Berth Capacity 100% 2.83
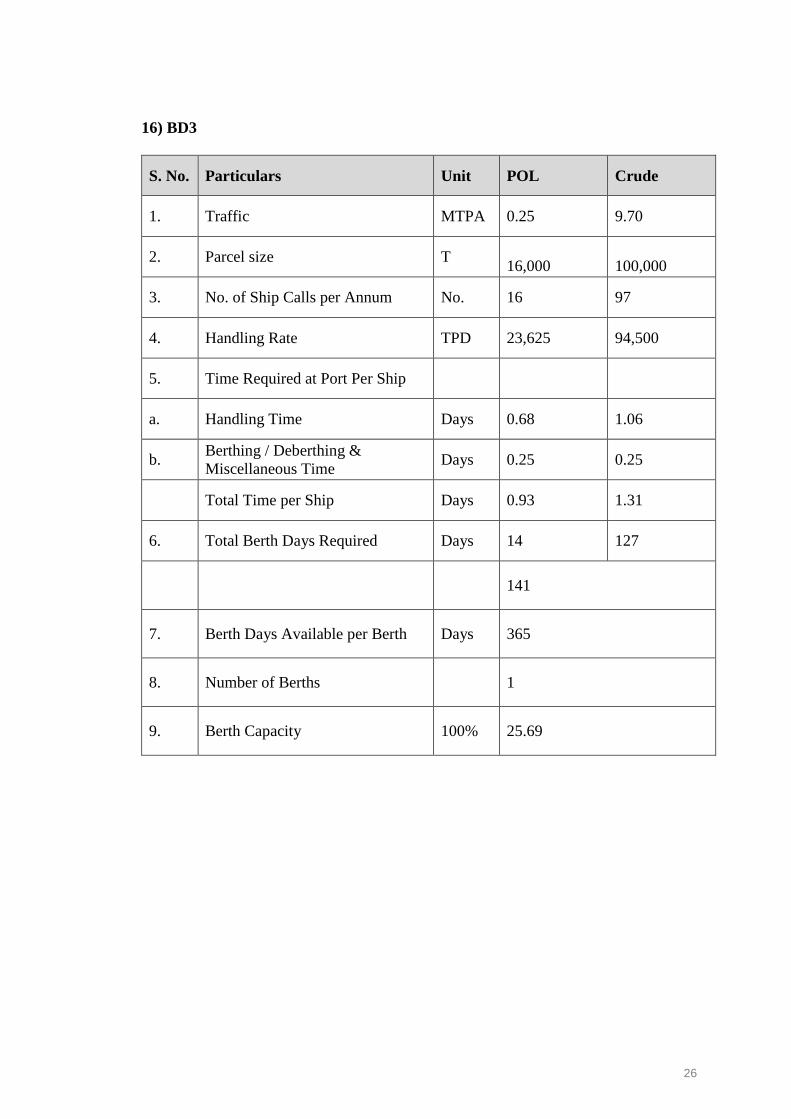
26
16) BD3
S. No. Particulars Unit POL Crude
1. Traffic MTPA 0.25 9.70
2. Parcel size T
16,000
100,000
3. No. of Ship Calls per Annum No. 16 97
4. Handling Rate TPD 23,625 94,500
5. Time Required at Port Per Ship
a. Handling Time Days 0.68 1.06
b. Berthing / Deberthing &
Miscellaneous Time Days 0.25 0.25
Total Time per Ship Days 0.93 1.31
6. Total Berth Days Required Days 14 127
141
7. Berth Days Available per Berth Days 365
8. Number of Berths 1
9. Berth Capacity 100% 25.69
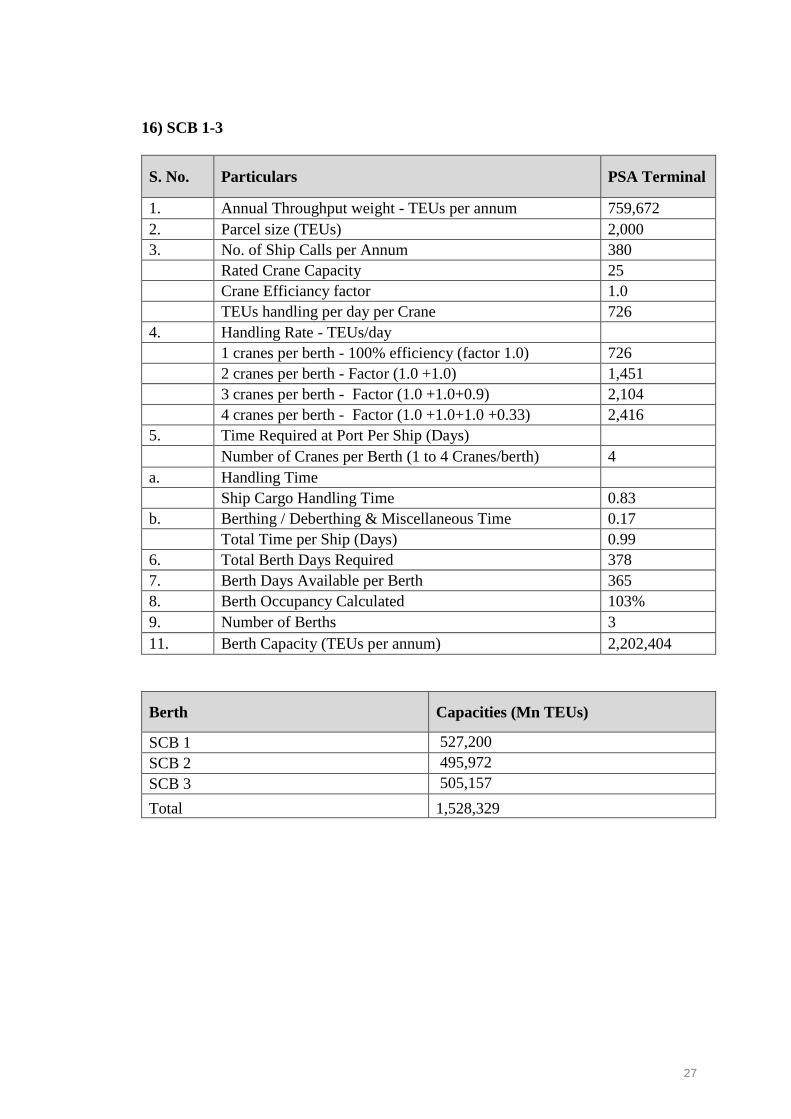
27
16) SCB 1-3
S. No. Particulars PSA Terminal
1. Annual Throughput weight - TEUs per annum 759,672
2. Parcel size (TEUs) 2,000
3. No. of Ship Calls per Annum 380
Rated Crane Capacity 25
Crane Efficiancy factor 1.0
TEUs handling per day per Crane 726
4. Handling Rate - TEUs/day
1 cranes per berth - 100% efficiency (factor 1.0) 726
2 cranes per berth - Factor (1.0 +1.0) 1,451
3 cranes per berth - Factor (1.0 +1.0+0.9) 2,104
4 cranes per berth - Factor (1.0 +1.0+1.0 +0.33) 2,416
5. Time Required at Port Per Ship (Days)
Number of Cranes per Berth (1 to 4 Cranes/berth) 4
a. Handling Time
Ship Cargo Handling Time 0.83
b. Berthing / Deberthing & Miscellaneous Time 0.17
Total Time per Ship (Days) 0.99
6. Total Berth Days Required 378
7. Berth Days Available per Berth 365
8. Berth Occupancy Calculated 103%
9. Number of Berths 3
11. Berth Capacity (TEUs per annum) 2,202,404
Berth Capacities (Mn TEUs)
SCB 1 527,200
SCB 2 495,972
SCB 3 505,157
Total 1,528,329

28
17) CTB 1-4
S. No. Particulars CTB
1. Annual Throughput - TEUs per annum 770,021
2. Parcel size (TEUs) 2,200
3. No. of Ship Calls per Annum 350
Rated Crane Capacity 25
Crane Efficiancy factor 1.0
TEUs handling per day per Crane 726
4. Handling Rate - TEUs/day
1 cranes per berth - 100% efficiency (factor 1.0) 726
2 cranes per berth - Factor (1.0 +0.75) 1,270
3 cranes per berth - Factor (1.0 +1.0+0.9) 2,104
4 cranes per berth - Factor (1.0 +1.0+0.9 +0.9) 2,757
5. Time Required at Port Per Ship (Days)
Number of Cranes per Berth (1 to 4 Cranes/berth) 2
a. Handling Time
Ship Cargo Handling Time 1.73
b. Berthing / Deberthing & Miscellaneous Time 0.25
Total Time per Ship (Days) 1.98
6. Total Berth Days Required 694
7. Berth Days Available per Berth 365
8. Berth Occupancy Calculated 190%
9. Number of Berths Proposed 4
10. Berth Occupancy Proposed 100%
11. Annual Throughput Estimated(TEUs per annum) 1,620,179
12. Container Quay Length(m) 885
13. Container Throughput per meter berth 1,831
14. Total Quay Canes Provided 7
Berth Capacity (Mn TEUs)
CTB 1 366,142
CTB 2 366,142
CTB 3 366,142
CTB 4 521,753
Total 1,620,179