asynchrony among local communities stabilises ecosystem
TRANSCRIPT
LETTER Asynchrony among local communities stabilises ecosystem
function of metacommunities
Kevin R. Wilcox,1*,a,c Andrew
T. Tredennick,2*,a Sally
E. Koerner,3,c Emily Grman,4,c
Lauren M. Hallett,5 Meghan
L. Avolio,6,b Kimberly J.
La Pierre,7,b Gregory R.
Houseman,8,c Forest Isbell,9,c David
Samuel Johnson,10,c Juha M.
Alatalo,11 Andrew H. Baldwin,12
Edward W. Bork,13 Elizabeth
H. Boughton,14 William D.
Bowman,15 Andrea J. Britton,16
James F. Cahill Jr.,17 Scott
L. Collins,18 Guozhen Du,19
Anu Eskelinen,20,21,22 Laura
Gough,23 Anke Jentsch,24 Christel
Kern,25 Kari Klanderud,26 Alan K.
Knapp,27 Juergen Kreyling,28
Yiqi Luo,1,29,30 Jennie R.
McLaren,31 Patrick Megonigal,32
Vladimir Onipchenko,33 Janet
Prev�ey,34 Jodi N. Price,35 Clare
H. Robinson,36 Osvaldo E. Sala,37
Melinda D. Smith,27 Nadejda A.
Soudzilovskaia,38 Lara Souza,1,39
David Tilman,40 Shannon R.
White,41 Zhuwen Xu,42 Laura
Yahdjian,43 Qiang Yu,44 Pengfei
Zhang,19 and Yunhai Zhang45,46
Abstract
Temporal stability of ecosystem functioning increases the predictability and reliability of ecosys-tem services, and understanding the drivers of stability across spatial scales is important for landmanagement and policy decisions. We used species-level abundance data from 62 plant communi-ties across five continents to assess mechanisms of temporal stability across spatial scales. Weassessed how asynchrony (i.e. different units responding dissimilarly through time) of species andlocal communities stabilised metacommunity ecosystem function. Asynchrony of species increasedstability of local communities, and asynchrony among local communities enhanced metacommu-nity stability by a wide range of magnitudes (1–315%); this range was positively correlated withthe size of the metacommunity. Additionally, asynchronous responses among local communitieswere linked with species’ populations fluctuating asynchronously across space, perhaps stemmingfrom physical and/or competitive differences among local communities. Accordingly, we suggestspatial heterogeneity should be a major focus for maintaining the stability of ecosystem services atlarger spatial scales.
Keywords
Alpha diversity, alpha variability, beta diversity, biodiversity, CoRRE data base, patchiness, plantcommunities, primary productivity, species synchrony.
Ecology Letters (2017) 20: 1534–1545
1Department of Microbiology and Plant Biology, University of Oklahoma, 770
Van Vleet Oval, Norman, OK 73019, USA2Department of Wildland Resources and the Ecology Center, Utah State
University, 5230 Old Main Hill, Logan, UT 84321, USA3Department of Biology, University of North Carolina Greensboro, Greens-
boro, NC 27412, USA4Biology Department, Eastern Michigan University, 441 Mark Jefferson
Science Complex, Ypsilanti, MI 48197, USA5Environmental Studies Program and Department of Biology, University of
Oregon, Eugene, OR 97403, USA6Morton K. Blaustein Department of Earth and Planetary Sciences, Johns Hop-
kins University, 301 Olin Hall 3400 N. Charles Street, Baltimore, MD 21218,
USA7Smithsonian Environmental Research Center, 647 Contees Wharf Road, Edge-
water, MD 21037, USA8Department of Biological Sciences, Wichita State University, Wichita, KS
67260, USA9Department of Ecology, Evolution and Behavior, University of Minnesota,
Saint Paul, MN 55108, USA10Virginia Institute of Marine Science, Gloucester Point, VA 23062, USA11Department of Biological and Environmental Sciences, Qatar University,
Doha, Qatar
12Department of Environmental Science and Technology, University of Mary-
land, College Park, MD 20742, USA13Agriculture/Forestry Center, University of Alberta, Edmonton, Alberta,
Canada T6G 2P5,14Archbold Biological Station, MacArthur Agroecology Research Center, 300
Buck Island Ranch Road, Lake Placid, FL 33852, USA15Department of Ecology and Evolutionary Biology and Mountain Research
Station, University of Colorado, Boulder, CO 80309, USA16The James Hutton Institute, Craigiebuckler, Aberdeen AB15 8QH, UK17Department of Biological Sciences, University of Alberta, Edmonton, AB
T6G 2E9, Canada18Department of Biology, University of New Mexico, Albuquerque, NM 87131,
USA19School of Life Science, Lanzhou University, Lanzhou, Gansu, China20Department of Physiological Diversity, Helmholtz Center for Environmental
Research – UFZ, Permoserstr. 15, D-04318, Leipzig, Germany21German Centre for Integrative Biodiversity Research (iDiv) Halle-Jena- Leip-
zig, Deutscher Platz 5e, D-04103, Leipzig, Germany22Department of Ecology, University of Oulu, P.O. Box 3000, FI-90014, Oulu,
Finland23Department of Biological Sciences, Towson University, Towson, MD 21252,
USA
© 2017 The Authors. Ecology Letters published by CNRS and John Wiley & Sons Ltd.This is an open access article under the terms of the Creative Commons Attribution License, which permits use,
distribution and reproduction in any medium, provided the original work is properly cited.
Ecology Letters, (2017) 20: 1534–1545 doi: 10.1111/ele.12861
INTRODUCTION
Ecosystem stability through time provides information aboutan ecosystem’s ability to maintain consistent interannual func-tioning despite variations in environmental conditions and dis-turbance (Turner et al. 1993; Tilman et al. 2006).Conservation managers seek stability because it suggests sus-tainability of species, community and ecosystem functioning(White & Jentsch 2001). Understanding the mechanisms thatcontrol ecosystem stability can help guide managementactions aimed at making ecosystem functioning more stable,and thus predictable, through time (Fisher et al. 2009). Manyprevious approaches to identifying mechanisms underlyingstability have focused on relatively small spatial scales (i.e.study plots) (Tilman et al. 2006; Hector et al. 2010; Hautieret al. 2014), yet the last decade of research has shown that thedynamics of metacommunities often differ from those of thelocal communities of which they are composed (Leibold et al.2004; Lalibert�e et al. 2013). Quantifying the processes thatdetermine the stability of ecosystem functioning at scalesbeyond the traditional ecological study plot is a critical steptoward predicting the consequences of environmental change(e.g. biodiversity loss, spatial homogenisation) at spatial scalesrelevant for land management.Although the term stability has a range of different mean-
ings in ecology (Grimm & Wissel 1997), we define stabilityhere as the mean of an ecosystem function, such as net pri-mary productivity, divided by its temporal standard deviation(Tilman 1999). In a MacArthur lecture, Levin (1992) for-malised the idea that the stability of ecosystem processesthrough space or time is increased as the spatial scale of focusincreases. Additionally, Levin stressed the importance and the
need for detailed understanding of how and why stabilitychanges across scales. More recently, Gurevitch et al. (2016)discussed the usefulness of aggregating population dynamicsto inform processes occurring at larger spatial scales, andrecent theoretical work has developed a hierarchical frame-work that can help integrate processes that affect stabilityfrom the local to the landscape or metacommunity scale(Fig. 1; Mellin et al. 2014; Wang & Loreau 2014). This frame-work provides quantifiable terms that represent stability andsynchrony at various spatial scales.For clarity, and to be consistent with recent theoretical
work (Wang & Loreau 2014, 2016), we use the following ter-minology to refer to and integrate across three levels of eco-logical organisation: (1) populations of different speciescombine to create (2) local communities, which aggregate toform (3) metacommunities. At any given scale, the stability ofecosystem functioning is determined by the stability of itscomponent parts (e.g. populations or species at the commu-nity level; communities at the metacommunity level) and howsynchronous the component parts are from year to year(Fig. 1; Loreau & de Mazancourt 2013; Hautier et al. 2014;Hallett et al. 2014). Synchrony measures the degree to whichcomponent parts respond similarly to environmental fluctua-tions, interannual competitive effects, and demographicstochasticity (Loreau & de Mazancourt 2008; Tredennicket al. 2017). For example, if two species have very dissimilarresponses to environmental fluctuations, then synchrony willbe low. The same is true for communities – if two local com-munities have differential responses to environmental fluctua-tions, perhaps due to different species composition, then thesynchrony of the two communities will be low (Wang & Lor-eau 2016).
24Department of Disturbance Ecology, University of Bayreuth, D-95440, Bayr-
euth, Germany25Northern Research Station, US Forest Service, 5985 Highway K, Rhinelander,
WI 54501, USA26Faculty of Environmental Sciences and Natural Resource Management, Nor-
wegian University of Life Sciences, P.O. Box 5003, NO-1432, Aas, Norway27Department of Biology, Graduate Degree Program in Ecology, Colorado
State University, Fort Collins, CO 80523, USA28Institute of Botany and Landscape Ecology, Experimental Plant Ecology,
Greifswald University, Soldmannstrasse 15, D-17487, Greifswald, Germany29Department of Biological Sciences, Center for Ecosystem Science and Society
(Ecoss), Northern Arizona University, Flagstaff, AZ 86011, USA30Department for Earth System Science, Tsinghua University, Beijing, China31Department of Biological Sciences, University of Texas at El Paso, El Paso,
TX 79968, USA32Smithsonian Environmental Research Center, Edgewater, MD 20754, USA33Department of Geobotany, Moscow State Lomonosov University, Leninskie
gory 1-12, 119234, Moscow, Russia34USFS Pacific Northwest Research Station, 3625 93rd Ave SW, Olympia, WA
98512, USA35Institute of Land, Water and Society, Charles Sturt University, Albury, NSW
2640, Australia36School of Earth & Environmental Sciences, The University of Manchester,
Williamson Building, Oxford Road, Manchester M13 9PL, UK37School of Life Sciences and School of Sustainability, Arizona State Univer-
sity, Tempe, AZ 85287, USA
38Conservation Biology Department, Institute of Environmental Sciences,
CML, Leiden University, Einsteinweg 2, 2333 CC, Leiden, The Netherlands39Oklahoma Biological Survey, University of Oklahoma, Norman, OK 73019,
USA40Department of Ecology, Evolution and Behavior, College of Biological
Sciences, University of Minnesota, Saint Paul, MN 55108, USA41Environment and Parks, Government of Alberta, Edmonton, AB T5K 2M4,
Canada42Institute of Applied Ecology, Chinese Academy of Sciences, Shenyang,
Liaoning 110016, China43Universidad de Buenos Aires, Consejo Nacional de Investigaciones Cient�ıfi-
cas y T�ecnicas, Instituto de Investigaciones Fisiol�ogicas y Ecol�ogicas Vinculadas
a la Agricultura (IFEVA), Facultad de Agronom�ıa, Buenos Aires, Argentina44National Hulunber Grassland Ecosystem Observation and Research Station/
Institute of Agricultural Resources and Regional Planning, Chinese Academy
of Agricultural Sciences, Beijing 100081, China45State Key Laboratory of Vegetation and Environmental Change, Institute of
Botany, Chinese Academy of Sciences, Beijing 100093, China46Department of Agroecology, Aarhus University, Blichers All�e 20, 8830, Tjele,
Denmark
*Correspondence: E-mail: [email protected] and [email protected] co-led this manuscript.bCoRRE working group leader.cCoRRE working group member.
© 2017 The Authors. Ecology Letters published by CNRS and John Wiley & Sons Ltd.
Letter Mechanisms of metacommunity stability 1535
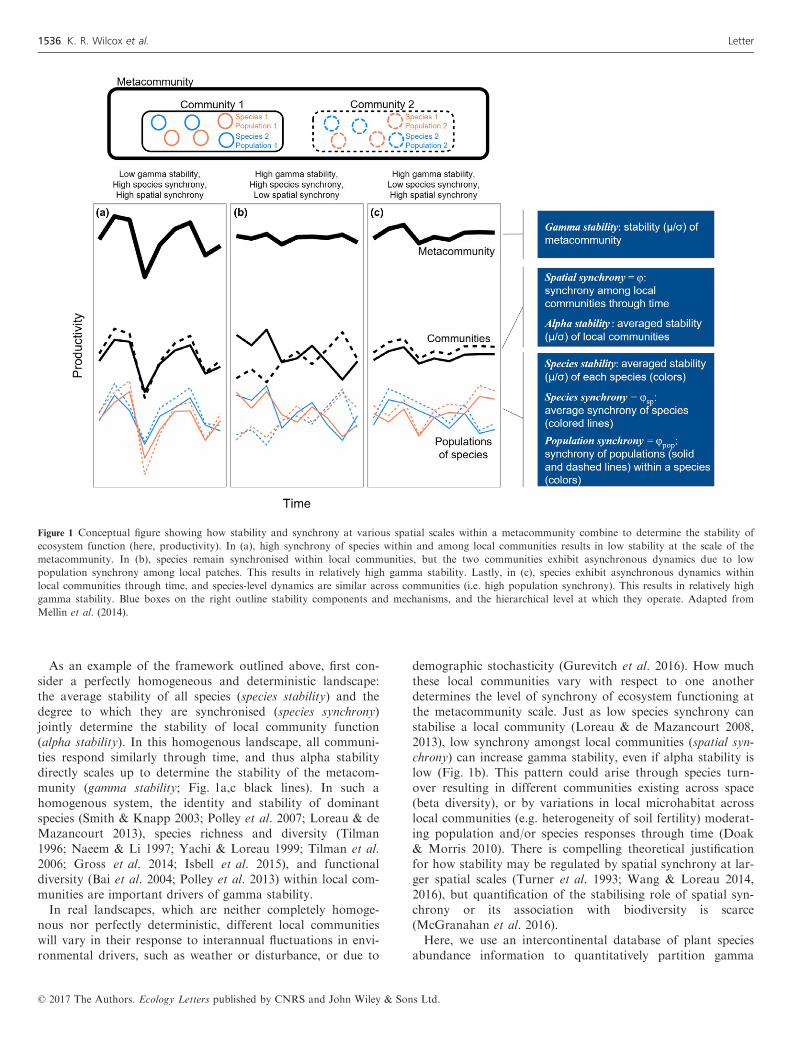
As an example of the framework outlined above, first con-sider a perfectly homogeneous and deterministic landscape:the average stability of all species (species stability) and thedegree to which they are synchronised (species synchrony)jointly determine the stability of local community function(alpha stability). In this homogenous landscape, all communi-ties respond similarly through time, and thus alpha stabilitydirectly scales up to determine the stability of the metacom-munity (gamma stability; Fig. 1a,c black lines). In such ahomogenous system, the identity and stability of dominantspecies (Smith & Knapp 2003; Polley et al. 2007; Loreau & deMazancourt 2013), species richness and diversity (Tilman1996; Naeem & Li 1997; Yachi & Loreau 1999; Tilman et al.2006; Gross et al. 2014; Isbell et al. 2015), and functionaldiversity (Bai et al. 2004; Polley et al. 2013) within local com-munities are important drivers of gamma stability.In real landscapes, which are neither completely homoge-
nous nor perfectly deterministic, different local communitieswill vary in their response to interannual fluctuations in envi-ronmental drivers, such as weather or disturbance, or due to
demographic stochasticity (Gurevitch et al. 2016). How muchthese local communities vary with respect to one anotherdetermines the level of synchrony of ecosystem functioning atthe metacommunity scale. Just as low species synchrony canstabilise a local community (Loreau & de Mazancourt 2008,2013), low synchrony amongst local communities (spatial syn-chrony) can increase gamma stability, even if alpha stability islow (Fig. 1b). This pattern could arise through species turn-over resulting in different communities existing across space(beta diversity), or by variations in local microhabitat acrosslocal communities (e.g. heterogeneity of soil fertility) moderat-ing population and/or species responses through time (Doak& Morris 2010). There is compelling theoretical justificationfor how stability may be regulated by spatial synchrony at lar-ger spatial scales (Turner et al. 1993; Wang & Loreau 2014,2016), but quantification of the stabilising role of spatial syn-chrony or its association with biodiversity is scarce(McGranahan et al. 2016).Here, we use an intercontinental database of plant species
abundance information to quantitatively partition gamma
Figure 1 Conceptual figure showing how stability and synchrony at various spatial scales within a metacommunity combine to determine the stability of
ecosystem function (here, productivity). In (a), high synchrony of species within and among local communities results in low stability at the scale of the
metacommunity. In (b), species remain synchronised within local communities, but the two communities exhibit asynchronous dynamics due to low
population synchrony among local patches. This results in relatively high gamma stability. Lastly, in (c), species exhibit asynchronous dynamics within
local communities through time, and species-level dynamics are similar across communities (i.e. high population synchrony). This results in relatively high
gamma stability. Blue boxes on the right outline stability components and mechanisms, and the hierarchical level at which they operate. Adapted from
Mellin et al. (2014).
© 2017 The Authors. Ecology Letters published by CNRS and John Wiley & Sons Ltd.
1536 K. R. Wilcox et al. Letter

stability into its hierarchical components (Fig. 1; Wang &Loreau 2014). We addressed two major questions. First, rel-ative to local-scale stability, how important is spatial syn-chrony for regulating stability at larger spatial scales?Second, what are the major ecological predictors of syn-chrony and stability within and across metacommunities?Regarding the second question, we tested two sets of non-exclusive hypotheses: (H1a) spatial synchrony across meta-communities is negatively related to species turnover amonglocal communities (e.g. beta diversity). This could be drivenby unique responses of different local communities to inter-annual environmental variation; alternately, (H1b) spatialsynchrony across metacommunities is positively related tosynchrony among species populations. This could resultfrom spatial variation of physical characteristics or competi-tion among local communities or demographic stochasticity.(H2) Alpha diversity will be positively related to alpha sta-bility and negatively related to species synchrony. Wehypothesised this because communities with higher alphadiversity often have higher primary productivity as well asgreater variety of plant growth strategies. In summary, weseek to quantify the determinants of ecosystem stability atthe metacommunity scale, and to understand the ecologicalfactors that contribute to stability across spatial scales andlevels of organisation.
MATERIALS AND METHODS
Data sets
Disentangling the drivers of gamma stability requires esti-mates of species abundance and/or primary productivitythrough time at the metacommunity, community and species/population levels (Fig. 1). In February of 2016, we searchedthe CoRRE (http://corredata.weebly.com/) database toobtain species-level abundance data from 62 herbaceouscommunity studies distributed around the globe (Table S1and Fig. S1). We extracted data collected in control (nomanipulation) plots from data sets that met the followingcriteria:
(1) Contained at least three replicate plots in all years.(2) Contained at least 3 years of measurements for all repli-cate plots.(3) Plot sizes consistent in all replicates.(4) Starting community intact and not undergoing strong pri-mary or secondary succession (i.e. due to plowing, weeding,seeding).(5) Included absolute species-level abundance.(6) Nutrients not added before or during the measurementperiod.
The data represent ecosystems spanning climatic gradientsof mean annual precipitation from 168 to 1400 mm (mean:725 mm; median: 751 mm) and mean annual temperaturefrom �12 to 22 °C (mean: 7.0 °C; median: 8.5 °C). Meanaboveground net primary productivity (ANPP) among studiesvaried from 1.5 to 1002 g m�2 (mean: 311.6 g m�2; median:222.1 g m�2), and study-wide richness varied from 5 to 140species (mean: 59 species; median: 55 species). The number of
replicates sampled varied from 3 to 18 (mean: 6.2; median: 5),experimental length varied from 3 to 30 years (mean:7.6 years; median: 5 years), and replicate sizes ranged from0.03 to 10 m2 (mean: 1.4 m2; median: 0.6 m2). See Table S1for more information about included data sets.Each study included several replicate plots that were rela-
tively close in space (Table S1). We treated these plots as indi-vidual communities, and collections of plots asmetacommunities. When groups of plots within a study werein different study sites (e.g. different watersheds, fields), theywere separated and treated as distinct metacommunities.Absolute percent abundance of species within plots were mea-sured either by visual estimates of percent cover (N = 35),presence/absence (N = 2), line-intercept (N = 1), biomass(N = 12), primary productivity (N = 6), pin hits (N = 3), orstem density (N = 3). Plot-level ANPP was estimated in ornext to the same plots as species percent abundances in 35 ofthe metacommunities via clipping (N = 26), pin hit/pointintercept (N = 5), allometric calibrations (N = 3), or percentcover calibrations (N = 1).
Calculating stability components
Within each study site (treated here as a metacommunity), weused species abundance and plot-level ANPP data to calculatealpha stability, spatial synchrony, and gamma stability follow-ing Wang & Loreau (2014, 2016) (Table 1). For clarity pur-poses, we inversed the coefficient of variability terms presentedin Wang & Loreau (2014, 2016) to represent stability. Gammastability (cstb) is a measure of the temporal variability ofecosystem functioning of the entire metacommunity, calcu-lated as follows:
cstb ¼lMrM
ð1Þ
where rM is the temporal standard deviation and lM is thetemporal mean of summed total abundance in metacommu-nity M. For species cover data sets, we used the sum oftotal cover across all plots as total metacommunity abun-dance; for ANPP data sets, we used summed ANPP acrossall plots.Alpha stability (astb) is a measure of the average temporal
stability of plant abundance or productivity at the local com-munity scale. We obtained alpha stability for each site by cal-culating the temporal coefficient of variation of totalcommunity abundance (summed species cover or plot-levelANPP) for each local community (plot), weighting by localcommunity abundance, and taking the inverse:
astb ¼X
i
lilM
� ri
li
� ��1
ð2Þ
where li is the temporal mean of total abundance in com-munity i, lM is the temporal mean of total abundance inmetacommunity M, and ri is the temporal standard devia-tion of total abundance in community i. As above, fortotal abundance we used total summed absolute speciescover or ANPP for species cover and ANPP data sets,respectively.
© 2017 The Authors. Ecology Letters published by CNRS and John Wiley & Sons Ltd.
Letter Mechanisms of metacommunity stability 1537
Spatial synchrony (φ) represents the similarity of temporalfluctuations of different communities (within a metacommu-nity), and is calculated as:
u ¼P
i;j wijPi
ffiffiffiffiffiffiwii
p� �2 ð3Þ
where wij is the temporal covariance between communities iand j, and wii is the temporal variance of community i, asreferenced from a covariance matrix. In addition to syn-chrony of local community abundance through time, spatialsynchrony can also incorporate spatial unevenness if meanand variance of plot abundance is not equal among plots(Wang & Loreau 2014). We do not think spatial unevennesswas a large component of spatial synchrony here becausewe did not find obvious and consistent violation of theassumption of equal means and variance of abundanceacross plots (Fig. S2).Lastly, we used the reciprocal of spatial synchrony to repre-
sent the degree to which squared stability is increased due tospatial dynamics (eqn 6 in Wang & Loreau 2014). So, weterm spatial stabilisation as the square root of 1//, which cor-responds to the amount of stability enhanced when movingfrom the community to metacommunity level:ffiffiffiffi
1
u
s¼ cstb
astbð4Þ
To test for potential bias of plot size on the spatial stabilisa-tion metric, we calculated spatial stabilisation, using the entiredatabase and a subset of metacommunities containing 1 m2
plots to assess the range, mean, and median spatial stabilisa-tion values across our database. We present the summarystatistics of spatial stabilisation across the entire databasebecause these values were qualitatively similar when usingonly metacommunities with 1 m2 plots (Table S2).
We used species abundance data to calculate two temporalmetrics at the species level and one at the population level –species synchrony, species stability, and population synchrony.Plot-level ANPP data were mostly not parsed by species, sowe were unable to calculate species-level synchrony or stabilityfor ANPP. We calculated species synchrony (φsp) within eachcommunity following Loreau & de Mazancourt (2008):
usp;i ¼P
k;l wkl;iPk
ffiffiffiffiffiffiffiffiffiwkk;i
p� �2 ð5Þ
where w is the temporal covariance matrix comparing abun-dances of species k and l within community i. Species syn-chrony values were averaged across plots, weighting by totalplot abundance, to obtain a single value for each metacom-munity. There is a mathematical bias between species richnessand the species synchrony metric in eqn 5, so for all analyseswhich compared species synchrony with measures that incor-porate information about species richness (e.g. Simpson’sdiversity), we also ran the analyses using a species synchronymetric that is not biased by species richness (Gross et al.2014). All such analyses yielded very similar results to thoseobtained using eqn 5, so we report results using the speciessynchrony metric in eqn 5. Species stability (Spstb) for eachcommunity was calculated as:
Spstb;i ¼X
j
ljðiÞli
� rjðiÞljðiÞ
!�1
ð6Þ
where lj(i) is the mean of species j’s abundance through timein community i, li is mean total abundance in community i,lj(i) is the mean abundance of species j in community i, and rj
(i) is the temporal standard deviation of species j in commu-nity i. As with species synchrony, we averaged species stabilityacross communities, weighting by each species’ relative
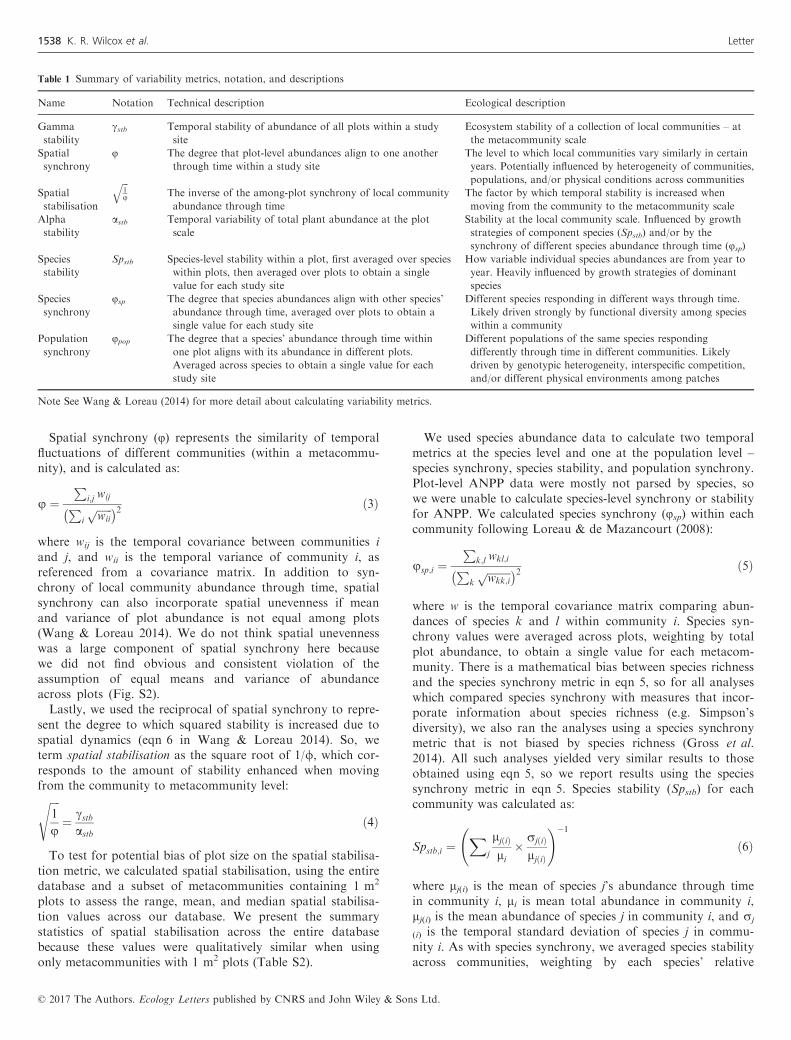
Table 1 Summary of variability metrics, notation, and descriptions
Name Notation Technical description Ecological description
Gamma
stability
cstb Temporal stability of abundance of all plots within a study
site
Ecosystem stability of a collection of local communities – at
the metacommunity scale
Spatial
synchrony
φ The degree that plot-level abundances align to one another
through time within a study site
The level to which local communities vary similarly in certain
years. Potentially influenced by heterogeneity of communities,
populations, and/or physical conditions across communities
Spatial
stabilisation
ffiffiffi1u
qThe inverse of the among-plot synchrony of local community
abundance through time
The factor by which temporal stability is increased when
moving from the community to the metacommunity scale
Alpha
stability
astb Temporal variability of total plant abundance at the plot
scale
Stability at the local community scale. Influenced by growth
strategies of component species (Spstb) and/or by the
synchrony of different species abundance through time (φsp)Species
stability
Spstb Species-level stability within a plot, first averaged over species
within plots, then averaged over plots to obtain a single
value for each study site
How variable individual species abundances are from year to
year. Heavily influenced by growth strategies of dominant
species
Species
synchrony
φsp The degree that species abundances align with other species’
abundance through time, averaged over plots to obtain a
single value for each study site
Different species responding in different ways through time.
Likely driven strongly by functional diversity among species
within a community
Population
synchrony
φpop The degree that a species’ abundance through time within
one plot aligns with its abundance in different plots.
Averaged across species to obtain a single value for each
study site
Different populations of the same species responding
differently through time in different communities. Likely
driven by genotypic heterogeneity, interspecific competition,
and/or different physical environments among patches
Note See Wang & Loreau (2014) for more detail about calculating variability metrics.
© 2017 The Authors. Ecology Letters published by CNRS and John Wiley & Sons Ltd.
1538 K. R. Wilcox et al. Letter
abundance and then by total plot abundance to obtainestimates of Spstb for each metacommunity. Finally, for eachspecies, we calculated population synchrony as follows:
upop;i ¼P
m;n wmnPm
ffiffiffiffiffiffiffiffiffiwmm
p� �2 ð7Þ
where for each species i present within a metacommunity, wmn
is the temporal covariance between populations (species abun-dance in single plots) m and n, and wmm is the temporal vari-ance of population m, as referenced from a covariance matrix.We then averaged across species, weighting by species’ relativeabundance, to obtain a single population synchrony value foreach metacommunity. See Table 1 for a summary of stabilitymetrics and components. We calculated all metrics in R (RCore Team 2016), and used the ‘synchrony()’ function (‘co-dyn’ package, Hallett et al. 2016) to calculate synchrony met-rics.
Calculating biodiversity
We calculated alpha and beta diversity indices to comparewith gamma stability, alpha stability, and spatial synchrony.To estimate alpha diversity, we calculated the Simpson’s index(D):
D ¼XSi¼1
p2i ð8Þ
where pi is the relative abundance of species i and S is thenumber of species within a plot. We also used Shannon–Wiener index (H0):
H0 ¼ �XSi¼1
pi � lnðpiÞ ð9Þ
We calculated these for each plot in each year and took theaverage. These metrics incorporate information about speciesrichness and abundance. We also calculated diversity of entiremetacommunities by averaging cover values across plots andapplying eqns 8 and 9.Beta diversity, or compositional dissimilarity among local
communities, was calculated for each metacommunity usingmultivariate dispersion techniques with species abundancedata (Anderson et al. 2006), which estimates the distance ofeach community to the metacommunity centroid in multivari-ate space. Distances were averaged across communities andyears to estimate beta-diversity for a metacommunity. Beta-diversity, Simpson’s, Shannon-Wiener indexes were calculatedusing the ‘betadisper()’ and ‘diversity()’ functions inR (‘vegan’ package, Oksanen et al. 2016).
Quantifying components of gamma stability
A major goal was to attribute variation in gamma stabilityamong metacommunities to specific lower level attributes likealpha stability and spatial synchrony. We proceeded in threesteps: (1) we partitioned the variation of gamma stabilityamong alpha stability and spatial synchrony; (2) we parti-tioned the variation of gamma stability among species
synchrony, species stability, and spatial synchrony; and (3) weconducted bivariate linear regressions among stability-driverpairs to further assess and visualise the influence of lower-levelprocesses on higher-level variability. Few studies measuredANPP information at the species-level, so we were limited tosteps 1 and 3 for ANPP. Plot size varied across many studiesused in our analyses, likely due to investigator knowledge ofthe different spatial scales of ecological processes across sites.We chose to trust principle investigator decisions on appropri-ate plot sizes used in individual studies, but we also foundqualitatively similar results when we performed our variancepartitioning analyses using only studies having 1 m2 plots(these were the most common; Fig. S3). Additionally, we per-formed linear regressions between spatial and population syn-chrony and study duration, plot number, plot size, andmetacommunity size to determine whether underlying method-ological factors might be driving relationships between stabil-ity components.Linear regressions were used to compare alpha and beta
diversity metrics with gamma stability, alpha stability, spatialsynchrony, species stability, and species synchrony acrosssites. This allowed us to determine whether (1) diversity met-rics in isolation were associated with local stability and syn-chrony dynamics, and (2) whether these impacts scaled up toaffect larger (gamma) spatial scales. To account for cross-sitepatterns of potentially confounding factors, such as environ-mental variability or disturbance regime, we conductedregressions comparing Simpson’s diversity with alpha stabil-ity and species synchrony across plots within sites. For this,we only incorporated sites having five or more plots (44metacommunities) to avoid biasing results by including stud-ies with small sample size. Population synchrony was com-pared with spatial synchrony also using linear regression. Weused the ‘varpart()’ function in R (‘vegan’ package, Oksanenet al. 2016) to conduct variance partitioning and the ‘lm()’function in R to fit linear regressions. The variance partition-ing analysis provides variance explained by each metric aloneand shared. We used log-transformed metrics for all statisti-cal analysis to account for non-normality. R code andderived data for all analyses have been deposited onFigshare (https://doi.org/10.6084/m9.figshare.5384167). Seehttp://corredata.weebly.com/ for inquiries concerning rawdata.
RESULTS
Quantifying influence of stability components
Using species abundance data, species stability, species syn-chrony, and spatial synchrony contributed 41, 30, and 25%,respectively, to explaining the cross-site variance of gammastability (Fig. 2a). Alpha stability, which represents the com-bined effects of species stability and synchrony, aloneexplained 63% of the variance in gamma stability amongsites, while spatial synchrony alone explained 24% (Fig. 2a).The remaining 13% of the variance in gamma stability wasexplained by covariance between the two predictors. All indi-vidual drivers (alpha stability, spatial synchrony, species sta-bility, and species synchrony) were significant (P < 0.01)
© 2017 The Authors. Ecology Letters published by CNRS and John Wiley & Sons Ltd.
Letter Mechanisms of metacommunity stability 1539
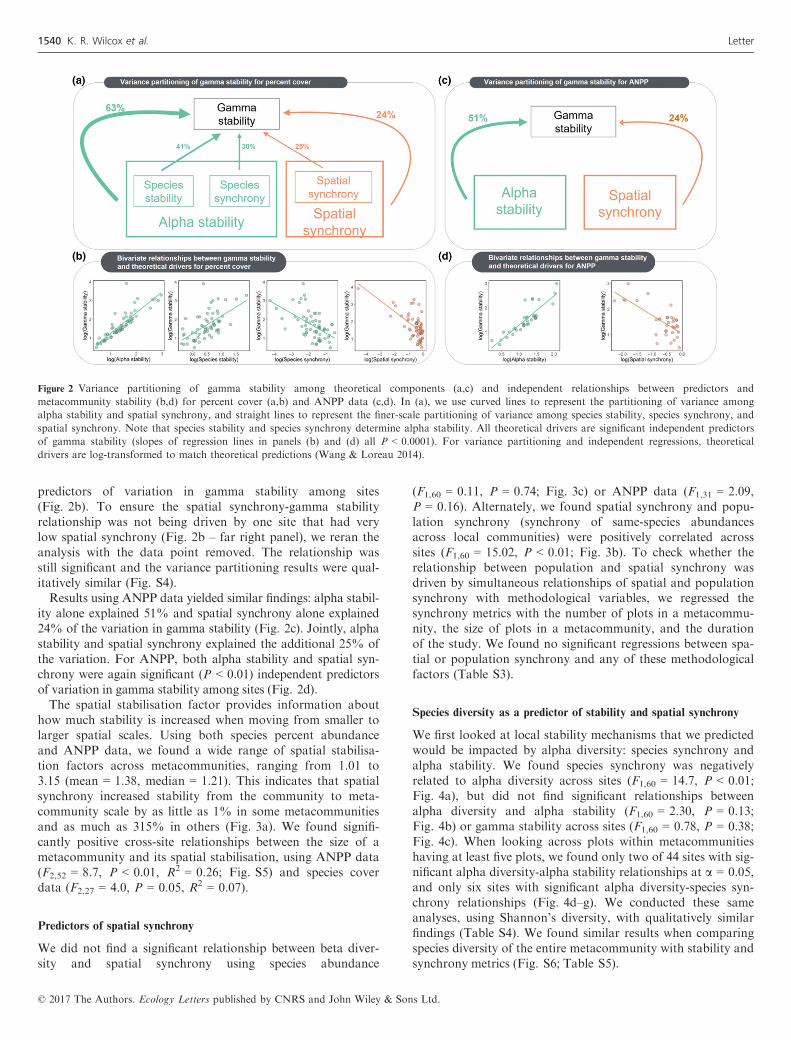
predictors of variation in gamma stability among sites(Fig. 2b). To ensure the spatial synchrony-gamma stabilityrelationship was not being driven by one site that had verylow spatial synchrony (Fig. 2b – far right panel), we reran theanalysis with the data point removed. The relationship wasstill significant and the variance partitioning results were qual-itatively similar (Fig. S4).Results using ANPP data yielded similar findings: alpha stabil-
ity alone explained 51% and spatial synchrony alone explained24% of the variation in gamma stability (Fig. 2c). Jointly, alphastability and spatial synchrony explained the additional 25% ofthe variation. For ANPP, both alpha stability and spatial syn-chrony were again significant (P < 0.01) independent predictorsof variation in gamma stability among sites (Fig. 2d).The spatial stabilisation factor provides information about
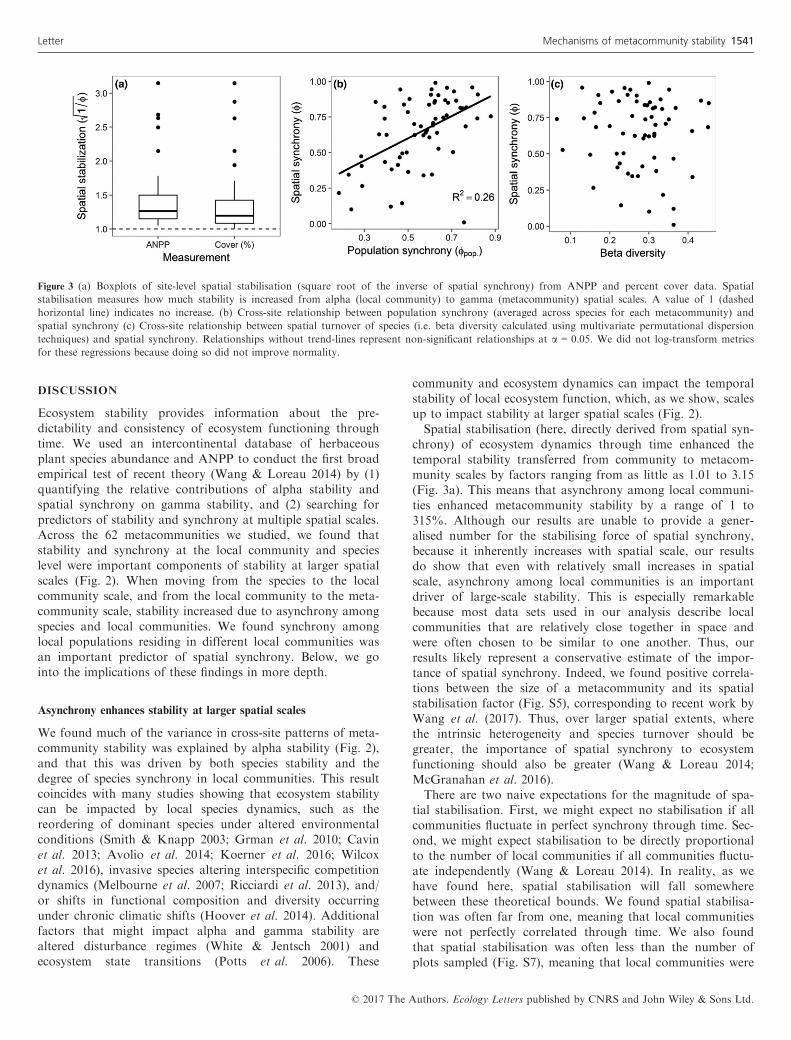
how much stability is increased when moving from smaller tolarger spatial scales. Using both species percent abundanceand ANPP data, we found a wide range of spatial stabilisa-tion factors across metacommunities, ranging from 1.01 to3.15 (mean = 1.38, median = 1.21). This indicates that spatialsynchrony increased stability from the community to meta-community scale by as little as 1% in some metacommunitiesand as much as 315% in others (Fig. 3a). We found signifi-cantly positive cross-site relationships between the size of ametacommunity and its spatial stabilisation, using ANPP data(F2,52 = 8.7, P < 0.01, R2 = 0.26; Fig. S5) and species coverdata (F2,27 = 4.0, P = 0.05, R2 = 0.07).
Predictors of spatial synchrony
We did not find a significant relationship between beta diver-sity and spatial synchrony using species abundance
(F1,60 = 0.11, P = 0.74; Fig. 3c) or ANPP data (F1,31 = 2.09,P = 0.16). Alternately, we found spatial synchrony and popu-lation synchrony (synchrony of same-species abundancesacross local communities) were positively correlated acrosssites (F1,60 = 15.02, P < 0.01; Fig. 3b). To check whether therelationship between population and spatial synchrony wasdriven by simultaneous relationships of spatial and populationsynchrony with methodological variables, we regressed thesynchrony metrics with the number of plots in a metacommu-nity, the size of plots in a metacommunity, and the durationof the study. We found no significant regressions between spa-tial or population synchrony and any of these methodologicalfactors (Table S3).
Species diversity as a predictor of stability and spatial synchrony
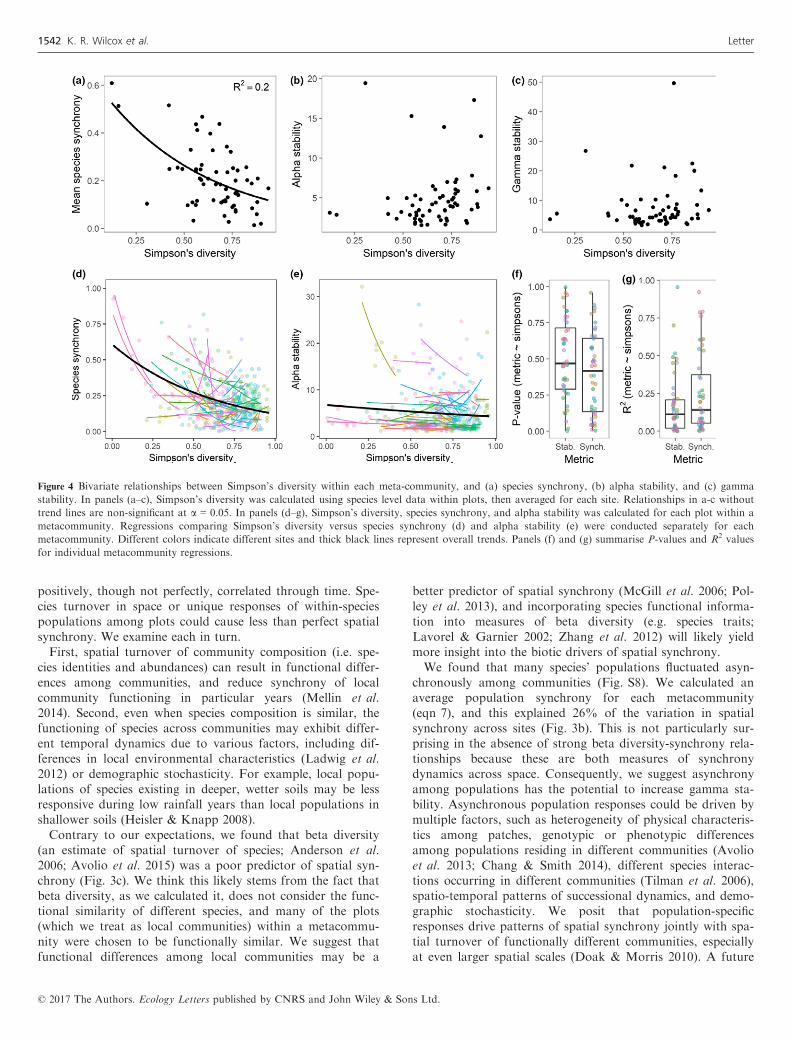
We first looked at local stability mechanisms that we predictedwould be impacted by alpha diversity: species synchrony andalpha stability. We found species synchrony was negativelyrelated to alpha diversity across sites (F1,60 = 14.7, P < 0.01;Fig. 4a), but did not find significant relationships betweenalpha diversity and alpha stability (F1,60 = 2.30, P = 0.13;Fig. 4b) or gamma stability across sites (F1,60 = 0.78, P = 0.38;Fig. 4c). When looking across plots within metacommunitieshaving at least five plots, we found only two of 44 sites with sig-nificant alpha diversity-alpha stability relationships at a = 0.05,and only six sites with significant alpha diversity-species syn-chrony relationships (Fig. 4d–g). We conducted these sameanalyses, using Shannon’s diversity, with qualitatively similarfindings (Table S4). We found similar results when comparingspecies diversity of the entire metacommunity with stability andsynchrony metrics (Fig. S6; Table S5).
Figure 2 Variance partitioning of gamma stability among theoretical components (a,c) and independent relationships between predictors and
metacommunity stability (b,d) for percent cover (a,b) and ANPP data (c,d). In (a), we use curved lines to represent the partitioning of variance among
alpha stability and spatial synchrony, and straight lines to represent the finer-scale partitioning of variance among species stability, species synchrony, and
spatial synchrony. Note that species stability and species synchrony determine alpha stability. All theoretical drivers are significant independent predictors
of gamma stability (slopes of regression lines in panels (b) and (d) all P < 0.0001). For variance partitioning and independent regressions, theoretical
drivers are log-transformed to match theoretical predictions (Wang & Loreau 2014).
© 2017 The Authors. Ecology Letters published by CNRS and John Wiley & Sons Ltd.
1540 K. R. Wilcox et al. Letter
DISCUSSION
Ecosystem stability provides information about the pre-dictability and consistency of ecosystem functioning throughtime. We used an intercontinental database of herbaceousplant species abundance and ANPP to conduct the first broadempirical test of recent theory (Wang & Loreau 2014) by (1)quantifying the relative contributions of alpha stability andspatial synchrony on gamma stability, and (2) searching forpredictors of stability and synchrony at multiple spatial scales.Across the 62 metacommunities we studied, we found thatstability and synchrony at the local community and specieslevel were important components of stability at larger spatialscales (Fig. 2). When moving from the species to the localcommunity scale, and from the local community to the meta-community scale, stability increased due to asynchrony amongspecies and local communities. We found synchrony amonglocal populations residing in different local communities wasan important predictor of spatial synchrony. Below, we gointo the implications of these findings in more depth.
Asynchrony enhances stability at larger spatial scales
We found much of the variance in cross-site patterns of meta-community stability was explained by alpha stability (Fig. 2),and that this was driven by both species stability and thedegree of species synchrony in local communities. This resultcoincides with many studies showing that ecosystem stabilitycan be impacted by local species dynamics, such as thereordering of dominant species under altered environmentalconditions (Smith & Knapp 2003; Grman et al. 2010; Cavinet al. 2013; Avolio et al. 2014; Koerner et al. 2016; Wilcoxet al. 2016), invasive species altering interspecific competitiondynamics (Melbourne et al. 2007; Ricciardi et al. 2013), and/or shifts in functional composition and diversity occurringunder chronic climatic shifts (Hoover et al. 2014). Additionalfactors that might impact alpha and gamma stability arealtered disturbance regimes (White & Jentsch 2001) andecosystem state transitions (Potts et al. 2006). These
community and ecosystem dynamics can impact the temporalstability of local ecosystem function, which, as we show, scalesup to impact stability at larger spatial scales (Fig. 2).Spatial stabilisation (here, directly derived from spatial syn-
chrony) of ecosystem dynamics through time enhanced thetemporal stability transferred from community to metacom-munity scales by factors ranging from as little as 1.01 to 3.15(Fig. 3a). This means that asynchrony among local communi-ties enhanced metacommunity stability by a range of 1 to315%. Although our results are unable to provide a gener-alised number for the stabilising force of spatial synchrony,because it inherently increases with spatial scale, our resultsdo show that even with relatively small increases in spatialscale, asynchrony among local communities is an importantdriver of large-scale stability. This is especially remarkablebecause most data sets used in our analysis describe localcommunities that are relatively close together in space andwere often chosen to be similar to one another. Thus, ourresults likely represent a conservative estimate of the impor-tance of spatial synchrony. Indeed, we found positive correla-tions between the size of a metacommunity and its spatialstabilisation factor (Fig. S5), corresponding to recent work byWang et al. (2017). Thus, over larger spatial extents, wherethe intrinsic heterogeneity and species turnover should begreater, the importance of spatial synchrony to ecosystemfunctioning should also be greater (Wang & Loreau 2014;McGranahan et al. 2016).There are two naive expectations for the magnitude of spa-
tial stabilisation. First, we might expect no stabilisation if allcommunities fluctuate in perfect synchrony through time. Sec-ond, we might expect stabilisation to be directly proportionalto the number of local communities if all communities fluctu-ate independently (Wang & Loreau 2014). In reality, as wehave found here, spatial stabilisation will fall somewherebetween these theoretical bounds. We found spatial stabilisa-tion was often far from one, meaning that local communitieswere not perfectly correlated through time. We also foundthat spatial stabilisation was often less than the number ofplots sampled (Fig. S7), meaning that local communities were
Figure 3 (a) Boxplots of site-level spatial stabilisation (square root of the inverse of spatial synchrony) from ANPP and percent cover data. Spatial
stabilisation measures how much stability is increased from alpha (local community) to gamma (metacommunity) spatial scales. A value of 1 (dashed
horizontal line) indicates no increase. (b) Cross-site relationship between population synchrony (averaged across species for each metacommunity) and
spatial synchrony (c) Cross-site relationship between spatial turnover of species (i.e. beta diversity calculated using multivariate permutational dispersion
techniques) and spatial synchrony. Relationships without trend-lines represent non-significant relationships at a = 0.05. We did not log-transform metrics
for these regressions because doing so did not improve normality.
© 2017 The Authors. Ecology Letters published by CNRS and John Wiley & Sons Ltd.
Letter Mechanisms of metacommunity stability 1541
positively, though not perfectly, correlated through time. Spe-cies turnover in space or unique responses of within-speciespopulations among plots could cause less than perfect spatialsynchrony. We examine each in turn.First, spatial turnover of community composition (i.e. spe-
cies identities and abundances) can result in functional differ-ences among communities, and reduce synchrony of localcommunity functioning in particular years (Mellin et al.2014). Second, even when species composition is similar, thefunctioning of species across communities may exhibit differ-ent temporal dynamics due to various factors, including dif-ferences in local environmental characteristics (Ladwig et al.2012) or demographic stochasticity. For example, local popu-lations of species existing in deeper, wetter soils may be lessresponsive during low rainfall years than local populations inshallower soils (Heisler & Knapp 2008).Contrary to our expectations, we found that beta diversity
(an estimate of spatial turnover of species; Anderson et al.2006; Avolio et al. 2015) was a poor predictor of spatial syn-chrony (Fig. 3c). We think this likely stems from the fact thatbeta diversity, as we calculated it, does not consider the func-tional similarity of different species, and many of the plots(which we treat as local communities) within a metacommu-nity were chosen to be functionally similar. We suggest thatfunctional differences among local communities may be a
better predictor of spatial synchrony (McGill et al. 2006; Pol-ley et al. 2013), and incorporating species functional informa-tion into measures of beta diversity (e.g. species traits;Lavorel & Garnier 2002; Zhang et al. 2012) will likely yieldmore insight into the biotic drivers of spatial synchrony.We found that many species’ populations fluctuated asyn-
chronously among communities (Fig. S8). We calculated anaverage population synchrony for each metacommunity(eqn 7), and this explained 26% of the variation in spatialsynchrony across sites (Fig. 3b). This is not particularly sur-prising in the absence of strong beta diversity-synchrony rela-tionships because these are both measures of synchronydynamics across space. Consequently, we suggest asynchronyamong populations has the potential to increase gamma sta-bility. Asynchronous population responses could be driven bymultiple factors, such as heterogeneity of physical characteris-tics among patches, genotypic or phenotypic differencesamong populations residing in different communities (Avolioet al. 2013; Chang & Smith 2014), different species interac-tions occurring in different communities (Tilman et al. 2006),spatio-temporal patterns of successional dynamics, and demo-graphic stochasticity. We posit that population-specificresponses drive patterns of spatial synchrony jointly with spa-tial turnover of functionally different communities, especiallyat even larger spatial scales (Doak & Morris 2010). A future
Figure 4 Bivariate relationships between Simpson’s diversity within each meta-community, and (a) species synchrony, (b) alpha stability, and (c) gamma
stability. In panels (a–c), Simpson’s diversity was calculated using species level data within plots, then averaged for each site. Relationships in a-c without
trend lines are non-significant at a = 0.05. In panels (d–g), Simpson’s diversity, species synchrony, and alpha stability was calculated for each plot within a
metacommunity. Regressions comparing Simpson’s diversity versus species synchrony (d) and alpha stability (e) were conducted separately for each
metacommunity. Different colors indicate different sites and thick black lines represent overall trends. Panels (f) and (g) summarise P-values and R2 values
for individual metacommunity regressions.
© 2017 The Authors. Ecology Letters published by CNRS and John Wiley & Sons Ltd.
1542 K. R. Wilcox et al. Letter
challenge is to quantify the contribution of different mecha-nisms underlying population synchrony, similar to recentwork on species synchrony (Tredennick et al. 2017).
Alpha diversity versus stability and synchrony
Based on previous experimental evidence (Tilman et al. 2006;Hector et al. 2010), we predicted that the diversity of localcommunities (alpha diversity) would be correlated with speciessynchrony, alpha stability, and ultimately gamma stability. Amajor mechanism by which local species diversity can increasestability of local communities is by reducing the synchrony ofspecies’ abundances through time (Loreau & de Mazancourt2008; Isbell et al. 2009). Indeed, we found evidence for thismechanism as species synchrony was generally lower in meta-communities having higher alpha diversity (Fig. 4a). However,we did not find that this scaled up to impact alpha or gammastability across sites (Fig. 4b–c). This corresponds with previ-ous theoretical work suggesting that the effect of alpha diver-sity on gamma stability may be small compared to otherbiotic and abiotic forces (Wang & Loreau 2016). Thus, it maybe difficult to detect diversity effects on stability in short andnoisy time series of community dynamics where cross-site pat-terns of interannual variation in weather and disturbancelevels (e.g. herbivore pressure) may also have strong impactson stability.Additionally, we found few significant alpha diversity-alpha
stability relationships across local communities within sites(Fig. 4d–g). This may be due to different relationshipsbetween alpha diversity and stability in different local commu-nities. For example, in some local communities, greater spe-cies diversity might enhance species stability by increasingproductivity (the numerator in the stability formula; deMazancourt et al. 2013). However, in other local communi-ties, greater species richness may decrease species stability ifhigher diversity leads to more competitive interactions andlarger population fluctuations (Loreau & de Mazancourt2013). So, although we think that changes in biodiversitythrough time can impact gamma stability though increases inspecies synchrony, other site-level factors may cloud theapparentness of such an effect.
CONCLUSIONS
Ecosystem stability provides actionable information about thepredictability and persistence of multiple ecosystem services.Understanding stability at ecosystem or metacommunityscales requires knowledge of how stability is maintained whenmoving from smaller to larger spatial scales. Yet, most of ourknowledge about the drivers of ecosystem stability comesfrom relatively small-scale studies. Consistent with emergingtheory (Wang & Loreau 2014), we found that the stability ofspatially larger systems results both from the stability of localcommunities within the larger system, and from the degree ofsynchrony among these local communities. Contrary to expec-tations, beta diversity was not predictive of functional differ-ences among local communities within a metacommunity.Instead, it appears that population-specific responses to envi-ronmental conditions/disturbance regimes or different species
interactions across local communities may play a large role inpromoting stability at larger spatial scales. Based on thesefindings, we suggest that homogenisation of physical charac-teristics and/or plant populations across space may substan-tially reduce ecosystem stability.
ACKNOWLEDGEMENTS
We thank the Long Term Ecological Research Network Com-munications Office for funding the initial working groupresponsible for compiling the CORRE database, and the vari-ous funding agencies and data collection/processing personnelthat made individual studies possible, including but not lim-ited to: Jornada Basin Long-Term Ecological Research(LTER) (NSF DEB-1235828), ARC LTER RSF (#16-14-10208), Cedar Creek LTER, Konza Prairie LTER, theMacarthur Agro-Ecological Research Center, Niwot LTER,Plum Island Estuary, Sevilleta LTER. Data from the Smithso-nian Global Change Research Wetland as supported by theDOE-TES program (award DE-SC0008339), the NSF-LTREBprogram (awards DEB-0950080 and DEB-1457100), and theSmithsonian Environmental Research Center. VO thanks RSF(#16-14-10208) for financial support; CHR thanks the GlobalAtmospheric Nitrogen Environment (GANE) thematic pro-gramme of the UK Natural Environmental Research Council(GST022701); ATT was supported by an NSF PostdoctoralResearch Fellowship in Biology (DBI-1400370); and KRWwas supported by the Experimental Drought in GrasslandsExperiment (EF-1137293).
AUTHOR CONTRIBUTIONS
KRW and ATT designed and led the manuscript; KRW,ATT, SEK and EG participated in original idea generation;MLA and KJL led the collection of the database with thehelp of KRW, SEK, EG, GRH, FI, and DSJ; MLA, KJL,GRH, FI, DSJ, JMA, AHB, EB, EHB, WDB, AB, JFC,SLC, GD, AE, LG, AJ, CK, KK, AKK, JK, YL, JRM, PM,VO, JP, JP, CHR, OS, MDS, NAS, LS, DT, SRW, ZX, LY,YQ and YZ organised and collected abundance and produc-tivity data at various sites, data analysis was done by KRW,ATT, SEK, EG and LMH; all authors were involved in thewriting and editing process.
DATA ACCESSIBILITY STATEMENT
R code and derived data for all analyses are available on Fig-share (https://doi.org/10.6084/m9.figshare.5384167). Seehttp://corredata.weebly.com/ for inquiries concerning rawdata.
REFERENCES
Anderson, M.J., Ellingsen, K.E. & McArdle, B.H. (2006). Multivariate
dispersion as a measure of beta diversity. Ecol. Lett., 9, 683–693.Avolio, M.L., Beaulieu, J.M. & Smith, M.D. (2013). Genetic diversity of
a dominant C4 grass is altered with increased precipitation variability.
Oecologia, 171, 571–581.
© 2017 The Authors. Ecology Letters published by CNRS and John Wiley & Sons Ltd.
Letter Mechanisms of metacommunity stability 1543
Avolio, M.L., Koerner, S.E., La Pierre, K.J., Wilcox, K.R., Wilson,
G.W., Smith, M.D. et al. (2014). Changes in plant community
composition, not diversity, during a decade of nitrogen and phosphorus
additions drive above-ground productivity in a tallgrass prairie. J.
Ecol., 102, 1649–1660.Avolio, M.L., Pierre, K.J.L., Houseman, G.R., Koerner, S.E., Grman, E.,
Isbell, F. et al. (2015). A framework for quantifying the magnitude and
variability of community responses to global change drivers. Ecosphere,
6, 1–14.Bai, Y., Han, X., Wu, J., Chen, Z. & Li, L. (2004). Ecosystem stability
and compensatory effects in the Inner Mongolia grassland. Nature, 431,
181–184.Cavin, L., Mountford, E.P., Peterken, G.F. & Jump, A.S. (2013).
Extreme drought alters competitive dominance within and between tree
species in a mixed forest stand. Funct. Ecol., 27, 1424–1435.Chang, C.C. & Smith, M.D. (2014). Resource availability modulates
above- and below-ground competitive interactions between genotypes
of a dominant C4 grass. Funct. Ecol., 28, 1041–1051.Doak, D.F. & Morris, W.F. (2010). Demographic compensation and
tipping points in climate-induced range shifts. Nature, 467, 959–962.Fisher, B., Turner, R.K. & Morling, P. (2009). Defining and classifying
ecosystem services for decision making. Ecol. Econ., 68, 643–653.Grimm, V. & Wissel, C. (1997). Babel, or the ecological stability
discussions: an inventory and analysis of terminology and a guide for
avoiding confusion. Oecologia, 109, 323–334.Grman, E., Lau, J.A., Schoolmaster, D.R. & Gross, K.L. (2010).
Mechanisms contributing to stability in ecosystem function depend on
the environmental context. Ecol. Lett., 13, 1400–1410.Gross, K., Cardinale, B.J., Fox, J.W., Gonzalez, A., Loreau, M., Polley,
H.W. et al. (2014). Species richness and the temporal stability of
biomass production: a new analysis of recent biodiversity experiments.
Am. Nat., 183, 1–12.Gurevitch, J., Fox, G.A., Fowler, N.L. & Graham, C.H. (2016).
Landscape demography: population changes and its drivers across
spatial scales. Q. Rev. Biol., 91, 459–485.Hallett, L.M., Hsu, J.S., Cleland, E.E., Collins, S.L., Dickson, T.L.,
Farrer, E.C. et al. (2014). Biotic mechanisms of community stability
shift along a precipitation gradient. Ecology, 95, 1693–1700.Hallett, L.M., Jones, S.K., MacDonald, A.M., Jones, M.B., Flynn,
D.F.B., Ripplinger, J. et al. (2016). codyn: an R package of community
dynamics metrics. Methods Ecol. Evol., 7, 1146–1151.Hautier, Y., Seabloom, E.W., Borer, E.T., Adler, P.B., Harpole, W.S.,
Hillebrand, H. et al. (2014). Eutrophication weakens stabilizing effects
of diversity in natural grasslands. Nature, 508, 521–525.Hector, A., Hautier, Y., Saner, P., Wacker, L., Bagchi, R., Joshi, J. et al.
(2010). General stabilizing effects of plant diversity on grassland
productivity through population asynchrony and overyielding. Ecology,
91, 2213–2220.Heisler, J.L. & Knapp, A.K. (2008). Temporal coherence of aboveground
net primary productivity in mesic grasslands. Ecography, 31, 408–416.Hoover, D.L., Knapp, A.K. & Smith, M.D. (2014). Resistance and
resilience of a grassland ecosystem to climate extremes. Ecology, 95,
2646–2656.Isbell, F.I., Polley, H.W. & Wilsey, B.J. (2009). Biodiversity, productivity
and the temporal stability of productivity: patterns and processes. Ecol.
Lett., 12, 443–451.Isbell, F., Craven, D., Connolly, J., Loreau, M., Schmid, B.,
Beierkuhnlein, C. et al. (2015). Biodiversity increases the resistance of
ecosystem productivity to climate extremes. Nature, 526, 574–577.Koerner, S.E., Avolio, M.L., La Pierre, K.J., Wilcox, K.R., Smith, M.D.
& Collins, S.L. (2016). Nutrient additions cause divergence of tallgrass
prairie plant communities resulting in loss of ecosystem stability. J.
Ecol., 104, 1478–1487.Ladwig, L.M., Collins, S.L., Swann, A.L., Xia, Y., Allen, M.F. & Allen,
E.B. (2012). Above-and belowground responses to nitrogen addition in
a Chihuahuan Desert grassland. Oecologia, 169, 177–185.
Lalibert�e, E., Norton, D.A. & Scott, D. (2013). Contrasting effects of
productivity and disturbance on plant functional diversity at local and
metacommunity scales. J. Veg. Sci., 24, 834–842.Lavorel, S. & Garnier, E. (2002). Predicting changes in community
composition and ecosystem functioning from plant traits: revisiting the
Holy Grail. Funct. Ecol., 16, 545–556.Leibold, M.A., Holyoak, M., Mouquet, N., Amarasekare, P., Chase,
J.M., Hoopes, M.F. et al. (2004). The metacommunity concept: a
framework for multi-scale community ecology. Ecol. Lett., 7, 601–613.Levin, S.A. (1992). The problem of pattern and scale in ecology: the
Robert H. MacArthur Award Lecture. Ecology, 73, 1943–1967.Loreau, M. & de Mazancourt, C. (2008). Species synchrony and its
drivers: neutral and nonneutral community dynamics in fluctuating
environments. Am. Nat., 172, E48–E66.Loreau, M. & de Mazancourt, C. (2013). Biodiversity and ecosystem
stability: a synthesis of underlying mechanisms. Ecol. Lett., 16, 106–115.de Mazancourt, C., Isbell, F., Larocque, A., Berendse, F., Luca, E.,
Grace, J.B. et al. (2013). Predicting ecosystem stability from
community composition and biodiversity. Ecol. Lett., 16, 617–625.
McGill, B.J., Enquist, B.J., Weiher, E. & Westoby, M. (2006). Rebuilding
community ecology from functional traits. Trends Ecol. Evol., 21, 178–185.
McGranahan, D.A., Hovick, T.J., Dwayne Elmore, R., Engle, D.M.,
Fuhlendorf, S.D., Winter, S.L. et al. (2016). Temporal variability in
aboveground plant biomass decreases as spatial variability increases.
Ecology, 97, 555–560.Melbourne, B.A., Cornell, H.V., Davies, K.F., Dugaw, C.J., Elmendorf,
S., Freestone, A.L. et al. (2007). Invasion in a heterogeneous world:
resistance, coexistence or hostile takeover? Ecol. Lett., 10, 77–94.Mellin, C., Bradshaw, C., Fordham, D. & Caley, M. (2014). Strong but
opposing beta diversity-stability relationships in coral reef fish
communities. Proc. Biol. Sci., 281, 20131993.
Naeem, S. & Li, S. (1997). Biodiversity enhances ecosystem reliability.
Nature, 390, 507–509.Oksanen, J., Blanchet, F.G., Kindt, R., Legendre, P., Minchin, P.R.,
O’Hara, R. et al. (2016). Package ‘vegan’. Community ecology
package, version 2.
Polley, H., Wilsey, B.J. & Derner, J.D. (2007). Dominant species
constrain effects of species diversity on temporal variability in biomass
production of tallgrass prairie. Oikos, 116, 2044–2052.Polley, H.W., Isbell, F.I. & Wilsey, B.J. (2013). Plant functional traits
improve diversity-based predictions of temporal stability of grassland
productivity. Oikos, 122, 1275–1282.Potts, D., Huxman, T., Scott, R., Williams, D. & Goodrich, D. (2006).
The sensitivity of ecosystem carbon exchange to seasonal precipitation
and woody plant encroachment. Oecologia, 150, 453–463.R Core Team (2016). R: A Language and Environment for Statistical
Computing. R Foundation for Statistical Computing, Vienna, Austria.
Ricciardi, A., Hoopes, M.F., Marchetti, M.P. & Lockwood, J.L. (2013).
Progress toward understanding the ecological impacts of nonnative
species. Ecol. Monogr., 83, 263–282.Smith, M.D. & Knapp, A.K. (2003). Dominant species maintain
ecosystem function with non-random species loss. Ecol. Lett., 6, 509–517.
Tilman, D. (1996). Biodiversity: population versus ecosystem stability.
Ecology, 77, 350–363.Tilman, D. (1999). The ecological consequences of changes in
biodiversity: a search for general principles. Ecology, 80, 1455–1474.
Tilman, D., Reich, P.B. & Knops, J.M. (2006). Biodiversity and
ecosystem stability in a decade-long grassland experiment. Nature, 441,
629–632.Tredennick, A.T., de Mazancourt, C., Loreau, M. & Adler, P.B. (2017).
Environmental responses, not species interactions, determine synchrony
of dominant species in semiarid grasslands. Ecology, 98, 971–981.
© 2017 The Authors. Ecology Letters published by CNRS and John Wiley & Sons Ltd.
1544 K. R. Wilcox et al. Letter
Turner, M.G., Romme, W.H., Gardner, R.H., O’Neill, R.V. & Kratz,
T.K. (1993). A revised concept of landscape equilibrium: disturbance
and stability on scaled landscapes. Landscape Ecol., 8, 213–227.Wang, S. & Loreau, M. (2014). Ecosystem stability in space: alpha, beta
and gamma variability. Ecol. Lett., 17, 891–901.Wang, S. & Loreau, M. (2016). Biodiversity and ecosystem stability
across scales in metacommunities. Ecol. Lett., 19, 510–518.Wang, S., Loreau, M., Arnoldi, J.F., Fang, J., Rahman, K.A., Tao, S. &
de Mazancourt, D. (2017). An invariability-area relationship sheds
new light on the spatial scaling of ecological stability. Nature
Communications, 8.
White, P.S. & Jentsch, A. (2001). The search for generality in studies of
disturbance and ecosystem dynamics. In: Progress in Botany (ed Esser,
K., L€uttge, U., Kadereit, J.W., Beyschlag, W.). Springer, Berlin
Heidelberg, Vol. 62, pp. 399–450.Wilcox, K.R., Blair, J.M., Smith, M.D. & Knapp, A.K. (2016). Does
ecosystem sensitivity to precipitation at the site-level conform to
regional-scale predictions? Ecology, 97, 561–568.
Yachi, S. & Loreau, M. (1999). Biodiversity and ecosystem productivity
in a fluctuating environment: the insurance hypothesis. Proc. Natl
Acad. Sci., 96, 1463–1468.Zhang, Y., Chen, H.Y. & Reich, P.B. (2012). Forest productivity
increases with evenness, species richness and trait variation: a global
meta-analysis. J. Ecol., 100, 742–749.
SUPPORTING INFORMATION
Additional Supporting Information may be found online inthe supporting information tab for this article.
Editor, Jessica GurevitchManuscript received 1 July 2017First decision made 1 August 2017Manuscript accepted 6 September 2017
© 2017 The Authors. Ecology Letters published by CNRS and John Wiley & Sons Ltd.
Letter Mechanisms of metacommunity stability 1545