at a glance - listed companybts.listedcompany.com/misc/newsltr/20190220-bts-newslrt-3q20… · at a...
TRANSCRIPT
Our City Our Future 1
INVESTOR RELATIONS QUARTERLY REVIEW: ISSUE 35 BTS GROUP HOLDINGS PCL
3Q 2018/19 (For the quarter ended 31 Dec 2018)
(Ended June 2010) AT A GLANCE
SHARE INFORMATIONi
Shares Outstanding 11,845.2mn sharesvii Free Float 58.0%v Par Value THB 4.0 / Sharevi Market Capitalisation THB 120.8bn / USD 3.9bnii YTD daily traded valueiv THB 253.7mn / USD 7.2mnii Stock Identifiers
Stock Exchange Symbol BTS Bloomberg / Reuters BTS TB / BTS.BK
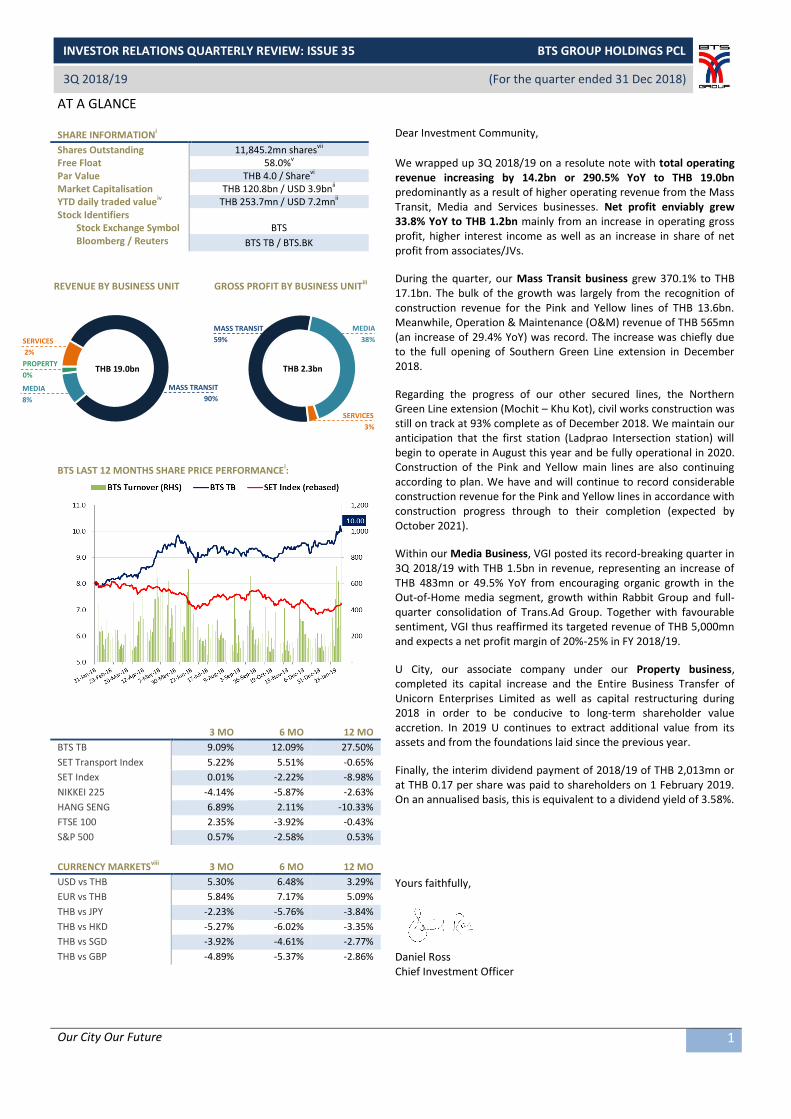
REVENUE BY BUSINESS UNIT GROSS PROFIT BY BUSINESS UNITiii
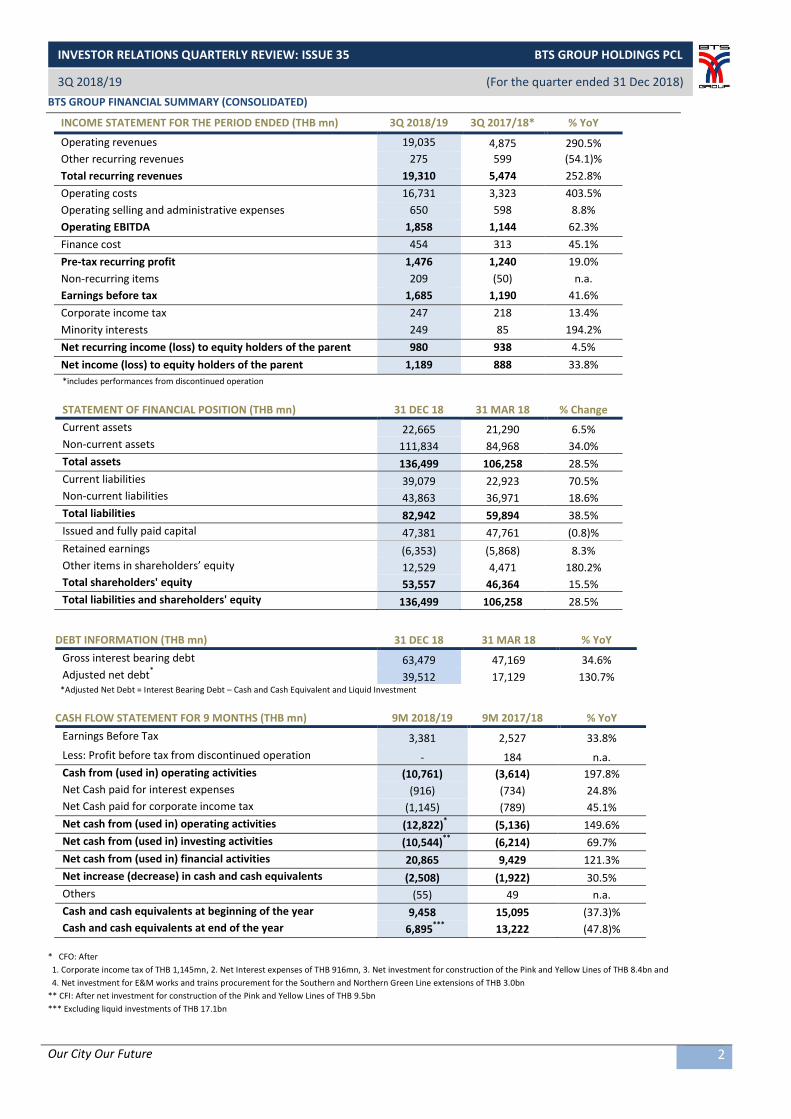
BTS LAST 12 MONTHS SHARE PRICE PERFORMANCEi:
3 MO 6 MO 12 MO
BTS TB 9.09% 12.09% 27.50%
SET Transport Index 5.22% 5.51% -0.65%
SET Index 0.01% -2.22% -8.98%
NIKKEI 225 -4.14% -5.87% -2.63%
HANG SENG 6.89% 2.11% -10.33%
FTSE 100 2.35% -3.92% -0.43%
S&P 500 0.57% -2.58% 0.53%
CURRENCY MARKETSviii 3 MO 6 MO 12 MO
USD vs THB 5.30% 6.48% 3.29%
EUR vs THB 5.84% 7.17% 5.09%
THB vs JPY -2.23% -5.76% -3.84%
THB vs HKD -5.27% -6.02% -3.35%
THB vs SGD -3.92% -4.61% -2.77%
THB vs GBP -4.89% -5.37% -2.86%
Dear Investment Community,
We wrapped up 3Q 2018/19 on a resolute note with total operating revenue increasing by 14.2bn or 290.5% YoY to THB 19.0bn predominantly as a result of higher operating revenue from the Mass Transit, Media and Services businesses. Net profit enviably grew 33.8% YoY to THB 1.2bn mainly from an increase in operating gross profit, higher interest income as well as an increase in share of net profit from associates/JVs.
During the quarter, our Mass Transit business grew 370.1% to THB 17.1bn. The bulk of the growth was largely from the recognition of construction revenue for the Pink and Yellow lines of THB 13.6bn. Meanwhile, Operation & Maintenance (O&M) revenue of THB 565mn (an increase of 29.4% YoY) was record. The increase was chiefly due to the full opening of Southern Green Line extension in December 2018.
Regarding the progress of our other secured lines, the Northern Green Line extension (Mochit – Khu Kot), civil works construction was still on track at 93% complete as of December 2018. We maintain our anticipation that the first station (Ladprao Intersection station) will begin to operate in August this year and be fully operational in 2020. Construction of the Pink and Yellow main lines are also continuing according to plan. We have and will continue to record considerable construction revenue for the Pink and Yellow lines in accordance with construction progress through to their completion (expected by October 2021).
Within our Media Business, VGI posted its record-breaking quarter in 3Q 2018/19 with THB 1.5bn in revenue, representing an increase of THB 483mn or 49.5% YoY from encouraging organic growth in the Out-of-Home media segment, growth within Rabbit Group and full-quarter consolidation of Trans.Ad Group. Together with favourable sentiment, VGI thus reaffirmed its targeted revenue of THB 5,000mn and expects a net profit margin of 20%-25% in FY 2018/19.
U City, our associate company under our Property business, completed its capital increase and the Entire Business Transfer of Unicorn Enterprises Limited as well as capital restructuring during 2018 in order to be conducive to long-term shareholder value accretion. In 2019 U continues to extract additional value from its assets and from the foundations laid since the previous year.
Finally, the interim dividend payment of 2018/19 of THB 2,013mn or at THB 0.17 per share was paid to shareholders on 1 February 2019. On an annualised basis, this is equivalent to a dividend yield of 3.58%.
Yours faithfully,
Daniel Ross Chief Investment Officer
THB 2.3bn
MEDIA
8%
SERVICES
2%
PROPERTY
0%
MASS TRANSIT
90%
SERVICES
1%
SERVICES
3%
MEDIA
38%
MASS TRANSIT
59%
THB 19.0bn
Our City Our Future 2
INVESTOR RELATIONS QUARTERLY REVIEW: ISSUE 35 BTS GROUP HOLDINGS PCL
3Q 2018/19 (For the quarter ended 31 Dec 2018)
(Ended June 2010)
BTS GROUP FINANCIAL SUMMARY (CONSOLIDATED)
INCOME STATEMENT FOR THE PERIOD ENDED (THB mn) 3Q 2018/19 3Q 2017/18* % YoY
Operating revenues 19,035 4,875 290.5%
Other recurring revenues 275 599 (54.1)%
Total recurring revenues 19,310 5,474 252.8%
Operating costs 16,731 3,323 403.5%
Operating selling and administrative expenses 650 598 8.8%
Operating EBITDA 1,858 1,144 62.3%
Finance cost 454 313 45.1%
Pre-tax recurring profit 1,476 1,240 19.0%
Non-recurring items 209 (50) n.a.
Earnings before tax 1,685 1,190 41.6%
Corporate income tax 247 218 13.4%
Minority interests 249 85 194.2%
Net recurring income (loss) to equity holders of the parent 980 938 4.5%
Net income (loss) to equity holders of the parent 1,189 888 33.8%
*includes performances from discontinued operation
STATEMENT OF FINANCIAL POSITION (THB mn) 31 DEC 18 31 MAR 18 % Change
Current assets 22,665 21,290 6.5%
Non-current assets 111,834 84,968 34.0%
Total assets 136,499 106,258 28.5%
Current liabilities 39,079 22,923 70.5%
Non-current liabilities 43,863 36,971 18.6%
Total liabilities 82,942 59,894 38.5%
Issued and fully paid capital 47,381 47,761 (0.8)%
Retained earnings (6,353) (5,868) 8.3%
Other items in shareholders’ equity 12,529 4,471 180.2%
Total shareholders' equity 53,557 46,364 15.5%
Total liabilities and shareholders' equity 136,499 106,258 28.5%
DEBT INFORMATION (THB mn) 31 DEC 18 31 MAR 18 % YoY
Gross interest bearing debt 63,479 47,169 34.6%
Adjusted net debt* 39,512 17,129 130.7%
*Adjusted Net Debt = Interest Bearing Debt – Cash and Cash Equivalent and Liquid Investment
CASH FLOW STATEMENT FOR 9 MONTHS (THB mn) 9M 2018/19 9M 2017/18 % YoY
Earnings Before Tax 3,381 2,527 33.8%
Less: Profit before tax from discontinued operation - 184 n.a.
Cash from (used in) operating activities (10,761) (3,614) 197.8%
Net Cash paid for interest expenses (916) (734) 24.8%
Net Cash paid for corporate income tax (1,145) (789) 45.1%
Net cash from (used in) operating activities (12,822)* (5,136) 149.6%
Net cash from (used in) investing activities (10,544)**
(6,214) 69.7%
Net cash from (used in) financial activities 20,865 9,429 121.3%
Net increase (decrease) in cash and cash equivalents (2,508) (1,922) 30.5%
Others (55) 49 n.a.
Cash and cash equivalents at beginning of the year 9,458 15,095 (37.3)%
Cash and cash equivalents at end of the year 6,895***
13,222 (47.8)%
* CFO: After
1. Corporate income tax of THB 1,145mn, 2. Net Interest expenses of THB 916mn, 3. Net investment for construction of the Pink and Yellow Lines of THB 8.4bn and
4. Net investment for E&M works and trains procurement for the Southern and Northern Green Line extensions of THB 3.0bn
** CFI: After net investment for construction of the Pink and Yellow Lines of THB 9.5bn
*** Excluding liquid investments of THB 17.1bn
Our City Our Future 3
INVESTOR RELATIONS QUARTERLY REVIEW: ISSUE 35 BTS GROUP HOLDINGS PCL
3Q 2018/19 (For the quarter ended 31 Dec 2018)
(Ended June 2010)
KEY FINANCIAL RATIOS
3Q 2018/19 HIGHLIGHTS
A prodigious YoY increase in total operating revenue by THB 14.2bn or 290.5% to THB 19.0bn in 3Q 2018/19, predominantly as a result
of higher operating revenue from the Mass Transit, Media and Services businesses
Total Mass Transit revenue of THB 17.1bn – an expectional growth of 370.1% YoY or THB 13.5bn - largely from the recognition of
construction revenue for the Pink and Yellow lines of THB 13.6bn in this quarter
Revenue from the provision of Electrical and Mechanical (E&M) works and train procurement service for the Southern and Northern
Green Line extensions of THB 2.2bn was recorded in this quarter
Mass Transit Operation & Maintenance (O&M) revenue rose 29.4% YoY to THB 565mn, largely due to the full opening of Southern
Green Line extension in December 2018 as well as the contractually agreed increase in the operating fee of the existing Green Line
extensions.
3Q 2018/19 farebox revenue grew 2.9% YoY to THB 1,792mn, from an increase in average fare of 1.5% YoY to THB 29.1 per trip and the
increase in ridership of 1.3% YoY to 61.6mn trips.
Media business posted a record-breaking quarter in 3Q 2018/19 with THB 1,460mn in revenue, representing an increase of THB 483mn
or 49.5% YoY from encouraging organic growth in the Out-of-Home media segment, growth within Rabbit Group and full-quarter
consolidation of Trans.Ad Group
Operating EBITDA of THB 1,858mn, an increase of THB 713mn or 62.3% YoY, largely as a result of improvements in operating
performances of our Mass Transit, Media and Services businesses
Reported Net Profit (after MI) of THB 1,189mn, an increase of THB 300mn or 33.8% YoY, mainly from an increase in operating gross profit, higher interest income as well as an increase in share of net profit from associates/JVs
The interim dividend payment of 2018/19 of THB 2,013mn or at THB 0.17 per share was paid to shareholders on 1 February 2019.
SIGNIFICANT EVENTS
BTS GROUP
7 November 2018: The Executive Committee approved the issuance of BTS-W4 warrants for 30 November 2018. The term of BTS-W4 is one
year from the issuance date, or expiring on 29 November 2019. The warrant holders can exercise their rights on the last business day of every
quarter after the issuance date. The exercise ratio is 1:1 at the price of THB 10.50 per share.
Profitability ratios 3Q 2018/19 3Q 2017/18* 2Q 2018/19
Gross operating profit margin (%) 12.1% 31.8% 11.5%
Operating EBITDA margin (%)A 9.8% 23.5% 8.9%
Recurring pre-tax profit margin (%)B 7.6% 22.7% 7.7%
Net profit margin (%)C 6.1% 16.3% 4.1%
ROA (%)D 4.4% 2.7% 4.4%
ROE (%)E 10.8% 5.7% 10.3%
Liquidity ratio
Current ratio (times) 0.58x 1.13x 0.88x
Leverage ratios
Interest bearing debt to equity (times) 1.19x 1.07x 1.15x
Adjusted net debtF to equity (times) 0.74x 0.34x 0.56x
Adjusted net debtF to recurring operating EBITDA (times) 5.75x 3.14x 4.38x
Interest coverage (times)G 4.09x 3.65x 3.52x
Per share ratiosH
Basic earnings per share (THB) 0.10 0.08 0.06
Book value per share (THB) 4.52 3.92 4.25
NOTE:
*Includes performance from discontinued
operation
A Excludes non-operating items and interest
income
B Calculated based on pre-tax recurring profit
/ total recurring revenue
C Calculated based on accounting net profit
(after MI) / total accounting revenue including
shares of income / (loss) from investments in
associates and JVs and gross revenue under
profit from discontinued operation for the
period
D Calculated based on accounting net profit /
total average assets
E Calculated based on accounting net profit /
total average shareholders’ equity
F Calculated from interest bearing debt – cash
and cash equivalent and liquid investment –
Cash to be received from clearing house-share
subscription of subsidiary
G Calculated based on operating EBITDA /
finance cost
H Calculated based on weighted average
number of shares at par value of THB 4.0

Our City Our Future 4
INVESTOR RELATIONS QUARTERLY REVIEW: ISSUE 35 BTS GROUP HOLDINGS PCL
3Q 2018/19 (For the quarter ended 31 Dec 2018)
(Ended June 2010)
7 January 2019: The Board of Directors approved the interim dividend payment from the operating results of the six-month period (April 2018
– September 2018) at THB 0.17 per share. Subsequently, on 1 February 2019, a total of THB 2,013.3mn was paid to shareholders. Based on the
share price on 4 January 2019 of THB 9.50 (one day before BOD date), this is equivalent to a dividend yield of 3.58% on an annualised basis.
MASS TRANSIT
12 November 2018: BSR Joint Venture, a Joint Venture between BTS Group Holding Publiuc Company Limited (BTSG or the Company), Sino-
Thai Engineering & Construction PCL (STEC), and Ratchaburi Electricity Generating Holding PCL (RATCH), submitted its bid for the High Speed
Rail Project (Don Muang - Suvarnabhumi - U-Ta Pao; 220km, 15 stations) to the State Railway of Thailand. The Company has entered into a
joint venture agreement with STEC and RATCH to jointly invest and hold 60%, 20% and 20% in BSR for the High Speed Rail Project, respectively.
6 December 2018: Bangkok Mass Transit System Public Company Limited (BTSC) and the Bangkok Metropolitan Administration (BMA)
commenced full operation of the Southern Green Line extension (Bearing – Samutprakarn), totaling 12.6km, 9 stations.
MEDIA
30 October 2018: Rabbit LinePay Company Limited (RLP) and BTSC announced the soft launch of “Bind, Tap & Ride” service across 20 BTS
stations allowing more than 700,000 BTS users to bind their existing rabbit card with Rabbit LinePay into a single e-wallet. This represents a
major milestone in driving the public towards a cashless society and creating the smoothest experience for BTS daily users, as well as
promoting a queue-free experience on the BTS system.
November 2018: Master Ad Public Company Limited (MACO) received the approval from BMA to renovate its street furniture media on BTS
columns. MACO will leverage the benefits of digitalising its prime media inventory by converting its existing 188 static street furniture panels
to 42 LED screens and 180 lightboxes. The renovation is expected to start commercialisation in May 2019.
November 2018: MACO acquired 75% in VGI Global Media (Malaysia) Sdn Bhd (VGM) with a total investment value of THB 360mn. This
transaction will strengthen MACO’s international footprint, and VGM will be the flagbearer in expanding OOH media business overseas.
December 2018: RLP continued to enhance its payment services to move towards a cashless society by launching its QR Code payments for a
single-journey BTS passengers. Such development aims to provide an easier journey for BTS passengers.
PROPERTY
12 October 2018: The Extraordinary Shareholders’ Meeting of U City Public Company Limited (U City) approved a series of transactions,
including (i) a reverse stock split of ordinary and preferred shares at a ratio of 100:1, which is expected to facilitate the stock’s long-term
trading liquidity, resulting in the the increase in par value of both U City’s ordinary and preferred shares to THB 100 from THB 1, (ii) a minor
capital increase through a private placement, for the purpose of facilitating the reverse stock split via a rounding of fractional shares and (iii) a
capital reduction for the purpose of reducing the deficit in the separate financial statements of U City, and thereby reducing the par value to
THB 3.20 from THB 100. These key transactions are expected to considerably boost U City’s attractiveness to potential investors and be
conducive to long-term shareholder value accretion.
17 November 2018: Sansiri JV launches ‘THE LINE Phahonyothin Park’ project for presales. The third project launched this year under the
Sansiri JV, with a total project value of THB 4.9bn, 880 units and an average selling price per unit of THB 5.6mn.
1 December 2018: U City has recently launched the 194-key Eastin Thana City Golf Resort Bangkok, a hotel located within the Thana City
Country Club, as the first Eastin resort in Thailand.
9M 2018/19 P&L SNAPSHOT
Total consolidated revenue of 9M 2018/19 stood at THB 38,710mn, growing significantly by 244.5% YoY or THB 27,474mn. The substantial
revenue development was mainly attributed to (i) an increase in revenue from installation and construction services and train procurement
service of THB 26.6bn, largely from the revenue recognition of the construction of Pink and Yellow lines, which contributed revenue of THB
25.4bn and (ii) an increase in service income of THB 653mn largely from higher Mass Transit, Media and Services revenue, together with (iii)
higher interest income of THB 543mn. As a result of the aforementioned major revenue contributors, group operating EBITDA in 9M 2018/19
surged by THB 1,455mn or 49.6% YoY to THB 4,391mn. The Group recorded net profit (after MI) of THB 2,246mn, increasing by THB 300mn
or 15.4% YoY. Net profit growth was mainly attributable to improvements in the performances of the Mass Transit and Media business in
particular, as well as the increase in interest income, being partially offset by higher finance cost and higher income tax.

Our City Our Future 5
INVESTOR RELATIONS QUARTERLY REVIEW: ISSUE 35 BTS GROUP HOLDINGS PCL
3Q 2018/19 (For the quarter ended 31 Dec 2018)
(Ended June 2010)
3Q 2018/19 PERFORMANCE
The Group reported total consolidated revenues of THB 19,349mn in 3Q 2018/19. This represented an increase of 274.1% YoY or THB
14,177mn from THB 5,171mn in 3Q 2017/18. The revenue growth was chiefly attributed to (i) an increase in revenue from installation and
construction services and train procurement service of THB 13,669mn, mainly from the recognition of construction revenue for the Pink and
Yellow lines, (ii) higher service income of THB 371mn chiefly from higher revenue of our Mass Transit, Media and Services business and (iii)
growth in interest income of THB 240mn, chiefly from (a) receivables under an agreement with the government for the provision of E&M
works and train procurement services for the Southern and Northern Green Line extensions and (b) receivables related to the Pink and Yellow
lines and (c) interest income from related parties.
Total consolidated expenses amounted to THB 17,451mn in 3Q 2018/19, an increase of THB 13,584mn or 351.3% YoY largely from (i)
recognition of construction cost for the Pink and Yellow lines and (ii) higher selling and administrative expenses of THB 214mn principally from
expenditures in relation with ongoing Media business’ expansion. Reported share of net profit from associates/JVs (including share of profit
from BTSGIF) was THB 241mn (compared to share of net profit of THB 86mn in 3Q 2017/18). The YoY increase of THB 154mn was mainly from
share of net profit from U City and from Kerry Express Thailand. Finance costs increased by 44.8% YoY or THB 140mn to THB 454mn, primarily
from interest expense of (i) THB 7.0bn of BTSG debentures issued by BTSG on 26 December 2017 and (ii) THB 9.5bn of BTSG debentures issued
by BTSG on 7 September 2018.
As a result, profit attributable to the equity holders of the Company increased by 33.8% YoY or THB 300mn to THB 1,189mn, predominantly
from an increase in operating gross profit, higher interest income as well as an increase in share of net profit from associates/JVs. The net
profit margin attributable to the equity holders of the Company in 3Q 2018/19 was 6.1% (versus 16.3% in 3Q 2017/18). The decrease in net
profit margin was mainly from the recognition of construction revenue for the aforesaid Pink and Yellow lines and services income for the
provision of E&M works and train procurement which have lower margins.
OPERATING REVENUE AND OPERATING GROSS PROFIT MARGIN BY BU
Operating Revenue
1
(THB mn) 3Q 2018/19 % of Total
1 3Q 2017/18 % of Total
1
% Change (YoY)
3Q 2018/19 GP Margin
6
3Q 2017/18 GP Margin
6
Mass Transit 17,1202 90% 3,642 75% 370.1% 8.0% 22.9%
Media3 1,460 8% 976 20% 49.5% 59.2% 68.3%
Property 854 0% 174 4% (51.1)% 7.3% 39.4%
Services5 371 2% 83 1% 345.4% 17.7 n.a.
Total1 19,035 100% 4,875 100% 290.5% 12.1% 31.8%
1 Operating revenue from the operational performance of 4 BUs EXCLUDES non-mass transit related interest income, dividend income and non-recurring items 2 3Q 2018/19 Mass Transit revenue includes:
i) Share of net profit (loss) from BTSGIF (included in ‘Share of profit (loss) from investments in associates’ in statement of comprehensive income) ii) Service Income from Train, farebox revenue from BRT, Interest Income from Train Procurement and Interest Income under purchase and installation of operating system agreement iii) Services Income from the provision of E&M works and the train procurement service for the Southern and Northern Green Line extensions iv) Construction revenue and the interest income related to the Pink and Yellow lines 3 Media revenue includes performances of VGI Group and Rabbit Group. Rabbit group (classified to be under Digital Services Business) comprises of BSS & BSSH and subsidiaries but excludes two companies which are Bangkok Payment Solutions Co., Ltd. (BPS) and Rabbit Rewards Co., Ltd. (RR) 4 3Q 2018/19 Property includes Sales from Real Estate, Rental and Service Income, Revenue from Thana City Golf & Sports Club
5 Services revenue includes revenue from Rabbit Rewards, BPS, HHT construction and ChefMan Restaurants (up to 3 August 2017). 6 Operating gross profit calculated based on the operational performance of 4 BUs
Total operating revenue1 in 3Q 2018/19 reached THB 19,035mn, a significant increase of 290.5% YoY or THB 14,160mn. Revenues from the
Mass Transit, Media, Property and Services businesses accounted for 90%, 8%, 0% and 2% of total operating revenue, respectively. The sharp
rise in operating revenue was largely as a result of higher Mass Transit, Media and Services operating revenues, which increased by 370.1%,
49.5% and 345.4% YoY, respectively. The growth was chiefly from (i) the continued recognition of construction revenue for the Pink and Yellow
lines, (ii) higher Media revenue, driven by encouraging organic growth in the Out-of-Home media segment, growth within Rabbit Group and
full-quarter consolidation of Trans.Ad Group and (iii) increased construction revenue generated from HHT Construction Company Limited.
Nevertheless, the increase in operating revenue was partially offset by a decrease of 51.1% or THB 89mn YoY in Property operating revenue,
primarilly from the deconsolidation of Unicorn Enterprise Company Limited (UE), following the entire business transfer (EBT of UE) to U City in
4Q 2017/18. Operating revenue growth was also accompanied by an increase in operating costs which came to THB 16,731mn, up 403.5% YoY,
Our City Our Future 6
INVESTOR RELATIONS QUARTERLY REVIEW: ISSUE 35 BTS GROUP HOLDINGS PCL
3Q 2018/19 (For the quarter ended 31 Dec 2018)
(Ended June 2010)
primarily from construction costs for the Pink and Yellow lines. Operating gross profit6 grew 48.5% YoY to THB 2,305mn and operating EBITDA
7
rose by THB 713mn or 62.3% YoY to THB 1,858mn. As construction revenue for the aforesaid Pink and Yellow lines and services income for the
provision of E&M works and train procurement have lower margins, operating gross profit margin declined to 12.1% from 31.8% in the prior
year and operating EBITDA margin decreased to 9.8% in 3Q 2018/19 from 23.5% in 3Q 2017/18. 7 Operating EBITDA calculated based on the operational performance of 4 BUs EXCLUDES non-mass transit related interest income, dividend income, share of net profit (loss) from other associates (except from BTSGIF) and joint ventures and other non-recurring items
SEGMENTAL PERFORMANCE
MASS TRANSIT BUSINESS
Total Mass Transit revenue was THB 17,120mn, a significant growth of 370.1% YoY or THB 13,478mn, due to (i) the continued recognition of
construction revenue for the Pink and Yellow Lines, (ii) the beginning of revenue recognition for the provision of E&M works for the Gold line
in this quarter, of THB 213mn, (iii) higher interest income related to Green Line extensions and the Pink and Yellow Lines, (iv) higher O&M
revenue from the full commencement of the Southern Green Line extension, (v) an increase in share of net profit from investment in BTSGIF,
yet partly offset by (vi) reduced recognition of revenue for the provision of E&M works and the train procurement service for the Southern and
Northern Green Line extensions.
In 3Q 2018/19, Construction revenue for the Pink and Yellow Lines contributed 80% of total Mass Transit revenue or THB 13.6bn according to
progress of work completion. Interest income related to Green Line extensions, Pink and Yellow Lines increased by 165.2% YoY or THB 180mn
to THB 289mn, chiefly as a result of interest income from receivable related to the aforesaid Pink and Yellow Lines as well as the provision of
services for the Southern and Northern Green Line extensions.
O&M revenue in this quarter rose considerably by 29.4% or THB 128mn YoY to THB 565mn. This increase was mainly attributable to the the
full opening of Southern Green Line extension since 6 December 2018, as well as the contractually agreed increase in the operating fee of the
existing Green Line extensions.
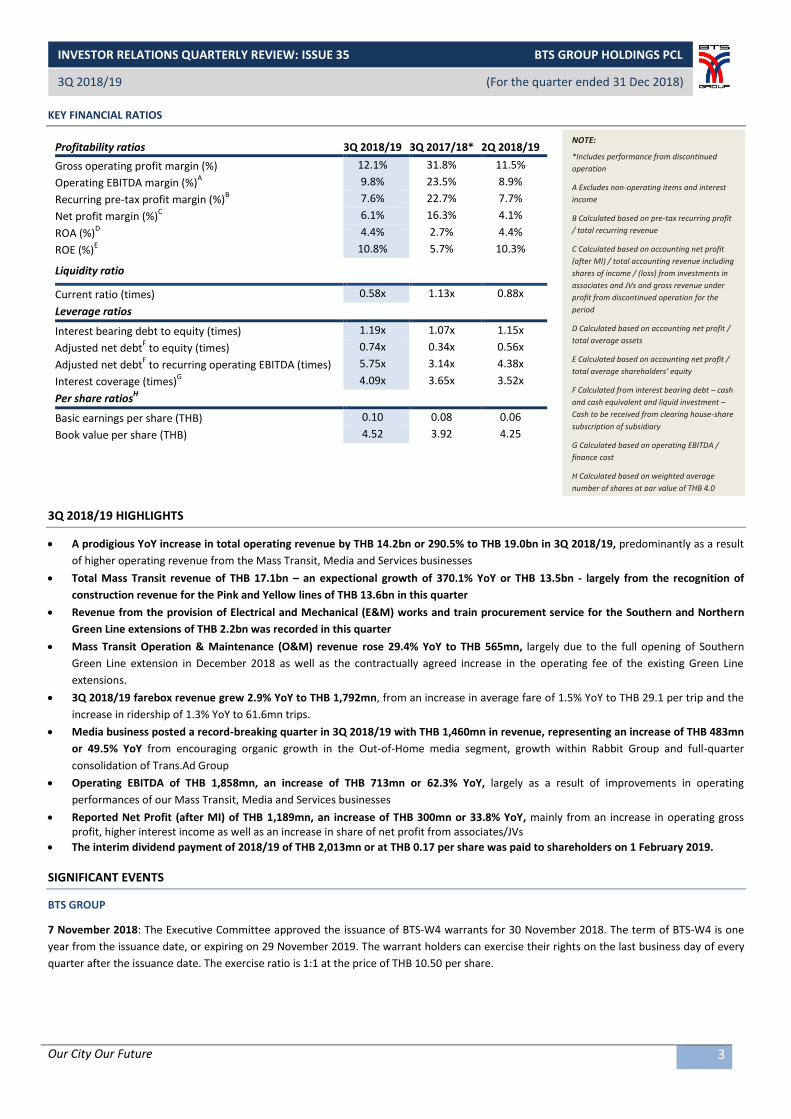
Share of net profit from investment in BTSGIF grew to THB 239mn, increasing by THB 6mn or 2.7% YoY, from the growth of farebox revenue
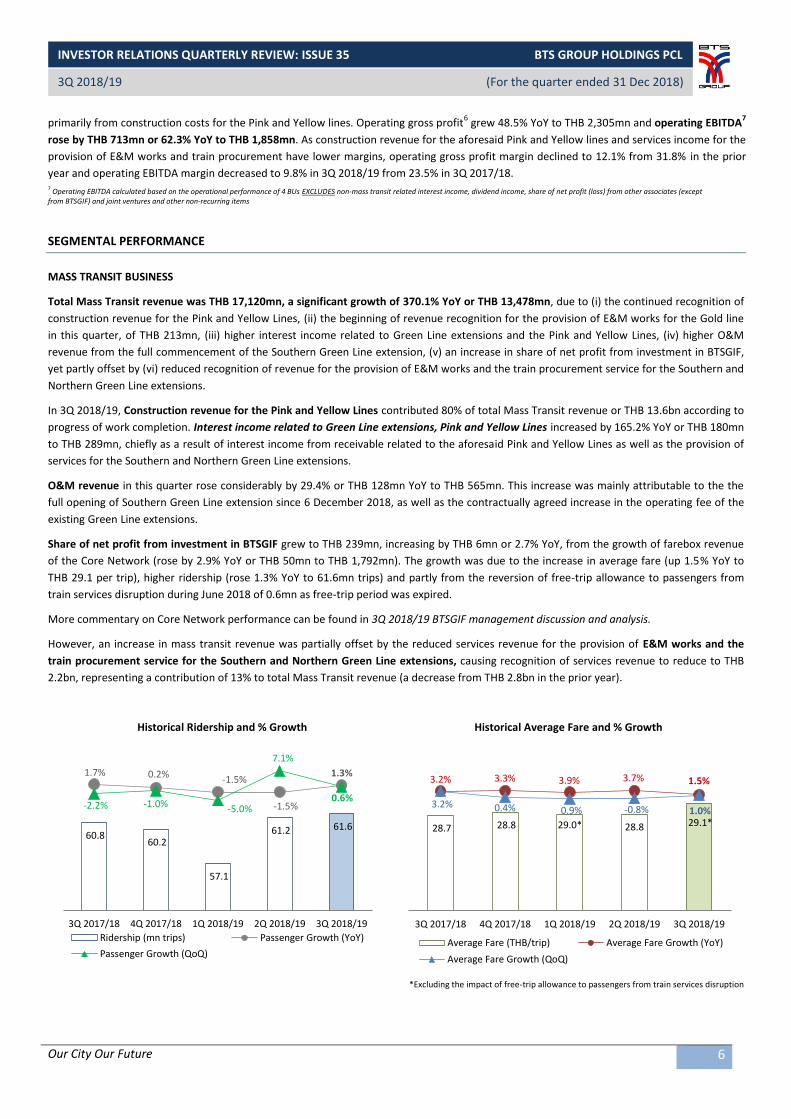
of the Core Network (rose by 2.9% YoY or THB 50mn to THB 1,792mn). The growth was due to the increase in average fare (up 1.5% YoY to
THB 29.1 per trip), higher ridership (rose 1.3% YoY to 61.6mn trips) and partly from the reversion of free-trip allowance to passengers from
train services disruption during June 2018 of 0.6mn as free-trip period was expired.
More commentary on Core Network performance can be found in 3Q 2018/19 BTSGIF management discussion and analysis.
However, an increase in mass transit revenue was partially offset by the reduced services revenue for the provision of E&M works and the
train procurement service for the Southern and Northern Green Line extensions, causing recognition of services revenue to reduce to THB
2.2bn, representing a contribution of 13% to total Mass Transit revenue (a decrease from THB 2.8bn in the prior year).
Historical Ridership and % Growth Historical Average Fare and % Growth
*Excluding the impact of free-trip allowance to passengers from train services disruption
60.8 60.2
57.1
61.2 61.6
1.7% 0.2% -1.5%
-1.5%
1.3%
-2.2% -1.0% -5.0%
7.1%
0.6%
-50.0%
0.0 %
53.0
58.0
63.0
3Q 2017/18 4Q 2017/18 1Q 2018/19 2Q 2018/19 3Q 2018/19
Ridership (mn trips) Passenger Growth (YoY)
Passenger Growth (QoQ)
28.7 28.8 29.0* 28.8 29.1*
3.2% 3.3% 3.9% 3.7% 1.5%
3.2% 0.4% 0.9% -0.8% 1.0%
25.0
30.0
3Q 2017/18 4Q 2017/18 1Q 2018/19 2Q 2018/19 3Q 2018/19
Average Fare (THB/trip) Average Fare Growth (YoY)
Average Fare Growth (QoQ)
Our City Our Future 7
INVESTOR RELATIONS QUARTERLY REVIEW: ISSUE 35 BTS GROUP HOLDINGS PCL
3Q 2018/19 (For the quarter ended 31 Dec 2018)
(Ended June 2010)
Mass Transit costs increased by THB 12,943mn to THB 15,750mn largely from the recognition of construction costs for the Pink and Yellow
Lines, being partly offset by the reduced recognition of costs related to the provision of E&M works and train procurement services for the
Green Line extensions. Operating EBITDA margin declined considerably to 8.1% from 23.1% in previous year, as a result of the
abovementioned provision of services, which have lower margin. If the aforestated revenue, cost and interest income related to pink and
yellow lines construction as well as the provision of E&M works and train procurement services of the green line extensions were excluded, the
operating EBTIDA margin for the Mass Transit business was 70.8%.
MEDIA BUSINESS
Our media business demonstrated continuous growth, validating its strategy to offer total ‘Offline-to-Online solutions’ for advertisers. A
record-breaking quarter was achieved in 3Q 2018/19 with THB 1,460mn in total Media revenue, representing an increase of THB 483mn or
49.5% YoY. The increase was mainly driven by encouraging organic growth in the Out-of-Home media segment as well as growth within Rabbit
Group and the full-quarter consolidation of Trans.Ad Solutions Company Limited and Roctec Technology Limited, collectively called “Trans.Ad
Group” in Digital Services segment.
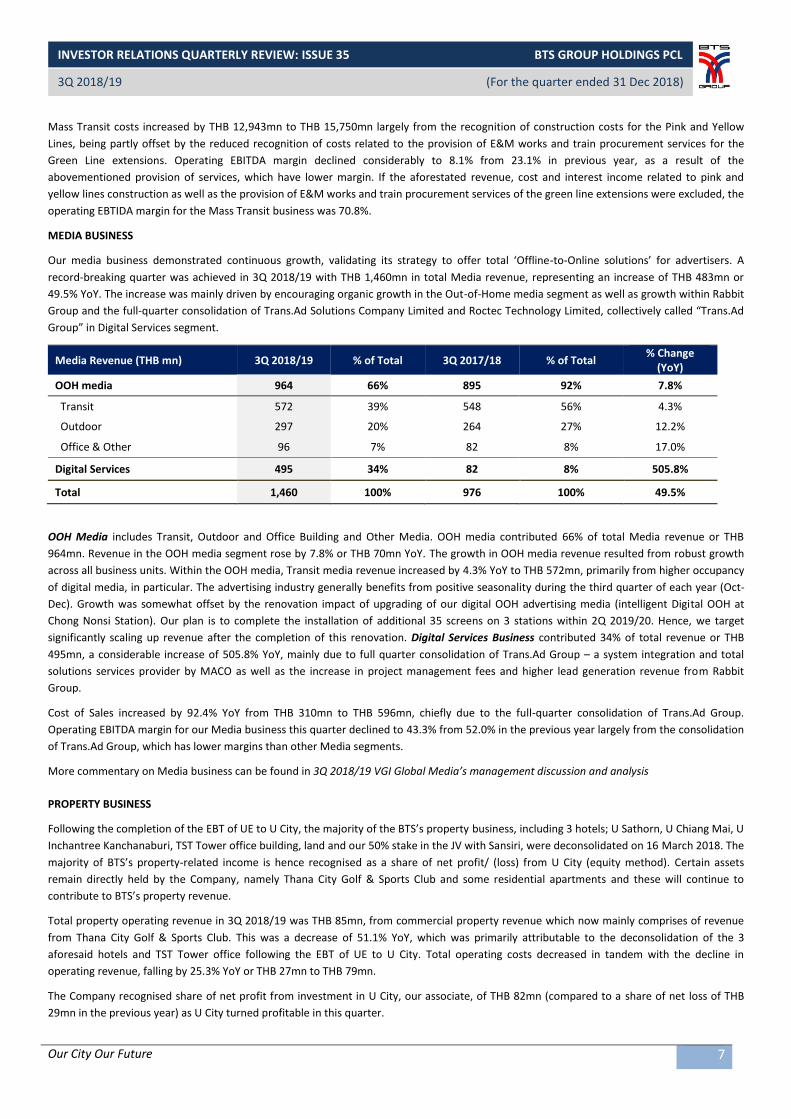
Media Revenue (THB mn) 3Q 2018/19 % of Total 3Q 2017/18 % of Total % Change
(YoY)
OOH media 964 66% 895 92% 7.8%
Transit 572 39% 548 56% 4.3%
Outdoor 297 20% 264 27% 12.2%
Office & Other 96 7% 82 8% 17.0%
Digital Services 495 34% 82 8% 505.8%
Total 1,460 100% 976 100% 49.5%
OOH Media includes Transit, Outdoor and Office Building and Other Media. OOH media contributed 66% of total Media revenue or THB
964mn. Revenue in the OOH media segment rose by 7.8% or THB 70mn YoY. The growth in OOH media revenue resulted from robust growth
across all business units. Within the OOH media, Transit media revenue increased by 4.3% YoY to THB 572mn, primarily from higher occupancy
of digital media, in particular. The advertising industry generally benefits from positive seasonality during the third quarter of each year (Oct-
Dec). Growth was somewhat offset by the renovation impact of upgrading of our digital OOH advertising media (intelligent Digital OOH at
Chong Nonsi Station). Our plan is to complete the installation of additional 35 screens on 3 stations within 2Q 2019/20. Hence, we target
significantly scaling up revenue after the completion of this renovation. Digital Services Business contributed 34% of total revenue or THB
495mn, a considerable increase of 505.8% YoY, mainly due to full quarter consolidation of Trans.Ad Group – a system integration and total
solutions services provider by MACO as well as the increase in project management fees and higher lead generation revenue from Rabbit
Group.
Cost of Sales increased by 92.4% YoY from THB 310mn to THB 596mn, chiefly due to the full-quarter consolidation of Trans.Ad Group.
Operating EBITDA margin for our Media business this quarter declined to 43.3% from 52.0% in the previous year largely from the consolidation
of Trans.Ad Group, which has lower margins than other Media segments.
More commentary on Media business can be found in 3Q 2018/19 VGI Global Media’s management discussion and analysis
PROPERTY BUSINESS
Following the completion of the EBT of UE to U City, the majority of the BTS’s property business, including 3 hotels; U Sathorn, U Chiang Mai, U
Inchantree Kanchanaburi, TST Tower office building, land and our 50% stake in the JV with Sansiri, were deconsolidated on 16 March 2018. The
majority of BTS’s property-related income is hence recognised as a share of net profit/ (loss) from U City (equity method). Certain assets
remain directly held by the Company, namely Thana City Golf & Sports Club and some residential apartments and these will continue to
contribute to BTS’s property revenue.
Total property operating revenue in 3Q 2018/19 was THB 85mn, from commercial property revenue which now mainly comprises of revenue
from Thana City Golf & Sports Club. This was a decrease of 51.1% YoY, which was primarily attributable to the deconsolidation of the 3
aforesaid hotels and TST Tower office following the EBT of UE to U City. Total operating costs decreased in tandem with the decline in
operating revenue, falling by 25.3% YoY or THB 27mn to THB 79mn.
The Company recognised share of net profit from investment in U City, our associate, of THB 82mn (compared to a share of net loss of THB
29mn in the previous year) as U City turned profitable in this quarter.
Our City Our Future 8
INVESTOR RELATIONS QUARTERLY REVIEW: ISSUE 35 BTS GROUP HOLDINGS PCL
3Q 2018/19 (For the quarter ended 31 Dec 2018)
(Ended June 2010)
SERVICES BUSINESS
3Q 2018/19 Services business revenue increased by THB 288mn or 345.4% YoY to THB 371mn. The growth was chiefly due to an increase in
construction revenue generated from HHT construction Company Limited. Services business costs also increased by THB 205mn or 204.2% YoY
to THB 306mn. SG&A expenses amounted to THB 26mn, an increase of THB 10mn or 62.3% YoY.
FINANCIAL POSITION \
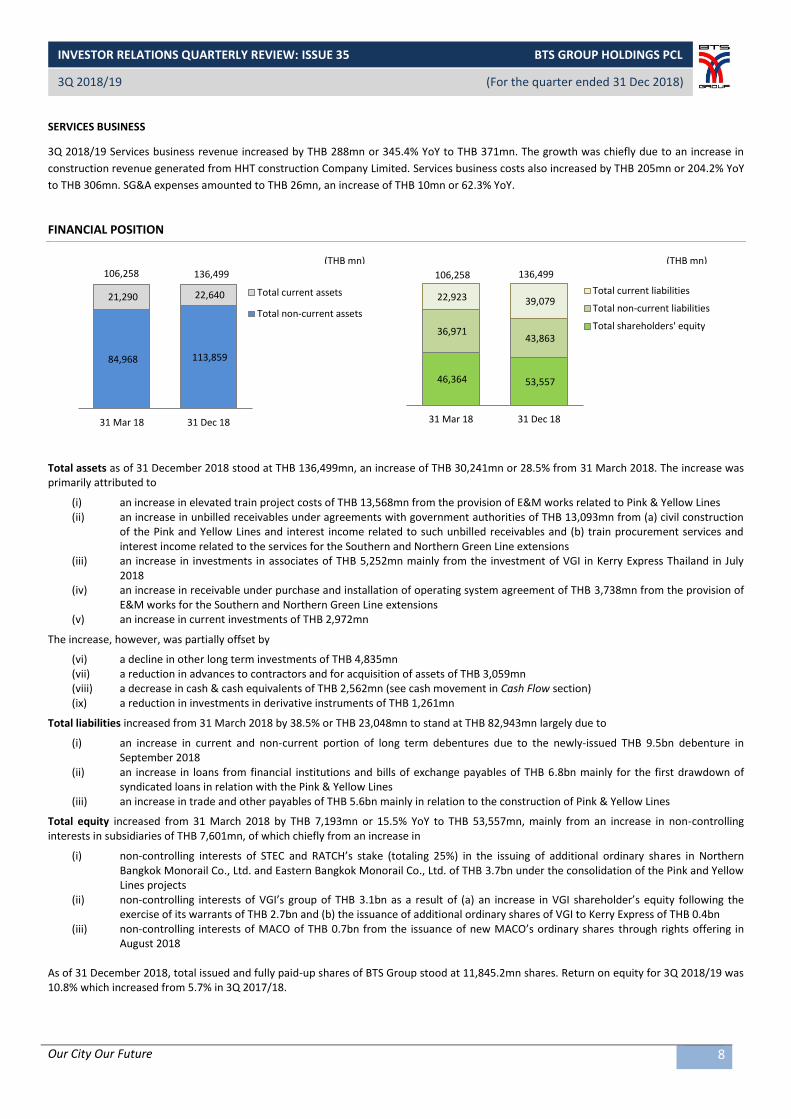
Total assets as of 31 December 2018 stood at THB 136,499mn, an increase of THB 30,241mn or 28.5% from 31 March 2018. The increase was primarily attributed to
(i) an increase in elevated train project costs of THB 13,568mn from the provision of E&M works related to Pink & Yellow Lines (ii) an increase in unbilled receivables under agreements with government authorities of THB 13,093mn from (a) civil construction
of the Pink and Yellow Lines and interest income related to such unbilled receivables and (b) train procurement services and interest income related to the services for the Southern and Northern Green Line extensions
(iii) an increase in investments in associates of THB 5,252mn mainly from the investment of VGI in Kerry Express Thailand in July 2018
(iv) an increase in receivable under purchase and installation of operating system agreement of THB 3,738mn from the provision of E&M works for the Southern and Northern Green Line extensions
(v) an increase in current investments of THB 2,972mn
The increase, however, was partially offset by
(vi) a decline in other long term investments of THB 4,835mn (vii) a reduction in advances to contractors and for acquisition of assets of THB 3,059mn (viii) a decrease in cash & cash equivalents of THB 2,562mn (see cash movement in Cash Flow section) (ix) a reduction in investments in derivative instruments of THB 1,261mn
Total liabilities increased from 31 March 2018 by 38.5% or THB 23,048mn to stand at THB 82,943mn largely due to
(i) an increase in current and non-current portion of long term debentures due to the newly-issued THB 9.5bn debenture in September 2018
(ii) an increase in loans from financial institutions and bills of exchange payables of THB 6.8bn mainly for the first drawdown of syndicated loans in relation with the Pink & Yellow Lines
(iii) an increase in trade and other payables of THB 5.6bn mainly in relation to the construction of Pink & Yellow Lines
Total equity increased from 31 March 2018 by THB 7,193mn or 15.5% YoY to THB 53,557mn, mainly from an increase in non-controlling interests in subsidiaries of THB 7,601mn, of which chiefly from an increase in
(i) non-controlling interests of STEC and RATCH’s stake (totaling 25%) in the issuing of additional ordinary shares in Northern Bangkok Monorail Co., Ltd. and Eastern Bangkok Monorail Co., Ltd. of THB 3.7bn under the consolidation of the Pink and Yellow Lines projects
(ii) non-controlling interests of VGI’s group of THB 3.1bn as a result of (a) an increase in VGI shareholder’s equity following the exercise of its warrants of THB 2.7bn and (b) the issuance of additional ordinary shares of VGI to Kerry Express of THB 0.4bn
(iii) non-controlling interests of MACO of THB 0.7bn from the issuance of new MACO’s ordinary shares through rights offering in August 2018
As of 31 December 2018, total issued and fully paid-up shares of BTS Group stood at 11,845.2mn shares. Return on equity for 3Q 2018/19 was 10.8% which increased from 5.7% in 3Q 2017/18.
84,968 113,859
21,290 22,640
31 Mar 18 31 Dec 18
Total current assets
Total non-current assets
136,499 106,258
46,364 53,557
36,971 43,863
22,923 39,079
31 Mar 18 31 Dec 18
Total current liabilities
Total non-current liabilities
Total shareholders' equity
136,499 106,258
(THB mn) (THB mn)
Our City Our Future 9
INVESTOR RELATIONS QUARTERLY REVIEW: ISSUE 35 BTS GROUP HOLDINGS PCL
3Q 2018/19 (For the quarter ended 31 Dec 2018)
(Ended June 2010)
CASH FLOW
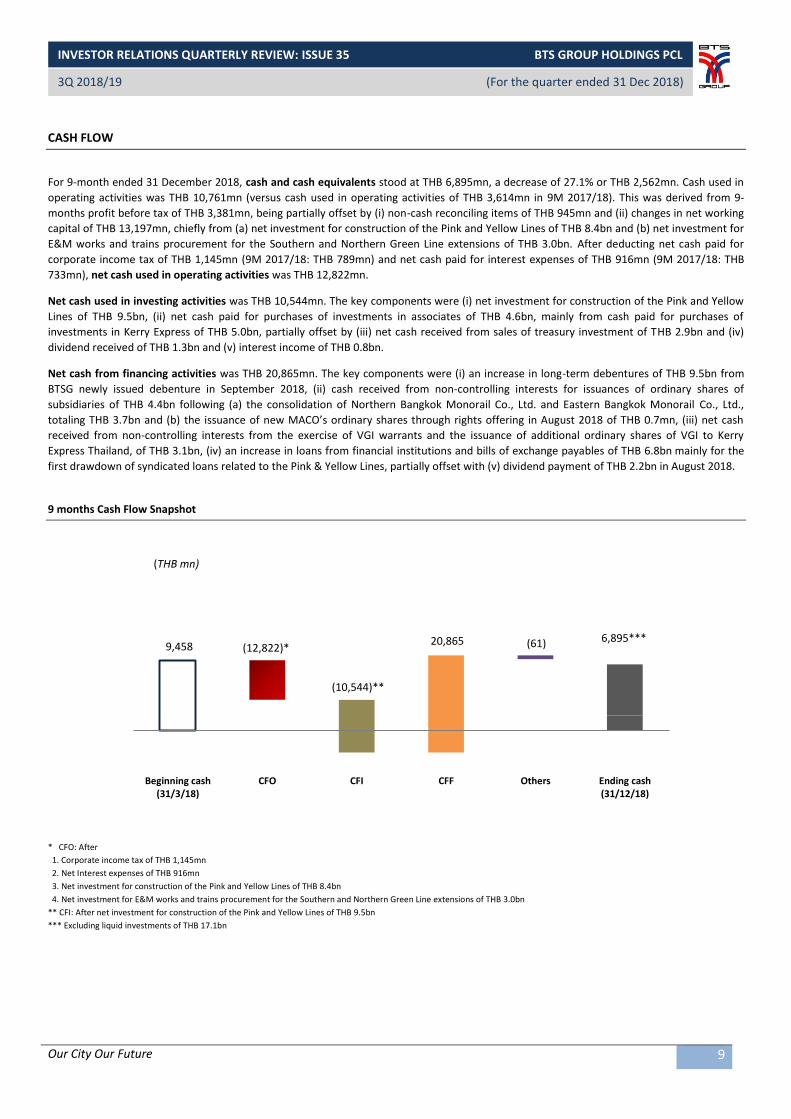
For 9-month ended 31 December 2018, cash and cash equivalents stood at THB 6,895mn, a decrease of 27.1% or THB 2,562mn. Cash used in
operating activities was THB 10,761mn (versus cash used in operating activities of THB 3,614mn in 9M 2017/18). This was derived from 9-
months profit before tax of THB 3,381mn, being partially offset by (i) non-cash reconciling items of THB 945mn and (ii) changes in net working
capital of THB 13,197mn, chiefly from (a) net investment for construction of the Pink and Yellow Lines of THB 8.4bn and (b) net investment for
E&M works and trains procurement for the Southern and Northern Green Line extensions of THB 3.0bn. After deducting net cash paid for
corporate income tax of THB 1,145mn (9M 2017/18: THB 789mn) and net cash paid for interest expenses of THB 916mn (9M 2017/18: THB
733mn), net cash used in operating activities was THB 12,822mn.
Net cash used in investing activities was THB 10,544mn. The key components were (i) net investment for construction of the Pink and Yellow
Lines of THB 9.5bn, (ii) net cash paid for purchases of investments in associates of THB 4.6bn, mainly from cash paid for purchases of
investments in Kerry Express of THB 5.0bn, partially offset by (iii) net cash received from sales of treasury investment of THB 2.9bn and (iv)
dividend received of THB 1.3bn and (v) interest income of THB 0.8bn.
Net cash from financing activities was THB 20,865mn. The key components were (i) an increase in long-term debentures of THB 9.5bn from
BTSG newly issued debenture in September 2018, (ii) cash received from non-controlling interests for issuances of ordinary shares of
subsidiaries of THB 4.4bn following (a) the consolidation of Northern Bangkok Monorail Co., Ltd. and Eastern Bangkok Monorail Co., Ltd.,
totaling THB 3.7bn and (b) the issuance of new MACO’s ordinary shares through rights offering in August 2018 of THB 0.7mn, (iii) net cash
received from non-controlling interests from the exercise of VGI warrants and the issuance of additional ordinary shares of VGI to Kerry
Express Thailand, of THB 3.1bn, (iv) an increase in loans from financial institutions and bills of exchange payables of THB 6.8bn mainly for the
first drawdown of syndicated loans related to the Pink & Yellow Lines, partially offset with (v) dividend payment of THB 2.2bn in August 2018.
9 months Cash Flow Snapshot
* CFO: After
1. Corporate income tax of THB 1,145mn
2. Net Interest expenses of THB 916mn
3. Net investment for construction of the Pink and Yellow Lines of THB 8.4bn
4. Net investment for E&M works and trains procurement for the Southern and Northern Green Line extensions of THB 3.0bn
** CFI: After net investment for construction of the Pink and Yellow Lines of THB 9.5bn
*** Excluding liquid investments of THB 17.1bn
9,458 (12,822)*
(10,544)**
20,865 6,895*** (61)
Beginning cash(31/3/18)
CFO CFI CFF Others Ending cash(31/12/18)
(THB mn)
Our City Our Future 10
INVESTOR RELATIONS QUARTERLY REVIEW: ISSUE 35 BTS GROUP HOLDINGS PCL
3Q 2018/19 (For the quarter ended 31 Dec 2018)
(Ended June 2010)
BTS GROUP IN THE COMMUNITY
BTS Group is committed to improving the lives of people, through its vision of being a leading provider of mass transit services. The Group has
also initiated many special Corporate Social Responsibility (CSR) projects in both Bangkok and other provinces of Thailand. Our CSR activities
cover a broad spectrum of social concerns including religion, education, sport and public health and we encourage staff involvement in all
these efforts.
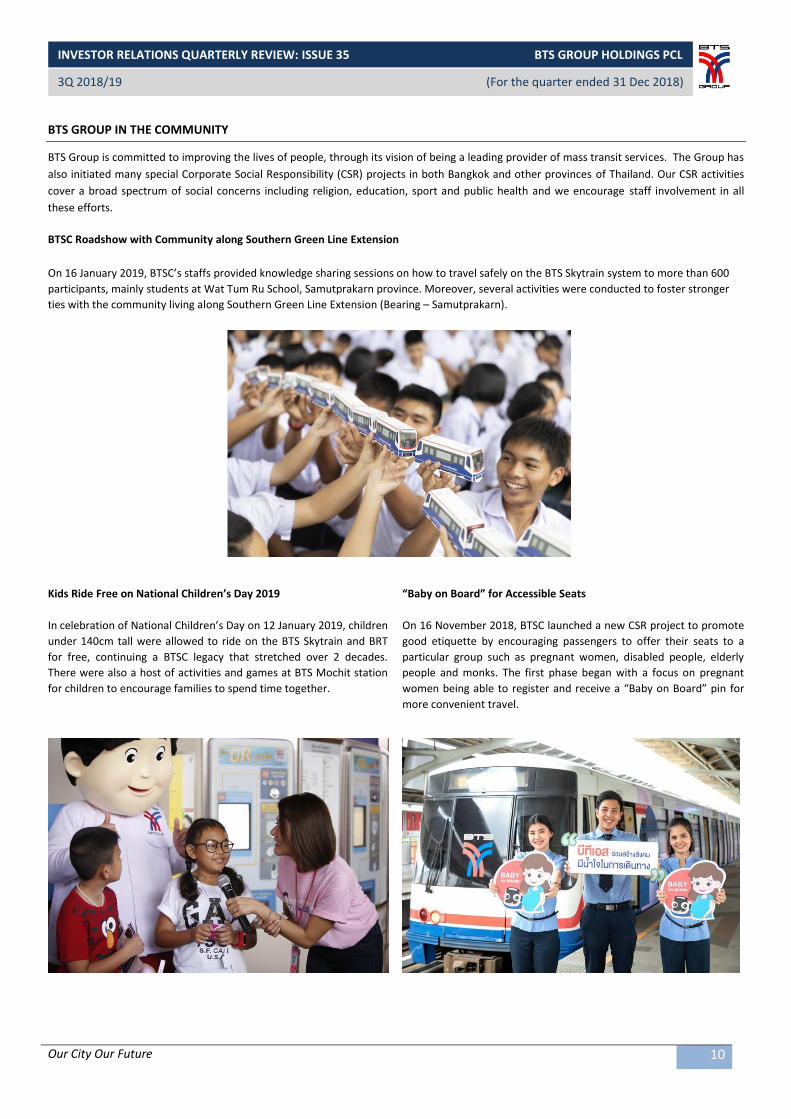
BTSC Roadshow with Community along Southern Green Line Extension
On 16 January 2019, BTSC’s staffs provided knowledge sharing sessions on how to travel safely on the BTS Skytrain system to more than 600
participants, mainly students at Wat Tum Ru School, Samutprakarn province. Moreover, several activities were conducted to foster stronger
ties with the community living along Southern Green Line Extension (Bearing – Samutprakarn).
Kids Ride Free on National Children’s Day 2019
In celebration of National Children’s Day on 12 January 2019, children
under 140cm tall were allowed to ride on the BTS Skytrain and BRT
for free, continuing a BTSC legacy that stretched over 2 decades.
There were also a host of activities and games at BTS Mochit station
for children to encourage families to spend time together.
“Baby on Board” for Accessible Seats
On 16 November 2018, BTSC launched a new CSR project to promote
good etiquette by encouraging passengers to offer their seats to a
particular group such as pregnant women, disabled people, elderly
people and monks. The first phase began with a focus on pregnant
women being able to register and receive a “Baby on Board” pin for
more convenient travel.
Our City Our Future 11
INVESTOR RELATIONS QUARTERLY REVIEW: ISSUE 35 BTS GROUP HOLDINGS PCL
3Q 2018/19 (For the quarter ended 31 Dec 2018)
(Ended June 2010)
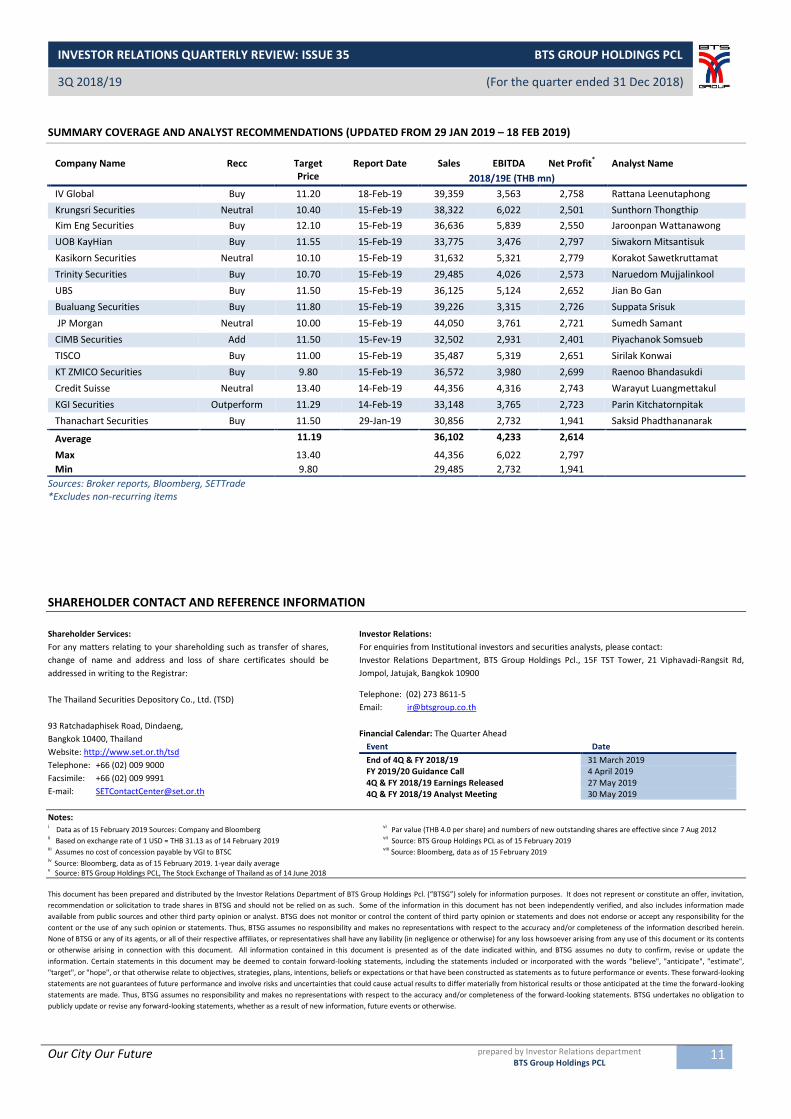
SUMMARY COVERAGE AND ANALYST RECOMMENDATIONS (UPDATED FROM 29 JAN 2019 – 18 FEB 2019)
Company Name Recc Target Price
Report Date Sales EBITDA Net Profit* Analyst Name
2018/19E (THB mn)
IV Global Buy 11.20 18-Feb-19 39,359 3,563 2,758 Rattana Leenutaphong
Krungsri Securities Neutral 10.40 15-Feb-19 38,322 6,022 2,501 Sunthorn Thongthip
Kim Eng Securities Buy 12.10 15-Feb-19 36,636 5,839 2,550 Jaroonpan Wattanawong
UOB KayHian Buy 11.55 15-Feb-19 33,775 3,476 2,797 Siwakorn Mitsantisuk
Kasikorn Securities Neutral 10.10 15-Feb-19 31,632 5,321 2,779 Korakot Sawetkruttamat
Trinity Securities Buy 10.70 15-Feb-19 29,485 4,026 2,573 Naruedom Mujjalinkool
UBS Buy 11.50 15-Feb-19 36,125 5,124 2,652 Jian Bo Gan
Bualuang Securities Buy 11.80 15-Feb-19 39,226 3,315 2,726 Suppata Srisuk
JP Morgan Neutral 10.00 15-Feb-19 44,050 3,761 2,721 Sumedh Samant
CIMB Securities Add 11.50 15-Fev-19 32,502 2,931 2,401 Piyachanok Somsueb
TISCO Buy 11.00 15-Feb-19 35,487 5,319 2,651 Sirilak Konwai
KT ZMICO Securities Buy 9.80 15-Feb-19 36,572 3,980 2,699 Raenoo Bhandasukdi
Credit Suisse Neutral 13.40 14-Feb-19 44,356 4,316 2,743 Warayut Luangmettakul
KGI Securities Outperform 11.29 14-Feb-19 33,148 3,765 2,723 Parin Kitchatornpitak
Thanachart Securities Buy 11.50 29-Jan-19 30,856 2,732 1,941 Saksid Phadthananarak
Average
11.19
36,102 4,233 2,614
Max 13.40 44,356 6,022 2,797
Min 9.80 29,485 2,732 1,941
Sources: Broker reports, Bloomberg, SETTrade *Excludes non-recurring items
SHAREHOLDER CONTACT AND REFERENCE INFORMATION
Shareholder Services:
For any matters relating to your shareholding such as transfer of shares,
change of name and address and loss of share certificates should be
addressed in writing to the Registrar:
The Thailand Securities Depository Co., Ltd. (TSD)
93 Ratchadaphisek Road, Dindaeng,
Bangkok 10400, Thailand
Website: http://www.set.or.th/tsd
Telephone: +66 (02) 009 9000
Facsimile: +66 (02) 009 9991
E-mail: [email protected]
Investor Relations:
For enquiries from Institutional investors and securities analysts, please contact:
Investor Relations Department, BTS Group Holdings Pcl., 15F TST Tower, 21 Viphavadi-Rangsit Rd,
Jompol, Jatujak, Bangkok 10900
Telephone: (02) 273 8611-5
Email: [email protected]
Financial Calendar: The Quarter Ahead
Event Date
End of 4Q & FY 2018/19 31 March 2019 FY 2019/20 Guidance Call 4 April 2019 4Q & FY 2018/19 Earnings Released 27 May 2019 4Q & FY 2018/19 Analyst Meeting 30 May 2019
Notes: i Data as of 15 February 2019 Sources: Company and Bloomberg vi Par value (THB 4.0 per share) and numbers of new outstanding shares are effective since 7 Aug 2012 ii Based on exchange rate of 1 USD = THB 31.13 as of 14 February 2019 vii Source: BTS Group Holdings PCL as of 15 February 2019 iii Assumes no cost of concession payable by VGI to BTSC viii Source: Bloomberg, data as of 15 February 2019 iv Source: Bloomberg, data as of 15 February 2019. 1-year daily average v Source: BTS Group Holdings PCL, The Stock Exchange of Thailand as of 14 June 2018
This document has been prepared and distributed by the Investor Relations Department of BTS Group Holdings Pcl. (“BTSG”) solely for information purposes. It does not represent or constitute an offer, invitation,
recommendation or solicitation to trade shares in BTSG and should not be relied on as such. Some of the information in this document has not been independently verified, and also includes information made
available from public sources and other third party opinion or analyst. BTSG does not monitor or control the content of third party opinion or statements and does not endorse or accept any responsibility for the
content or the use of any such opinion or statements. Thus, BTSG assumes no responsibility and makes no representations with respect to the accuracy and/or completeness of the information described herein.
None of BTSG or any of its agents, or all of their respective affiliates, or representatives shall have any liability (in negligence or otherwise) for any loss howsoever arising from any use of this document or its contents
or otherwise arising in connection with this document. All information contained in this document is presented as of the date indicated within, and BTSG assumes no duty to confirm, revise or update the
information. Certain statements in this document may be deemed to contain forward-looking statements, including the statements included or incorporated with the words "believe", "anticipate", "estimate",
"target", or "hope", or that otherwise relate to objectives, strategies, plans, intentions, beliefs or expectations or that have been constructed as statements as to future performance or events. These forward-looking
statements are not guarantees of future performance and involve risks and uncertainties that could cause actual results to differ materially from historical results or those anticipated at the time the forward-looking
statements are made. Thus, BTSG assumes no responsibility and makes no representations with respect to the accuracy and/or completeness of the forward-looking statements. BTSG undertakes no obligation to
publicly update or revise any forward-looking statements, whether as a result of new information, future events or otherwise.
prepared by Investor Relations department BTS Group Holdings PCL