at a glancebts.listedcompany.com/misc/newsltr/20181115-bts-newslrt-2q201819-en.pdf · feasibility...
TRANSCRIPT
Our City Our Future 1
INVESTOR RELATIONS QUARTERLY REVIEW: ISSUE 34 BTS GROUP HOLDINGS PCL
2Q 2018/19 (For the quarter ended 30 Sep 2018)
(Ended June 2010) AT A GLANCE
SHARE INFORMATIONi
Shares Outstanding 11,845.2mn sharesvii Free Float 58.0%v Par Value THB 4.0 / Sharevi Market Capitalisation THB 111.3bn / USD 3.4bnii YTD daily traded valueiv THB 248.8mn / USD 7.1mnii Stock Identifiers
Stock Exchange Symbol BTS Bloomberg / Reuters BTS TB / BTS.BK
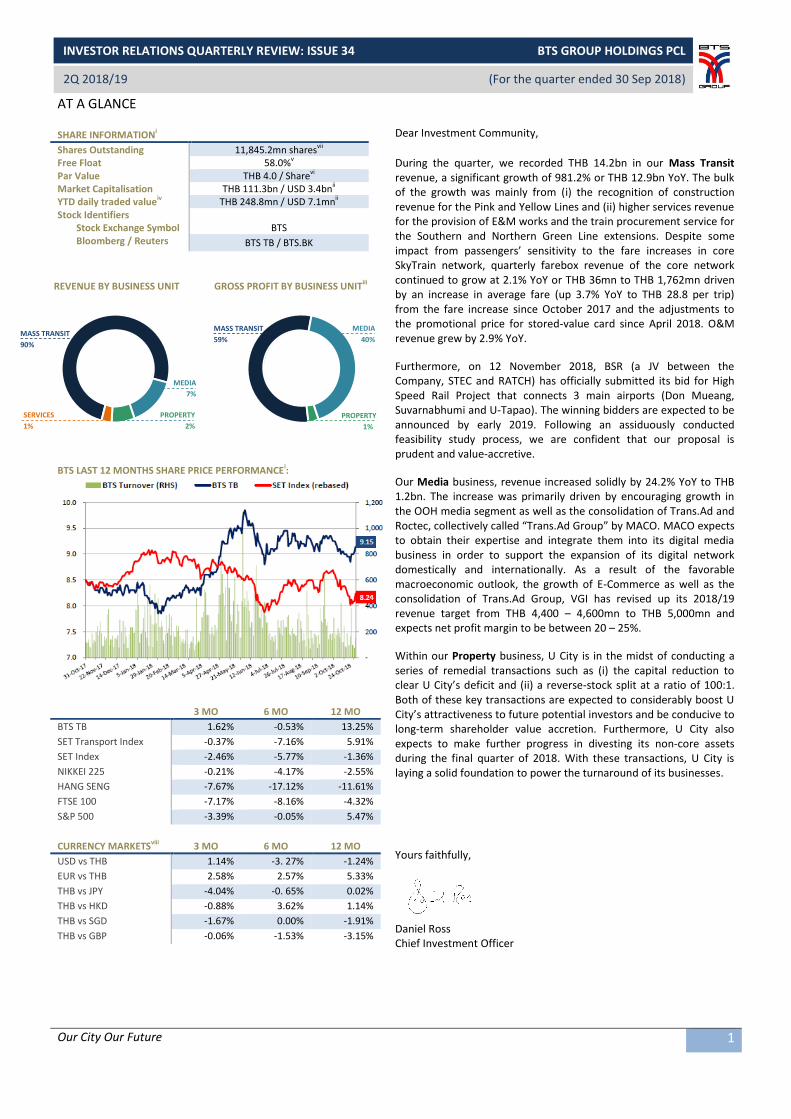
REVENUE BY BUSINESS UNIT GROSS PROFIT BY BUSINESS UNITiii
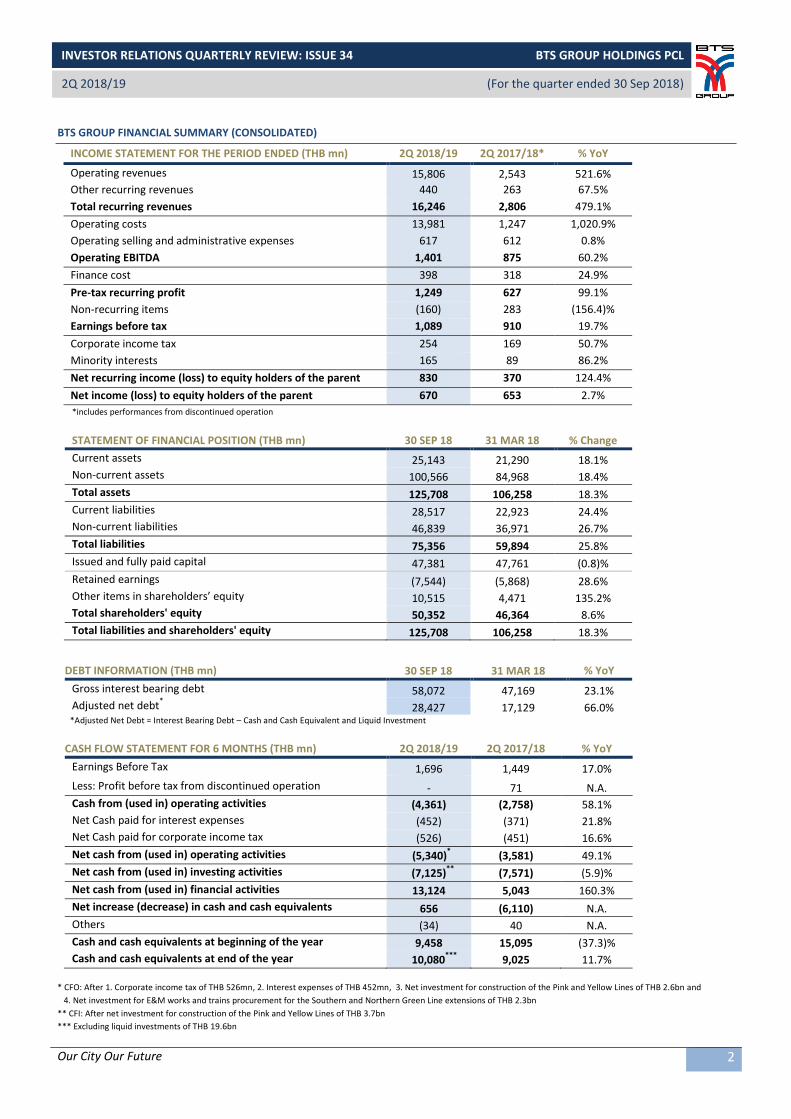
BTS LAST 12 MONTHS SHARE PRICE PERFORMANCEi:
3 MO 6 MO 12 MO
BTS TB 1.62% -0.53% 13.25%
SET Transport Index -0.37% -7.16% 5.91%
SET Index -2.46% -5.77% -1.36%
NIKKEI 225 -0.21% -4.17% -2.55%
HANG SENG -7.67% -17.12% -11.61%
FTSE 100 -7.17% -8.16% -4.32%
S&P 500 -3.39% -0.05% 5.47%
CURRENCY MARKETSviii 3 MO 6 MO 12 MO
USD vs THB 1.14% -3. 27% -1.24%
EUR vs THB 2.58% 2.57% 5.33%
THB vs JPY -4.04% -0. 65% 0.02%
THB vs HKD -0.88% 3.62% 1.14%
THB vs SGD -1.67% 0.00% -1.91%
THB vs GBP -0.06% -1.53% -3.15%
Dear Investment Community,
During the quarter, we recorded THB 14.2bn in our Mass Transit revenue, a significant growth of 981.2% or THB 12.9bn YoY. The bulk of the growth was mainly from (i) the recognition of construction revenue for the Pink and Yellow Lines and (ii) higher services revenue for the provision of E&M works and the train procurement service for the Southern and Northern Green Line extensions. Despite some impact from passengers’ sensitivity to the fare increases in core SkyTrain network, quarterly farebox revenue of the core network continued to grow at 2.1% YoY or THB 36mn to THB 1,762mn driven by an increase in average fare (up 3.7% YoY to THB 28.8 per trip) from the fare increase since October 2017 and the adjustments to the promotional price for stored-value card since April 2018. O&M revenue grew by 2.9% YoY.
Furthermore, on 12 November 2018, BSR (a JV between the Company, STEC and RATCH) has officially submitted its bid for High Speed Rail Project that connects 3 main airports (Don Mueang, Suvarnabhumi and U-Tapao). The winning bidders are expected to be announced by early 2019. Following an assiduously conducted feasibility study process, we are confident that our proposal is prudent and value-accretive.
Our Media business, revenue increased solidly by 24.2% YoY to THB 1.2bn. The increase was primarily driven by encouraging growth in the OOH media segment as well as the consolidation of Trans.Ad and Roctec, collectively called “Trans.Ad Group” by MACO. MACO expects to obtain their expertise and integrate them into its digital media business in order to support the expansion of its digital network domestically and internationally. As a result of the favorable macroeconomic outlook, the growth of E-Commerce as well as the consolidation of Trans.Ad Group, VGI has revised up its 2018/19 revenue target from THB 4,400 – 4,600mn to THB 5,000mn and expects net profit margin to be between 20 – 25%.
Within our Property business, U City is in the midst of conducting a series of remedial transactions such as (i) the capital reduction to clear U City’s deficit and (ii) a reverse-stock split at a ratio of 100:1. Both of these key transactions are expected to considerably boost U City’s attractiveness to future potential investors and be conducive to long-term shareholder value accretion. Furthermore, U City also expects to make further progress in divesting its non-core assets during the final quarter of 2018. With these transactions, U City is laying a solid foundation to power the turnaround of its businesses.
Yours faithfully,
Daniel Ross Chief Investment Officer
MEDIA
7%
MASS TRANSIT
90%
SERVICES
1%
PROPERTY
1%
SERVICES
1%
PROPERTY
2%
MEDIA
40%
MASS TRANSIT
59%
Our City Our Future 2
INVESTOR RELATIONS QUARTERLY REVIEW: ISSUE 34 BTS GROUP HOLDINGS PCL
2Q 2018/19 (For the quarter ended 30 Sep 2018)
(Ended June 2010)
BTS GROUP FINANCIAL SUMMARY (CONSOLIDATED)
INCOME STATEMENT FOR THE PERIOD ENDED (THB mn) 2Q 2018/19 2Q 2017/18* % YoY
Operating revenues 15,806 2,543 521.6%
Other recurring revenues 440 263 67.5%
Total recurring revenues 16,246 2,806 479.1%
Operating costs 13,981 1,247 1,020.9%
Operating selling and administrative expenses 617 612 0.8%
Operating EBITDA 1,401 875 60.2%
Finance cost 398 318 24.9%
Pre-tax recurring profit 1,249 627 99.1%
Non-recurring items (160) 283 (156.4)%
Earnings before tax 1,089 910 19.7%
Corporate income tax 254 169 50.7%
Minority interests 165 89 86.2%
Net recurring income (loss) to equity holders of the parent 830 370 124.4%
Net income (loss) to equity holders of the parent 670 653 2.7%
*includes performances from discontinued operation
STATEMENT OF FINANCIAL POSITION (THB mn) 30 SEP 18 31 MAR 18 % Change
Current assets 25,143 21,290 18.1%
Non-current assets 100,566 84,968 18.4%
Total assets 125,708 106,258 18.3%
Current liabilities 28,517 22,923 24.4%
Non-current liabilities 46,839 36,971 26.7%
Total liabilities 75,356 59,894 25.8%
Issued and fully paid capital 47,381 47,761 (0.8)%
Retained earnings (7,544) (5,868) 28.6%
Other items in shareholders’ equity 10,515 4,471 135.2%
Total shareholders' equity 50,352 46,364 8.6%
Total liabilities and shareholders' equity 125,708 106,258 18.3%
DEBT INFORMATION (THB mn) 30 SEP 18 31 MAR 18 % YoY
Gross interest bearing debt 58,072 47,169 23.1%
Adjusted net debt* 28,427 17,129 66.0%
*Adjusted Net Debt = Interest Bearing Debt – Cash and Cash Equivalent and Liquid Investment
CASH FLOW STATEMENT FOR 6 MONTHS (THB mn) 2Q 2018/19 2Q 2017/18 % YoY
Earnings Before Tax 1,696 1,449 17.0%
Less: Profit before tax from discontinued operation - 71 N.A.
Cash from (used in) operating activities (4,361) (2,758) 58.1%
Net Cash paid for interest expenses (452) (371) 21.8%
Net Cash paid for corporate income tax (526) (451) 16.6%
Net cash from (used in) operating activities (5,340)* (3,581) 49.1%
Net cash from (used in) investing activities (7,125)**
(7,571) (5.9)%
Net cash from (used in) financial activities 13,124 5,043 160.3%
Net increase (decrease) in cash and cash equivalents 656 (6,110) N.A.
Others (34) 40 N.A.
Cash and cash equivalents at beginning of the year 9,458 15,095 (37.3)%
Cash and cash equivalents at end of the year 10,080***
9,025 11.7%
* CFO: After 1. Corporate income tax of THB 526mn, 2. Interest expenses of THB 452mn, 3. Net investment for construction of the Pink and Yellow Lines of THB 2.6bn and
4. Net investment for E&M works and trains procurement for the Southern and Northern Green Line extensions of THB 2.3bn
** CFI: After net investment for construction of the Pink and Yellow Lines of THB 3.7bn
*** Excluding liquid investments of THB 19.6bn

Our City Our Future 3
INVESTOR RELATIONS QUARTERLY REVIEW: ISSUE 34 BTS GROUP HOLDINGS PCL
2Q 2018/19 (For the quarter ended 30 Sep 2018)
(Ended June 2010)
KEY FINANCIAL RATIOS
2Q 2018/19 HIGHLIGHTS
Total operating revenue increased significantly by 521.6% YoY to THB 15.8bn predominantly as a result of higher operating revenue
from the Mass Transit and Media businesses
Total Mass Transit revenue of THB 14.3bn, a significant increase of 981.2% YoY or THB 12.9bn, largely from the start of recognising
construction revenue for the Pink and Yellow lines, which contributed revenue of THB 11.8bn in this quarter
Revenue from the provision of Electrical and Mechanical (E&M) works and train procurement service for the Southern and
Northern Green Line extensions rose to THB 1.5bn, up 193.8% YoY
Mass Transit Operation & Maintenance (O&M) revenue increased 2.9% YoY to THB 452mn from the contractually agreed increase in
the operating fee of the existing green line extensions
2Q 2018/19 farebox revenue continued to grow at 2.1% YoY to THB 1,762mn, from an increase in average fare (rose 3.7% YoY to
THB 28.8 per trip)
Media business revenue of THB 1,205mn in 2Q 2018/19, increasing solidly by 24.2% or THB 235mn YoY, from the strong
performances of Outdoor Media and Office Media in Out-of-Home (OOH) Media business segments
Operating EBITDA of THB 1,401mn, an increase of THB 526mn or 60.2% YoY, largely as a result of the improvements in operating
performances of our Mass Transit and Media businesses
Recurring Net Profit (after MI) of THB 830mn, an increase of THB 460mn or 124.4% YoY, chiefly from an increase in recurring gross profit, higher interest and investment income, being partially offset by higher finance cost and corporate income tax
Reported Net Profit (after MI) of THB 670mn, an increase of THB 17mn or 2.7% YoY, from an increase in aforesaid recurring net profit, being partially offset by no repeat of the record of extraordinary gain from the restructuring of ChefMan business last year
SIGNIFICANT EVENTS
BTS GROUP 23 July 2018: The 2018 Annual General Meeting of Shareholders of BTS Group Holding Public Company Limited (BTSG or the Company)
approved the issuance of BTS-W4 warrants (BTS-W4) up to 1,755mn units at a ratio of 9:1 with exercise price of THB 10.50. In addition, the
Company paid a final dividend of approximately THB 2,191mn or THB 0.185 per share on 16 August 2018, bringing the total annual
dividend paid up to THB 4,145mn (or THB 0.35 per share), or equivalent to an annual dividend yield of 3.95%.
7 September 2018: The Company issued THB 9,500mn senior unsecured debentures to institutional investors and high net worth
investors. The debentures were issued in 3 tranches due in 2020, 2023, and 2028 with the coupon rate of 2.58%, 3.25% and 4.03%,
Profitability ratios 2Q 2018/19 2Q 2017/18* 1Q 2018/19
Gross operating profit margin (%) 11.5% 50.9% 48.2%
Operating EBITDA margin (%)A 8.9% 34.4% 37.0%
Recurring pre-tax profit margin (%)B 7.7% 22.4% 22.2%
Net profit margin (%)C 4.1% 21.0% 11.6%
ROA (%)D 4.4% 2.5% 4.6%
ROE (%)E 10.3% 4.7% 10.1%
Liquidity ratio
Current ratio (times) 0.88x 0.91x 0.95x
Leverage ratios
Interest bearing debt to equity (times) 1.15x 0.97x 1.02x
Adjusted net debtF to equity (times) 0.56x 0.30x 0.39x
Adjusted net debtF to recurring operating EBITDA (times) 4.38x 3.36x 3.23x
Interest coverage (times)G 3.52x 2.75x 3.58x
Per share ratiosH
Basic earnings per share (THB) 0.06 0.06 0.03
Book value per share (THB) 4.25 3.88 4.10
NOTE:
*Includes performance from discontinued
operation
A Excludes non-operating items and interest
income
B Calculated based on pre-tax recurring profit
/ total recurring revenue
C Calculated based on accounting net profit
(after MI) / total accounting revenue including
shares of income / (loss) from investments in
associates and JVs and gross revenue under
profit from discontinued operation for the
period
D Calculated based on accounting net profit /
total average assets
E Calculated based on accounting net profit /
total average shareholders’ equity
F Calculated from interest bearing debt – cash
and cash equivalent and liquid investment –
Cash to be received from clearing house-share
subscription of subsidiary
G Calculated based on operating EBITDA /
finance cost
H Calculated based on weighted average
number of shares at par value of THB 4.0
Our City Our Future 4
INVESTOR RELATIONS QUARTERLY REVIEW: ISSUE 34 BTS GROUP HOLDINGS PCL
2Q 2018/19 (For the quarter ended 30 Sep 2018)
(Ended June 2010)
respectively (the average coupon rate of 3.38%). The proceeds will mainly be used for repayment of existing debt and/or investment
and/or financing the working capital of the Company. This debenture was rated “A / Stable” by TRIS on 31 August 2018.
13 September 2018: The Company has been officially selected by the Dow Jones Sustainability Indices (DJSI) Emerging Markets 2018 as the
first Thai company in the Transportation category. The indices are categorised by industries with an assessment criteria focusing on
economic, social and environmental performance, as well as an analysis of financial performance. Investment funds worldwide recognise
and have adopted the DJSI accreditation for consideration when investing in companies and firms.
7 November 2018: The Executive Committee approved BTS-W4 issuance date as 30 November 2018. The term of BTS-W4 is one year from
the issuance date which will be expired on 29 November 2019. The warrant holders can exercise their first rights of the BTS-W4 on the last
business day of the first quarter from the issuance date. The exercise ratio is 1:1 at the price of THB 10.50 per share.
MASS TRANSIT 31 July 2018: Bangkok Mass Transit System Public Company Limited (BTSC) and Krungthep Thanakom Company Limited (KT) entered into a
30-year O&M Services Agreement of the Gold Line Project Phase 1 (Krung Thonburi BTS Station – Khlong San District Office, 1.7km and 3
stations) for a total O&M value of approximately THB 13,520mn (inclusive of VAT). Moreover, in order to maintain continuity of service for
passengers and high standard of E&M works, BTSC has entered into a Sale and Installation of E&M Works Agreement on 27 February 2018,
with a total value of approximately THB 765.59mn (inclusive of VAT). The commercial operation date for Gold Line Phase 1 is targeted by
September 2020.
5 August 2018: The first in a series of 22 4-carriage trains from Siemens was successfully delivered. At least 6 of the 4-carriage trains are
expected to be delivered and ready for operation by early December in order to accommodate the increase in passengers on the existing
Green Line network, as well as in the Southern Green Line extension, where full operation is targeted to begin in December 2018.
12 November 2018: BSR Joint Venture, a Joint Venture between the Company, Sino-Thai Engineering & Construction PCL (STEC), and
Ratchaburi Electricity Generating Holding PCL (RATCH), submitted its bid for the High Speed Rail Project (Don Muang - Suvarnabhumi - U-
Ta Pao; 220km, 15 stations) to the State Railway of Thailand. The Company has entered into a joint venture agreement with STEC and
RATCH to jointly invest and hold 60%, 20% and 20% in BSR for the High Speed Rail Project, respectively. The winning bidders are expected
to be announced by early 2019.
MEDIA 5 July 2018: The 2018 Annual General Meeting of Shareholders of VGI Global Media Public Company Limited (VGI) approved (i) the
acquisition of 276,000 ordinary shares or 23% of total shares in Kerry Express (Thailand) for a total purchase price of THB 5.9bn, as well as
(ii) the issuance and offering of 121,578,525 VGI’s newly issued ordinary shares with a par value of THB 0.10, to the Sellers at the offering
price of THB 7.28 per share, totaling THB 885.1mn. Kerry Express is the leading domestic express delivery services in Thailand with more
than 800,000 parcels delivered a day. Completion took place in July 2018.
18 July 2018: The Extraordinary General Meeting of Shareholders of Master Ad Company Limited (MACO) approved the acquisition of 75% in
VGI Global Media (Malaysia) Sdn Bhd (VGM) with a total investment value of THB 360mn. VGM will be the flagbearer in expanding OOH media business overseas as it invests in advertising-related companies in various potential areas such as, airport, office building and mass
transit media.
July 2018: MACO via its subsidiary, Eye On Ads, successfully acquired 81.65% of Trans.Ad Solutions Company Limited (Trans.Ad), a multimedia
display systems provider, with a total investment value of THB 388mn. Subsequently, Trans.Ad used the funds received from Eye On Ads to
further invest in 89% of Roctec Technology Limited (Roctec). Roctec is a provider of multimedia & communications systems, system
integrations and total network infrastructure based in Hong Kong. MACO expects to expand its digital network domestically and
internationally.
1 August 2018: VGI completed its exercise of VGI’s warrant number 1 (VGI-W1). VGI received total proceeds of THB 8.6bn, or 72% of
maximum proceeds. Of this, BTSG and BTSC exercised its rights totaling THB 5.4bn. The cash received by VGI was utilised for the acquisition of
Kerry Express, used for the subscription of shares in the announced rights offering of MACO and expansion of other digital and online-related
businesses.
30 October 2018: Rabbit LinePay Company Limited (RLP) and BTSC announced the soft launch of “Bind, Tap & Ride” service across 20 BTS
stations allowing more than 700,000 BTS users to bind their existing rabbit card with Rabbit LinePay into a single e-wallet. This represents a
major milestone in driving the public towards a cashless society and creating the smoothest experience for BTS daily users as well as
promoting a queue-free experience on the BTS system.
Our City Our Future 5
INVESTOR RELATIONS QUARTERLY REVIEW: ISSUE 34 BTS GROUP HOLDINGS PCL
2Q 2018/19 (For the quarter ended 30 Sep 2018)
(Ended June 2010)
PROPERTY 12 October 2018: The Extraordinary Shareholders’ Meeting of U City Public Company Limited (U City) approved a series of transactions,
including (i) a reverse stock split of ordinary and preferred shares at a ratio of 100:1, which is expected to facilitate the stock’s long-term
trading liquidity, (ii) a minor capital increase through a private placement, for the purpose of facilitating the reverse stock split via a rounding
of fractional shares and (iii) a capital reduction for the purpose of reducing the deficit in the separate financial statements of U City. Both of
these key transactions are expected to considerably boost U City’s attractiveness to future potential investors and be conducive to long-term
shareholder value accretion.
1H 2018/19 P&L SNAPSHOT
Total consolidated revenue of 1H 2018/19 stood at THB 19,362mn, grew significantly by 219.3% YoY or THB 13,297mn. The substantial
development of revenue was mainly attributed to (i) an increase in revenue from installation and construction services and train
procurement service of THB 12.9bn, largely from the start of revenue recognition of the construction of Pink and Yellow lines, which
contributed revenue of THB 11.8bn and (ii) an increase in interest income of THB 303mn, together with (iii) higher service income of THB
282mn or 9.6% YoY from healthy growth in our Media business. As a result of the aforementioned major revenue contributors, group
operating EBITDA in 1H 2018/19 surged by THB 738mn or 41.2% YoY to THB 2,529mn. The Group recorded net profit (before MI) of THB
1,330mn, increasing by THB 151mn or 12.8% YoY. Net profit growth was mainly attributable to improvements in Mass Transit and Media
business performance in particular, as well as the increase in interest income, being partially offset by higher finance cost and no recognition
of a gain on sales and change in status of investment of THB 251mn from the restructuring of ChefMan business, which was recorded in 1H
2017/18.
2Q 2018/19 PERFORMANCE
The Group reported total consolidated revenues from continued operation of THB 16,213mn in 2Q 2018/19. This represented an increase of
461.0% YoY or THB 13,323mn from THB 2,890mn in 2Q 2017/18. The revenue growth was chiefly attributed to (i) an increase in revenue from
installation and construction services and train procurement service of THB 13,132mn mainly from the inception of construction revenue
recognition for the Pink and Yellow lines, (ii) growth in interest income of THB 169mn, chiefly from (a) receivables under an agreement with
the government for the provision of E&M works and train procurement services for the Southern and Northern Green Line extensions and (b)
receivables related to the Pink and Yellow lines. The revenue growth was partly offset by a decline in extraordinary gain from the
restructuring of the ChefMan business, totaling THB 251mn (which was recorded in 2Q 2017/18).
Total consolidated expenses from continued operation amounted to THB 14,835mn in 2Q 2018/19, an increase of THB 13,075mn or 742.9%
YoY largely from (i) recognition of construction cost for the Pink and Yellow lines, (ii) an increase in cost of E&M installation and train
procurement service for the aforementioned Southern and Northern green line extensions and (iii) higher selling and administrative expenses
of THB 333mn, chiefly from (a) SG&A expenses related to the ongoing expansion of our Media business and (b) booking of the remaining
World Cup TV rights for Thailand co-sponsorship expense of THB 100mn this quarter.
Reported share of net profit from associates/JVs (including share of profit in BTSGIF) was THB 109mn (compared to share of net loss of THB
108mn in 2Q 2017/18). The YoY increase of THB 217mn was mainly from narrowed share of net loss from U City and the recognition of a
share of net profit from Kerry Express since August 2018. Finance costs increased by 25.1% YoY or THB 80mn to THB 398mn, primarily from
interest expense of (i) THB 7bn BTSG debentures issued by BTSG in December 2017 and (ii) THB 9.5bn BTSG debentures issued by BTSG on 7
September 2018.
As a result, recurring net profit (after minority interests of THB 165mn) stood at THB 830mn, an increase of 124.4% YoY or THB 460mn
chiefly from an increase in recurring gross profit, an increase in interest and investment income, being partially offset by higher finance cost
and corporate income tax. Similarly to the growth in recurring net profit, profit attributable to the equity holders of the Company increased
by 2.7% YoY or THB 17mn to THB 670mn, predominantly from an increase in recurring net profit, being partially offset by no repeat of
recognition of an extraordinary gain from the restructuring of ChefMan business. The net profit margin attributable to the equity holders of
the Company in 2Q 2018/19 was 4.1% (versus 21.0% in 2Q 2017/18). The decrease in net profit margin was mainly from the recognition of
construction revenue for the aforesaid Pink and Yellow lines and services income for the provision of E&M works and train procurement
which have lower margins.

Our City Our Future 6
INVESTOR RELATIONS QUARTERLY REVIEW: ISSUE 34 BTS GROUP HOLDINGS PCL
2Q 2018/19 (For the quarter ended 30 Sep 2018)
(Ended June 2010)
OPERATING REVENUE AND OPERATING GROSS PROFIT MARGIN BY BU
Operating Revenue
1
(THB mn)
2Q 2018/19
% of Total1
2Q 2017/18
% of Total1
% Change (YoY)
2Q 2018/19 GP Margin
6
2Q 2017/18 GP Margin
6
Mass Transit 14,2552 90.2% 1,318 51.9% 981.2% 7.6% 43.8%
Media3 1,205 7.6% 970 38.1% 24.2% 62.1% 68.1%
Property 874 0.6% 159 6.3% (45.2)% 16.3% 32.2%
Services5 258 1.6% 95 3.7% 172.0% N.A. 6.3%
Total1 15,806 100.0% 2,543 100.0% 521.6% 11.5% 50.9%
1 Operating revenue from the operational performance of 4 BUs EXCLUDES non-mass transit related interest income, dividend income and non-recurring items 2
2Q 2018/19 Mass Transit revenue includes:
i) Share of net profit (loss) from BTSGIF (included in ‘Share of profit (loss) from investments in associates’ in statement of comprehensive income) ii) Service Income from Train & Bus Operation Management (included in ‘Service income’ under ‘Revenues from provision of operating services’) and Interest Income from Train Procurement as well as
Interest Income under purchase and installation of operating system agreement iii) Services Income from the provision of E&M works and the train procurement service for the Southern and Northern Green Line extensions iv) Construction revenue and the interest income related to the Pink and Yellow lines
3 Media revenue includes performances of VGI Group and Rabbit Group. Rabbit group (classified to be under Digital Services Business) comprises of BSS & BSSH and subsidiaries but excludes two companies which are Bangkok Payment Solutions Co., Ltd. (BPS) and Rabbit Rewards Co., Ltd. (RR) 4 2Q 2018/19 Property includes Sales from Real Estate, Rental and Service Income, Revenue from Thana City Golf & Sports Club
5 Services revenue includes revenue from Rabbit Rewards, BPS, HHT construction and ChefMan Restaurants (up to 3 August 2017). 6 Operating gross profit calculated based on the operational performance of 4 BUs
7 Operating EBITDA calculated based on the operational performance of 4 BUs EXCLUDES non-mass transit related interest income, dividend income, share of net profit (loss) from other associates (except from BTSGIF) and joint ventures and other non-recurring items
(THB mn) 2Q 2018/19 2Q 2017/18* % YoY
Operating revenues 15,806 2,543 521.6%
Other recurring revenues 440 263 67.5%
Total recurring revenues 16,246 2,806 479.1%
Operating costs 13,981 1,247 1,020.9%
Operating selling and administrative expenses 617 612 0.8%
Operating EBITDA 1,401 875 60.2%
Finance cost 398 318 24.9%
Pre-tax recurring profit 1,249 627 99.1%
Non-recurring items (160) 283 (156.4)%
Earnings before tax 1,089 910 19.7%
Corporate income tax 254 169 50.7%
Minority interests 165 89 86.2%
Recurring net income (loss) to equity holders of the parent 830 370 124.4%
Net income (loss) to equity holders of the parent 670 653 2.7% *includes performances from discontinued operation
Total operating revenue1 in 2Q 2018/19 reached THB 15,806mn, a significant increase of 521.6% YoY or THB 13,263mn. Revenues from the
Mass Transit, Media, Property and Services businesses accounted for 90.2%, 7.6%, 0.6% and 1.6% of total operating revenue, respectively.
The sharp rise in operating revenue was largely as a result of higher Mass Transit, Media and Services operating revenues, which increased by
981.2%, 24.2% and 172.0% YoY respectively. The growth was chiefly from (i) the aforesaid recognition of construction revenue for the Pink
and Yellow lines as well as (ii) an increase in the recognition of E&M revenue and the train procurement services revenue for the Southern
and Northern Green Line extensions. Nevertheless, the increase in operating revenue was partially offset by a decrease of 45.2% or THB 72mn
YoY in Property operating revenue primarily from the deconsolidation of Unicorn Enterprise Company Limited (UE), following the entire
business transfer (EBT of UE) to U City in 4Q 2017/18.
Operating costs were THB 13,981mn, increasing by 1,020.9% or THB 12,734mn YoY, primarily from construction costs for the Pink and Yellow
lines, as well as higher cost recognition for the provision of E&M works and train procurement services for the aforesaid Southern and
Northern Green Line extensions. Operating gross profit6 grew 40.8% YoY to THB 1,824mn and operating EBITDA
7 rose by THB 526mn or
60.2% YoY to THB 1,401mn. As construction revenue for the aforesaid Pink and Yellow lines and services income for the provision of E&M
works and train procurement have lower margins, operating gross profit margin declined to 11.5% from 50.9% in the prior year and operating
EBITDA margin decreased to 8.9% in 2Q 2018/19 from 34.4% in 2Q 2017/18.
Our City Our Future 7
INVESTOR RELATIONS QUARTERLY REVIEW: ISSUE 34 BTS GROUP HOLDINGS PCL
2Q 2018/19 (For the quarter ended 30 Sep 2018)
(Ended June 2010)
SEGMENTAL PERFORMANCE
MASS TRANSIT BUSINESS
Total Mass Transit revenue was THB 14,255mn, a significant growth of 981.2% YoY or THB 12,937mn, primarily due to (i) the recognition of
construction revenue for the Pink and Yellow Lines, (ii) higher services revenue for the provision of E&M works and the train procurement
service for the Southern and Northern Green Line extensions, (iii) higher interest income related to Green Line extensions and the Pink and
Yellow Lines and (iv) higher O&M revenue from green line extensions.
In 2Q 2018/19, the Company began to recognise construction revenue for the Pink and Yellow Lines of THB 11.8bn and continued to
recognise services revenue from the provision of E&M works and the train procurement service of THB 1.5bn (increased from THB 0.5bn in
the prior year) for the aforesaid Southern and Northern Green Line extensions, both according to progress of work completion.
Interest income related to Green Line extensions, Pink and Yellow Lines also rose from the previous year (up 196.5% YoY or THB 160mn) to
THB 242mn, chiefly as a result of the aforementioned provision of services for the Southern and Northern Green Line extensions as well as
interest income from receivable related to the aforesaid Pink and Yellow Lines.
O&M Revenue (excluding interest income related to Green Line extensions, Pink and Yellow Lines) rose by 2.9% YoY or THB 13mn to THB
452mn. The increase was mainly attributable to the contractually agreed increase in the operating fee of the existing Green Line extensions.
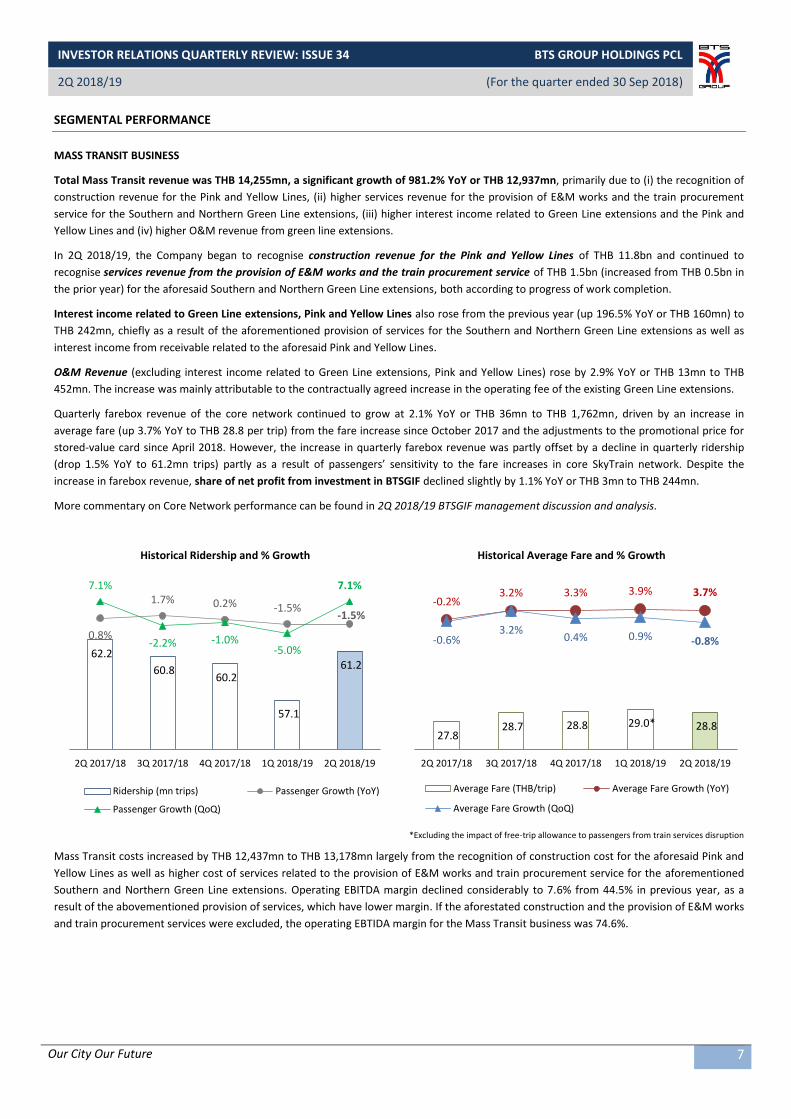
Quarterly farebox revenue of the core network continued to grow at 2.1% YoY or THB 36mn to THB 1,762mn, driven by an increase in
average fare (up 3.7% YoY to THB 28.8 per trip) from the fare increase since October 2017 and the adjustments to the promotional price for
stored-value card since April 2018. However, the increase in quarterly farebox revenue was partly offset by a decline in quarterly ridership
(drop 1.5% YoY to 61.2mn trips) partly as a result of passengers’ sensitivity to the fare increases in core SkyTrain network. Despite the
increase in farebox revenue, share of net profit from investment in BTSGIF declined slightly by 1.1% YoY or THB 3mn to THB 244mn.
More commentary on Core Network performance can be found in 2Q 2018/19 BTSGIF management discussion and analysis.
Historical Ridership and % Growth Historical Average Fare and % Growth
*Excluding the impact of free-trip allowance to passengers from train services disruption
Mass Transit costs increased by THB 12,437mn to THB 13,178mn largely from the recognition of construction cost for the aforesaid Pink and
Yellow Lines as well as higher cost of services related to the provision of E&M works and train procurement service for the aforementioned
Southern and Northern Green Line extensions. Operating EBITDA margin declined considerably to 7.6% from 44.5% in previous year, as a
result of the abovementioned provision of services, which have lower margin. If the aforestated construction and the provision of E&M works
and train procurement services were excluded, the operating EBTIDA margin for the Mass Transit business was 74.6%.
62.2
60.8 60.2
57.1
61.2
0.8%
1.7% 0.2% -1.5% -1.5%
7.1%
-2.2% -1.0% -5.0%
7.1%
-50.0%
0.0 %
53.0
58.0
63.0
2Q 2017/18 3Q 2017/18 4Q 2017/18 1Q 2018/19 2Q 2018/19
Ridership (mn trips) Passenger Growth (YoY)
Passenger Growth (QoQ)
27.8 28.7 28.8 29.0* 28.8
-0.2% 3.2% 3.3% 3.9% 3.7%
-0.6% 3.2%
0.4% 0.9% -0.8%
25.0
30.0
35.0
40.0
2Q 2017/18 3Q 2017/18 4Q 2017/18 1Q 2018/19 2Q 2018/19
Average Fare (THB/trip) Average Fare Growth (YoY)
Average Fare Growth (QoQ)
Our City Our Future 8
INVESTOR RELATIONS QUARTERLY REVIEW: ISSUE 34 BTS GROUP HOLDINGS PCL
2Q 2018/19 (For the quarter ended 30 Sep 2018)
(Ended June 2010)
MEDIA BUSINESS
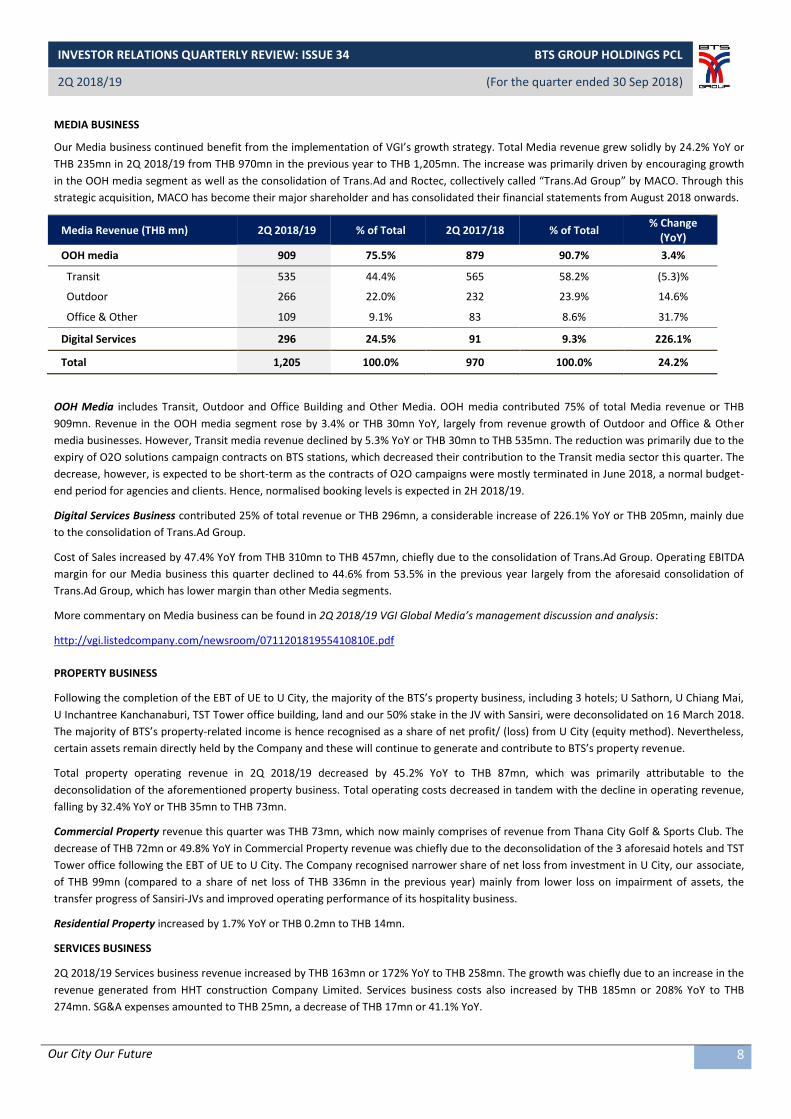
Our Media business continued benefit from the implementation of VGI’s growth strategy. Total Media revenue grew solidly by 24.2% YoY or
THB 235mn in 2Q 2018/19 from THB 970mn in the previous year to THB 1,205mn. The increase was primarily driven by encouraging growth
in the OOH media segment as well as the consolidation of Trans.Ad and Roctec, collectively called “Trans.Ad Group” by MACO. Through this
strategic acquisition, MACO has become their major shareholder and has consolidated their financial statements from August 2018 onwards.
Media Revenue (THB mn) 2Q 2018/19 % of Total 2Q 2017/18 % of Total % Change
(YoY)
OOH media 909 75.5% 879 90.7% 3.4%
Transit 535 44.4% 565 58.2% (5.3)%
Outdoor 266 22.0% 232 23.9% 14.6%
Office & Other 109 9.1% 83 8.6% 31.7%
Digital Services 296 24.5% 91 9.3% 226.1%
Total 1,205 100.0% 970 100.0% 24.2%
OOH Media includes Transit, Outdoor and Office Building and Other Media. OOH media contributed 75% of total Media revenue or THB
909mn. Revenue in the OOH media segment rose by 3.4% or THB 30mn YoY, largely from revenue growth of Outdoor and Office & Other
media businesses. However, Transit media revenue declined by 5.3% YoY or THB 30mn to THB 535mn. The reduction was primarily due to the
expiry of O2O solutions campaign contracts on BTS stations, which decreased their contribution to the Transit media sector this quarter. The
decrease, however, is expected to be short-term as the contracts of O2O campaigns were mostly terminated in June 2018, a normal budget-
end period for agencies and clients. Hence, normalised booking levels is expected in 2H 2018/19.
Digital Services Business contributed 25% of total revenue or THB 296mn, a considerable increase of 226.1% YoY or THB 205mn, mainly due
to the consolidation of Trans.Ad Group.
Cost of Sales increased by 47.4% YoY from THB 310mn to THB 457mn, chiefly due to the consolidation of Trans.Ad Group. Operating EBITDA
margin for our Media business this quarter declined to 44.6% from 53.5% in the previous year largely from the aforesaid consolidation of
Trans.Ad Group, which has lower margin than other Media segments.
More commentary on Media business can be found in 2Q 2018/19 VGI Global Media’s management discussion and analysis:
http://vgi.listedcompany.com/newsroom/071120181955410810E.pdf
PROPERTY BUSINESS
Following the completion of the EBT of UE to U City, the majority of the BTS’s property business, including 3 hotels; U Sathorn, U Chiang Mai,
U Inchantree Kanchanaburi, TST Tower office building, land and our 50% stake in the JV with Sansiri, were deconsolidated on 16 March 2018.
The majority of BTS’s property-related income is hence recognised as a share of net profit/ (loss) from U City (equity method). Nevertheless,
certain assets remain directly held by the Company and these will continue to generate and contribute to BTS’s property revenue.
Total property operating revenue in 2Q 2018/19 decreased by 45.2% YoY to THB 87mn, which was primarily attributable to the
deconsolidation of the aforementioned property business. Total operating costs decreased in tandem with the decline in operating revenue,
falling by 32.4% YoY or THB 35mn to THB 73mn.
Commercial Property revenue this quarter was THB 73mn, which now mainly comprises of revenue from Thana City Golf & Sports Club. The
decrease of THB 72mn or 49.8% YoY in Commercial Property revenue was chiefly due to the deconsolidation of the 3 aforesaid hotels and TST
Tower office following the EBT of UE to U City. The Company recognised narrower share of net loss from investment in U City, our associate,
of THB 99mn (compared to a share of net loss of THB 336mn in the previous year) mainly from lower loss on impairment of assets, the
transfer progress of Sansiri-JVs and improved operating performance of its hospitality business.
Residential Property increased by 1.7% YoY or THB 0.2mn to THB 14mn.
SERVICES BUSINESS
2Q 2018/19 Services business revenue increased by THB 163mn or 172% YoY to THB 258mn. The growth was chiefly due to an increase in the
revenue generated from HHT construction Company Limited. Services business costs also increased by THB 185mn or 208% YoY to THB
274mn. SG&A expenses amounted to THB 25mn, a decrease of THB 17mn or 41.1% YoY.
Our City Our Future 9
INVESTOR RELATIONS QUARTERLY REVIEW: ISSUE 34 BTS GROUP HOLDINGS PCL
2Q 2018/19 (For the quarter ended 30 Sep 2018)
(Ended June 2010)
FINANCIAL POSITION \
(THB mn)
(THB mn)
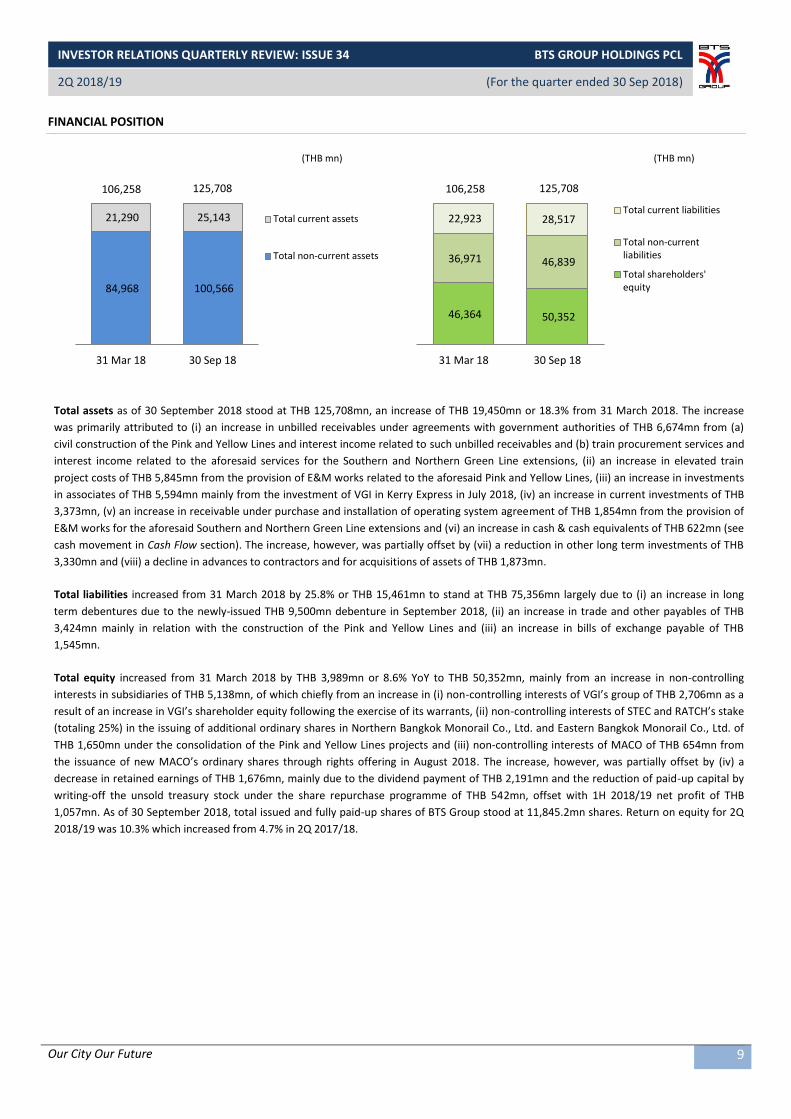
Total assets as of 30 September 2018 stood at THB 125,708mn, an increase of THB 19,450mn or 18.3% from 31 March 2018. The increase
was primarily attributed to (i) an increase in unbilled receivables under agreements with government authorities of THB 6,674mn from (a)
civil construction of the Pink and Yellow Lines and interest income related to such unbilled receivables and (b) train procurement services and
interest income related to the aforesaid services for the Southern and Northern Green Line extensions, (ii) an increase in elevated train
project costs of THB 5,845mn from the provision of E&M works related to the aforesaid Pink and Yellow Lines, (iii) an increase in investments
in associates of THB 5,594mn mainly from the investment of VGI in Kerry Express in July 2018, (iv) an increase in current investments of THB
3,373mn, (v) an increase in receivable under purchase and installation of operating system agreement of THB 1,854mn from the provision of
E&M works for the aforesaid Southern and Northern Green Line extensions and (vi) an increase in cash & cash equivalents of THB 622mn (see
cash movement in Cash Flow section). The increase, however, was partially offset by (vii) a reduction in other long term investments of THB
3,330mn and (viii) a decline in advances to contractors and for acquisitions of assets of THB 1,873mn.
Total liabilities increased from 31 March 2018 by 25.8% or THB 15,461mn to stand at THB 75,356mn largely due to (i) an increase in long
term debentures due to the newly-issued THB 9,500mn debenture in September 2018, (ii) an increase in trade and other payables of THB
3,424mn mainly in relation with the construction of the Pink and Yellow Lines and (iii) an increase in bills of exchange payable of THB
1,545mn.
Total equity increased from 31 March 2018 by THB 3,989mn or 8.6% YoY to THB 50,352mn, mainly from an increase in non-controlling
interests in subsidiaries of THB 5,138mn, of which chiefly from an increase in (i) non-controlling interests of VGI’s group of THB 2,706mn as a
result of an increase in VGI’s shareholder equity following the exercise of its warrants, (ii) non-controlling interests of STEC and RATCH’s stake
(totaling 25%) in the issuing of additional ordinary shares in Northern Bangkok Monorail Co., Ltd. and Eastern Bangkok Monorail Co., Ltd. of
THB 1,650mn under the consolidation of the Pink and Yellow Lines projects and (iii) non-controlling interests of MACO of THB 654mn from
the issuance of new MACO’s ordinary shares through rights offering in August 2018. The increase, however, was partially offset by (iv) a
decrease in retained earnings of THB 1,676mn, mainly due to the dividend payment of THB 2,191mn and the reduction of paid-up capital by
writing-off the unsold treasury stock under the share repurchase programme of THB 542mn, offset with 1H 2018/19 net profit of THB
1,057mn. As of 30 September 2018, total issued and fully paid-up shares of BTS Group stood at 11,845.2mn shares. Return on equity for 2Q
2018/19 was 10.3% which increased from 4.7% in 2Q 2017/18.
84,968 100,566
21,290 25,143
31 Mar 18 30 Sep 18
Total current assets
Total non-current assets
125,708 106,258
46,364 50,352
36,971 46,839
22,923 28,517
31 Mar 18 30 Sep 18
Total current liabilities
Total non-currentliabilities
Total shareholders'equity
125,708 106,258

Our City Our Future 10
INVESTOR RELATIONS QUARTERLY REVIEW: ISSUE 34 BTS GROUP HOLDINGS PCL
2Q 2018/19 (For the quarter ended 30 Sep 2018)
(Ended June 2010)
CASH FLOW
For 6-month ended 30 September 2018, cash and cash equivalents stood at THB 10,080mn, an increase of 6.6% or THB 622mn. Cash used in
operating activities was THB 4,362mn (versus cash used in operating activities of THB 2,758mn in 1H 2017/18). This was derived from profit
before tax of THB 1,696mn, being partially offset by (i) non-cash reconciling items of THB 526mn and (ii) changes in net working capital of THB
5,532mn, chiefly from (a) net investment for construction of the Pink and Yellow Lines of THB 2.6bn and (b) net investment for E&M works
and trains procurement for the Southern and Northern Green Line extensions of THB 2.3bn. After deducting net cash paid for corporate
income tax of THB 526mn (1H 2017/18: THB 451mn) and net cash paid for interest expenses of THB 452mn (1H 2017/18: THB 371mn), net
cash used in operating activities was THB 5,340mn.
Net cash used in investing activities was THB 7,125mn. The key components were (i) cash paid for purchases of investments in Kerry Express
of THB 5.0bn, (ii) net investment for construction of the Pink and Yellow Lines of THB 3.7bn, partially offset with (iii) net cash received from
sales of treasury investment of THB 1.0bn and (iv) dividend received of THB 845mn and (v) interest income of THB 511mn.
Net cash from financing activities was THB 13,124mn. The key components were (i) an increase in long-term debentures of THB 9,500mn
from BTSG newly issued debenture in September 2018, (ii) net cash received from non-controlling interests from the exercise of VGI warrants
of THB 3,173mn, (iii) cash received from non-controlling interests for issuances of ordinary shares of subsidiaries of THB 2,359mn following
(a) the consolidation of Northern Bangkok Monorail Co., Ltd. and Eastern Bangkok Monorail Co., Ltd., totaling THB 1,650mn and (b) the
issuance of new MACO’s ordinary shares through rights offering in August 2018 of THB 709mn, (iv) a net increase of bills of exchange of THB
1,412mn, partially offset with (v) dividend payment of THB 2,185mn in August 2018.
6 months Cash Flow Snapshot
* CFO: After
1. Corporate income tax of THB 526mn
2. Interest expenses of THB 452mn
3. Net investment for construction of the Pink and Yellow Lines of THB 2.6bn
4. Net investment for E&M works and trains procurement for the Southern and Northern Green Line extensions of THB 2.3bn
** CFI: After net investment for construction of the Pink and Yellow Lines of THB 3.7bn
*** Excluding liquid investments of THB 19.6bn
9,458 (5,340)*
(7,125)**
13,124 10,080***
(37)
Beginning cash(31/3/18)
CFO CFI CFF Others Ending cash(30/9/18)
(THB mn)
Our City Our Future 11
INVESTOR RELATIONS QUARTERLY REVIEW: ISSUE 34 BTS GROUP HOLDINGS PCL
2Q 2018/19 (For the quarter ended 30 Sep 2018)
(Ended June 2010)
BTS GROUP IN THE COMMUNITY
BTS Group is committed to improving the lives of people, through its vision of being a leading provider of mass transit services. The Group has also initiated
many special Corporate Social Responsibility (CSR) projects in both Bangkok and other provinces of Thailand. Our CSR activities cover a broad spectrum of social
concerns including religion, education, sport and public health and we encourage staff involvement in all these efforts.
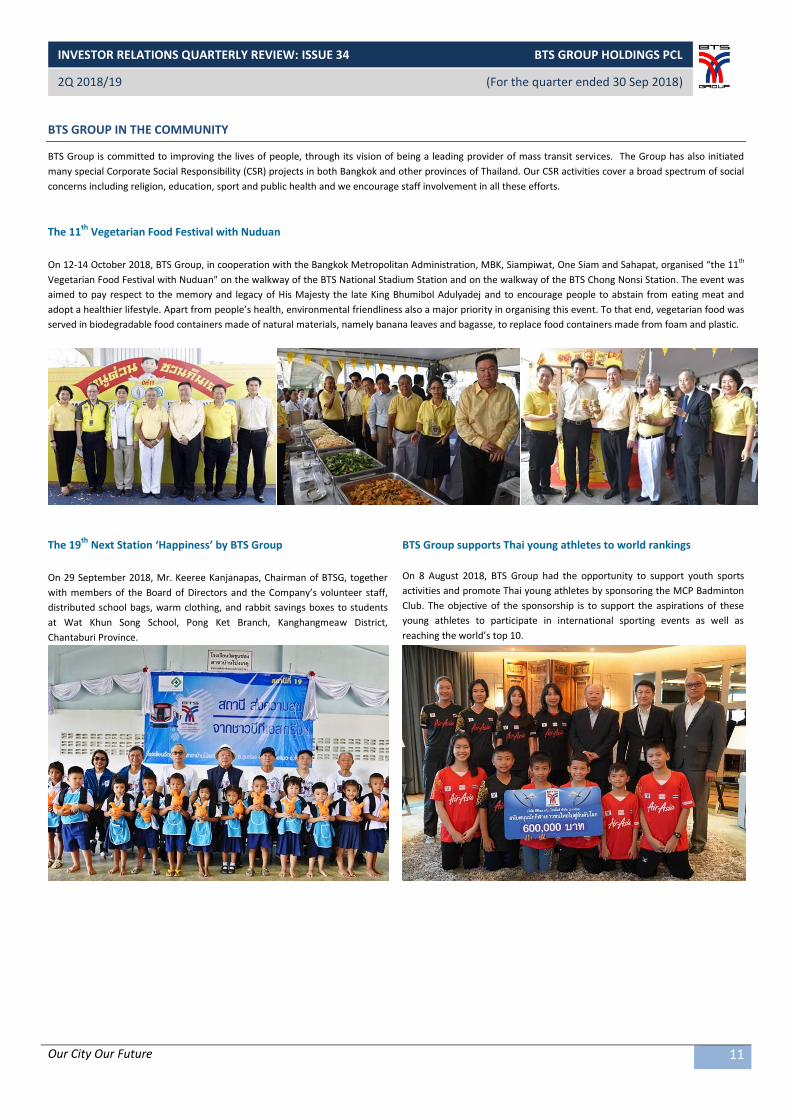
The 11th
Vegetarian Food Festival with Nuduan
On 12-14 October 2018, BTS Group, in cooperation with the Bangkok Metropolitan Administration, MBK, Siampiwat, One Siam and Sahapat, organised “the 11th
Vegetarian Food Festival with Nuduan" on the walkway of the BTS National Stadium Station and on the walkway of the BTS Chong Nonsi Station. The event was
aimed to pay respect to the memory and legacy of His Majesty the late King Bhumibol Adulyadej and to encourage people to abstain from eating meat and
adopt a healthier lifestyle. Apart from people’s health, environmental friendliness also a major priority in organising this event. To that end, vegetarian food was
served in biodegradable food containers made of natural materials, namely banana leaves and bagasse, to replace food containers made from foam and plastic.
The 19th
Next Station ‘Happiness’ by BTS Group
On 29 September 2018, Mr. Keeree Kanjanapas, Chairman of BTSG, together
with members of the Board of Directors and the Company’s volunteer staff,
distributed school bags, warm clothing, and rabbit savings boxes to students
at Wat Khun Song School, Pong Ket Branch, Kanghangmeaw District,
Chantaburi Province.
BTS Group supports Thai young athletes to world rankings
On 8 August 2018, BTS Group had the opportunity to support youth sports
activities and promote Thai young athletes by sponsoring the MCP Badminton
Club. The objective of the sponsorship is to support the aspirations of these
young athletes to participate in international sporting events as well as
reaching the world’s top 10.
Our City Our Future 12
INVESTOR RELATIONS QUARTERLY REVIEW: ISSUE 34 BTS GROUP HOLDINGS PCL
2Q 2018/19 (For the quarter ended 30 Sep 2018)
(Ended June 2010)
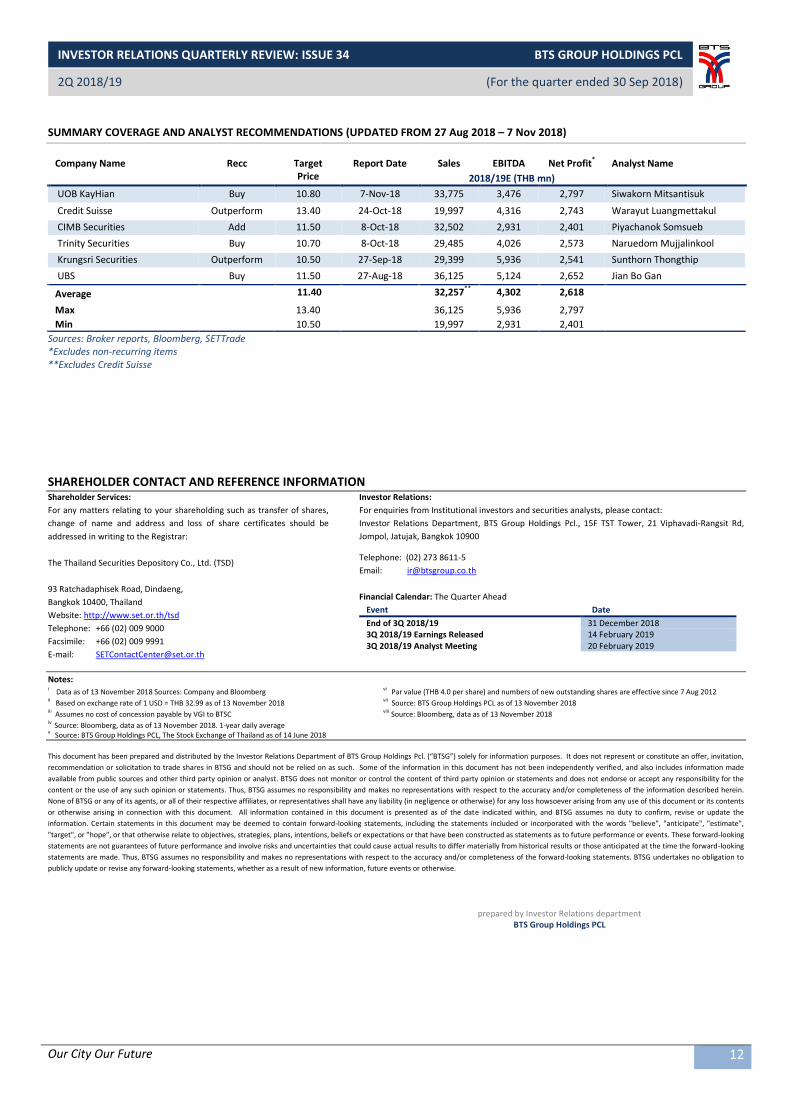
SUMMARY COVERAGE AND ANALYST RECOMMENDATIONS (UPDATED FROM 27 Aug 2018 – 7 Nov 2018)
Company Name Recc Target Price
Report Date Sales EBITDA Net Profit* Analyst Name
2018/19E (THB mn)
UOB KayHian Buy 10.80 7-Nov-18 33,775 3,476 2,797 Siwakorn Mitsantisuk
Credit Suisse Outperform 13.40 24-Oct-18 19,997 4,316 2,743 Warayut Luangmettakul
CIMB Securities Add 11.50 8-Oct-18 32,502 2,931 2,401 Piyachanok Somsueb
Trinity Securities Buy 10.70 8-Oct-18 29,485 4,026 2,573 Naruedom Mujjalinkool
Krungsri Securities Outperform 10.50 27-Sep-18 29,399 5,936 2,541 Sunthorn Thongthip
UBS Buy 11.50 27-Aug-18 36,125 5,124 2,652 Jian Bo Gan
Average
11.40
32,257** 4,302 2,618
Max 13.40 36,125 5,936 2,797
Min 10.50 19,997 2,931 2,401
Sources: Broker reports, Bloomberg, SETTrade *Excludes non-recurring items **Excludes Credit Suisse
SHAREHOLDER CONTACT AND REFERENCE INFORMATION Shareholder Services:
For any matters relating to your shareholding such as transfer of shares,
change of name and address and loss of share certificates should be
addressed in writing to the Registrar:
The Thailand Securities Depository Co., Ltd. (TSD)
93 Ratchadaphisek Road, Dindaeng,
Bangkok 10400, Thailand
Website: http://www.set.or.th/tsd
Telephone: +66 (02) 009 9000
Facsimile: +66 (02) 009 9991
E-mail: [email protected]
Investor Relations:
For enquiries from Institutional investors and securities analysts, please contact:
Investor Relations Department, BTS Group Holdings Pcl., 15F TST Tower, 21 Viphavadi-Rangsit Rd,
Jompol, Jatujak, Bangkok 10900
Telephone: (02) 273 8611-5
Email: [email protected]
Financial Calendar: The Quarter Ahead
Event Date
End of 3Q 2018/19 31 December 2018 3Q 2018/19 Earnings Released 14 February 2019 3Q 2018/19 Analyst Meeting 20 February 2019
Notes: i Data as of 13 November 2018 Sources: Company and Bloomberg vi Par value (THB 4.0 per share) and numbers of new outstanding shares are effective since 7 Aug 2012 ii Based on exchange rate of 1 USD = THB 32.99 as of 13 November 2018 vii Source: BTS Group Holdings PCL as of 13 November 2018 iii Assumes no cost of concession payable by VGI to BTSC viii Source: Bloomberg, data as of 13 November 2018 iv Source: Bloomberg, data as of 13 November 2018. 1-year daily average v Source: BTS Group Holdings PCL, The Stock Exchange of Thailand as of 14 June 2018
This document has been prepared and distributed by the Investor Relations Department of BTS Group Holdings Pcl. (“BTSG”) solely for information purposes. It does not represent or constitute an offer, invitation,
recommendation or solicitation to trade shares in BTSG and should not be relied on as such. Some of the information in this document has not been independently verified, and also includes information made
available from public sources and other third party opinion or analyst. BTSG does not monitor or control the content of third party opinion or statements and does not endorse or accept any responsibility for the
content or the use of any such opinion or statements. Thus, BTSG assumes no responsibility and makes no representations with respect to the accuracy and/or completeness of the information described herein.
None of BTSG or any of its agents, or all of their respective affiliates, or representatives shall have any liability (in negligence or otherwise) for any loss howsoever arising from any use of this document or its contents
or otherwise arising in connection with this document. All information contained in this document is presented as of the date indicated within, and BTSG assumes no duty to confirm, revise or update the
information. Certain statements in this document may be deemed to contain forward-looking statements, including the statements included or incorporated with the words "believe", "anticipate", "estimate",
"target", or "hope", or that otherwise relate to objectives, strategies, plans, intentions, beliefs or expectations or that have been constructed as statements as to future performance or events. These forward-looking
statements are not guarantees of future performance and involve risks and uncertainties that could cause actual results to differ materially from historical results or those anticipated at the time the forward-looking
statements are made. Thus, BTSG assumes no responsibility and makes no representations with respect to the accuracy and/or completeness of the forward-looking statements. BTSG undertakes no obligation to
publicly update or revise any forward-looking statements, whether as a result of new information, future events or otherwise.
prepared by Investor Relations department BTS Group Holdings PCL