atlanta public schools facilities master planning
TRANSCRIPT

Facilities
Master
Planning
1
Atlanta Public Schools
FACILITIES MASTER PLANNINGAtlanta Board of Education Retreat: Guardrails, Current and Future
EnrollmentNovember 14, 2019
Tuskegee Airmen Global Academy 2019 Construction

2Facilities
Master
Planning
Retreat Objectives
Receive Board Input on Goals
Finalize Goals and Review Input from Session Set
One
Agree on Planning Guardrails
Present Approach to Enrollment Forecast
Review Input from Community Set One
Present Planning Guardrails (Guidelines, Working Premises and Policies)
Review their Application to Current Capacity Model
Establish the Planning Guardrails
Student Yield Drivers
Models
1 2 3
InputShare Discussions with Other External Entities

3Facilities
Master
Planning
Retreat Objectives – Sign Off• Goals• Components of School/Site Capacity Calculation
• Classroom Size• Pre-K – All elementary schools have one classroom?• PEC – Every school and/or one location to serve entire district or cluster? • Flex Space Allocation• Wraparound Services
• Methodology for calculating School/Site Capacity• Maintaining Charter Schools
• Methodology of Enrollment Forecast• 2 Models (high and low)• Only forecasting APS traditional and Partner (Maintaining Charter, no Private)
• Working Premises• Prompts Forthcoming

4Facilities
Master
Planning
Agenda
Springdale Park ES
Introduction & Objectives
Scope & Flow
Progress to Date
Planning Guardrails (9:45)
Current Capacity
BREAK (11:45)
Enrollment Forecast (12:00)
Conclusion (12:30)
Next Steps
5Facilities
Master
Planning
Inventory and Assessment
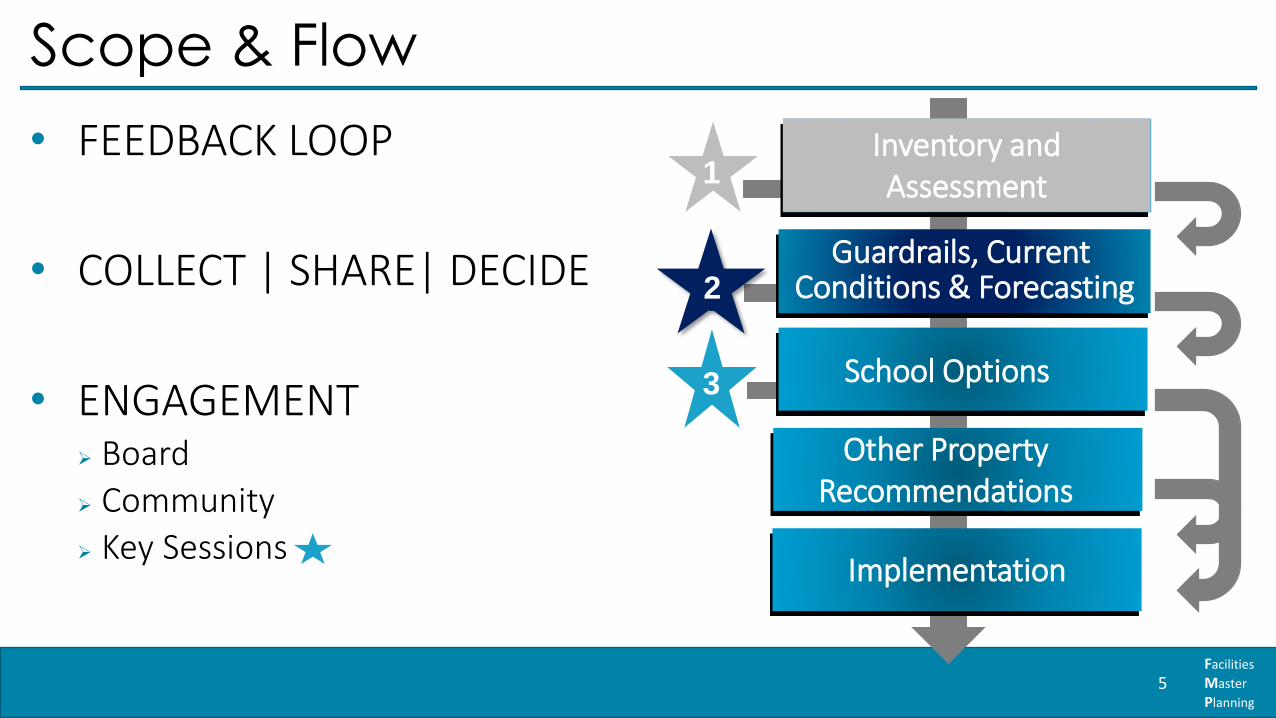
Scope & Flow
• FEEDBACK LOOP
• COLLECT | SHARE| DECIDE
• ENGAGEMENT Board
Community
Key Sessions
School Options
Other Property Recommendations
Inventory and Assessment1
2
3
Implementation
Guardrails, Current Conditions & Forecasting

6Facilities
Master
Planning
Agenda
Springdale Park ES
Introduction & Objectives
Scope & Flow
Progress to Date
Planning Guardrails
Current Capacity
Enrollment Forecast
Conclusion
Next Steps

7Facilities
Master
Planning
Progress to Date
OBJECTIVE:
To review input on goals
To review input from Community
Conversation Set one
Share Discussions with External Entities
OUTCOME:
Approved FMP Goals

8Facilities
Master
Planning
Facilities Master Plan Goals - Draft
The planning for this project is guided by these goals:
To create flexible, equitable, innovative and long-lasting
environments.
To strengthen communities equitably through quality
schools that align facility and academic objectives.
To provide an equitable distribution of instructional space
among all facilities.
To optimize operational efficiency by equitably aligning
property use, disposition and acquisition with values and
priorities.
To explore alternative opportunities for shared use of
facilities by establishing local partnerships.
Note: goals will be defined by the Atlanta Board of Education
*Develop an integrated equitable facilities planning process to include
programming around academic space, budget planning, staffing and resources
*What does it mean to strengthen communities equitably?
*And would appreciate a further explanation
*To optimize operational efficiency and incorporated sustainable strategies to
reduce energy consumption, reduce maintenance, operating and capital costs,
and to help increase student comfort, performance and employee productivity
*Please provide more information at the retreat.
*And also to explore alternative opportunities to do more than ground leasing
properties. To explore venturing with public and private partners to potentially
provide an income stream to support facilities in the system while addressing
communities’ needs.
Board Comments from Goals Survey:
*I need a lot more information about this. I’m willing to “explore,” which is why I
checked the box, but would need to see strong financial, programmatic, academic,
and community benefit analyses before I’d agree to any specific proposal.
*Add “as expressed in the strategic plan”.*I am curious to see which properties will be considered for disposition.
9Facilities
Master
Planning
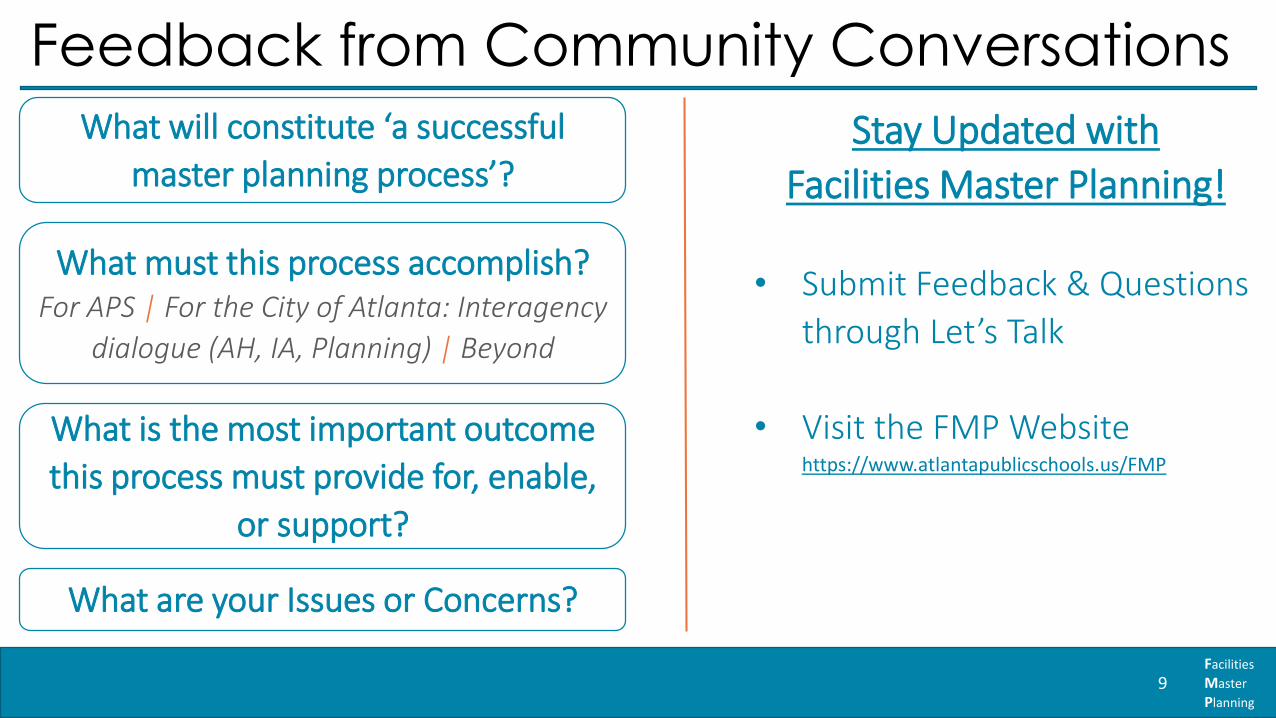
Feedback from Community Conversations
What will constitute ‘a successful
master planning process’?
What must this process accomplish?For APS | For the City of Atlanta: Interagency
dialogue (AH, IA, Planning) | Beyond
What is the most important outcome
this process must provide for, enable,
or support?
What are your Issues or Concerns?
Stay Updated with
Facilities Master Planning!
• Submit Feedback & Questions
through Let’s Talk
• Visit the FMP Website https://www.atlantapublicschools.us/FMP
10Facilities
Master
Planning
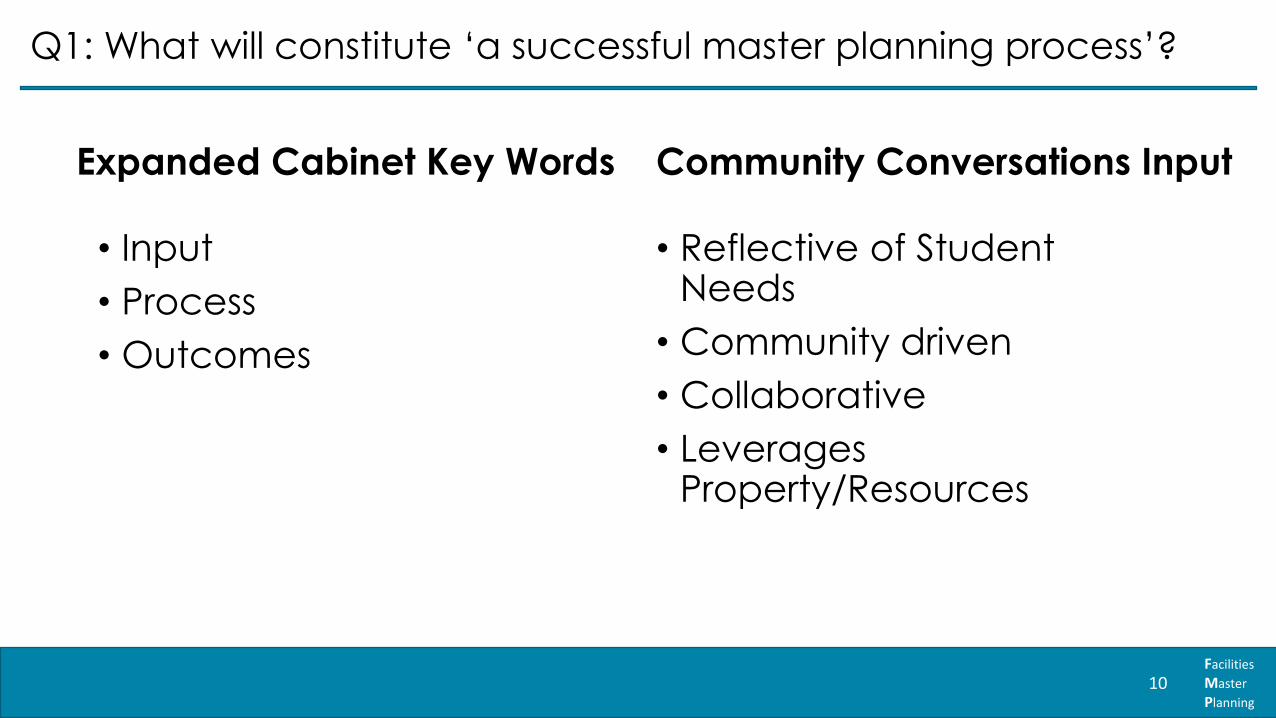
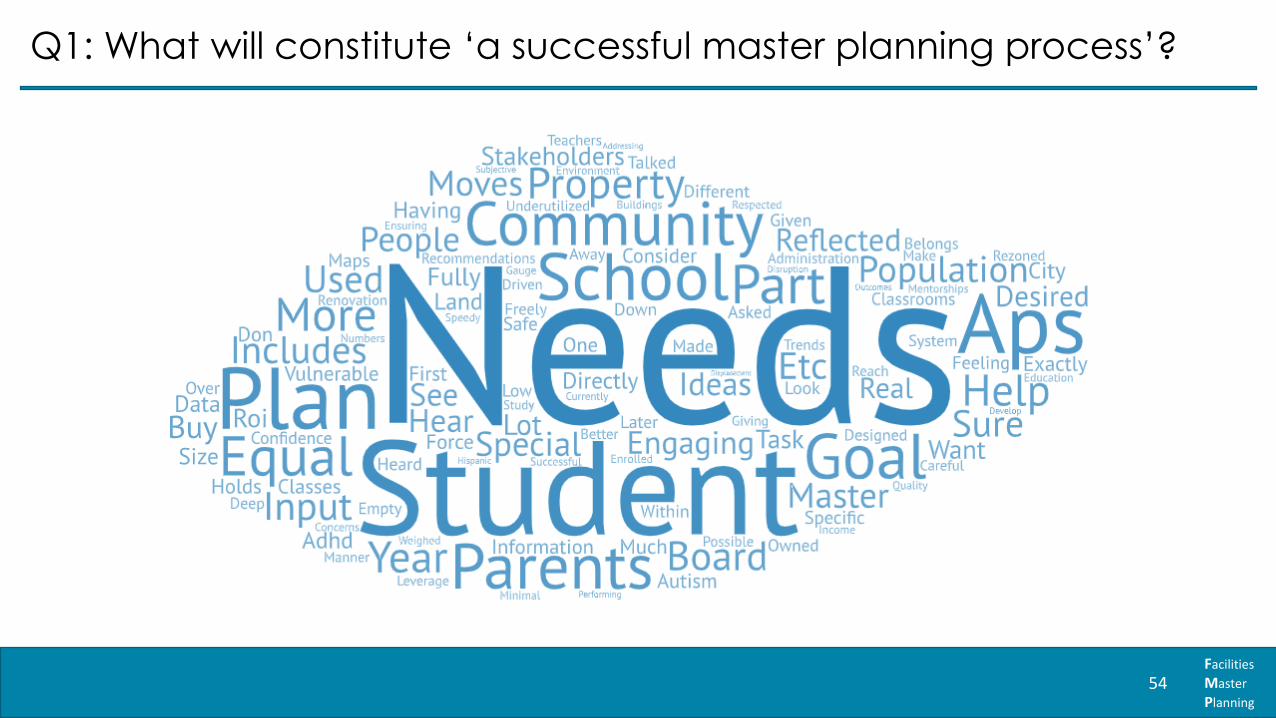
Q1: What will constitute ‘a successful master planning process’?
Expanded Cabinet Key Words
• Input
• Process
• Outcomes
Community Conversations Input
• Reflective of Student Needs
• Community driven
• Collaborative
• Leverages Property/Resources

11Facilities
Master
Planning
Q2: What must this process accomplish?
Expanded Cabinet Key Words
• Innovation
•Updates
•Upgrades
•Equity
• Input
•Collaboration
•Outcomes
Community Conversations Input
•Equitable facilities
• Sustainable facilities
•Collaboration
•Relationships
•Community Input

12Facilities
Master
Planning
Q3: What is the most important outcome this process must provide for, enable, or support?
Expanded Cabinet Key Words
• Equity
• Facilities
• Accommodations
• Infrastructure
• Input
• Process
• Shared Use
• Collaboration
• Vision
• Long Term Planning
Community Conversations Input
• Facilities Aligned w/School Goals
• Clear Direction
• Addresses Current Needs
• Long-Term Planning
• Clear Vision
13Facilities
Master
Planning
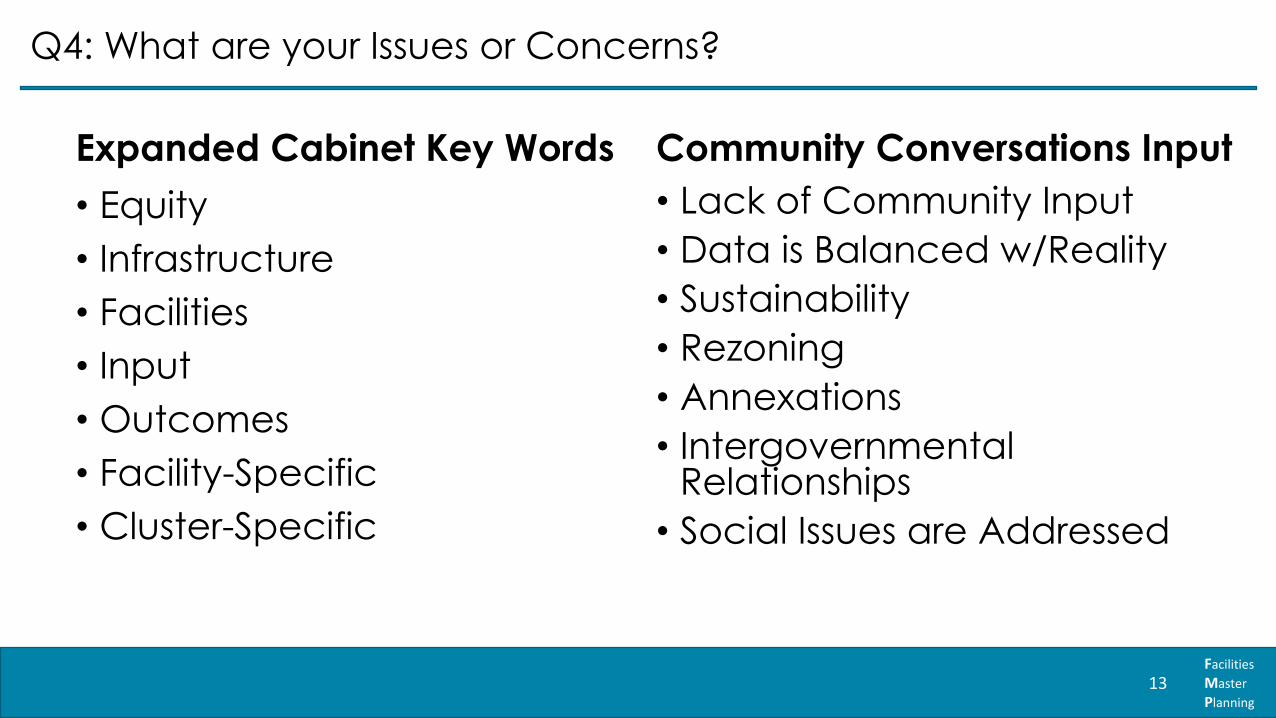
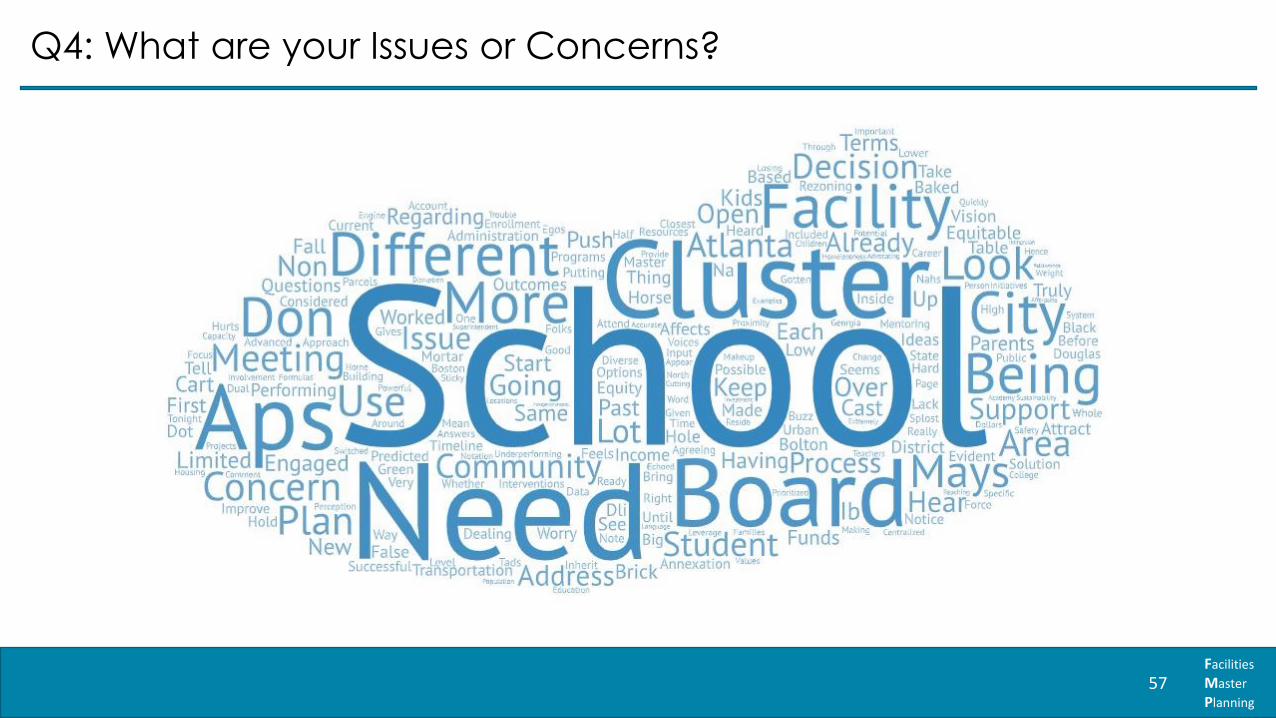
Q4: What are your Issues or Concerns?
Expanded Cabinet Key Words
• Equity
• Infrastructure
• Facilities
• Input
• Outcomes
• Facility-Specific
• Cluster-Specific
Community Conversations Input
• Lack of Community Input
• Data is Balanced w/Reality
• Sustainability
• Rezoning
• Annexations
• Intergovernmental Relationships
• Social Issues are Addressed

14Facilities
Master
Planning
Other External Entities
• Atlanta Housing
• Invest Atlanta
• Atlanta Regional Commission
• City of Atlanta Planning
• City of Atlanta Housing
• Enterprise Community Partners
• Georgia Tech
15Facilities
Master
Planning
Agenda
Springdale Park ES
Introduction & Objectives
Scope & Flow
Progress to Date
Planning Guardrails
Current Capacity
Enrollment Forecast
Conclusion
Next Steps
16Facilities
Master
Planning
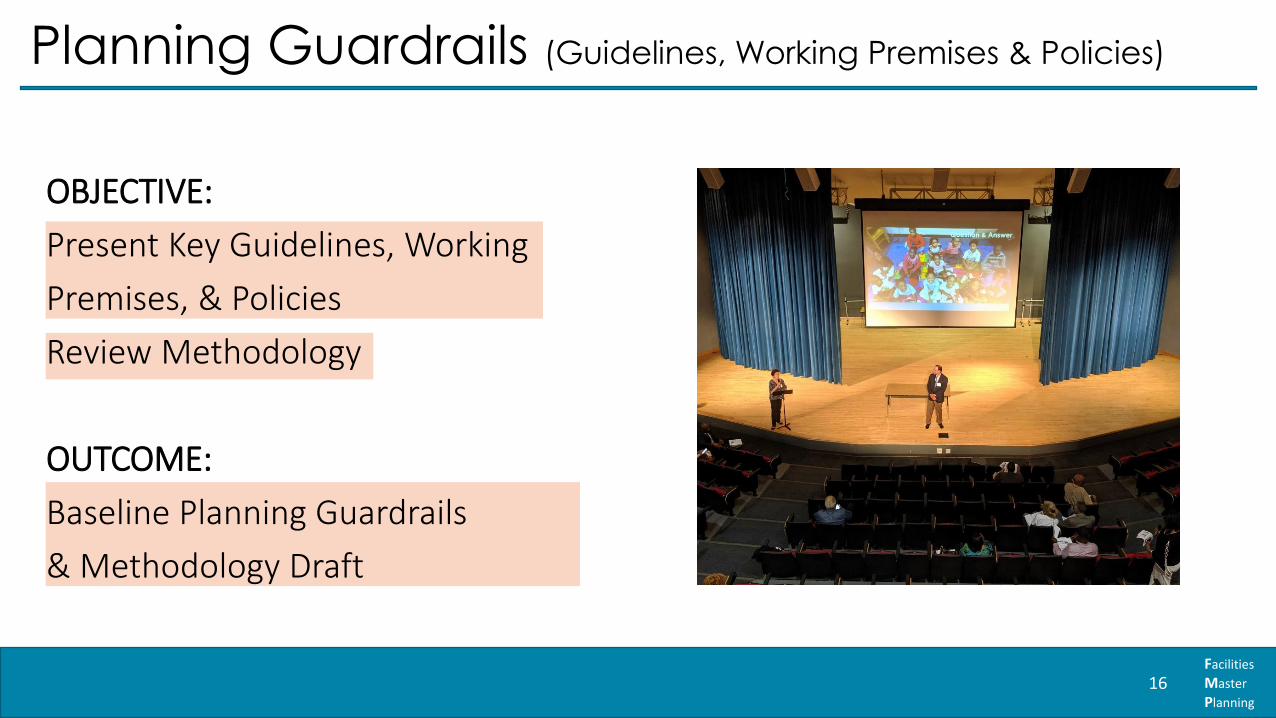
OBJECTIVE:
Present Key Guidelines, Working
Premises, & Policies
Review Methodology
OUTCOME:
Baseline Planning Guardrails
& Methodology Draft
Planning Guardrails (Guidelines, Working Premises & Policies)

17Facilities
Master
Planning
Planning Guidelines1. Class SizeFor facilities, the planning team will calculate APS capacity at:
• Primary (K-3) – 21 students/classroom
• Elementary (4-5) – 23 students/classroom
• Middle (6-8) – 24 students/classroom
• High (9-12) - 25 students/classroom
Note: In 2017 APS switched from planning capacity in all grade levels @25 to the
capacities defined in the Student Success Formula.
2. Existing Breakdown of GradesAPS will continue current grade arrangements:• Elementary School Pre-K, K-5• Middle School 6-8• High School 9-12
Existing schools with different grade level arrangements will remain as currently arranged. No additional different grade level arrangement schools will be assumed.• APS will add Pre-K to existing elementary schools only
if excess facility capacity exists.
3. Maximum & Minimum School SizeTarget ranges for the size of new schools are established as:
• Elementary School 450 – 600 Students
• Middle School 750 - 900 Students
• High School 1200 - 2000 Students
Pre-school: Use of available space in elementary school will be allowed provided that there is no displacement of K-5.
4. Site SizeThe following APS minimum new site target, which include provision of recreation fields and parking, have been established:
• Elementary School (5 Acres)• Middle School (10 Acres)• High School (25 Acres)
Note: FMP and APS should be mindful of any urban conditions of the City of Atlanta that may further require modifications to these targets (School Size, Site Size)

18Facilities
Master
Planning
Methodology - Equitable School
How School Capacity is Calculated:
The total number of Instructional Units remaining after excluding the non-core classrooms (PEC as applicable), wrapround services, flex space, and early learning classrooms (if applicable) times the number of students per classroom. The Student Success Formula Base Funding Level numbers were used for each respective grade level. This result is then compared to the Current Enrollment (2019-2020) to determine whether a school is Over Capacity, Approaching Capacity, or Under Capacity
Note: Capacity for Charter Schools was not calculated as that is set by the specific charter
Non-Core Classrooms
Wraparound Services
Flex Space
Early Learning Classrooms (if
Applicable)
# Core Classrooms
X
# of Students per Classroom (SSF)
= School CapacityTo
tal I
nst
ruct
ion
al U
nit
s
2019-2020 Enrollment
Vs.

19Facilities
Master
Planning
Methodology – Site
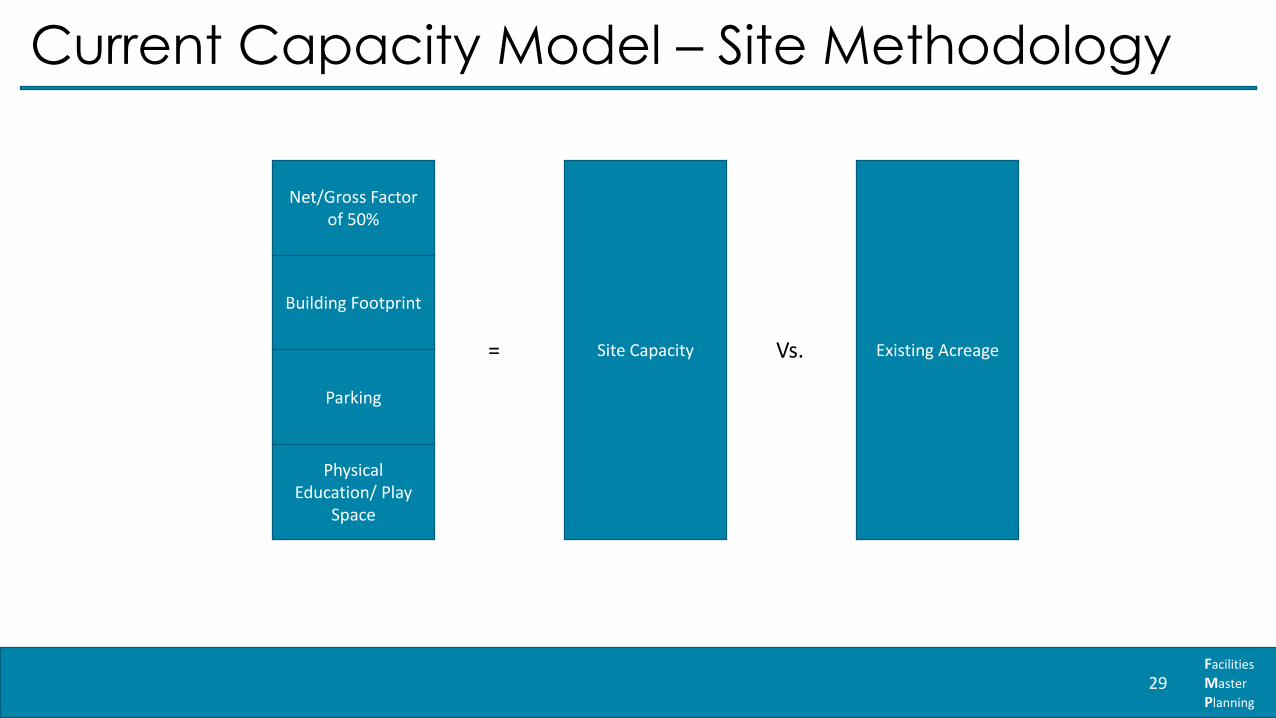
How Site Capacity is Calculated:
The total acreage guideline is calculated by adding physical education/play space, parking, and building footprint with a net/gross factor of 50% to accommodate circulation between each space. This result is then compared to the Existing Site Acreage to determine whether a school site is under-sized.
Note: Site Capacity for Charter Schools was not calculated as that is set by the specific charter
Net/Gross Factor of 50%
Building Footprint
Parking
Physical Education/ Play
Space
= Site Existing AcreageVs.

20Facilities
Master
Planning
Working PremisesSchool Capacity PlanningThe facilities will be organized around Elementary School attendance zones. Middle schools will be arranged by the sum of specific Elementary school attendance zones. High schools will be arranged based on the sum of specific Middle school attendance zones. No rezoning will be done outside of the cluster.
The Policy of “Administrative Transfers” will remain, but the facilities will be planned on the basis of the Demographic count of students within the attendance zone. Administrative transfers will be limited to current or planned permanent space.
Surplus PropertySchool sites will be identified for future sale if they are well below site standards, are within close distance of an existing school (½ mile for elementary schools) and/or not supported by the population trends for the year 2040. Sites may be exempted if large enough to house a future Elementary School site, or if designated for a specific school support use. All sites identified for future sale will be appraised and recommended to the Board for their consideration before site specific solicitation of community and private developers.
To Open - To replace an existing school site(s) or to service a new Attendance Zone created to accommodate population growth that cannot be served at existing school sites.
Community Uses or Functions to be Considered in the SchoolsCommunity uses will be defined on a site by site basis. Strategic alliances are sought to provide facilities for programs such as:• Parks and Recreation Sites• Libraries• Pre-K • Other programs as identified by the community
TransportationAtlanta Public Schools is studying strategies for how to address the location and transportation requirements of Special Needs Students.

21Facilities
Master
Planning
APS Policies & GA LawAPS Policies Residents interested in attending an APS school, but live outside of the city of Atlanta, may attend if space is available, and pay non-resident tuition. APS offers two types of School Choice transfers:
General Administrative Transfers – permits students to attend an out-of-zone school until the highest grade of school (as allowable by Cohort aging).Georgia Special Needs Scholarship Transfers – permits eligible special education students to request a transfer to another APS school on the basis of special needs.
(Source: APS Website: Student Transfer Options https://www.atlantapublicschools.us/transfers)
Administrative TransfersGeorgia LawGeorgia’s Public School Choice Law (Intradistrict Transfer), allows city of Atlanta residents the option to apply to attend a public school outside of their zoned school area, if space is available. (O.C.G.A. § 20-2-2131 also known as House Bill 251).

22Facilities
Master
Planning
Agenda
Springdale Park ES
Introduction & Objectives
Scope & Flow
Progress to Date
Planning Guardrails
Current Capacity
Enrollment Forecast
Conclusion
Next Steps

23Facilities
Master
Planning
Current Capacity
OBJECTIVE:
Illustrate Application of the
Planning Guardrails on Current
School’s Enrollment
OUTCOME:
Affirm Planning Guardrails

24Facilities
Master
Planning
EQUITY BASELINE FLEXIBILITY
Recurring Themes

25Facilities
Master
Planning
Current Capacity Model Methodology
Non-Core Classrooms
Wraparound Services
Flex Space
Early Learning Classrooms (if
Applicable)
# Core Classrooms
X
# of Students per Classroom (SSF)
= School Capacity
Tota
l In
stru
ctio
nal
Un
its
2019-2020 Enrollment
Vs.
26Facilities
Master
Planning
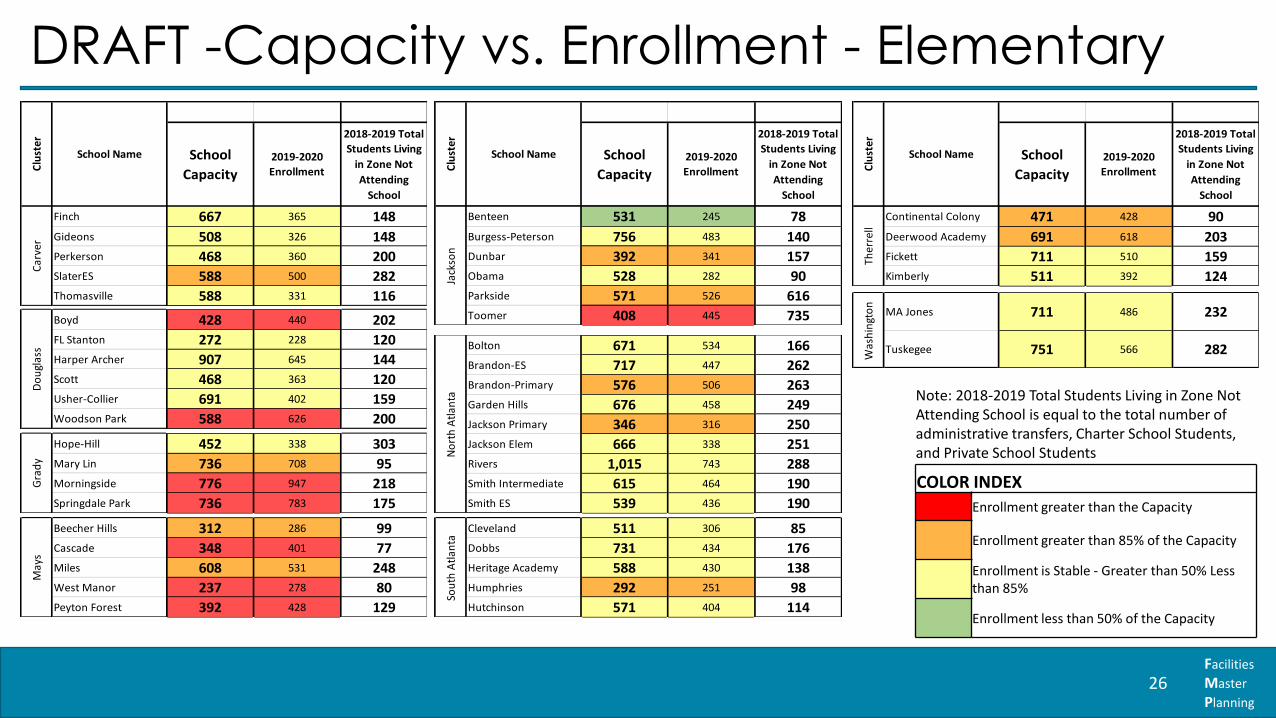
DRAFT -Capacity vs. Enrollment - Elementary
COLOR INDEX
Enrollment greater than the Capacity
Enrollment greater than 85% of the Capacity
Enrollment is Stable - Greater than 50% Less than 85%
Enrollment less than 50% of the Capacity
School
Capacity
2019-2020
Enrollment
2018-2019 Total
Students Living
in Zone Not
Attending
School
Finch 667 365 148
Gideons 508 326 148
Perkerson 468 360 200
SlaterES 588 500 282
Thomasville 588 331 116
School Name
Clu
ster
Car
ver
Boyd 428 440 202FL Stanton 272 228 120Harper Archer 907 645 144
Scott 468 363 120Usher-Collier 691 402 159Woodson Park 588 626 200
Do
ugl
ass
Hope-Hill 452 338 303Mary Lin 736 708 95Morningside 776 947 218Springdale Park 736 783 175
Gra
dy
Beecher Hills 312 286 99
Cascade 348 401 77
Miles 608 531 248
West Manor 237 278 80
Peyton Forest 392 428 129
May
s
School
Capacity
2019-2020
Enrollment
2018-2019 Total
Students Living
in Zone Not
Attending
School
Benteen 531 245 78
Burgess-Peterson 756 483 140Dunbar 392 341 157Obama 528 282 90
Parkside 571 526 616
Toomer 408 445 735
School Name
Clu
ster
Jack
son
Bolton 671 534 166Brandon-ES 717 447 262Brandon-Primary 576 506 263Garden Hills 676 458 249Jackson Primary 346 316 250Jackson Elem 666 338 251
Rivers 1,015 743 288Smith Intermediate 615 464 190Smith ES 539 436 190
No
rth
Atl
anta
Cleveland 511 306 85
Dobbs 731 434 176
Heritage Academy 588 430 138
Humphries 292 251 98
Hutchinson 571 404 114
Sou
th A
tlan
ta
School
Capacity2019-2020
Enrollment
2018-2019 Total
Students Living
in Zone Not
Attending
School
Continental Colony 471 428 90
Deerwood Academy 691 618 203Fickett 711 510 159Kimberly 511 392 124
School Name
Clu
ster
Ther
rell
MA Jones 711 486 232
Tuskegee 751 566 282Was
hin
gto
n
Note: 2018-2019 Total Students Living in Zone Not Attending School is equal to the total number of administrative transfers, Charter School Students, and Private School Students

27Facilities
Master
Planning
DRAFT - Capacity vs. Enrollment - Middle
COLOR INDEX
Enrollment greater than the Capacity
Enrollment greater than 85% of the Capacity
Enrollment is Stable - Greater than 50% Less than 85%
Enrollment less than 50% of the Capacity
School
Capacity2019-2020
Enrollment
2018-2019
Total Students
Living in Zone
Not Attending
School
Was
hin
gto
n
Brown 1,157 409 217
Ther
rell
Bunche 962 988 272
Gra
dy
Inman 905 1,125 434
Jack
son
King 919 846 789
Do
ugl
ass
Lewis Academy 1,670 964 527
S. A
tlan
ta
Long 979 780 260
BASE CLASSROOM CAPACITY
Clu
ster
School Name School
Capacity2019-2020
Enrollment
2018-2019
Total Students
Living in Zone
Not Attending
School
Car
ver
Price 785 391 118
Sutton (Northside) 1,682 1,076 567
Sutton (Powers Ferry) 1,229 579 960
Car
ver
Sylvan Hills 919 528 194
May
s
Young 1,044 825 297
BASE CLASSROOM CAPACITY
Clu
ster
N. A
tlan
ta
School Name
Note: 2018-2019 Total Students Living in Zone Not Attending School is equal to the total number of administrative transfers, Charter School Students, and Private School Students
28Facilities
Master
Planning
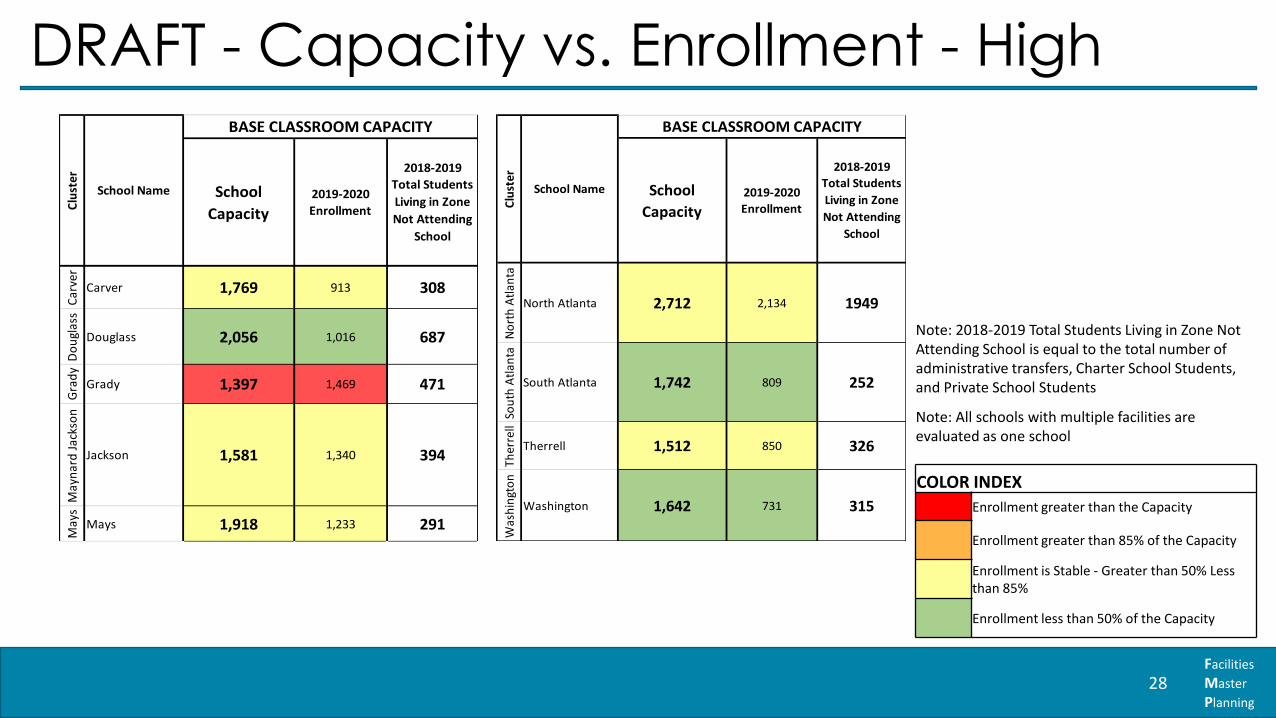
DRAFT - Capacity vs. Enrollment - High
Note: All schools with multiple facilities are evaluated as one school
COLOR INDEX
Enrollment greater than the Capacity
Enrollment greater than 85% of the Capacity
Enrollment is Stable - Greater than 50% Less than 85%
Enrollment less than 50% of the Capacity
School
Capacity2019-2020
Enrollment
2018-2019
Total Students
Living in Zone
Not Attending
School
Car
ver
Carver 1,769 913 308
Do
ugl
ass
Douglass 2,056 1,016 687
Gra
dy
Grady 1,397 1,469 471
May
nar
d J
acks
on
Jackson 1,581 1,340 394
May
s
Mays 1,918 1,233 291
Clu
ster
School Name
BASE CLASSROOM CAPACITY
School
Capacity2019-2020
Enrollment
2018-2019
Total Students
Living in Zone
Not Attending
School
No
rth
Atl
anta
North Atlanta 2,712 2,134 1949
Sou
th A
tlan
ta
South Atlanta 1,742 809 252
Ther
rell
Therrell 1,512 850 326
Was
hin
gto
nWashington 1,642 731 315
Clu
ster
School Name
BASE CLASSROOM CAPACITY
Note: 2018-2019 Total Students Living in Zone Not Attending School is equal to the total number of administrative transfers, Charter School Students, and Private School Students
29Facilities
Master
Planning
Current Capacity Model – Site Methodology
Net/Gross Factor of 50%
Building Footprint
Parking
Physical Education/ Play
Space
= Site Capacity Existing AcreageVs.

30Facilities
Master
Planning
DRAFT – Site Capacity – Elementary
COLOR INDEXTotal Guideline Acreage greater than the Existing Acreage
Total Guideline Acreage Less than Existing Acreage
Total
Guideline
Acreage
Existing
Acreage
Finch 5.32 3.8
Gideons 5.06 4.5
Perkerson 5.78 9
SlaterES 4.73 13
Thomasville 4.82 11.15
Clu
ster
Car
ver
School Name
SITE
Boyd 4.66 19.7
FL Stanton 3.86 5.2
Harper Archer 8.28 18.1
Scott 4.67 8
Usher-Collier 5.65 14
Woodson Park 4.92 7
Do
ugl
ass
Hope-Hill 4.37 2.4
Mary Lin 5.21 2.3
Morningside 4.95 5.2
Springdale Park 3.98 5.5
Gra
dy
Beecher Hills 4.19 9.5
Cascade 5.45 10
Miles 6.20 15
West Manor 3.77 10.8
Peyton Forest 5.18 25
May
s
Total
Guideline
Acreage
Existing
Acreage
Benteen 5.54 4
Burgess-Peterson 5.41 8.3
Dunbar 4.53 5.3
Obama 4.31 6
Parkside 6.07 8.3
Toomer 4.67 10.6
Jack
son
Clu
ster
School Name
SITE
Bolton 4.80 4
Brandon-ES 4.25 10
Brandon-Primary 4.62 8.6
Garden Hills 4.69 8
Jackson Primary 3.57 7.5
Jackson Elem 4.90 12.5
Rivers 4.97 8
Smith Intermediate 4.71 6.2
Smith ES 5.07 10.3N
ort
h A
tlan
ta
Total
Guideline
Acreage
Existing
Acreage
Continental Colony 5.15 8.7
Deerwood Academy 6.54 21
Fickett 4.66 12
Kimberly 4.89 7.2
Ther
rell
Clu
ster
School Name
SITE
MA Jones 5.12 7.5
Tuskegee 4.87 3.7
Was
hin
gto
n
Cleveland 5.78 9.6
Dobbs 6.45 19.6
Heritage Academy 6.12 7
Humphries 4.11 8.2
Hutchinson 5.39 8.5
Sou
th A
tlan
ta

31Facilities
Master
Planning
DRAFT – Site Capacity – Middle
COLOR INDEXTotal Guideline Acreage greater than the Existing Acreage
Total Guideline Acreage Less than Existing Acreage
Total
Guideline
Acreage
Existing
Acreage
Do
ugl
ass
Lewis Academy 12.96 17
S. A
tlan
ta
Long 10.43 15.6
Car
ver
Price 10.11 19
Sutton (Northside) 13.63 17.5
Sutton (Powers Ferry) 10.25 12.5
Car
ver
Sylvan Hills 11.06 13
May
s
Young 11.09 15
SITE
Clu
ster
N. A
tlan
ta
School Name Total
Guideline
Acreage
Existing
Acreage
Was
hin
gto
n
Brown 11.35 15.6
Ther
rell
Bunche 11.18 42.3
Gra
dy
Inman 10.88 4.2
Jack
son
King 11.86 9.59
SITE
Clu
ster
School Name

32Facilities
Master
Planning
DRAFT – Site Capacity – High
COLOR INDEXTotal Guideline Acreage greater than the Existing Acreage
Total Guideline Acreage Less than Existing Acreage
Total Guideline
AcreageExisting
Acreage
Carver 27.62 35.4
Douglass 27.64 32
Grady 30.66 19.5
Jackson 24.91 25
Mays 31.34 70.4
SITE
School Name Total Guideline
AcreageExisting
Acreage
North Atlanta 35.77 56.6
South Atlanta 25.60 50.2
Therrell 25.50 17.3
Washington 24.55 21.1
SITE
School Name

33Facilities
Master
Planning
Capacity vs. Enrollment and Site– Alternate Grade Arrangement Schools
COLOR INDEX - SITETotal Guideline Acreage greater than the Existing Acreage
Total Guideline Acreage Less than Existing Acreage
COLOR INDEX
Enrollment greater than the Capacity
Enrollment greater than 85% of the Capacity
Enrollment is Stable - Greater than 50% Less than 85%
Enrollment less than 50% of the Capacity
School
Capacity2019-2020
Enrollment
2018-2019
Total
Students
Living in
Zone Not
Attending
School
BEST 783 278 *
C.S. KING 783 334 *
Gra
dy
Centennial Place 406 805 196
Was
hin
gto
n
Hollis 571 725 262
BASE CLASSROOM CAPACITY
Clu
ster
Cit
ywid
e
School Name
Note: 2018-2019 Total Students Living in Zone Not Attending School is equal to the total number of administrative transfers, Charter School Students, and Private School Students
Total
Guideline
Acreage
Existing
Acreage
BEST 16 10.6
C.S. KING 18 10.6
Gra
dy
Centennial Place 5 5
Was
hin
gto
n
Hollis 11.55 5
SITE
Clu
ster
Cit
ywid
e
School Name

34Facilities
Master
Planning
Work in Progress Example – Howard MS
Enrollment
Capacity2019-2020
Enrollment
2018-2019 Total
Students Living
in Zone Not
Attending
School
Inman (as is) 810
Hope-Hill 452 338 303Mary Lin 736 708 95
Morningside (as is) 776 947 218Springdale Park 736 783 175
3510 2776 791TOTAL
School Name
Clu
ster
Gra
dy
COLOR INDEX
Enrollment greater than the Capacity
Enrollment greater than 85% of the Capacity
Enrollment is Stable - Greater than 50% Less than 85%
Enrollment less than 50% of the Capacity
Note: 2018-2019 Total Students Living in Zone Not Attending School is equal to the total number of administrative transfers, Charter School Students, and Private School Students
Enrollment
Capacity2019-2020
Enrollment
2018-2019
Total Students
Living in Zone
Not Attending
School
Gra
dy Howard
(based on plans)1639 1125 434
BASE CLASSROOM CAPACITY
Clu
ster
School Name

35Facilities
Master
Planning
Agenda
Springdale Park ES
Introduction & Objectives
Scope & Flow
Progress to Date
Planning Guardrails
Current Capacity
Enrollment Forecast
Conclusion
Next Steps

36Facilities
Master
Planning
School Enrollment Forecast Methodology
Current Elementary School Zone Housing Unit Mix
Data: City of Atlanta Parcel Files + CoStar Inventory
Base School Zone Growth/Decline
AssumptionsData: ARC Census Tract
Household Growth Forecast
Modified School Zone Growth/Decline Assumptions
Data: City of Atlanta Permits + CoStar Pipeline +
Other Planned Development (e.g., AH Sites) + Vacant Property Assumptions
Housing Unit Growth Forecast by Elementary Attendance Zone
XStudent Yield Analysis
Factors: Housing Unit Type & Value
Inputs to Derive Housing Unit Forecast
Analytical Output
Previous Analytical Output
Student Enrollment Forecast by Elementary Zone

37Facilities
Master
Planning
Preliminary Takeaways/Conclusions
• Recently updated ARC population forecasts:
• Predict a substantial increase in City-wide population growth compared to recent decades
• Indicate continued pressure on APS attendance zones that have experienced past enrollment growth (e.g. North Atlanta and Grady)
• Suggest the potential for higher growth rates in other parts of the district that have experienced less development in the recent past (e.g. South Atlanta, Therrell, Mays, Carver)
• New housing constructed in Atlanta over the past decade has not been the most important factor impacting recent APS enrollment
• Multifamily apartments have accounted for the majority of Atlanta’s new housing and population growth since 2010
• To date those apartments built and occupied since 2010 have, overall, had a relatively small impact on school-aged children. Average: < 3 APS students per 100 units
• This is an average based on more than 26,000 units – individual properties can be outliers
• Student Yields by housing types and values reflect/confirm demographic characteristics of the student population
• Highest student yields are derived from lower cost units, both single- and multi-family, owner and renter housing
• Higher incidence of APS students living in affordable/assisted rental housing compared to market rate rentals
• Total APS enrollment and the future locations of APS enrollment will be influenced by the City’s success (or failure) in supplying more affordable housing, particularly for families
38Facilities
Master
Planning
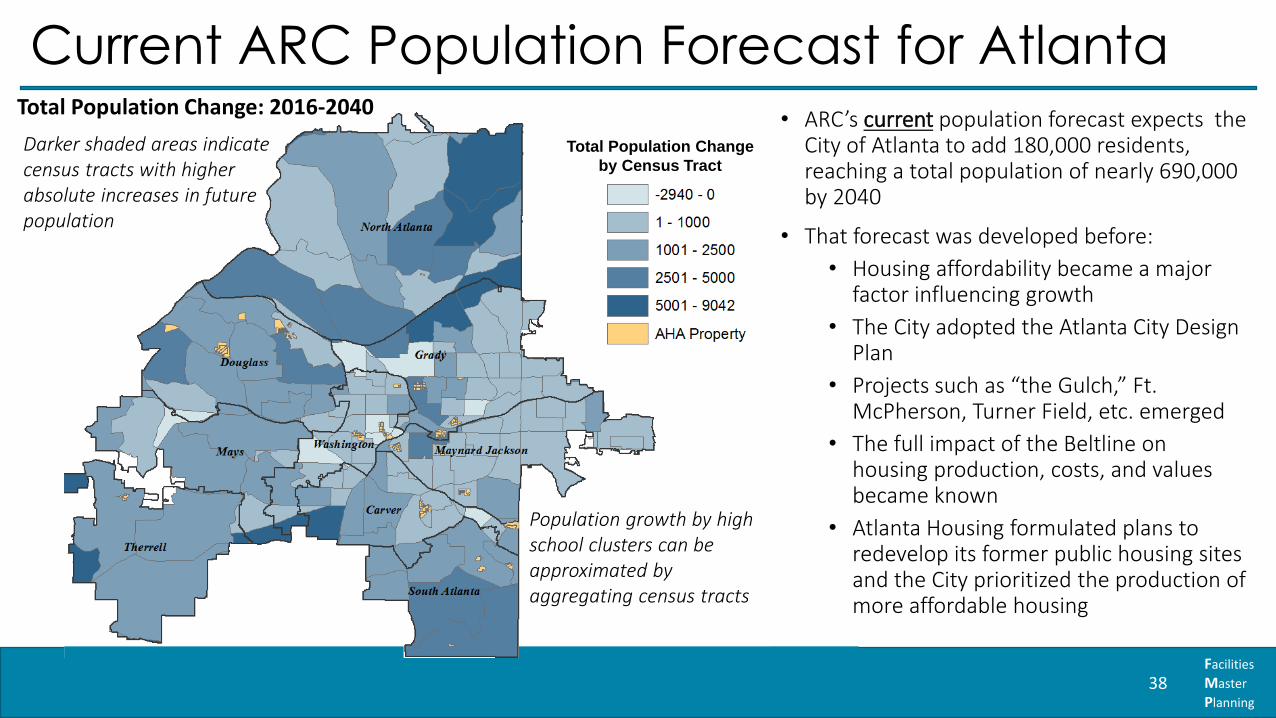
Current ARC Population Forecast for AtlantaTotal Population Change: 2016-2040
• ARC’s current population forecast expects the City of Atlanta to add 180,000 residents, reaching a total population of nearly 690,000 by 2040
• That forecast was developed before:
• Housing affordability became a major factor influencing growth
• The City adopted the Atlanta City Design Plan
• Projects such as “the Gulch,” Ft. McPherson, Turner Field, etc. emerged
• The full impact of the Beltline on housing production, costs, and values became known
• Atlanta Housing formulated plans to redevelop its former public housing sites and the City prioritized the production of more affordable housing
Darker shaded areas indicate census tracts with higher absolute increases in future population
Population growth by high school clusters can be approximated by aggregating census tracts
Total Population Change
by Census Tract

39Facilities
Master
Planning
595,000
687,000
498,044
627,000
734,000
806,000
400,000
450,000
500,000
550,000
600,000
650,000
700,000
750,000
800,000
850,000
2018 ACS* 2020 2025 2030 2035 2040 2045 2050
Atl
an
ta T
ota
l P
op
ula
tio
n
Updated Atlanta Regional Commission 2050 Population Forecast: City of Atlanta Census Tracts
Current ARC 2040 Fcst Updated ARC 2050 Fcst
Updated ARC Population Forecast
*Latest US Census
(American Community Survey) population estimate for the City of Atlanta
• The ARC is in process of updating its census-tract level population forecasts to 2050
• Implications of the new forecast for the City of Atlanta:
• The City’s expected share of future regional growth will increase
• Atlanta’s population is projected to reach 800,000 by 2050
• Interim year (2030 and 2040) population forecasts have also increased – by roughly 30,000 and 50,000, respectively
• Locations of future growth are expected to cluster near major corridors and transit
The updated ARC Census tract level population forecasts align locations of future growth with the Atlanta City Design Plan.
40Facilities
Master
Planning
Current ARC Population Forecast – by HS Cluster
0.0%
5.0%
10.0%
15.0%
20.0%
25.0%
30.0%
35.0%
40.0%
45.0%
0
5000
10000
15000
20000
25000
30000
35000
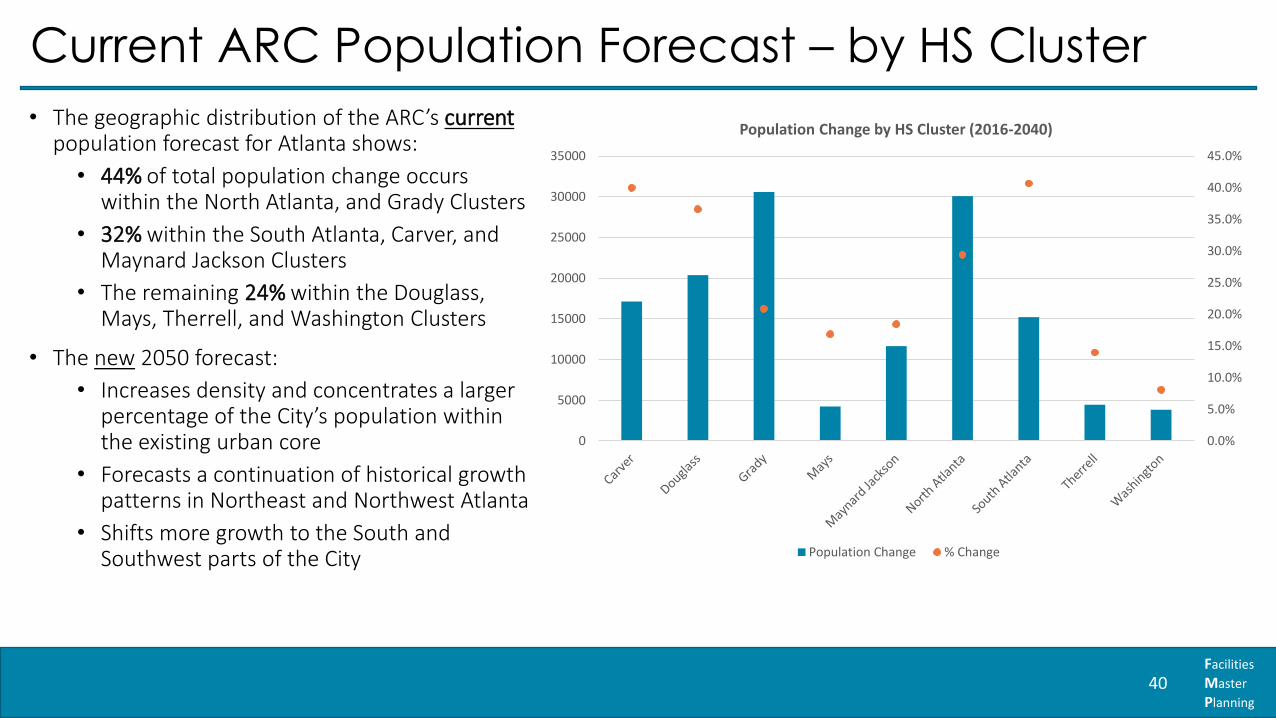
Population Change by HS Cluster (2016-2040)
Population Change % Change
• The geographic distribution of the ARC’s currentpopulation forecast for Atlanta shows:
• 44% of total population change occurs within the North Atlanta, and Grady Clusters
• 32% within the South Atlanta, Carver, and Maynard Jackson Clusters
• The remaining 24% within the Douglass, Mays, Therrell, and Washington Clusters
• The new 2050 forecast:
• Increases density and concentrates a larger percentage of the City’s population within the existing urban core
• Forecasts a continuation of historical growth patterns in Northeast and Northwest Atlanta
• Shifts more growth to the South and Southwest parts of the City

41Facilities
Master
Planning
Student Yield Analysis
• Nearly 43,300 APS* students and 5,000 private school students could be linked to the type and value of housing they occupy
• Fulton and DeKalb data analyzed separately due to different source data
• 2018-19 enrollment data: the sample captures roughly 85% of all public and 55% of all private-school students
• Summary Findings – Public School Children
• 55% live in Single-Family homes
• 26% in multi-family apartments
• 11% in condos, lofts, mobile homes & other
• 93% live in the Fulton County portion of the City
• Housing types for DeKalb students could not be determined to the same detail as APS students living in Fulton Co.
55.6%
6.1%2.5%
2.6%
26.2%
6.9%
Public School Students by Housing Type (43,270 Students in Sample)
SF Detached
Townhomes
2-4 Unit Bldgs
Mobile Homes
MF Apartments
Other East Atlanta
* Based on APS and tax assessment GIS data analysisAPS students include all public-school students attending APS traditional and APS charter schools

42Facilities
Master
Planning
Single-Family Student YieldsFulton Sample
• 24,070 students in +/- 77,106 total SF detached homes
• Average yield = 0.3122 APS students/unit across all units
• Highest yields are from homes valued below $100,000 (0.367)
• Lowest yields are from homes valued above $1.5 million (0.094)
• Student yields for homes in between those values range between 0.21 and 0.28
• 67% of APS students who live in single-family homes occupy housing with a taxable full value below $100,000
• Average home values occupied by students vary widely by HS cluster
• Carver, Douglass, South Atlanta, and Washington < $35,000
• North Atlanta and Grady > $600,000
DeKalb Sample
• 2,496 students live in 11,639 SF detached homes (estimated) = 0.214 students per unit, average home value = $317,400
• 64% of DeKalb students are in the Maynard Jackson cluster, 33% Grady, 2.4% not indicated
43Facilities
Master
Planning
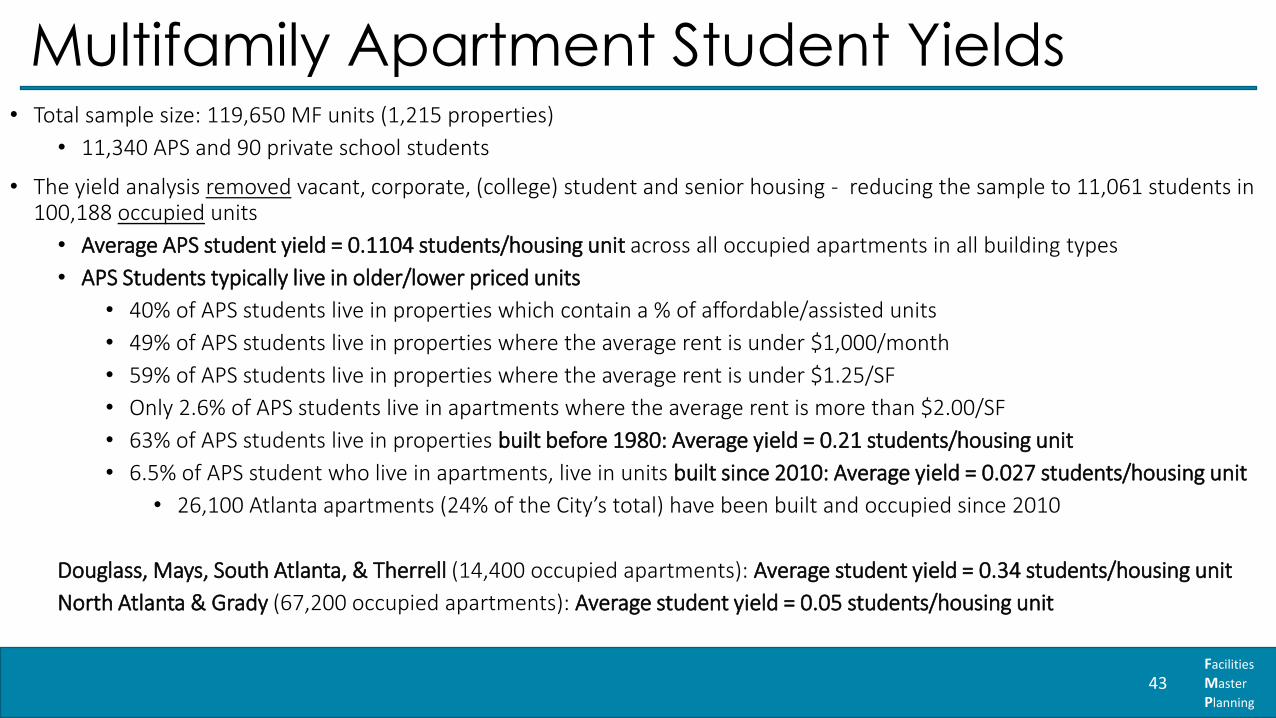
Multifamily Apartment Student Yields• Total sample size: 119,650 MF units (1,215 properties)
• 11,340 APS and 90 private school students
• The yield analysis removed vacant, corporate, (college) student and senior housing - reducing the sample to 11,061 students in 100,188 occupied units
• Average APS student yield = 0.1104 students/housing unit across all occupied apartments in all building types
• APS Students typically live in older/lower priced units
• 40% of APS students live in properties which contain a % of affordable/assisted units
• 49% of APS students live in properties where the average rent is under $1,000/month
• 59% of APS students live in properties where the average rent is under $1.25/SF
• Only 2.6% of APS students live in apartments where the average rent is more than $2.00/SF
• 63% of APS students live in properties built before 1980: Average yield = 0.21 students/housing unit
• 6.5% of APS student who live in apartments, live in units built since 2010: Average yield = 0.027 students/housing unit
• 26,100 Atlanta apartments (24% of the City’s total) have been built and occupied since 2010
Douglass, Mays, South Atlanta, & Therrell (14,400 occupied apartments): Average student yield = 0.34 students/housing unit
North Atlanta & Grady (67,200 occupied apartments): Average student yield = 0.05 students/housing unit

44Facilities
Master
Planning
Other Housing Types / Private SchoolsTownhomes
• 2,644 APS students in 6,554 total townhomes –average yield = 0.4034 students per unit across all townhome units
2-4 Unit Buildings
• 1,086 students in 8,082 housing units - average yield = 0.1344 per unit
Condos, Lofts and Co-ops
• 1,226 students (average yield not calculated)
Mobile Homes
• 280 students in 1,182 Units - average yield = 0.2369 per unit
Private Schools
• Of the total number of Atlanta resident students attending private schools during the 2018-19 school year, +/- 4,950 could be linked to specific housing types using GIS
• Of this sample:
• Identified private school students attended 53 different schools
• 86% live in the North Atlanta Cluster
• 6% live in the Grady Cluster
• 8% live in the remaining clusters

45Facilities
Master
Planning
School Enrollment Forecast Methodology
Student Yield Analysis
Modified School Zone
Growth/Decline Assumptions
Base School Zone Growth/Decline
Assumptions
Current Elementary School Zone Housing Mix
Student Cohort Survival Ratio
Enrollment Projection
Forecast by School
Ho
usi
ng
+ D
emo
grap
hic
En
rollm
ent
Pro
ject
ion
=+

46Facilities
Master
Planning
Agenda
Springdale Park ES
Introduction & Objectives
Scope & Flow
Progress to Date
Planning Guardrails
Current Capacity
Enrollment Forecast
Conclusion
Next Steps

47Facilities
Master
Planning
Retreat Objectives
Receive Board Input on Goals
Finalize Goals and Review Input from Session Set
One
Agree on Planning Guardrails
Present Approach to Enrollment Forecast
Review Input from Community Set One
Present Planning Guardrails (Guidelines, Working Premises and Policies)
Review their Application to Current Capacity Model
Establish the Planning Guardrails
Student Yield Drivers
Models
1 2 3
InputShare Discussions with Other External Entities

48Facilities
Master
Planning
Retreat Objectives – Sign Off• Goals• Components of School/Site Capacity Calculation
• Classroom Size• Pre-K – All elementary schools have one classroom?• PEC – Every school and/or one location to serve entire district or cluster? • Flex Space Allocation• Wraparound Services
• Methodology for calculating School/Site Capacity• Maintaining Charter Schools
• Methodology of Enrollment Forecast• 2 Models (high and low)• Only forecasting APS traditional and Partner (Maintaining Charter, no Private)
• Working Premises• Prompts Forthcoming

49Facilities
Master
Planning
Next Steps
Update Enrollment
Forecast Models
Prepare for 2nd Round of Community
Conversations
Conduct 2nd Round of
Community Conversations
Develop Detailed
Enrollment Forecast Model

50Facilities
Master
Planning
Community Conversation Schedule
Note: draft schedule & is subject to change
Updated: 10/18/2019
Topic Proposed Date Time Location Cluster Address Type Status
Friday, August 30, 2019 9:00 am - 1:00 pm CLL 130 Trinity Ave, SW 30303 BOE Retreat: 9am-1pm Complete
Wednesday, October 2, 2019 6:00 - 8:00 pm Mays Mays 3450 Benjamin E. Mays Dr., SW 30331 Regional 6-8pm Complete
Wednesday, October 16, 2019 6:00 - 8:00 pm Sutton Main North Atlanta 2875 Northside Dr., NW 30305 Regional 6-8pm Complete
Thursday, October 17, 2019 6:00 - 8:00 pm King MS Jackson 545 Hill St., 30312 Regional 6-8pm Complete
Wednesday, October 23, 2019 6:00 - 8:00 pm South Atlanta South Atlanta 800 Hutchins Rd., SE 30315 Regional 6-8pm Confirmed
Thursday, November 14, 2019 9:00 am - 1:00 pm CLL 130 Trinity Ave, SW 30303 BOE Retreat: 9am-1pm Confirmed
Wednesday, January 8, 2020 6:00 - 8:00 pm BEST/CSK Douglass 1190 Northwest Dr., NW 30318 Regional 6-8pm Pending
Wednesday, January 15, 2020 6:00 - 8:00 pm Inman Grady 774 Virginia Ave., NE 30306 Regional 6-8pm Pending
Thursday, January 16, 2020 6:00 - 8:00 pm Therrell Therrell 3099 Panther Trail, SW 30311 Regional 6-8pm Pending
Wednesday, January 22, 2020 6:00 - 8:00 pm Washington Washington 45 Whitehouse Dr., NW 30314 Regional 6-8pm Pending
Thursday, January 30, 2020 9:00 am - 4:00 pm CLL 130 Trinity Ave, SW 30303 BOE Retreat: 9am-4pm Confirmed
Wednesday, March 4, 2020 6:00 - 8:00 pm South Atlanta South Atlanta 800 Hutchins Rd., SE 30315 Cluster 6-8pm Pending
Wednesday, March 11, 2020 6:00 - 8:00 pm John Lewis Douglass 225 Hamilton E. Holmes Dr., NW 30318 Cluster 6-8pm Pending
Thursday, March 12, 2020 6:00 - 8:00 pm Jackson Jackson 801 Glenwood Ave., SE 30316 Cluster 6-8pm Pending
Wednesday, March 18, 2020 6:00 - 8:00 pm Sutton Main North Atlanta 2875 Northside Dr., NW 30305 Cluster 6-8pm Pending
Wednesday, March 25, 2020 6:00 - 8:00 pm Mays Mays 3450 Benjamin E. Mays Dr., SW 30331 Cluster 6-8pm Pending
Wednesday, April 1, 2020 6:00 - 8:00 pm Bunche Therrell 1925 Niskey Lake Rd., SW 30331 Cluster 6-8pm Pending
Thursday, April 2, 2020 6:00 - 8:00 pm Grady Grady 929 Charles Allen Dr., NE 30309 Cluster 6-8pm Pending
Wednesday, April 15, 2020 6:00 - 8:00 pm Sylvan Carver 1461 Sylvan Rd., SW 30310 Cluster 6-8pm Pending
Thursday, April 16, 2020 6:00 - 8:00 pm Brown Washington 765 Peeples St., SW 30310 Cluster 6-8pm Pending
Thursday, April 30, 2020 9:00 am - 4:00 pm CLL 130 Trinity Ave, SW 30303 BOE Retreat: 9am-4pm Confirmed
First Read of Final
RecommendationsMonday, May 4, 2020 6:00 PM CLL 130 Trinity Ave, SW 30303 BOE Meeting Pending
Second Read & Vote of Final
RecommendationsMonday, June 1, 2020 6:00 PM CLL 130 Trinity Ave, SW 30303 BOE Meeting Pending
Facilities Master PlanningCommunity Conversation Schedule
Existing Context
Guidelines, Current and
Forecasting
Draft of Recommended
School Options

51Facilities
Master
Planning
GaTech

Facilities
Master
Planning
52
Appendix
Whitefoord Early Learning

53Facilities
Master
Planning
Appendix
Springdale Park ES
Input from Community Set 1
Capacity Calculation Details
54Facilities
Master
Planning
Q1: What will constitute ‘a successful master planning process’?

55Facilities
Master
Planning
Q2: What must this process accomplish?

56Facilities
Master
Planning
Q3: What is the most important outcome this process must provide for, enable, or support?
57Facilities
Master
Planning
Q4: What are your Issues or Concerns?

58Facilities
Master
Planning
Appendix
Springdale Park ES
Input from Community Set 1
Capacity Calculation Details

59Facilities
Master
Planning
Non-Core Classrooms
Based on the APS Local Facilities Plan, the following non-core classrooms were reported to be the most common among their respective school types.
Elementary Schools
Discipline
% of Schools with Program
Music 97%
Art 89%
PEC 88%
Media 84%
Computer 78%
Gym 75%
Science 58%
Pre-K 55%
Foreign Language 33%
Auditorium 23%
Multipurpose (Gymnatorium?)20%
Gifted 6%
Undesignated 6%
ESOL 5%
Interactive 5%
STEM Lab 3%
Clinic 2%
EIP 2%
Project Grad 2%
Tech Lab 2%
High Schools
Discipline
% of Schools with Program
Competition Gym 100%
Practice Gym 100%
Art 89%
Health 89%
JROTC 89%
Music 78%
PEC 67%
Auditorium 56%
Computer Lab 56%
Rifle Range 56%
Dance 44%
Interactive Lab 44%
Media Center 44%
Theater 44%
Multi Purpose Room 33%
Band 22%
Black Box 22%
Career 22%
Drama 22%
ISS 22%
Special Ed 22%
Weight Room 22%
Aircraft Hangar 11%
Business Education 11%
CADD Lab 11%
Chorus 11%
Commons 11%
Construction Lab 11%
Culinary Kitchen 11%
Gallery 11%
Labs 11%
Mac Lab 11%
MIDI Lab 11%
PA Lab 11%
Photo Lab 11%
Project Room 11%
Senior Academy 11%
Scene Shop 11%
Technology Lab 11%
Video Studio 11%
Middle Schools
Discipline
% of Schools with Program
Music 100%
Art 91%
Business Lab 82%
Gym 82%
Health 82%
PEC 82%
Technology Lab 73%
Auditorium 64%
Computer Lab 64%
Interactive Lab 55%
ISS 45%
Theater 45%
Dance 36%
Lecture 36%
Weight Room 36%
Gifted 27%
Drama 18%
ESOL 18%
Foreign Language 18%
Health Science 18%
Media Center 18%
Broadcast 9%
Commons 9%
Connections 9%
Consumer Science 9%
Flex Classroom 9%
Health Care lab 9%
Maker Space 9%
Math Lab 9%
MOID 9%
Multi-Purpose 9%
Practice Gym 9%
Rifle Range 9%
ROTC 9%
Speech/Therapy 9%
Special Ed 9%
Team Room 9%
Testing/Resource Room 9%

60Facilities
Master
Planning
Capacity vs. Enrollment - ElementaryBased on APS Enrollment Data, this chart represents the breakdown of those students reported as living in the zone and not attending the school within that zone.
School
Capacity
2019-2020
Enrollment
Administrative
Transfers Living
in Zone/Cluster
Charter
Students Living
in Zone/Cluster
Private School
Students Living
in Zone/Cluster
2018-2019 Total
Students Living
in Zone Not
Attending
School
Finch 667 365 55 91 2 148
Gideons 508 326 67 77 4 148
Perkerson 468 360 57 133 10 200
SlaterES 588 500 89 164 29 282
Thomasville 588 331 33 53 30 116
School Name
Clu
ster
Car
ver
Boyd 428 440 42 159 1 202FL Stanton 272 228 52 63 5 120Harper Archer 907 645 71 72 1 144
Scott 468 363 42 72 6 120Usher-Collier 691 402 65 89 5 159Woodson Park 588 626 78 116 6 200
Do
ugl
ass
Hope-Hill 452 338 47 234 22 303
Mary Lin 736 708 10 8 77 95
Morningside 776 947 8 13 197 218Springdale Park 736 783 6 13 156 175
Gra
dy
Beecher Hills 312 286 28 65 6 99
Cascade 348 401 35 39 3 77
Miles 608 531 97 146 5 248
West Manor 237 278 29 46 5 80
Peyton Forest 392 428 39 88 2 129
May
s
COLOR INDEX
Enrollment greater than the Capacity
Enrollment greater than 85% of the Capacity
Enrollment is Stable - Greater than 50% Less than 85%
Enrollment less than 50% of the Capacity

61Facilities
Master
Planning
Capacity vs. Enrollment - ElementaryBased on APS Enrollment Data, this chart represents the breakdown of those students reported as living in the zone and not attending the school within that zone.
School
Capacity
2019-2020
Enrollment
Administrative
Transfers Living
in Zone/Cluster
Charter
Students Living
in Zone/Cluster
Private School
Students Living
in Zone/Cluster
2018-2019 Total
Students Living
in Zone Not
Attending
School
Benteen 531 245 24 48 6 78
Burgess-Peterson 756 483 13 106 21 140Dunbar 392 341 52 104 1 157Obama 528 282 27 62 1 90
Parkside 571 526 60 491 65 616
Toomer 408 445 43 644 48 735
School Name
Clu
ster
Jack
son
Continental Colony 471 428 48 41 1 90Deerwood Academy 691 618 48 138 17 203Fickett 711 510 50 90 19 159Kimberly 511 392 68 51 5 124
Ther
rell
Bolton 671 534 23 95 48 166Brandon-ES 717 447 8 39 215 262Brandon-Primary 576 506 8 40 215 263Garden Hills 676 458 13 22 214 249Jackson Primary 346 316 4 14 232 250Jackson Elem 666 338 5 14 232 251
Rivers 1,015 743 30 42 216 288Smith Intermediate 615 464 6 48 136 190Smith ES 539 436 6 48 136 190
No
rth
Atl
anta
COLOR INDEX
Enrollment greater than the Capacity
Enrollment greater than 85% of the Capacity
Enrollment is Stable - Greater than 50% Less than 85%
Enrollment less than 50% of the Capacity

62Facilities
Master
Planning
Capacity vs. Enrollment - ElementaryBased on APS Enrollment Data, this chart represents the breakdown of those students reported as living in the zone and not attending the school within that zone.
School
Capacity
2019-2020
Enrollment
Administrative
Transfers Living
in Zone/Cluster
Charter
Students Living
in Zone/Cluster
Private School
Students Living
in Zone/Cluster
2018-2019 Total
Students Living
in Zone Not
Attending
School
Cleveland 511 306 26 58 1 85
Dobbs 731 434 44 121 11 176
Heritage Academy 588 430 39 97 2 138
Humphries 292 251 53 43 2 98
Hutchinson 571 404 32 81 1 114
School Name
Clu
ster
Sou
th A
tlan
ta
MA Jones 711 486 64 164 4 232
Tuskegee 751 566 76 194 12 282Was
hin
gto
n
COLOR INDEX
Enrollment greater than the Capacity
Enrollment greater than 85% of the Capacity
Enrollment is Stable - Greater than 50% Less than 85%
Enrollment less than 50% of the Capacity
63Facilities
Master
Planning
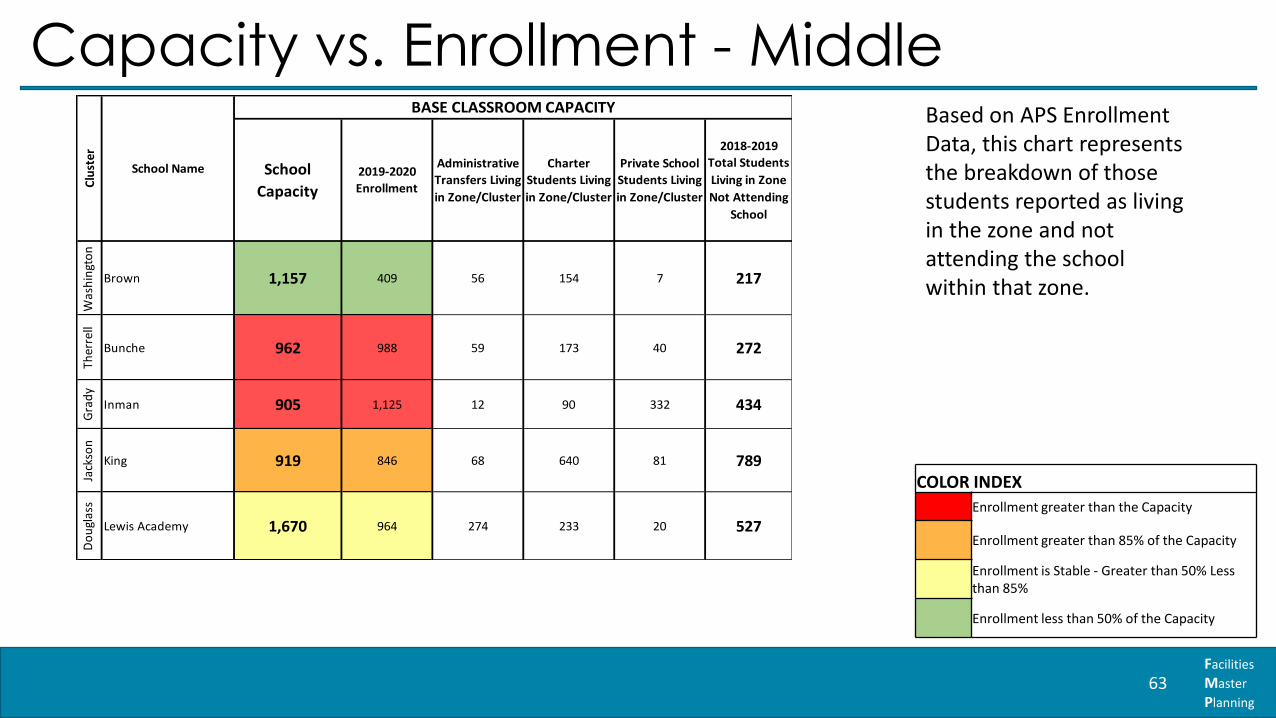
Capacity vs. Enrollment - MiddleBased on APS Enrollment Data, this chart represents the breakdown of those students reported as living in the zone and not attending the school within that zone.
COLOR INDEX
Enrollment greater than the Capacity
Enrollment greater than 85% of the Capacity
Enrollment is Stable - Greater than 50% Less than 85%
Enrollment less than 50% of the Capacity
School
Capacity2019-2020
Enrollment
Administrative
Transfers Living
in Zone/Cluster
Charter
Students Living
in Zone/Cluster
Private School
Students Living
in Zone/Cluster
2018-2019
Total Students
Living in Zone
Not Attending
School
Was
hin
gto
n
Brown 1,157 409 56 154 7 217
Ther
rell
Bunche 962 988 59 173 40 272
Gra
dy
Inman 905 1,125 12 90 332 434
Jack
son
King 919 846 68 640 81 789
Do
ugl
ass
Lewis Academy 1,670 964 274 233 20 527
BASE CLASSROOM CAPACITYC
lust
er
School Name

64Facilities
Master
Planning
Capacity vs. Enrollment - MiddleBased on APS Enrollment Data, this chart represents the breakdown of those students reported as living in the zone and not attending the school within that zone.
COLOR INDEX
Enrollment greater than the Capacity
Enrollment greater than 85% of the Capacity
Enrollment is Stable - Greater than 50% Less than 85%
Enrollment less than 50% of the Capacity
School
Capacity2019-2020
Enrollment
Administrative
Transfers Living
in Zone/Cluster
Charter
Students Living
in Zone/Cluster
Private School
Students Living
in Zone/Cluster
2018-2019
Total Students
Living in Zone
Not Attending
School
S. A
tlan
ta
Long 979 780 57 192 11 260
Car
ver
Price 785 391 27 89 2 118
Sutton (Northside) 1,682 1,076 6 81 480 567
Sutton (Powers Ferry) 1,229 579 7 81 872 960
Car
ver
Sylvan Hills 919 528 58 123 13 194
May
s
Young 1,044 825 100 186 11 297
BASE CLASSROOM CAPACITY
Clu
ster
N. A
tlan
ta
School Name

65Facilities
Master
Planning
Capacity vs. Enrollment - HighBased on APS Enrollment Data, this chart represents the breakdown of those students reported as living in the zone and not attending the school within that zone.
COLOR INDEX
Enrollment greater than the Capacity
Enrollment greater than 85% of the Capacity
Enrollment is Stable - Greater than 50% Less than 85%
Enrollment less than 50% of the Capacity
School
Capacity
2019-2020
Enrollment
Administrative
Transfers Living
in Zone/Cluster
Charter
Students Living
in Zone/Cluster
Private School
Students Living
in Zone/Cluster
2018-2019
Total Students
Living in Zone
Not Attending
School
Car
ver
Carver 1,769 913 141 146 21 308
Do
ugl
ass
Douglass 2,056 1,016 446 196 45 687
Gra
dy
Grady 1,397 1,469 24 45 402 471
May
nar
d J
acks
on
Jackson 1,581 1,340 67 242 85 394
May
s
Mays 1,918 1,233 115 155 21 291
No
rth
Atl
anta
North Atlanta 2,712 2,134 14 141 1794 1949
Sou
th A
tlan
ta
South Atlanta 1,742 809 113 119 20 252
Ther
rell
Therrell 1,512 850 138 145 43 326
Was
hin
gto
n
Washington 1,642 731 131 156 28 315
Clu
ster
School Name
BASE CLASSROOM CAPACITY

66Facilities
Master
Planning
Capacity vs. Enrollment – Alternate Grade Arrangement Schools
Based on APS Enrollment Data, this chart represents the breakdown of those students reported as living in the zone and not attending the school within that zone.
BEST Academy and C.S King do not have assigned zone.
COLOR INDEX
Enrollment greater than the Capacity
Enrollment greater than 85% of the Capacity
Enrollment is Stable - Greater than 50% Less than 85%
Enrollment less than 50% of the Capacity
School
Capacity2019-2020
Enrollment
Administrative
Transfers Living
in Zone/Cluster
Charter
Students Living
in Zone/Cluster
Private School
Students Living
in Zone/Cluster
2018-2019
Total
Students
Living in
Zone Not
Attending
School
BEST 783 278 * * * *
C.S. KING 783 334 * * * *
Gra
dy
Centennial Place 406 805 59 81 56 196
Was
hin
gto
n
Hollis 571 725 126 136 6 262
BASE CLASSROOM CAPACITY
Clu
ster
Cit
ywid
e
School Name