atmospheric co 2 & global warming. atmospheric temperature and co 2 atmospheric temperature and...
TRANSCRIPT
Atmospheric COAtmospheric CO2 2 & Global & Global
WarmingWarming
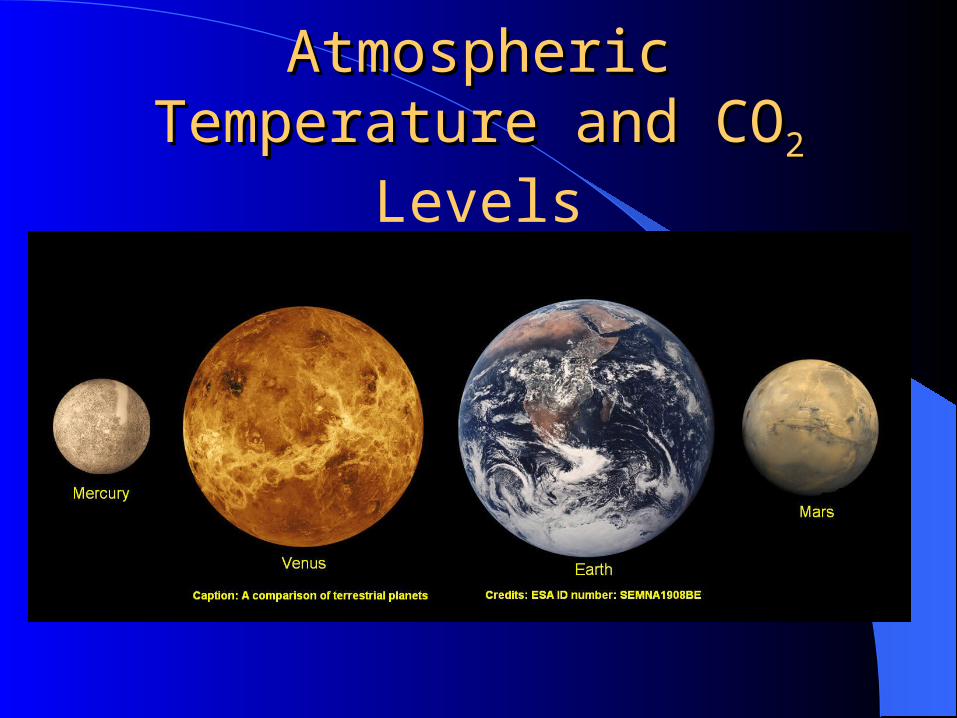
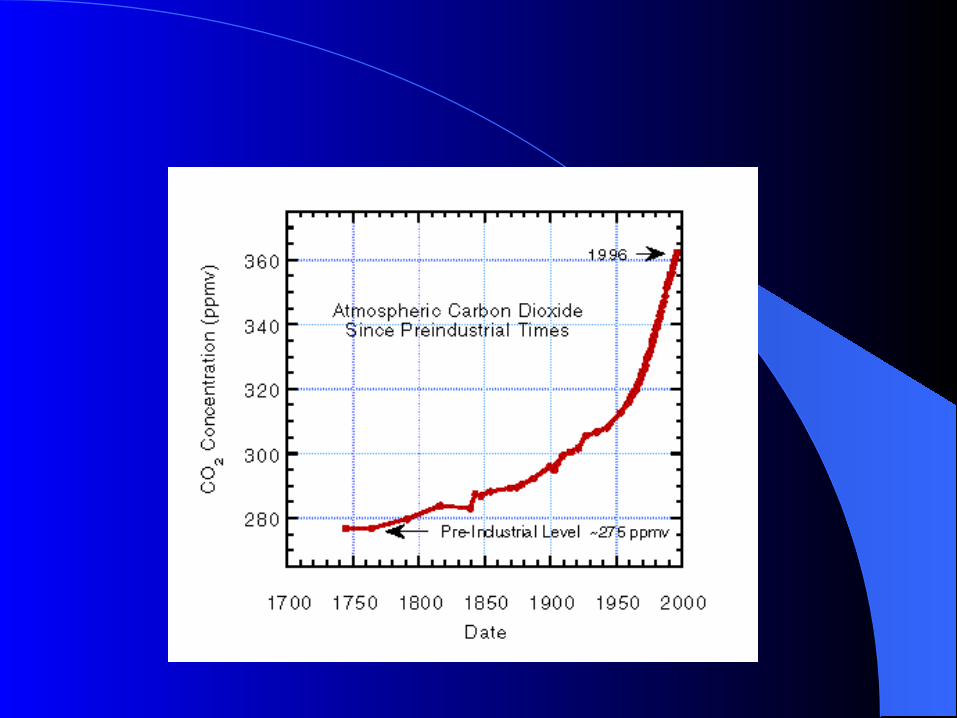
Atmospheric Temperature and Atmospheric Temperature and COCO22 Levels
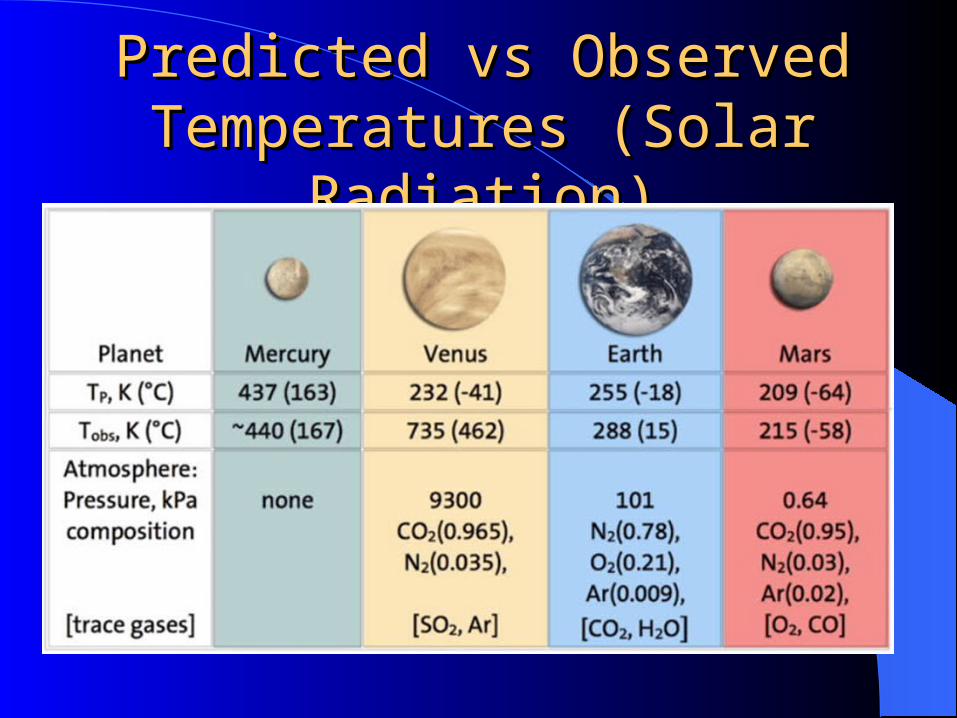
Predicted vs Observed Predicted vs Observed Temperatures (Solar Radiation)Temperatures (Solar Radiation)
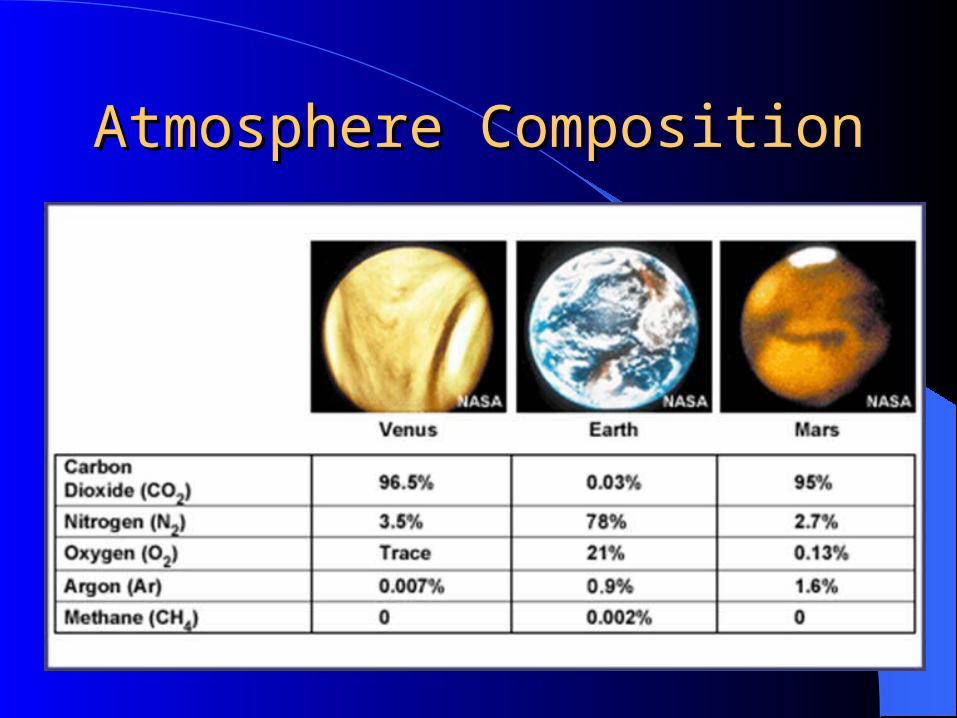
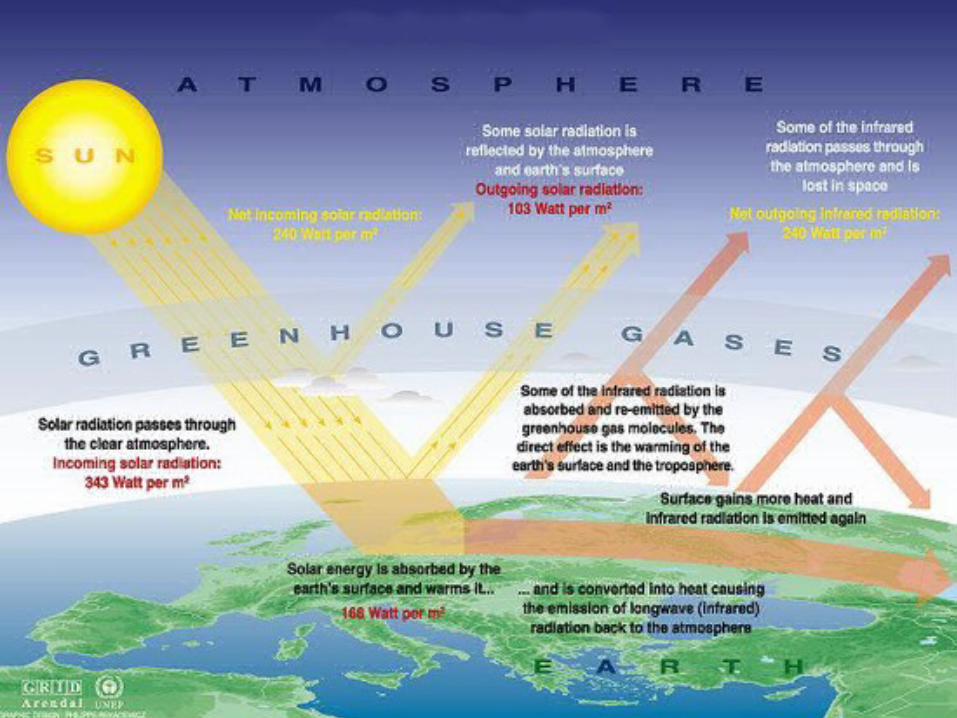
Atmosphere CompositionAtmosphere Composition
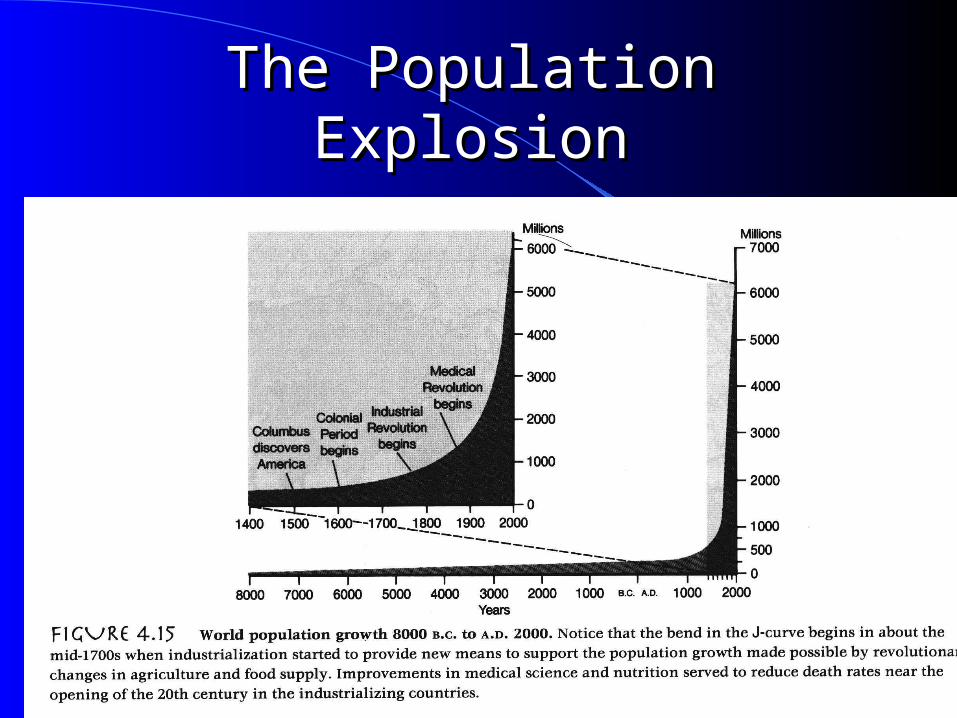
The Population ExplosionThe Population Explosion
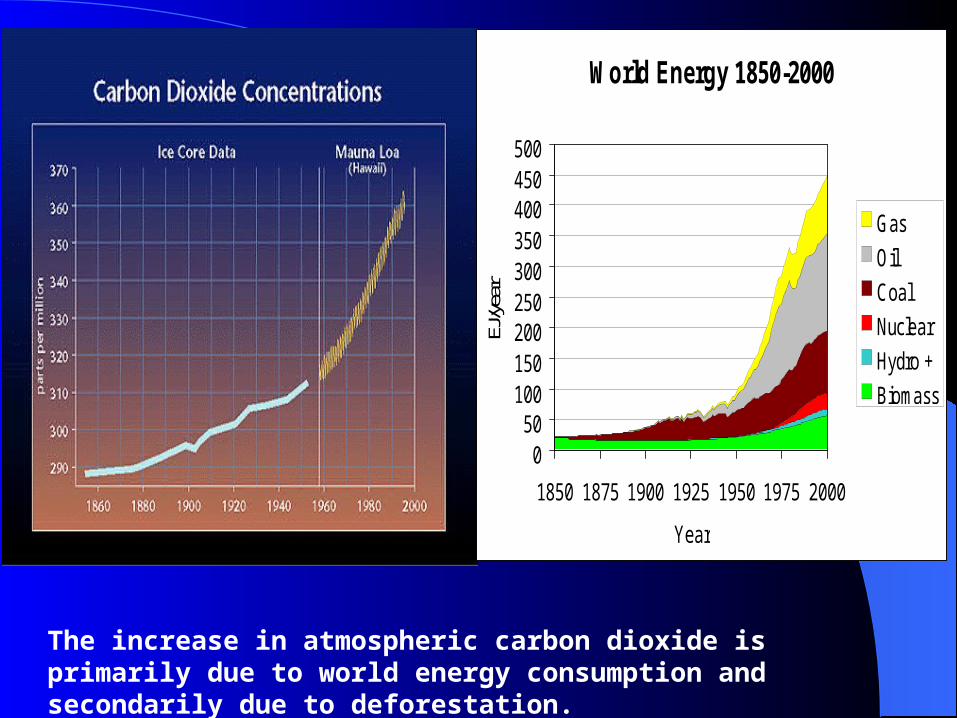
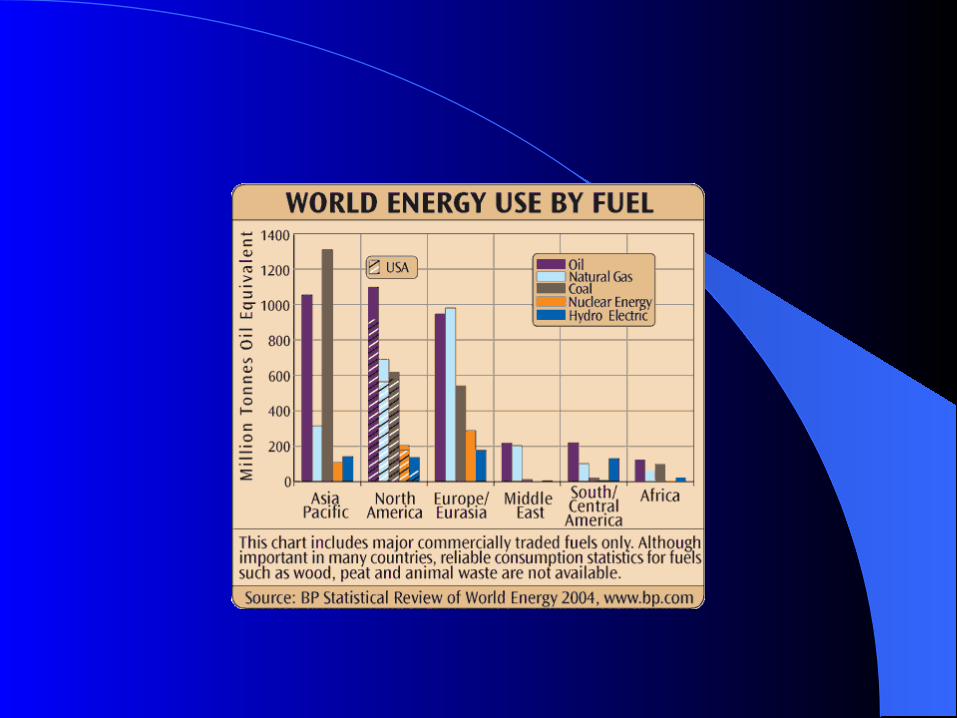
The increase in atmospheric carbon dioxide is primarily due to world energy consumption and secondarily due to deforestation.
World Energy 1850-2000
050
100150200250300350400450500
1850 1875 1900 1925 1950 1975 2000
Year
EJ/ye
ar
Gas
Oil
Coal
Nuclear
Hydro +
Biomass
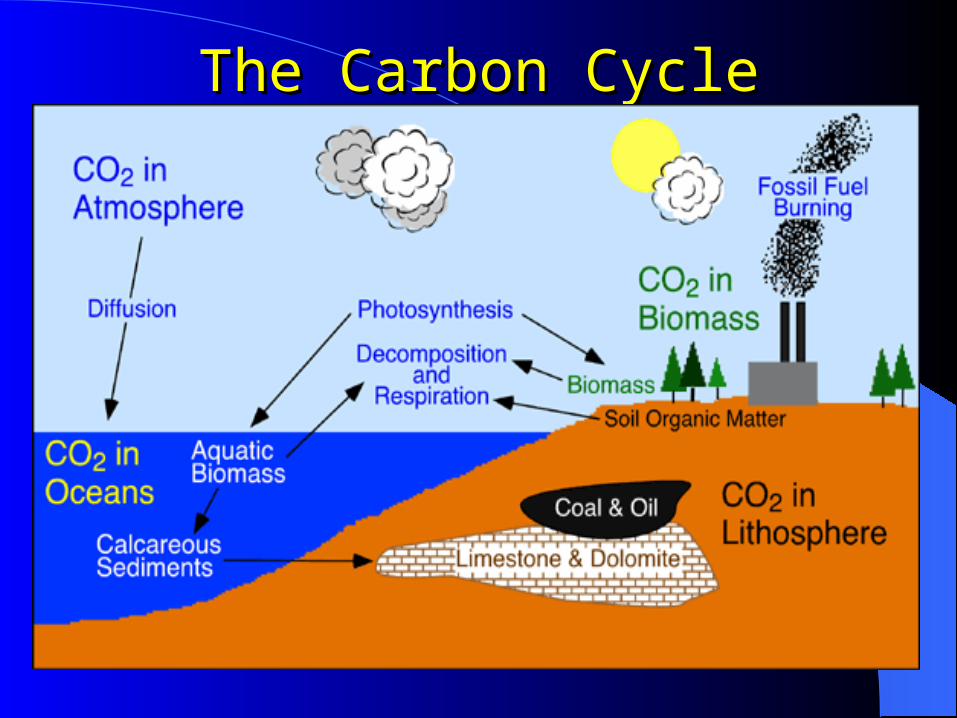
The Carbon CycleThe Carbon Cycle
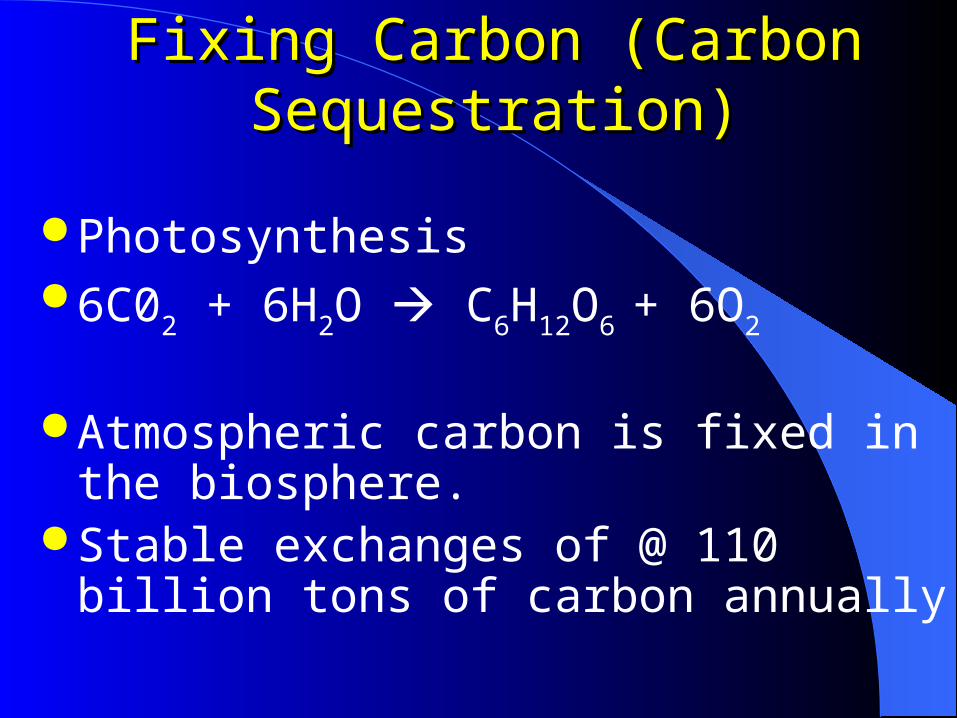
Fixing Carbon (Carbon Fixing Carbon (Carbon Sequestration)Sequestration)
Photosynthesis 6C02 + 6H2O C6H12O6 + 6O2
Atmospheric carbon is fixed in the
biosphere. Stable exchanges of @ 110 billion tons of
carbon annually
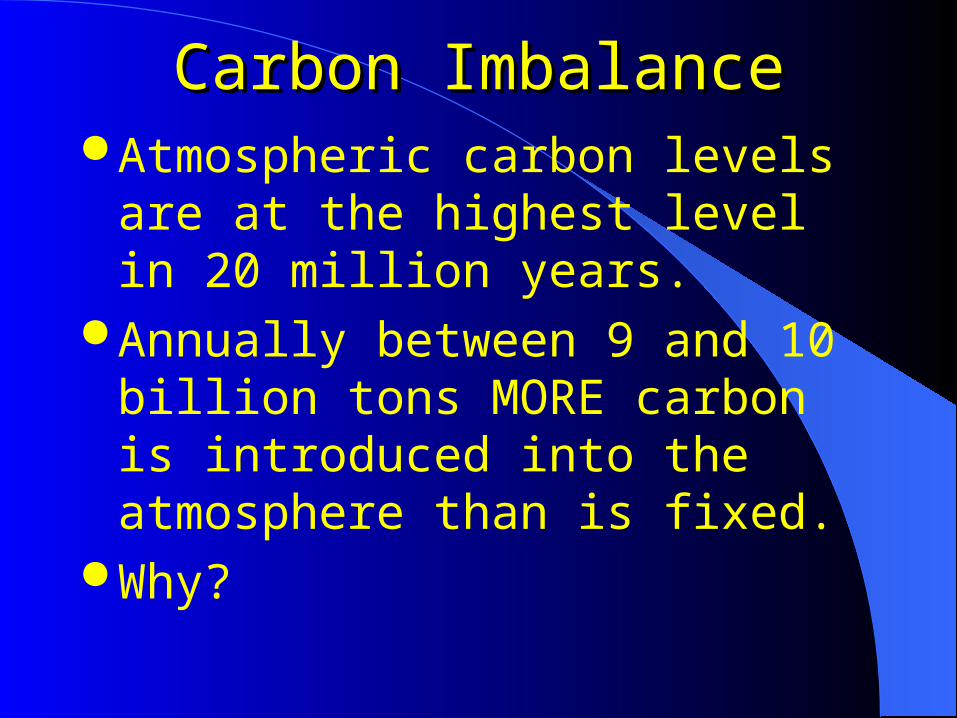
Carbon ImbalanceCarbon Imbalance Atmospheric carbon levels are at the
highest level in 20 million years. Annually between 9 and 10 billion tons
MORE carbon is introduced into the atmosphere than is fixed.
Why?
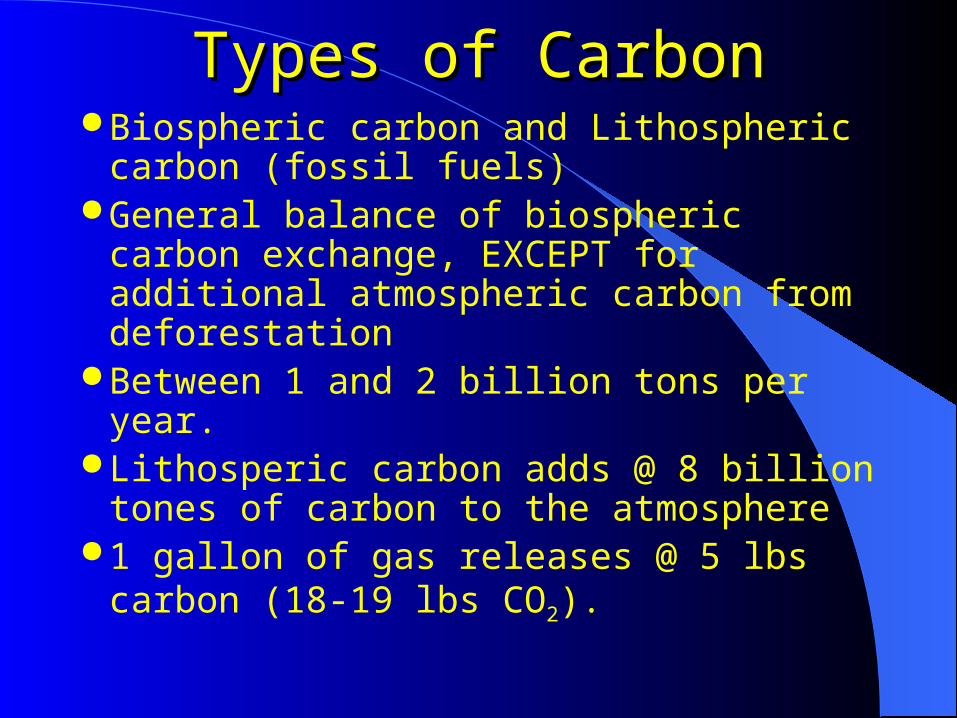
Types of CarbonTypes of Carbon Biospheric carbon and Lithospheric
carbon (fossil fuels) General balance of biospheric carbon
exchange, EXCEPT for additional atmospheric carbon from deforestation
Between 1 and 2 billion tons per year. Lithosperic carbon adds @ 8 billion
tones of carbon to the atmosphere 1 gallon of gas releases @ 5 lbs carbon
(18-19 lbs CO2).
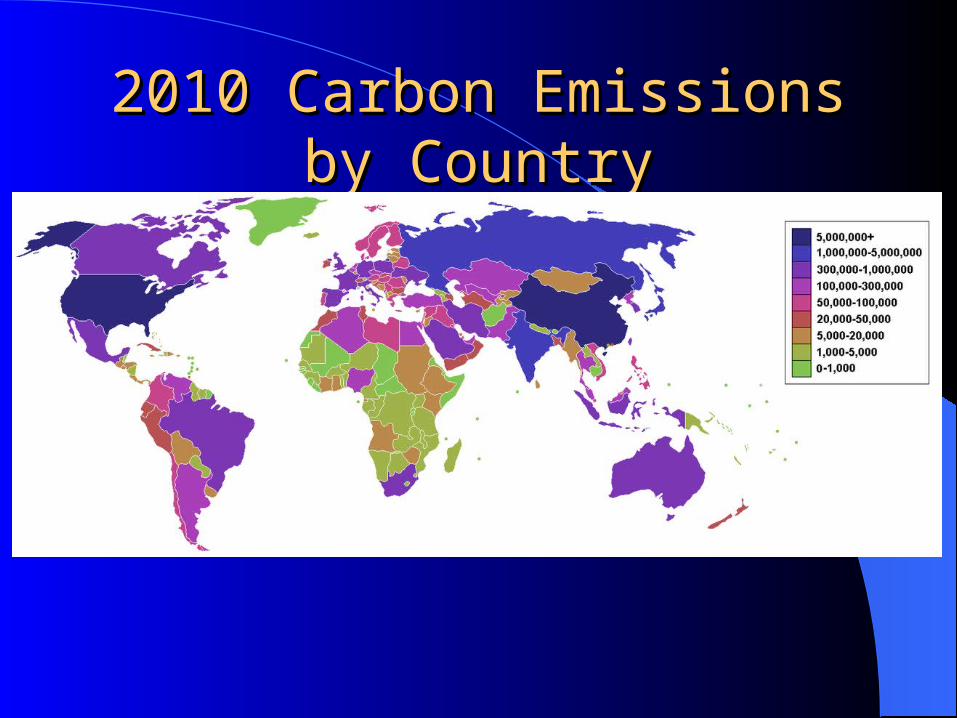
2010 Carbon Emissions by 2010 Carbon Emissions by CountryCountry
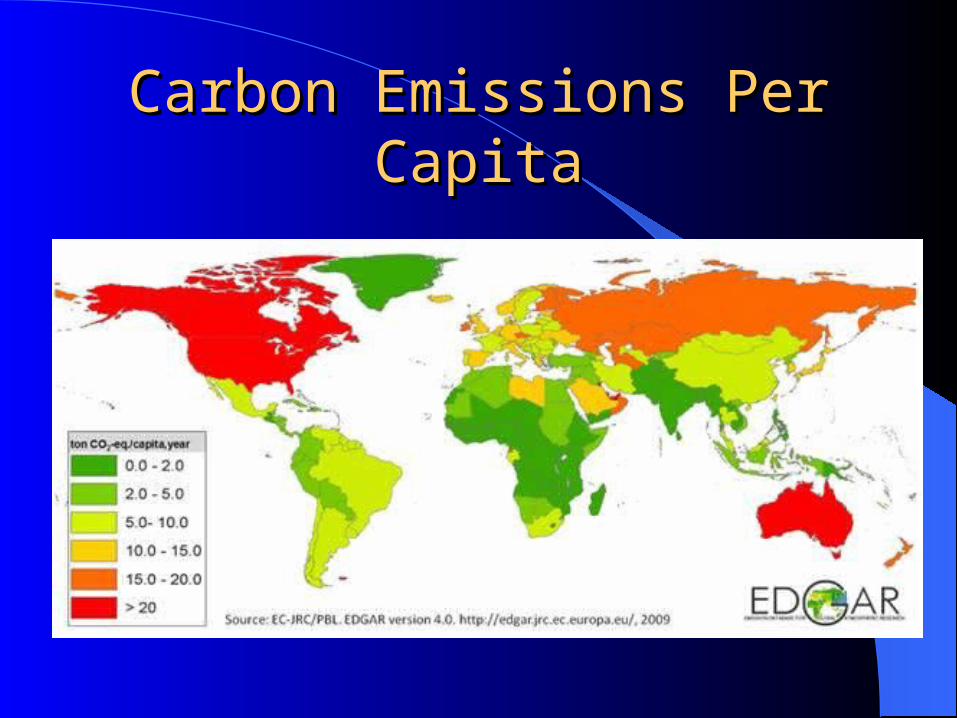
Carbon Emissions Per CapitaCarbon Emissions Per Capita
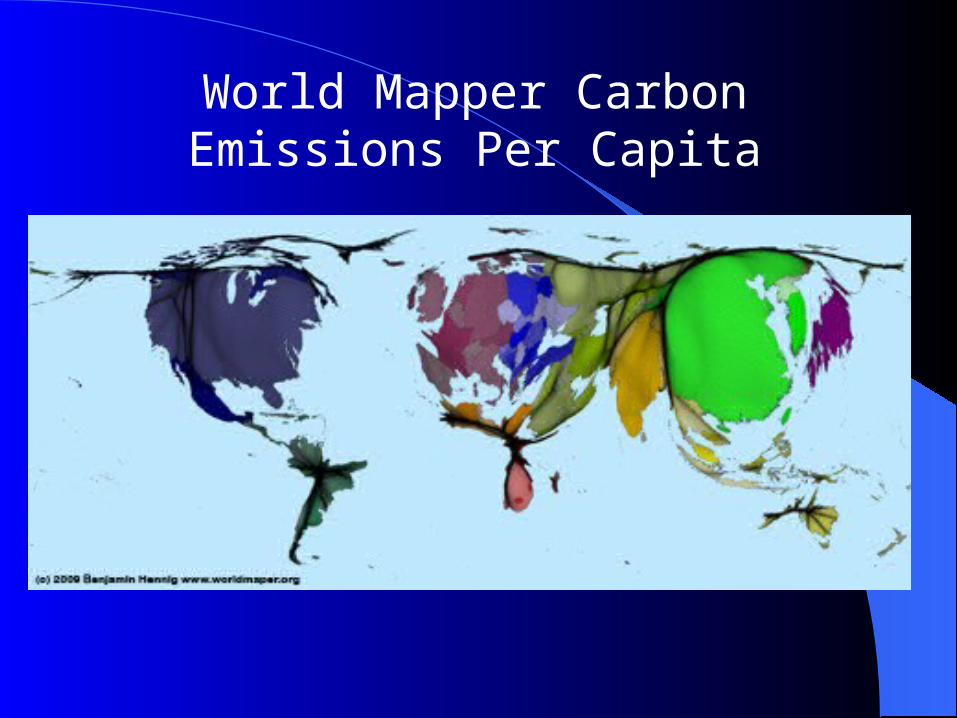
World Mapper Carbon Emissions Per Capita
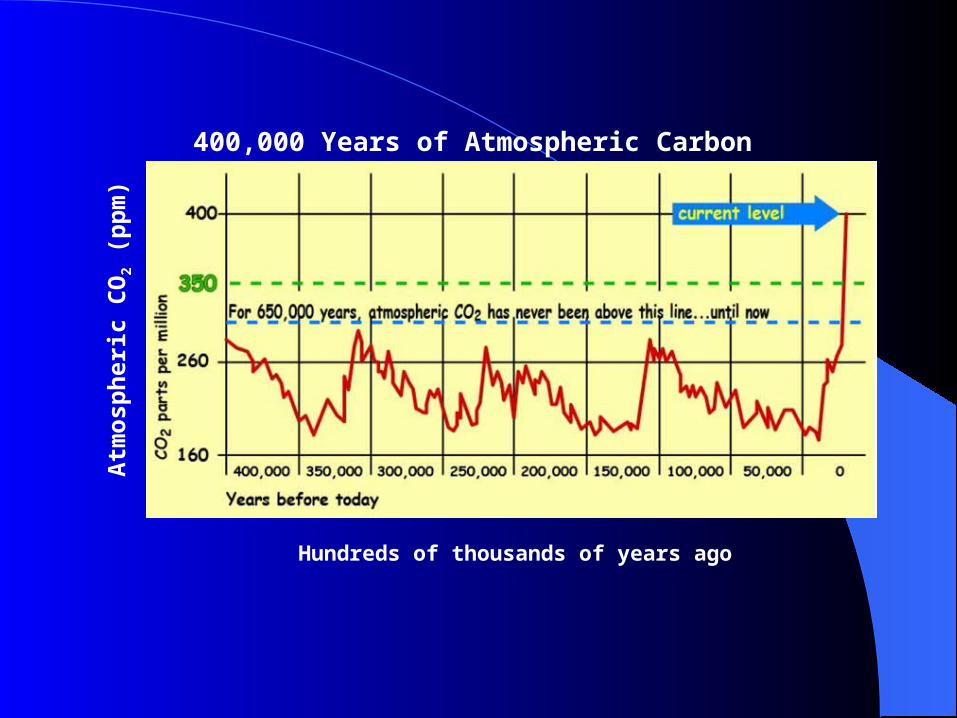
Hundreds of thousands of years ago
400,000 Years of Atmospheric Carbon Dioxide DataA
tmo
sph
eric
CO
2 (p
pm
)
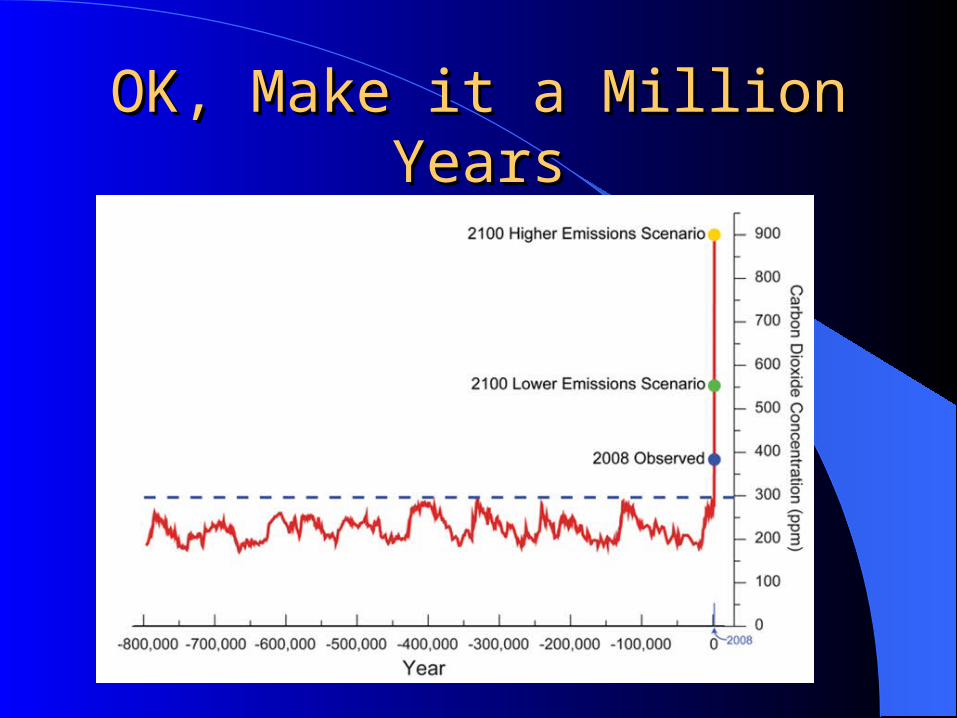
OK, Make it a Million YearsOK, Make it a Million Years
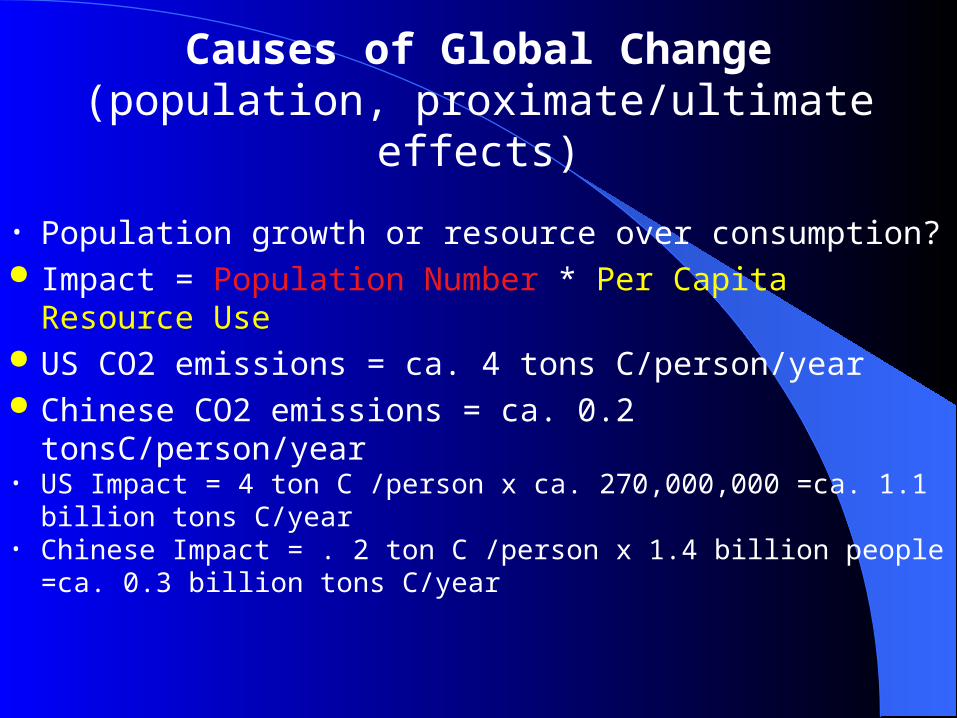
Causes of Global Change(population, proximate/ultimate effects)
• Population growth or resource over consumption? Impact = Population Number * Per Capita Resource Use US CO2 emissions = ca. 4 tons C/person/year Chinese CO2 emissions = ca. 0.2 tonsC/person/year• US Impact = 4 ton C /person x ca. 270,000,000 =ca. 1.1 billion tons
C/year• Chinese Impact = . 2 ton C /person x 1.4 billion people =ca. 0.3
billion tons C/year
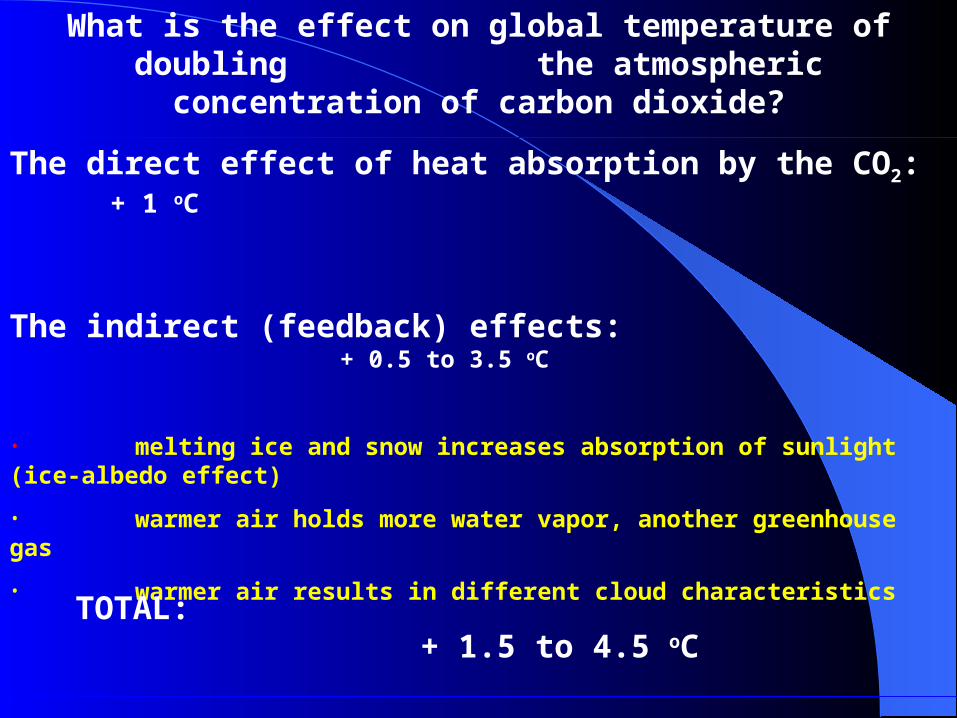
What is the effect on global temperature of doubling the atmospheric concentration of carbon dioxide?
The direct effect of heat absorption by the CO2: + 1 oC
The indirect (feedback) effects: + 0.5 to 3.5 oC
• melting ice and snow increases absorption of sunlight (ice-albedo effect)
• warmer air holds more water vapor, another greenhouse gas
• warmer air results in different cloud characteristics
TOTAL: + 1.5 to 4.5 oC
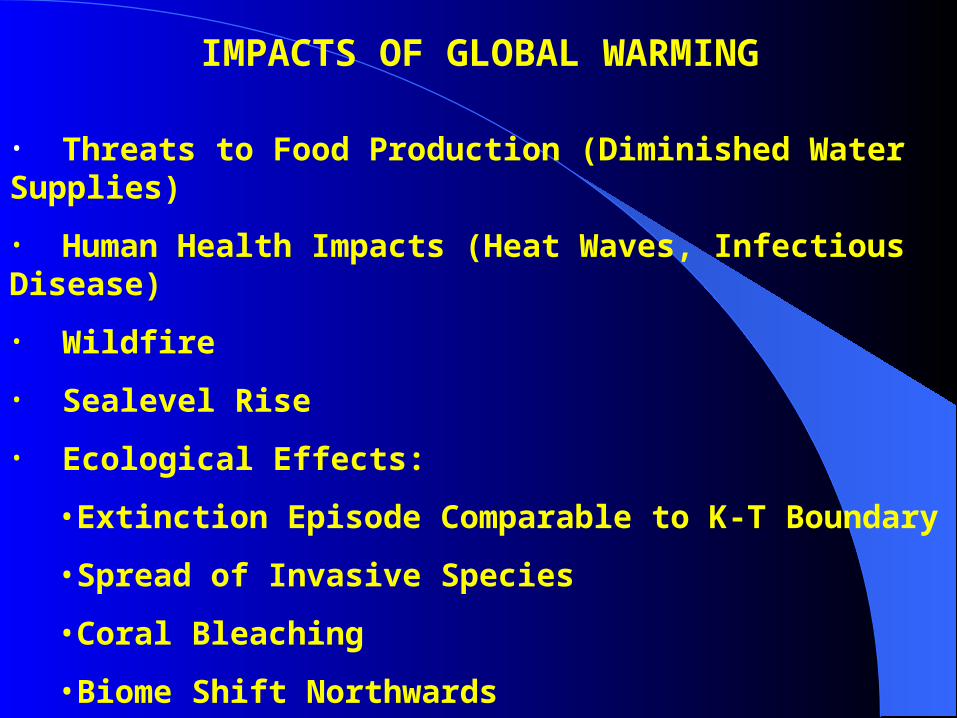
IMPACTS OF GLOBAL WARMING
• Threats to Food Production (Diminished Water Supplies)
• Human Health Impacts (Heat Waves, Infectious Disease)
• Wildfire
• Sealevel Rise
• Ecological Effects:
•Extinction Episode Comparable to K-T Boundary
•Spread of Invasive Species
•Coral Bleaching
•Biome Shift Northwards
•Climate Hot Map
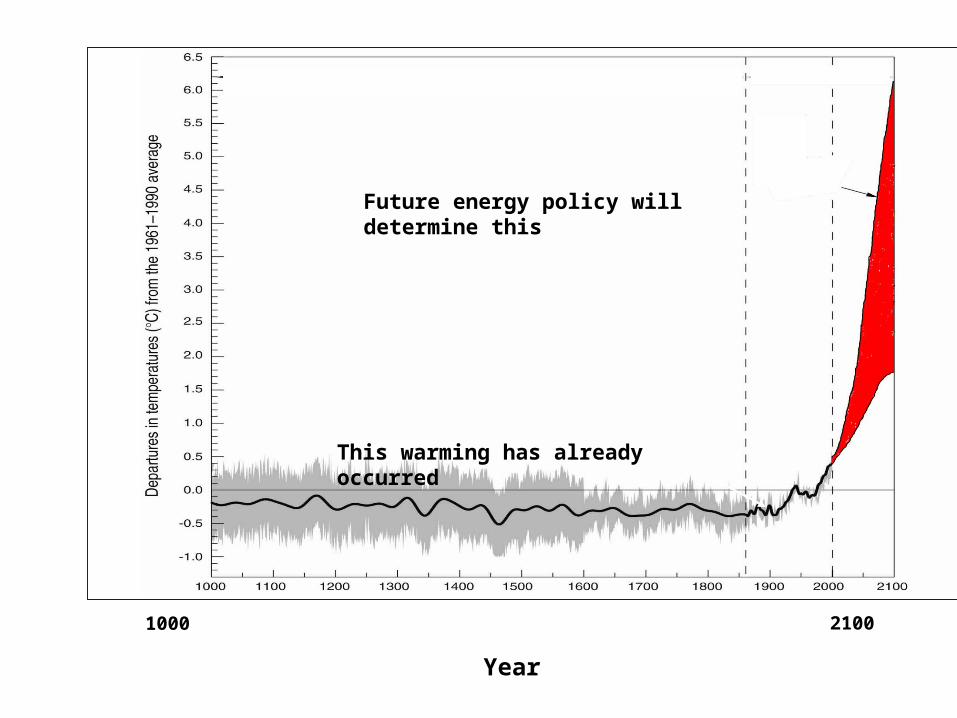
Future energy policy will determine this
This warming has already occurred
1000 2100
Year
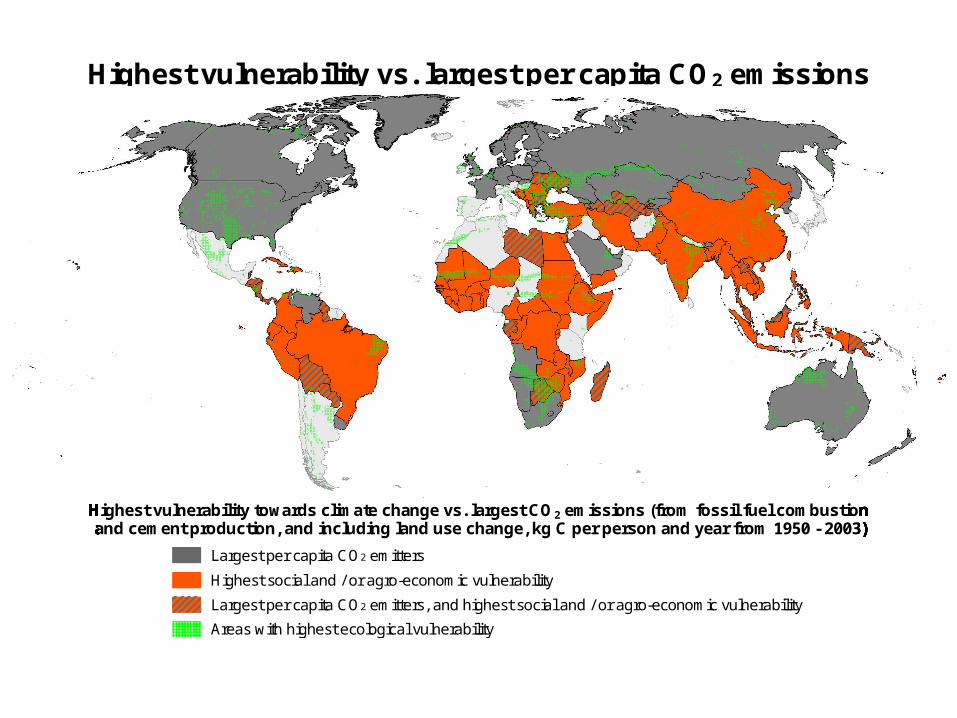
Largest per capita CO2 emitters
Highest social and / or agro-economic vulnerability
Largest per capita CO2 emitters, and highest social and / or agro-economic vulnerability
Areas with highest ecological vulnerability
Highest vulnerability towards climate change vs. largest CO2 emissions (from fossil fuel combustion and cement production, and including land use change, kg C per person and year from 1950 - 2003)
Highest vulnerability vs. largest per capita CO2 emissions
Highest social and / or agro-economic vulnerability
Largest per capita CO2 emitters, and highest social and / or agro-economic vulnerability
Areas with highest ecological vulnerability
Highest vulnerability towards climate change vs. largest CO2 emissions (from fossil fuel combustion and cement production, and including land use change, kg C per person and year from 1950 - 2003)
Largest per capita CO2 emitters
Highest social and / or agro-economic vulnerability
Largest per capita CO2 emitters, and highest social and / or agro-economic vulnerability
Areas with highest ecological vulnerability
Highest vulnerability towards climate change vs. largest CO2 emissions (from fossil fuel combustion and cement production, and including land use change, kg C per person and year from 1950 - 2003)
Largest per capita CO2 emitters
Highest social and / or agro-economic vulnerability
Largest per capita CO2 emitters, and highest social and / or agro-economic vulnerability
Areas with highest ecological vulnerability
Highest vulnerability towards climate change vs. largest CO2 emissions (from fossil fuel combustion and cement production, and including land use change, kg C per person and year from 1950 - 2003)
Largest per capita CO2 emitters
Highest social and / or agro-economic vulnerability
Largest per capita CO2 emitters, and highest social and / or agro-economic vulnerability
Areas with highest ecological vulnerability
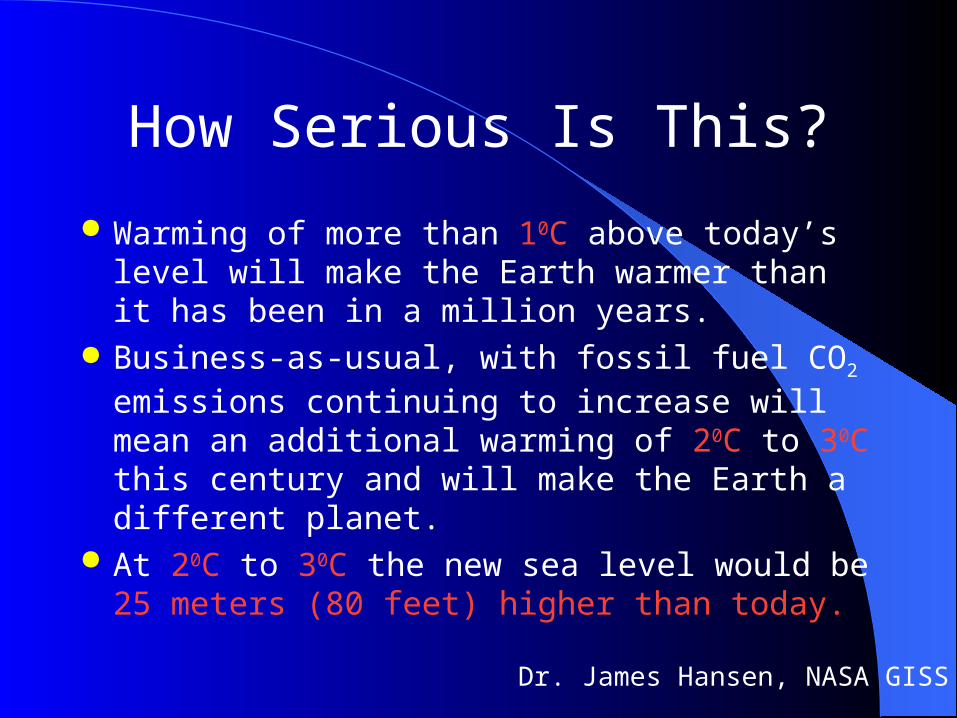
Dr. James Hansen, NASA GISS
How Serious Is This?
Warming of more than 10C above today’s level will make the Earth warmer than it has been in a million years.
Business-as-usual, with fossil fuel CO2 emissions continuing to increase will mean an additional warming of 20C to 30C this century and will make the Earth a different planet.
At 20C to 30C the new sea level would be 25 meters (80 feet) higher than today.
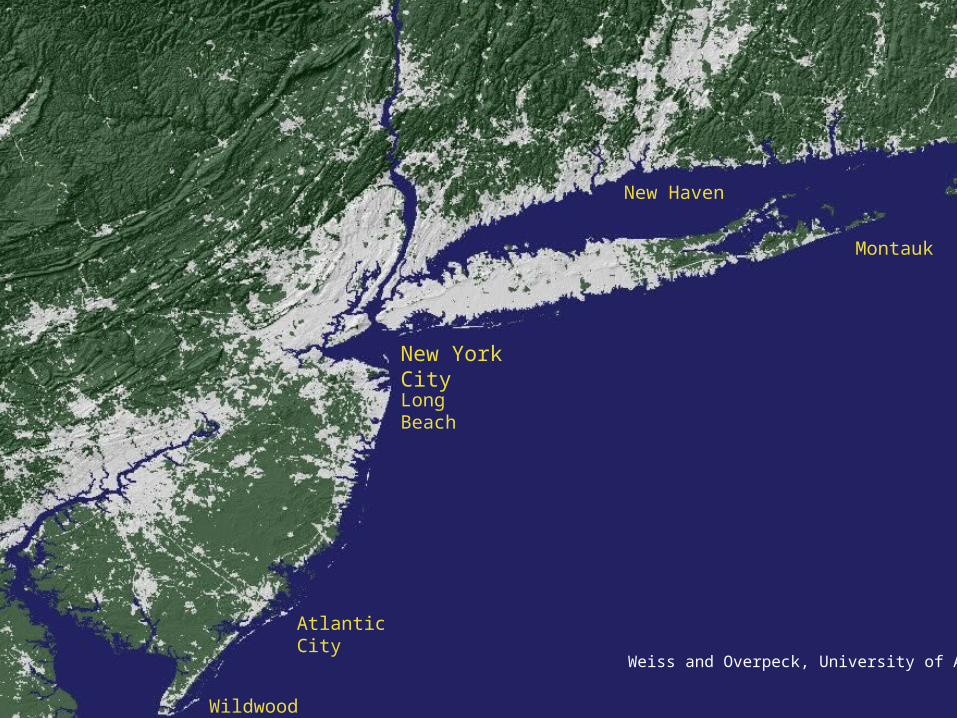
New York City
Long Beach
Atlantic City
Wildwood
Montauk
New Haven
Weiss and Overpeck, University of Arizona
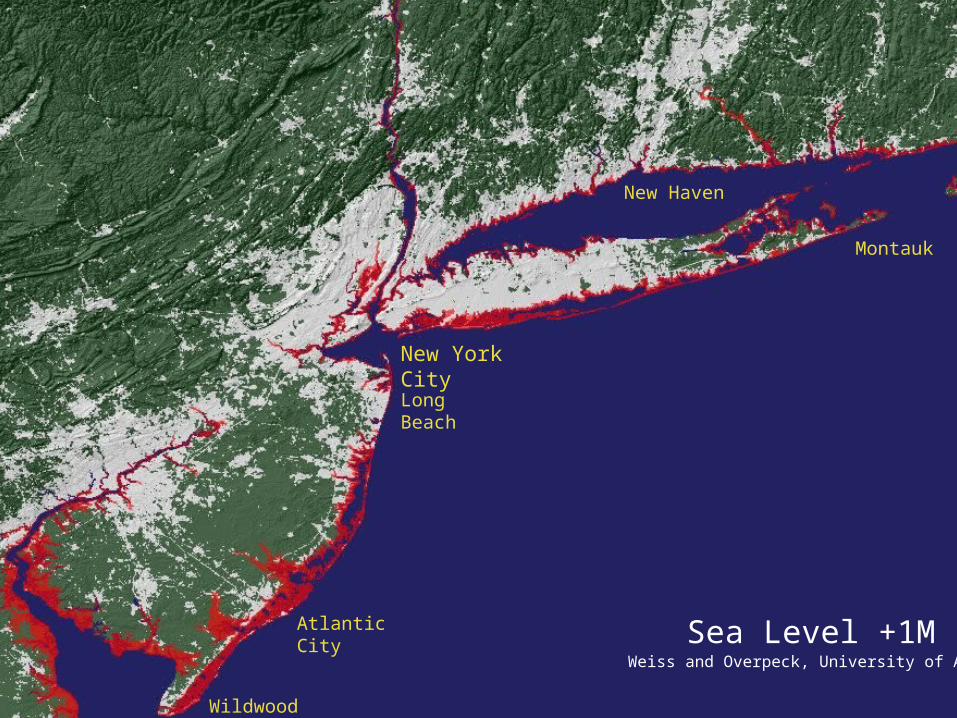
Sea Level +1M
New York City
Long Beach
Atlantic City
Wildwood
Montauk
New Haven
Weiss and Overpeck, University of Arizona
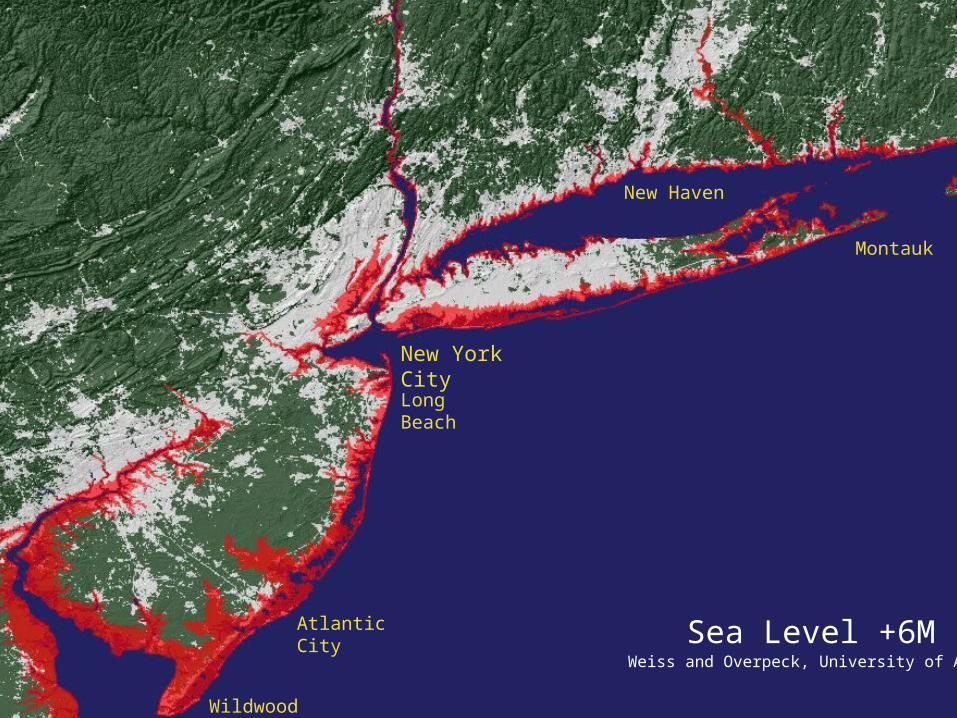
Sea Level +6M
New York City
Long Beach
Atlantic City
Wildwood
Montauk
New Haven
Weiss and Overpeck, University of Arizona
Virginia Beach
Norfolk
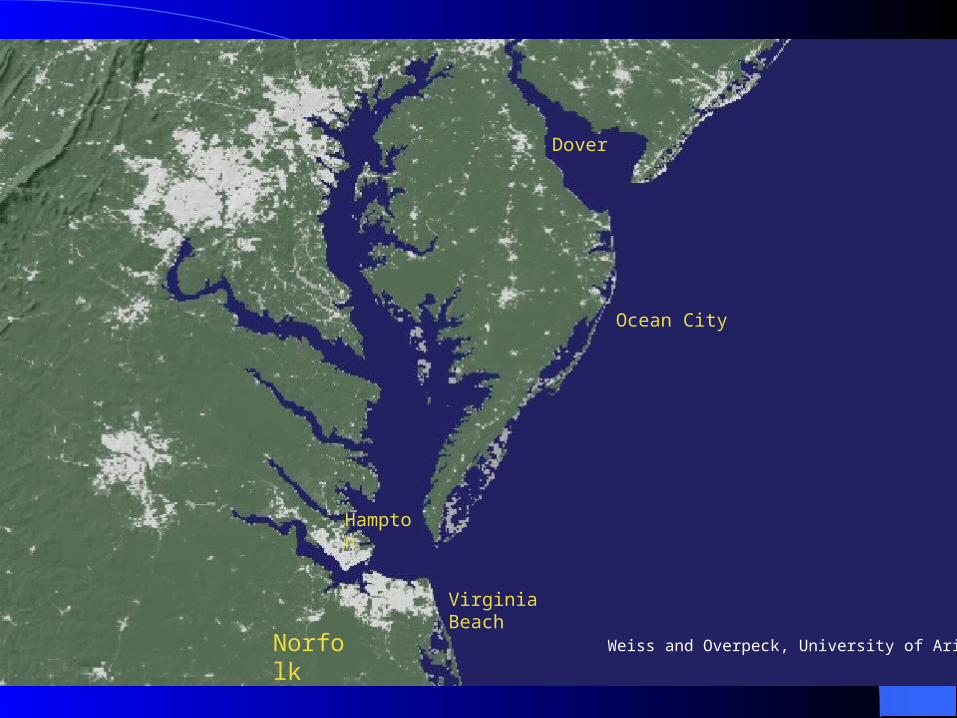
Ocean City
Hampton
Dover
Weiss and Overpeck, University of Arizona
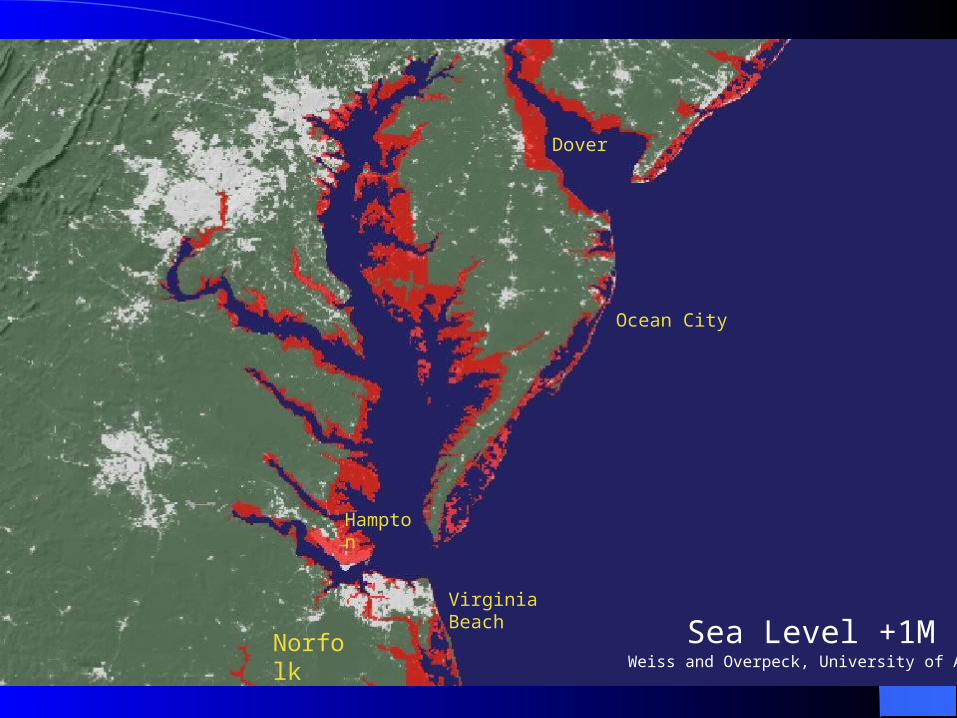
Virginia Beach
Norfolk
Ocean City
Hampton
Dover
Sea Level +1MWeiss and Overpeck, University of Arizona
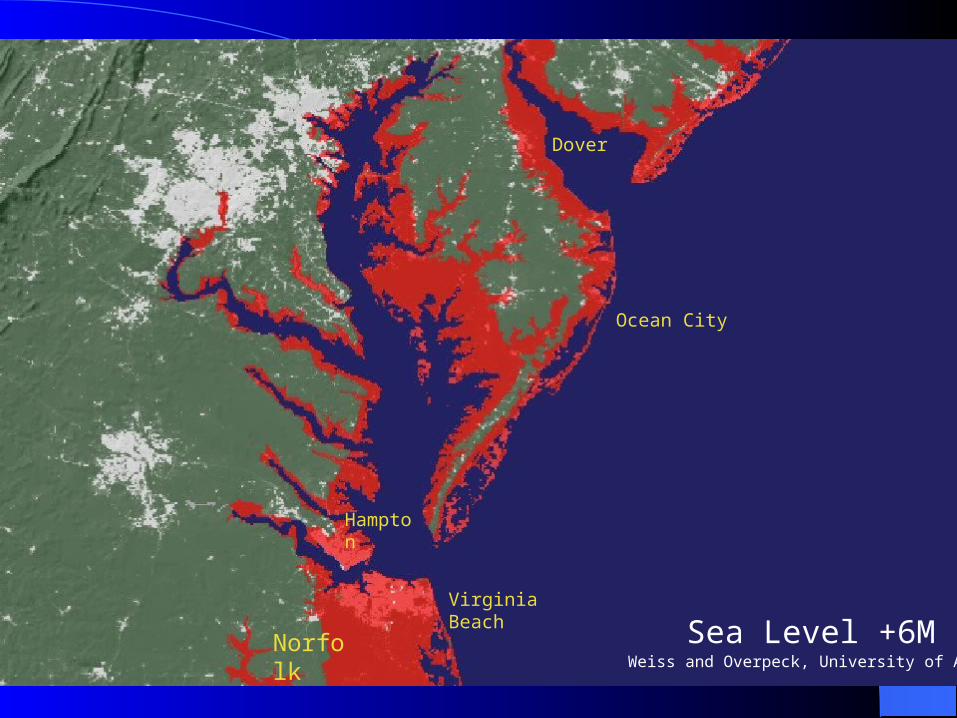
Virginia Beach
Norfolk
Ocean City
Hampton
Dover
Sea Level +6MWeiss and Overpeck, University of Arizona
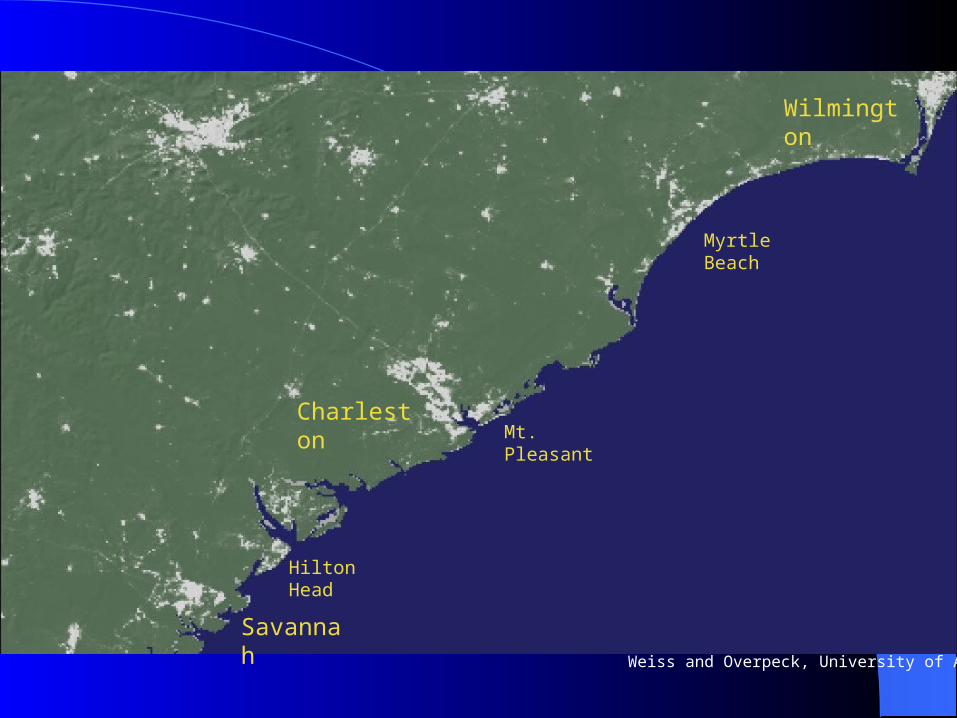
Wilmington
Myrtle Beach
Charleston Mt.
Pleasant
Hilton Head
Savannah Weiss and Overpeck, University of Arizona
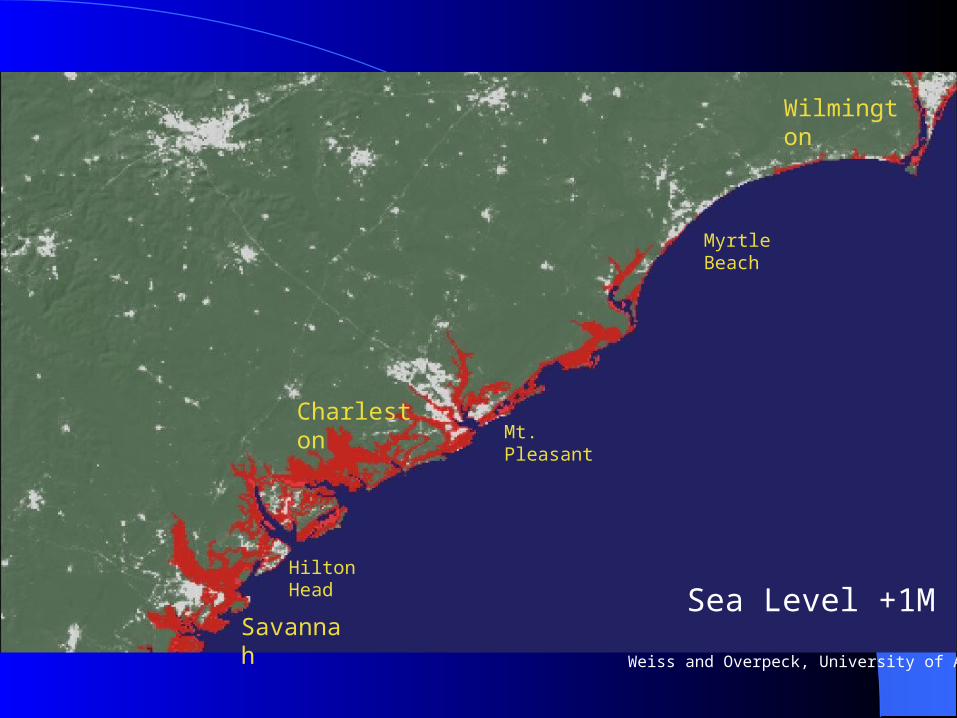
Wilmington
Myrtle Beach
Charleston Mt.
Pleasant
Hilton Head
Savannah
Sea Level +1M
Weiss and Overpeck, University of Arizona
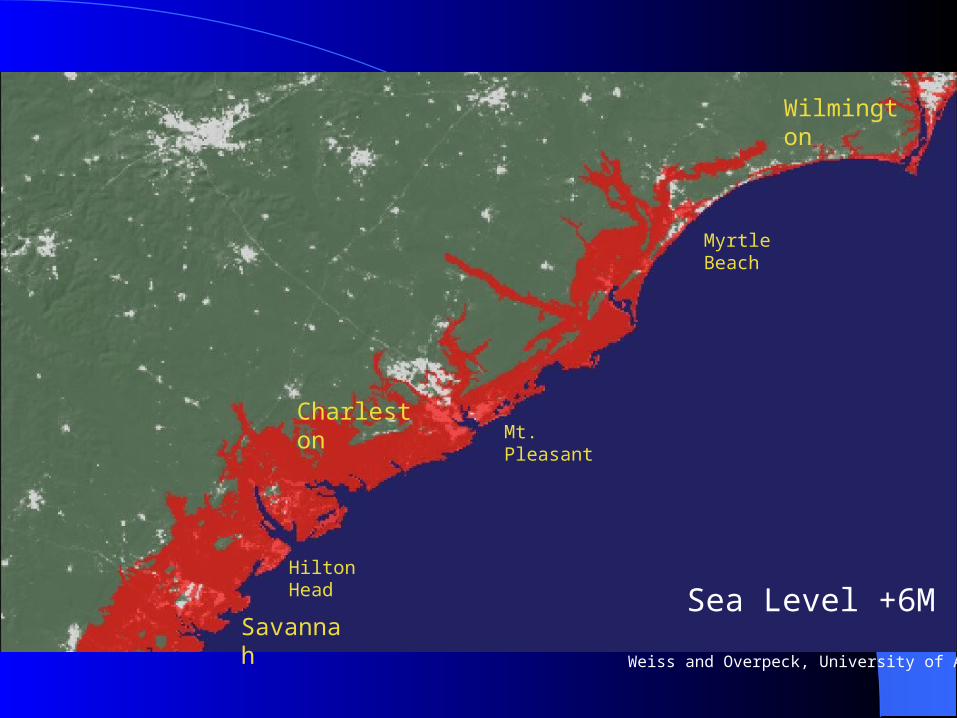
Wilmington
Myrtle Beach
Charleston Mt.
Pleasant
Hilton Head
Savannah
Sea Level +6M
Weiss and Overpeck, University of Arizona
Ft. Lauderdale
Daytona Beach
Jacksonville
St. Petersburg
Fort Meyers
Panama City
Miami
Weiss and Overpeck, University of Arizona
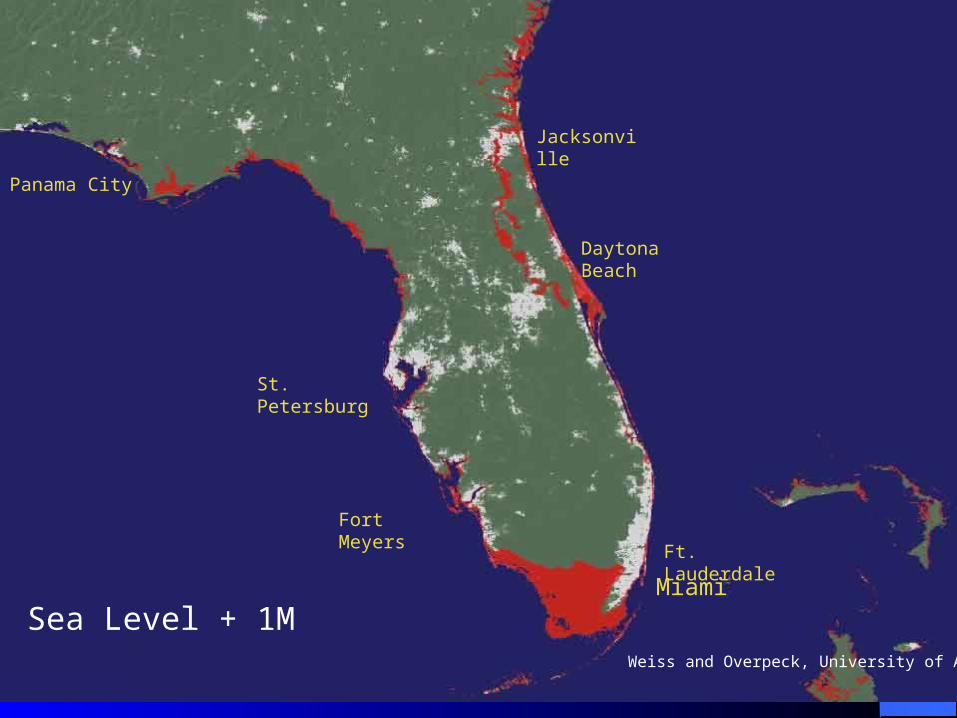
Sea Level + 1MMiami
Ft. Lauderdale
Daytona Beach
Jacksonville
St. Petersburg
Fort Meyers
Panama City
Weiss and Overpeck, University of Arizona
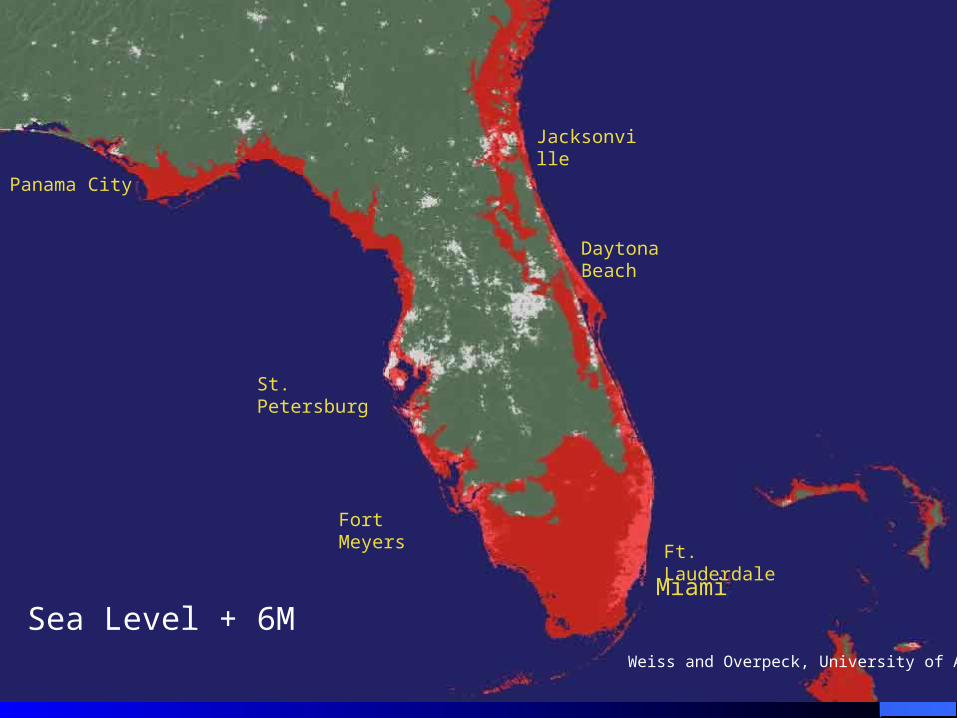
Sea Level + 6MMiami
Ft. Lauderdale
Daytona Beach
Jacksonville
St. Petersburg
Fort Meyers
Panama City
Weiss and Overpeck, University of Arizona
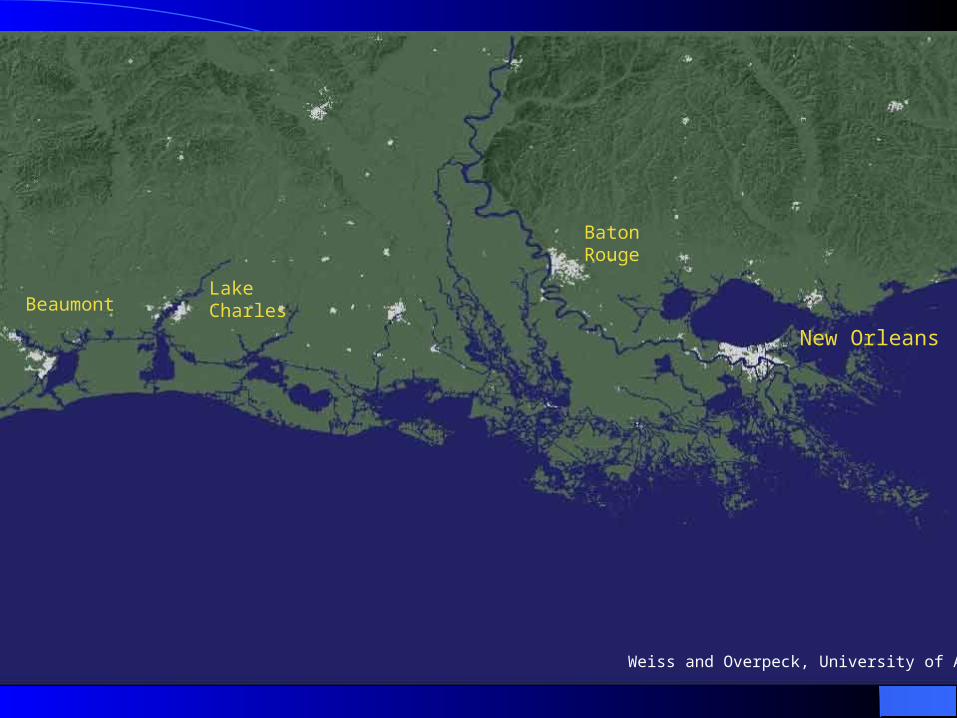
New Orleans
Lake CharlesBeaumont
Baton Rouge
Weiss and Overpeck, University of Arizona
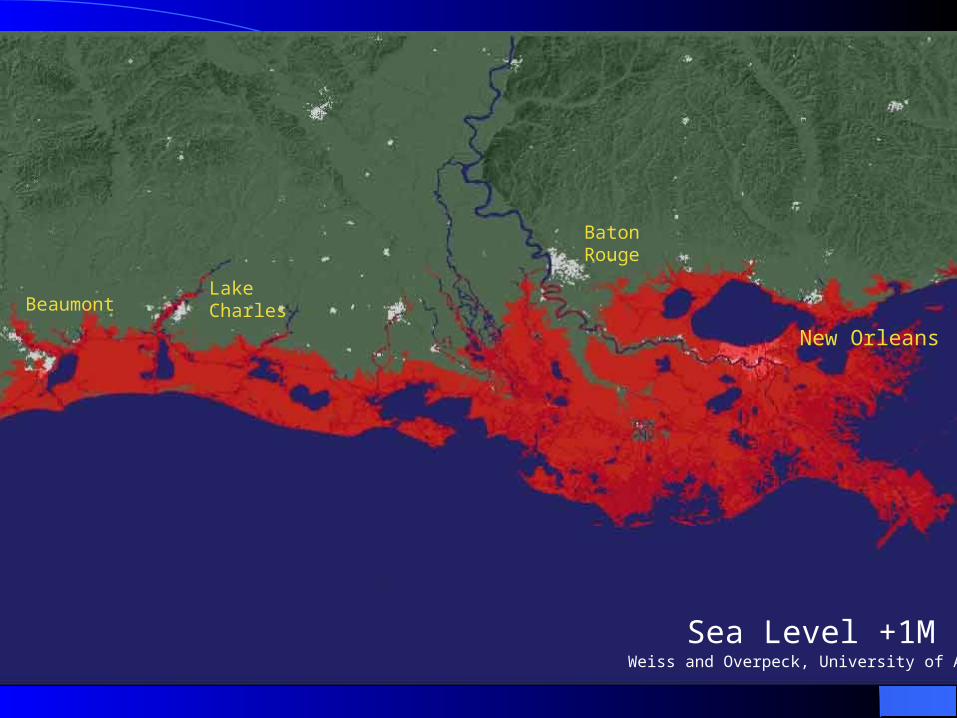
Sea Level +1M
New Orleans
Lake CharlesBeaumont
Baton Rouge
Weiss and Overpeck, University of Arizona
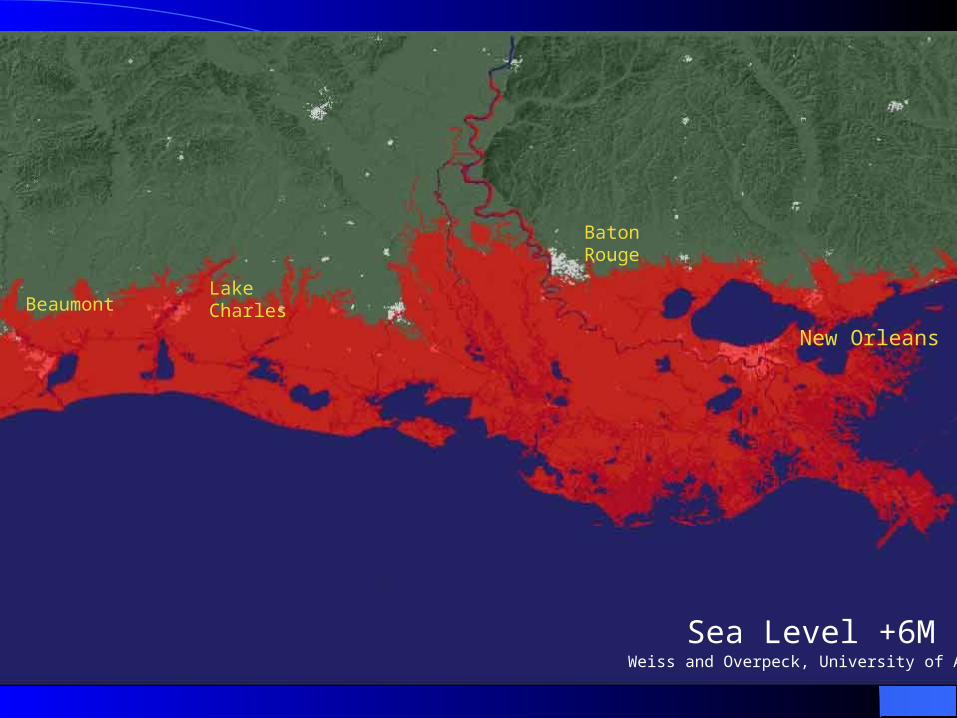
Sea Level +6M
New Orleans
Lake CharlesBeaumont
Baton Rouge
Weiss and Overpeck, University of Arizona