atmospheric mercury deposition impacts of future electric
TRANSCRIPT

Mercury in the Great Lakes RegionSponsored by the Commission for Environmental Cooperation’s
Environment, Economy and Trade and Pollutants and Health Programsin cooperation with the Binational Toxic Strategy
Wednesday December 17th, 2003Hyatt Regency Chicago
Atmospheric Mercury Deposition Impactsof Future Electric Power Generation
Mark D. CohenPhysical Scientist,
NOAA Air Resources LaboratorySilver Spring, Maryland,USA
Paul J. MillerProgram Coordinator, Air Quality
Commission for Environmental Cooperation*Montreal, Quebec, Canada
Presentation at
* This presentation was developed for discussion purposes. The opinions, views or other information contained herein do not necessarily reflect the views of the CEC, Canada, Mexico or the United States.
Outline
Emissions Scenarios
“Receptors” Studied
Results
Atmospheric Modeling
Outline
Emissions Scenarios
“Receptors” Studied
Results
Atmospheric Modeling
Current:1999 data
(U.S. EPA)
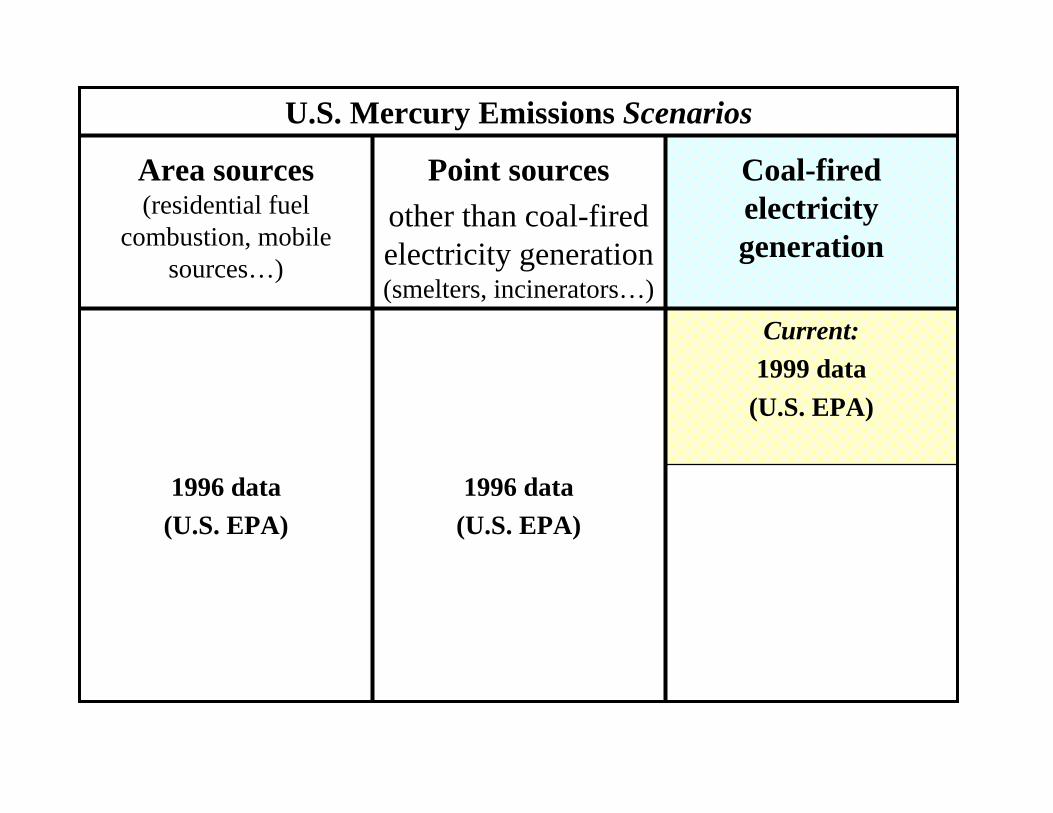
U.S. Mercury Emissions Scenarios
1996 data(U.S. EPA)
1996 data(U.S. EPA)
Coal-fired electricity generation
Point sourcesother than coal-fired electricity generation (smelters, incinerators…)
Area sources(residential fuel
combustion, mobile sources…)
Current:1999 data
(U.S. EPA)
Future:2020 Projected Baseline
(U.S. EPA)
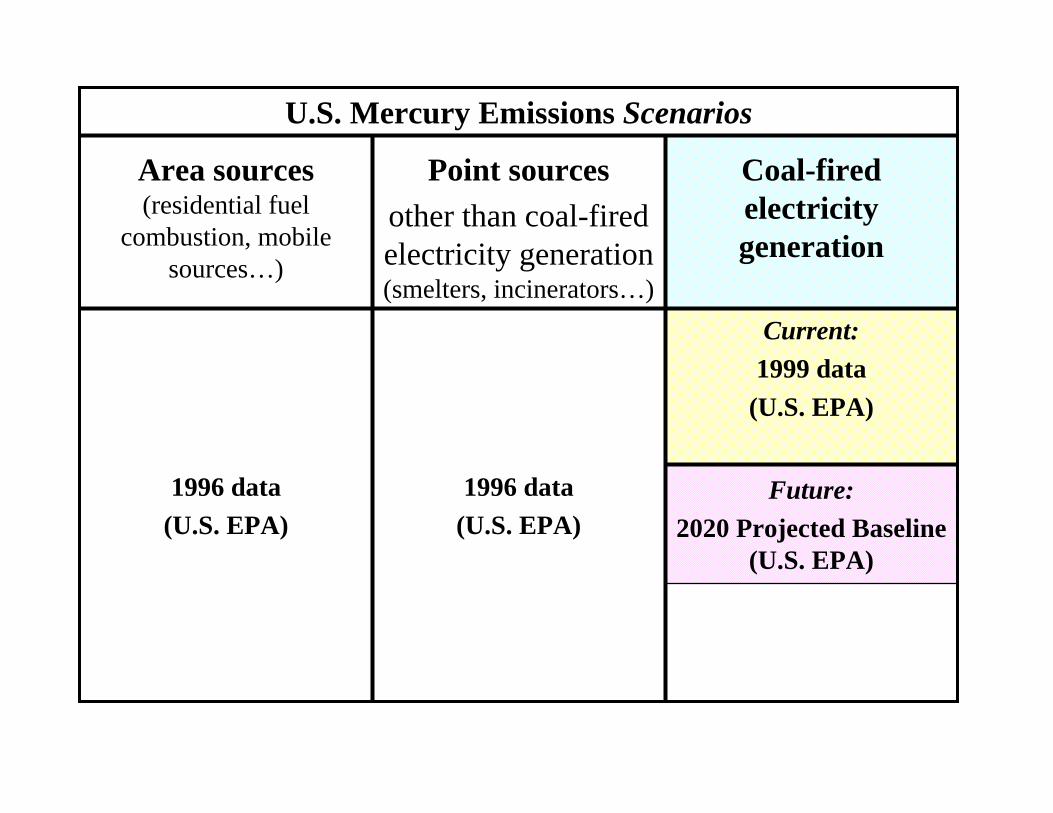
U.S. Mercury Emissions Scenarios
1996 data(U.S. EPA)
1996 data(U.S. EPA)
Coal-fired electricity generation
Point sourcesother than coal-fired electricity generation (smelters, incinerators…)
Area sources(residential fuel
combustion, mobile sources…)
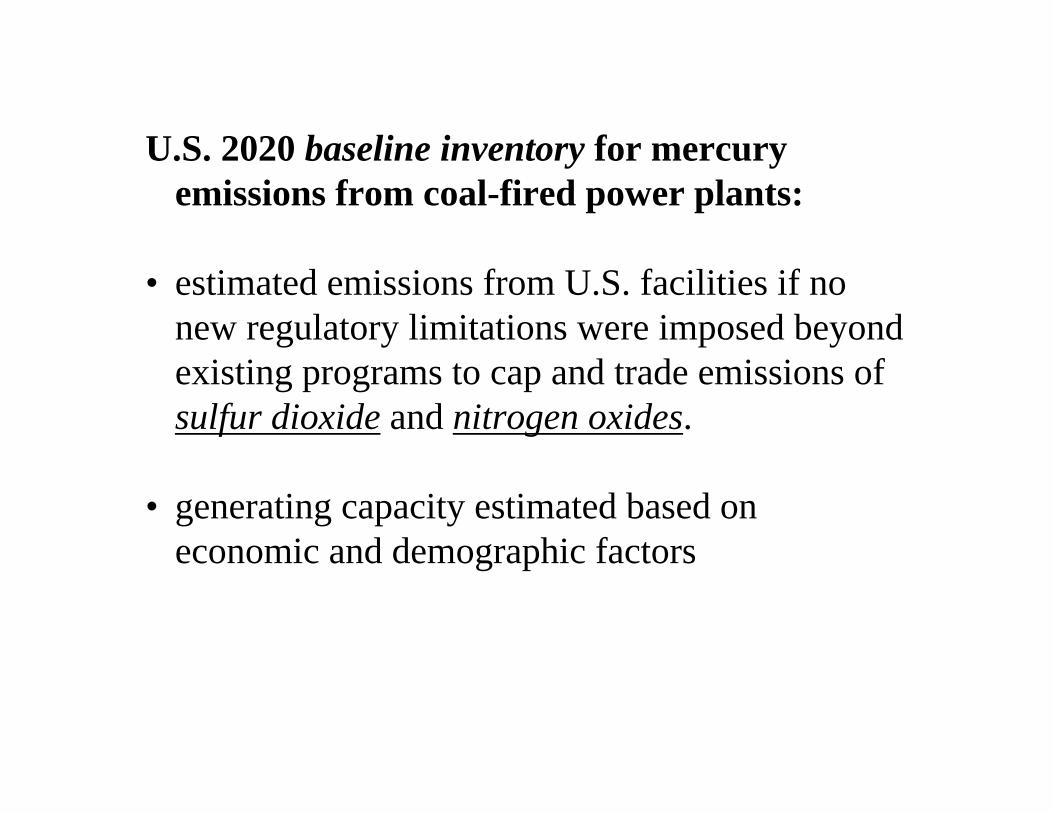
U.S. 2020 baseline inventory for mercury emissions from coal-fired power plants:
• estimated emissions from U.S. facilities if no new regulatory limitations were imposed beyond existing programs to cap and trade emissions of sulfur dioxide and nitrogen oxides.
• generating capacity estimated based on economic and demographic factors
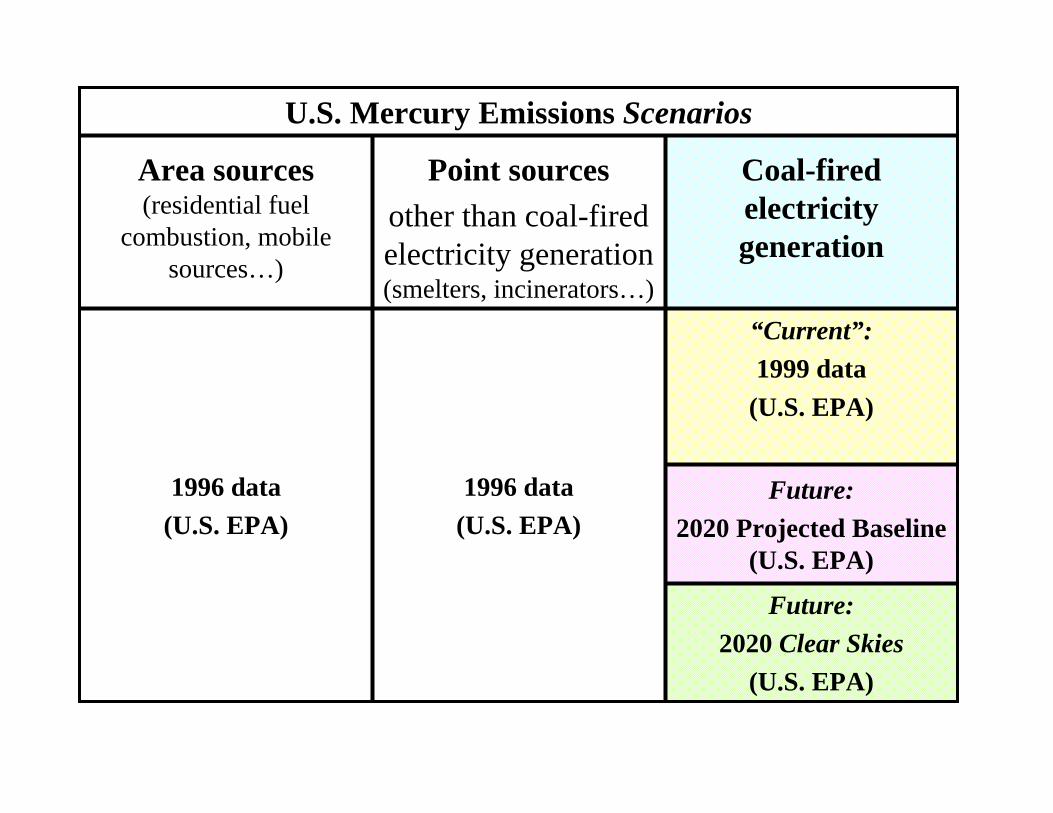
“Current”:1999 data
(U.S. EPA)
Future:2020 Projected Baseline
(U.S. EPA)
U.S. Mercury Emissions Scenarios
Future:2020 Clear Skies
(U.S. EPA)
1996 data(U.S. EPA)
1996 data(U.S. EPA)
Coal-fired electricity generation
Point sourcesother than coal-fired electricity generation (smelters, incinerators…)
Area sources(residential fuel
combustion, mobile sources…)
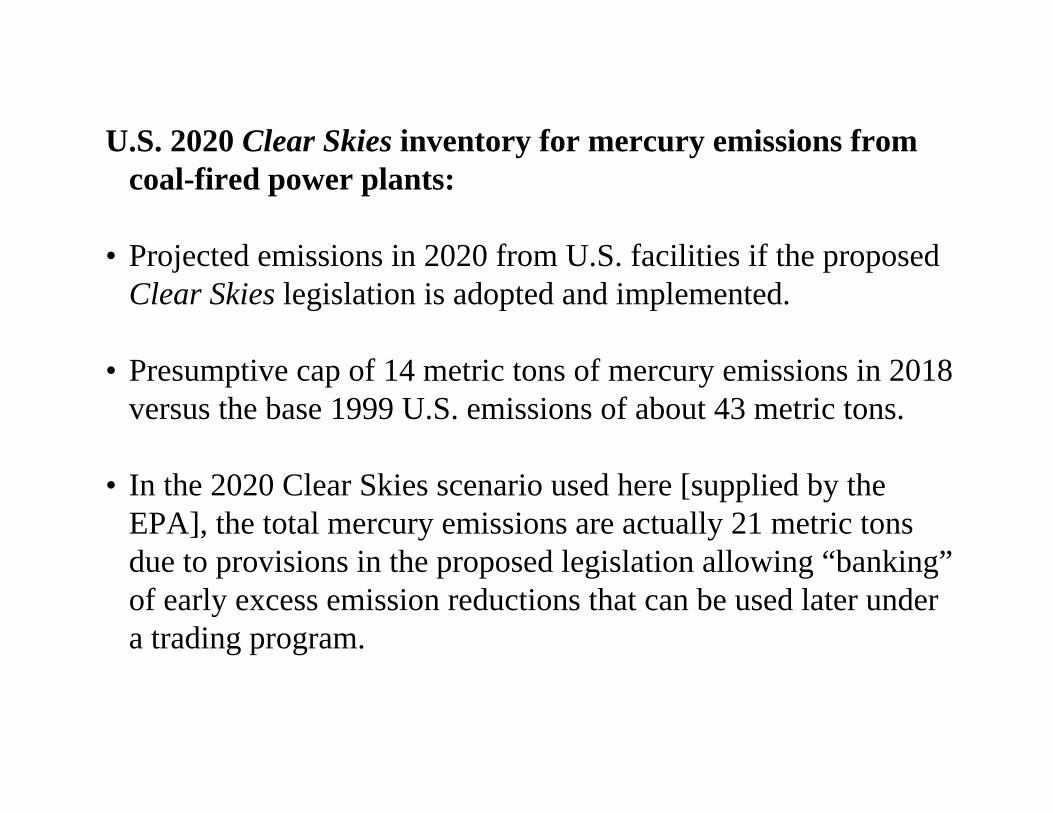
U.S. 2020 Clear Skies inventory for mercury emissions from coal-fired power plants:
• Projected emissions in 2020 from U.S. facilities if the proposedClear Skies legislation is adopted and implemented.
• Presumptive cap of 14 metric tons of mercury emissions in 2018 versus the base 1999 U.S. emissions of about 43 metric tons.
• In the 2020 Clear Skies scenario used here [supplied by the EPA], the total mercury emissions are actually 21 metric tons due to provisions in the proposed legislation allowing “banking”of early excess emission reductions that can be used later undera trading program.
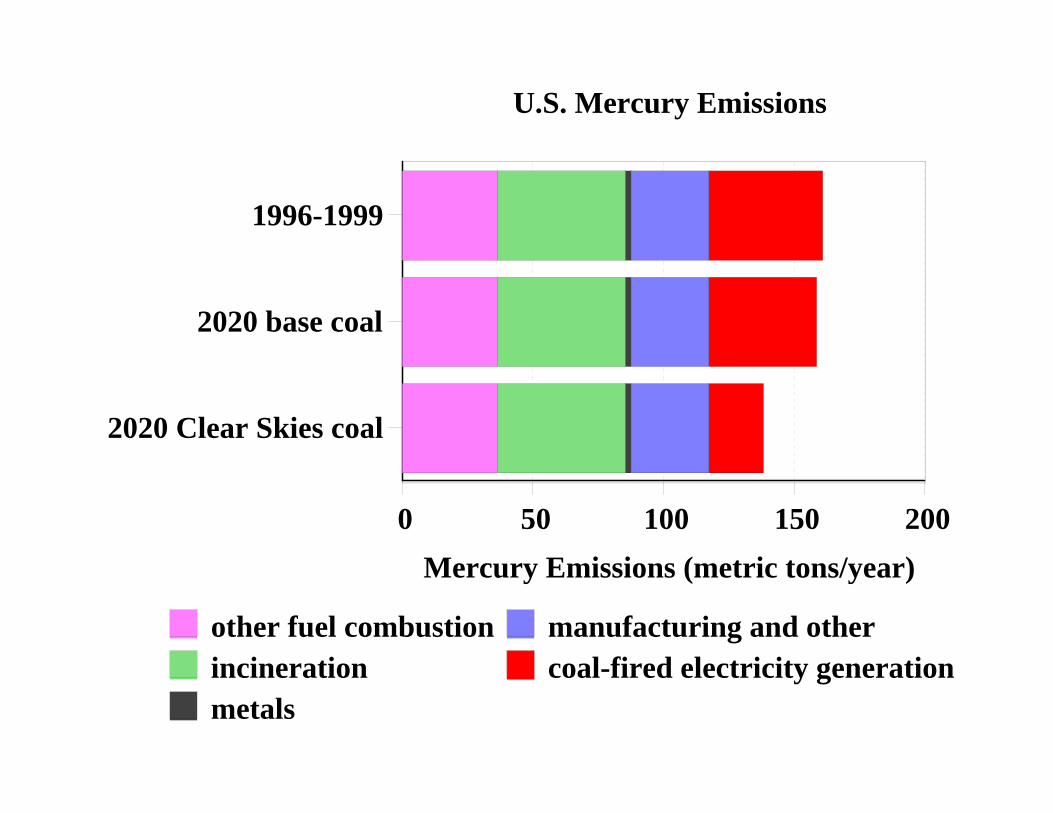
1996-1999
2020 base coal
2020 Clear Skies coal
0 50 100 150 200Mercury Emissions (metric tons/year)
other fuel combustionincinerationmetals
manufacturing and othercoal-fired electricity generation
U.S. Mercury Emissions
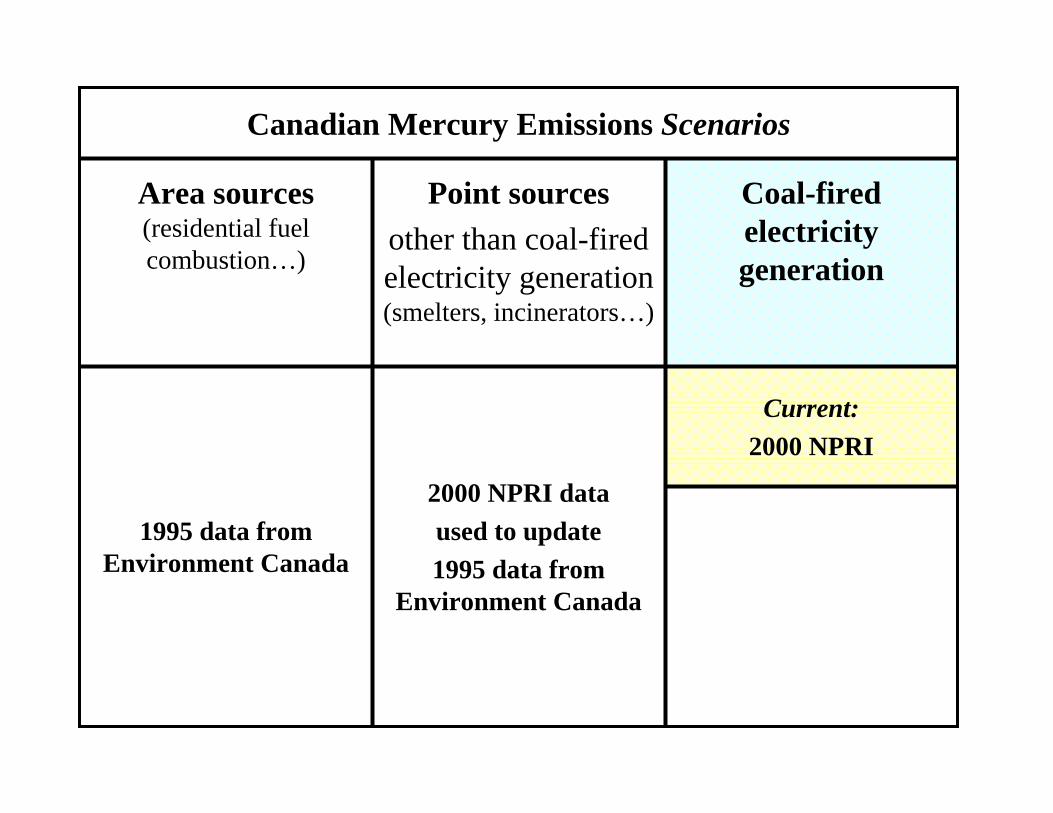
Canadian Mercury Emissions Scenarios
Current:2000 NPRI
2000 NPRI dataused to update1995 data from
Environment Canada
1995 data from Environment Canada
Coal-fired electricity generation
Point sourcesother than coal-fired electricity generation (smelters, incinerators…)
Area sources(residential fuel combustion…)
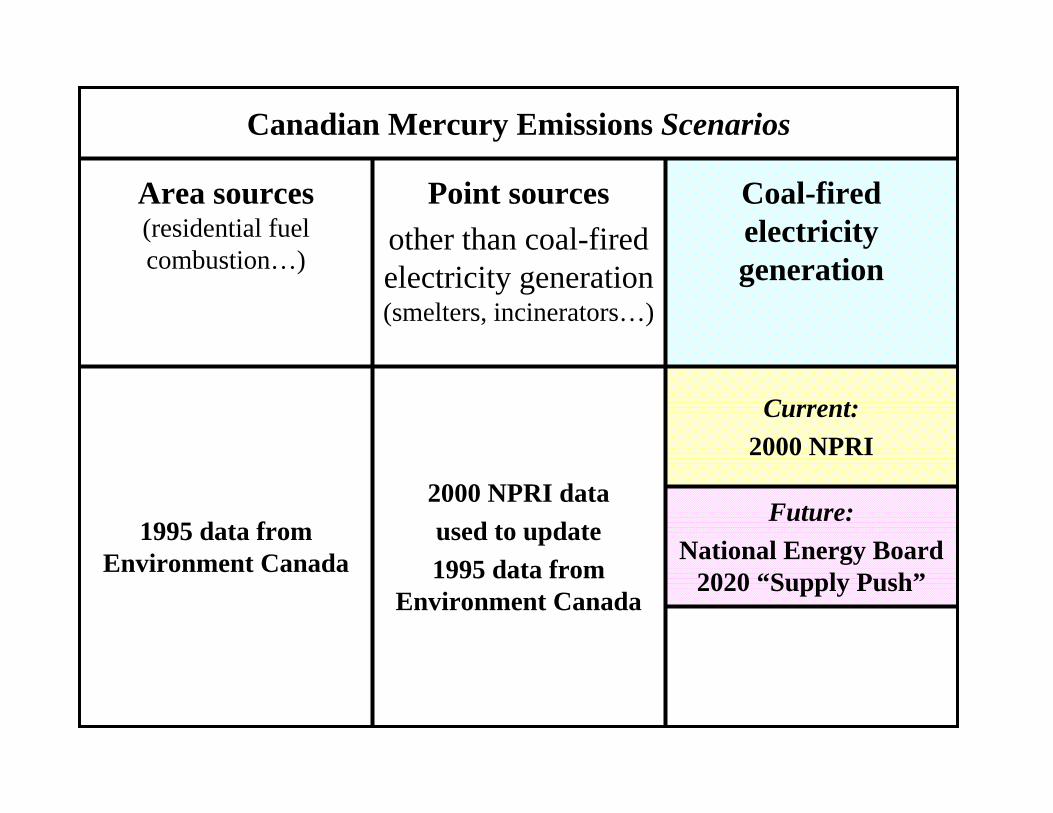
Canadian Mercury Emissions Scenarios
Future:National Energy Board
2020 “Supply Push”
Current:2000 NPRI
2000 NPRI dataused to update1995 data from
Environment Canada
1995 data from Environment Canada
Coal-fired electricity generation
Point sourcesother than coal-fired electricity generation (smelters, incinerators…)
Area sources(residential fuel combustion…)

Canadian National Energy Board 2020 Supply Push scenario for coal combustion at coal-fired power plants:
• technology advances slowly
• limited action with respect to the environment.
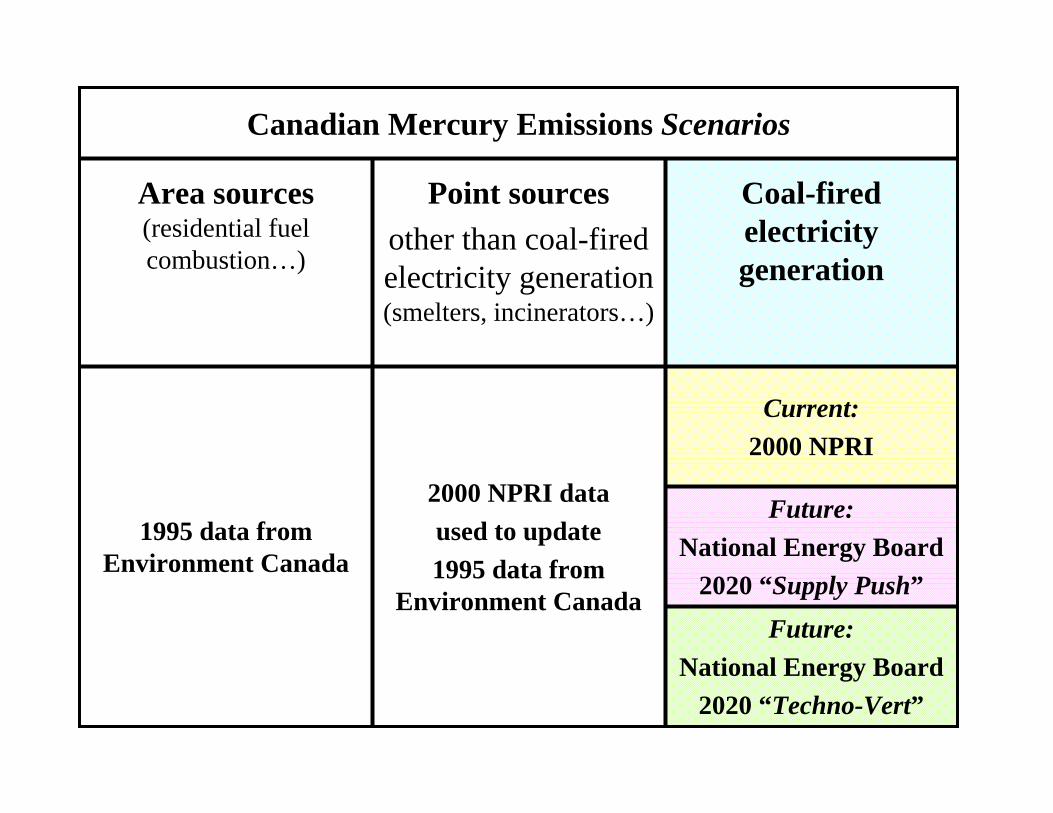
Canadian Mercury Emissions Scenarios
Future:National Energy Board
2020 “Techno-Vert”
Future:National Energy Board
2020 “Supply Push”
Current:2000 NPRI
2000 NPRI dataused to update1995 data from
Environment Canada
1995 data from Environment Canada
Coal-fired electricity generation
Point sourcesother than coal-fired electricity generation (smelters, incinerators…)
Area sources(residential fuel combustion…)
Canadian NEB 2020 Techno-Vert scenario for coal combustion at coal-fired power plants:
• technology advances rapidly
• broad action with respect to the environment, including preference for environmentally-friendly products and cleaner-burning fuels.
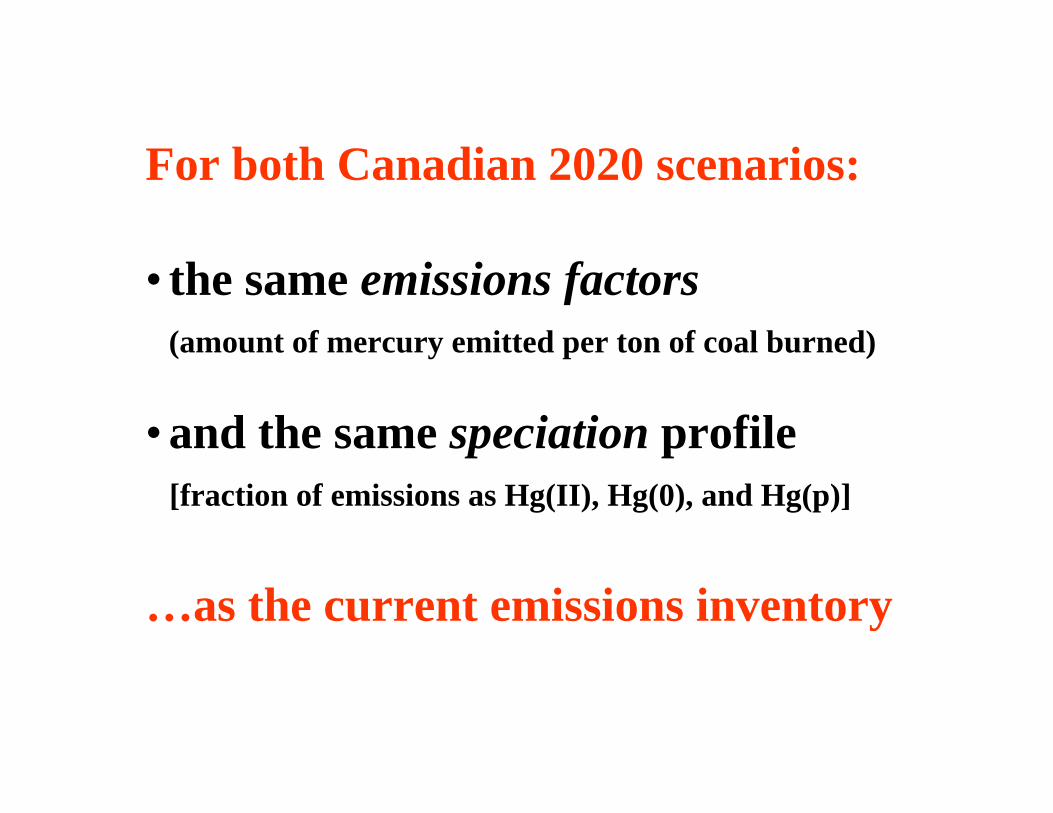
For both Canadian 2020 scenarios:
• the same emissions factors(amount of mercury emitted per ton of coal burned)
• and the same speciation profile[fraction of emissions as Hg(II), Hg(0), and Hg(p)]
…as the current emissions inventory
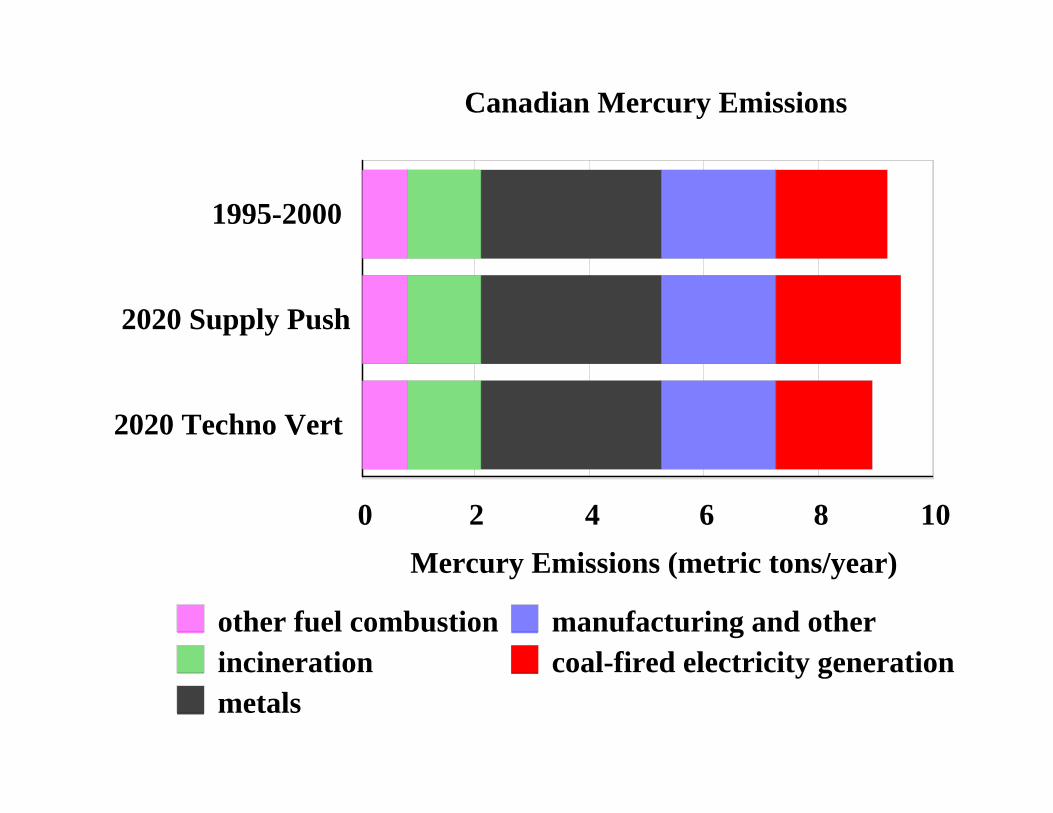
1995-2000
2020 Supply Push
2020 Techno Vert
0 2 4 6 8 10Mercury Emissions (metric tons/year)
other fuel combustionincinerationmetals
manufacturing and othercoal-fired electricity generation
Canadian Mercury Emissions
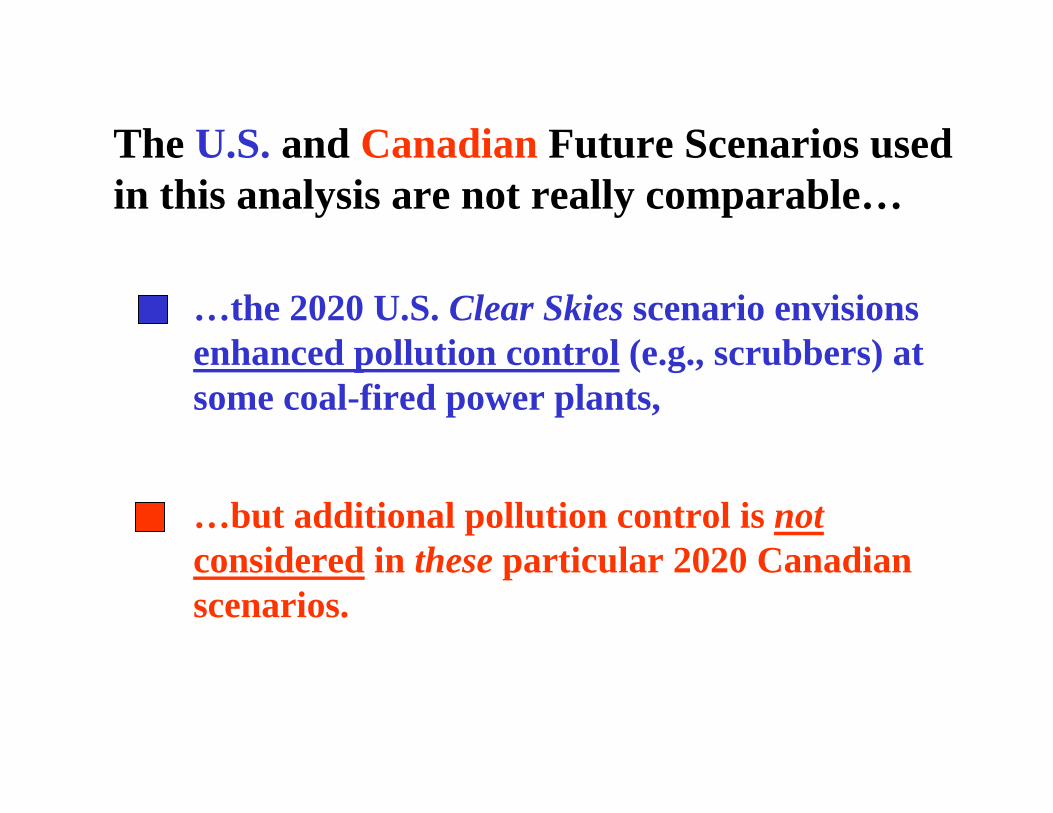
The U.S. and Canadian Future Scenarios used in this analysis are not really comparable…
…the 2020 U.S. Clear Skies scenario envisions enhanced pollution control (e.g., scrubbers) at some coal-fired power plants,
…but additional pollution control is notconsidered in these particular 2020 Canadian scenarios.

Outline
Emissions Scenarios
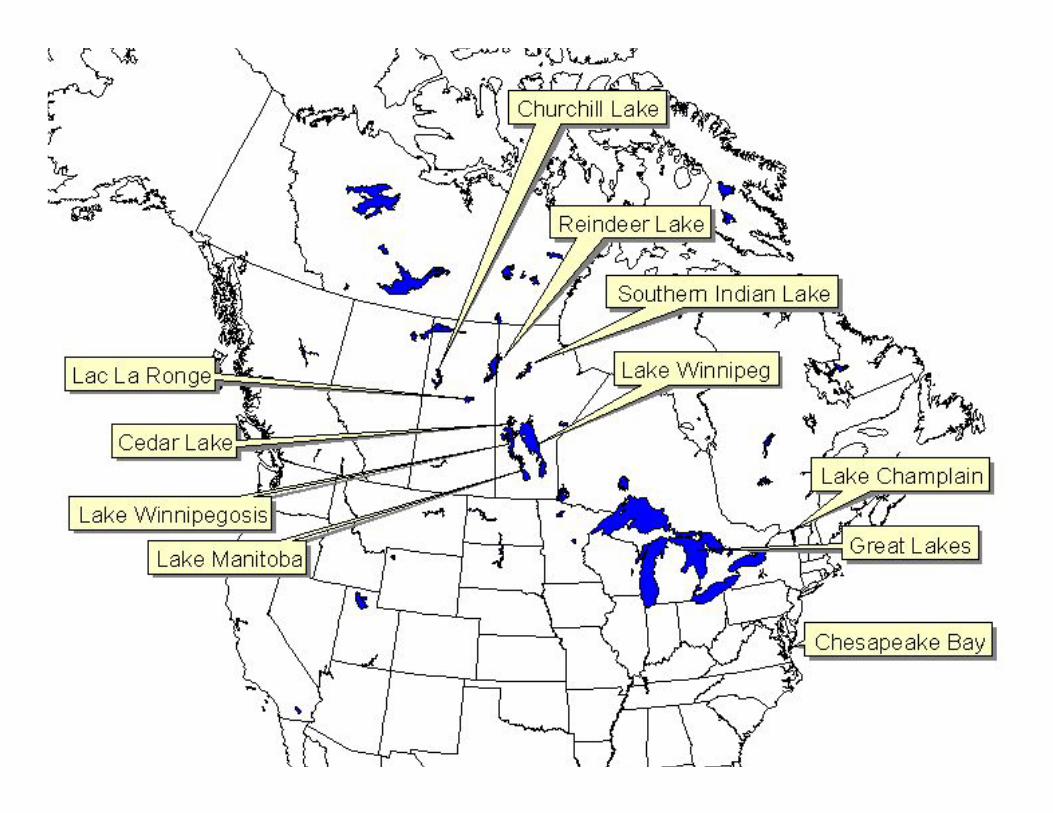
“Receptors” Studied
Results
Atmospheric Modeling
Outline
Emissions Scenarios
“Receptors” Studied
Results
Atmospheric Modeling
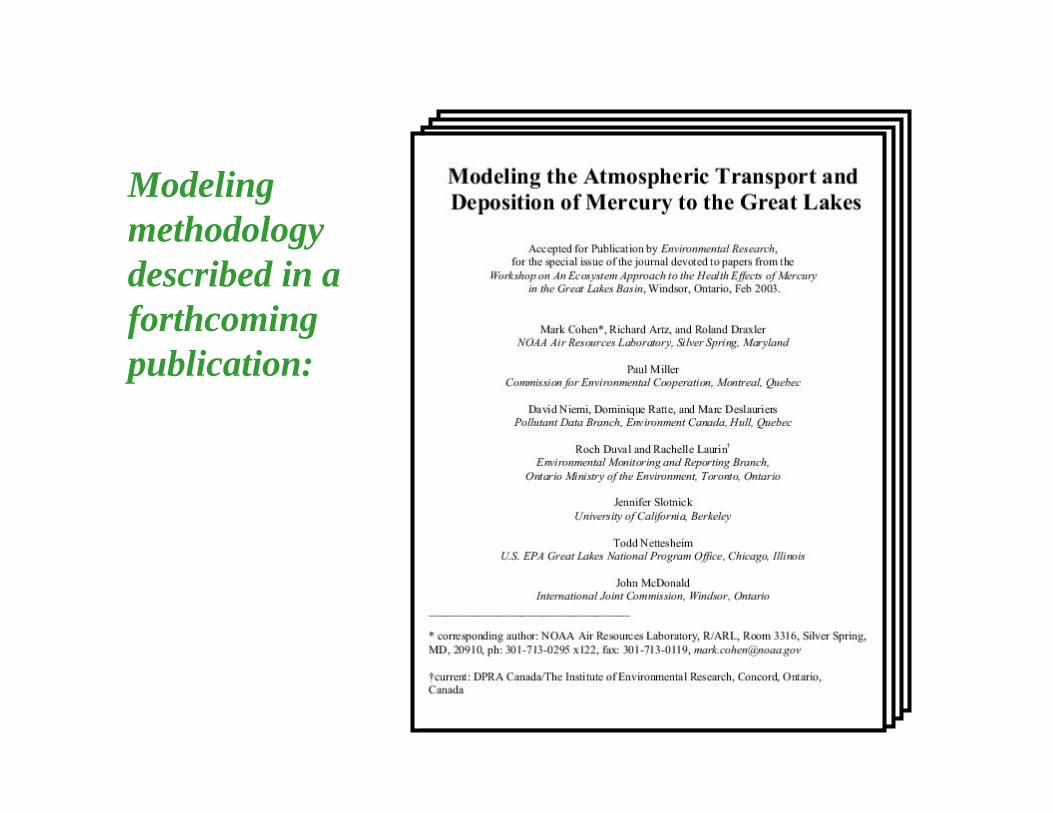
Modeling methodology described in a forthcoming publication:
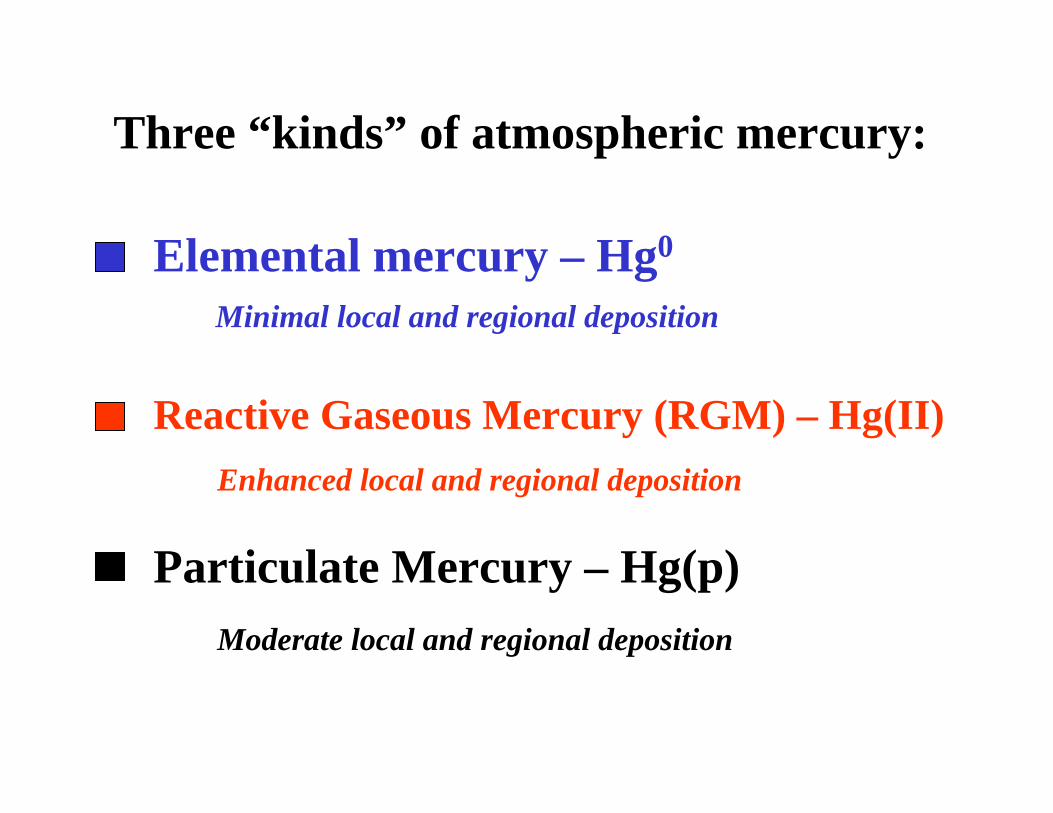
Three “kinds” of atmospheric mercury:
Elemental mercury – Hg0
Reactive Gaseous Mercury (RGM) – Hg(II)
Particulate Mercury – Hg(p)
Minimal local and regional deposition
Enhanced local and regional deposition
Moderate local and regional deposition
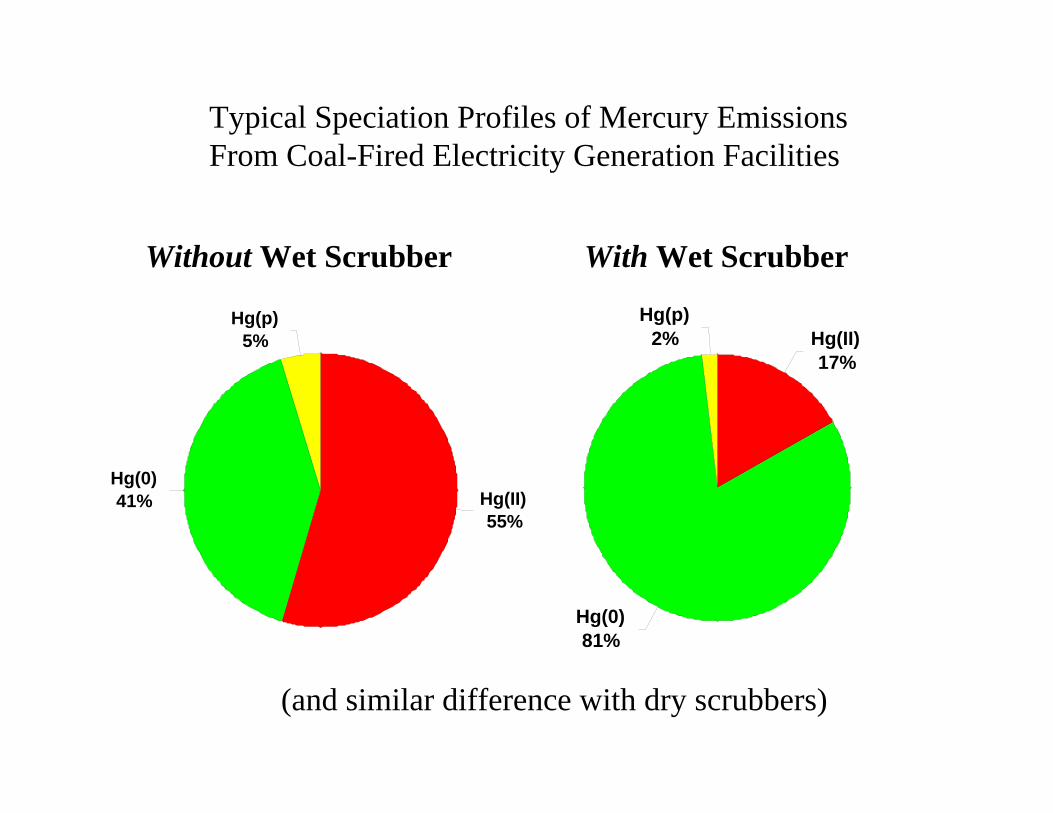
Typical Speciation Profiles of Mercury EmissionsFrom Coal-Fired Electricity Generation Facilities
Hg(II)17%
Hg(0)81%
Hg(p)2%
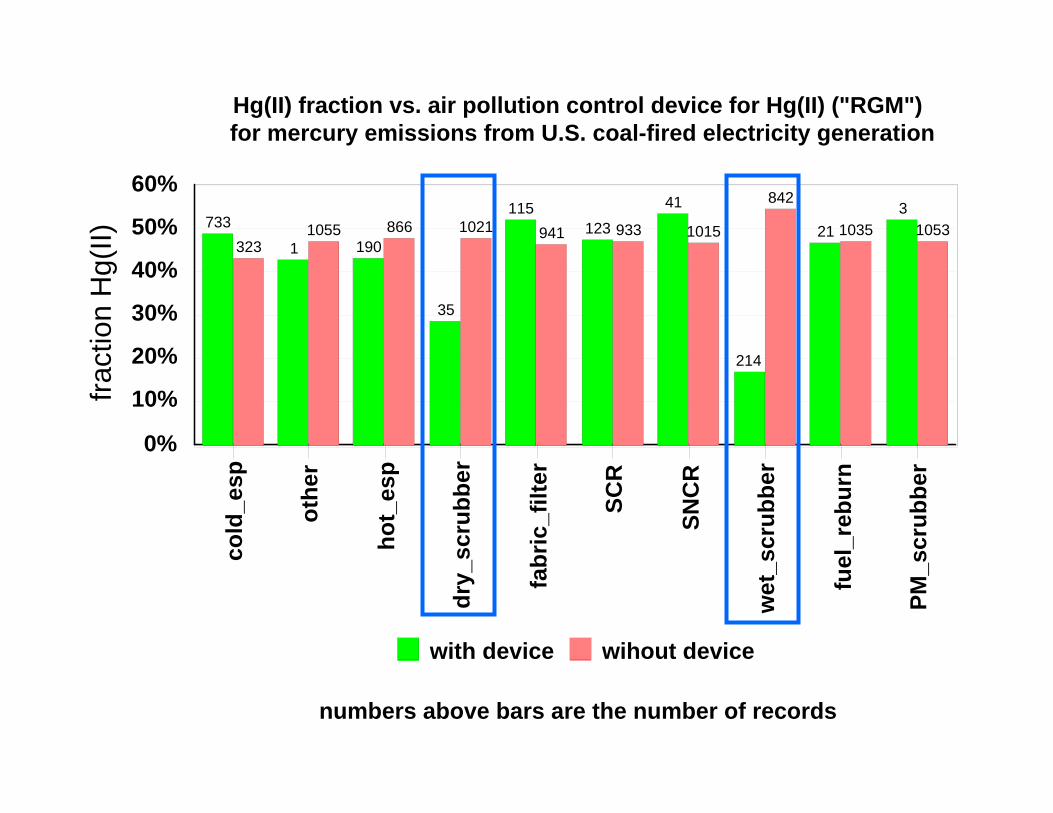
With Wet Scrubber
Hg(II)55%
Hg(0)41%
Hg(p)5%
Without Wet Scrubber
(and similar difference with dry scrubbers)
Outline
Emissions Scenarios
“Receptors” Studied
Results
Atmospheric Modeling
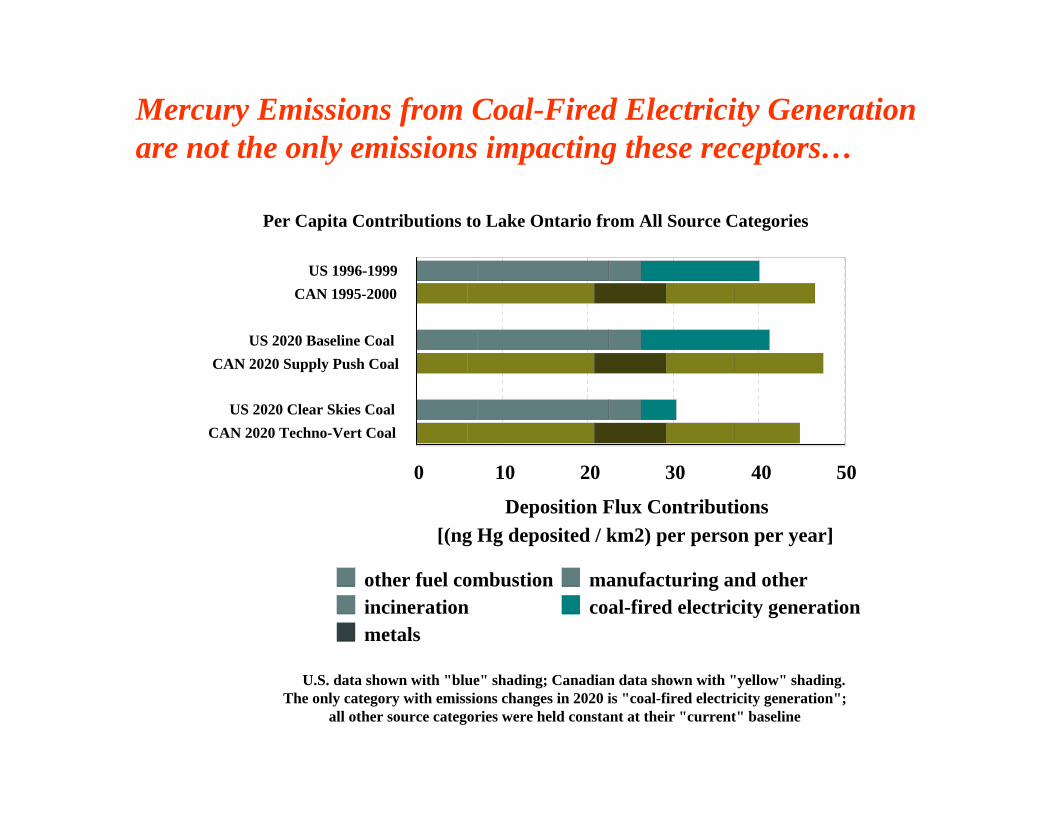
Mercury Emissions from Coal-Fired Electricity Generation are not the only emissions impacting these receptors…
US 1996-1999CAN 1995-2000
US 2020 Baseline CoalCAN 2020 Supply Push Coal
US 2020 Clear Skies CoalCAN 2020 Techno-Vert Coal
0 10 20 30 40 50
[(ng Hg deposited / km2) per person per year]Deposition Flux Contributions
other fuel combustionincinerationmetals
manufacturing and othercoal-fired electricity generation
U.S. data shown with "blue" shading; Canadian data shown with "yellow" shading.The only category with emissions changes in 2020 is "coal-fired electricity generation";
all other source categories were held constant at their "current" baseline
Per Capita Contributions to Lake Ontario from All Source Categories
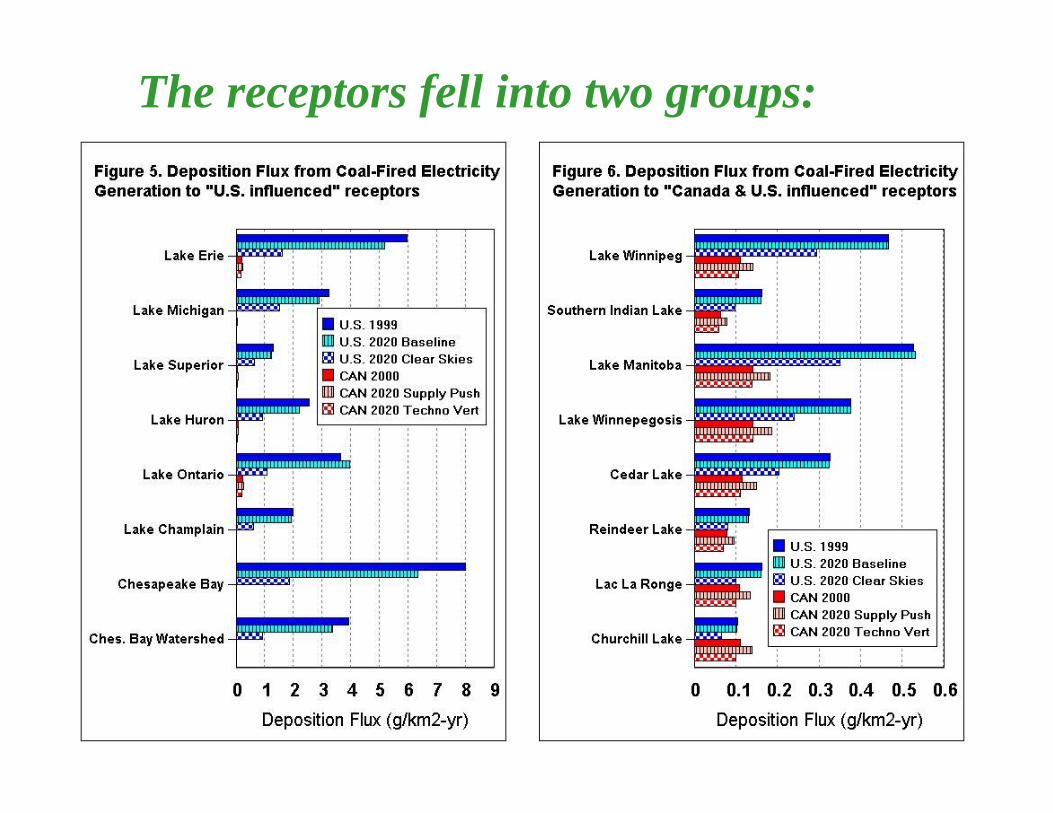
The receptors fell into two groups:
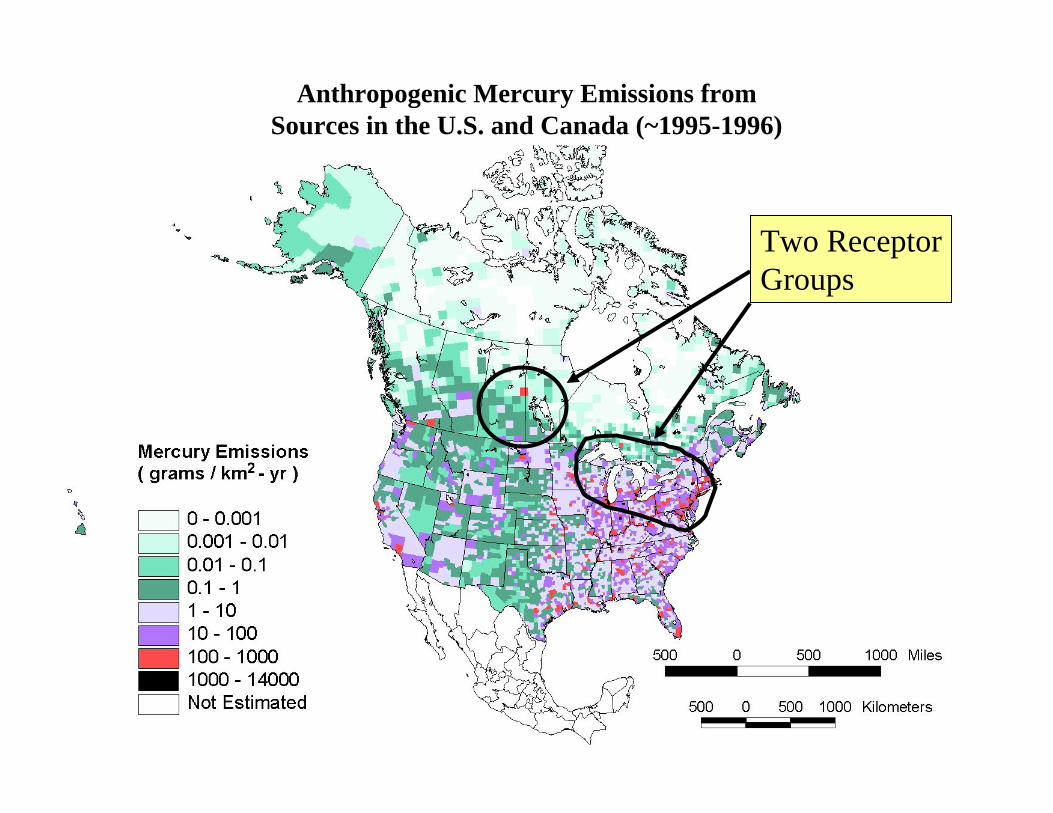
Anthropogenic Mercury Emissions from Sources in the U.S. and Canada (~1995-1996)
Two ReceptorGroups
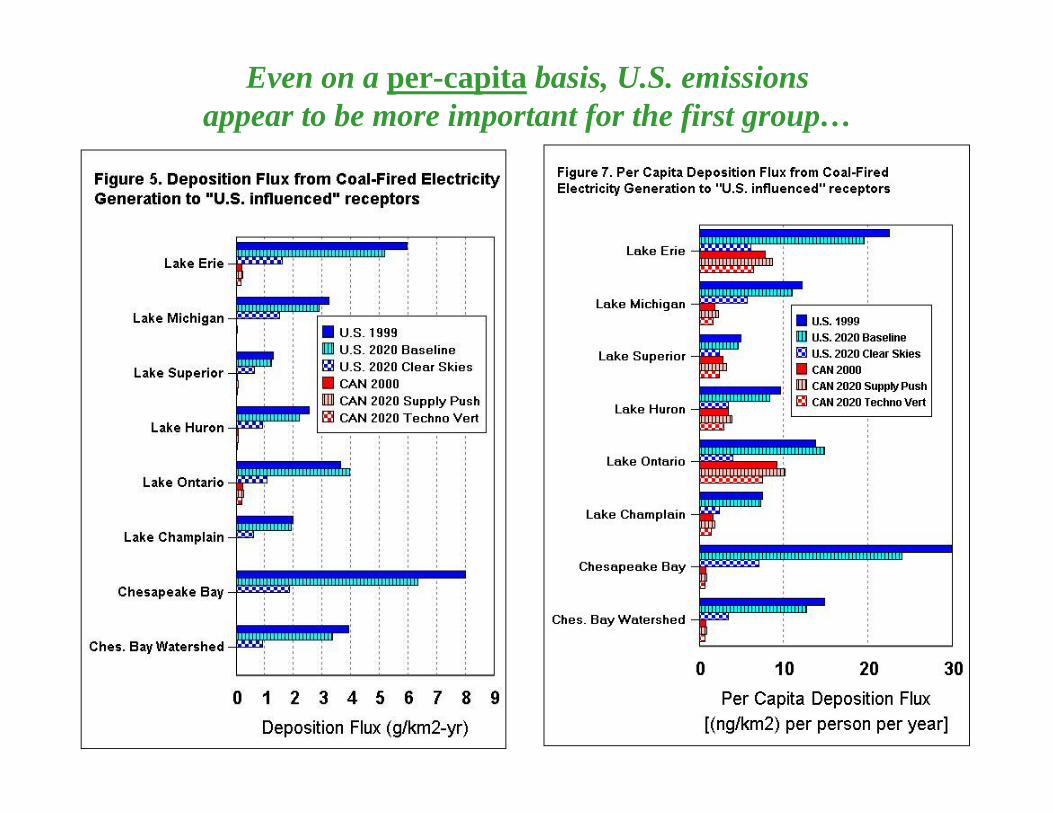
Even on a per-capita basis, U.S. emissionsappear to be more important for the first group…
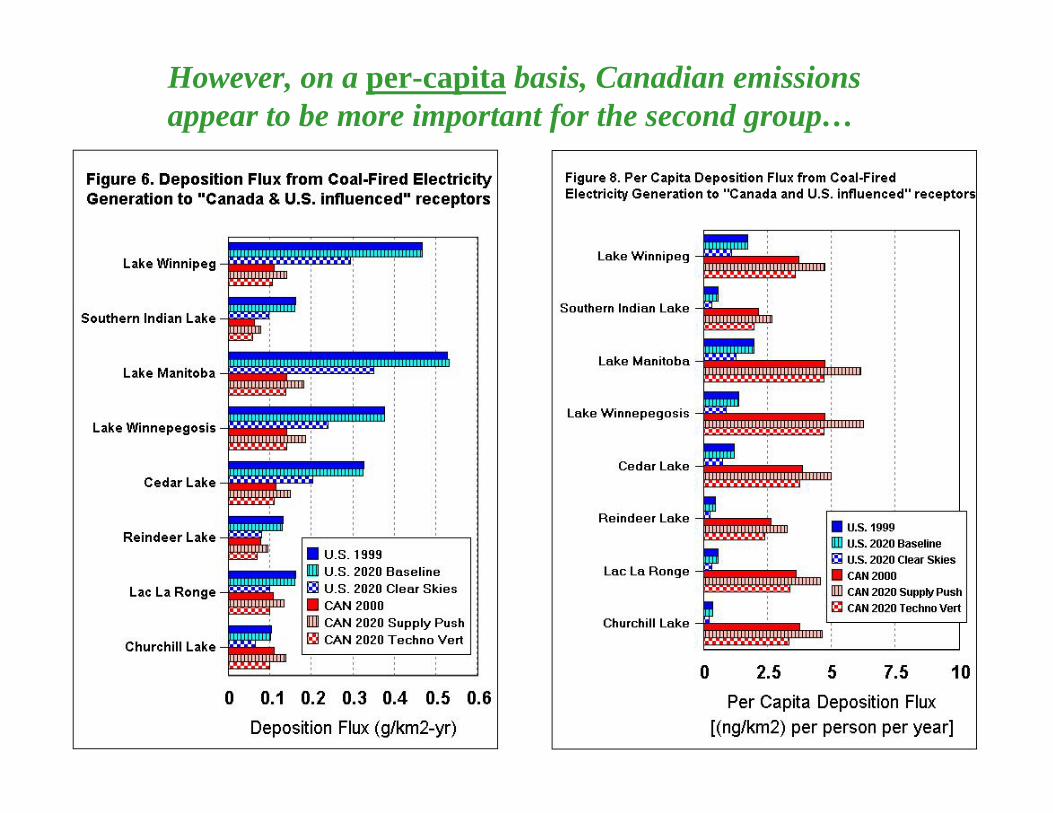
However, on a per-capita basis, Canadian emissions appear to be more important for the second group…
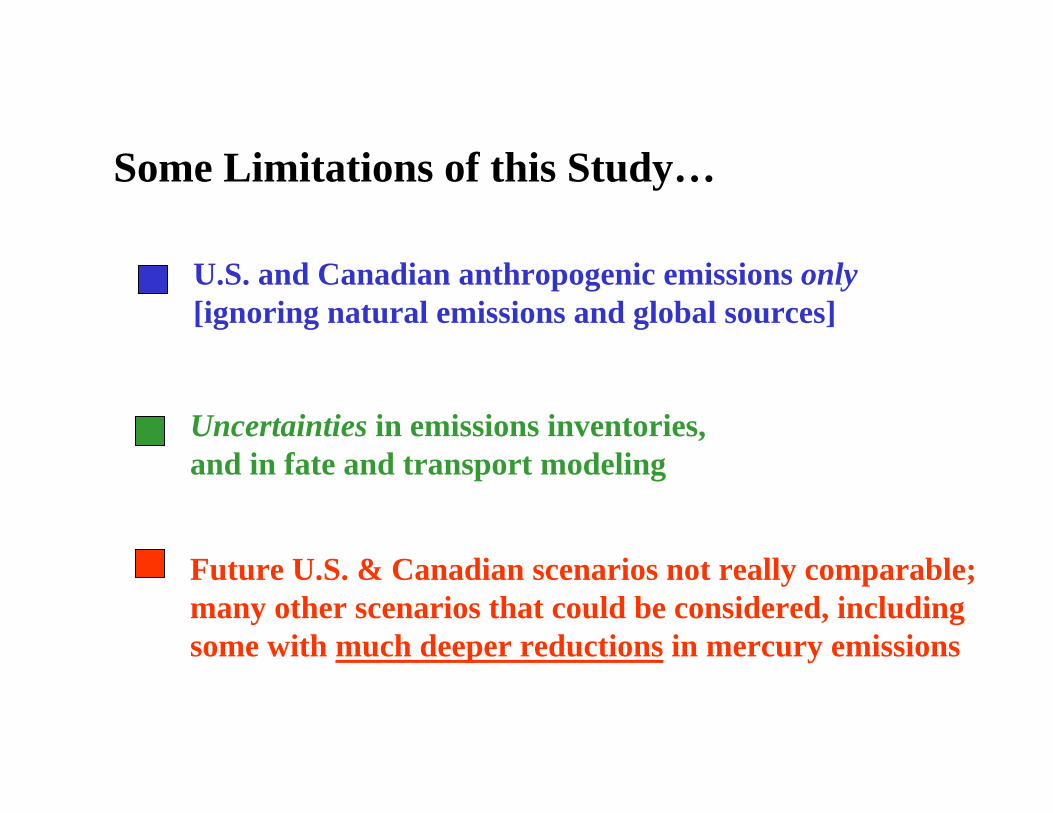
Some Limitations of this Study…
U.S. and Canadian anthropogenic emissions only[ignoring natural emissions and global sources]
Uncertainties in emissions inventories, and in fate and transport modeling
Future U.S. & Canadian scenarios not really comparable; many other scenarios that could be considered, including some with much deeper reductions in mercury emissions
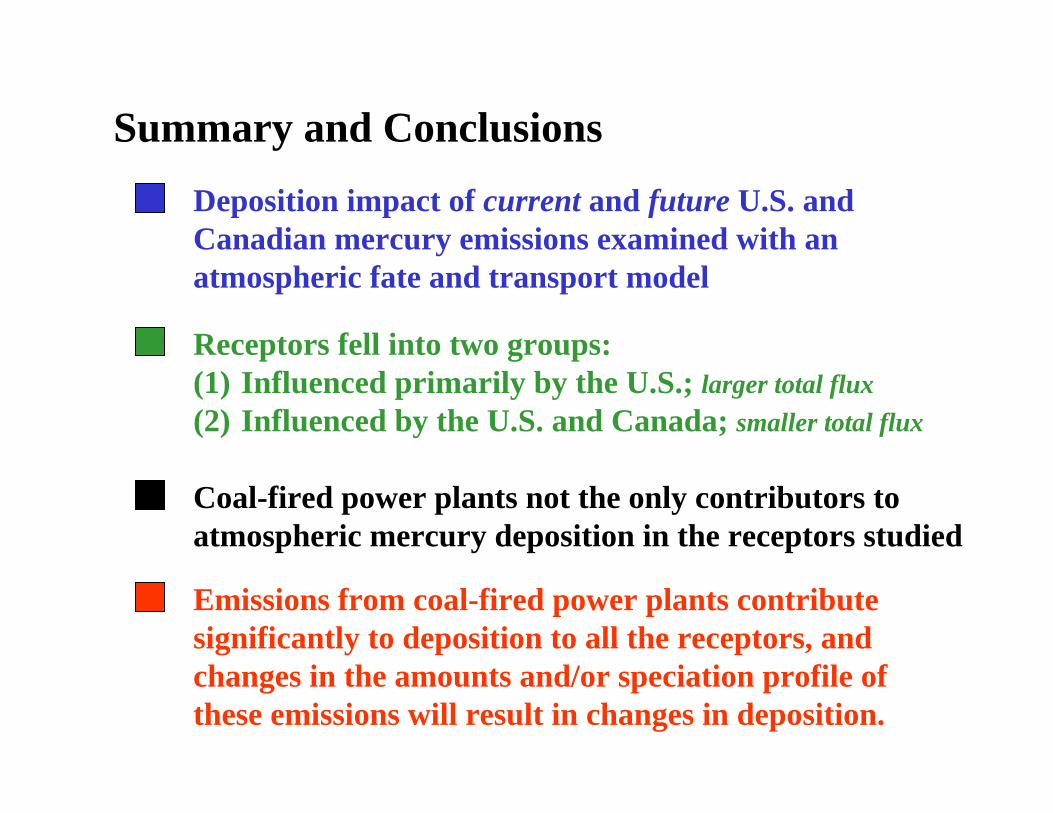
Summary and ConclusionsDeposition impact of current and future U.S. and Canadian mercury emissions examined with an atmospheric fate and transport model
Receptors fell into two groups: (1) Influenced primarily by the U.S.; larger total flux(2) Influenced by the U.S. and Canada; smaller total flux
Emissions from coal-fired power plants contribute significantly to deposition to all the receptors, and changes in the amounts and/or speciation profile of these emissions will result in changes in deposition.
Coal-fired power plants not the only contributors to atmospheric mercury deposition in the receptors studied

ExtraSlides
3231055 866 1021 941 933 1015
842
1035 1053733
1 190
35
115123
41
214
213
cold
_esp
othe
r
hot_
esp
dry_
scru
bber
fabr
ic_f
ilter
SCR
SNC
R
wet
_scr
ubbe
r
fuel
_reb
urn
PM_s
crub
ber
0%
10%
20%
30%
40%
50%
60%
fract
ion
Hg(
II)
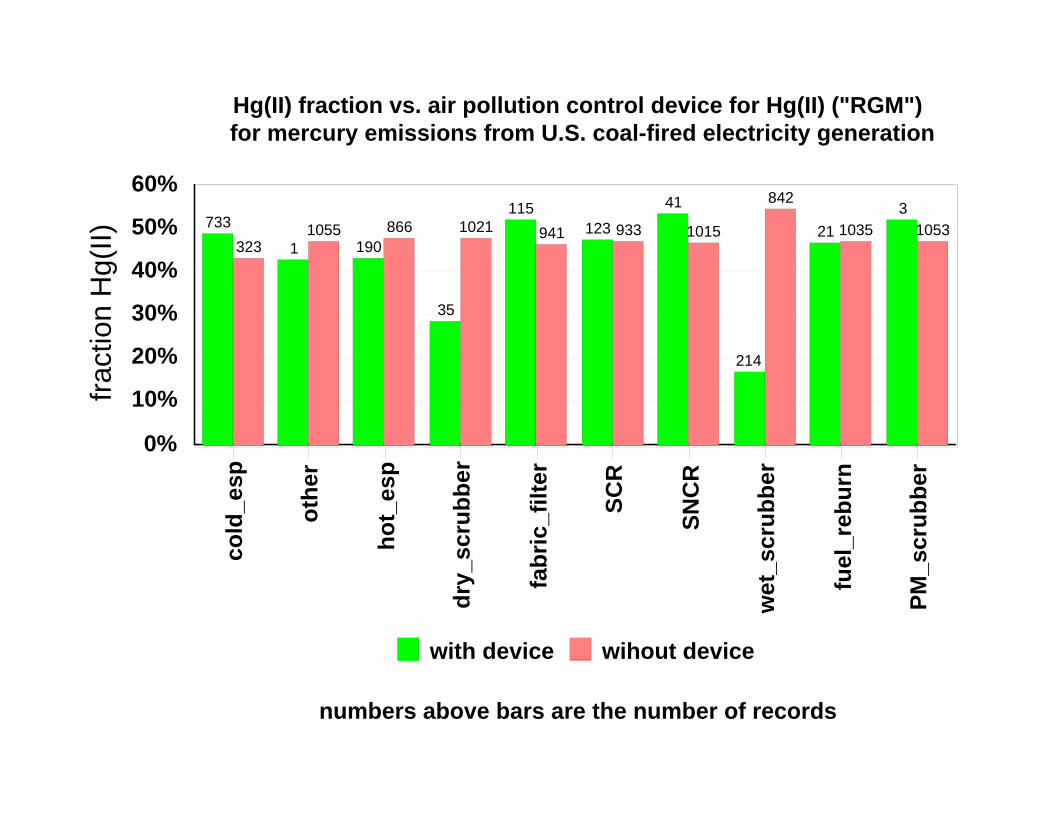
with device wihout device
numbers above bars are the number of records
Hg(II) fraction vs. air pollution control device for Hg(II) ("RGM")for mercury emissions from U.S. coal-fired electricity generation
3231055 866 1021 941 933 1015
842
1035 1053733
1 190
35
115123
41
214
213
cold
_esp
othe
r
hot_
esp
dry_
scru
bber
fabr
ic_f
ilter
SCR
SNC
R
wet
_scr
ubbe
r
fuel
_reb
urn
PM_s
crub
ber
0%
10%
20%
30%
40%
50%
60%
fract
ion
Hg(
II)
with device wihout device
numbers above bars are the number of records
Hg(II) fraction vs. air pollution control device for Hg(II) ("RGM")for mercury emissions from U.S. coal-fired electricity generation