atmospheric pressure rf plasma jet characterization of ... · atmospheric pressure rf plasma jet:...
TRANSCRIPT

Atmospheric pressure RF plasma jet : characterization of flowand O2 chemistryCitation for published version (APA):Zhang, S. (2015). Atmospheric pressure RF plasma jet : characterization of flow and O2 chemistry. Eindhoven:Technische Universiteit Eindhoven.
Document status and date:Published: 02/07/2015
Document Version:Publisher’s PDF, also known as Version of Record (includes final page, issue and volume numbers)
Please check the document version of this publication:
• A submitted manuscript is the version of the article upon submission and before peer-review. There can beimportant differences between the submitted version and the official published version of record. Peopleinterested in the research are advised to contact the author for the final version of the publication, or visit theDOI to the publisher's website.• The final author version and the galley proof are versions of the publication after peer review.• The final published version features the final layout of the paper including the volume, issue and pagenumbers.Link to publication
General rightsCopyright and moral rights for the publications made accessible in the public portal are retained by the authors and/or other copyright ownersand it is a condition of accessing publications that users recognise and abide by the legal requirements associated with these rights.
• Users may download and print one copy of any publication from the public portal for the purpose of private study or research. • You may not further distribute the material or use it for any profit-making activity or commercial gain • You may freely distribute the URL identifying the publication in the public portal.
If the publication is distributed under the terms of Article 25fa of the Dutch Copyright Act, indicated by the “Taverne” license above, pleasefollow below link for the End User Agreement:www.tue.nl/taverne
Take down policyIf you believe that this document breaches copyright please contact us at:[email protected] details and we will investigate your claim.
Download date: 26. Mar. 2020

Atmospheric pressure RF plasma jet:characterization of flow and O2
chemistry
PROEFSCHRIFT
ter verkrijging van de graad van doctor aan deTechnische Universiteit Eindhoven, op gezag van derector magnificus prof.dr.ir. F.P.T. Baaijens, voor een
commissie aangewezen door het College voorPromoties in het openbaar te verdedigenop donderdag 2 juli 2015 om 16:00 uur
door
Shiqiang Zhang
geboren te Henan, China

Dit proefschrift is goedgekeurd door de promotoren en de samenstellingvan de promotiecommissie is als volgt:
voorzitter: prof.dr. H.J.H. Clercx1e promotor: prof.dr.ir G.M.W. Kroesencopromotoren: prof.dr.ir.lic. P.J. Bruggeman (University of Minnesota)
dr.dipl.-ing. A. Sobotaleden: prof.dr. Y.-K. (Yi-Kang) Pu (Tsinghua University)
prof.dr. A. Fridman (Drexel University)prof.dr. A.A. Darhuberdr. R.A.H. Engeln

This research is partly supported by the Dutch Technology FoundationSTW, which is part of the Netherlands Organisation for Scientific Research(NWO).
CIP-DATA Technische Universiteit Eindhoven
shiqiang zhang
Atmospheric pressure RF plasma jet: characterization of flow and O2 chemistryby Shiqiang Zhang. - Eindhoven: Technische Universiteit Eindhoven, 2015. -Proefschrift.
A catalogue record is available from the Eindhoven University ofTechnology Library.ISBN: 978-90-386-3881-2NUR 926Subject headings: plasma physics / plasma chemistry / atmosphericpressure plasma jet / optical & laser diagnostics / UV absorptionspectroscopy / two-photon absorption laser induced fluorescence /shadowgraphy / ozone / atomic oxygen / flow dynamics
All rights reserved. No part of this book may be reproduced, stored in adatabase or retrieval system, or published, in any form or in any way,electronically, mechanically, by print, photo-print, or any other meanswithout prior written permission of the author.
Printed by Ipskamp Drukkers B.V.Cover design by Verspaget & BruininkTypeset in MiKTeX
Copyright © 2015 Shiqiang Zhang


Summary
Atmospheric pressure RF plasma jet: characterization of flow and O2chemistry
Atmospheric pressure plasma jets (APPJs) operate close to room tempera-ture in open air and produce a cocktail of reactive species and (UV) photonsin their highly reactive effluent. They are investigated for their potentialapplications in medicine, disinfection and decontamination and materialsprocessing.
The goal of the research was to investigate the effluent of an RF-drivenargon APPJ mainly focusing on reactive oxygen species such as ozone oratomic oxygen for its importance in plasma medicine. UV (Hartley band) ab-sorption is used to measure absolute ozone density time and space resolved.Accurate low concentrations were obtained by the use of a lock-in amplifier.Using the Beer Lambert law the absolute density of ozone is acquired fromradially resolved line integrated absorption intensity after applying the in-verse Abel transformation. A zero dimensional model is developed to verifythe experimental results of the ozone density. Two-photon absorption laser-induced fluorescence (TALIF) was used to measure absolute atomic oxygendensity, as atomic oxygen is one of the key precursor for ozone. As ozonechemistry is a function of gas temperature, Rayleigh scattering was used tomap the spatial and temporal gas temperature of the effluent. Additionally,as the interaction with the ambient air determines the mixing dynamics ofair into the jet effluent, shadowgraphy was used to study the spatial andtemporal flow dynamics of the effluent.
This research reports the temporally and spatially resolved ozone mea-surements in the effluent of an APPJ and shows that high ozone density canbe found off-axis near the exit of the quartz tube and on-axis further away inthe effluent. The maximum ozone density has been found to be 2 × 10²¹ m−3
in the far effluent 13 mm away from the exit of the quartz tube. The main
v
Summary
production mechanism is a three-body recombination of O and O2; the maindestruction path is ozone collisions with atomic species, particularly atomicoxygen in the plasma core.
The effect of the flow on the ozone density distribution in the effluentis also reported. Shadowgraphy measurements revealed the formation ofa transient vortex structure in the effluent at the rise and falling edges ofthe power modulated waveform, which causes significant air admixing intothe effluent of the jet. Combined with Rayleigh scattering, the flow dynam-ics observed by shadowgraphy were shown to be affected by gas temperaturechanges in the APPJ. The flow dynamics, including the transient vortex struc-ture resulting the air mixture into the effluent, and temporal atomic oxygenas obtained have greatly affect the temporal ozone distribution in the coreand far effluent zones.
Finally, a parametric study was performed in which absolute ozone andatomic oxygen densities were obtained for a varying oxygen concentrationin the feed gas (0.5% ∼ 4%), gas flow rate (1.5 slm ∼ 4 slm) and plasmadissipated power (3.0 W ∼ 10.0 W). The results showed little variation in themeasured parameter range, indicating that conclusions on ozone productionand destruction obtained for one set of parameters are valid in a broaderrange of conditions.
vi

Contents
Summary iv
1 Introduction 11.1 Atmospheric pressure plasma jets and applications . . . . . . . . 11.2 Research problems . . . . . . . . . . . . . . . . . . . . . . . . . . . 31.3 Diagnostics . . . . . . . . . . . . . . . . . . . . . . . . . . . . . . . 51.4 Thesis outline . . . . . . . . . . . . . . . . . . . . . . . . . . . . . . 6References . . . . . . . . . . . . . . . . . . . . . . . . . . . . . . . . . . 7
2 Spatially resolved distribution of O3 and Tg 112.1 Introduction . . . . . . . . . . . . . . . . . . . . . . . . . . . . . . 122.2 Experimental setup . . . . . . . . . . . . . . . . . . . . . . . . . . 132.3 Results and discussions . . . . . . . . . . . . . . . . . . . . . . . . 262.4 Conclusions . . . . . . . . . . . . . . . . . . . . . . . . . . . . . . . 32References . . . . . . . . . . . . . . . . . . . . . . . . . . . . . . . . . . 33
3 Collisional quenching on O of TALIF 393.1 Introduction . . . . . . . . . . . . . . . . . . . . . . . . . . . . . . 403.2 Experimental setup and conditions . . . . . . . . . . . . . . . . . 413.3 Calibration of TALIF . . . . . . . . . . . . . . . . . . . . . . . . . . 453.4 Results and discussions . . . . . . . . . . . . . . . . . . . . . . . . 453.5 Conclusions . . . . . . . . . . . . . . . . . . . . . . . . . . . . . . . 52References . . . . . . . . . . . . . . . . . . . . . . . . . . . . . . . . . . 52
4 Gas flow characteristics 554.1 Introduction . . . . . . . . . . . . . . . . . . . . . . . . . . . . . . 564.2 Experimental setup . . . . . . . . . . . . . . . . . . . . . . . . . . 604.3 Experimental results . . . . . . . . . . . . . . . . . . . . . . . . . . 624.4 Discussions . . . . . . . . . . . . . . . . . . . . . . . . . . . . . . . 704.5 Conclusions . . . . . . . . . . . . . . . . . . . . . . . . . . . . . . . 76References . . . . . . . . . . . . . . . . . . . . . . . . . . . . . . . . . . 76
5 Temporally resolved distribution of O3 835.1 Introduction . . . . . . . . . . . . . . . . . . . . . . . . . . . . . . 845.2 Experimental setup . . . . . . . . . . . . . . . . . . . . . . . . . . 855.3 Experimental results and discussion . . . . . . . . . . . . . . . . 895.4 Conclusions . . . . . . . . . . . . . . . . . . . . . . . . . . . . . . . 96References . . . . . . . . . . . . . . . . . . . . . . . . . . . . . . . . . . 96
6 Parameter study on O3 and O 1016.1 Introduction . . . . . . . . . . . . . . . . . . . . . . . . . . . . . . 102
vii
Contents
6.2 Experimental setup . . . . . . . . . . . . . . . . . . . . . . . . . . 1036.3 Results and discussion . . . . . . . . . . . . . . . . . . . . . . . . 1036.4 Conclusions . . . . . . . . . . . . . . . . . . . . . . . . . . . . . . . 110References . . . . . . . . . . . . . . . . . . . . . . . . . . . . . . . . . . 110
7 Conclusion 113
Acknowledgments 117
Curriculum Vitae 121
125
viii
CHAPTER 1
Introduction
1.1 Atmospheric pressure plasma jets and applications
Plasmas, also known as the fourth state of matter, can be considered a spe-cific state of matter similar to solid, liquid, and gas. The term plasma hasbeen used for the first time by Irving Langmuir in 1928 [1] to describe thequasi-neutral gas containing free charged and neutral particles which ex-hibits collective behavior [2]. The history of research on plasmas is mucholder and can be trace back to the early kite experiment conducted in 1750sby pioneers for studying lightning, one kind of natural occurring plasmason earth [3]. Plasmas are believed to constitute more than 99% of the Uni-verse [2]. Meanwhile, various man-made plasmas are produced and used fordifferent industrial processes and applications [4–9].
Plasmas can be made by increasing the internal energy of the gas. Anexample is our sun. However, a lot of man-made plasmas are not necessaryoperating at highly elevated gas temperatures and can be in thermal non-equilibrium. The electron temperature (Te) is thus much larger than the gastemperature (Tg). The external energy supplied to the plasma, most oftenthrough electric fields is mainly transferred to electrons having the small-est mass and highest mobility. As the pressure increases to atmosphericpressure, the energy transfer between electrons and neutral species becomesfaster and gas heating can become important. This enhanced gas heating canlead to thermal instabilities making it becomes challenging to produce largevolume homogeneous plasmas at atmospheric pressure. Often plasmas aregenerated in noble gas such as helium or argon, because it is easy to create aplasma in noble gases and gas heating is less excessive compared to molecu-lar gases [10, 11]. A small mount of oxygen or air is often added to the noble
1

Introduction
gas to produce abundant reactive species that is a requirement for variousapplications.
Atmospheric pressure plasma jet (APPJ) is a type of non-thermal atmo-spheric pressure plasma. There is a large number of different APPJ de-signs [12, 13]. The used excited voltage includes direct current (DC), kHzalternative current (AC), radio frequency (RF), microwave (MW). Helium orargon is used as fed gas mixed with oxygen or air. The drive voltage can becontinuous or pulsed. An example of APPJ is the well characterized KINPenjet [14] or the μAPPJ [15].
Particularly RF jets, as used in this work, can produce large densities ofreactive species [7, 11, 13]. A fast gas flow blows the plasma and reactivespecies, typically generated inside the tube of the jet, out of the small cylin-drical tube into the air. APPJs can work without complex vacuum systems,and arrays of APPJs can make large volume of plasmas. APPJs have showntheir large potential in the recently emerging field of plasma medicine. Alot of research is currently performed to assess on the feasibility of APPJapplications in the context of plasma medicine [16–23], for example, woundhealing [24], sterilization [25, 26], even cancer treatment [16].
Figure 1.1: Picture of the plasma jet.
In this work, the geometry of the investigated APPJ has a grounded metalring outside the cylindrical quartz tube and a high voltage needle is placedin the tube. The electric field is perpendicular to the flow field. The plasmajet operates open to the air and is excited by time modulated 13.56 MHz RFvoltages. The gas flow is typical argon with a small portion of oxygen or air.
2

1.2. Research problems
The excited RF voltage is also modulated. The APPJ is shown in figure 1.1.Table 1.1 shows the typical operational parameter range of the APPJ.
Table 1.1: Parameter range of the APPJ in this work.
Parameter Range
Argon flow 1.5 - 4 slmO2 concentration� 0.5 - 4%Average dissipated power∗ 3 - 10 WVisible effluent ∼ 6 mm longExcitation frequency 13.56 MHz
Modulation and duty cycle50 Hz with 50% duty cycle
20 kHz with 20% duty cycle
Electron temperature (Te)† ∼ 3 eVGas temperature (Tg) 300 - 800 KElectron density † 1017 - 1020 m−3
Ionization degree 10−5 - 10−7
� For some case, 2% air is mixed, see chapter 3.∗ Refer methods of determining the average dissipated power to [27].† See [28] and chapter 2.
1.2 Research problems
Atmospheric pressure plasma jets produce a cocktail of reactive species, ions,electrons, electric field, and UV radiation, as illustrated in figure 1.2. The re-active species are transported by the gas flow to the surface of the application-oriented substrate, such as cells, tissue, or organisms [17, 29], materials [30],or liquid [8].
APPJ applications in the context of medicine have strict standards and reg-ulations to avoid health risks. For example, the ozone produced by plasmacan be harmful for patients when its concentration is too high [31]. A basicknowledge of the generated reactive species and their densities is required toinvestigate mechanisms and ensure a safe application in medicine of APPJs.
For the APPJ used in this work, Bram van Gessel has investigated in detailthe NO production in the jet. In addition, he has measured reactive speciessuch as NO and O, along with the electron temperature and densities, gastemperatures and the air diffusion in the jet effluent [32]. Sven Hofmann
3

Introduction
core zone
far effluent
e, O3, O, OH, NO, ions, UV, et al
O3, N2(A), et allong-lived speices
RF inputgas flow
Figure 1.2: Sketch of the APPJ effluent.
has previously studied the electrical characteristics of APPJ, including accu-rate power measurements, and investigated the interaction of the APPJ withhuman mammalian cells and bacteria and the plasma induced liquid phasechemistry [33]. It is well established that both reactive oxygen and nitrogenspecies are important for plasma medicine [20]. The characterization of re-active oxygen species in the gas phase has not been performed for the jetstudied in this work and is a key goal.
Of all the reactive species, the production of ozone by plasmas has a longhistory since the development of the ozonizer by Werner von Siemens [34].Although the history of ozone production by plasma has been long, the ap-plications of ozone, often coupled with other reactive species, particularly forplasma medicine is rather new and is up to now mostly studied in dielectricbarrier discharges and corona discharges.
Important research questions remain:
• What is the distribution of ozone produced by APPJs and how is itaffected by external controllable factors such as gas flow rate, concen-tration of O2 admixture and RF power?
• What is the dissociation degree of O2 in the RF plasma jet and what isthe O density?
• What is the chemical reaction mechanism that determines the ozone
4

1.3. Diagnostics
distribution in an APPJ and what is the effect of the gas flow?
• What is the gas flow pattern in the effluent and how is it affected bythe plasma?
1.3 Diagnostics
To answer these research questions, the research was focused on the detectionof ozone, atomic oxygen and the gas flow dynamics in the jet effluent. Inorder to analyze the ozone kinetics, density of O which is the precursorspecie for ozone production by three body reaction and the gas temperaturewas also investigated.
Traditional probe measurement can not not be used since the scale of aprobe is similar to the size of the APPJ plasma. In addition, the probe woulddistort the plasma and the flow pattern. Optical diagnostics is the preferredchoice, since it is non-intrusive and it can achieve high spatial and tempo-ral resolution. The optical diagnostics used in this work are schematically
RF inputgas flow
Incident laser
Transmitted laser and/or plasma emission
Scattering or fluorescence light
TALIF on ORayleigh scattering on Tg
UV absorption on O3
Shadowgraphy on flow pattern
Figure 1.3: Illustration of optical diagnostics.
illustrated in figure 1.3. We have performed:
• UV absorption to obtain ozone densities
• Absolute two-photon absorption laser induced fluorescence (TALIF) tomeasure atomic oxygen densities
5

Introduction
• Rayleigh scattering to measure spatially and time resolved gas temper-atures
• Shadowgraphy to visualize the flow pattern
• Current voltage measurement to measure the plasma dissipated power.
1.4 Thesis outline
The dissertation deals with two topics: O2 chemistry focused on O3 andO species and the flow patterns of the jet effluent. Most of the detaileddiagnostics have been performed in detail for one reference condition: gasflow rate of 2 slm mixed with 2% oxygen and an averaged dissipated plasmapower of 6.5 W.
In chapter 2 ozone distribution of the modulated APPJ is determinedby UV absorption spectroscopy for the reference condition. The gas tem-perature for the reference condition is also obtained by Rayleigh scattering.Along with the chemical model, the production and destruction mechanismsof ozone are discussed. To acquire the absolute ozone density, an analyticalapproach is introduced to fit the radial-dependent line-of-sight absorbanceand perform the Abel inversion.
In chapter 3 TALIF is performed on a modulated APPJ plasma jet. Thecollisional quenching of the excited O 3p 3PJ state from the entrained airspecies is calculated from air concentrations obtained previously by Ramanscattering to convert the fluorescence intensity and reconstruct the O densityprofile. The TALIF signal and the corresponding profile of O density is com-pared to analyze the effect of collisional quenching of the O 3p 3PJ state onthe determination of O density.
In chapter 4 the flow patterns of the modulated APPJ is investigated byshadowgraphy. In addition, a laser sheath is made to determine the gastemperature by Rayleigh scattering. The effects of Reynold and Richardsonnumber, flow velocity, ion momentum transfer, and dissipated power on thelength of potential core flow and observed flow pattern are discussed. Mech-anisms of an observed transient vortex structure coinciding with the ignitionand extinction of the plasma are presented.
In chapter 5 the temporal ozone distribution of the modulated APPJ byUV absorption spectroscopy is reported. TALIF is also performed on O for
6
References
the same condition. Using the flow pattern and gas temperature in chapter4, ozone distribution is discussed in detail.
In chapter 6 the dependence of ozone and atomic oxygen distribution onvarious gas flow rates, oxygen concentrations, and plasma dissipated powersis studied. Ozone is determined by the technique introduced in chapter 2 andTALIF is performed on O with the same technique as introduced in chapter3.
References
[1] I. Langmuir. Oscillations in ionized gases. Proceedings of the NationalAcademy of Sciences of the United States of America, 14(8):627, 1928.
[2] F. F. Chen and A. Trivelpiece. Introduction to plasma physics. PhysicsToday, 29:54, 1976.
[3] A. L. Rotch. The lightning-rod coincident with Franklin’s kite experi-ment. Science, pages 780–780, 1906.
[4] J.-S. Chang, P. A. Lawless, and T. Yamamoto. Corona discharge pro-cesses. Plasma Science, IEEE Transactions on, 19(6):1152–1166, 1991.
[5] A. Fridman. Plasma chemistry. Cambridge University Press, 2008.
[6] R. Hippler, H. Kersten, M. Schmidt, and K. H. Schoenbach. Low temper-ature plasmas: fundamentals, technologies and techniques, volume 1. Wiley-Vch, 2008.
[7] U. Kogelschatz, B. Eliasson, and W. Egli. From ozone generators toflat television screens: history and future potential of dielectric-barrierdischarges. Pure and Applied Chemistry, 71(10):1819–1828, 1999.
[8] U. Kogelschatz. Dielectric-barrier discharges: their history, dischargephysics, and industrial applications. Plasma chemistry and plasma process-ing, 23(1):1–46, 2003.
[9] M. A. Lieberman and A. J. Lichtenberg. Principles of plasma dischargesand materials processing. MRS Bulletin, 30:899–901.
[10] Y. P. Raizer, V. I. Kisin, and J. E. Allen. Gas discharge physics, volume 1.Springer-Verlag Berlin, 1991.
[11] P. K. Chu and X. Lu. Low Temperature Plasma Technology: Methods andApplications. CRC Press, 2013.
7

Introduction
[12] X. Lu, M. Laroussi, and V. Puech. On atmospheric-pressure non-equilibrium plasma jets and plasma bullets. Plasma Sources Science andTechnology, 21(3):034005, 2012.
[13] A. Schutze, J. Y. Jeong, S. E. Babayan, J. Park, G. S. Selwyn, and R. F.Hicks. The atmospheric-pressure plasma jet: a review and comparisonto other plasma sources. Plasma Science, IEEE Transactions on, 26(6):1685–1694, 1998.
[14] K.-D. Weltmann, E. Kindel, R. Brandenburg, C. Meyer, R. Bussiahn,C. Wilke, and T. Von Woedtke. Atmospheric pressure plasma jet formedical therapy: plasma parameters and risk estimation. Contributionsto Plasma Physics, 49(9):631–640, 2009.
[15] N. Knake, S. Reuter, K. Niemi, V. Schulz-von der Gathen, and J. Win-ter. Absolute atomic oxygen density distributions in the effluent of amicroscale atmospheric pressure plasma jet. Journal of Physics D: AppliedPhysics, 41(19):194006, 2008.
[16] D. B. Graves. The emerging role of reactive oxygen and nitrogen speciesin redox biology and some implications for plasma applications tomedicine and biology. Journal of Physics D: Applied Physics, 45(26):263001,2012.
[17] M. G. Kong, G. Kroesen, G. Morfill, T. Nosenko, T. Shimizu, J. van Dijk,and J. L. Zimmermann. Plasma medicine: an introductory review. NewJournal of Physics, 11(11):115012, 2009.
[18] G. Fridman, G. Friedman, A. Gutsol, A. B. Shekhter, V. N. Vasilets, andA. Fridman. Applied plasma medicine. Plasma Processes and Polymers,5(6):503–533, 2008.
[19] K. D. Weltmann, E. Kindel, T. von Woedtke, M. Hähnel, M. Stieber,and R. Brandenburg. Atmospheric-pressure plasma sources: Prospec-tive tools for plasma medicine. Pure and Applied Chemistry, 82(6):1223,2010.
[20] D. B. Graves. Reactive species from cold atmospheric plasma: Implica-tions for cancer therapy. Plasma Processes and Polymers, 2014.
[21] O. Lunov, V. Zablotskii, O. Churpita, E. Chánová, E. Syková, A. Dejneka,and Š. Kubinová. Cell death induced by ozone and various non-thermalplasmas: therapeutic perspectives and limitations. Scientific reports, 4,2014.
[22] S. Salehi, A. Shokri, M. R. Khani, M. Bigdeli, and B. Shokri. Investigatingeffects of atmospheric-pressure plasma on the process of wound healing.Biointerphases, 10(2):029504, 2015.
8
References
[23] M. Laroussi. Low-temperature plasma jet for biomedical applications:A review. Plasma Science, IEEE Transactions on, 43(3):703–712, 2015.
[24] C. H. Park, J. S. Lee, J. H. Kim, D.-K. Kim, O. J. Lee, H. W. Ju, B. M.Moon, J. H. Cho, M. H. Kim, P. P. Sun, et al. Wound healing with non-thermal microplasma jets generated in arrays of hourglass microcavitydevices. Journal of Physics D: Applied Physics, 47(43):435402, 2014.
[25] M. Pervez, A. Begum, and M. Laroussi. Plasma based sterilization:overview and the stepwise inactivation process of microbial by non-thermal atmospheric pressure plasma jet. International Journal of Engi-neering & Technology, 14(5), 2014.
[26] N. Mastanaiah, P. Banerjee, J. A. Johnson, and S. Roy. Examining the roleof ozone in surface plasma sterilization using dielectric barrier discharge(DBD) plasma. Plasma Processes and Polymers, 10(12):1120–1133, 2013.
[27] S. Hofmann, A. F. H. van Gessel, T. Verreycken, and P. Bruggeman.Power dissipation, gas temperatures and electron densities of cold at-mospheric pressure helium and argon RF plasma jets. Plasma SourcesScience and Technology, 20(6):065010, 2011.
[28] B. van Gessel, R. Brandenburg, and P. Bruggeman. Electron propertiesand air mixing in radio frequency driven argon plasma jets at atmo-spheric pressure. Applied Physics Letters, 103(6):064103–064103, 2013.
[29] X. Lu and A. Fridman. Guest editorial the second special issue on atmo-spheric pressure plasma jets and their applications. 2015.
[30] C. Tendero, C. Tixier, P. Tristant, J. Desmaison, and P. Leprince. Atmo-spheric pressure plasmas: A review. Spectrochimica Acta Part B: AtomicSpectroscopy, 61(1):2–30, 2006.
[31] V. Bocci. Biological and clinical effects of ozone. has ozone therapy afuture in medicine. Br J Biomed Sci, 56(4):270–279, 1999.
[32] A. F. H. van Gessel. Laser diagnostics on atmospheric pressure plasma jets.PhD thesis, PhD Thesis, 2013.
[33] S. Hofmann. Atmospheric pressure plasma jets: characterisation and interac-tion with human cells and bacteria. PhD thesis, PhD Thesis, 2013.
[34] W. Siemens. Ueber die elektrostatische induction und die verzögerungdes stroms in flaschendrähten. Annalen der Physik, 178(9):66–122, 1857.
9

10

CHAPTER 2
Spatially resolved ozone densities and gas
temperatures in a time modulated RF driven
atmospheric pressure plasma jet: an analysis
of the production and destruction mechanisms
Abstract
In this work, a time modulated RF driven DBD-like atmospheric pres-sure plasma jet in Ar + 2%O2, operating at a time averaged power of 6.5 Wis investigated. Spatially resolved ozone densities and gas temperatures areobtained by UV absorption and Rayleigh scattering respectively. Significantgas heating in the core of the plasma up to 700 K is found and at the positionof this increased gas temperature a depletion of the ozone density is found.The production and destruction reactions of O3 in the jet effluent as a func-tion of the distance from the nozzle are obtained from a zero-dimensionalchemical kinetics model in plug flow mode which considers air chemistrydue to air entrainment in the jet fluent. A comparison of the measurementsand the models shows that the depletion of O3 in the core of the plasmais mainly caused by an enhanced destruction of O3 due to a large atomicoxygen density.
1A modified version of this chapter is published as S. Zhang, W. van Gaens, B. van Gessel,S. Hofmann, E. M. van Veldhuizen, A. Bogaerts, and P. J. Bruggeman, “Spatially resolvedozone densities and gas temperatures in a time modulated RF driven atmospheric pressureplasma jet: an analysis of the production and destruction mechanisms”, (2013) Journal ofPhysics D: Applied Physics 46 205202
2Acknowledgment to Wouter van Gaens for the contribution of the model work
11

Spatially resolved distribution of O3 and Tg
2.1 Introduction
Cold atmospheric pressure plasma jets (APPJs) have recently been shownto be promising tools for biomedical applications, such as disinfection andwound healing et al [1–6]. APPJs can operate close to room temperatureand open to air without the necessity of a controlled surrounding gas atmo-sphere. In addition, APPJs can often be electrically and thermally touchedwhile producing a highly reactive plasma cocktail consisting of radicals andoxidizing species such as OH, O, NO, O3, excited species, ions and UV radi-ation [2, 5]. The long term impact of this reactive cocktail on human tissue isstill a topic of investigation. As many of these constituents enable the plasmato disinfect, it is important to study the chemical and physical processes ofthe plasma jet including the concentrations of these reactive species in orderto understand the plasma induced effects on biological samples.
APPJs are made in many geometries and the plasma can be producedby direct current (DC), microwave (MW), Radio Frequency (RF), kHz ACand pulsed DC excitation [5, 7]. Noble gases, such as argon and helium aremainly used as feed gas. Oxygen, air and sometimes water vapor is alsomixed into the gas stream [8].
Since the length of the light-emitting plasma effluent is of the order ofmicrometers up to centimeters, non-intrusive spectroscopic diagnostics arethe usual choices to investigate these APPJs, which can provide informationfrom excited atoms to molecules. Two-photon absorption laser induced flu-orescence spectroscopy (TALIF) is used to measure the ground state atomicoxygen density produced by a RF excited APPJ [9–11]. Pipa et al measuredthe density of NO produced by a kINPen plasma jet by methods of absorp-tion spectroscopy in the mid-infrared region [12]. Ozone concentrations havebeen measured by UV absorption spectroscopy in a micro He-O2 dischargejet [13]. The same method has been applied to measure ozone density pro-duced by a MHz Ar-O2 plasma ‘bullet’ jet [14, 15], although the O3 densityclose to the nozzle is not obtained and only a monotonic decrease of the O3density as a function of the distance from the nozzle is found. Addition-ally, ozone density measurements have also been performed by Ellerweg etal [16] in the effluent (essential an afterglow) of an He-O2 microplasma jetemanating into ambient air by means of molecular beam mass spectrometry(MBMS). A maximum O3 density in the effluent at a distance of 20mm fromthe nozzle is found in this case which was not predicted by oxygen chemistryresulting from the O density which was also measured. Actually widening ofthe jet effluent at increasing distance from the nozzle could partly explain theobserved reduction of O3. Kuhn et al measured the O3 density in an N2/O2MW driven plasma jet [17]. O3 production has been measured by UV absorp-
12

2.2. Experimental setup
tion at a fixed position from the nozzle not considering spatial gradients indensities. The gas temperature of the MW jet was found to be 1000K. Thetrends depending on gas temperature have been qualitatively explained bya set of 11 chemical reactions involving NO and O3 production. Yanallah etal also studied ozone generation in a positive corona discharge numericallyand experimentally [18].
The motivation to study O3 is due to its strong oxidization, long life timeand the fact that it has been used in biomedical applications, such as waterdisinfection, treating wounds in the medical field [19–21]. Due to this reasonan extensive literature on O3 production exists although mainly in DBD andcorona discharges (see [22, 23]). Extensive modeling of O3 production inDBDs in oxygen and air have been reported by [24]. In this work, we presentresults of spatially resolved gas temperature and ozone density measurementin a time modulated RF driven atmospheric pressure plasma jet operating inargon with 2% oxygen mixture. Similar to [13], UV absorption spectroscopyis used to obtain the spatially resolved ozone density in the plasma effluent.
As the gas temperature needs to be low for biomedical applications andthe gas temperature can strongly influence the ozone production [25], spa-tially resolved gas temperatures are obtained by Rayleigh scattering [26, 27].The spatially resolved gas temperature and the corresponding ozone densityare compared and a strong correlation is found. In addition, the produc-tion and destruction mechanisms of ozone in the different plasma zones areanalyzed by comparing the experimental results with the calculated ozoneconcentration of a zero-dimensional chemical model in plug flow mode toexplain the observed O3 profile. In view of the O3 profile reported in [16],which could not be explained by O2 chemistry, air entrainment and a fullset of chemistry including humid air chemistry which consists of about 1890reactions is included.
2.2 Experimental setup
2.2.1 The plasma jet
Figure 2.1(a) shows the geometry of the APPJ. An image of the operatingplasma jet is shown in figure 2.1(b). The APPJ used in this work is a RF ex-cited DBD-like source [28]. The source operates open to the surrounding airand an Ar-O2 gas mixture is fed through a quartz tube (inner � = 1.8 mm)surrounding the needle electrode (� = 1 mm) positioned in the center of thetube. A grounded copper ring is placed outside the quartz tube to obtain the
13
Spatially resolved distribution of O3 and Tg
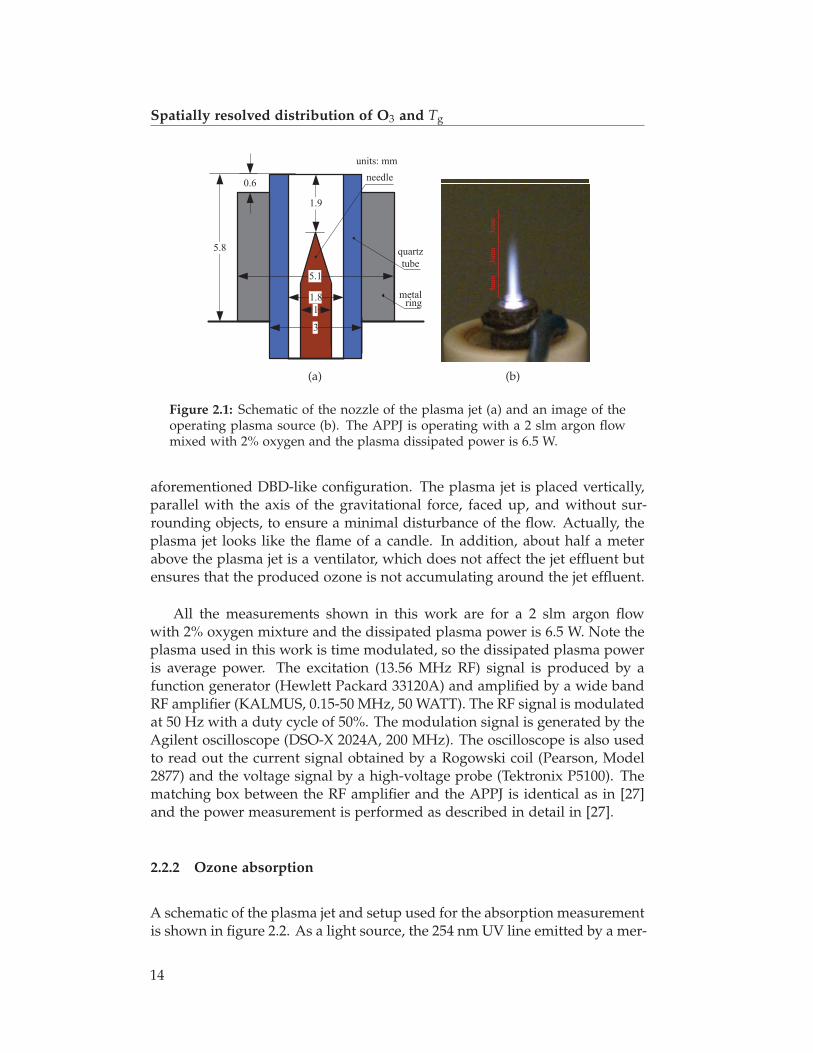
(a) (b)
Figure 2.1: Schematic of the nozzle of the plasma jet (a) and an image of theoperating plasma source (b). The APPJ is operating with a 2 slm argon flowmixed with 2% oxygen and the plasma dissipated power is 6.5 W.
aforementioned DBD-like configuration. The plasma jet is placed vertically,parallel with the axis of the gravitational force, faced up, and without sur-rounding objects, to ensure a minimal disturbance of the flow. Actually, theplasma jet looks like the flame of a candle. In addition, about half a meterabove the plasma jet is a ventilator, which does not affect the jet effluent butensures that the produced ozone is not accumulating around the jet effluent.
All the measurements shown in this work are for a 2 slm argon flowwith 2% oxygen mixture and the dissipated plasma power is 6.5 W. Note theplasma used in this work is time modulated, so the dissipated plasma poweris average power. The excitation (13.56 MHz RF) signal is produced by afunction generator (Hewlett Packard 33120A) and amplified by a wide bandRF amplifier (KALMUS, 0.15-50 MHz, 50 WATT). The RF signal is modulatedat 50 Hz with a duty cycle of 50%. The modulation signal is generated by theAgilent oscilloscope (DSO-X 2024A, 200 MHz). The oscilloscope is also usedto read out the current signal obtained by a Rogowski coil (Pearson, Model2877) and the voltage signal by a high-voltage probe (Tektronix P5100). Thematching box between the RF amplifier and the APPJ is identical as in [27]and the power measurement is performed as described in detail in [27].
2.2.2 Ozone absorption
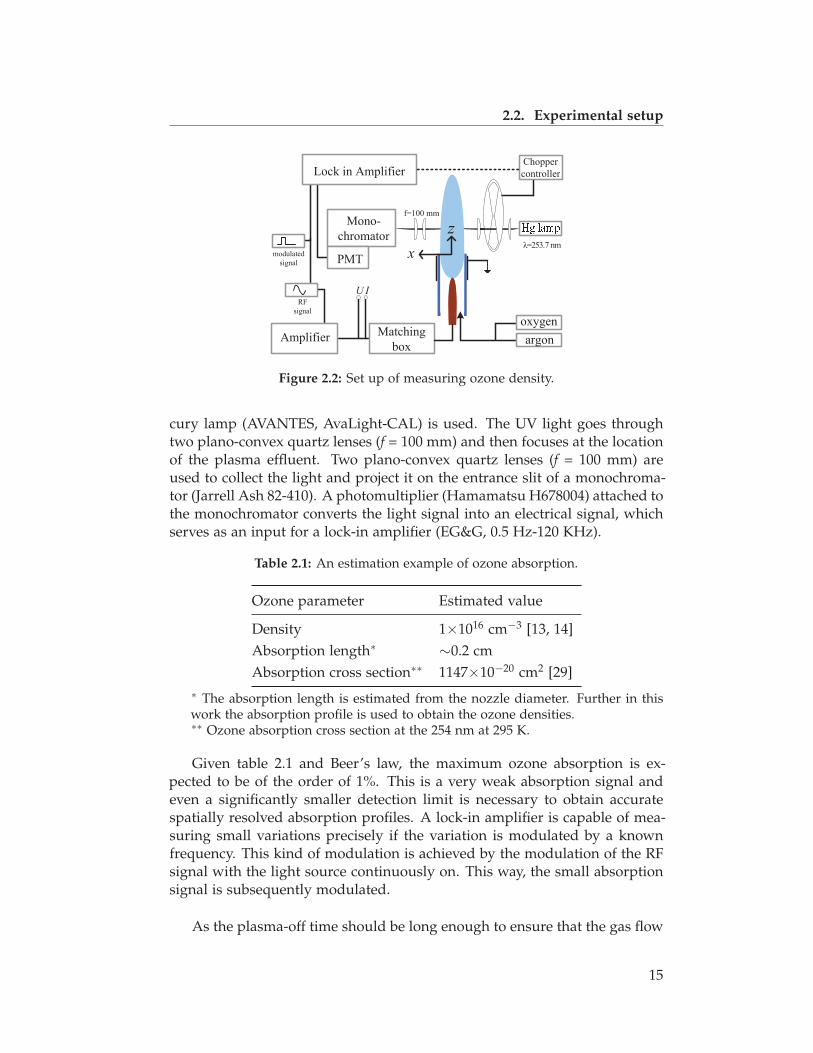
A schematic of the plasma jet and setup used for the absorption measurementis shown in figure 2.2. As a light source, the 254 nm UV line emitted by a mer-
14
2.2. Experimental setup
Figure 2.2: Set up of measuring ozone density.
cury lamp (AVANTES, AvaLight-CAL) is used. The UV light goes throughtwo plano-convex quartz lenses (f = 100 mm) and then focuses at the locationof the plasma effluent. Two plano-convex quartz lenses (f = 100 mm) areused to collect the light and project it on the entrance slit of a monochroma-tor (Jarrell Ash 82-410). A photomultiplier (Hamamatsu H678004) attached tothe monochromator converts the light signal into an electrical signal, whichserves as an input for a lock-in amplifier (EG&G, 0.5 Hz-120 KHz).
Table 2.1: An estimation example of ozone absorption.
Ozone parameter Estimated value
Density 1×1016 cm−3 [13, 14]Absorption length∗ ∼0.2 cmAbsorption cross section∗∗ 1147×10−20 cm2 [29]
∗ The absorption length is estimated from the nozzle diameter. Further in thiswork the absorption profile is used to obtain the ozone densities.∗∗ Ozone absorption cross section at the 254 nm at 295 K.
Given table 2.1 and Beer’s law, the maximum ozone absorption is ex-pected to be of the order of 1%. This is a very weak absorption signal andeven a significantly smaller detection limit is necessary to obtain accuratespatially resolved absorption profiles. A lock-in amplifier is capable of mea-suring small variations precisely if the variation is modulated by a knownfrequency. This kind of modulation is achieved by the modulation of the RFsignal with the light source continuously on. This way, the small absorptionsignal is subsequently modulated.
As the plasma-off time should be long enough to ensure that the gas flow
15

Spatially resolved distribution of O3 and Tg
flushes away the ozone produced in the plasma, a low frequency plasmamodulation of 50 Hz is used. Given the diameter of the quartz tube of 1.8mm and the gas flow of 2 slm, the velocity of the gas flow is estimated tobe approximately 13.1 m/s at 300 K. This means that the O3 is removed bythe flow over a length of 25 mm in 1.9 ms. According to this estimation,a plasma-off time of 10 ms is enough for the gas flow to flush away theproduced ozone.
Figure 2.3: Schematic of signals used to measure the ozone absorbance.Dashed line: I = 0.
The intensity of the incident UV light, I0, is measured and displayed ascurve S1 in figure 2.3. It is modulated by a variable light chopper (PAR,Model 191). The lock-in amplifier detects the differential signal Ilock−in,1,which is in this case equal to I0. The duty cycle of the modulation producedby the chopper is 50%. The modulation signal for the plasma is set to thesame frequency as the chopper (curve S2 and S3 in figure 2.3).
Signal S2 is recorded when the UV light is continuously on, the variationIlock−in,2 is now caused by the absorption due to the O3 density while theplasma is on. The absorption intensity of ozone Ion is obtained from S2,however the modulation of the RF signal also causes a modulation of theplasma emission, Iem. This is shown as curve S3 which is measured with thesame settings as for the S2 signal but with the UV light source switched off.
The absorption of ozone is obtained as Iabsorbance = (Ion − Iem)/I0.
16

2.2. Experimental setup
y
N(x0,y,z0)
x
xx0
Iabsorbance(x,z0)
Figure 2.4: 2D diagram in the z = z0 plane of ozone density distribution andthe measured absorption profile on the axis x = x0.
2.2.3 Spatially resolved ozone density
In figure 2.4, a schematic representation of the ozone density and absorptionprofile is shown. According to Beer’s law, the absorption of ozone is relatedto the ozone density distribution as follows:
exp(−∫ +L
−Lσ(T)N(x0, y, z)dy) =
II0
(2.1)
in which, σ is the absorption cross section of ozone; N is the ozone density;I and I0 is the intensity of the transmitted light and the incident light, re-spectively. It should be mentioned that the ozone absorption cross sectionat 254 nm decreases about 20% from 300 K to 900 K [30] but the affect ofthe decrease on ozone density is little (see further). Rewriting the formulawith the notations introduced above as the signals obtained from the lock-inamplifier, it can be rewritten as
∫ +L
−Lσ(T)N(x0, y, z)dy = − ln(
I0 − (Ion − Iem)
I0)
= − ln(1 − Iabsorbance)
≈ Iabsorbance
(2.2)
The last approximation is valid for a small absorbance as is the case in thiswork. It should be stated that the absorption at 254nm is solely due to ozoneas verified in [15] for similar experimental conditions.
Figure 2.4 illustrates that the experimentally obtained absorption profileis a line of sight integrated measurement while a spatially resolved ozonedensity needs to be obtained. The inverse Abel transform [14, 15, 31–34] and
17

Spatially resolved distribution of O3 and Tg
deconvolution [35, 36] allow to obtain the spatially resolved ozone densityfrom the measured Iabsorbance(x, z).
(a) (b)
Figure 2.5: (a) Absorption profile fitted with the above method by a linearcombination of the Abel transformed two base functions: k1 = 0, σ1 = 1.5, C1= 0.025, k2 = 2, σ2 = 0.5, C2 = 0.16 and (b) the corresponding ozone densityprofile (sum of the two base functions) obtained by fitting in (a) at an axialposition of z = 7 mm.
However, if the experimental data are directly used to obtain ozone den-sities by the inverse Abel transform, the obtained solution is very sensitiveto the absorption profile, which will lead to a large inaccuracy because asmall error at the edge of the absorption profile accumulates to a large er-ror in the center part of the density profile. Generally, fitting methods areused to smooth the raw experimental data [14, 31, 32]. For the experimentaldata obtained in this work, it is found that the obtained profiles have twodifferent shapes, one of which has a depletion in the center part as shownin figure 2.5(a), the other one is Gaussian-like shaped as in [14] . Becauseof this depletion, it is difficult to fit this kind of profile to apply the inverseAbel transform. In addition, if the size of the focus point obtained using apinhole (HP-CU Gold, � = 50 μm) in figure 2.6 is considered, in principle acorrection of the intensity distribution of the UV source as measured at theposition of the plasma jet (a deconvolution of the raw data) should be madebefore the inverse Abel transform is performed.
Because of such difficulties, we use an alternative method presentedin [37], which is based on the Abel transform and convolution using ananalytical solution of the Abel transform for a base set of functions. Theunknown profile of the ozone density, which will have a more significant dipthan the absorption profile in the center part due to the line of sight inte-gration (see also figure 2.4), is reconstructed as a linear combination of the
18
2.2. Experimental setup
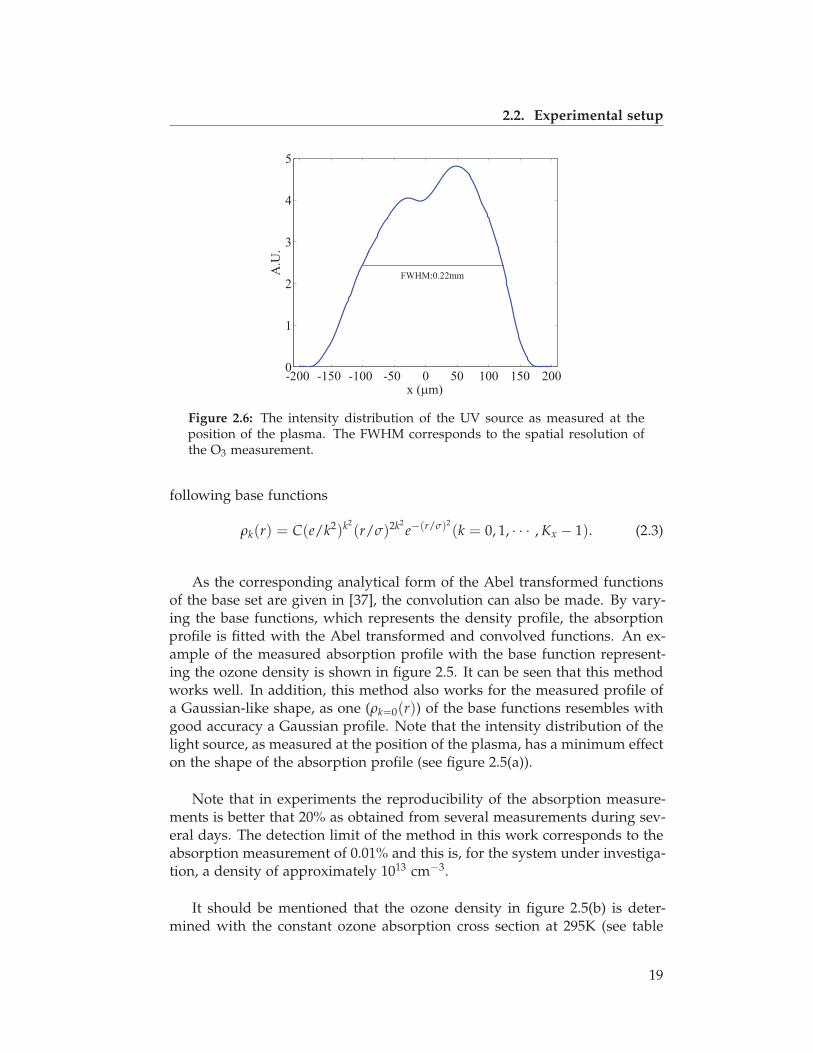
Figure 2.6: The intensity distribution of the UV source as measured at theposition of the plasma. The FWHM corresponds to the spatial resolution ofthe O3 measurement.
following base functions
ρk(r) = C(e/k2)k2(r/σ)2k2
e−(r/σ)2(k = 0, 1, · · · , Kx − 1). (2.3)
As the corresponding analytical form of the Abel transformed functionsof the base set are given in [37], the convolution can also be made. By vary-ing the base functions, which represents the density profile, the absorptionprofile is fitted with the Abel transformed and convolved functions. An ex-ample of the measured absorption profile with the base function represent-ing the ozone density is shown in figure 2.5. It can be seen that this methodworks well. In addition, this method also works for the measured profile ofa Gaussian-like shape, as one (ρk=0(r)) of the base functions resembles withgood accuracy a Gaussian profile. Note that the intensity distribution of thelight source, as measured at the position of the plasma, has a minimum effecton the shape of the absorption profile (see figure 2.5(a)).
Note that in experiments the reproducibility of the absorption measure-ments is better that 20% as obtained from several measurements during sev-eral days. The detection limit of the method in this work corresponds to theabsorption measurement of 0.01% and this is, for the system under investiga-tion, a density of approximately 1013 cm−3.
It should be mentioned that the ozone density in figure 2.5(b) is deter-mined with the constant ozone absorption cross section at 295K (see table
19

Spatially resolved distribution of O3 and Tg
2.1). Since the gas temperature has an effect on the ozone absorption crosssection, corrections should be made to the density profile with the gas tem-perature distribution obtained (see further).
2.2.4 Rayleigh scattering
Gas temperature plays an important role in the ozone production and de-struction [25]. To analyze the effect of the gas temperature on the ozonedensity distribution, Rayleigh scattering is performed to measure the gas tem-perature distribution in the jet. A schematic representation of the Rayleighscattering measurement is shown in figure 2.7.
Figure 2.7: Set up for measuring the gas temperature by Rayleigh scattering.
A Nd:YAG laser (EdgeWave, λ = 532 nm, 4000 Hz) is used. The laserenergy is lower than 1 mJ per pulse. The laser beam is guided by threereflection mirrors to a plano-convex lens (f = 250 mm) which focuses thelaser beam on the axial line of the effluent of the plasma jet. The scatteredlight perpendicular to the incident laser beam is collected by an iCCD camera(Stanford Computer Optics, 4 Picos, 200 ps). A plano-convex lens (f = 300mm) images the scattered light on the iCCD. The spatial resolution of thissystem is 0.2 mm.
The iCCD camera is triggered by the signal produced by a pulse/delaygenerator (BNC, Model575), which is shown in figure 2.8. The delay genera-
20
2.2. Experimental setup
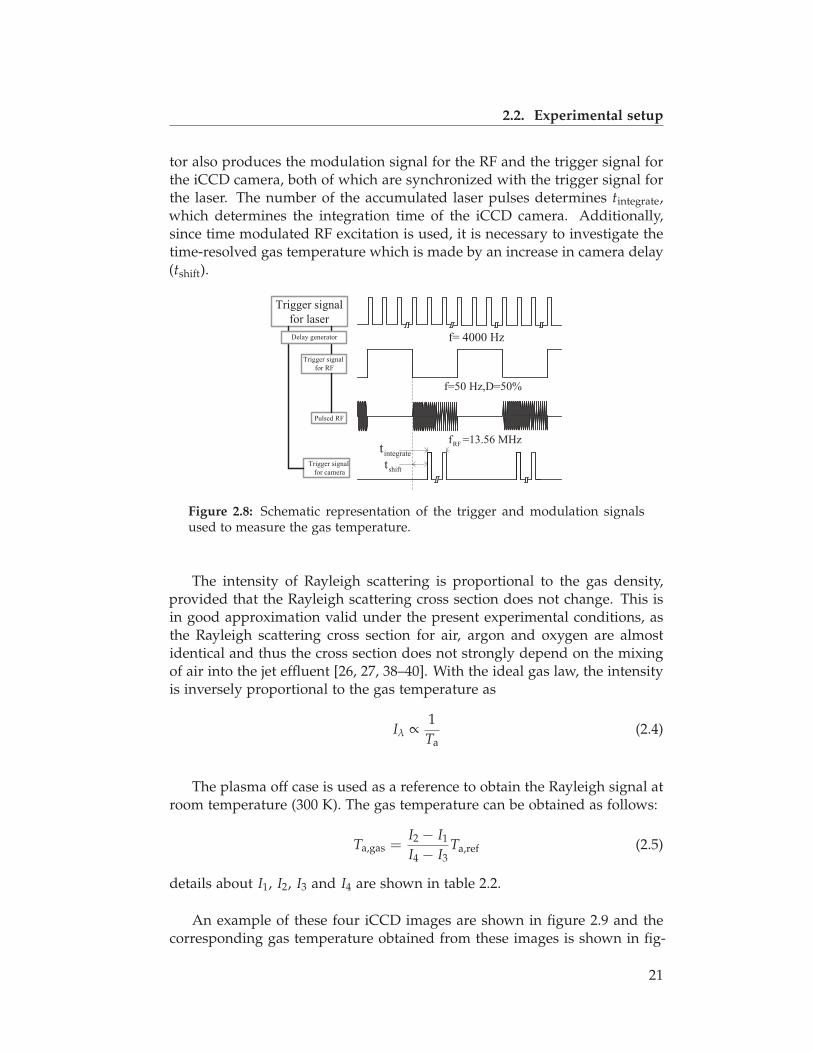
tor also produces the modulation signal for the RF and the trigger signal forthe iCCD camera, both of which are synchronized with the trigger signal forthe laser. The number of the accumulated laser pulses determines tintegrate,which determines the integration time of the iCCD camera. Additionally,since time modulated RF excitation is used, it is necessary to investigate thetime-resolved gas temperature which is made by an increase in camera delay(tshift).
Figure 2.8: Schematic representation of the trigger and modulation signalsused to measure the gas temperature.
The intensity of Rayleigh scattering is proportional to the gas density,provided that the Rayleigh scattering cross section does not change. This isin good approximation valid under the present experimental conditions, asthe Rayleigh scattering cross section for air, argon and oxygen are almostidentical and thus the cross section does not strongly depend on the mixingof air into the jet effluent [26, 27, 38–40]. With the ideal gas law, the intensityis inversely proportional to the gas temperature as
Iλ ∝1Ta
(2.4)
The plasma off case is used as a reference to obtain the Rayleigh signal atroom temperature (300 K). The gas temperature can be obtained as follows:
Ta,gas =I2 − I1
I4 − I3Ta,ref (2.5)
details about I1, I2, I3 and I4 are shown in table 2.2.
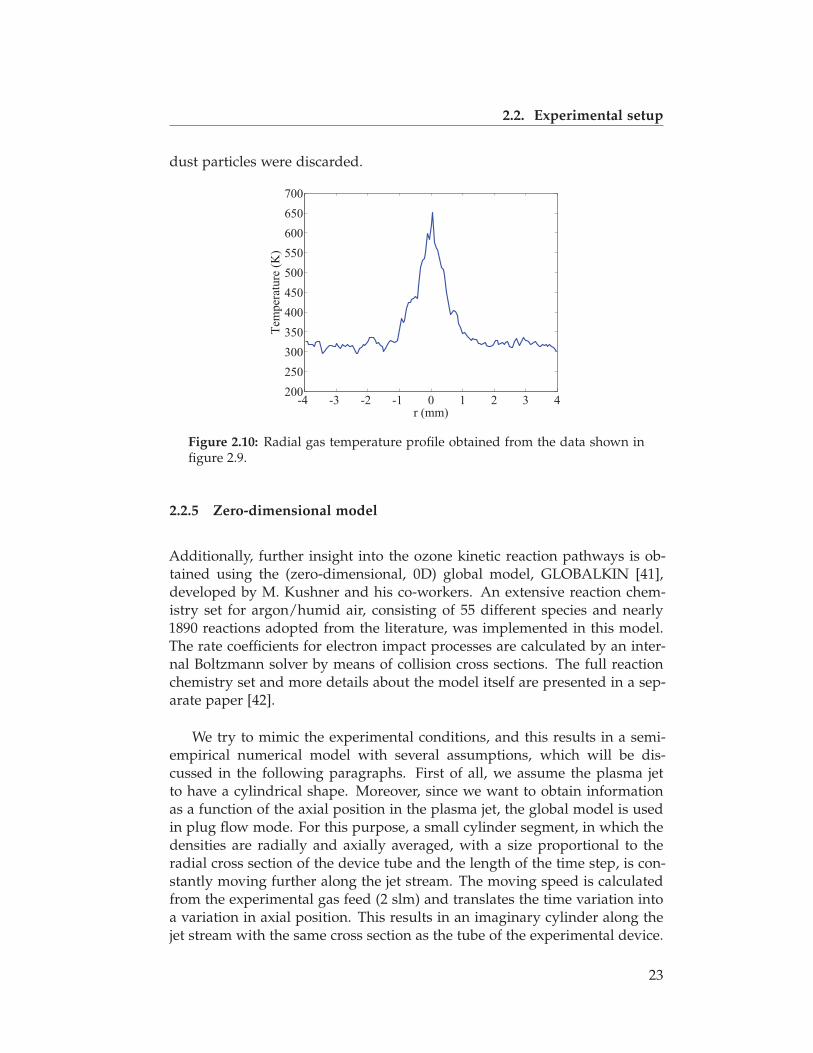
An example of these four iCCD images are shown in figure 2.9 and thecorresponding gas temperature obtained from these images is shown in fig-
21
Spatially resolved distribution of O3 and Tg
(a) (b)
(c) (d)
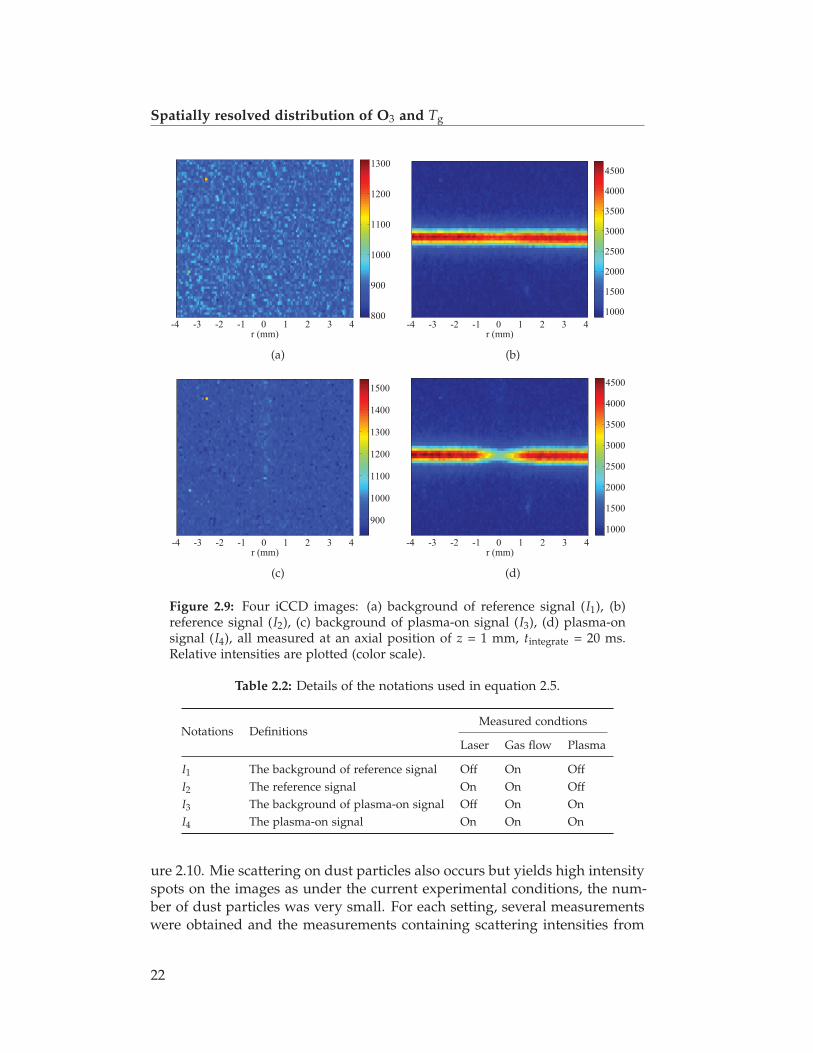
Figure 2.9: Four iCCD images: (a) background of reference signal (I1), (b)reference signal (I2), (c) background of plasma-on signal (I3), (d) plasma-onsignal (I4), all measured at an axial position of z = 1 mm, tintegrate = 20 ms.Relative intensities are plotted (color scale).
Table 2.2: Details of the notations used in equation 2.5.
Notations DefinitionsMeasured condtions
Laser Gas flow Plasma
I1 The background of reference signal Off On OffI2 The reference signal On On OffI3 The background of plasma-on signal Off On OnI4 The plasma-on signal On On On
ure 2.10. Mie scattering on dust particles also occurs but yields high intensityspots on the images as under the current experimental conditions, the num-ber of dust particles was very small. For each setting, several measurementswere obtained and the measurements containing scattering intensities from
22
2.2. Experimental setup
dust particles were discarded.
Figure 2.10: Radial gas temperature profile obtained from the data shown infigure 2.9.
2.2.5 Zero-dimensional model
Additionally, further insight into the ozone kinetic reaction pathways is ob-tained using the (zero-dimensional, 0D) global model, GLOBALKIN [41],developed by M. Kushner and his co-workers. An extensive reaction chem-istry set for argon/humid air, consisting of 55 different species and nearly1890 reactions adopted from the literature, was implemented in this model.The rate coefficients for electron impact processes are calculated by an inter-nal Boltzmann solver by means of collision cross sections. The full reactionchemistry set and more details about the model itself are presented in a sep-arate paper [42].
We try to mimic the experimental conditions, and this results in a semi-empirical numerical model with several assumptions, which will be dis-cussed in the following paragraphs. First of all, we assume the plasma jetto have a cylindrical shape. Moreover, since we want to obtain informationas a function of the axial position in the plasma jet, the global model is usedin plug flow mode. For this purpose, a small cylinder segment, in which thedensities are radially and axially averaged, with a size proportional to theradial cross section of the device tube and the length of the time step, is con-stantly moving further along the jet stream. The moving speed is calculatedfrom the experimental gas feed (2 slm) and translates the time variation intoa variation in axial position. This results in an imaginary cylinder along thejet stream with the same cross section as the tube of the experimental device.
23
Spatially resolved distribution of O3 and Tg
The plug flow approach means that axial transport of mass and energy due todrift and concentration gradients is small in comparison with axial transportby convection. This model was already successfully used before to simulateplug flow systems with He/O2 mixtures [43].
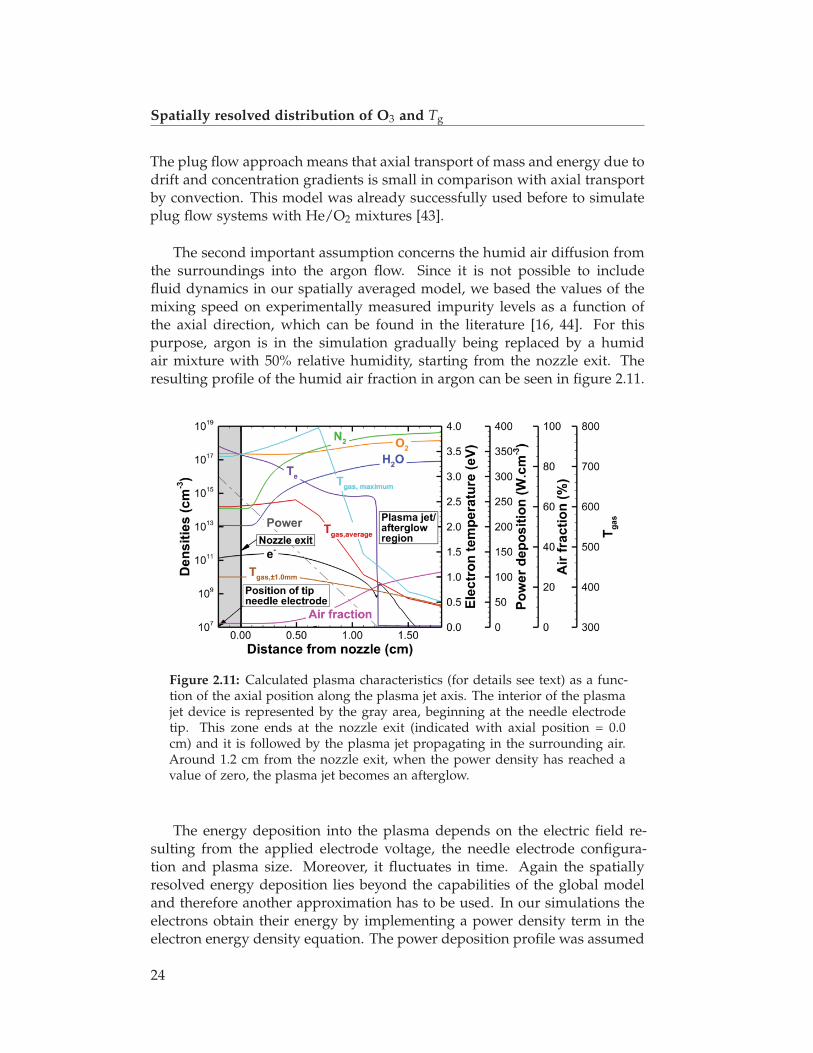
The second important assumption concerns the humid air diffusion fromthe surroundings into the argon flow. Since it is not possible to includefluid dynamics in our spatially averaged model, we based the values of themixing speed on experimentally measured impurity levels as a function ofthe axial direction, which can be found in the literature [16, 44]. For thispurpose, argon is in the simulation gradually being replaced by a humidair mixture with 50% relative humidity, starting from the nozzle exit. Theresulting profile of the humid air fraction in argon can be seen in figure 2.11.
Figure 2.11: Calculated plasma characteristics (for details see text) as a func-tion of the axial position along the plasma jet axis. The interior of the plasmajet device is represented by the gray area, beginning at the needle electrodetip. This zone ends at the nozzle exit (indicated with axial position = 0.0cm) and it is followed by the plasma jet propagating in the surrounding air.Around 1.2 cm from the nozzle exit, when the power density has reached avalue of zero, the plasma jet becomes an afterglow.
The energy deposition into the plasma depends on the electric field re-sulting from the applied electrode voltage, the needle electrode configura-tion and plasma size. Moreover, it fluctuates in time. Again the spatiallyresolved energy deposition lies beyond the capabilities of the global modeland therefore another approximation has to be used. In our simulations theelectrons obtain their energy by implementing a power density term in theelectron energy density equation. The power deposition profile was assumed
24

2.2. Experimental setup
to have a maximum at the needle electrode tip and it decreases linearly tozero at a position of 12mm after the nozzle exit. The relation between thepower density and the distance from the nozzle exit is probably not exactlylinear in reality, but up to this moment there is no relevant experimental ormodeling data available on this. The total power deposition in the modelmatches exactly the experimentally measured value of 6.5 W. Additionally,the maximum value of the power density (at the needle tip) is selected togive realistic species densities besides ozone. Indeed, for the O, NO and OHdensities our values lie within one order of magnitude of typically values re-ported in the literature [12, 44, 45] for similar experimental conditions. Notethat ne is significantly smaller than the measurements by Hofmann et al [27].However, the latter was measured at around 2.5 mm away from the pin elec-trode and as in the experiment a tendency to form a filament close to theneedle is observed. Indeed, it is expected that ne is much lower in the bulkof the jet which is modeled by the zero-dimensional model, and where thedensities are averaged over a rather large volume. Furthermore, processeslike secondary electron emission at the needle tip can not be included in themodel, and this certainly has an effect as well. The power density remainshigh throughout the jet region as long as the emission is observed; otherwisethe electron density rapidly drops and the jet essentially would become anafterglow. This can also be seen in figure 2.11. The calculated value of theelectron temperature is a reasonable value; it is only slightly higher than thevalues reported in the literature (i.e., typically around 1 - 2.5 eV [46–48]). Thisis expected since the electron density is probably somewhat underestimatedand thus the same power is distributed over fewer electrons.
The last assumption concerns the gas temperature profile. Since the latteris essential to model the plasma chemistry correctly, especially for ozone [22],it was not calculated (e.g. from contributions of reaction enthalpy) but fittedto the experimentally measured gas temperature. Three different profiles areconsidered (see further): a temperature at a radial position ±1 mm off-axis,a maximum temperature at the symmetry axis, and a temperature radiallyaveraged over all values in between -1 mm and +1 mm from the jet axis.Although an experimentally measured gas temperature profile is used in thecalculations, self-consistent calculations were also performed and resulted ina very similar gas temperature to the averaged experimental values with amaximum of 630 K at an axial position z = 8 mm and 590 K at the nozzleexit. Additionally, also the ozone densities deviated only slightly (factor 2maximum) from the results presented later in this work. This self-consistenttemperature calculation was not used in the final calculations because inreality there are extra cooling processes like gas expansion and diffusion ofcold surrounding air, which can not be included in the plug flow systems.This resulted in a much slower decrease of the gas temperature compared tothe experimentally obtained profile.
25

Spatially resolved distribution of O3 and Tg
The advantage of this semi-empirical approach is the possibility toinclude a full description of the plasma chemistry necessary for aAr/N2/O2/H2O mixture, without excessive calculation times. However, theresulting species densities should be considered more in a qualitative than ina quantitative way, and experimental validation is very important.
2.3 Results and discussions
2.3.1 The gas temperature
The time-resolved gas temperature at z = 1 mm in the core of the plasmais presented in figure 2.12(a). The gas temperature is about 780 K whenthe plasma is on, and reduces to 500 K when the plasma is off. The gastemperature during the plasma on phase is larger than during the plasma offphase. As the ozone is produced and measured during the plasma on phase,the temperature at tshift = 13 ms (tintegrate = 2 ms) is chosen to analyze theeffect of gas temperature on the ozone density.
(a) Maximum gas temperature (b) Gas temperature (K)
Figure 2.12: Time-resolved gas temperature during one period at axial po-sition z=1 mm (a) and spatially resolved gas temperature (b) for the sameplasma conditions as figure 2.13.
Figure 2.12(b) shows the two-dimensional distribution of the gas tempera-ture. On every different axial plane, the maximum gas temperature is alwayslocated on the axis of symmetry. In radial direction, the temperature de-creases quickly within ±1 mm. In the axial direction, between z = 8 - 13 mm,the gas temperature decreases quickly towards room temperature. Remark-ably the maximum gas temperature is found at a distance of about 7mm from
26

2.3. Results and discussions
the nozzle, which corresponds to the location at which significant mixing ofair into the jet occurs. The exact mechanisms are not clear and it needs tobe mentioned that the increase in temperature is close to the experimentalaccuracy of the temperature measurement (±20 K). Nonetheless, a similarsmall increase in the gas temperature is found in the self-consistent modelwhich is due to heating induced by chemical reactions having excess energyin addition to the reaction products. The gas temperature is larger comparedto the results for e.g the RF Ar based jet (kINPen) developed at the INP [4].The actual power dissipated in the plasma (6.5 W) in this work is expectedto be larger than the power of the kINPen although power consumption hasnot been stated for the kINPen. The discrepancy is not due to the differenttechnique of the gas temperature determination. Different techniques of ob-taining the gas temperature have been compared in detail in our previouswork [27].
2.3.2 Ozone density
(a) Absorption percentage (%) (b) Ozone density (cm−3)
Figure 2.13: Experimentally obtained absorption percentage and ozone den-sity.
Figure 2.13(a) shows the spatially resolved absorption profile of ozone.Figure 2.13(b) is the corresponding ozone density obtained by the procedureoutlined above (see section 2.2.3). Since ozone density in figure 2.13(b) is ob-tained with the constant absorption cross section at 295 K, corrections shouldbe made. Based on [30], a linear fitting is made between the gas temperatureand the absorption cross section. The reality might be more complex, but itcan be expected that the result differs little and a linear fitting is easy to ma-nipulate. With the linear fitting and obtained gas temperature, a correctioncoefficient for the ozone density, i.e., σ(T)/σ(295 K), could be obtained foreach point. From the corrections displayed in figure 2.14, it can be seen that
27

Spatially resolved distribution of O3 and Tg
the distribution differs little with a maximum deviation at the position of themaximum gas temperature between the results in figures 2.14 and 2.13(b) of28%.
Figure 2.14: Ozone density distribution similarly obtained as figure 2.13(b)but including the correction for the temperature dependence of the absorptioncross section.
The distribution of the ozone density consists of two different zones. Inthe zone close to the nozzle in the ionizing plasma, the peak density of ozoneis 1 mm off-axis. In the second zone further downstream and outside theionizing plasma, the maximum density of ozone is on the axis of symme-try. Additionally, the maximum density of ozone, produced by the APPJ, is1.9×1015 cm−3 (2.1×1015 cm−3 for correction) at axial position z = 13 mmfrom the nozzle. The asymmetry of the absorption profile close to the nozzlein figure 2.13(a) is not taken into account for the Abel inversion and an av-erage value of the two maxima is taken to fit the base functions as in figure2.5(a) to obtain the ozone density profile. Comparing figure 2.12(b) and fig-ure 2.13(b), a strong correlation between the gas temperature and the ozonedensity is found. Indeed, in the hot plasma region, the ozone density issmaller compared to the colder effluent and the radial edges of the plasmaplume which also also have a temperature lower than the gas temperature atthe axis of symmetry.
Humidity has not been controlled during the measurement (see belowfor possible influences of humidity on O3 production).
28
2.3. Results and discussions
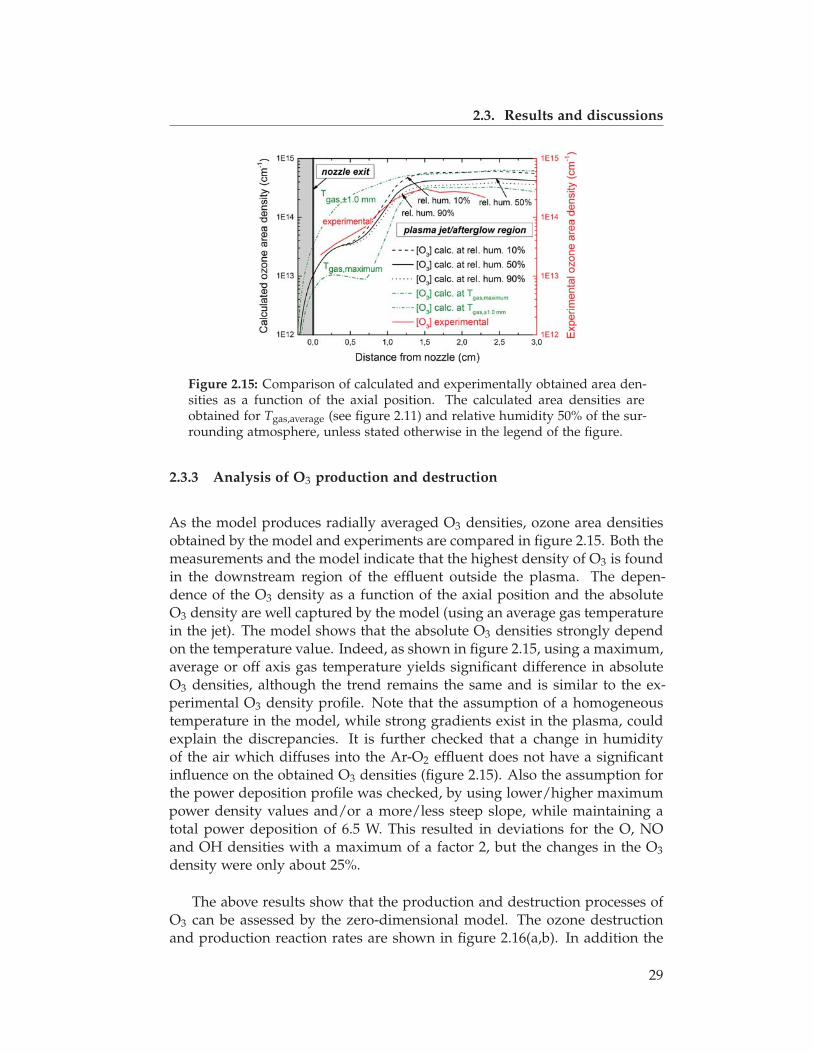
Figure 2.15: Comparison of calculated and experimentally obtained area den-sities as a function of the axial position. The calculated area densities areobtained for Tgas,average (see figure 2.11) and relative humidity 50% of the sur-rounding atmosphere, unless stated otherwise in the legend of the figure.
2.3.3 Analysis of O3 production and destruction
As the model produces radially averaged O3 densities, ozone area densitiesobtained by the model and experiments are compared in figure 2.15. Both themeasurements and the model indicate that the highest density of O3 is foundin the downstream region of the effluent outside the plasma. The depen-dence of the O3 density as a function of the axial position and the absoluteO3 density are well captured by the model (using an average gas temperaturein the jet). The model shows that the absolute O3 densities strongly dependon the temperature value. Indeed, as shown in figure 2.15, using a maximum,average or off axis gas temperature yields significant difference in absoluteO3 densities, although the trend remains the same and is similar to the ex-perimental O3 density profile. Note that the assumption of a homogeneoustemperature in the model, while strong gradients exist in the plasma, couldexplain the discrepancies. It is further checked that a change in humidityof the air which diffuses into the Ar-O2 effluent does not have a significantinfluence on the obtained O3 densities (figure 2.15). Also the assumption forthe power deposition profile was checked, by using lower/higher maximumpower density values and/or a more/less steep slope, while maintaining atotal power deposition of 6.5 W. This resulted in deviations for the O, NOand OH densities with a maximum of a factor 2, but the changes in the O3density were only about 25%.
The above results show that the production and destruction processes ofO3 can be assessed by the zero-dimensional model. The ozone destructionand production reaction rates are shown in figure 2.16(a,b). In addition the
29

Spatially resolved distribution of O3 and Tg
(a)
(b)
(c)
Figure 2.16: Rates of the different reactions calculated by the zero-dimensionalmodel in (a) ozone formation and (b) ozone destruction. (c) Densities of themain species involved in ozone formation and destruction. These data wereobtained by the numerical model (see section 2.2.5).
30

2.3. Results and discussions
densities of the involved species for production and destruction are shownin figure 2.16(c). Three-body association reactions of atomic with molecularoxygen have the most important contribution to the production of ozone.This is due to the very large atomic oxygen density with a maximum up to5×1016 cm−3. Note that this is ten times larger than the 4×1015 cm−3 foundby TALIF for an RF plasma jet [9]. The gas temperature in the present jetis approximately two times larger (700 K compared to below 400 K in thecase of [9]); hence, the local plasma dissipated power will be larger and itcan be expected that the same will be valid for the O density as well. Onthe other hand, since the electron energy is possibly slightly overestimatedas mentioned above, the dissociation rate might be somewhat overestimatedtoo. According to the Boltzmann solver calculations, the dissociation ratemight be reduced to half its value with an average electron temperature of 2eV instead of 3 eV.
Note that in the region of the plasma close to the nozzle, O3 is mainlydestroyed by the abundance of atomic oxygen. However, more downstream(approximately 10 mm from the nozzle), when humid air entrainment be-comes more important, also the destruction of ozone by atomic hydrogenbecomes significant. The density of atomic species drops significantly in thefar effluent which allows for the increase of the O3 density. Note that a sig-nificant decrease of O and H is found in the model at about 13 mm from thenozzle which corresponds to the location of the maximum O3 density foundin the experiment. In the far effluent the destruction of O3 is determined bylong lived species such as NO and O2(a) (O2(a) is singlet oxygen, the firstelectronically excited level at 0.98 eV). The calculations predict that the den-sities of H and O will increase with rising gas temperature (this dependencyis not shown in the figures), but also the rate coefficients of their reactionswith ozone will increase, which results in a much higher destruction rate ofozone. Additionally, the rate coefficients for association of O and O2, therebyforming ozone, are inversely proportional with the gas temperature, whichillustrates again that ozone formation is extremely sensitive to temperatureeffects. This effect can also clearly be seen in figure 2.15, where ozone densityprofiles for three different temperature conditions are plotted.
In the far effluent atomic oxygen is created by a collision between bothlong living species, i.e., O2(a) and O3. Note that it is the only destructionpathway for both O2(a) and O3 in this region. Moreover, the reaction rateis low, since its rate coefficient is proportional with temperature and the jeteffluent has cooled down to nearly room temperature in that area. Thus, thisexplains why O2(a) and O3 are long living species at these timescales.
We also want to stress that the atomic oxygen generated by this process,
31

Spatially resolved distribution of O3 and Tg
is rapidly converted back into ozone, since O association with O2 is at roomtemperature is much faster than the reactions shown in table 2.3.
Table 2.3: Reactions and the rate constants.
Reactions Rate constants Ref
R1 O + O + M → O2+M [Ar] 5.2 × 10⁻³⁵exp(900/Tgas)cm6s−1 [49]R2 O + O3 → O2+O2 8.0 × 10⁻¹²exp(−2060/Tgas)cm3s−1 [50]
Although a direct (inverse) correlation seems to be observed between thegas temperature and the O3 density, the depletion of O3 in the plasma coreis not attributed to thermal dissociation of O3 but it is caused by atomicoxygen and hydrogen, as their density is the largest in the hot core zone ofthe plasma which causes the depletion of O3 in the plasma core.
2.4 Conclusions
A time modulated RF driven DBD-like atmospheric pressure plasma jet inAr + 2% O2, operating at 6.5 W is investigated. Spatially resolved ozonedensities and gas temperatures are obtained by UV absorption and Rayleighscattering respectively. Significant gas heating in the core of the plasma up to700K is found and the elevated gas temperature is correlated by a decreasein O3 density. The maximum ozone density is found at 13 mm from thenozzle, downstream of the plasma and equals 2×1015 cm−3. The productionand destruction reactions of O3 in the plasma jet as a function of the distancefrom the nozzle obtained from a zero dimensional chemical kinetics modelin plug flow mode are presented in detail. In the core of the plasma the O3 isproduced from O and O2 in three-body reactions while the O3 dissociation in-duced by atomic species (O and H) are found to be important. In the effluentdownstream, where the O density is significantly reduced, O3 is producedless efficiently and the destruction of O3 is due to long lived species such asNO and O2(a). The boundary between the two zones is determined by thesignificant drop of O and H at about 13 mm from the nozzle. This locationcorresponds with the position of the maximum observed O3 density. It isshown by the zero-dimensional model that the gas temperature has a majoreffect on the species (O and H) concentrations which strongly determinesthe O3 density. In addition the reactions rates involved in destruction andproduction of O3 are temperature dependent but it needs to be emphasizedthat thermal dissociation of O3 is not causing the depletion of O3 in the coreof the plasma.
32

References
References
[1] M. Laroussi and X. Lu. Room-temperature atmospheric pressure plasmaplume for biomedical applications. Applied Physics Letters, 87(11):113902–113902, 2005.
[2] M. G. Kong, G. Kroesen, G. Morfill, T. Nosenko, T. Shimizu, J. van Dijk,and J. L. Zimmermann. Plasma medicine: an introductory review. NewJournal of Physics, 11(11):115012, 2009.
[3] G. Lloyd, G. Friedman, S. Jafri, G. Schultz, A. Fridman, and K. Harding.Gas plasma: medical uses and developments in wound care. PlasmaProcesses and Polymers, 7(3-4):194–211, 2009.
[4] K. D. Weltmann, E. Kindel, T. von Woedtke, M. Hähnel, M. Stieber,and R. Brandenburg. Atmospheric-pressure plasma sources: Prospec-tive tools for plasma medicine. Pure and Applied Chemistry, 82(6):1223,2010.
[5] H. W. Lee, G. Y. Park, Y. S. Seo, Y. H. Im, S. B. Shim, and H. J. Lee.Modelling of atmospheric pressure plasmas for biomedical applications.Journal of Physics D: Applied Physics, 44(5):053001, 2011.
[6] Y.-F. Li, T. Shimizu, J. L. Zimmermann, and G. E. Morfill. Cold atmo-spheric plasma for surface disinfection. Plasma Processes and Polymers,9(6):585–589, 2012.
[7] S. Hofmann, A. Sobota, and P. Bruggeman. Transitions between andcontrol of guided and branching streamers in DC nanosecond pulsedexcited plasma jets. Plasma Science, IEEE Transactions on, 40(11):2888–2899, 2012.
[8] J. Ehlbeck, U. Schnabel, M. Polak, J. Winter, T. von Woedtke, R. Branden-burg, T. von dem Hagen, and K. D. Weltmann. Low temperature atmo-spheric pressure plasma sources for microbial decontamination. Journalof Physics D: Applied Physics, 44(1):013002, 2010.
[9] S. Reuter, K. Niemi, V. Schulz-von der Gathen, and H. F. Döbele. Genera-tion of atomic oxygen in the effluent of an atmospheric pressure plasmajet. Plasma Sources Science and Technology, 18(1):015006, 2008.
[10] N. Knake, S. Reuter, K. Niemi, V. Schulz-von der Gathen, and J. Win-ter. Absolute atomic oxygen density distributions in the effluent of amicroscale atmospheric pressure plasma jet. Journal of Physics D: AppliedPhysics, 41(19):194006, 2008.
33
Spatially resolved distribution of O3 and Tg
[11] N. Knake, K. Niemi, S. Reuter, V. Schulz-von der Gathen, and J. Win-ter. Absolute atomic oxygen density profiles in the discharge core ofa microscale atmospheric pressure plasma jet. Applied Physics Letters,93(13):131503–131503, 2008.
[12] A. V. Pipa, S. Reuter, R. Foest, and K. D. Weltmann. Controlling the NOproduction of an atmospheric pressure plasma jet. Journal of Physics D:Applied Physics, 45(8):085201, 2012.
[13] V. Schulz-von der Gathen, V. Buck, T. Gans, N. Knake, K. Niemi,S. Reuter, L. Schaper, and J. Winter. Optical diagnostics of micro dis-charge jets. Contributions to Plasma Physics, 47(7):510–519, 2007.
[14] S. Reuter, J. Winter, S. Iseni, S. Peters, A. Schmidt-Bleker, M. Dünnbier,J. Schäfer, R. Foest, and K. D. Weltmann. Detection of ozone in a MHz ar-gon plasma bullet jet. Plasma Sources Science and Technology, 21(3):034015,2012.
[15] J. Winter, M. Dünnbier, A. Schmidt-Bleker, A. Meshchanov, S. Reuter,and K. D. Weltmann. Aspects of UV-absorption spectroscopy on ozonein effluents of plasma jets operated in air. Journal of Physics D: AppliedPhysics, 45(38):385201, 2012.
[16] D. Ellerweg, A. von Keudell, and J. Benedikt. Unexpected O and O3production in the effluent of He/O2 microplasma jets emanating intoambient air. Plasma Sources Science and Technology, 21(3):034019, 2012.
[17] S. Kühn, N. Bibinov, R. Gesche, and P. Awakowicz. Non-thermal at-mospheric pressure HF plasma source: generation of nitric oxide andozone for bio-medical applications. Plasma Sources Science and Technol-ogy, 19(1):015013, 2010.
[18] K. Yanallah, F. Pontiga, A. Fernandez-Rueda, and A. Castellanos. Ex-perimental investigation and numerical modelling of positive coronadischarge: ozone generation. Journal of Physics D: Applied Physics,42(6):065202, 2009.
[19] A. Azarpazhooh and H. Limeback. The application of ozone in den-tistry: a systematic review of literature. Journal of dentistry, 36(2):104–116, 2008.
[20] M. H. Ho, J. J. Lee, S. C. Fan, D. M. Wang, L. T. Hou, H. J. Hsieh, andJ. Y. Lai. Efficient modification on plla by ozone treatment for biomedicalapplications. Macromolecular bioscience, 7(4):467–474, 2007.
[21] M. L. Mokoena, C. B. Brink, B. H. Harvey, and D. W. Oliver. Appraisal ofozone as biologically active molecule and experimental tool in biomedi-cal sciences. Medicinal Chemistry Research, 20(9):1687–1695, 2011.
34

References
[22] S. Pekárek. Non-thermal plasma ozone generation. Acta Polytechnica,43(6):047–051, 2003.
[23] U. Kogelschatz. Ozone generation and dust collection. Electrical Dis-charges for Enûironmental Purposes: Fundamentals and Applications, pages315–344, 2000.
[24] B. Eliasson and U. Kogelschatz. Modeling and applications of silentdischarge plasmas. Plasma Science, IEEE Transactions on, 19(2):309–323,1991.
[25] A. Fridman. Plasma chemistry. Cambridge University Press, 2008.
[26] A. F. H. van Gessel, E. A. D. Carbone, P. J. Bruggeman, and J. van derMullen. Laser scattering on an atmospheric pressure plasma jet: dis-entangling Rayleigh, Raman and Thomson scattering. Plasma SourcesScience and Technology, 21(1):015003, 2012.
[27] S. Hofmann, A. F. H. van Gessel, T. Verreycken, and P. Bruggeman.Power dissipation, gas temperatures and electron densities of cold at-mospheric pressure helium and argon RF plasma jets. Plasma SourcesScience and Technology, 20(6):065010, 2011.
[28] X. Lu, M. Laroussi, and V. Puech. On atmospheric-pressure non-equilibrium plasma jets and plasma bullets. Plasma Sources Science andTechnology, 21(3):034005, 2012.
[29] D. Daumont, J. Brion, J. Charbonnier, and J. Malicet. Ozone UV spec-troscopy I: Absorption cross-sections at room temperature. Journal ofatmospheric chemistry, 15(2):145–155, 1992.
[30] D. C. Astholz, A. E. Croce, and J. Troe. Temperature dependence of theozone absorption coefficient in the Hartley continuum. The Journal ofPhysical Chemistry, 86(5):696–699, 1982.
[31] S. Ma, H. Gao, G. Zhang, and L. Wu. A versatile analytical expressionfor the inverse Abel transform applied to experimental data with noise.Applied spectroscopy, 62(6):701–707, 2008.
[32] M. J. Buie, J. T. P. Pender, J. P. Holloway, T. Vincent, P. L. G. Ventzek,and M. L. Brake. Abel’s inversion applied to experimental spectroscopicdata with off axis peaks. Journal of Quantitative Spectroscopy and RadiativeTransfer, 55(2):231–243, 1996.
[33] A. J. Flikweert, A. F. Meunier, T. Nimalasuriya, G. M. W. Kroesen, andW. W. Stoffels. Imaging laser absorption spectroscopy of the metal-halide lamp under hyper-gravity conditions ranging from 1 to 10g. Jour-nal of Physics D: Applied Physics, 41(19):195202, 2008.
35
Spatially resolved distribution of O3 and Tg
[34] C. O. Laux, T. G. Spence, C. H. Kruger, and R. N. Zare. Optical diag-nostics of atmospheric pressure air plasmas. Plasma Sources Science andTechnology, 12(2):125, 2003.
[35] R. Verma. Profile deconvolution method for small computers. NuclearInstruments and Methods in Physics Research, 212(1):323–326, 1983.
[36] M. Morhác and V. Matoušek. Complete positive deconvolution of spec-trometric data. Digital Signal Processing, 19(3):372–392, 2009.
[37] V. Dribinski, A. Ossadtchi, V. A. Mandelshtam, and H. Reisler. Recon-struction of Abel-transformable images: The Gaussian basis-set expan-sion Abel transform method. Review of scientific instruments, 73(7):2634–2642, 2002.
[38] J. M. De Regt, F. P. J. De Groote, J. A. M. Van der Mullen, and D. C.Schram. Air entrainment in an inductively coupled plasma measuredby Raman and Rayleigh scattering. Spectrochimica Acta Part B: AtomicSpectroscopy, 51(12):1527–1534, 1996.
[39] J. A. Sutton and J. F. Driscoll. Rayleigh scattering cross sections of com-bustion species at 266, 355, and 532 nm for thermometry applications.Optics letters, 29(22):2620–2622, 2004.
[40] J. M. Palomares, E. I. Iordanova, A. Gamero, A. Sola, and J. vd Mullen.Atmospheric microwave-induced plasmas in Ar/H2 mixtures studiedwith a combination of passive and active spectroscopic methods. Journalof Physics D: Applied Physics, 43(39):395202, 2010.
[41] R. Dorai and M. J. Kushner. A model for plasma modification ofpolypropylene using atmospheric pressure discharges. Journal of PhysicsD: Applied Physics, 36(6):666, 2003.
[42] W. Van Gaens and A. Bogaerts. Kinetic modelling for an atmosphericpressure argon plasma jet in humid air. Journal of Physics D: AppliedPhysics, 46(27):275201, 2013.
[43] D. S. Stafford and M. J. Kushner. O 2 (1 δ) production in He/O2 mixturesin flowing low pressure plasmas. Journal of applied physics, 96(5):2451–2465, 2004.
[44] S. Reuter, J. Winter, A. Schmidt-Bleker, D. Schroeder, H. Lange,N. Knake, V. Schulz-von der Gathen, and K. D. Weltmann. Atomicoxygen in a cold argon plasma jet: TALIF spectroscopy in ambient airwith modelling and measurements of ambient species diffusion. PlasmaSources Science and Technology, 21(2):024005, 2012.
36

References
[45] Q. Xiong, A. Y. Nikiforov, L. Li, P. Vanraes, N. Britun, R. Snyders, X. P.Lu, and C. Leys. Absolute OH density determination by laser inducedfluorescence spectroscopy in an atmospheric pressure RF plasma jet. TheEuropean Physical Journal D-Atomic, Molecular, Optical and Plasma Physics,66(11):1–8, 2012.
[46] N. Balcon, G. Hagelaar, and J. P. Boeuf. Numerical model of an argonatmospheric pressure RF discharge. Plasma Science, IEEE Transactions on,36(5):2782–2787, 2008.
[47] X. M. Zhu, Y. K. Pu, N. Balcon, and R. Boswell. Measurement of the elec-tron density in atmospheric-pressure low-temperature argon dischargesby line-ratio method of optical emission spectroscopy. Journal of PhysicsD: Applied Physics, 42(14):142003, 2009.
[48] N. Balcon, A. Aanesland, and R. Boswell. Pulsed RF discharges, glowand filamentary mode at atmospheric pressure in argon. Plasma SourcesScience and Technology, 16(2):217, 2007.
[49] J. Y. Jeong, J. Park, I. Henins, S. E. Babayan, V. J. Tu, G. S. Selwyn,G. Ding, and R. F. Hicks. Reaction chemistry in the afterglow of anoxygen-helium, atmospheric-pressure plasma. The Journal of PhysicalChemistry A, 104(34):8027–8032, 2000.
[50] R. Atkinson, D. L. Baulch, R. A. Cox, J. N. Crowley, R. F. Hampson,R. G. Hynes, M. E. Jenkin, M. J. Rossi, J. Troe, et al. Evaluated kineticand photochemical data for atmospheric chemistry: Volume I-gas phasereactions of Ox, HOx, NOx and SOx species. Atmospheric chemistry andphysics, 4(6):1461–1738, 2004.
37

38
CHAPTER 3
The effect of collisional quenching of the O
3p 3PJ state on the determination of the spatial
distribution of the atomic oxygen density in
an APPJ operating in ambient air by TALIF
Abstract
The spatial profile of the absolute atomic oxygen density is obtained bytwo-photon absorption laser induced fluorescence (TALIF) in an Ar+2% aircold atmospheric pressure plasma jet operating in ambient air. The vary-ing air concentration in the jet effluent which contributes to the collisionalquenching of the O 3p 3PJ state, pumped by the laser, strongly influences therecorded TALIF signal under the present experimental conditions. The spa-tially resolved air densities obtained from Raman scattering measurementshave been reported in our work [1]. These densities allow us to calculatethe spatially dependent collisional quenching rate for the O 3p 3PJ state andreconstruct the spatial O density profile from the recorded TALIF signal.Significant differences between the TALIF intensity profile and the actual Odensity profile for the investigated experimental conditions are found.
1A modified version of this chapter is published as S. Zhang, B. van Gessel, S. C. vanGrootel, and P. J. Bruggeman, “The effect of collisional quenching of the O 3p 3PJ state on thedetermination of the spatial distribution of the atomic oxygen density in an APPJ operatingin ambient air by TALIF”, (2014) Plasma Sources Science and Technology 23 025012
2Acknowledgment to Bram van Gessel for the contribution of Raman scattering
39

Collisional quenching on O of TALIF
3.1 Introduction
Cold atmospheric pressure plasma jets (APPJs) have attracted great interestsbecause of their potential biomedical applications and surface treatment ofheat sensitive materials [2–4]. The effluent, which includes many reactivespecies, enables plasma jets to inactivate bacteria and contribute to woundhealing [5]. One of the important species produced in APPJs is atomic oxy-gen. It is the precursor to the long lived ozone which is bactericidal. In ad-dition atomic oxygen is believed to be important for material treatment [6].As the effluent, including the atomic oxygen species, is blown towards thesubstrate, one requires the radial and axial distribution of atomic oxygen to-gether with the gas velocity flow pattern to obtain the total flux which isimportant for the applications. In this work we only focus on the density ofatomic oxygen.
Two-photon absorption laser induced fluorescence (TALIF) is a widelyused laser diagnostic method to obtain the atomic oxygen density [7–13].TALIF is also used in this work. The ground state of atomic oxygen 2p4 3PJis excited by two photons of 225.59 nm to the level 3p 3PJ . The excited Ode-excites to the lower state 3s 3S by emitting a photon at 844.58 nm. Theamount of fluorescence at 844.58 nm allows one to deduce the absolute Odensity in the ground state when a proper calibration is made. Absolutecalibration methods for O TALIF measurements by TALIF on Xenon are wellestablished (see e.g. [7]).
The above description is however strongly complicated at atmosphericpressure due to significant collisional quenching of the excited state. In He-air mixtures in a MW jet, as shown in our previous work [14], the effec-tive lifetime of the excited state of O could be measured even when using ananosecond pulsed laser and the effect of quenching was determined fromthe TALIF measurements itself. As we will show, the effective lifetime ofthe laser excited O is too short under the present experimental conditionsto measure the fluorescence decay when using a nanosecond pulsed laser.Hence the quenching rate needs to be calculated and the densities of thequenchers need to be known or determined. In addition, the air diffusioninto the jet effluent causes a spatial dependence of the collisional quenchingwhich requires the knowledge of the spatial variation in the density of thequenchers.
Duluard et al used mass spectrometry and LIF on OH radicals to esti-mate the intrusion of air in an Ar/O2 RF atmospheric pressure plasma [15].Yonemori et al obtained the 2D distribution of air-helium mixture ratio in ahelium atmospheric plasma jet by LIF on OH radical which has a longer ef-
40

3.2. Experimental setup and conditions
fective lifetime compared to the O 3p 3PJ state [16]. Reuter et al used VUVabsorption to measure the air concentration in an argon plasma jet but onlyobtained and reported the effect of quenching on the determination of theO density on the axis of symmetry. The effect of quenching was reportedto be negligible [11]. In fact this result is to be expected, since the maxi-mum reported air concentration on the axial position between 0 - 7 mm fromthe nozzle is less than 5% in [11]. However, the air density gradient is signifi-cantly larger in radial direction so collisional quenching effects are importantin this case as will be shown in this work.
After a description of the experimental setup and conditions, the time andspatially resolved TALIF intensities are reported. Next the air concentrationsand gas temperature 2D profiles used to correct for the collisional quenchingare shown. Finally, we present the absolutely calibrated 2D atomic oxygendensities in the jet effluent corrected for spatially varying quenching rates.The accuracy of this correction is also discussed.
3.2 Experimental setup and conditions
The APPJ, which is identical to the one used in chapter 2 and previous work[1, 17, 18], is driven by 13.56 MHz RF modulated by 20 kHz waveform withthe duty ratio 20% (10 μs on, 40 μs off). The feeding gas is 1 slm argonmixed with 2% air. The obtained average power dissipated by the plasmais 3.5 W. Details about the plasma jet and the power measurement can befound in [19]. The TALIF measurement is implemented identical as in ourprevious reported work [14]. The schematic representation of the TALIFmeasurement is shown in figure 3.1. The wavelength of 225.5 nm, necessaryfor the TALIF measurement is produced by a dye laser (Sirah, CSTR-LG-3000-HRR) which is pumped by the third harmonic of a Nd-YAG laser (Edgewave,IS6III-E YAG). The 1 kHz laser system is synchronized with the RF signalapplied to the plasma and the detecting unit by a delay generator (BNC,Model 575 pulse/delay generator). The UV laser beam is focused into theplasma effluent by a convex lens (f = 250 mm). The fluorescence light (844.68nm for atomic oxygen) is collected perpendicularly to the laser beam axisand imaged by two lenses (f = 200 mm) onto the 100 μm entrance slit ofa monochromator (Jarrell-Ash 82025, 0.5 m focal length, 1180 grooves/mmgrating). A photomultiplier (Hamamatsu R666), used as a detector on themonochromator, operates in photon counting mode. The counting mode isachieved by a Fast Comtec P7888 time digitizer card with a time resolutionof 1 ns. A laser energy meter (Ophir PD10) is used to obtain the laser energyof every pulse. The absolute calibration method for TALIF, based on themeasurement of the fluorescence light of state 6p′[3/2]2 → 6s′[1/2]1 of a
41
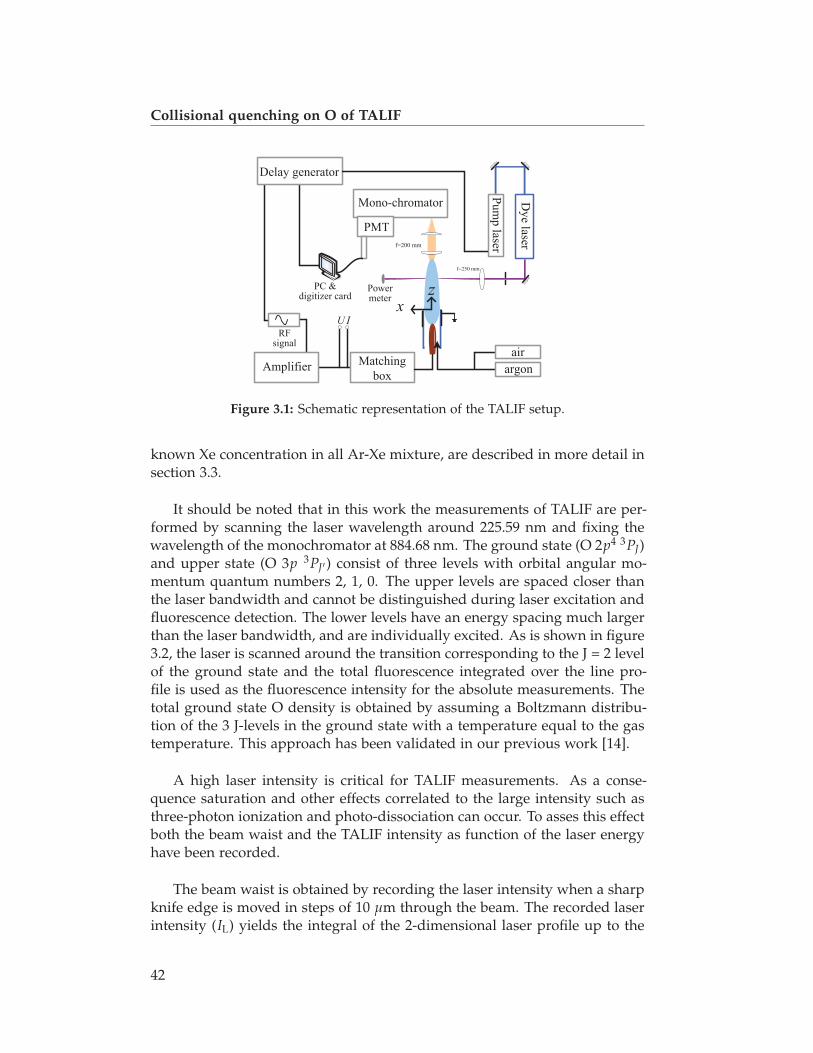
Collisional quenching on O of TALIF
Figure 3.1: Schematic representation of the TALIF setup.
known Xe concentration in all Ar-Xe mixture, are described in more detail insection 3.3.
It should be noted that in this work the measurements of TALIF are per-formed by scanning the laser wavelength around 225.59 nm and fixing thewavelength of the monochromator at 884.68 nm. The ground state (O 2p4 3PJ)and upper state (O 3p 3PJ′) consist of three levels with orbital angular mo-mentum quantum numbers 2, 1, 0. The upper levels are spaced closer thanthe laser bandwidth and cannot be distinguished during laser excitation andfluorescence detection. The lower levels have an energy spacing much largerthan the laser bandwidth, and are individually excited. As is shown in figure3.2, the laser is scanned around the transition corresponding to the J = 2 levelof the ground state and the total fluorescence integrated over the line pro-file is used as the fluorescence intensity for the absolute measurements. Thetotal ground state O density is obtained by assuming a Boltzmann distribu-tion of the 3 J-levels in the ground state with a temperature equal to the gastemperature. This approach has been validated in our previous work [14].
A high laser intensity is critical for TALIF measurements. As a conse-quence saturation and other effects correlated to the large intensity such asthree-photon ionization and photo-dissociation can occur. To asses this effectboth the beam waist and the TALIF intensity as function of the laser energyhave been recorded.
The beam waist is obtained by recording the laser intensity when a sharpknife edge is moved in steps of 10 μm through the beam. The recorded laserintensity (IL) yields the integral of the 2-dimensional laser profile up to the
42
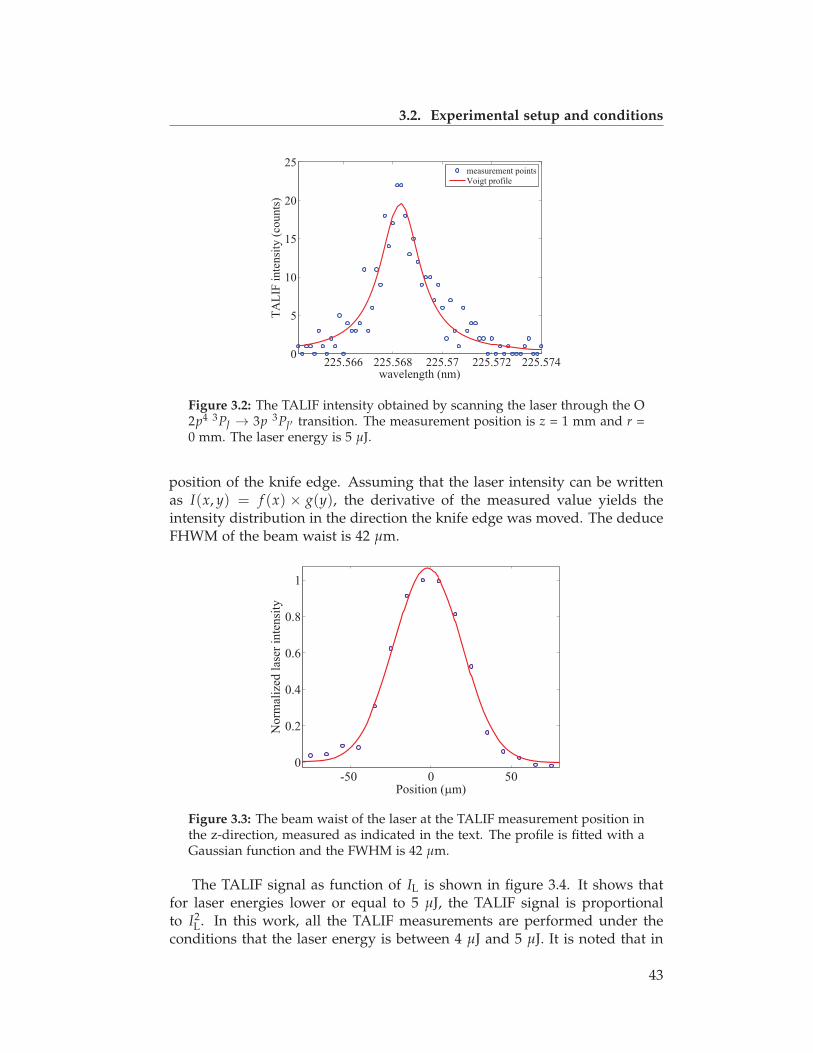
3.2. Experimental setup and conditions
Figure 3.2: The TALIF intensity obtained by scanning the laser through the O2p4 3PJ → 3p 3PJ′ transition. The measurement position is z = 1 mm and r =0 mm. The laser energy is 5 μJ.
position of the knife edge. Assuming that the laser intensity can be writtenas I(x, y) = f (x) × g(y), the derivative of the measured value yields theintensity distribution in the direction the knife edge was moved. The deduceFHWM of the beam waist is 42 μm.
Figure 3.3: The beam waist of the laser at the TALIF measurement position inthe z-direction, measured as indicated in the text. The profile is fitted with aGaussian function and the FWHM is 42 μm.
The TALIF signal as function of IL is shown in figure 3.4. It shows thatfor laser energies lower or equal to 5 μJ, the TALIF signal is proportionalto I2
L. In this work, all the TALIF measurements are performed under theconditions that the laser energy is between 4 μJ and 5 μJ. It is noted that in
43

Collisional quenching on O of TALIF
Figure 3.4: The recorded TALIF intensity as a function of the laser energysquared. The measurement position is chosen at z = 1 mm and r = 0 mm. Thebeam waist is 42 μm.
our previous work [14] a higher energy of the ’linear regime’ has been foundfor He plasmas using the same optics.
As there are some fluctuations in the power measurements presented infigure 3.4, we provide some additional information to estimate the validity ofthe TALIF measurements. The depletion of the ground state is negligible asan estimation of the ratio of the population on upper and lower states leadsto 7×10⁻³. The detection limit of TALIF in this work is 1019 m−3 and in thefar effluent, where the O2 density is the highest, no TALIF signal is observed.This means that photo-dissociation can be neglected in the present experi-ment. In addition also the dominant depopulation mechanism of the excitedstate of O needs to be larger than the depopulation by photo-ionization of thestate. With a peak laser intensity of 60 MW/cm2, the photo-ionization rateis 3.6×10⁷ Hz [20]. Although the photo-ionization rate is close to the sponta-neous emission rate of the excited state (2.9×10⁷ Hz), it remains much lowerthan the effective depopulation rate (∼109 Hz or smaller). Photo-ionizationcan thus also safely be neglected in the present experiment.
The spatial resolution of the TALIF measurement in the z-direction corre-sponds to the beam waist while the radial resolution is in good approxima-tion equal to the entrance slit of the spectrometer which is 100 μm.
44

3.3. Calibration of TALIF
3.3 Calibration of TALIF
In order to obtain the density of atomic oxygen, an absolute calibration ofthe TALIF signal must be performed. In this work, a known concentrationxenon in argon is chosen to perform the calibration, since the xenon levelexcitation 5p6 1S0 → 6p′[3/2]2 by two photons of 224.24 nm is very close tolevel excitation of atomic oxygen 2p4 3PJ → 3p 3PJ′ by two photons of 225.59nm.
According to [14], the TALIF intensity obtained by the photomultiplier isas follows:
S = nlCG(2)σ(2)acE2
hω(3.1)
in which, nl is the density of the ground state level of atomic oxygen orxenon; C is a factor to consider efficiency of optics and sensors; G(2) = 2 isthe photon statistical factor; σ(2) is the two-photon absorption cross section;a is the branching ratio of the observed fluorescence transition; hω is thephoton energy of the laser; c depends on the distribution shape of the laserintensity in time; E is the laser energy.
With xenon a reference gas, the density of atomic oxygen can be ex-pressed as:
nO =σ(2)Xe
σ(2)O
E2Xe
E2O
SO
SXe
aXe
aOnXe (3.2)
effectively eliminating all factors depending on laser beam properties and theused optics and detector. The fluorescence intensities S at the correspondinglaser energies E are measured. σ
(2)Xe / σ
(2)O = 1.9, as in [7]. The branching ratio
for an admixture of 0.2% Xe in 5 slm argon is aXe = 0.0086 as previouslyobtained in [14]. Details of aO is in section 3.4.3.
3.4 Results and discussions
3.4.1 Time and spatially resolved TALIF signal
The RF plasma is power modulated at 20 kHz with a duty cycle of 20%.Figure 3.5 shows the corresponding TALIF signal as a function of time duringthe plasma on and off at a fixed position. It can be concluded from thisfigure that the TALIF signal is in good approximation constant during oneperiod. Also the gas temperature has been found equal in the plasma on and
45

Collisional quenching on O of TALIF
off case [17]. All the measurements in this work are performed 10 μs afterthe plasma is switched off. This is done to avoid a strong time modulatedbackground of the plasma emission (during the RF cycle) which reduces thesignal to noise ratio of the recorded TALIF signal.
Figure 3.5: Time resolved TALIF signal during one modulation period of theplasma. The TALIF signal is recorded at z = 1 mm and r = 0 mm.
The recorded 2D TALIF intensities are shown in figure 3.6. The signalhas been recorded in steps of 100 μm in radial direction and 1 mm in axialdirection. For every axial position, a Gaussian function is used to fit theradial profile, as show in figure 3.6(b).
(a) TALIF intensity (A.U.) (b)
Figure 3.6: (a) The 2D profile of the recorded TALIF signal of atomic oxy-gen. (b) The radial distribution of the TALIF signal at z = 1, 2 and 3 mm.The original data (crosses) are fitted to a Gaussian profile. The position (0,0)corresponds to the position at the nozzle on the axis of symmetry of the jet.
46
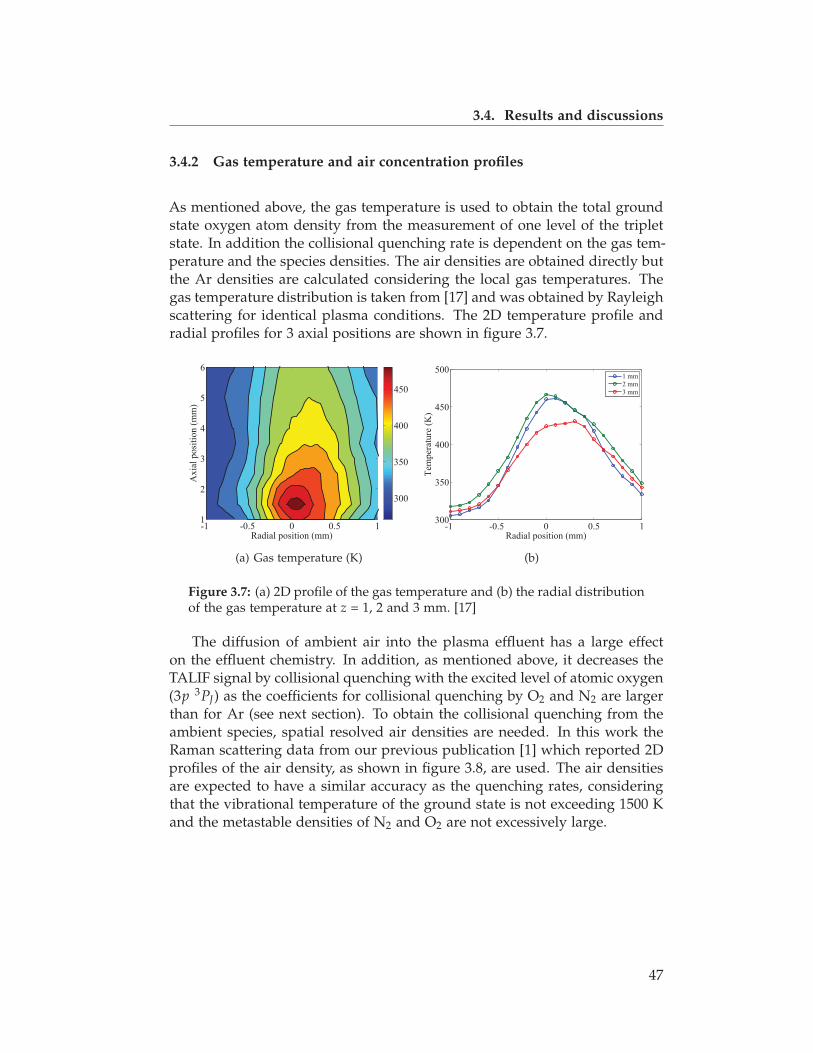
3.4. Results and discussions
3.4.2 Gas temperature and air concentration profiles
As mentioned above, the gas temperature is used to obtain the total groundstate oxygen atom density from the measurement of one level of the tripletstate. In addition the collisional quenching rate is dependent on the gas tem-perature and the species densities. The air densities are obtained directly butthe Ar densities are calculated considering the local gas temperatures. Thegas temperature distribution is taken from [17] and was obtained by Rayleighscattering for identical plasma conditions. The 2D temperature profile andradial profiles for 3 axial positions are shown in figure 3.7.
(a) Gas temperature (K) (b)
Figure 3.7: (a) 2D profile of the gas temperature and (b) the radial distributionof the gas temperature at z = 1, 2 and 3 mm. [17]
The diffusion of ambient air into the plasma effluent has a large effecton the effluent chemistry. In addition, as mentioned above, it decreases theTALIF signal by collisional quenching with the excited level of atomic oxygen(3p 3PJ) as the coefficients for collisional quenching by O2 and N2 are largerthan for Ar (see next section). To obtain the collisional quenching from theambient species, spatial resolved air densities are needed. In this work theRaman scattering data from our previous publication [1] which reported 2Dprofiles of the air density, as shown in figure 3.8, are used. The air densitiesare expected to have a similar accuracy as the quenching rates, consideringthat the vibrational temperature of the ground state is not exceeding 1500 Kand the metastable densities of N2 and O2 are not excessively large.
47
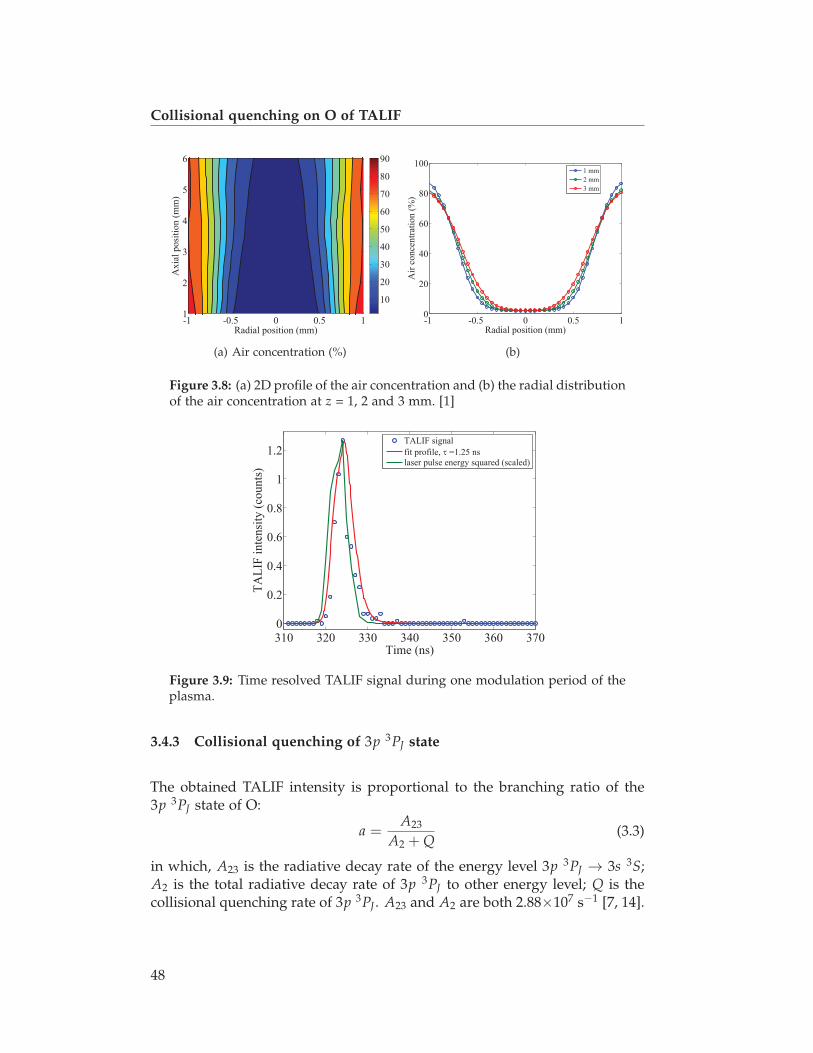
Collisional quenching on O of TALIF
(a) Air concentration (%) (b)
Figure 3.8: (a) 2D profile of the air concentration and (b) the radial distributionof the air concentration at z = 1, 2 and 3 mm. [1]
Figure 3.9: Time resolved TALIF signal during one modulation period of theplasma.
3.4.3 Collisional quenching of 3p 3PJ state
The obtained TALIF intensity is proportional to the branching ratio of the3p 3PJ state of O:
a =A23
A2 + Q(3.3)
in which, A23 is the radiative decay rate of the energy level 3p 3PJ → 3s 3S;A2 is the total radiative decay rate of 3p 3PJ to other energy level; Q is thecollisional quenching rate of 3p 3PJ . A23 and A2 are both 2.88×10⁷ s−1 [7, 14].
48
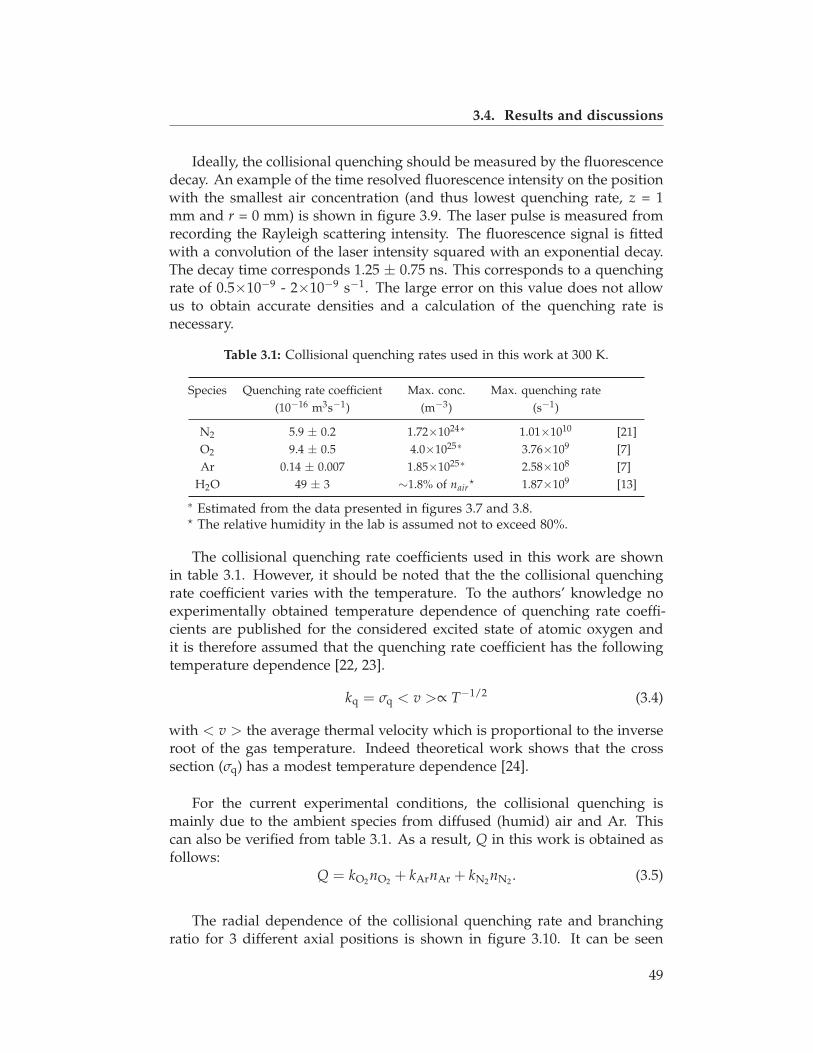
3.4. Results and discussions
Ideally, the collisional quenching should be measured by the fluorescencedecay. An example of the time resolved fluorescence intensity on the positionwith the smallest air concentration (and thus lowest quenching rate, z = 1mm and r = 0 mm) is shown in figure 3.9. The laser pulse is measured fromrecording the Rayleigh scattering intensity. The fluorescence signal is fittedwith a convolution of the laser intensity squared with an exponential decay.The decay time corresponds 1.25 ± 0.75 ns. This corresponds to a quenchingrate of 0.5×10⁻⁹ - 2×10⁻⁹ s−1. The large error on this value does not allowus to obtain accurate densities and a calculation of the quenching rate isnecessary.
Table 3.1: Collisional quenching rates used in this work at 300 K.
Species Quenching rate coefficient Max. conc. Max. quenching rate(10−16 m3s−1) (m−3) (s−1)
N2 5.9 ± 0.2 1.72×1024∗ 1.01×1010 [21]O2 9.4 ± 0.5 4.0×1025∗ 3.76×109 [7]Ar 0.14 ± 0.007 1.85×1025∗ 2.58×108 [7]
H2O 49 ± 3 ∼1.8% of nair� 1.87×10⁹ [13]
∗ Estimated from the data presented in figures 3.7 and 3.8.� The relative humidity in the lab is assumed not to exceed 80%.
The collisional quenching rate coefficients used in this work are shownin table 3.1. However, it should be noted that the the collisional quenchingrate coefficient varies with the temperature. To the authors’ knowledge noexperimentally obtained temperature dependence of quenching rate coeffi-cients are published for the considered excited state of atomic oxygen andit is therefore assumed that the quenching rate coefficient has the followingtemperature dependence [22, 23].
kq = σq < v >∝ T−1/2 (3.4)
with < v > the average thermal velocity which is proportional to the inverseroot of the gas temperature. Indeed theoretical work shows that the crosssection (σq) has a modest temperature dependence [24].
For the current experimental conditions, the collisional quenching ismainly due to the ambient species from diffused (humid) air and Ar. Thiscan also be verified from table 3.1. As a result, Q in this work is obtained asfollows:
Q = kO2 nO2 + kArnAr + kN2 nN2. (3.5)
The radial dependence of the collisional quenching rate and branchingratio for 3 different axial positions is shown in figure 3.10. It can be seen
49

Collisional quenching on O of TALIF
that the collisional quenching depends significantly on the air concentrationin the plasma effluent.
(a) (b)
Figure 3.10: The calculated radial distribution of (a) collisional quenching rateand (b) branching ratio at z = 1, 2 and 3 mm.
In the remainder of this section, the accuracy of the calculated quenchingrates will be evaluated.
The effect of humidity with a realistic upper estimate of a relative humid-ity of 80% corresponding to 1.8% water in the lab air, the maximum effectof the presence of water could lead to 13% underestimate of the effect of thequenching introduced by the humid air which is entering the jet effluent bydiffusion. This underestimate is considered to be acceptable in this work asit is similar to the error on the O density induced by the accuracy of thereported quenching rates.
The plasma also changes the gas composition in situ. The main differencein species in the core of the plasma would be caused by the dissociationof O2, forming O. However, we measured the O2 density by Raman andthe O density is not expected to exceed 18.5% of the O2 density. As thequenching rate for O is smaller than 0.2 times the quenching rate for O2[12] the O2 dissociation process is not significantly influencing the calculatedoverall quenching rate. It should be noted that the density of other speciesor radicals produced by the plasma, such as NO or O3, is not expected toexceed 1021 m−3 (see [17] and chapter 2). This is two orders smaller than theair density in the core of the effluent and is thus not expected to influencethe quenching rates.
3-body quenching processes can play a role at elevated pressures. In ourprevious work, indeed 3-body quenching in Xe TALIF was observed startingat 400 mbar [14]. To the authors’ knowledge, similar effect is not reported
50

3.4. Results and discussions
for O. The accuracy of the measured decay time is too small to enable us tocheck the potential effect of 3-body quenching. In literature, O quenching byAr has been measured up to 0.1 bar by Bittner et al [25] which showed a lineardependence with pressure. Several other groups have also used extrapolatedquenching coefficients [7].
3.4.4 O density
The atomic oxygen density, absolutely calibrated and corrected for spatialdependent quenching, is shown in figure 3.11. Taking into consideration
(a) O density (m−3) (b)
Figure 3.11: (a) The obtained 2D distribution of the O density (b) O densityprofile at z = 1 mm, 2 mm, 3 mm. The dashed line which corresponds to thenormalized TALIF signal is given as a reference.
the collisional quenching due to the air diffusion, the radial density profileof atomic oxygen becomes broader. Within a cylinder with radius 0.3 mm(at least close to the nozzle), the air concentration is lower than 5%, andthe atomic oxygen density profile is almost identical to the TALIF signalprofile. This is consistent with the findings of Reuter et al [11]. Outsidethis cylinder of 0.3 mm, the air concentration starts to increase with a steepgradient between 0.3 mm and 0.6 mm. At this position, collisional quenchingsignificantly starts to reduce the fluorescence intensity and needs to be takeninto account.
For an identical plasma jet a depletion of the ozone is found in the coreof the jet effluent and the maximum of the O3 density is located at a radialdistance of 0.9 mm (see chapter 2). This would not be expected if the Odensity was the same as the recorded TALIF profile, but is consistent withthe O density profile shown in figure 3.11(a). Indeed with the corrected
51

Collisional quenching on O of TALIF
profiles, the O3 density starts to increase at the same position where the Odensity reduces with a steep gradient. This is necessary as inspite the factthat a significant density of O is necessary to produce ozone, a too largedensity of O will destroy it by the reaction O + O3 → 2O2 (see chapter 2).
A similar important effect of quenching on the determination of the Odensity is found at axial distances in excess of 3 mm. This distance is smallerthan what has been found in a similar jet by Reuter et al. It might be ex-plained by the fact that there is more air diffusion in the jet reported in thiswork due to the higher flow rate of argon used in the cited work (1 slm com-pared to 5 slm). The flow pattern is expected to be different from the presentcase. However, as can be seen from figure 3.11(a), the O density reduces andthe air density increases for the zone where z > 3 mm which decreases theaccuracy of the TALIF measurements. It is thus important to consider spa-tially resolved quenching for each jet individually as it strongly depends onthe flow pattern which can be influenced by the gas temperature, dischargemorphology, exact jet geometry and flow rates.
3.5 Conclusions
It is shown that spatially dependent collisional quenching due to air densitygradients in an Ar RF APPJ operating open to air needs to be consideredto determine the spatially resolved O density profile from TALIF measure-ments. The radial O density profiles are significant broader than the recordedTALIF signal. These broader density profiles are found to be consistent withthe O3 depletion zone diameter found in the core of the jet for which theozone depletion is ascribed to quenching of ozone by atomic oxygen.
References
[1] B. van Gessel, R. Brandenburg, and P. Bruggeman. Electron propertiesand air mixing in radio frequency driven argon plasma jets at atmo-spheric pressure. Applied Physics Letters, 103(6):064103–064103, 2013.
[2] M. G. Kong, G. Kroesen, G. Morfill, T. Nosenko, T. Shimizu, J. van Dijk,and J. L. Zimmermann. Plasma medicine: an introductory review. NewJournal of Physics, 11(11):115012, 2009.
[3] A. Schutze, J. Y. Jeong, S. E. Babayan, J. Park, G. S. Selwyn, and R. F.Hicks. The atmospheric-pressure plasma jet: a review and comparison
52
References
to other plasma sources. Plasma Science, IEEE Transactions on, 26(6):1685–1694, 1998.
[4] S. Samukawa, M. Hori, S. Rauf, K. Tachibana, P. Bruggeman, G. Kroe-sen, J. C. Whitehead, A. B. Murphy, A. F. Gutsol, S. Starikovskaia,et al. The 2012 plasma roadmap. Journal of Physics D: Applied Physics,45(25):253001, 2012.
[5] M. Laroussi. Low-temperature plasmas for medicine? Plasma Science,IEEE Transactions on, 37(6):714–725, 2009.
[6] R. Reuter, K. Rügner, D. Ellerweg, T. de los Arcos, A. von Keudell, andJ. Benedikt. The role of oxygen and surface reactions in the depositionof silicon oxide like films from HMDSO at atmospheric pressure. PlasmaProcesses and Polymers, 9(11-12):1116–1124, 2012.
[7] K. Niemi, V. Schulz-von der Gathen, and H. Döbele. Absoluteatomic oxygen density measurements by two-photon absorption laser-induced fluorescence spectroscopy in an RF-excited atmospheric pres-sure plasma jet. Plasma Sources Science and Technology, 14(2):375, 2005.
[8] T. Oda, Y. Yamashita, K. Takezawa, and R. Ono. Oxygen atom behaviourin the nonthermal plasma. Thin solid films, 506:669–673, 2006.
[9] S. Reuter, K. Niemi, V. Schulz-von der Gathen, and H. F. Döbele. Genera-tion of atomic oxygen in the effluent of an atmospheric pressure plasmajet. Plasma Sources Science and Technology, 18(1):015006, 2008.
[10] G. D. Stancu, F. Kaddouri, D. Lacoste, and C. Laux. Atmospheric pres-sure plasma diagnostics by OES, CRDS and TALIF. Journal of Physics D:Applied Physics, 43(12):124002, 2010.
[11] S. Reuter, J. Winter, A. Schmidt-Bleker, D. Schroeder, H. Lange,N. Knake, V. Schulz-von der Gathen, and K. D. Weltmann. Atomicoxygen in a cold argon plasma jet: TALIF spectroscopy in ambient airwith modelling and measurements of ambient species diffusion. PlasmaSources Science and Technology, 21(2):024005, 2012.
[12] G. Dilecce, M. Vigliotti, and S. De Benedictis. A TALIF calibrationmethod for quantitative oxygen atom density measurement in plasmajets. Journal of Physics D: Applied Physics, 33(6):53, 2000.
[13] U. Meier, K. Kohse-Höinghaus, and T. Just. H and O atom detectionfor combustion applications: study of quenching and laser photolysiseffects. Chemical physics letters, 126(6):567–573, 1986.
[14] A. F. H. van Gessel, S. C. Grootel, and P. J. Bruggeman. Atomic oxy-gen TALIF measurements in an atmospheric pressure microwave plasma
53
Collisional quenching on O of TALIF
jet with in situ xinon calibration. Plasma Sources Science and Technology,22(5):055010, 2013.
[15] C. Duluard, T. Dufour, J. Hubert, and F. Reniers. Influence of ambientair on the flowing afterglow of an atmospheric pressure Ar/O2 radiofre-quency plasma. Journal of Applied Physics, 113(9):093303–093303, 2013.
[16] S. Yonemori, Y. Nakagawa, R. Ono, and T. Oda. Measurement of OHdensity and air–helium mixture ratio in an atmospheric-pressure heliumplasma jet. Journal of Physics D: Applied Physics, 45(22):225202, 2012.
[17] A. van Gessel, K. Alards, and P. Bruggeman. NO production in an RFplasma jet at atmospheric pressure. Journal of Physics D: Applied Physics,46(26):265202, 2013.
[18] C. van Gils, S. Hofmann, B. Boekema, R. Brandenburg, and P. Brugge-man. Mechanisms of bacterial inactivation in the liquid phase inducedby a remote RF cold atmospheric pressure plasma jet. Journal of PhysicsD: Applied Physics, 46(17):175203, 2013.
[19] S. Hofmann, A. F. H. van Gessel, T. Verreycken, and P. Bruggeman.Power dissipation, gas temperatures and electron densities of cold at-mospheric pressure helium and argon RF plasma jets. Plasma SourcesScience and Technology, 20(6):065010, 2011.
[20] D. J. Bamford, L. E. Jusinski, and W. K. Bischel. Absolute two-photon ab-sorption and three-photon ionization cross sections for atomic oxygen.Physical Review A, 34(1):185, 1986.
[21] M. Uddi, N. Jiang, E. Mintusov, I. V. Adamovich, and W. R. Lempert.Atomic oxygen measurements in air and air/fuel nanosecond pulse dis-charges by two photon laser induced fluorescence. Proceedings of theCombustion Institute, 32(1):929–936, 2009.
[22] J. H. Frank and T. B. Settersten. Two-photon LIF imaging of atomic oxy-gen in flames with picosecond excitation. Proceedings of the CombustionInstitute, 30(1):1527–1534, 2005.
[23] R. Ono, K. Takezawa, and T. Oda. Two-photon absorption laser-inducedfluorescence of atomic oxygen in the afterglow of pulsed positive coronadischarge. Journal of Applied Physics, 106(4):043302–043302, 2009.
[24] M. Faist and R. Bernstein. Systematics of the Landau–Zener rate con-stant. The Journal of Chemical Physics, 64:3924, 1976.
[25] J. Bittner, K. Kohse-Höinghaus, U. Meier, and T. Just. Quenching of two-photon-excited H (3s, 3d) and O (3p 3P2,1,0) atoms by rare gases andsmall molecules. Chemical physics letters, 143(6):571–576, 1988.
54

CHAPTER 4
Gas flow characteristics of a time modulated
APPJ: the effect of gas heating on flow
dynamics
Abstract
This work investigates the flow dynamics of a RF non-equilibrium ar-gon atmospheric pressure plasma jet. The RF power is at a frequency of 50Hz or 20 kHz. Combined flow pattern visualizations (obtained by shadowg-raphy) and gas temperature distributions (obtained by Rayleigh scattering)are used to study the formation of transient vortex structures in initial flowfield shortly after the plasma is switched on and off in the case of 50 Hzmodulation. The transient vortex structures correlate well with observedtemperature differences. Experimental results of the fast modulated (20kHz) plasma jet that does not induce changes of the gas temperature arealso presented. The latter result suggests that momentum transfer by ionsdoes not have dominant effect on the flow pattern close to the tube. It isargued that the increased gas temperature and corresponding gas velocityincrease at the tube exit due to the plasma heating increases the admixingof surrounding air and reduces the effective potential core length. With in-creasing plasma power a reduction of the effective potential core length isobserved with a minimum length for 5.6 W after which the length extendsagain. Possible mechanisms related to viscosity effects and ionic momen-tum transfer are discussed.
A modified version of this chapter is published as S. Zhang, A. Sobota, E. M. van Veld-huizen, and P. J. Bruggeman, “Gas flow characteristics of a time modulated APPJ: the effectof gas heating on flow dynamics”, (2015) Journal of Physics D: Applied Physics 48 015203
55

Gas flow characteristics
4.1 Introduction
Cold atmospheric pressure plasma jets (APPJs) are promising tools for ma-terial processing and biomedical applications such as wound healing, disin-fection and decontamination [1–3]. They operate in open air with argon orhelium as feed gas where the effluent of the jet extends into open air envi-ronment, which leads to air entrainment. Knowing the characteristics of theflow is crucial for understanding the distribution, evolution, transport, andchemical reactions of reactive species produced in and carried by the flow,on which the applications rely.
The gas jet has been extensively investigated in the context of fluid dy-namics, thermal plasmas and combustion. In many of these studies Reynoldsnumbers in the range 1000 - 3000 are of interest. These conditions corre-spond to a transition or semi-turbulent jet [4]. In fluid dynamics, the flowstructure of a gas jet is divided into (potential) core region, transition re-gion, self-similar region and terminal region based on the local flow velocitydistributions [5]. The potential core corresponds to the region in which thevelocity field is not significantly altered from the nozzle. In the transitionregion the surrounding air starts to admix with the jet and (regular) vortexstructures are formed. In the self-similar region and terminal region the jetsis no longer strongly dependent on the initial flow conditions of the nozzleand the vortex structures break down to smaller scales and can lead to tur-bulence depending on the Reynolds number [5–7]. Table 4.1 gives the mainparameters of the effluent for a typical example taken from fluid dynamics,combustion, thermal plasmas and non-equilibrium plasmas.
Table 4.1: Research domains addressing the flow dynamics of a gas jet.
Parameters Reference
Fluid dynamicsno plasma;Tgas ∼ 300 K, some in heated gas [8]
S ∗ ∼ 0.25 (He - air) - 1.53 (CO2 - air) [9];[5–8, 10–15]
Combustion Tflame ∼ 1000 - 3000 K; S ∼ 0.1 - 1; [16, 17]
Thermal plasmasTe ∼ Ti ∼ Tg ∼ 10000 K
ionization degree > 1%; S ∼ 0.07 [18];[18–21]
APPJsHe jets
Ar jets (this work)
Tg ∼ 300 - 500 K; ne ∼ 1011 - 1013 cm−3
ionization degree: 10−6 - 10−8; S ∼ 0.15;
Tg ∼ 300 - 900 K; ne ∼ 1012 - 1014 cm−3 [22]ionization degree: 10−5 - 10−7; S ∼ 0.5 - 1.54;
[23–30]
∗ S indicates the density ratio of the core zone to the ambient surroundings.
Labus et al reported that the potential core length of an axisymmetric free
56
4.1. Introduction
helium jet depends on the Reynolds number at the nozzle exit, it reaches amaximum at a Reynolds number of roughly 1500 and decreases afterwards[5]. Buoyancy has been found to play a key role in the flow transition fromlaminar to turbulent flow in the case of helium jets [13, 14]. This effect hasbeen observed for Richardson numbers between 3.53 × 10⁻³ and 19 × 10−3
[13]. The jet development for a low density heated air gas jet at a Reynoldsnumber of 10000 with laminar flow at the exit of the nozzle is dominatedby large scale vortex structures. These shear layer structures also becamemore organized as the jet density was reduced relative to the density of theambient gas [8]. Both the flow dynamics and possible instabilities in the jetstrongly depend on the conditions at the nozzle exit including the Reynoldsnumber, nozzle geometry and initial velocity [6, 11]. Hence it is often difficultto make general conclusions on flow structures of different jets.
Flow dynamics in combustion is of the utmost importance as it deter-mines the mixing of fuel and air in non-premixed flames and influencesflame length [16, 17]. Buoyancy is often important due to significant gasheating in this case (1000 - 3000 K).
Pfender et al reports on the entrainment of surrounding cold gas into anargon thermal plasma jet with shadowgraphy and the coherent anti-StokesRaman scattering technique and confirmed that large scale flow structuresgoverns the air entrainment processes in the plasma jet close to the nozzleexit and that the onset of turbulence results from the breakdown of theseflow structures [20]. Work of the same group [18] showed that the organizedvortex structures in a low density argon jet with the Reynolds number 1000and the ratio of jet to ambient density of 0.07 are responsible for the rapidentrainment of external air. Similar coherent structures have been found fora thermal plasma. However at higher flow rates, small scale turbulencesare formed which is enhanced by the fluctuations from the arc observedunder these conditions. These findings have been reproduced in models byTrelles [19].
Flow dynamics in non-equilibrium atmospheric pressure jets have beenreceived recently a lot of attention. Bradley et al performed Schlieren photog-raphy on a micro-plasma jet excited by 10 kHz AC with a voltage amplitudebetween 6 kV and 9 kV fed by helium at atmospheric pressure [24–26]. Theyreported that the length of the laminar flow regime when the plasma is onis shorter than when the plasma is off. In spite that gas temperatures werenot reported gas heating was identified as the key mechanism leading to thevelocity increase of the gas and the reduction of the laminar length. Folettoet al [27] reported the distance from the dielectric tube exit to the transitionpoint under different Reynolds numbers (100 to 500), applied voltage (3.0
57
Gas flow characteristics
kV to 5.5 kV), and operating frequency (2 kHz to 50 kHz) in a similar ACdriven helium jet. The transition point being the spatial location at which thetransition from laminar to turbulent flow is observed. Foletto et al proposedthat the ionic wind produced by the plasma influences the position of thetransition point. The effect of gas temperature was not considered in thiswork. Robert et al studied the influence of geometrical features, the pulserepetition rate, and the presence of a metallic target on the rare gas flowstructuration in a helium plasma jet [28]. They confirmed that the plasma af-fected the transition from the laminar to turbulent flow regime for the heliumand neon plasma jet [29]. The authors also speculated that for argon plasmajets the plasma action also might play a key role in the transition from a lam-inar to a turbulent flow. Boselli et al researched the fluid-dynamic behaviorof a nanosecond pulsed helium APPJ with a maximum excitation frequencyof 1 kHz by means of Schlieren photography [30]. They found that a tran-sient turbulent structure is formed and propagates along the gas flow afterthe plasma is ignited. They proposed different possible mechanisms suchas gas heating, local pressure increase, the change of transport properties ofthe fluid and the momentum transfer between ions and neutrals to explainthe observed turbulent front. Recently Papadopoulos et al reported that theflow pattern change of a helium plasma jet (10 kHz, 0 - 30 kV peak to peak)is related to the electrohydrodynamic force and the gas heating has little ef-fect [31]. These conclusions have been obtained mainly by simulations andthe measurements of the gas temperature in jet by the rotational temperatureof N2(C). However, it is possible that the obtained gas temperature is an un-derestimate as it has been shown that the emission profile is hollow [32] andmost likely the temperature of the outer plasma core has been measured. Inaddition the authors have assumed that the electrohydrodynamic force has aspatially uniform distribution.
The existing literature on the flow characteristics of cold atmospheric pres-sure plasma jets has several common points. There is a transition point for agas jet without plasma from large-scale uniform (laminar in the references)to non-uniform (turbulent in the references) flow. The determining factorfor that transition of the flow pattern in the effluent is still under debate asillustrated by the different proposed mechanism for similar jets. The physicsbehind the transient vortex structure in the flow pattern shortly after theplasma is switched on or off as reported by Boselli et al is at least only poorlyunderstood. In addition, the reported results had a strong emphasis on Hejets in air, which has a density ratio of jet and ambient gas of 0.14 while theAr/air jet has a density ratio of 1.38. This might lead to significant differencesin flow and a likely reduction of buoyancy driven effects.
Simulation work might be a suitable method to obtain the mechanismbehind these phenomena. However, the simulations dealing with plasma-
58
4.1. Introduction
flow interactions [19, 33–35] are mainly developed for thermal plasmas andhave not reached the same level of detail for non-equilibrium plasma [36].The reported work in atmospheric pressure non-equilibrium plasma jets hasmainly been based on Schlieren imaging while influencing factors such asgas temperatures and ion fluxes have not been measured consistently.
The existing literature on APPJs tends to divide the effluent in zones oflaminar and turbulent flow based on Schlieren imaging. In the field of fluidmechanics, this is supported by flow velocity field measurement (standarddeviation of the velocity) [37] or the power spectra measurement [8, 38]. Insome cases, the plasma does not extend in the far effluent region and ends inthe transition region in which only large scale vortex structures are observed.This is also the case in the work presented in this chapter. To this end, wewill refer to effective potential core length. Effective is used in this terminol-ogy as no velocity profiles are obtained as should be the case for an exactdetermination of the potential core region.
In fluid dynamics, carefully designed nozzles are used while this is notthe case in plasma jets. In several cases a high voltage needle is present inthe quartz tube that may influence the initial flow conditions at the nozzleand trigger additional disturbances to the flow. A direct comparison with jetstudies using nozzles should thus be done with care.
In this work, shadowgraphy is used to visualize the time resolved flowdynamics of the effluent of an argon RF atmospheric pressure plasma jet.The plasma jet is modulated differently by a fast mode and a slow modein order to investigate the temporal development of the flow pattern on dif-ferent time scales when the plasma is on and/or off. Complementary mea-surements were made of temporally and spatially recorded gas temperaturesand plasma optical emissions profiles, which allows us to verify the thermaleffect on flow dynamics.
This chapter starts with a description of the experimental setup includingthe plasma jet, the shadowgraphy setup and the Rayleigh scattering setup.The experimental results follow, consisting of the shadowgraphy images, thegas temperature, and the visible plasma emission results under different op-erating conditions. Next the driving forces behind the the change in the flowpattern are discussed followed by the conclusions.
59
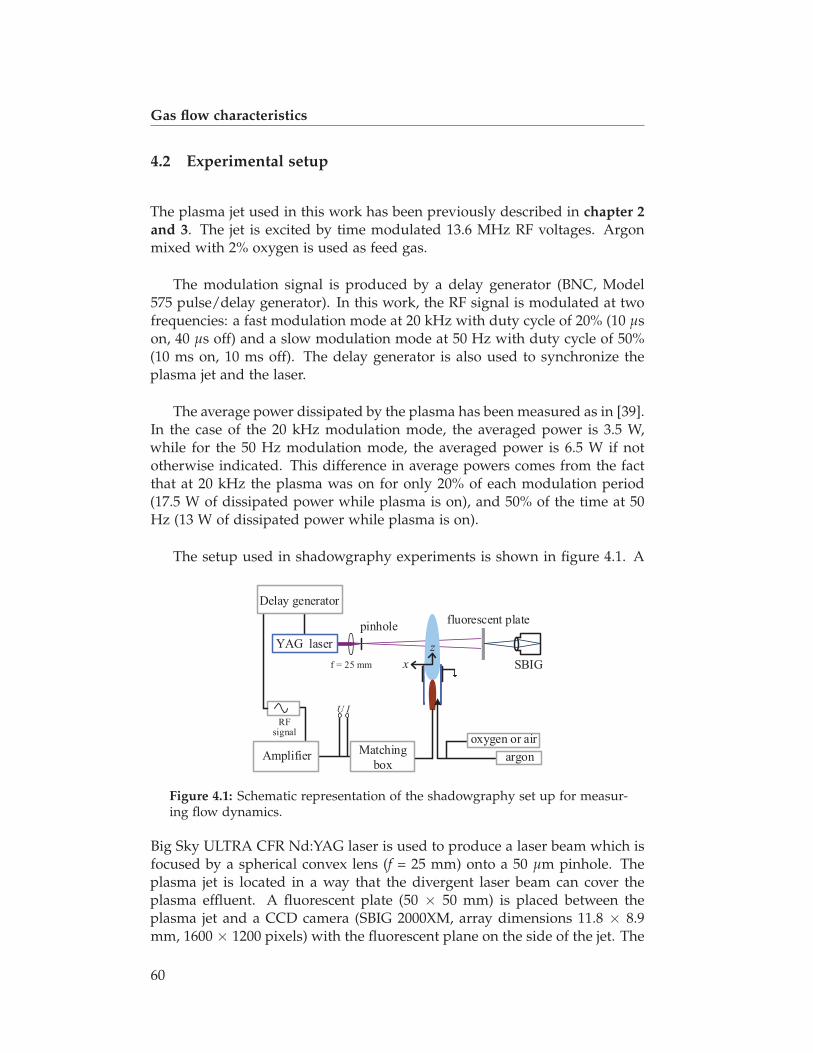
Gas flow characteristics
4.2 Experimental setup
The plasma jet used in this work has been previously described in chapter 2and 3. The jet is excited by time modulated 13.6 MHz RF voltages. Argonmixed with 2% oxygen is used as feed gas.
The modulation signal is produced by a delay generator (BNC, Model575 pulse/delay generator). In this work, the RF signal is modulated at twofrequencies: a fast modulation mode at 20 kHz with duty cycle of 20% (10 μson, 40 μs off) and a slow modulation mode at 50 Hz with duty cycle of 50%(10 ms on, 10 ms off). The delay generator is also used to synchronize theplasma jet and the laser.
The average power dissipated by the plasma has been measured as in [39].In the case of the 20 kHz modulation mode, the averaged power is 3.5 W,while for the 50 Hz modulation mode, the averaged power is 6.5 W if nototherwise indicated. This difference in average powers comes from the factthat at 20 kHz the plasma was on for only 20% of each modulation period(17.5 W of dissipated power while plasma is on), and 50% of the time at 50Hz (13 W of dissipated power while plasma is on).
The setup used in shadowgraphy experiments is shown in figure 4.1. A
Amplifier Matching
box
Delay generator
RFsignal
oxygen or air
argon
YAG laser
SBIG
pinholefluorescent plate
f = 25 mm
U I
x
z
Figure 4.1: Schematic representation of the shadowgraphy set up for measur-ing flow dynamics.
Big Sky ULTRA CFR Nd:YAG laser is used to produce a laser beam which isfocused by a spherical convex lens (f = 25 mm) onto a 50 μm pinhole. Theplasma jet is located in a way that the divergent laser beam can cover theplasma effluent. A fluorescent plate (50 × 50 mm) is placed between theplasma jet and a CCD camera (SBIG 2000XM, array dimensions 11.8 × 8.9mm, 1600 × 1200 pixels) with the fluorescent plane on the side of the jet. The
60

4.2. Experimental setup
position of the jet is adjusted to obtain a full picture by the camera. The laseroperates at a wavelength of 266 nm and has a pulse duration of 8 ns. Theshadowgraphy images are recorded in a single shot.
The gas temperature is obtained by Rayleigh scattering. The principle ofRayleigh scattering and the setup has been described in detail in chapter 2and [40]. It is noted that the Rayleigh scattering cross sections of air, O2,and Ar differ less than 2% [41, 42]. Hence, the Rayleigh signal intensity doesnot significantly depend on the varying gas composition in the effluent. Inorder to compare the gas temperature distribution with the flow dynamicsby shadowgraphy, a laser sheath is scanned through the plasma plume asis shown in figure 4.2. The output laser beam from a Nd:YAG laser (Con-
Amplifier Matching
box
Delay generator
RFsignal
oxygen or air
argon
continuum
laser
iCCD
x
z
f = 300 mm
f = 250 mm
U I
Figure 4.2: Schematic representation of the setup for measuring gas tempera-ture by Rayleigh scattering.
tinuum Powerlite Precision II 8010) has a diameter of 5 mm. A cylindricalconvex lens (f = 25 mm) is utilized to focus the cylindrical laser beam into thelaser sheath. The scattered signal is collected by an intensified CCD camera(Stanford Computer Optics, 4 Picos, 200 ps). The same delay generator isused to synchronize all the signals. Other details of the setup are identical tochapter 2.
The photographs of the effluent were obtained with the intensified CCDcamera. Color images of the plasma jet are taken with a CCD photo camera(SONY, Model: DSC-R1).
61
Gas flow characteristics
4.3 Experimental results
A description of the APPJ effluent is introduced to clarify the terminology. Asis shown later, when the plasma induced flow emanates into the surroundingair, the flow characteristics remain determined by the flow at the quartz tubeexit for a certain distance, showing no large-scale vortex structures. Thensubsequent vortex structures on the edge finally reach the center line of theeffluent. This region is marked as "effective potential core flow" (in figure4.3(h) and (i)) following the classification in [20]. As velocity measurementswere not performed in this work, the term "potential core flow" cannot con-clusively be linked to this region of the APPJ; based on the similarities ofthe flow profile and velocity measurements pending, the term "effective po-tential core flow" is used instead. The position that vortex structures reachthe center line marks the beginning of the "transition region". As is seenfrom shadowgraphy images, the initial large scale vortex structures breaksinto small scale structures as the flow goes downstream, which is similar asdescribed in [7, 20]. Note that the plasma is mainly present in the potentialcore zone and penetrates only moderately the transition region (see further).To this end this work focuses on the potential core and transition region.
4.3.1 Flow patterns at different gas flow rates
The results shown in this section are for the 50 Hz modulation of the RF jet.The plasma is switched on at 0 ms and off at 10 ms until 20 ms. The flowpatterns obtained during the plasma-off phase in one modulation period areshown in figure 4.3 (a) ∼ (f), while the flow patterns obtained when theplasma is on are shown in figure 4.3 (g) ∼ (l). The effective potential coreflow length is shorter for a larger gas flow rate and during the plasma-onphase when compared to the plasma-off phase. The same observation wasalso reported in [24–27].
Images of the visible plasma emission in the effluent, taken for the sameconditions as in figure 4.3, are shown in figure 4.4. The length of the plasmaeffluent decreases slightly from 8 mm to 6 mm when the flow increases from1.5 slm to 4 slm, while the vortex structure at the edge of the effluent appearat ∼ 9 mm to ∼ 3 mm.
62

4.3. Experimental results
6 mm
3 mm
9 mm
6 mm
3 mm
9 mm
6 mm
3 mm
9 mm
6 mm
3 mm
9 mm
6 mm
3 mm
9 mm
6 mm
3 mm
9 mm
6 mm
3 mm
9 mm
6 mm
3 mm
9 mm
6 mm
3 mm
9 mm
6 mm
3 mm
9 mm
6 mm
3 mm
9 mm
6 mm
3 mm
9 mm
4.0 slm3.5 slm3.0 slm2.5 slm2.0 slm1.5 slm(a) (b) (c) (d) (e) (f)
(g) (h) (i) (j) (k) (l) 4.0 slm3.5 slm3.0 slm2.5 slm2.0 slm1.5 slmef
fect
ive
pote
nti
al
core
flo
w
vortexstructures
Figure 4.3: Flow pattern at different gas flows. Images (a) ∼ (f) are obtainedduring the plasma-off phase at 19 ms, and images (g) ∼ (l) are obtained duringthe plasma-on phase at 9 ms. The feed gas is argon mixed with 2% oxygen.The mass flow rate is marked on the images. The power is 8.3 W with 50 Hzmodulation, 50% duty cycle.
1.5 slm 2.0 slm 2.5 slm 3.0 slm 3.5 slm 4.0 slm(a) (b) (c) (d) (e) (f)
6 mm
3 mm
9 mm
6 mm
3 mm
9 mm
6 mm
3 mm
9 mm
6 mm
3 mm
9 mm
6 mm
3 mm
9 mm
6 mm
3 mm
9 mm
Figure 4.4: Time averaged images of the visible plasma effluent. The feed gasis argon mixed with 2% oxygen. The argon flow rate from (a) to (f) is 1.5 slm,2.0 slm, 2.5 slm, 3.0 slm, 3.5 slm, 4.0 slm respectively. The average dissipatedpower is 8.3 W and the experimental conditions are the same as in figure 4.3.
63
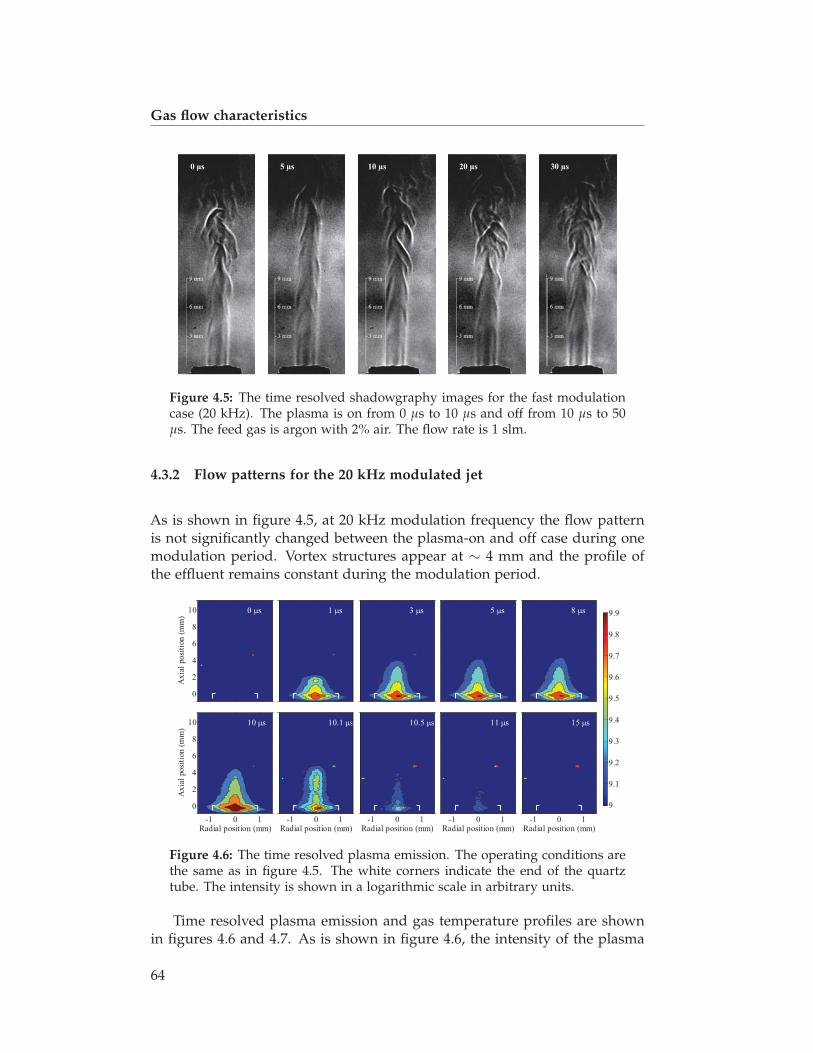
Gas flow characteristics
0 μs 5 μs 10 μs 20 μs 30 μs
Figure 4.5: The time resolved shadowgraphy images for the fast modulationcase (20 kHz). The plasma is on from 0 μs to 10 μs and off from 10 μs to 50μs. The feed gas is argon with 2% air. The flow rate is 1 slm.
4.3.2 Flow patterns for the 20 kHz modulated jet
As is shown in figure 4.5, at 20 kHz modulation frequency the flow patternis not significantly changed between the plasma-on and off case during onemodulation period. Vortex structures appear at ∼ 4 mm and the profile ofthe effluent remains constant during the modulation period.
Ax
ial
po
siti
on
(m
m)
0 s
0
2
4
6
8
10 1 s 3 s 5 s 8 s
Radial position (mm)
Ax
ial
po
siti
on
(m
m)
10 s
-1 0 1
0
2
4
6
8
10
Radial position (mm)
10.1 s
-1 0 1Radial position (mm)
10.5 s
-1 0 1Radial position (mm)
11 s
-1 0 1Radial position (mm)
15 s
-1 0 1
9
9.1
9.2
9.3
9.4
9.5
9.6
9.7
9.8
9.9
Figure 4.6: The time resolved plasma emission. The operating conditions arethe same as in figure 4.5. The white corners indicate the end of the quartztube. The intensity is shown in a logarithmic scale in arbitrary units.
Time resolved plasma emission and gas temperature profiles are shownin figures 4.6 and 4.7. As is shown in figure 4.6, the intensity of the plasma
64
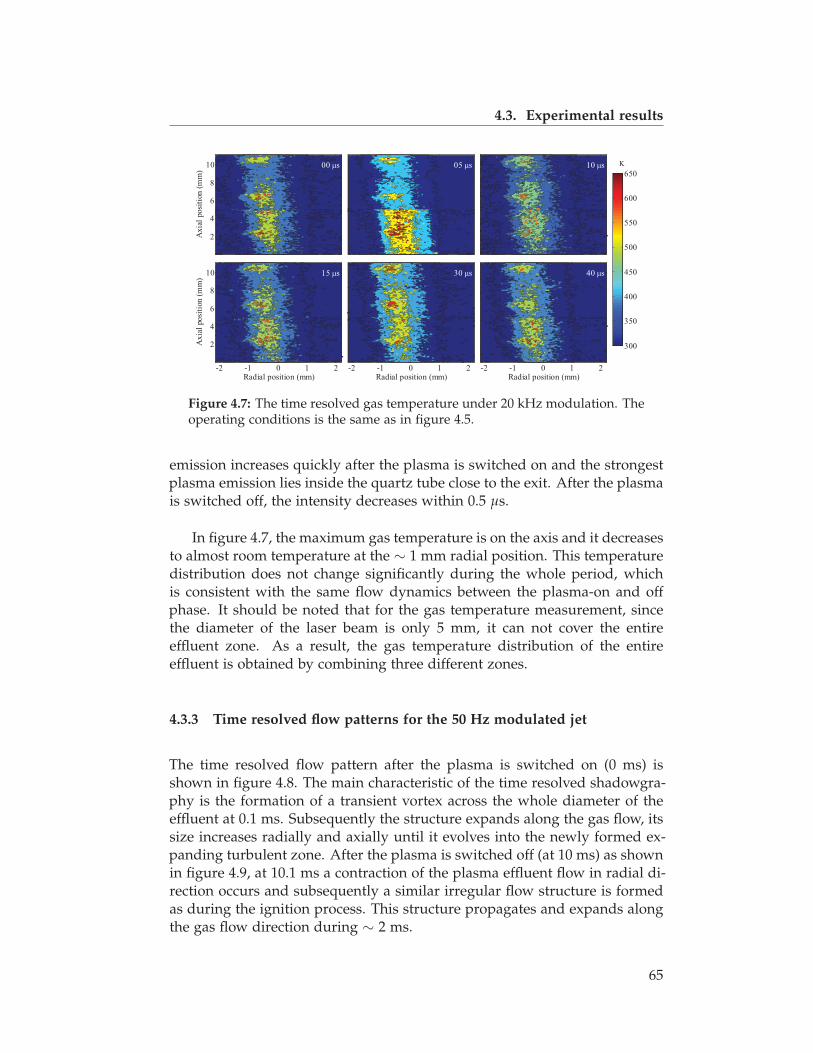
4.3. Experimental results
Ax
ial
po
siti
on
(m
m)
00 s
2
4
6
8
10 05 s 10 s
Radial position (mm)
Ax
ial
po
siti
on
(m
m)
15 s
-2 -1 0 1 2
2
4
6
8
10
Radial position (mm)
30 s
-2 -1 0 1 2Radial position (mm)
40 s
-2 -1 0 1 2
300
350
400
450
500
550
600
650
Figure 4.7: The time resolved gas temperature under 20 kHz modulation. Theoperating conditions is the same as in figure 4.5.
emission increases quickly after the plasma is switched on and the strongestplasma emission lies inside the quartz tube close to the exit. After the plasmais switched off, the intensity decreases within 0.5 μs.
In figure 4.7, the maximum gas temperature is on the axis and it decreasesto almost room temperature at the ∼ 1 mm radial position. This temperaturedistribution does not change significantly during the whole period, whichis consistent with the same flow dynamics between the plasma-on and offphase. It should be noted that for the gas temperature measurement, sincethe diameter of the laser beam is only 5 mm, it can not cover the entireeffluent zone. As a result, the gas temperature distribution of the entireeffluent is obtained by combining three different zones.
4.3.3 Time resolved flow patterns for the 50 Hz modulated jet
The time resolved flow pattern after the plasma is switched on (0 ms) isshown in figure 4.8. The main characteristic of the time resolved shadowgra-phy is the formation of a transient vortex across the whole diameter of theeffluent at 0.1 ms. Subsequently the structure expands along the gas flow, itssize increases radially and axially until it evolves into the newly formed ex-panding turbulent zone. After the plasma is switched off (at 10 ms) as shownin figure 4.9, at 10.1 ms a contraction of the plasma effluent flow in radial di-rection occurs and subsequently a similar irregular flow structure is formedas during the ignition process. This structure propagates and expands alongthe gas flow direction during ∼ 2 ms.
65
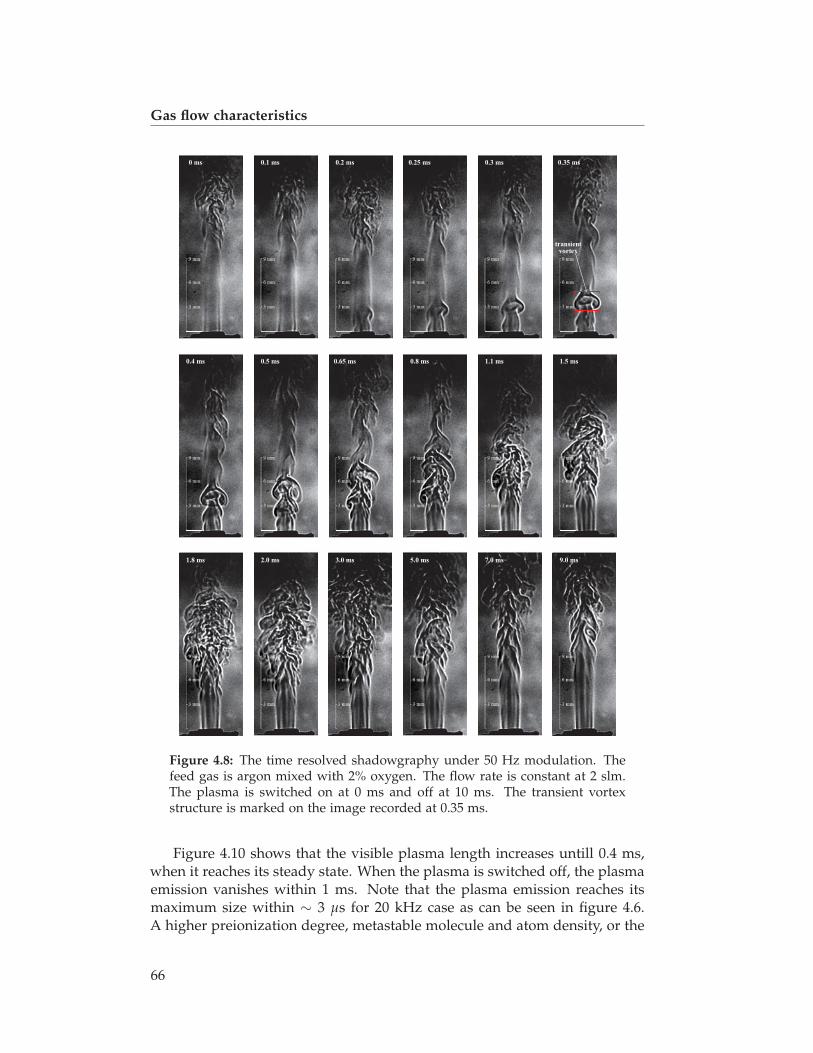
Gas flow characteristics
0 ms 0.1 ms 0.2 ms 0.25 ms 0.3 ms 0.35 ms
0.4 ms 0.5 ms 0.65 ms 0.8 ms 1.1 ms 1.5 ms
1.8 ms 2.0 ms 3.0 ms 5.0 ms 7.0 ms 9.0 ms
transient vortex
Figure 4.8: The time resolved shadowgraphy under 50 Hz modulation. Thefeed gas is argon mixed with 2% oxygen. The flow rate is constant at 2 slm.The plasma is switched on at 0 ms and off at 10 ms. The transient vortexstructure is marked on the image recorded at 0.35 ms.
Figure 4.10 shows that the visible plasma length increases untill 0.4 ms,when it reaches its steady state. When the plasma is switched off, the plasmaemission vanishes within 1 ms. Note that the plasma emission reaches itsmaximum size within ∼ 3 μs for 20 kHz case as can be seen in figure 4.6.A higher preionization degree, metastable molecule and atom density, or the
66

4.3. Experimental results
10 ms 10.1 ms 10.2 ms 10.3 ms 10.5 ms 10.7 ms
10.9 ms 11.5 ms 12 ms 14 ms 16 ms 20 ms
transient vortex
Figure 4.9: 50 Hz modulation, time resolved shadowgraphy after the plasmais switched off at 10 ms. On the image of 10.7 ms, the transient vortex struc-ture is marked.
Ax
ial
po
siti
on
(m
m)
0 ms
0
5
10 0.05 ms 0.1 ms 0.15 ms 0.2 ms
Ax
ial
po
siti
on
(m
m)
0.25 ms
0
5
10 0.3 ms 0.35 ms 0.4 ms 0.6 ms
Radial position (mm)
Ax
ial
po
siti
on
(m
m)
1 ms
-1 0 1
0
5
10
Radial position (mm)
1.5 ms
-1 0 1Radial position (mm)
5 ms
-1 0 1Radial position (mm)
9 ms
-1 0 1Radial position (mm)
10 ms
-1 0 1
9
9.1
9.2
9.3
9.4
9.5
9.6
Figure 4.10: Time and spatially resolved plasma emission profiles. The op-erating conditions are identical to the ones in figure 4.8. The white cornersindicate the exit of the quartz. The intensity is shown in a logarithmic scalein arbitrary units.
67

Gas flow characteristics
Ax
ial
po
siti
on
(m
m)
0.1 ms
2
4
6
8
10
12
0.2 ms 0.25 ms 0.3 ms
Ax
ial
po
siti
on
(m
m)
0.45 ms
2
4
6
8
10
12
0.85 ms 1.2 ms 2 ms
Ax
ial
po
siti
on
(m
m)
5 ms
2
4
6
8
10
12
9 ms 10.1 ms 10.3 ms
Radial position (mm)
Ax
ial
po
siti
on
(m
m)
10.4 ms
-2 0 2
2
4
6
8
10
12
Radial position (mm)
11.2 ms
-2 0 2Radial position (mm)
12 ms
-2 0 2Radial position (mm)
18 ms
-2 0 2
300
350
400
450
500
550
600
650
700
750
800
Figure 4.11: Time and spatially resolved gas temperature profiles. The oper-ating conditions are the same as the ones in figure 4.8.
higher dissipated power and voltage for 20 kHz compared to the 50 Hz casemight be responsible for the faster development of the discharge.
The corresponding spatially and time resolved gas temperature profilesare shown in figure 4.11. An irregular high gas temperature zone is formedafter the plasma is ignited between 0.1 and 0.3 ms. This high gas tempera-ture zone extends along the axial direction, as observed in the shadowgra-phy measurements. Upstream from this high gas temperature zone, the gastemperature distribution has a profile symmetric around the centerline. Sim-ilarly, after the plasma is switched off, a low gas temperature zone is formedas shown on the image at 10.3 ms and 10.4 ms. This low gas temperaturealso evolves axially and radially and propagates upwards.
4.3.4 Flow dynamics as a function of average dissipated power
As shown in figure 4.12, the effective potential core length when the plasmais on does not change monotonically as function of the dissipated power.This length has a minimum at ∼ 6 W, while for the plasma-off phase, theonset position of the large scale vortex is constant at 9 mm from the quartztube exit and the effective potential core length is roughly 13 mm.
Images of the visible plasma jet in figure 4.13 illustrate that the length
68

4.3. Experimental results
6 mm
3 mm
9 mm
6 mm
3 mm
9 mm
6 mm
3 mm
9 mm
6 mm
3 mm
9 mm
6 mm
3 mm
9 mm
6 mm
3 mm
9 mm
6.4 W6.0 W5.6 W5.2 W4.1 W3.1 W(a) (b) (c) (d) (e) (f)
6 mm
3 mm
9 mm
6 mm
3 mm
9 mm
6 mm
3 mm
9 mm
9.2 W7.9 W7.1 W(g) (h) (i)
6 mm
3 mm
9 mm
6 mm
3 mm
9 mm
6 mm
3 mm
9 mm
5.2 W4.1 W3.1 W(j) (k) (l)
6 mm
3 mm
9 mm
6 mm
3 mm
9 mm
6 mm
3 mm
9 mm
6.4 W6.0 W5.6 W(m) (n) (o)
6 mm
3 mm
9 mm
6 mm
3 mm
9 mm
6 mm
3 mm
9 mm
9.2 W7.9 W7.1 W(p) (q) (r)
Figure 4.12: Flow patterns as a function of average dissipated power. Images(a) ∼ (i) are obtained during the plasma-on phase at 19 ms, (j) ∼ (r) during theplasma-off phase at 9 ms. The feed gas is argon mixed with 2% oxygen. Thejet is RF-powered using 50 Hz modulation with 50% duty cycle. The averagedissipated power is indicated in the images. The gas flow rate is 2 slm.
of the plasma jet increases with increasing power, from ∼ 4 mm when theaverage dissipated power is 1.7 W to ∼ 9 mm when the dissipated power is8.1 W.
69

Gas flow characteristics
1.7 W 3.2 W 5.5 W 6.9 W 8.1 W(a) (b) (c) (d) (e)
6 mm
3 mm
9 mm
6 mm
3 mm
9 mm
6 mm
3 mm
9 mm
6 mm
3 mm
9 mm
6 mm
3 mm
9 mm
Figure 4.13: Photographs of plasma effluent at different powers. The feed gasis argon mixed with 2% oxygen. The flow rate is 2 slm. The power is markedon the image.
4.4 Discussions
4.4.1 The effective potential core flow length
Effect of Reynolds and Richardson numbers
In a gas jet with a circular cross-section such as studied in this work, theinitial conditions in the quartz tube determine the flow dynamics in thenear field region and the intermediate region as defined in [6, 11, 12]. TheReynolds number (equation 4.1) is considered as one of determining factorsof these initial conditions together with gas velocity at the exit of the quartztube. They will both be affected by the gas heating and plasma constituents.
Re =ρυD
μ(4.1)
where ρ is the gas density; υ is the gas velocity; D is the characteristic length,which equates the inner quartz tube diameter and μ is the dynamic viscosity[43].
Combining the data presented in table 4.2 and figure 4.3, Vortex struc-tures appear closer to the exit of the quartz tube when the Reynolds numberincreases. It should also be noted in table 4.2 that even when the plasma isoff in figure 4.3 (a) ∼ (f), at the exit of the quartz tube the gas is not at roomtemperature.
At a given gas flow, the temperature at the exit of the quartz tube in-
70

4.4. Discussions
Table 4.2: The Reynolds numbers under different flow rate in figure 4.3.
Ar flow rate (slm) 1.5 2.0 2.5 3.0 3.5 4.0Ar flow velocity at 300 K (m/s) 8.0 10.6 13.3 15.9 18.6 21.2
Gas temperature (K)∗plasma on 870 745 735 640 635 605plasma off 450 450 450 450 450 450
Reynolds number† plasma on 518 764 955 1273 1485 1797plasma off 764 1018 1273 1528 1782 2037
∗ The gas temperature is obtained at the quartz tube exit by Rayleigh scattering.† The Reynolds number is calculated at the quartz tube exit considering temper-ature dependent viscosity [43].
creases when the plasma is on, increasing the gas velocity at the quartz tubeexit. The continuity equation postulates the following:
ρplasmaonυplasmaonD = ρplasmaoffυplasmaoffD (4.2)
Consequently, the ρυ in equation 4.1 remains constant.
According to equation 4.1, the Reynolds number decreases when theplasma is on because of the increase in μ. Still, for a given gas flow in fig-ure 4.3, the first vortex structure at the edge of the effluent appears closerto the exit of the quartz tube in the plasma-on phase than in the plasma-offphase, regardless to the lower value of the Reynolds number. Consequently,the change in the value of the Reynolds number does not correlate with thelength of the effective potential core flow and the appearance of the firstvortex structure.
Note that the viscosity of the argon plasma might differ from the viscosityof the pure gas flow, however, to the authors’ knowledge, there is no suchdata for non-equilibrium plasma available in literature, so the viscosity ischosen from the property of pure gas flow without plasma.
The Richardson number (equation 4.3) expresses the ratio of potential tokinetic energy and as such reflects the influence of buoyancy on the flow. IfRi >> 1, there is insufficient kinetic energy to homogenize the fluids andbuoyancy is dominant in the flow, however if Ri << 1 buoyancy has nostrong effect on the flow.
Ri =Dg(ρ∞ − ρgas)
υ2ρgas(4.3)
71

Gas flow characteristics
where υ is the gas velocity; D is the characteristic length; g is the gravitationalacceleration; ρ∞ and ρgas are the gas density of the surrounding and the corezone, respectively.
For the region from the exit of the quartz tube to the onset of first vortexstructure the gas velocity and the characteristic length can be approximatedas equal to the initial conditions at the exit of the quartz tube [5]. The gasdensity at the core zone depends on the gas temperature and the Richardsonnumber is approximately Ri ∼ 10−4; consequently the buoyancy effect dueto the density differences should not be important throughout the investi-gated region. Indeed the density ratio Ar-air is 1.54 at room temperature andreaches 0.5 for the heated jet. This is still significantly larger than for the Hejet at room temperature.
Effect of flow velocity
As shown in figure 4.3, the increase in gas flow velocity at the quartz tube exitcauses the decrease in the effective potential core flow length. The increasein flow velocity can come from experiment control (increasing the gas flow)or by switching on the plasma and increasing gas temperature, as shown intable 4.3.
Table 4.3: Gas flow velocity for the condition of 2 slm argon + 2% O2 as shownin figures 4.3 (b) and (h) at the position of the exit of the quartz tube.
Plasma on Plasma off
Gas temperature (K) 745 450Gas velocity (m/s) 26.3 15.9
The reason for the appearance of vortex structures at the edge of theeffluent stems from the velocity gradient between the effluent of the jet andthe surrounding air. Due to the velocity difference a perturbation develops ina thin layer at the edge of the effluent where vortex structures start forming,as reported in [20]. For a larger velocity difference, the perturbation developsearlier in the jet and the vortex structures appear closer to the exit of thequartz tube and the effective potential core length reduces.
Velocity gradients also lead to Kelvin-Helmholtz instabilities [12, 17, 23].Particularly in reports of simulations performed for a DC arc plasma jet thismechanism is highlighted [19]. However, further work is needed to showwhether Kelvin-Helmholtz instabilities are triggered by the plasma and in-volved in the initial formation of the observed large vortex structures under
72

4.4. Discussions
the present experimental conditions.
The effect of ion momentum transfer
As mentioned previously, there is debate whether the momentum transferfrom ions or ion wind to neutrals may accelerate the velocity of the gas flowin APPJs [27]. The momentum transfer from ions to neutrals is representedby the electrohydrodynamics (EHD) force and widely investigated in plasmaactuators to manipulate the flow in the near wall boundary layer by increas-ing the velocity in the boundary [44–47]. A necessary condition for this effectto be important is the occurrence of zones with space charge separation. Inthe jet itself this can be achieved in the ionization fronts. If the effect of theion drag would be important compared to e.g. thermal effects, one shouldobserve some obvious flow pattern distortion when the plasma is switchedoff and/or on, which is not the case at 20 kHz modulation as shown in figure4.5.
While in guided streamers (or plasma bullets) the streamer head propaga-tion induces a charge separation this is less likely the case at 13.5MHz as theelectron density remains constant during one RF cycle [22]. Nonetheless it isfound that the visual emission of the plasma is growing on a time scale of0.4 ms (for the 50 Hz modulation case) and 3 us (for the 20 kHz modulationcase) (see section 4.3.3). Charge separation will be present at the edge of thisgrowing ionization front. We use the approach of Boeuf et al to estimate anorder of magnitude of the ion momentum transfer possibly generated by thisprocess [48]. The intensity of the electric field ∼ 100 V/cm as deduced froma maximum expected Te of 3 eV in an Ar plasma [22, 49]. The propagationvelocity of the growing ionization front over several RF cycles has been foundby van Gessel et al in a similar jet to be 10 - 100 km/s when only consideringthe N2(C) emission [50]. From the non-spectral resolved images in figure 4.6and 4.10, a maximum velocity of the order of 1 km/s can be deduced in the20 kHz case while 10 m/s in the 50 Hz case. Considering that the gas tem-perature is of the order of 900 K, the increased velocity due to the EHD force(Δυ ≈ ε0E2/(ρgasυbullet)) (for the lowest velocity) is most likely on the orderof 10−4 m/s, at least four orders of magnitude smaller than the flow velocity.This confirms the experimental conclusion that the effect of ion wind on thegas flow velocity close to the quartz tube exit will be negligible.
73
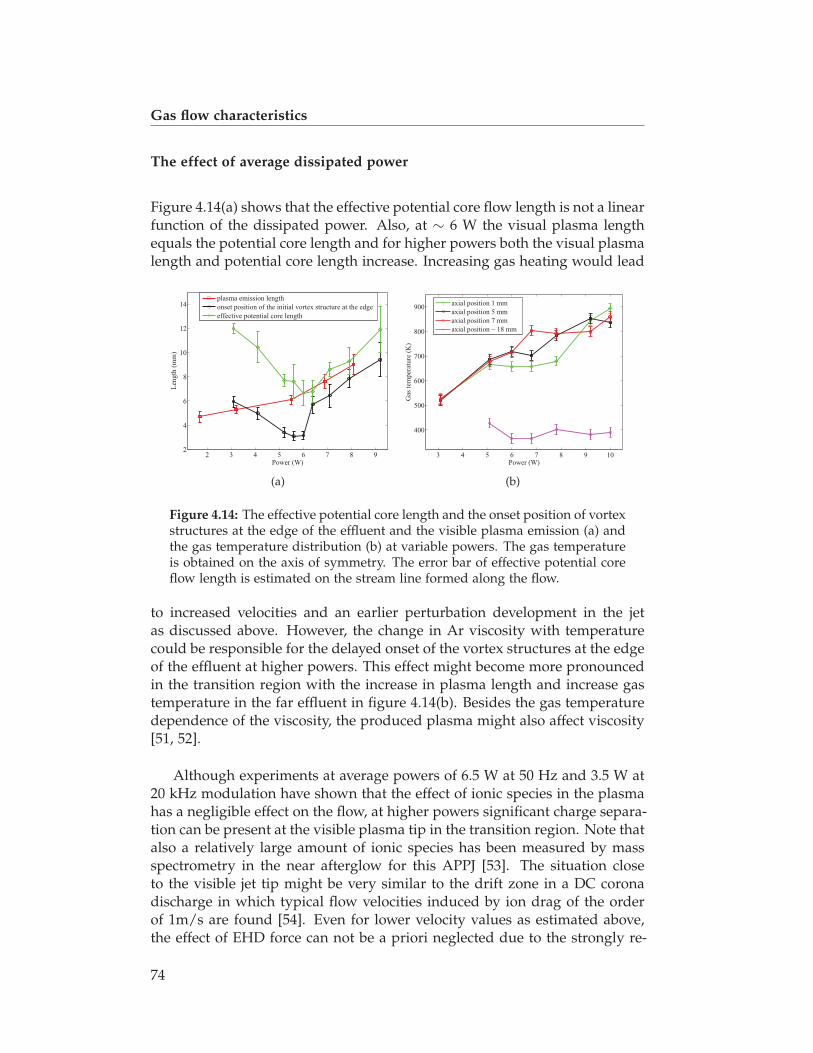
Gas flow characteristics
The effect of average dissipated power
Figure 4.14(a) shows that the effective potential core flow length is not a linearfunction of the dissipated power. Also, at ∼ 6 W the visual plasma lengthequals the potential core length and for higher powers both the visual plasmalength and potential core length increase. Increasing gas heating would lead
2 3 4 5 6 7 8 92
4
6
8
10
12
14
Power (W)
Len
gth
(m
m)
plasma emission length
onset position of the initial vortex structure at the edge
effective potential core length
(a)
3 4 5 6 7 8 9 10
400
500
600
700
800
900
Power (W)
Gas
tem
per
atu
re (
K)
axial position 1 mm
axial position 5 mm
axial position 7 mm
axial position ~ 18 mm
(b)
Figure 4.14: The effective potential core length and the onset position of vortexstructures at the edge of the effluent and the visible plasma emission (a) andthe gas temperature distribution (b) at variable powers. The gas temperatureis obtained on the axis of symmetry. The error bar of effective potential coreflow length is estimated on the stream line formed along the flow.
to increased velocities and an earlier perturbation development in the jetas discussed above. However, the change in Ar viscosity with temperaturecould be responsible for the delayed onset of the vortex structures at the edgeof the effluent at higher powers. This effect might become more pronouncedin the transition region with the increase in plasma length and increase gastemperature in the far effluent in figure 4.14(b). Besides the gas temperaturedependence of the viscosity, the produced plasma might also affect viscosity[51, 52].
Although experiments at average powers of 6.5 W at 50 Hz and 3.5 W at20 kHz modulation have shown that the effect of ionic species in the plasmahas a negligible effect on the flow, at higher powers significant charge separa-tion can be present at the visible plasma tip in the transition region. Note thatalso a relatively large amount of ionic species has been measured by massspectrometry in the near afterglow for this APPJ [53]. The situation closeto the visible jet tip might be very similar to the drift zone in a DC coronadischarge in which typical flow velocities induced by ion drag of the orderof 1m/s are found [54]. Even for lower velocity values as estimated above,the effect of EHD force can not be a priori neglected due to the strongly re-
74
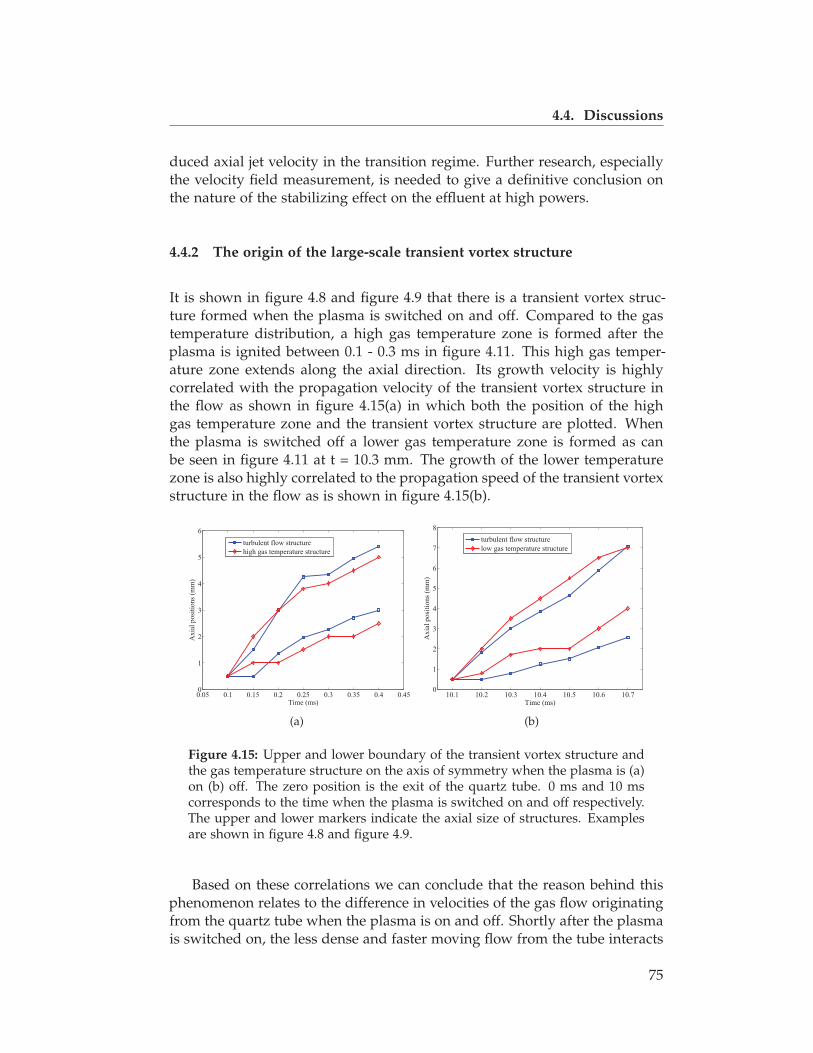
4.4. Discussions
duced axial jet velocity in the transition regime. Further research, especiallythe velocity field measurement, is needed to give a definitive conclusion onthe nature of the stabilizing effect on the effluent at high powers.
4.4.2 The origin of the large-scale transient vortex structure
It is shown in figure 4.8 and figure 4.9 that there is a transient vortex struc-ture formed when the plasma is switched on and off. Compared to the gastemperature distribution, a high gas temperature zone is formed after theplasma is ignited between 0.1 - 0.3 ms in figure 4.11. This high gas temper-ature zone extends along the axial direction. Its growth velocity is highlycorrelated with the propagation velocity of the transient vortex structure inthe flow as shown in figure 4.15(a) in which both the position of the highgas temperature zone and the transient vortex structure are plotted. Whenthe plasma is switched off a lower gas temperature zone is formed as canbe seen in figure 4.11 at t = 10.3 mm. The growth of the lower temperaturezone is also highly correlated to the propagation speed of the transient vortexstructure in the flow as is shown in figure 4.15(b).
0.05 0.1 0.15 0.2 0.25 0.3 0.35 0.4 0.450
1
2
3
4
5
6
Time (ms)
Ax
ial
po
siti
on
s (m
m)
turbulent flow structure
high gas temperature structure
(a)
10.1 10.2 10.3 10.4 10.5 10.6 10.70
1
2
3
4
5
6
7
8
Time (ms)
Ax
ial
po
siti
on
s (m
m)
turbulent flow structure
low gas temperature structure
(b)
Figure 4.15: Upper and lower boundary of the transient vortex structure andthe gas temperature structure on the axis of symmetry when the plasma is (a)on (b) off. The zero position is the exit of the quartz tube. 0 ms and 10 mscorresponds to the time when the plasma is switched on and off respectively.The upper and lower markers indicate the axial size of structures. Examplesare shown in figure 4.8 and figure 4.9.
Based on these correlations we can conclude that the reason behind thisphenomenon relates to the difference in velocities of the gas flow originatingfrom the quartz tube when the plasma is on and off. Shortly after the plasmais switched on, the less dense and faster moving flow from the tube interacts
75

Gas flow characteristics
with the slower moving flow downstream, forming a vortex in the wholecross-section of the effluent. Similarly when the plasma is switched off, theonset of denser but slower flow from the quartz tube triggers a perturbationin the flow and causes a similar large-scale vortex that travels downstream.
4.5 Conclusions
It is shown for the APPJ studied in this work that the reduction of the ef-fective potential core flow in the plasma effluent is due to gas heating. Gasheating leads to increased gas flow velocities in the early effluent and theinduced larger velocity difference triggers the onset of the vortex structuresat the jet effluent. The changes in the effective potential core flow length arenot found not to be correlated with a change in the Reynolds number.
In addition, it is shown that the velocity change due to gas temperaturechanges induced by plasma modulation lead to the occurrence of large-scaletransient vortex structure of which the propagation velocity strongly corre-lates with the change in gas temperature distribution.
In the case of higher plasma powers, the plasma is able to stabilize theflow and extend the effective potential core flow length. Two possible ex-planations are given: (1) stabilizing effects due to an increase in viscositywith increasing gas temperature and (2) charge separation at the edge of theplasma plume leading to ionic momentum transfer.
References
[1] M. G. Kong, G. Kroesen, G. Morfill, T. Nosenko, T. Shimizu, J. van Dijk,and J. L. Zimmermann. Plasma medicine: an introductory review. NewJournal of Physics, 11(11):115012, 2009.
[2] M. Laroussi. Low-temperature plasmas for medicine? Plasma Science,IEEE Transactions on, 37(6):714–725, 2009.
[3] R. Reuter, K. Rügner, D. Ellerweg, T. de los Arcos, A. von Keudell, andJ. Benedikt. The role of oxygen and surface reactions in the depositionof silicon oxide like films from HMDSO at atmospheric pressure. PlasmaProcesses and Polymers, 9(11-12):1116–1124, 2012.
76
References
[4] J. W. Gauntner, J. N. Livingood, and P. Hrycak. Survey of literature onflow characteristics of a single turbulent jet impinging on a flat plate.Washington, DC, 1970.
[5] T. L. Labus and E. P. Symons. Experimental investigation of an axisymmetricfree jet with an initially uniform velocity profile. National Aeronautics andSpace Administration, 1972.
[6] X. Grandchamp and A. Van Hirtum. Near field round jet flow down-stream from an abrupt contraction nozzle with tube extension. Flow,turbulence and combustion, 90(1):95–119, 2013.
[7] A. Abdel-Rahman. A review of effects of initial and boundary condi-tions on turbulent jets. WSEAS transactions on Fluid Mechanics, 5(4):257–275, 2010.
[8] S. Russ and P. Strykowski. Turbulent structure and entrainment inheated jets: The effect of initial conditions. Physics of Fluids A: FluidDynamics (1989-1993), 5(12):3216–3225, 1993.
[9] W. M. Pitts. Effects of global density ratio on the centerline mixing be-havior of axisymmetric turbulent jets. Experiments in Fluids, 11(2-3):125–134, 1991.
[10] D. Kyle and K. Sreenivasan. The instability and breakdown of a roundvariable-density jet. Journal of Fluid Mechanics, 249:619–664, 1993.
[11] V. V. Kozlov, G. R. Grek, A. V. Dovgal, and Y. A. Litvinenko. Stability ofsubsonic jet flows. Journal of Flow Control, Measurement & Visualization,1:94, 2013.
[12] Y. A. Litvinenko, G. Grek, G. Kozlov, A. Sorokin, and M. Litvinenko.Development of a free round jet at different conditions at the nozzle exitunder an acoustic action. In Progress in Flight Physics, volume 3, pages429–448. EDP Sciences, 2012.
[13] B. Yildirim and A. Agrawal. Full-field measurements of self-excited os-cillations in momentum-dominated helium jets. Experiments in fluids,38(2):161–173, 2005.
[14] K. S. Pasumarthi and A. K. Agrawal. Buoyancy effects on flow transitionin low-density inertial gas jets. Experiments in fluids, 38(4):541–544, 2005.
[15] H. Rehab, E. Villermaux, and E. Hopfinger. Flow regimes of large-velocity-ratio coaxial jets. Journal of Fluid Mechanics, 345:357–381, 1997.
[16] F. Takahashi, M. Mizomoto, and S. Ikai. Transition from laminar toturbulent free jet diffusion flames. Combustion and Flame, 48:85–95, 1982.
77

Gas flow characteristics
[17] T. Takeno. Transition and structure of jet diffusion flames. In Symposium(International) on Combustion, volume 25, pages 1061–1073. Elsevier, 1994.
[18] S. Russ, P. Strykowski, and E. Pfender. Mixing in plasma and low den-sity jets. Experiments in fluids, 16(5):297–307, 1994.
[19] J. P. Trelles. Computational study of flow dynamics from a DC arcplasma jet. Journal of Physics D: Applied Physics, 46(25):255201, 2013.
[20] E. Pfender, J. Fincke, and R. Spores. Entrainment of cold gas into thermalplasma jets. Plasma chemistry and plasma processing, 11(4):529–543, 1991.
[21] R. Barnes and J. Genna. Gas flow dynamics of an inductively cou-pled plasma discharge. Spectrochimica Acta Part B: Atomic Spectroscopy,36(4):299–323, 1981.
[22] B. van Gessel, R. Brandenburg, and P. Bruggeman. Electron propertiesand air mixing in radio frequency driven argon plasma jets at atmo-spheric pressure. Applied Physics Letters, 103(6):064103–064103, 2013.
[23] S. Takamura, S. Saito, G. Kushida, M. Kando, and N. Ohno. Fluidmechanical characteristics of microwave discharge jet plasmas at atmo-spheric gas pressure. IEEJ Transactions on Fundamentals and Materials,130:493–500, 2010.
[24] J.-S. Oh, O. T. Olabanji, C. Hale, R. Mariani, K. Kontis, and J. W. Bradley.Imaging gas and plasma interactions in the surface-chemical modifica-tion of polymers using micro-plasma jets. Journal of Physics D: AppliedPhysics, 44(15):155206, 2011.
[25] J. W. Bradley, J.-S. Oh, O. T. Olabanji, C. Hale, R. Mariani, and K. Kontis.Schlieren photography of the outflow from a plasma jet. Plasma Science,IEEE Transactions on, 39(11):2312–2313, 2011.
[26] M. Ghasemi, P. Olszewski, J. Bradley, and J. Walsh. Interaction of multi-ple plasma plumes in an atmospheric pressure plasma jet array. Journalof Physics D: Applied Physics, 46(5):052001, 2013.
[27] M. Foletto, C. Douat, J. Fontane, L. Joly, L. Pitchford, and V. Puech.Influence of a plasma jet on the hydrodynamics of a helium jet. 31thInternational Conference on Phenomena in Ionized Gases - ICPIG (Granada,Spain), 2013.
[28] E. Robert, V. Sarron, T. Darny, D. Riès, S. Dozias, J. Fontane, L. Joly,and J. Pouvesle. Rare gas flow structuration in plasma jet experiments.Plasma Sources Science and Technology, 23(1):012003, 2014.
78

References
[29] V. Sarron, É. Robert, J. Fontane, T. Darny, D. Riès, S. Dozias, L. Joly, andJ.-M. Pouvesle. Plasma plume length characterization. 21st InternationalSymposium on Plasma Chemistry - ISPC (Cairns, Australia), 2013.
[30] M. Boselli, V. Colombo, E. Ghedini, M. Gherardi, R. Laurita, A. Liguori,P. Sanibondi, and A. Stancampiano. Schlieren high-speed imaging ofa nanosecond pulsed atmospheric pressure non-equilibrium plasma jet.Plasma Chemistry and Plasma Processing, pages 1–17, 2014.
[31] P. Papadopoulos, P. Vafeas, P. Svarnas, K. Gazeli, P. Hatzikonstantinou,A. Gkelios, and F. Clément. Interpretation of the gas flow field modi-fication induced by guided streamer ( plasma bullet ) propagation.Journal of Physics D: Applied Physics, 47(42):425203, 2014.
[32] N. Mericam-Bourdet, M. Laroussi, A. Begum, and E. Karakas. Exper-imental investigations of plasma bullets. Journal of Physics D: AppliedPhysics, 42(5):055207, 2009.
[33] D.-Y. Xu and X. Chen. Effects of surrounding gas on the long laminarargon plasma jet characteristics. International communications in heat andmass transfer, 32(7):939–946, 2005.
[34] K. Cheng and X. Chen. Prediction of the entrainment of ambient air intoa turbulent argon plasma jet using a turbulence-enhanced combined-diffusion-coefficient method. International journal of heat and mass transfer,47(23):5139–5148, 2004.
[35] P. Woodfield, K. Nakabe, and K. Suzuki. Numerical computation on re-circulation flow structures in co-axial confined laminar jets. Japan societyfor computational fluid dynamics, 2000.
[36] S. Samukawa, M. Hori, S. Rauf, K. Tachibana, P. Bruggeman, G. Kroe-sen, J. C. Whitehead, A. B. Murphy, A. F. Gutsol, S. Starikovskaia,et al. The 2012 plasma roadmap. Journal of Physics D: Applied Physics,45(25):253001, 2012.
[37] K. V. Sharp and R. J. Adrian. Transition from laminar to turbulent flowin liquid filled microtubes. Experiments in fluids, 36(5):741–747, 2004.
[38] R. Adrian and C. Yao. Power spectra of fluid velocities measured bylaser doppler velocimetry. Experiments in Fluids, 5(1):17–28, 1986.
[39] S. Hofmann, A. F. H. van Gessel, T. Verreycken, and P. Bruggeman.Power dissipation, gas temperatures and electron densities of cold at-mospheric pressure helium and argon RF plasma jets. Plasma SourcesScience and Technology, 20(6):065010, 2011.
79
Gas flow characteristics
[40] A. F. H. van Gessel, E. A. D. Carbone, P. J. Bruggeman, and J. van derMullen. Laser scattering on an atmospheric pressure plasma jet: dis-entangling Rayleigh, Raman and Thomson scattering. Plasma SourcesScience and Technology, 21(1):015003, 2012.
[41] J. M. De Regt, F. P. J. De Groote, J. A. M. Van der Mullen, and D. C.Schram. Air entrainment in an inductively coupled plasma measuredby Raman and Rayleigh scattering. Spectrochimica Acta Part B: AtomicSpectroscopy, 51(12):1527–1534, 1996.
[42] J. A. Sutton and J. F. Driscoll. Rayleigh scattering cross sections of com-bustion species at 266, 355, and 532 nm for thermometry applications.Optics letters, 29(22):2620–2622, 2004.
[43] E. Bich, J. Millat, and E. Vogel. The viscosity and thermal conductivityof pure monatomic gases from their normal boiling point up to 5000 Kin the limit of zero density and at 0.101325 MPa. Journal of physical andchemical reference data, 19(6):1289–1305, 1990.
[44] E. Moreau. Airflow control by non-thermal plasma actuators. Journal ofPhysics D: Applied Physics, 40(3):605, 2007.
[45] E. Moreau, N. Benard, J.-D. Lan-Sun-Luk, and J.-P. Chabriat. Electrohy-drodynamic force produced by a wire-to-cylinder DC corona dischargein air at atmospheric pressure. Journal of Physics D: Applied Physics,46(47):475204, 2013.
[46] J. Boeuf and L. Pitchford. Electrohydrodynamic force and aerodynamicflow acceleration in surface dielectric barrier discharge. Journal of AppliedPhysics, 97(10):103307, 2005.
[47] L. Leger, E. Moreau, and G. G. Touchard. Effect of a DC corona electricaldischarge on the airflow along a flat plate. Industry Applications, IEEETransactions on, 38(6):1478–1485, 2002.
[48] J. Boeuf, Y. Lagmich, T. Unfer, T. Callegari, and L. Pitchford. Electrohy-drodynamic force in dielectric barrier discharge plasma actuators. Jour-nal of Physics D: Applied Physics, 40(3):652, 2007.
[49] Y. P. Raizer, V. I. Kisin, and J. E. Allen. Gas discharge physics, volume 1.Springer-Verlag Berlin, 1991.
[50] A. van Gessel, K. Alards, and P. Bruggeman. NO production in an RFplasma jet at atmospheric pressure. Journal of Physics D: Applied Physics,46(26):265202, 2013.
[51] R. Sosa, E. Arnaud, E. Memin, and G. Artana. Study of the flow in-duced by a sliding discharge. Dielectrics and Electrical Insulation, IEEETransactions on, 16(2):305–311, 2009.
80
References
[52] V. Fortov, O. Petrov, O. Vaulina, and R. Timirkhanov. Viscosity of astrongly coupled dust component in a weakly ionized plasma. Physicalreview letters, 109(5):055002, 2012.
[53] C. van Gils, S. Hofmann, B. Boekema, R. Brandenburg, and P. Brugge-man. Mechanisms of bacterial inactivation in the liquid phase inducedby a remote RF cold atmospheric pressure plasma jet. Journal of PhysicsD: Applied Physics, 46(17):175203, 2013.
[54] H. Kawamoto, H. Yasuda, and S. Umezu. Flow distribution and pressureof air due to ionic wind in pin-to-plate corona discharge system. Journalof Electrostatics, 64(6):400–407, 2006.
81

82

CHAPTER 5
Temporally resolved ozone distribution of a
time modulated RF atmospheric pressure
argon plasma jet: flow, chemical reaction, and
transient vortex
Abstract
The temporally resolved ozone density distribution in the effluent of atime modulated RF atmospheric pressure plasma jet (APPJ) is investigatedby absorption spectroscopy. The plasma jet is operated with the averageddissipated power 6.5 W and gas flow rate 2 slm argon + 2% O2. The modu-lation frequency is 50 Hz with a duty ratio cycle of 50%. To investigate theproduction and destruction mechanism of ozone in the plasma effluent, thetemporally resolved atomic oxygen and gas temperature is also obtained byTALIF and Rayleigh scattering, respectively.
A temporal increase in ozone density is observed at a axial position of0.5 mm when the plasma is switched off. A chemical model shows that abalance between ozone production through a three body reaction and theloss due to flow determines the temporal ozone density. Ozone absorptionat different axial positions indicates that the ozone distribution is dominatedby the transport process induced by gas flow and allows to estimate the axislocal gas velocity in the jet effluent.
A modified version of this chapter is submitted for publication as S. Zhang, A. Sobota, E.M. van Veldhuizen, and P. J. Bruggeman, “Temporally resolved ozone distribution of a timemodulated RF atmospheric pressure argon plasma jet: flow, chemical reaction, and transientvortex”, (2015)
83
Temporally resolved distribution of O3
5.1 Introduction
Cold atmospheric pressure plasma jets (APPJs) are currently investigatedintensively due to the promising applications in biomedical field such aswound healing [1], disinfection, sterilization [2, 3] and material and watertreatment [4–6]. APPJs operate with the plasma effluent into open air. Theplasma effluent is a cocktail of charged particles, reactive species and pho-tons. Out of the reactive oxygen species (ROS), ozone has strong oxida-tion and a long lifetime and plays an important role in biomedical appli-cations [7, 8].
Ozone has been extensively investigated in a large variety of microplas-mas. Reuter et al [9] studied the ozone production of an argon RF ex-ited plasma jet by UV absorption spectroscopy and mid-IR absorption spec-troscopy. The same authors also validated that the absorption of UV at 253nm is solely due to ozone in the same plasma jet [10]. Hong et al investi-gated the ozone production in surface dielectric barrier discharge used in aplasma actuator under different parameters such as amplitude and frequencyof the applied voltage and the electrode shape [11]. Vezzu et al researchedthe large scale ozone generator and suggested that the optimal situation forozone synthesis in a DBD requires highly filamentary discharges [12]. Theozone production of a hollow-needle-to-mesh negative corona discharge wasstudied by Pekárek [13]. They found that placing the dielectric tube aroundthe needle electrode with an optimized position led to a fourfold increaseof ozone concentration at the same discharge power and airflow. Chen etal presented and validated a numerical model of ozone production for aDC corona discharge [14].Sands et al observed a turnover frequency for theozone production with different pulse repetition rate in the case of a kHz-pulsed He-O2 capillary dielectric barrier discharges [15]. Kim et al investi-gated a new ozone reactor based on arrays of microchannel plasmas andindicated that the electric field strength has a significant impact on the ozoneproduction efficiency [16]. The dependence of ozone production rate on thereduced electric field strength was also found by Plank et al in a low cur-rent non self-sustained DC discharge [17]. Marinov et al demonstrated theozone formation by recombination of O and O2 on silica surfaces in a lowpressure (several mbar) pulsed O2 DC discharge inside a cylindrical silicatube and found that the ozone production is linearly proportional to the O2pressure [18].
For DBD plasma, the seminal work of Eliasson et al reported temporalozone formation by numerical simulation in an ozonizer discharge tube [19].For the production and destruction mechanism of ozone in an RF APPJ,Zhang et al found the ozone density is significantly reduced by dissociation
84
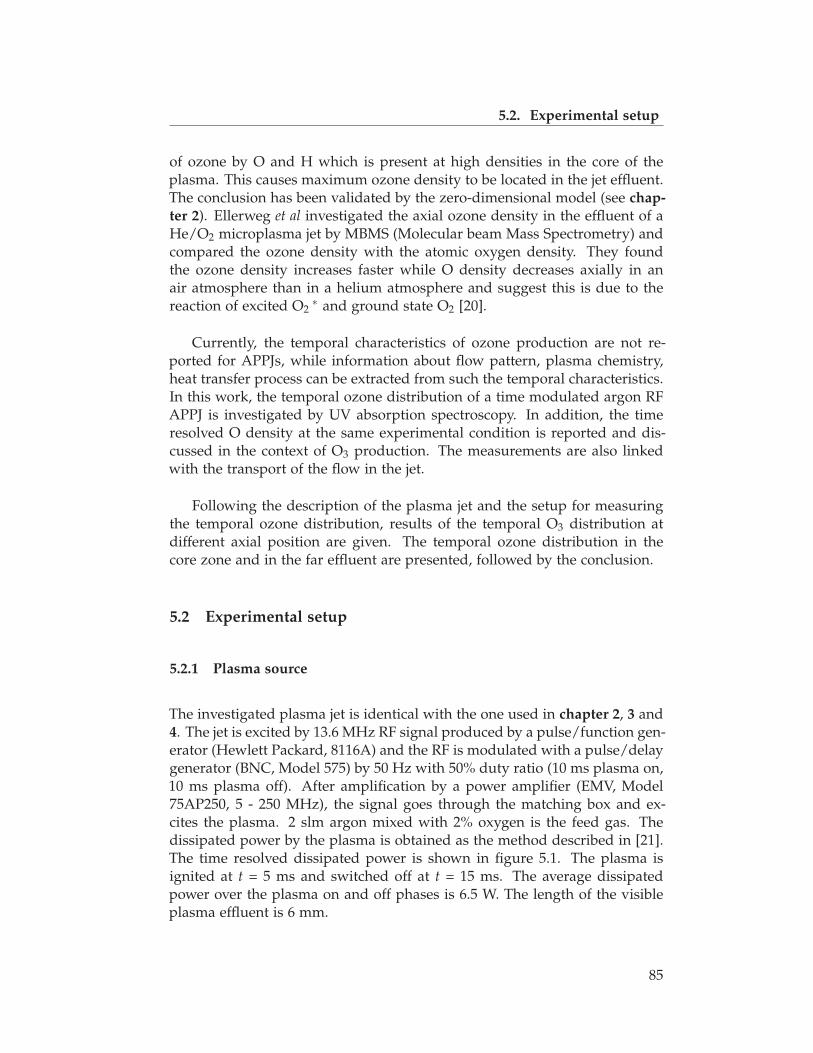
5.2. Experimental setup
of ozone by O and H which is present at high densities in the core of theplasma. This causes maximum ozone density to be located in the jet effluent.The conclusion has been validated by the zero-dimensional model (see chap-ter 2). Ellerweg et al investigated the axial ozone density in the effluent of aHe/O2 microplasma jet by MBMS (Molecular beam Mass Spectrometry) andcompared the ozone density with the atomic oxygen density. They foundthe ozone density increases faster while O density decreases axially in anair atmosphere than in a helium atmosphere and suggest this is due to thereaction of excited O2
∗ and ground state O2 [20].
Currently, the temporal characteristics of ozone production are not re-ported for APPJs, while information about flow pattern, plasma chemistry,heat transfer process can be extracted from such the temporal characteristics.In this work, the temporal ozone distribution of a time modulated argon RFAPPJ is investigated by UV absorption spectroscopy. In addition, the timeresolved O density at the same experimental condition is reported and dis-cussed in the context of O3 production. The measurements are also linkedwith the transport of the flow in the jet.
Following the description of the plasma jet and the setup for measuringthe temporal ozone distribution, results of the temporal O3 distribution atdifferent axial position are given. The temporal ozone distribution in thecore zone and in the far effluent are presented, followed by the conclusion.
5.2 Experimental setup
5.2.1 Plasma source
The investigated plasma jet is identical with the one used in chapter 2, 3 and4. The jet is excited by 13.6 MHz RF signal produced by a pulse/function gen-erator (Hewlett Packard, 8116A) and the RF is modulated with a pulse/delaygenerator (BNC, Model 575) by 50 Hz with 50% duty ratio (10 ms plasma on,10 ms plasma off). After amplification by a power amplifier (EMV, Model75AP250, 5 - 250 MHz), the signal goes through the matching box and ex-cites the plasma. 2 slm argon mixed with 2% oxygen is the feed gas. Thedissipated power by the plasma is obtained as the method described in [21].The time resolved dissipated power is shown in figure 5.1. The plasma isignited at t = 5 ms and switched off at t = 15 ms. The average dissipatedpower over the plasma on and off phases is 6.5 W. The length of the visibleplasma effluent is 6 mm.
85

Temporally resolved distribution of O3
0 5 10 15 20 250
2
4
6
8
10
12
14
Time (ms)
Po
wer
(W
)
plasma on phase plasma off phase
plasma switched on at 5 ms
plasma switched off at 15 ms
Figure 5.1: The time resolved dissipated power into plasma and the visibleplasma effluent.
5.2.2 Temporally resolved ozone absorption
The set up used to obtain the time resolved ozone density in the plasmaeffluent is shown in figure 5.2.
Amplifier Matching
box
Delay generator
RFsignal
oxygen or air
argon
pinhole
U I
x
zMC
PMT1
DAQ device
PMT2
L1L2
L3L4 L5
Figure 5.2: Sktech of the set up for the time resolved ozone density measure-ment. See details of MC, PMT1, PMT2, DAQ device in text.
The UV light from a UV led (Roithner, SN 13045) is imaged on a pinhole(� = 200 μm) and focused to a point at the location of the plasma effluentby two convex lenses (f = 75 mm). With another pair of convex lenses (f =100 mm and 25 mm, respectively), the UV light is focused on the entranceslit of a monochromator (MC in figure 5.2) (McPERSON, Model 234/302,
86

5.2. Experimental setup
f = 200 mm, Grating 1200 grooves/mm) equipped with a photomultiplier(HAMAMATSU, R8486, PMT1 in figure 5.2). Part of the LED light is alsoreflected by a quartz glass and focused by a convex lenses (f = 100 mm)to another photomultiplier (HAMAMATSU, Photosensor Module H10720-110 Series, PMT2 in figure 5.2). Signals from the two photomultipliers arerecorded by a data acquisition device (Agilent U2541A 250 kSa/s, 16 bit).The data acquisition device is synchronized by the delay generator with theplasma excitation. For the temporal measurement, the sample rate of the dataacquisition devices is set to 200 kSa/s, the corresponding time resolution is5 μs. Each measurement is an accumulation of 1000 modulation cycles.
An overview of the recorded signals and their notations is shown in table5.1. Signals obtained by PMT2 are used as reference signals.
Table 5.1: Signals obtained by temporally resolved measurement.
Notations Definitions
Ion,1(t) temporal signal obtained by PMT1 when the UV led is onIon,2(t) temporal signal obtained by PMT2 when the UV led is onIem,1(t) temporal signal obtained by PMT1 when the UV led is offIem,2(t) temporal signal obtained by PMT2 when the UV led is off
Note: the signal intensity is expressed in Voltage.
5.2.3 Temporally resolved ozone density
The transmitted signal after the absorption of the plasma effluent is obtainedas follows:
I(t) =Ion,1(t)− Iem,1(t)Ion,2(t)− Iem,2(t)
(5.1)
In order to obtain the ozone absorption intensity Iabsorbance, the incidentlight intensity (I0) is chosen as the transmitted signal during the time t = 0 -5 ms and 20 - 25 ms (I(t = 0 - 5 ms, 20 - 25 ms)). The time resolved absorptionintensity is obtained as follows:
Iabsorbance(t) = 1 − I(t)I0
(5.2)
The normalized transmitted signal and the corresponding absorbance (in per-
87

Temporally resolved distribution of O3
centage) is shown in figure 5.3.
(a)
0 5 10 15 20 25-0.5
0
0.5
1
1.5
2
2.5
3
Time (ms)
Ab
sorb
ance
(%
)
(b)
Figure 5.3: The normalized I(t) (a) and the corresponding absorbance (b).The data is obtained on axis at 13 mm from the quartz tube. The power is 6.5W and the gas flow is 2 slm Ar + 2% O2.
The process of inverse Abel transformation and deconvolution from theozone absorption percentage to absolute ozone density has been describedin our previous publication in detail (see chapter 2). To obtain the absoluteozone density, the radially resolved absorbance is acquired by placing theplasma jet on a two dimensional moving platform (Thorlabs, APT - DC servocontroller) with a spatial resolution of higher than 0.1 mm. The FWHM ofthe focus point is 160 μm.
5.2.4 TALIF of atomic O density
In the core zone of the plasma effluent, the temporal O density is obtained bytwo-photon absorption laser induced fluorescence (TALIF) measurement atthe same experimental condition as O3 measurement. The details of the ex-perimental set up can be found in our previous publications (see chapter 3).In the far effluent, the TALIF signal is too weak to obtain accurate O densitydue to the collisional quenching. Absolute calibration has been performedby the method of van Gessel et al [22].
5.2.5 Rayleigh scattering
Gas temperature is important for the ozone production and in this work isobtained by Rayleigh scattering. The details of the setup can be found inchapter 2 and 4.
88

5.3. Experimental results and discussion
5.3 Experimental results and discussion
5.3.1 Temporally resolved ozone distribution on the axial centerline
Time (ms)
Ax
ial
po
siti
on
(m
m)
5 10 15 20 25
5
10
15
20
25
0
0.5
1
1.5
2
2.5
(a) Absorption percentage (%)
Time (ms)A
xia
l p
osi
tio
n (
mm
)
5 10 15 20 25
2
4
6
8
10
12
300
350
400
450
500
550
600
(b) Gas temperature (K)
Figure 5.4: The recorded temporal absorption percentage (a) and the gas tem-perature obtained by Rayleigh scattering (b) on the centerline along the axialdirection with the condition that the power 6.5 W, the gas 2 slm Ar + 2% O2.The gas temperature is smoothed based on results in chapter 4 at the sameexperimental condition. The map of gas temperature is combined by threeparts as validated by the dash lines(see chapter 4).
The temporally resolved O3 absorption percentage is shown in figure5.4(a). Although the plasma is switched on at 5 ms and switched off at 15ms, a delay between the start of the plasma and the absorption is found andthe delay becomes longer with increasing axial distance. A delay betweenthe plasma-switched-off time and the decrease in absorption is also found.The O3 absorption actually increases when the plasma is switched off in theplasma core zone up to z = 5 mm.
In figure 5.4(b), after the plasma is switched off, the gas temperature inthe core zone (close to the quartz tube until ∼ 3 mm) decrease from 600 - 700K to ∼ 400 K. However in the far effluent the gas temperature decreases toroom temperature in the plasma off phase and has a maximum temperatureof ∼ 400 K. This lower gas temperature is due to the entrainment of the coldsurrounding air. When the plasma is switched on and/or off, as in chapter4, a large scale transient vortex structure is generated, enhancing the mixingof the surrounding air into the downstream effluent. In the core zone (orthe near field region), the air entrainment is small and the gas temperaturechanges due to reduced heat air in the quartz tube.Nevertheless, the gasremains heated by the hot quartz tube and needle. The time at which theabsorption starts to rise as a function of the axial position is shown in figure
89
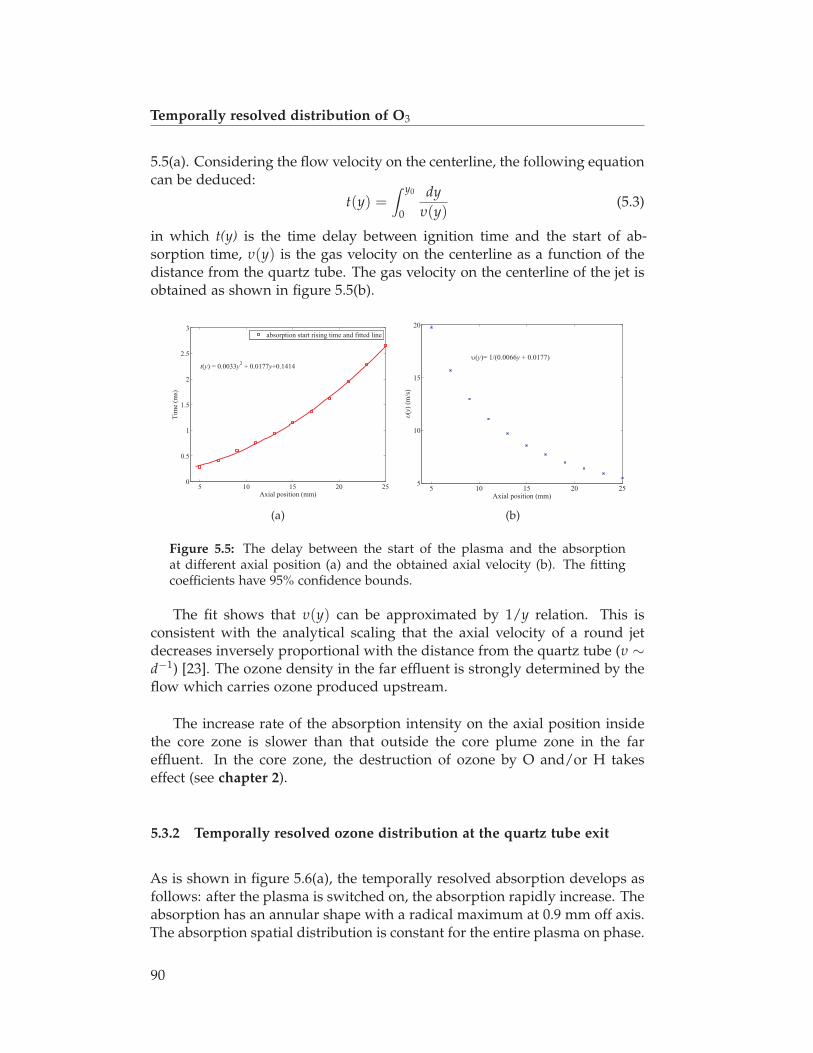
Temporally resolved distribution of O3
5.5(a). Considering the flow velocity on the centerline, the following equationcan be deduced:
t(y) =∫ y0
0
dyυ(y)
(5.3)
in which t(y) is the time delay between ignition time and the start of ab-sorption time, υ(y) is the gas velocity on the centerline as a function of thedistance from the quartz tube. The gas velocity on the centerline of the jet isobtained as shown in figure 5.5(b).
5 10 15 20 250
0.5
1
1.5
2
2.5
3
Axial position (mm)
Tim
e (m
s)
absorption start rising time and fitted line
t(y) = 0.0033y2 + 0.0177y+0.1414
(a)
5 10 15 20 255
10
15
20
Axial position (mm)
(y)
(m/s
)
(y)= 1/(0.0066y + 0.0177)
(b)
Figure 5.5: The delay between the start of the plasma and the absorptionat different axial position (a) and the obtained axial velocity (b). The fittingcoefficients have 95% confidence bounds.
The fit shows that υ(y) can be approximated by 1/y relation. This isconsistent with the analytical scaling that the axial velocity of a round jetdecreases inversely proportional with the distance from the quartz tube (υ ∼d−1) [23]. The ozone density in the far effluent is strongly determined by theflow which carries ozone produced upstream.
The increase rate of the absorption intensity on the axial position insidethe core zone is slower than that outside the core plume zone in the fareffluent. In the core zone, the destruction of ozone by O and/or H takeseffect (see chapter 2).
5.3.2 Temporally resolved ozone distribution at the quartz tube exit
As is shown in figure 5.6(a), the temporally resolved absorption develops asfollows: after the plasma is switched on, the absorption rapidly increase. Theabsorption has an annular shape with a radical maximum at 0.9 mm off axis.The absorption spatial distribution is constant for the entire plasma on phase.
90
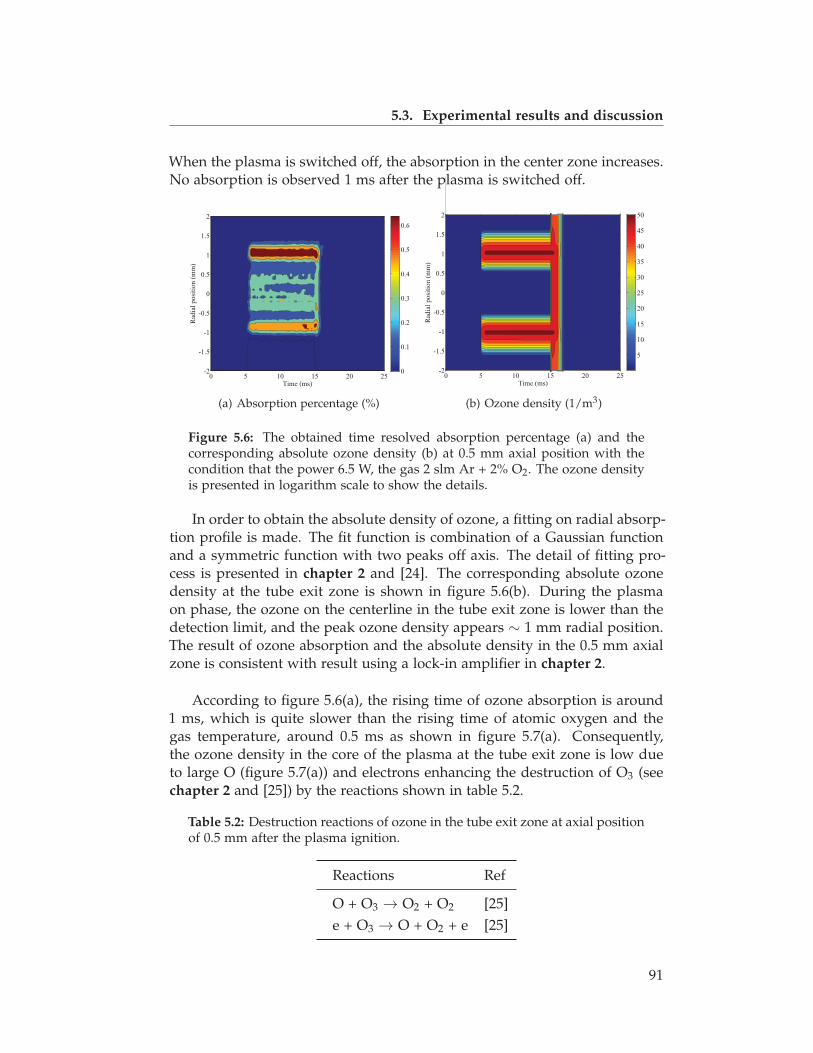
5.3. Experimental results and discussion
When the plasma is switched off, the absorption in the center zone increases.No absorption is observed 1 ms after the plasma is switched off.
Time (ms)
Rad
ial
po
siti
on
(m
m)
0 5 10 15 20 25-2
-1.5
-1
-0.5
0
0.5
1
1.5
2
0
0.1
0.2
0.3
0.4
0.5
0.6
(a) Absorption percentage (%)
Time (ms)
Rad
ial
po
siti
on
(m
m)
0 5 10 15 20 25-2
-1.5
-1
-0.5
0
0.5
1
1.5
2
5
10
15
20
25
30
35
40
45
50
(b) Ozone density (1/m3)
Figure 5.6: The obtained time resolved absorption percentage (a) and thecorresponding absolute ozone density (b) at 0.5 mm axial position with thecondition that the power 6.5 W, the gas 2 slm Ar + 2% O2. The ozone densityis presented in logarithm scale to show the details.
In order to obtain the absolute density of ozone, a fitting on radial absorp-tion profile is made. The fit function is combination of a Gaussian functionand a symmetric function with two peaks off axis. The detail of fitting pro-cess is presented in chapter 2 and [24]. The corresponding absolute ozonedensity at the tube exit zone is shown in figure 5.6(b). During the plasmaon phase, the ozone on the centerline in the tube exit zone is lower than thedetection limit, and the peak ozone density appears ∼ 1 mm radial position.The result of ozone absorption and the absolute density in the 0.5 mm axialzone is consistent with result using a lock-in amplifier in chapter 2.
According to figure 5.6(a), the rising time of ozone absorption is around1 ms, which is quite slower than the rising time of atomic oxygen and thegas temperature, around 0.5 ms as shown in figure 5.7(a). Consequently,the ozone density in the core of the plasma at the tube exit zone is low dueto large O (figure 5.7(a)) and electrons enhancing the destruction of O3 (seechapter 2 and [25]) by the reactions shown in table 5.2.
Table 5.2: Destruction reactions of ozone in the tube exit zone at axial positionof 0.5 mm after the plasma ignition.
Reactions Ref
O + O3 → O2 + O2 [25]e + O3 → O + O2 + e [25]
91
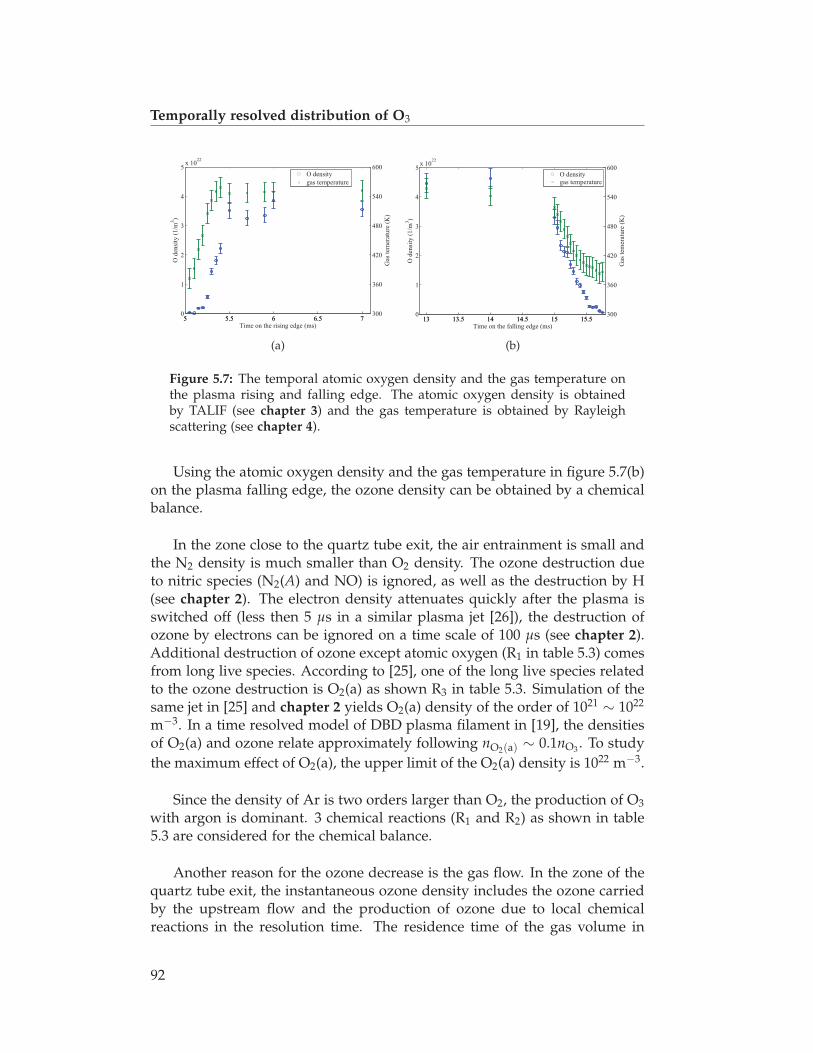
Temporally resolved distribution of O3
5 5.5 6 6.5 70
1
2
3
4
5x 10
22
O d
ensi
ty (
1/m
3)
5 5.5 6 6.5 7300
360
420
480
540
600
Gas
tem
erat
ure
(K
)
Time on the rising edge (ms)
O density
gas temperature
(a)
13 13.5 14 14.5 15 15.50
1
2
3
4
5x 10
22
O d
ensi
ty (
1/m
3)
13 13.5 14 14.5 15 15.5300
360
420
480
540
600
Gas
tem
erat
ure
(K
)
Time on the falling edge (ms)
O density
gas temperature
(b)
Figure 5.7: The temporal atomic oxygen density and the gas temperature onthe plasma rising and falling edge. The atomic oxygen density is obtainedby TALIF (see chapter 3) and the gas temperature is obtained by Rayleighscattering (see chapter 4).
Using the atomic oxygen density and the gas temperature in figure 5.7(b)on the plasma falling edge, the ozone density can be obtained by a chemicalbalance.
In the zone close to the quartz tube exit, the air entrainment is small andthe N2 density is much smaller than O2 density. The ozone destruction dueto nitric species (N2(A) and NO) is ignored, as well as the destruction by H(see chapter 2). The electron density attenuates quickly after the plasma isswitched off (less then 5 μs in a similar plasma jet [26]), the destruction ofozone by electrons can be ignored on a time scale of 100 μs (see chapter 2).Additional destruction of ozone except atomic oxygen (R1 in table 5.3) comesfrom long live species. According to [25], one of the long live species relatedto the ozone destruction is O2(a) as shown R3 in table 5.3. Simulation of thesame jet in [25] and chapter 2 yields O2(a) density of the order of 1021 ∼ 1022
m−3. In a time resolved model of DBD plasma filament in [19], the densitiesof O2(a) and ozone relate approximately following nO2(a) ∼ 0.1nO3. To studythe maximum effect of O2(a), the upper limit of the O2(a) density is 1022 m−3.
Since the density of Ar is two orders larger than O2, the production of O3with argon is dominant. 3 chemical reactions (R1 and R2) as shown in table5.3 are considered for the chemical balance.
Another reason for the ozone decrease is the gas flow. In the zone of thequartz tube exit, the instantaneous ozone density includes the ozone carriedby the upstream flow and the production of ozone due to local chemicalreactions in the resolution time. The residence time of the gas volume in
92

5.3. Experimental results and discussion
Table 5.3: Reactions related to ozone in the core zone.
Reactions Rate constants Tgas (K) Ref
R1 O + O3 → O2 + O2 8.0 × 10⁻¹²exp(−2060/Tgas) cm3s−1 [27]R2 O + O2 + Ar → O3+ Ar 1.85 × 10⁻³⁵exp(1057/Tgas) cm6s−1 200 - 400 [28]R3 O2(a)+O3 → O2 + O2 +O 6 × 10⁻¹¹exp(−2583/Tgas) cm3s−1 [28]
the jet is indeed several 100 μs after the plasma is switched off. As the flowincluding the atomic oxygen goes out from the quartz tube, more and morepure argon gas without plasma is fed and pushed out and the ozone densitydecrease. To include the flow effect into the balance, a characteristic time isobtained as follows:
tc =Lc
υc(5.4)
in which Lc = 2.5 mm and the distance is between the needle and the 0.5 mmaxial position, υc is the averaged velocity 26 m/s, tc ≈ 0.1 ms.
The chemical balance for O3 including the gas flow is as follows:
dnO3
dt= k2nOnO2 nAr − k1nOnO3 − k3nO2(a)nO3 −
nO3
tc(5.5)
in which, k1, k2, k3 represent the corresponding rate constants.
15 15.2 15.4 15.6 15.8 160
1
2
3
4
x 1022
O d
ensi
ty (
1/m
3)
15 15.2 15.4 15.6 15.8 160
2
4
6
8
x 1020
Mea
sure
d O
3 d
ensi
ty (
1/m
3)
Time on the falling edge (ms)
0
0.5
1
1.5
2
2.5
3x 10
21
Sim
ula
ted
O3 d
ensi
ty (
1/m
3)
measured O density
measured ozone density
simulated ozone densitywith 3 reactions in table 3
(a)
15 15.2 15.4 15.6 15.8 161
2
3
4
5
6
7
8
9x 10
20
Time (ms)
Ozo
ne
den
sity
(1
/m3)
measured ozone density
simulated ozone densityconsidering the gas flow
(b)
Figure 5.8: The O density and the Ozone density (a) and measured ozonedensity compared with model including singlet oxygen (b) at 0.5 mm axialposition from the quartz tube exit.
It can be seen in figure 5.8(a), the ozone reaches a maximum 0.3 ms afterthe plasma is switched off. The increase trend is consistent with the sim-ulated result. The ozone density increases in the core after the plasma is
93

Temporally resolved distribution of O3
switched off is due to the three body reaction. However, the simulated O3density keeps increasing and it is larger than the measured ozone density. Itshould be noted that even with the upper limit of O2(a) density, O2(a) haslittle effect in the simulated O3 density.
The simulated result considering the gas flow is shown in figure 5.8(b).As is shown, the gas flow in the zone of quartz tube exit determines the tem-poral ozone density distribution. After the plasma is switched off, the ozonedensity decreases due to the gas flow after a maximum resulting mainly fromthe production of three body reactions.
5.3.3 Temporally resolved ozone distribution in far effluent
The time resolved absorption percentage at axial distance 13 mm is shownin figure 5.9(a). The absorbance is not strictly symmetric. That may be dueto the small tilt of the needle inside the quartz tube leading to a small asym-metric. The absorbance tail after the plasma is switched off is possibly dueto random flow pattern.
Time (ms)0 5 10 15 20 25
-5
-4
-3
-2
-1
0
1
2
3
4
5
0
0.5
1
1.5
2
2.5
3
(a) Absorption percentage (%)
Time (ms)0 5 10 15 20 25
-5
-4
-3
-2
-1
0
1
2
3
4
5
1
2
3
4
5
6
7
8
x 1021
(b) Ozone density (1/m3)
Figure 5.9: The obtained temporally absorption percentage (a) and the ozonedensity (b) at an axial position of 13 mm. The power is 6.5 W and the gas flowis 2 slm Ar + 2% O2.
As is shown, the absorption profile generally has a Gaussian shape withthe maximum close to the centerline. As is stated in section 5.3.1, the delaybetween the start of the plasma and the ozone absorption is ∼ 0.8 ms. Afterthe absorption maximum induced by the plasma ignition, it decreases toa steady state until the plasma is switched off. The ozone absorption has adelayed response (0.5 ms) after the plasma is switched off and the absorptionfirst reaches a maximum then decreases until no more absorption is observed.
94
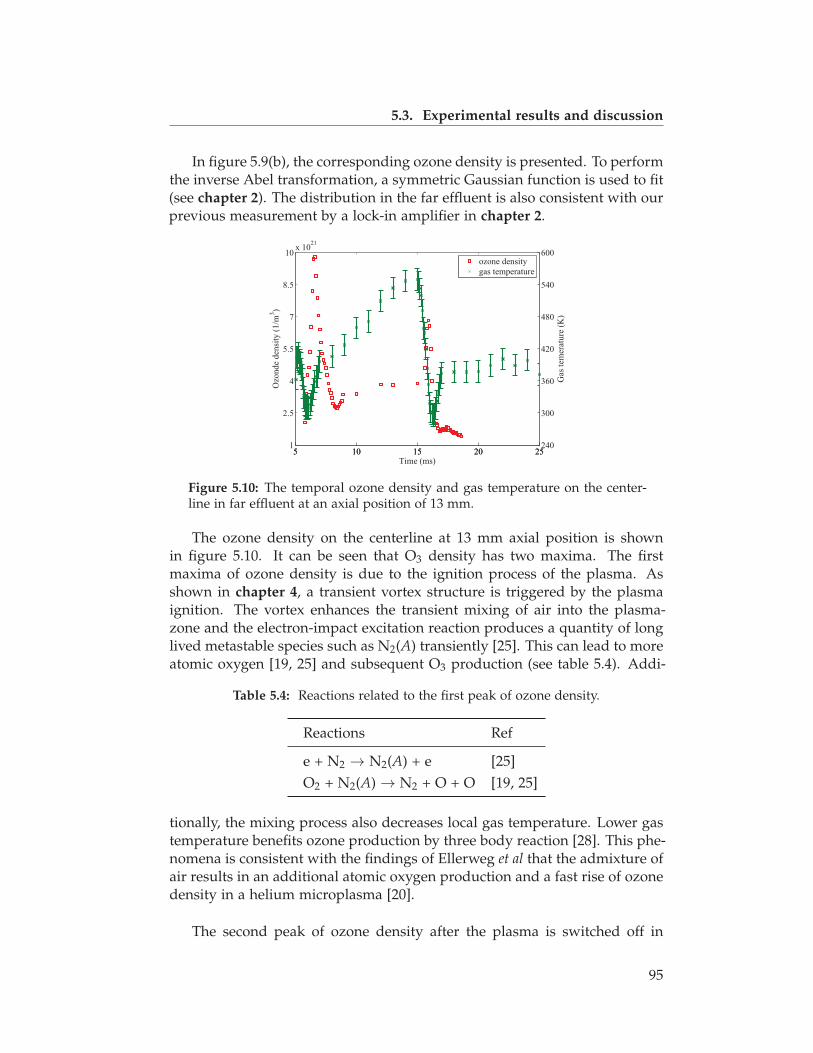
5.3. Experimental results and discussion
In figure 5.9(b), the corresponding ozone density is presented. To performthe inverse Abel transformation, a symmetric Gaussian function is used to fit(see chapter 2). The distribution in the far effluent is also consistent with ourprevious measurement by a lock-in amplifier in chapter 2.
5 10 15 20 251
2.5
4
5.5
7
8.5
10x 10
21
5 10 15 20 25240
300
360
420
480
540
600
Time (ms)
ozone density
gas temperature
Figure 5.10: The temporal ozone density and gas temperature on the center-line in far effluent at an axial position of 13 mm.
The ozone density on the centerline at 13 mm axial position is shownin figure 5.10. It can be seen that O3 density has two maxima. The firstmaxima of ozone density is due to the ignition process of the plasma. Asshown in chapter 4, a transient vortex structure is triggered by the plasmaignition. The vortex enhances the transient mixing of air into the plasma-zone and the electron-impact excitation reaction produces a quantity of longlived metastable species such as N2(A) transiently [25]. This can lead to moreatomic oxygen [19, 25] and subsequent O3 production (see table 5.4). Addi-
Table 5.4: Reactions related to the first peak of ozone density.
Reactions Ref
e + N2 → N2(A) + e [25]O2 + N2(A) → N2 + O + O [19, 25]
tionally, the mixing process also decreases local gas temperature. Lower gastemperature benefits ozone production by three body reaction [28]. This phe-nomena is consistent with the findings of Ellerweg et al that the admixture ofair results in an additional atomic oxygen production and a fast rise of ozonedensity in a helium microplasma [20].
The second peak of ozone density after the plasma is switched off in
95

Temporally resolved distribution of O3
figure 5.10 is due to the increase in the ozone production rate at lower gastemperature and the transport of O3 from upstream flow.
5.4 Conclusions
In this work, we investigated that temporal ozone density in the effluent of anArgon + 2% O2 RF APPJ. Time resolved ozone absorption at an axial positionof 0.5 mm and 13 mm are obtained. These two positions are representativesfor the core of the plasma and far effluent of the jet.
In the zone of 0.5 mm axial position, the ozone density increases after theplasma is switched off due to accelerated three body reaction because of thedecreased gas temperature and the decrease of O leading to the destructionof O3. The final decrease of ozone density results from gas flow.
In the far effluent at 13 mm axial position, the ozone density has twomaxima in one cycle. The first maximum in the ozone density is due to theadmixture of air induced by the transient vortex structure after the plasmais switched on, which is not occurring for the axial position of 0.5 mm. Thesecond maxima has the same origin as the axial position at 0.5 mm.
In the jet effluent flow, the delay between plasma ignition and the ozoneabsorption at different axial positions correlates well with the axial gas veloc-ity and the ozone density is dominated by the gas flow.
References
[1] C. H. Park, J. S. Lee, J. H. Kim, D.-K. Kim, O. J. Lee, H. W. Ju, B. M.Moon, J. H. Cho, M. H. Kim, P. P. Sun, et al. Wound healing with non-thermal microplasma jets generated in arrays of hourglass microcavitydevices. Journal of Physics D: Applied Physics, 47(43):435402, 2014.
[2] M. Pervez, A. Begum, and M. Laroussi. Plasma based sterilization:Overview and the stepwise inactivation process of microbial by non-thermal atmospheric pressure plasma jet. International Journal of Engi-neering & Technology, 14(5), 2014.
[3] N. Mastanaiah, P. Banerjee, J. A. Johnson, and S. Roy. Examining the roleof ozone in surface plasma sterilization using dielectric barrier discharge(DBD) plasma. Plasma Processes and Polymers, 10(12):1120–1133, 2013.
96
References
[4] M. G. Kong, G. Kroesen, G. Morfill, T. Nosenko, T. Shimizu, J. van Dijk,and J. L. Zimmermann. Plasma medicine: an introductory review. NewJournal of Physics, 11(11):115012, 2009.
[5] E. A. Ratovitski, X. Cheng, D. Yan, J. H. Sherman, J. Canady, B. Trink,and M. Keidar. Anti-cancer therapies of 21st century: Novel approachto treat human cancers using cold atmospheric plasma. Plasma Processesand Polymers, 11(12):1128–1137, 2014.
[6] C. B. Lee, Y. H. Na, T.-E. Hong, E. H. Choi, H. S. Uhm, K. Y. Baik, andG. Kwon. Evidence of radicals created by plasma in bacteria in water.Applied Physics Letters, 105(7):073702, 2014.
[7] D. B. Graves. Reactive species from cold atmospheric plasma: Implica-tions for cancer therapy. Plasma Processes and Polymers, 2014.
[8] O. Lunov, V. Zablotskii, O. Churpita, E. Chánová, E. Syková, A. Dejneka,and Š. Kubinová. Cell death induced by ozone and various non-thermalplasmas: therapeutic perspectives and limitations. Scientific reports, 4,2014.
[9] S. Reuter, J. Winter, S. Iseni, S. Peters, A. Schmidt-Bleker, M. Dünnbier,J. Schäfer, R. Foest, and K. D. Weltmann. Detection of ozone in a MHz ar-gon plasma bullet jet. Plasma Sources Science and Technology, 21(3):034015,2012.
[10] J. Winter, M. Dünnbier, A. Schmidt-Bleker, A. Meshchanov, S. Reuter,and K. D. Weltmann. Aspects of UV-absorption spectroscopy on ozonein effluents of plasma jets operated in air. Journal of Physics D: AppliedPhysics, 45(38):385201, 2012.
[11] D. Hong, H. Rabat, J. Bauchire, and M. Chang. Measurement of ozoneproduction in non-thermal plasma actuator using surface dielectric bar-rier discharge. Plasma Chemistry and Plasma Processing, 34(4):887–897,2014.
[12] G. Vezzu, J. L. Lopez, A. Freilich, and K. H. Becker. Optimizationof large-scale ozone generators. Plasma Science, IEEE Transactions on,37(6):890–896, 2009.
[13] S. Pekárek. Ozone production of hollow-needle-to-mesh negative coronadischarge enhanced by dielectric tube on the needle electrode. PlasmaSources Science and Technology, 23(6):062001, 2014.
[14] J. Chen and J. H. Davidson. Ozone production in the positive DC coronadischarge: Model and comparison to experiments. Plasma Chemistry andPlasma Processing, 22(4):495–522, 2002.
97
Temporally resolved distribution of O3
[15] B. L. Sands and B. N. Ganguly. Ozone generation in a kHz-pulsed He-O2 capillary dielectric barrier discharge operated in ambient air. Journalof Applied Physics, 114(24):243301, 2013.
[16] M. Kim, J. Cho, S. Ban, R. Choi, E. Kwon, S. Park, and J. Eden. Efficientgeneration of ozone in arrays of microchannel plasmas. Journal of PhysicsD: Applied Physics, 46(30):305201, 2013.
[17] T. Plank, A. Jalakas, M. Aints, P. Paris, F. Valk, M. Viidebaum, and I. Jõgi.Ozone generation efficiency as a function of electric field strength in air.Journal of Physics D: Applied Physics, 47(33):335205, 2014.
[18] D. Marinov, O. Guaitella, J. Booth, and A. Rousseau. Direct observationof ozone formation on SiO2 surfaces in O2 discharges. Journal of PhysicsD: Applied Physics, 46(3):032001, 2013.
[19] B. Eliasson and U. Kogelschatz. Modeling and applications of silentdischarge plasmas. Plasma Science, IEEE Transactions on, 19(2):309–323,1991.
[20] D. Ellerweg, A. von Keudell, and J. Benedikt. Unexpected O and O3production in the effluent of He/O2 microplasma jets emanating intoambient air. Plasma Sources Science and Technology, 21(3):034019, 2012.
[21] S. Hofmann, A. F. H. van Gessel, T. Verreycken, and P. Bruggeman.Power dissipation, gas temperatures and electron densities of cold at-mospheric pressure helium and argon RF plasma jets. Plasma SourcesScience and Technology, 20(6):065010, 2011.
[22] van Gessel A F H, S. C. Grootel, and P. J. Bruggeman. Atomic oxy-gen TALIF measurements in an atmospheric pressure microwave plasmajet with in situ xinon calibration. Plasma Sources Science and Technology,22(5):055010, 2013.
[23] H. Schlichting. Boundary layer theory. McGraw-Hill, 1968.
[24] V. Dribinski, A. Ossadtchi, V. A. Mandelshtam, and H. Reisler. Recon-struction of Abel-transformable images: The Gaussian basis-set expan-sion Abel transform method. Review of scientific instruments, 73(7):2634–2642, 2002.
[25] W. Van Gaens and A. Bogaerts. Reaction pathways of biomedically ac-tive species in an Ar plasma jet. Plasma Sources Science and Technology,23(3):035015, 2014.
[26] B. van Gessel, R. Brandenburg, and P. Bruggeman. Electron propertiesand air mixing in radio frequency driven argon plasma jets at atmo-spheric pressure. Applied Physics Letters, 103(6):064103–064103, 2013.
98
References
[27] R. Atkinson, D. L. Baulch, R. A. Cox, J. N. Crowley, R. F. Hampson,R. G. Hynes, M. E. Jenkin, M. J. Rossi, J. Troe, et al. Evaluated kineticand photochemical data for atmospheric chemistry: Volume I-gas phasereactions of Ox, HOx, NOx and SOx species. Atmospheric chemistry andphysics, 4(6):1461–1738, 2004.
[28] J. Y. Jeong, J. Park, I. Henins, S. E. Babayan, V. J. Tu, G. S. Selwyn,G. Ding, and R. F. Hicks. Reaction chemistry in the afterglow of anoxygen-helium, atmospheric-pressure plasma. The Journal of PhysicalChemistry A, 104(34):8027–8032, 2000.
99

100
CHAPTER 6
Parameter study of ozone and atomic oxygen
production in a time modulated atmospheric
pressure plasma jet
Abstract
In this work, we investigate the effect of various O2 concentrations, gasflow rates, and dissipated plasma powers on the O3 production of a timemodulate RF argon atmospheric pressure plasma jet. It is found that thevariation in O3 and O density is small for theses various parameters. While,the gas flow rate of the three parameters has a comparatively larger effecton O3 density and Tg.
The results validate that the reaction mechanisms in chapter 2 are validfor a broader parameter range.
101

Parameter study on O3 and O
6.1 Introduction
Atmospheric pressure plasma jet (APPJ) has attracted great interest becauseof wide applications. O2 chemistry of APPJ is important for many impor-tant reactive oxygen species (ROS), such as ozone, or atomic oxygen. Ozonecould be used to disinfect, wound healing, food preservation, and even watercleaning [1–3]. Meanwhile, the most important precursor specie of ozone isatomic oxygen.
The plasma jet operates with noble gas, such as argon in this work. Toproduce ozone efficiently, molecular oxygen is a common admixture, such asin helium-oxygen capillary DBD [4], or argon-oxygen plasm jet [5]. In someplasma jet, the air is mixed with noble gas [6–8]. Compared to the oxygen,air is much easier to obtain and much more abundant, and for ozone produc-tion air is used in some case [9–11]. With the introduction of air, the reactivespecies change greatly due to the occurrence of reactive nitrogen species.In [12], Winter et al validated the UV absorption signal in an Ar+O2 plasmajet is only due to ozone. They also reported the ozone net production un-der different percentage of oxygen admixture. Nishiyama et al investigatedthe ozone production under various applied voltages, frequencies, and gasflow rate by an atmospheric pressure coaxial dielectric-barrier discharge andreported that the ozone production is highly determined by the applied volt-age [13].Hong et al studied the ozone production in a surface dielectric barrierdischarge with different parameters such as amplitude and frequency of theapplied voltage, electrode configuration and found the production of ozoneis linear with the dissipated power [14]. Sands et al characterized the ozonegeneration in a pulsed capillary dielectric barrier discharge under differentpulse repetition rates, gas flow rates, amplitudes of the applied voltage, oxy-gen concentration, and the design of external electrode and reported ozoneproduction is dependent on the design of external electrode and the pulserepetition rate [15].
In this work, we investigated a time modulated RF Ar + 2% O2 APPJ. Theozone production for various admixtures of oxygen concentration, gas flowrates, and different powers is studied for the first time in this work. Sincethe gas temperature and the atomic oxygen are important for the productionof ozone, atomic oxygen and gas temperature under the same conditions arealso reported.
After the description of the experimental setup and the plasma jet, theozone production in the effluent of the modulated plasma jet fed by argonmixed with the pure oxygen for different oxygen concentrations, gas flowrates, and powers are reported.
102
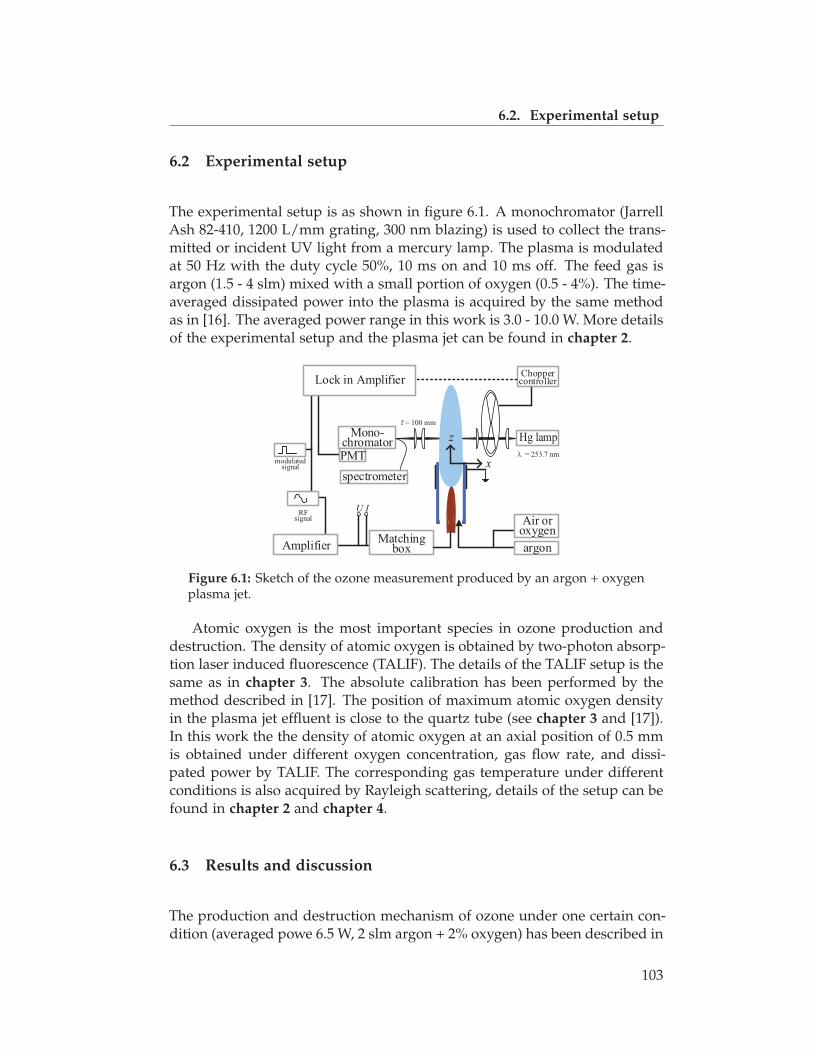
6.2. Experimental setup
6.2 Experimental setup
The experimental setup is as shown in figure 6.1. A monochromator (JarrellAsh 82-410, 1200 L/mm grating, 300 nm blazing) is used to collect the trans-mitted or incident UV light from a mercury lamp. The plasma is modulatedat 50 Hz with the duty cycle 50%, 10 ms on and 10 ms off. The feed gas isargon (1.5 - 4 slm) mixed with a small portion of oxygen (0.5 - 4%). The time-averaged dissipated power into the plasma is acquired by the same methodas in [16]. The averaged power range in this work is 3.0 - 10.0 W. More detailsof the experimental setup and the plasma jet can be found in chapter 2.
AmplifierMatching
box
Mono-chromatorPMT
Lock in AmplifierChopper controller
RFsignal
modulatedsignal
Air or oxygen
argon
spectrometerx
z
f = 100 mm
λ = 253.7 nm
U I
Figure 6.1: Sketch of the ozone measurement produced by an argon + oxygenplasma jet.
Atomic oxygen is the most important species in ozone production anddestruction. The density of atomic oxygen is obtained by two-photon absorp-tion laser induced fluorescence (TALIF). The details of the TALIF setup is thesame as in chapter 3. The absolute calibration has been performed by themethod described in [17]. The position of maximum atomic oxygen densityin the plasma jet effluent is close to the quartz tube (see chapter 3 and [17]).In this work the the density of atomic oxygen at an axial position of 0.5 mmis obtained under different oxygen concentration, gas flow rate, and dissi-pated power by TALIF. The corresponding gas temperature under differentconditions is also acquired by Rayleigh scattering, details of the setup can befound in chapter 2 and chapter 4.
6.3 Results and discussion
The production and destruction mechanism of ozone under one certain con-dition (averaged powe 6.5 W, 2 slm argon + 2% oxygen) has been described in
103

Parameter study on O3 and O
chapter 2. As is shown, the ozone density has a dip on axis in the core zoneof several mm from the quartz tube exit. The maximum density of ozoneis at the axial position of 13 mm. These features are validated by the timeresolved measurement of ozone at same condition in chapter 5.
Based on the result of ozone density under the condition stated above,the ozone density at the axial positions of 5 mm and 7 mm in the core zoneunder different O2 concentrations, flow rate and dissipated power are pre-sented. Additionally, the maximum ozone densities of the whole plasmaeffluent under these different conditions are obtained. The gas temperatureand atomic oxygen density are also presented.
6.3.1 The ozone production for different O2 concentrations
The ozone density is obtained at the 5 mm and 7 mm axial position andshown in figure 6.2(a).
0.5 1 1.5 2 2.5 3 3.5 40.4
0.6
0.8
1
1.2
1.4
1.6
1.8x 10
15
O2 concentration (%)
Max
imu
m o
zon
e d
ensi
ty (
cm-3
)
5mm
7mm
(a)
0.5 1 1.5 2 2.5 3 3.5 4450
500
550
600
650
700
750
800
850
900
950
O2 concentration (%)
Tem
per
atu
re (
K)
5mm
7mm
(b)
Figure 6.2: The ozone density (a) and the maximum gas temperature (b) un-der different O2 concentrations at the axial 5 mm and 7 mm position. Thedissipated power is constant at 7.3 W. The gas flow rate is 2 slm. The maxi-mum O3 density has its position off axis. The maximum Tg has its positionon axis.
As shown in 6.2(b), the gas temperature is not strongly dependent on theoxygen concentration at constant dissipated plasma power. The maximumozone density in figure 6.2(a) is at a radial position of ∼ 1 mm, the mecha-nism for that has been presented in chapter 2.
In the core zone of the axial position 5 mm and 7 mm, the gas tempera-ture has varied little in figure 6.2(b) and a similar effect is found at 0.5 mmaxial position as shown in 6.3(b). Meanwhile, the atomic oxygen density also
104

6.3. Results and discussion
changed a little under different oxygen concentrations as shown in figure6.3(a). The oxygen density is clearly the determining factor for ozone pro-duction. molecular oxygen comes from the admixed oxygen. As shown infigure 6.2(a), the ozone density is linearly dependent on the mixed oxygenconcentration.
0.5 1 1.5 2 2.5 3 3.5 41
1.5
2
2.5x 10
22
O2 concentration (%)
O d
ensi
ty (
1/m
3)
(a)
0.5 1 1.5 2 2.5 3 3.5 4300
400
500
600
700
800
900
O2 concentration (%)
Gas
tem
per
atu
re (
K)
(b)
Figure 6.3: The density of atomic oxygen (a) and the gas temperature (b) at0.5 mm on the axial line under the same condition as in figure 6.2(a).
In figure 6.4(a) the maximum ozone production of the effluent underdifferent oxygen concentrations is shown. The ozone production increaseslinearly with the oxygen concentration from 0.5% to 2.0%. Indeed the pro-duction and destruction rates of O3 are constant due to the constant gastemperature and O density. The only difference is the increase in O2 whichleads to a linear increase in the O3 production rate.
When the O2 concentration is larger than the 2%, the ozone productionis saturated. Also the position of the maximum ozone density is in the fareffluent as in 6.4(b).
As is indicated in chapter 5, the ozone in the far effluent transportedfrom the upstream effluent. This is clearly a maximum O3 density that canbe transported and this is limited by the O3 lifetime and gas velocity in thejet effluent.
6.3.2 The ozone production for different flow rates
One obvious impact of various flow rate is the gas temperature as expressedby formula 6.1 [16]:
P =ΔmΔt
cΔT, (6.1)
105
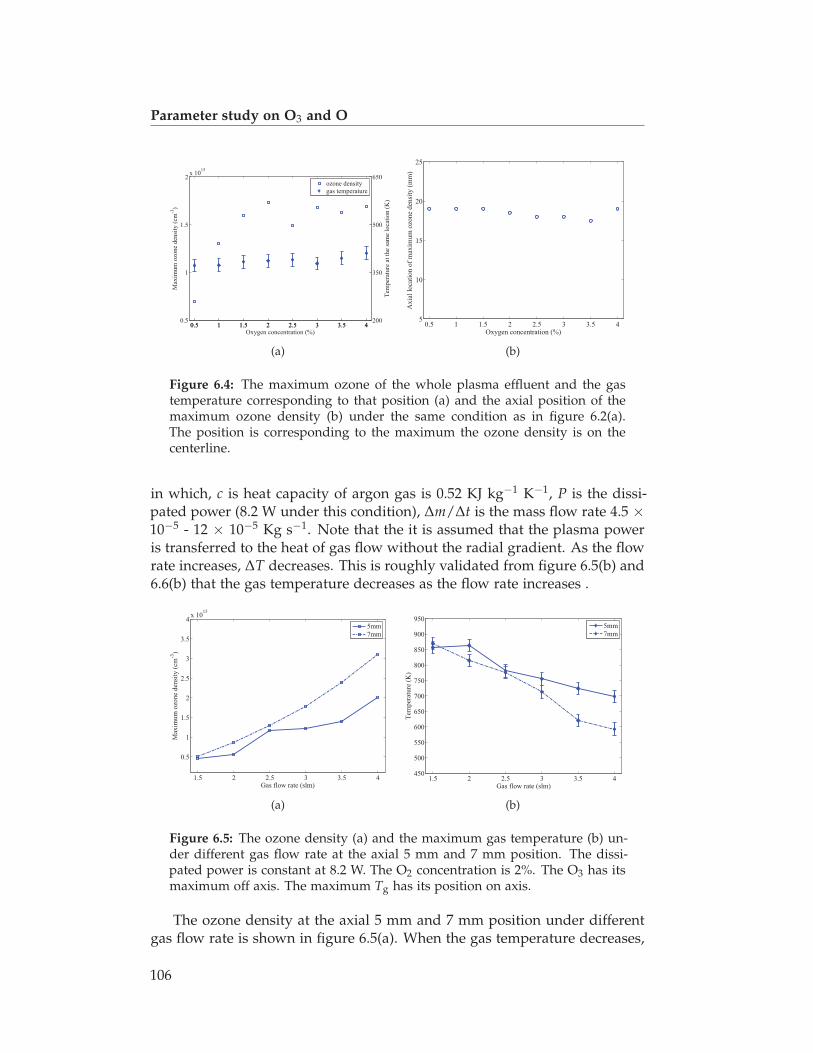
Parameter study on O3 and O
0.5 1 1.5 2 2.5 3 3.5 40.5
1
1.5
2x 10
15
Max
imu
m o
zon
e d
ensi
ty (
cm-3
)
0.5 1 1.5 2 2.5 3 3.5 4200
350
500
650
Tem
per
atu
re a
t th
e sa
me
loca
tio
n (
K)
Oxygen concentration (%)
ozone density
gas temperature
(a)
0.5 1 1.5 2 2.5 3 3.5 45
10
15
20
25
Ax
ial
loca
tio
n o
f m
axim
um
ozo
ne
den
sity
(m
m)
Oxygen concentration (%)
(b)
Figure 6.4: The maximum ozone of the whole plasma effluent and the gastemperature corresponding to that position (a) and the axial position of themaximum ozone density (b) under the same condition as in figure 6.2(a).The position is corresponding to the maximum the ozone density is on thecenterline.
in which, c is heat capacity of argon gas is 0.52 KJ kg−1 K−1, P is the dissi-pated power (8.2 W under this condition), Δm/Δt is the mass flow rate 4.5 ×10⁻⁵ - 12 × 10−5 Kg s−1. Note that the it is assumed that the plasma poweris transferred to the heat of gas flow without the radial gradient. As the flowrate increases, ΔT decreases. This is roughly validated from figure 6.5(b) and6.6(b) that the gas temperature decreases as the flow rate increases .
1.5 2 2.5 3 3.5 4
0.5
1
1.5
2
2.5
3
3.5
4x 10
15
Gas flow rate (slm)
Max
imu
m o
zon
e d
ensi
ty (
cm-3
)
5mm
7mm
(a)
1.5 2 2.5 3 3.5 4450
500
550
600
650
700
750
800
850
900
950
Tem
per
atu
re (
K)
Gas flow rate (slm)
5mm
7mm
(b)
Figure 6.5: The ozone density (a) and the maximum gas temperature (b) un-der different gas flow rate at the axial 5 mm and 7 mm position. The dissi-pated power is constant at 8.2 W. The O2 concentration is 2%. The O3 has itsmaximum off axis. The maximum Tg has its position on axis.
The ozone density at the axial 5 mm and 7 mm position under differentgas flow rate is shown in figure 6.5(a). When the gas temperature decreases,
106

6.3. Results and discussion
the ozone production by three body reactions with argon and molecular oxy-gen increases (see chapter 2 and [18]). In addition, destruction of ozone byatomic oxygen and atomic hydrogen in table 6.1 decreases as the gas temper-ature decreases (see chapter 2). Meanwhile, the atomic oxygen density in theeffluent is independent of the gas flow rate. Consequently, the ozone pro-duction and the destruction are mainly determined by the gas temperaturechange due to the various gas flow.
Table 6.1: Destruction reactions of ozone in the core zone.
Reactions Rate constants Ref
R1 O3 + O → O2+O2 8.0 × 10⁻¹²exp(−2060/Tgas) cm3s−1 [19]R2 O3 + H → HO+O2 1.4 × 10⁻¹⁰exp(−470/Tgas) cm3s−1 [19]
1.5 2 2.5 3 3.5 40.5
1
1.5
2
2.5x 10
22
Gas flow rate (slm)
O d
ensi
ty (
1/m
3)
(a)
1.5 2 2.5 3 3.5 4300
400
500
600
700
800
900
Gas flow rate (slm)
Gas
tem
per
atu
re (
K)
(b)
Figure 6.6: The density of atomic oxygen (a) and the gas temperature (b) ataxial 0.5 mm position on the axial line under the same condition as in figure6.5.
Figure 6.7(a) presents the maximum ozone density of the whole effluent.The increase amplitude of ozone density is ∼ 6, same as the increase am-plitude in the core zone at 5 mm and 7 mm in figure 6.5(a). However, theposition corresponding to the maximum ozone density moves closer to thequartz tube as the flow rate increases in figure 6.7(b). As the gas flow rate in-crease, the potential core flow becomes shorter ((see chapter 4). The sufficientmix process of surrounding air into the effluent starts earlier and the mixturebrings in abundant molecular oxygen to produce ozone causes a drop in gastemperature. Consequently, the atomic oxygen converts earlier to ozone andthe position of the maximum ozone density moves closer to the quartz tube.
107
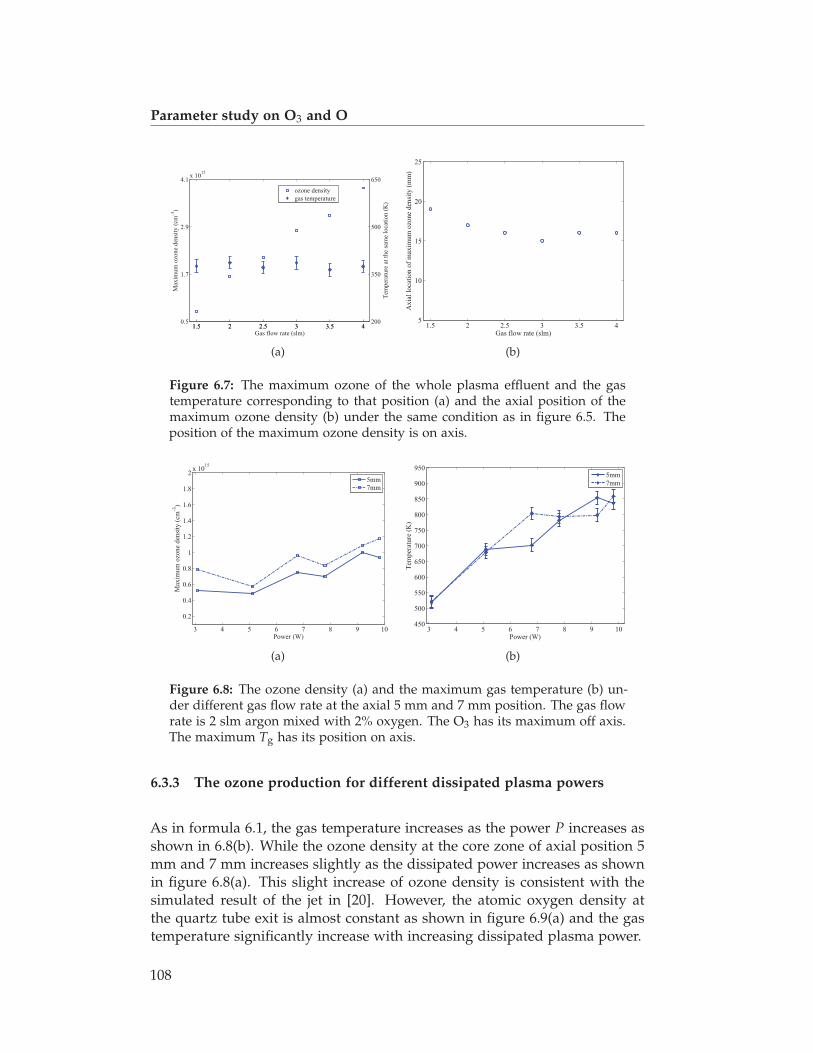
Parameter study on O3 and O
1.5 2 2.5 3 3.5 40.5
1.7
2.9
4.1x 10
15M
axim
um
ozo
ne
den
sity
(cm
-3)
1.5 2 2.5 3 3.5 4200
350
500
650
Tem
per
atu
re a
t th
e sa
me
loca
tio
n (
K)
Gas flow rate (slm)
ozone density
gas temperature
(a)
1.5 2 2.5 3 3.5 45
10
15
20
25
Ax
ial
loca
tio
n o
f m
axim
um
ozo
ne
den
sity
(m
m)
Gas flow rate (slm)
(b)
Figure 6.7: The maximum ozone of the whole plasma effluent and the gastemperature corresponding to that position (a) and the axial position of themaximum ozone density (b) under the same condition as in figure 6.5. Theposition of the maximum ozone density is on axis.
3 4 5 6 7 8 9 10
0.2
0.4
0.6
0.8
1
1.2
1.4
1.6
1.8
2x 10
15
Power (W)
Max
imu
m o
zon
e d
ensi
ty (
cm-3
)
5mm
7mm
(a)
3 4 5 6 7 8 9 10450
500
550
600
650
700
750
800
850
900
950
Tem
per
atu
re (
K)
Power (W)
5mm
7mm
(b)
Figure 6.8: The ozone density (a) and the maximum gas temperature (b) un-der different gas flow rate at the axial 5 mm and 7 mm position. The gas flowrate is 2 slm argon mixed with 2% oxygen. The O3 has its maximum off axis.The maximum Tg has its position on axis.
6.3.3 The ozone production for different dissipated plasma powers
As in formula 6.1, the gas temperature increases as the power P increases asshown in 6.8(b). While the ozone density at the core zone of axial position 5mm and 7 mm increases slightly as the dissipated power increases as shownin figure 6.8(a). This slight increase of ozone density is consistent with thesimulated result of the jet in [20]. However, the atomic oxygen density atthe quartz tube exit is almost constant as shown in figure 6.9(a) and the gastemperature significantly increase with increasing dissipated plasma power.
108

6.3. Results and discussion
3 4 5 6 7 80.5
1
1.5
2
2.5x 10
22
Power (W)
O d
ensi
ty (
1/m
3)
(a)
3 4 5 6 7 8300
350
400
450
500
550
600
650
700
750
Power (W)
Gas
tem
per
atu
re (
K)
(b)
Figure 6.9: The density of atomic oxygen (a) and the gas temperature (b) ataxial 0.5 mm position on the axial line under the same condition as in figure6.8.
In figure 6.10(a), as the dissipated power increases, the maximum ozonedensity rises in spite of the almost constant atomic oxygen density at the exit.
5.5 6 6.5 7 7.5 8 8.5 9 9.5 100.6
1
1.4
1.8x 10
15
Max
imu
m o
zon
e d
ensi
ty (
cm-3
)
5.5 6 6.5 7 7.5 8 8.5 9 9.5 10200
350
500
650
Tem
per
atu
re a
t th
e sa
me
loca
tio
n (
K)
Power (W)
ozone density
gas temperature
(a)
5.5 6 6.5 7 7.5 8 8.5 9 9.5 105
10
15
20
25
Ax
ial
loca
tio
n o
f m
axim
um
ozo
ne
den
sity
(m
m)
Power (W)
(b)
Figure 6.10: The maximum ozone of the whole plasma effluent and the gastemperature corresponding to that position (a) and the axial position of themaximum ozone density (b) under the same condition as in figure 6.8. Theposition of the maximum ozone density is on the axis.
The corresponding gas temperature at the position of the maximumozone density is independent of the dissipated plasma power. The positionis in the far effluent and the air is abundantly mixed with the effluent, whichcools down the gas temperature.
The increase in ozone density with increasing dissipated plasma power
109

Parameter study on O3 and O
in figure 6.10(a) is larger than that in the core zone of 5 mm and 7 mm axialposition. As the dissipated power increases, the length of visible plasmaeffluent increases. That leads to the extension of the zone of atomic oxygenproduction. Atomic oxygen is produced close to the position of the observedO3 density maximum and converted to ozone. As a result, more ozone istransported downstream with increased dissipated power.
6.4 Conclusions
In this work, we performed a parameter study of ozone production in the ef-fluent of a time modulated RF argon atmospheric pressure plasma jet mixedwith small amount of oxygen. In addition to oxygen concentration, the ef-fects of various gas flow rates and dissipated powers on the O3 productionare investigated.
The ozone density in the core zone and the maximum ozone density ofthe whole effluent increase a little when the O2 concentration, flow rate, anddissipated power increase, the ozone density also increase during the mea-sured parameter range. In addition, the maximum O density of the wholeeffluent increases little with the various three parameters.
Out of the three parameters, the gas flow rate has comparatively thelargest effect on ozone production. The small amount of admixed oxygenconcentration has little affect on the gas temperature. With increased gasflow rate, the position of maximum ozone density moves closer to the quartztube due to the shorter potential core flow.
The small variation in the O3 and O density allows to conclude that thereaction mechanism determined in chapter 2 for one experimental conditionsare valid for a broader parameter range.
References
[1] M. G. Kong, G. Kroesen, G. Morfill, T. Nosenko, T. Shimizu, J. van Dijk,and J. L. Zimmermann. Plasma medicine: an introductory review. NewJournal of Physics, 11(11):115012, 2009.
[2] N. Mastanaiah, P. Banerjee, J. A. Johnson, and S. Roy. Examining the roleof ozone in surface plasma sterilization using dielectric barrier discharge(DBD) plasma. Plasma Processes and Polymers, 10(12):1120–1133, 2013.
110

References
[3] A. Azarpazhooh and H. Limeback. The application of ozone in den-tistry: a systematic review of literature. Journal of dentistry, 36(2):104–116, 2008.
[4] D. Ellerweg, A. von Keudell, and J. Benedikt. Unexpected O and O3production in the effluent of He/O2 microplasma jets emanating intoambient air. Plasma Sources Science and Technology, 21(3):034019, 2012.
[5] S. Reuter, J. Winter, S. Iseni, S. Peters, A. Schmidt-Bleker, M. Dünnbier,J. Schäfer, R. Foest, and K. D. Weltmann. Detection of ozone in a MHz ar-gon plasma bullet jet. Plasma Sources Science and Technology, 21(3):034015,2012.
[6] A. van Gessel, K. Alards, and P. Bruggeman. NO production in an RFplasma jet at atmospheric pressure. Journal of Physics D: Applied Physics,46(26):265202, 2013.
[7] S. Iséni, S. Reuter, and K.-D. Weltmann. NO2 dynamics of an Ar/Airplasma jet investigated by in situ quantum cascade laser spectroscopy atatmospheric pressure. Journal of Physics D: Applied Physics, 47(7):075203,2014.
[8] S. Yonemori, Y. Nakagawa, R. Ono, and T. Oda. Measurement of OHdensity and air–helium mixture ratio in an atmospheric-pressure heliumplasma jet. Journal of Physics D: Applied Physics, 45(22):225202, 2012.
[9] S. Pekárek. Experimental study of surface dielectric barrier dischargein air and its ozone production. Journal of Physics D: Applied Physics,45(7):075201, 2012.
[10] T. Shimizu, Y. Sakiyama, D. B. Graves, J. L. Zimmermann, and G. E.Morfill. The dynamics of ozone generation and mode transition in airsurface micro-discharge plasma at atmospheric pressure. New Journal ofPhysics, 14(10):103028, 2012.
[11] Y. Xian, S. Wu, Z. Wang, Q. Huang, X. Lu, and J. F. Kolb. Dischargedynamics and modes of an atmospheric pressure non-equilibrium airplasma jet. Plasma Processes and Polymers, 10(4):372–378, 2013.
[12] J. Winter, M. Dünnbier, A. Schmidt-Bleker, A. Meshchanov, S. Reuter,and K. D. Weltmann. Aspects of UV-absorption spectroscopy on ozonein effluents of plasma jets operated in air. Journal of Physics D: AppliedPhysics, 45(38):385201, 2012.
[13] H. Nishiyama, H. Takana, S. Niikura, H. Shimizu, D. Furukawa, T. Naka-jima, K. Katagiri, and Y. Nakano. Characteristics of ozone jet gener-ated by dielectric-barrier discharge. Plasma Science, IEEE Transactions on,36(4):1328–1329, 2008.
111
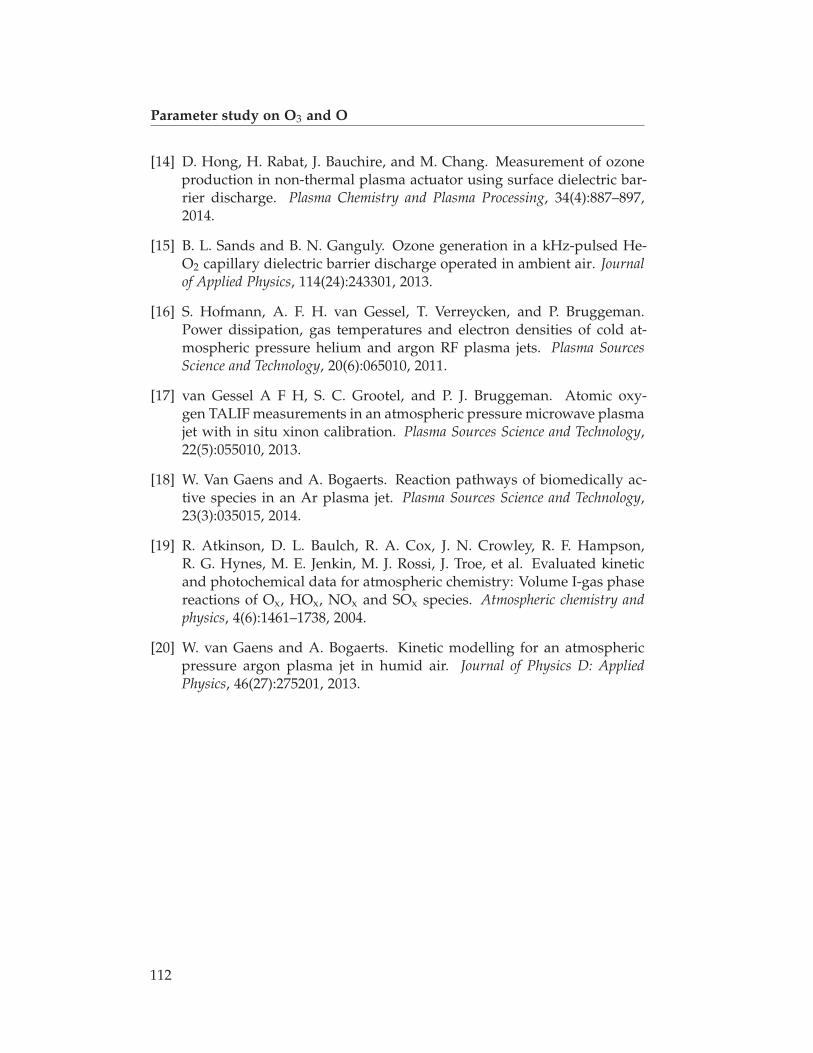
Parameter study on O3 and O
[14] D. Hong, H. Rabat, J. Bauchire, and M. Chang. Measurement of ozoneproduction in non-thermal plasma actuator using surface dielectric bar-rier discharge. Plasma Chemistry and Plasma Processing, 34(4):887–897,2014.
[15] B. L. Sands and B. N. Ganguly. Ozone generation in a kHz-pulsed He-O2 capillary dielectric barrier discharge operated in ambient air. Journalof Applied Physics, 114(24):243301, 2013.
[16] S. Hofmann, A. F. H. van Gessel, T. Verreycken, and P. Bruggeman.Power dissipation, gas temperatures and electron densities of cold at-mospheric pressure helium and argon RF plasma jets. Plasma SourcesScience and Technology, 20(6):065010, 2011.
[17] van Gessel A F H, S. C. Grootel, and P. J. Bruggeman. Atomic oxy-gen TALIF measurements in an atmospheric pressure microwave plasmajet with in situ xinon calibration. Plasma Sources Science and Technology,22(5):055010, 2013.
[18] W. Van Gaens and A. Bogaerts. Reaction pathways of biomedically ac-tive species in an Ar plasma jet. Plasma Sources Science and Technology,23(3):035015, 2014.
[19] R. Atkinson, D. L. Baulch, R. A. Cox, J. N. Crowley, R. F. Hampson,R. G. Hynes, M. E. Jenkin, M. J. Rossi, J. Troe, et al. Evaluated kineticand photochemical data for atmospheric chemistry: Volume I-gas phasereactions of Ox, HOx, NOx and SOx species. Atmospheric chemistry andphysics, 4(6):1461–1738, 2004.
[20] W. van Gaens and A. Bogaerts. Kinetic modelling for an atmosphericpressure argon plasma jet in humid air. Journal of Physics D: AppliedPhysics, 46(27):275201, 2013.
112

CHAPTER 7
Conclusion
Atmospheric plasma pressure plasma jet (APPJ) can operate in open air andproduce a cocktail of reactive species, ions, electric fields, and (UV) photons.Temperature of APPJ is close to room temperature and is safe to touch with-out burns or electric shock. These advantages make APPJ promising forplasma medicine. The goal of this work is to investigate the O2 chemistryand the flow which leads to the transport of reactive species of an RF drivenAPPJ in the context of plasma medicine.
Various diagnostics are used to study the temporally and spatially re-solved ozone and atomic oxygen density combined with the flow pattern.
• UV absorption spectroscopy is used to obtained the ozone density. Asthe absorbance is small on the scale of 10−3, a lock-in amplifier is usedto detect this small signal. This provides very accurate spatially re-solved o3 measurements. The temporal O3 distribution is obtained byUV absorption with correction for variation in the signal by a recordingof a reference signal.
• Two-photon absorption laser induced fluorescence (TALIF) is used toobtain the absolute atomic oxygen density. The calibration is performedwith xenon gas.
• Shadowgraphy is performed to study the flow dynamics. As changein gas density is dependent on refractive index change in flow patternand heating can be observed.
• Additionally, gas temperature is important in the consideration of flowand reactive chemistry. Rayleigh scattering is chosen as the main tech-nique to obtain the gas temperature.
113

Conclusion
For the atmospheric pressure plasma jet, the fed gas is argon mixed witha small portion of oxygen. The plasma jet is RF excited. One typical case isthe gas flow rate is 2 slm argon mixed with 2% oxygen and the dissipatedpower is 6.5 W, modulated by 50 Hz with 50% duty ratio. Another case isthe gas flow rate is 1 slm argon mixed with 2% air and the dissipated poweris 3.5 W, modulated by 20 kHz with the duty ratio 20%. Additionally, theproduction dependence of the ozone and atomic oxygen on various variousoxygen concentration, flow rate, dissipated power are investigated. Resultsand mechanisms obtained are as follows:
• For the first time, absolute ozone density in the core zone (at the quartztube edge in the core of plasma effluent) of an argon RF atmosphericpressure plasma jet are obtained. In the core zone, it is found thatthe ozone density is strongly depleted on the centerline compared tothe O3 density at the edge of the plasma effluent. According to thecorresponding measurement of gas temperature, gas heating up to 700K is found. In the core zone, the ozone is produced by three bodyreaction, the dissociation of ozone by the high density of O (and H)causes this depletion.
• It is found that the maximum ozone density 2×10²¹ m−3 of the atmo-spheric pressure plasma jet is in the far effluent at 13 mm axial position.The maximum ozone density in the far effluent is also verified by themodel and by temporal measurement of ozone. The mechanism is asfollows: the ozone is mainly produced by three body reaction and istransported to the far effluent.
• For the first time, the temporal ozone distribution of a modulated atmo-spheric pressure plasma jet is obtained. It is found in the far effluent at13 mm axial position that the ozone density has a maximum after theplasma is switched on. After the plasma is switched on, a transient vor-tex structure is formed in the core plasma zone. The air mixing due tothe vortex structure is also transient and high energy metastable speciesas N2(A) are produced by electron impact in the core zone which leadsto an increase production of O. In addition, this mixing causes reduc-tion in gas temperature. Both results in an increase in O3 productionrate and decrease in destruction rate. Ozone also has another maxi-mum after the plasma is switched off. Gas temperature decreases afterthe plasma is switched off and the atomic oxygen is converted to ozoneand transported downstream.
• Absolute atomic oxygen density is acquired and the actual radial pro-file of the atomic oxygen density is found, considering the collisionalquenching by diffused air species. This radial profile is significantly
114
Conclusion
broader than the TALIF signal. The radially broader atomic oxygendensity is consistent with the radial ozone density profile. As in radialdirection, the maximum ozone density also locates at the position ofsignificant decrease of O density. Our work for the first time shows theimportant effect of collisional quenching by entrained air species in aplasma jet effluent on the O density measurement by TALIF.
• Temporal resolved flow dynamics of the modulated atmospheric pres-sure plasma jet is obtained along with the temporal evolution of gastemperature. It is found that transient vortex structures of flow areformed not only when the plasma is switched on but also shortly af-ter the plasma is switched off. Transient structure of gas temperature isalso observed both when the plasma is switched on and off. It is shownthat the transient vortex is due to gas velocity difference between themainstream from the quartz tube and the surrounding air. The gas ve-locity difference is resulted from the gas temperature change when theplasma is switched on and (or) off. Our work validates for the first timethat the gas temperature change by Rayleigh scattering quantitatively.
• Flow dynamics for various gas flow rate and various dissipated powerof the modulated plasma jet has also been obtained. It is found thelength of potential core flow decreases when the gas flow rate increases.Also, the length of potential core flow during the plasma on phase isshorter than that during the plasma off phase. Our work verifies thatthe length does not correlate with the Reynold number as often stated.We showed for the first time that the potential flow length is affectedby the gas velocity difference resulting from gas heating. However, thelength of potential core flow is not a linear function of various dissi-pated power. That may imply the ionic plasma effects on flow at highpower. This needs further investigations.
• Absolute ozone and atomic oxygen densities are obtained for variousoxygen concentration (0.5 - 4%), gas flow rate (1.5 - 4 slm), and dis-sipated power (3.0 - 10.0 W). It is found that the maximum O densityand the maximum O3 density all have a small variation in the measuredparameter range. The change of flow rate has a comparatively largereffect on O3 density compared to the change in oxygen concentrationand dissipated plasma power. The conclusion in our work of ozoneproduction and destruction mechanisms although determined for oneexperimental condition are valid in the parameter ranges.
In short, we have studied the physics, plasma chemistry and the fluiddynamics of the effluent of an RF excited atmospheric pressure plasma jet.With different optical diagnostic tools, much information on ozone, atomic
115
Conclusion
oxygen, gas temperature and flow pattern is obtained. Parameter study ofozone is helpful to improve design in practical applications of plasma jet.The research on fluid pattern could give hint to improve simulation workand is an initial step to explain transportation of plasma induced radicals toa substrate in the context of plasma medicine.
116

Acknowledgments
Uitendlijk ben ik hier aangekomen!
It is truly that there are a lot of people to acknowledge when it comeshere. Firstly, I would thank my supervisor prof. Gerrit Kroesen for whathe has done from the beginning to the end of the Phd project. It is a greathonor for me to be accepted by EPG group. I thank him to give me thischance to join the group. He not only offered me a good start of my Phd lifein Netherlands, but also did a lot of work for the end Phd defense, dealingevery document needed for the defense, collecting the feedback from thecommittee member. And I wish him health all the time. Behavlve onderzoekhier in Eindhoven, Ik ook heb genieten van barbecues van hem. Het weer isaltijd gezellig, en het eten is ook heel lekker. Ik houd van penut sauce en dezalm.
Ik heb twee co-promotoren tijdens mijn promovendus studie. I thankthem for what they have done every day for the Phd research. I thank prof.Peter Bruggeman for his supervision. He always guided me to the right direc-tion on the research. The discussion with him is of great help to perform theinvestigation and I can always reach him in his office or by email. I also feelgrateful he even instructed me in the laboratory himself when I encounteredwith problems. His hard working vigor and academic attainments encour-aged me greatly during my Phd life. I also thank dr. Ana Sobota to takecare of Phd life during my last two years study. She always cheered me upwhen I have difficulties with my experiment and helped me to analyze theexperimental problems in laboratory from the shadowgraphy measurementto the temporally resolved ozone measurement. She encouraged me a lotand made me feel confident to overcome problems. Help from her on therevision of my publications is also constructive and strong enough to stopthe generally painful revision process as early as possible.
Thanks for the committee members of my defense to read my thesis and
117

Acknowledgments
give their comments in time. And thank them for joining my defense cere-mony.
I also thank Eddie, Huib, Ab, Evert, Loek for their technical assistancewith experiments. Special thanks to Eddie, with his help on the optics, Ican accomplish this topic of optical diagnostics. Their adept experimentaltechnique saved me a lot of time.
Anita and Rina, ze hebben uitstekende baan voor de hele EPG groepgedaan. Zij hebben elke groep vergadering voorbereiden en natuurlijk koek-jes daarna. Bedankt!
Er zijn ook veel mensen van EPG om te bedanken. Phd means not onlydischarge, plasma, laser, but also consisting of parties, barbecue, football, oreven plasma enhanced beer brewing. Bram, Emile, Arij, Wouter, Roxana,Sven, Tiny, Chris, Lei, Kim, Sara, Manuel, Diana, Job, Jose, Efe, Joost, Ronny,I have joined the defenses of most of you. That gives me enough experiencesto do that work of my own. And I wish you all enjoy your lives no matterwhere you are now. Paulien, Jan, Sander, Ruud, Ferdi, Leroy, Marc, Bart,Tijn, Jesper, Dirk, Luuk, Tafizur, Samaneh, Pieter, a lot of memories are stillon my mind. Football tournament (although I was always the supporter),beer brewing, Christmas activity & dinner party, even borrels (although Idid not join borrels regularly), and of course the barbecue at Gerrit’s houseevery year. I experienced these verhuizen van oud TN gebouw tot Fontys envan Fontys tot het nieuw FLUX gebouw nog een keer. It is fancy to enjoythree different offices during four years. I also feel grateful to spend the lasttime of my Phd in the new building. In the new building, the lunch timeat the long table is funny, and I still remember the Chinese culture courseI introduced, anyway I am trying to tell you a various China. Also, the“funny” Dutch word and also the comm “krom bananen” sentence give a lotof joy, while I forget who is the first one to tell me that. I also thank thenew colleagues from the PMP group to share the mixed group environmentwith me. Florian, Willem, Roy, Yizhi, Henriette, Sjoerd, Srinath, I wish youall great successes in future. My thanks also go to the other colleagues thatonce entered into my life in TN, Fontys, Flux.
Life in Eindhoven becomes more colorful with a lot of friends outsidethese academic environment. Ming, Lei, Xiulei, Shengnan, Zhenghang, Ji-quan, Feng, Jiang, Chong, Franc, Adam, Huang, Zhong, Vignish, Harish,Pengxiang, Tian, Zili, Rui, Shihuan, You, Feixiong, Chenhui, Teng, Fulong,Jiadun, Haijiang, Ji, Fenghua, Miao, Yingying, Zhe, sports with you makemy life full with joy and sweat. I am grateful to meet all of you in my lifeand strive together. Fitness and swimming bring me more than strong body
118

Acknowledgments
and it is a great honor for me to be one of you and stand with you who lovesports. And I wish each of you happiness and success and I strongly believethat would come true for you all.
I would also thank Hui, Yongjie, Zhongxi, Liqiu, they helped me a lotduring my master study and special thanks to Hui, he gave me a lot of helpwhen I applied for the position in TU/e. Also I thank my supervisor prof.Yu Daren for supervising me during my master study in HIT.
Last, I thank my family for supporting me all the time. They have donea lot for me during this long time study and They are always giving theirunconditional love to me and encouraging me all the time and making mebrave. My family always care about me more than themselves, I hope theycould enjoy themselves ever since now. And my wishes go to my nephewsand nieces: Xinying, I wish your marriage all happiness, Yongle, Yonghao,Xinle, Guanhe, Guanya, I hope you all could grow up happy and healthy.
119

120
Curriculum Vitae
Shiqiang Zhang was born on August 13, 1986 in Puyang, China. In 2001, hestarted the high school study in Qingfeng county. Four years later, he was ac-cepted by Honors school of Harbin Institute of Technology and he spent fouryears on studying thermal energy and power machinery. After two years con-tinuous investigation on plasma propulsion in Plasma Propulsion Laboratorysupervised by prof. Yu Daren, he obtained his master degree from HarbinInstitute of Technology. In 2011, he joined the group of Elementary Processesin Gas discharges of Eindhoven University of Technology in Netherland. Un-der the supervision of prof. Gerrit Kroesen and co-supervised by prof. PeterBruggeman and dr. Ana Sobota , he finished his Phd project on low temper-ature plasma, results of which are presented in this dissertation.
121
Curriculum Vitae
Publications
Journal articles
Zhang S., van Gaens W., van Gessel B., Hofmann S., van Veldhuizen E.,Bogaerts A. and Bruggeman P. 2013 Spatially resolved ozone densities andgas temperatures in a time modulated RF driven atmospheric pressure plasmajet : an analysis of the production and destruction mechanisms. Journal ofPhysics D: Applied Physics 46 205202∗
Zhang S., van Gessel A., van Grootel S. and Bruggeman P. 2014 Theeffect of collisional quenching of the O 3p 3PJ state on the determination ofthe spatial distribution of the atomic oxygen density in an APPJ operating inambient air by TALIF. Plasma Sources Science and Technology 23 025012
Zhang S., Sobota A., van Veldhuizen E., Bruggeman P. 2015 Gas flowcharacteristics of a time modulated APPJ: the effect of gas heating on flowdynamics. Journal of Physics D: Applied Physics 48 015203
Iseni S., Zhang S., van Gessel A., Hofmann S., Ham B., Reuter S., Welt-mann K.D., Bruggeman P. 2014 Nitric Oxide density distributions in theeffluent of an RF argon APPJ: effect of gas flow rate and substrate. NewJournal of Physics 16 123011
Zhang S., Sobota A., van Veldhuizen E., Bruggeman P. Temporally re-solved ozone distribution of a time modulated RF atmospheric pressure ar-gon plasma jet: flow, chemical reaction, and transient vortex. submitted toPlasma Sources Science and Technology
Proceedings & Conference Contributions
Zhang S., van Veldhuizen E., Bruggeman P. 2012 Measuring the ozone con-centration in the effluent of an APPJ by UV absorption spectroscopy. Poster: Proceedings of 24th NNV-symposium Plasma Physics & RadiationTechnology, Lunteren, March 6 and 7, 2012
Zhang S., van Gaens W., van Gessel B., Hofmann S., van Veldhuizen E.,Bogaerts A. and Bruggeman P. 2013 Spatially resolved ozone densities andgas temperatures in a time modulated RF driven APPJ. Poster : Presentationat the 7th International Workshop on Microplasmas, Beijing, China, 20-23 May 2013
Zhang S., van Gessel A., van Grootel S. and Bruggeman P. 2013 Theeffect of collisional quenching on the spatial distribution of atomic oxygen in
∗ The article has been selected for inclusion in the exclusive ‘Highlights of 2013’ collectionby Journal of Physics D: Applied physics
122

Curriculum Vitae
an Ar APPJ operating in ambient air by TALIF. Oral : Proceedings of The16th Workshop on the Exploration of Low Temperature Plasma PhysicsConference Centre Rolduc, Kerkrade, November 21-22, 2013
Zhang S., van Veldhuizen E., Bruggeman P., Sobota A. 2014 The forma-tion of a turbulent front in a time modulated argon APPJ. Oral : Presentationat the 67th Gaseous Electronics Conference, Raleigh, North Carolina,November 27, 2014
Zhang S., van Veldhuizen E., Bruggeman P., Sobota A. 2014 The effectof air admixture in the argon flow on ozone absorption in a time modulatedatmospheric pressure plasma jet. Oral : Proceedings of the 1st Workshopfor Young Professionals in Microplasma Research, Bochum, Germany,November 24-26, 2014
123

124

Thank you all!
Life is like a box of chocolates. You never know what you are gonna get.
125