atomic-level characterization of the ensemble of the aβ(1
TRANSCRIPT

doi:10.1016/j.jmb.2010.10.015 J. Mol. Biol. (2011) 405, 570–583
Contents lists available at www.sciencedirect.com
Journal of Molecular Biologyj ourna l homepage: ht tp : / /ees .e lsev ie r.com. jmb
Atomic-Level Characterization of the Ensemble of theAβ(1–42) Monomer in Water Using Unbiased MolecularDynamics Simulations and Spectral Algorithms
Nikolaos G. Sgourakis1,2,3, Myrna Merced-Serrano4,Christos Boutsidis3,5, Petros Drineas3,5, Zheming Du2,3,6,Chunyu Wang2,3,6 and Angel E. Garcia1,2,3⁎1Department of Physics, Applied Physics and Astronomy, Rensselaer Polytechnic Institute, 110 8th Street, Troy,NY 12180, USA2Center for Biotechnology and Interdisciplinary Studies, Rensselaer Polytechnic Institute, 110 8th Street, Troy,NY 12180, USA3Rensselaer Polytechnic Institute, 110 8th Street, Troy, NY 12180, USA4Department of Mathematics, University of Puerto Rico at Humacao, Humacao, PR 007915Department of Computer Science, Rensselaer Polytechnic Institute, 110 8th Street, Troy, NY 12180, USA6Department of Biology, Rensselaer Polytechnic Institute, 110 8th Street, Troy, NY 12180, USA
Received 5 July 2010;received in revised form6 October 2010;accepted 13 October 2010Available online5 November 2010
Edited by D. Case
Keywords:molecular dynamicssimulations;amyloid;peptide;Alzheimer's disease;Aβ monomers
*Corresponding author. E-mail addAbbreviations used: Aβ, amyloid
AD, Alzheimer's disease; P.C.C., Pe
0022-2836/$ - see front matter © 2010 P
Aβ(1–42) is the highly pathologic isoform of amyloid-β, the peptideconstituent of fibrils and neurotoxic oligomers involved in Alzheimer'sdisease. Recent studies on the structural features of Aβ in water havesuggested that the system can be described as an ensemble of distinctconformational species in fast exchange. Here, we use replica exchangemolecular dynamics (REMD) simulations to characterize the conformationsaccessible to Aβ42 in explicit water solvent, under the ff99SB force field.Monitoring the correlation between J-coupling(3JHNHα) and residual dipolarcoupling (RDC) data calculated from the REMD trajectories to theirexperimental values, as determined by NMR, indicates that the simulationsconverge towards sampling an ensemble that is representative of theexperimental data after 60 ns/replica of simulation time. We furthervalidate the converged MD-derived ensemble through direct comparisonwith 3JHNHα and RDC experimental data. Our analysis indicates that theff99SB-derived REMD ensemble can reproduce the experimental J-couplingvalues with high accuracy and further provide good agreement with theRDC data. Our results indicate that the peptide is sampling a highly diverserange of conformations: by implementing statistical learning techniques(Laplacian eigenmaps, spectral clustering, and Laplacian scores), we areable to obtain an otherwise hidden structure in the complex conformationalspace of the peptide. Using these methods, we characterize the peptideconformations and extract their intrinsic characteristics, identify a smallnumber of different conformations that characterize the whole ensemble,and identify a small number of protein interactions (such as contactsbetween the peptide termini) that are the most discriminative of thedifferent conformations and thus can be used in designing experimental
ress: [email protected]β; REMD, replica exchange molecular dynamics; RDC, residual dipolar coupling;arson's correlation coefficient.
ublished by Elsevier Ltd.
571Aβ(1–42) Conformations in Water
probes of transitions between such molecular states. This is a study of animportant intrinsically disordered peptide system that provides an atomic-level description of structural features and interactions that are relevantduring the early stages of the oligomerization and fibril nucleationpathways.
© 2010 Published by Elsevier Ltd.
Introduction
The amyloid-β (Aβ) peptides are the majorconstituents of amyloid plaques, the pathologicalhallmark of Alzheimer's disease (AD) and neurode-generation in general.1 Aggregation of Aβ leads tovarious β-sheet-rich conformers that are found inthe brains of AD patients and correlate with theonset of AD.2 Moreover, Aβ oligomerization leadsto the formation of soluble, neurotoxic oligomericspecies that impair synapse transmission andeventually memory function.3,4 Both the amyloido-genic and oligomeric pathways originate in the cellmembrane: the different-length isoforms of Aβ arederived from the proteolytic processing of atransmembrane protein, the amyloid precursorprotein. Variability in the exact site of amyloidprecursor protein cleavage leads to the productionof Aβ isoforms of different lengths (ranging from 39to 42 residues), of which Aβ42 is a major isoformand has a high potential to elicit amyloidogenesisand toxicity.Despite significant advances in the structure
determination of Aβ f ibri ls 5 ,6 and theirpolymorphisms7 in atomic detail, few studies havebeen performed to characterize the ensemble of thefull-length Aβ(1–42) peptide at the monomeric levelin water. An NMR-derived model of the averagestructure of the 26mer Aβ(10–35) in water hasrevealed a collapsed coil with little presence ofregular secondary structural elements.8 However,several experimental and computational studiesfocusing on different fragments of Aβ and itsmutants9,10 have indicated a highly dynamic,rugged energy landscape that is consistent with anensemble of rapidly interconverting, isoenergetic (toa first approximation) conformational species in fastexchange.11,12 Previous experimental results havesuggested that the peptide displays structuralfeatures that deviate significantly from the ran-dom-coil model indicated by local conformationalpreferences of the backbone.13–15 In a previousstudy, we used MD simulations validated byexperimental NMR data to elucidate the conforma-tions accessible to both in vivo isoforms of Aβ, A40and 42.16 Our MD-derived molecular ensemblesuggested that both peptides displayed uniquestructural features that were consistent with theexperimentally measured J-coupling data. More-over, the mechanism of aggregation and the
energetics of the transitions between monomers,oligomers, and fibrils are yet to be characterized inatomic detail. Recent efforts to characterize thestructure of important intermediates along theaggregation pathway including neurotoxic oligo-meric species have resulted in the solution structureof a soluble Aβ oligomer by NMR.17 To this extent, adetailed view of the solution conformation of Aβ atthe monomer level and their dynamics is importanttowards modeling the aggregation pathways, aswell as in rationally designing therapeutics thatwould selectively stabilize non-amyloidogenicconformations18,19 and inhibit oligomers and fibrilformation.20
Here, we present a detailed characterization of theensemble of Aβ42 that is obtained by all-atommolecular dynamics simulations in explicit solvent.We implement the same enhanced-sampling proto-cols used previously16 that were extended to themicrosecond simulation timescale and used a recentlyimproved force field21 derived from the AMBERseries of molecular mechanics force fields.22 Oursimulation data are validated by direct comparisonwith three-bond J-coupling constants and residualdipolar couplings (RDCs), as measured experimen-tally by NMR for the backbone NH groups. Theseexperimental observables, through their intrinsicdependence on the average backbone conformationand orientation relative to a molecular alignmentframe, respectively, provide a sensitive probe ofmolecular structure and have been recently used tomodel the conformations of unfolded, intrinsicallydisordered and chemically denatured proteins usingbiased ensemble-based approaches.23–25 In addition,RDCs have been previously measured for both majorisoforms of Aβ and interpreted on the basis ofstatistical coil models.26,27 Analysis of our unbiasedreplica exchange molecular dynamics (REMD) struc-tural ensemble reveals the presence of distinctconformational species,whichwe identify and furtheranalyze to obtain a small number of representativeconformations. Our results indicate the presence of ahighly diverse conformational ensemble that can beanalyzed in terms of correlated patterns of interactingresidues to yield conformational species of distinctstructural features. To analyze the structural proper-ties of the ensemble, we port nontrivial techniquesfrom statistical learning. More specifically, we areusing the Laplacian eigenmaps approach28 to visual-ize the conformations in a low-dimensional space,

0.2 0.3 0.4 0.5 0.6 0.7 0.8
P.C
.C.
RDC
0 0.1 0.2 0.3 0.4 0.5 0.6 0.7 0.8
50 100 150 200
P.C
.C.
time (ns/replica)
3JHNHα
572 Aβ(1–42) Conformations in Water
while the spectral clustering technique29 is used toefficiently extract conformations that are representa-tive of the ensemble. Finally, using Laplacian scores,30
we identify interactions (such as contacts between thepeptide termini) that are highly effective in distin-guishing between distinct conformational basins andcan be thus used to design experimental labels thatreport on the transitions between these conforma-tional species. This study augments on the existingknowledge of the conformations accessible to Aβ(1–42) monomers in water and further indicates astrategy to effectively identify key structural featuresand classify diverse ensembles of such conformationsfrom MD simulation data for metastable and intrin-sically disordered systems in general.
0 0.1
50 100 150 200
time (ns/replica)
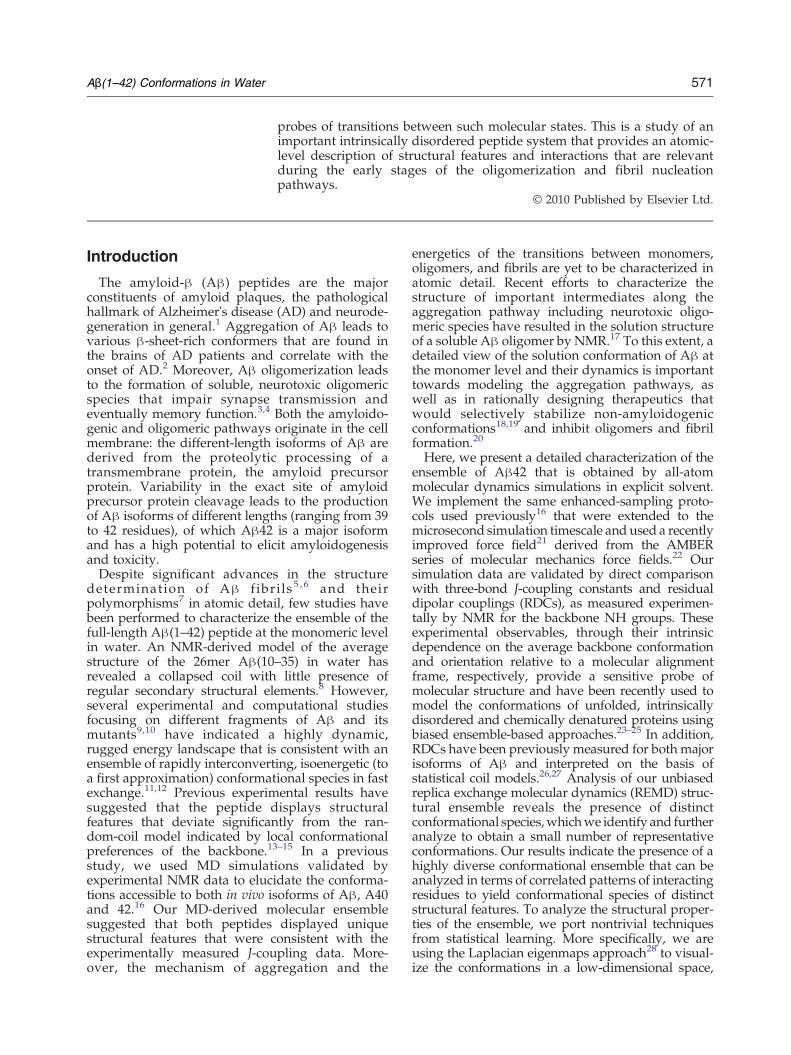
Fig. 1. Simulation convergence through comparisonwith experimental data. Correlation between J-couplingsand RDCs calculated from the MD ensemble with theirexperimentally determined values. Monitoring the P.C.C.to the experimental data as a function of the totalsimulation time indicates that the ensemble is convergedafter approximately 60 ns/replica. The broken lineindicates the start of the production phase of thesimulation, during which the calculated J-coupling andRDC values are converged to their ensemble-averagedvalues, as dictated by the details of the force field andsolvation model used.
Results
Convergence of the REMD simulations
We have estimated the time it takes for thesimulations to converge, according to the selectedobservables by monitoring the agreement of resultscalculated from our MD simulations to theirexperimentally determined values. To perform thistask, in addition to (3JHNHα J-couplings, we havemonitored the correlation of RDCs to the experi-mental results.27 The two observables give verysimilar results (Fig. 1a and b). We observe a firstphase in the simulations (0–60 ns/replica) where thecorrelation to experiments changes rapidly afterwhich the simulations converge to showing onlylarger timescale fluctuations that are more pro-nounced for the RDCs. After roughly 60 ns/replica,the two observables reach Pearson's correlationcoefficients (P.C.C.'s) of approximately 0.4–0.5(Fig. 1). These values are strikingly similar to theones obtained previously16 for the same systemusing the OPLS/AA force field31 and TIP3p watermodel32 (60 ns/replica and P.C.C. of 0.48 accordingto (3JHNHα), indicating the robustness of the replicaexchange algorithm for this intrinsically disorderedsystem. The differences in calculated J-coupling andRDC values among three samples of equal lengthobtained from the production phase of our simula-tion trajectory (60–225 ns/replica) are less than 10%in magnitude, indicating that the simulation isindeed well converged to sampling an ensemblethat is representative of the ff99SB force field afterthis first equilibration phase.
Validation with experimental results
We have examined the use of different parametersets for the Karplus equation in calculating J-coupling constants from the simulation coordinatesfor comparison with their experimental measure-
ments, as described in Methods.33,34 In general, weobserve a correlation between the experimental andsimulation data set that is comparable to thecorrelation between the two experimental datasets, as indicated by RMSD values below 1 Hz(0.32 Hz versus 0.73 Hz) (Fig. 2). This agreementwith the experimental J-coupling data is comparableto results recently obtained using the same forcefield for stable protein folds.36 Nevertheless, we alsoobserve several outliers for which the calculatedvalues are not in agreement with the experimentalresults. In particular, for residues Glu22, Asp23, andHis13, the calculated values differ by more than1 Hz from both experimental data sets. For singleconformations, this may amount to differences inthe φ dihedral angle as small as 5–7°, or as large as74° for selected values of (3JHNHα, by virtue of the factthat the Karplus equation is not a 1-to-1 function ofφ. Analysis of the values of φ for these three residuesin our simulation data set indicates that all threeallowed basins of the Ramachandran plot are beingsampled in our REMD trajectories, with differentpopulation weights that are given by the relativefree energies under the current force field (Fig. S2).Therefore, the discrepancy with the experimentalresults could be attributed to incorrect weighting ofthe different basins. All three of these outlier

5
5.5
6
6.5
7
7.5
8
8.5
5 5.5 6 6.5 7 7.5 8 8.5
3J H
NH
α (H
z)
3JHNHα (Hz)
His 13
Glu 22
Asp 23
RMSD 0.32HzRMSD 0.73Hz
0
1
2
3
4
5
6
7
0 1 2 3 4 5
RD
C M
D (
Hz)
RDC exp (Hz)
Phe 20
Ala 42Val 36
RMSD 1.49Hz
5
6
7
8
9
10
5 10 15 20 25 30 35 40
3J H
NH
α (H
z)
residue
exp 1exp 2
MD
0
1
2
3
4
5
6
7
8
5 10 15 20 25 30 35 40
RD
C (
Hz)
residue
(a)
(b)
(c)
(d)
expMD
Fig. 2. Validation with experimental data. Thirty-two experimental three-bond J-coupling values and 22 RDCs thatreport on the average conformation of the backbone and orientation of the amide bond vectors in the molecular alignmentframe, respectively, are compared with results calculated from our REMD simulation trajectories. Two independentexperimental measurements of (3JHNHα were used.16,27 Results are shown in (a) and (c) along the sequence of Aβ and ascorrelation plots in (b) and (d). Experimental J-coupling and RDC values were measured at 300 K and 277.3 K,respectively, while simulation values were calculated over the range of replica temperatures 280–310 K. Simulation errorswere estimated using block averages.35
573Aβ(1–42) Conformations in Water
residues are charged at neutral pH modeled in thissimulation study. This finding suggests a potentialstrategy for improvement of the ff99sb force fieldthat takes into account the interplay between thebackbone dihedrals and charged sites.We further validated our converged MD data set
(according to the J-coupling convergence shown inFig. 1b) by comparison of calculated RDCs withpreviously published experimental data.27 RDCsreport on the alignment of the amide bond vectorsrelative to a conformation-specific molecular align-ment frame that was calculated based on the stericproperties of each conformation using the methodPALES.37 The comparison between the experimen-tal and calculated RDCs is shown in Fig. 2c and d. Ingeneral, good agreement between the two data setsis obtained (RMSD, 1.49 Hz), which is reflected in aP.C.C. of 0.30 to the experimental data. We observethree outliers for which the disagreement withexperimental data is larger than twice the sum ofthe experimental and simulation errors. These areresidues Phe20, Val36, and Ala42. In contrast, for theremaining 19 residues of Aβ42 for which accurate
experimental values were available, the agreementwith the experimental data is significantly better,reaching a P.C.C. of 0.57. As the calculated RDCsreport both on the alignment properties of themolecule and on the orientation of individualamide bond vectors, the fact that the disagreementwith the experimental data is limited to residues 20,36, and 42 indicates that the force field and solvationmodel used are likely sampling the correct shapedistribution of Aβ42, and the inconsistencies are dueto local deviations in the backbone torsion angles.
Identification and characterization ofrepresentative conformational species
We have implemented a spectral clusteringapproach to characterize the conformations sampledin the REMD ensemble (summarized in Fig. 6). Inthe case of the intrinsically disordered Aβ peptide,which samples a diverse range of conformations,common clustering strategies that rely on thecalculation of geometrical distances such as RMSDare limited by the drastic change in the shape of the

Fig. 3. Spectral clustering of the conformational ensemble and identification of representative conformational species.(a) Visualization of the REMD ensemble of conformations in a space defined by the last three nontrivial eigenvectors of theaffinity matrix. Good dispersion of the data in this low-dimensional space is observed. Each region of the space containsconformations with distinct contact patterns, as shown in the structural diagrams belonging to individual conformations.(b) Example of the use of the k-means spectral clustering algorithm for k=20, operating in the space defined by the last sixnontrivial eigenvectors of the affinity matrix (see Methods). The clustering results are visualized in three dimensionscorresponding to the last three nontrivial eigenvectors, same as in (a). Using this technique, we have identified severalclusters of conformations that share common structural elements as discrete groups in the low-dimensional eigenspace.Representative (central) conformations for selected clusters are shown in the insets and discussed in the main text. Theseresults suggest that Aβ42 can sample a wide range of conformations with distinct features that can be analyzed using arelatively small set of collective variables.
574 Aβ(1–42) Conformations in Water
molecule across the conformational space that isaccessible. In summary, this approach is based onthe representation of each protein conformation as a
contact map (Fig. 6a). This representation is thenused in the calculation of a square affinity matrix A,whose elements are defined for each pair of

Fig. 4. Structural precision in the clustering results. Overlay of all conformations within a single identified clusteraccording to the spectral clustering technique implemented here. Despite the high degree of structural heterogeneity inthe REMD ensemble, the contact-map-based approach chosen here successfully identifies clusters of conformations withsimilar features. The central conformation of this cluster is shown in a cartoon representation, while the trace of thebackbone is shown for every other member of the cluster. A high degree of structural similarity among conformationswithin the same cluster is observed, as indicated by an average pairwise RMSD of 1.33 Å for the protein backbone amongcluster members.
575Aβ(1–42) Conformations in Water
conformations according to a distance kernel. Thespectral clustering technique involves the diagonal-ization of this matrix to obtain singular values ofhigh discriminative power in distinguishing be-tween different points using a small number oflinearly independent dimensions (Fig. 6b). Thisinformation is encoded within a small number ofthe lowest nontrivial eigenvectors and can be usedto cluster the ensemble into groups of conformationsthat share common contact map patterns. A directvisualization of the REMD conformational ensemblein the space defined by the three lowest nontrivialeigenvectors is shown in Fig. 3a. We observe gooddispersion of the REMD data in the three eigenvec-tors. In general, we observe a high degree ofstructural similarity for conformations that arenear and different overall structural features forconformations belonging to different regions of thespace (Fig. 3), which indicates the high discrimina-tive power of this technique. Consequently, con-formations belonging to the spatially distinctclusters display common structural features, asexemplified in Fig. 4. Furthermore, we observefrequent transitions between the clusters throughoutthe REMD trajectories (Fig. S3), which furthersupports the conclusion that we are sampling astructurally converged ensemble of conformations,
as previously indicated by the convergence of theensemble-averaged J-coupling and RDC data shownin Fig. 1.The identified representative conformations illus-
trate a diversity of local structural features includingregions with elements of regular secondary struc-ture that were assigned using the DSSP algorithm.38
In particular, we frequently observe the formation ofβ-sheets involving interactions of the C-terminuswith other parts of the sequence, as shown in Fig. 5.In a conformationally distinct cluster, we observethe formation of a β-sheet involving strands atresidues 4–6 and 38–40 (sequence GVV), as well asan α-helix at the sequence 8SGYE12V (Fig. 5a).Alternatively, the stand at residues 38–40 can form aβ-hairpin involving residues 33–35, as seen inanother representative conformation (Fig. 5b) or asheet with residues 18–20, as seen in a separateclosely clustered group of conformations (Fig. 5c).This indicates that the region 38–40 may act as aconformational switch, whose interactions withvarious parts of the sequence dictate the conforma-tional state of the peptide. A similar conformationfor the C-terminus has been previously reported inresults using the OPLS/AA force field,31 where itwas found to form a β-sheet with residues 31–34. Ina separate closely clustered group of conformations,

Fig. 5. Conformations of Aβ in water. Representative conformations of Aβ42 from the REMD ensemble as identifiedusing the spectral clustering technique. A diverse mixture of extended as well as collapsed coil conformations withsecondary structural elements is observed.
576 Aβ(1–42) Conformations in Water
we observe the formation of a β-hairpin involvingshort strands at residues 3EF5R and 10YE12Vtowards the N-terminus of the sequence (Fig. 5d).In addition, a short α-helix spanning residues 20–23 can be seen. In the same cluster, a hydrogenbond of Arg5 with Ser26 is also observed. In aconformationally distinct cluster, we observe theformation of a 310 helix at the sequence 29GAII33G(Fig. 5e). This region has a high potential to form a310 helix, as also observed in other clusters (Fig.5c). Finally, in a separate cluster that represents alarge part of the population, the conformation ofthe peptide resembles a coiled coil (Fig. 5f). A brief310 helix is observed at residues 21–24. Thepresence of turn-like structures at residues Y10,F19, and F20, as observed in some of the clusters,is corroborated by the analysis of RDC measure-ments in stretched polyacrylamide gels previouslyreported by Lim et al.26
Identification of interactions with highdiscriminative power
We have further explored the use of differentinteractions in Aβ to discriminate among distinctconformations in the ensemble. For this purpose, wehave implemented the Laplacian scores technique.30
This technique can be used to extract features thatare optimal in describing the local structure of pointsin a data set. In our case, the features correspond toresidue contacts derived from the contact maprepresentation of the REMD conformations de-scribed previously. An inspection of the 2D Lapla-cian score map relative to the raw probabilities ofcontact formation for different pairs of residues inAβ indicates these regions of high discriminativepower (Fig. 7). These interactions are formedbetween the N-terminal residues 2–5 and residues24–26 or residues 34–40 and between residues 25–28and residues 36–40. All three regions have arelatively small probability of contact formation inthe ensemble and would not be identified on thebasis of the contact probabilities alone. However, theLaplacian score analysis suggests interesting fea-tures. One such region is for contacts between theN- and C-termini of the peptide (shown in theupper left part of Fig. 6). These regions have beenobserved to interact through a β-sheet in one ofthe representative conformations in the ensemble(Fig. 3) involving a strand at residues 38–40.Therefore, the Laplacian score in this case can beattributed to the formation of this long-rangestructure. In addition, high Laplacian scores areobtained for interactions between the C-terminus

Fig. 6. Flow diagram of the spectral clustering method. In (a), a diverse ensemble of conformations obtained fromenhanced-sampling molecular dynamics is encoded as a binary distance matrix (contact matrix) where each columnrepresents the state of a residue contact (i,j) defined according to a distance threshold of 4.5 Å between any pair of heavyatoms belonging to residues i and j. In (b), the original MD data set in the contact matrix representation is used to calculatea square affinity matrix, whose elements are given by e−Dij, whereDij is the distance between conformations with indices iand j according to a chosen distance kernel. The singular value decomposition of the affinity matrix yields eigenvectors ofhigh discriminative power. In particular, the m lowest nontrivial eigenvectors (where m ‘N) can be used as explicitcoordinates to separate the MD ensemble into k clusters using the k-means clustering algorithm.
577Aβ(1–42) Conformations in Water
(residues 36–40) with residues 23–28, which havealso been found to form β-sheets as well as α-helices in different conformations in the ensemble.This result is consistent with the picture obtainedfrom the analysis of representative conformations,where the β-strand at positions 38–40 was foundto interact with several alternative partners, thusindicating the high discriminative power of thisregion to distinguish between different clusterconformations. Finally, for interactions betweenresidues 2–5 and residues 24–27, we identifyanother region of contacts with high discriminativepower, which again highlights the importance oflong-range interactions in shaping the energylandscape of Aβ. Therefore, monitoring the stateof these key contacts would be highly informativefor the overall conformation of the peptide.
Discussion
We have performed REMD simulations using theff99SB force field21 for the full-length Aβ(1–42)monomer, which constitutes a characteristic intrinsi-cally disordered peptide system. Previous studies
have indicated themerits21,39–43 and limitations36,44 ofusing this force field to obtain realistic ensembles ofshort peptides and proteins, relative to a variety ofNMR data that report on both the average structuralproperties and dynamics of biomolecules. In tworecently published studies, Wickstrom et al. haveshown that this force field, when used in combinationwith the TIP4P-Ew explicit solvation model,45 canreproduce experimental backbone J-couplings withreasonable accuracy for short alanine polypeptides43
and the chemically denatured state of the vilinheadpiece.46 Notably, using this combination offorce field and solvation model, Fawzi et al. per-formed multiple microcanonical simulations for asmaller fragment of Aβ(21–30) that reproduced bothJ-coupling constants and rotating-frame Overhausereffects and 13C relaxation rates measured by NMR.41
Day et al. studied the unbiased folding/unfoldingthermodynamics of the trp-cage miniprotein andfound that the ff99SB force field produced foldedensembles with distributions centered at 0.6 Å RMSDfrom the NMR structure and a folding temperaturethat is comparable to the one that is determinedexperimentally for this system.39 However, Lindorff-Larsen et al. observed significant deviations in the

578 Aβ(1–42) Conformations in Water
distributions of side-chain rotameric states in exten-sive ff99SB simulations, relative to statistics obtainedfrom the Protein Data Bank that influence thecalculation of accurate J-coupling values in proteins.36
Taken together, these results indicate the major areasof improvement towards the next generation ofAMBER force fields.Here, we confirm these findings and further
explore the generality of MD results obtainedusing ff99SB under extensive sampling conditionsfor an intrinsically disordered peptide. We haveobtained a converged ensemble, from the point ofview of correlation to experimental J-coupling andRDC values, after 60 ns/replica. The convergence ofthis ensemble at the structural level is furtherconfirmed by the observed global sampling of theaccessible conformational space according to thetime history of the assigned clusters (Fig. S3).Validation with both J-couplings and RDCs indi-cates good agreement with experiments for mostsites for which experimental data were available,which is manifested in P.C.C. in the range of 0.4–0.5for both observables. In a previous study for thesame peptide system using a variety of force fields,we have found that the best-performing force field,OPLS/AA,31 reached a P.C.C. of 0.48 to the sameexperimental J-coupling data set,16 indicating asmall improvement for the ff99SB force field,which is within the simulation error. Moreover, weobserve similar convergence times (∼60 ns/replica)for the replica exchange algorithm for both forcefields, which suggests that the simulation timeneeded to obtain realistic ensembles of intrinsicallydisordered peptides is in this range, which is apromising result given the combinatorial explosionof the conformational space that is accessible tosystems of size comparable to Aβ42 and is of greatmedical and biological importance. Finally, thereported correlation to the experimental data is, inmost cases, comparable if not higher to the oneobtained using microsecond timescale simulationsof stable-folded proteins using a recently proposedimprovement of the ff99SB force field used here.36
We demonstrate the high discriminative power ofthe spectral clustering method used here in identi-fying representative conformations towards a de-tailed characterization of the highly diverseensemble of Aβ42. To date, several dimensionalityreduction techniques have been employed to studybiomolecular dynamics from MD simulation data,for the purposes of clustering, the identification ofrepresentative conformations, or transitions be-tween distinct conformational states.47–50 The spec-tral clustering technique implemented here,although previously applied for the clustering ofprotein sequences,51 has not been previously used toaddress the problem of classifying conformationalensembles from MD simulation data. In this study,we show that this technique is highly efficient in
deriving families of conformations that share dis-tinct intramolecular interaction patterns, as shownin Figs. 3–5. Analysis of our simulation data usingthis method suggests that Aβ42 samples a highlydiverse conformational ensemble that can be ana-lyzed on the basis of a relatively small number ofcollective variables that report on medium- to long-range intramolecular interactions. A similar ap-proach has been recently used by our group usingMD simulation data to identify and characterizedistinct intermolecular orientations in the rhodop-sin/transducin complex.52 Without loss of general-ity, this approach can be implemented for thevisualization and clustering of conformationsobtained via other computational and experimentalmethods such as results from ab initio protein foldingcalculations and protein structure calculations.When compared with commonly employed clus-
tering algorithms53 that are based on the RMSDkernel,54 our method offers some attractive features.The main drawback of RMSD-based clusteringmethods is that conformations that are far apart inRMSD space will be classified in different clustersregardless of their contact map similarity. In systemswith conformational flexibility, this may result in avery large number of clusters that are hard tointerpret manually. Our method overcomes thisproblem by looking for structures that may be farapart in RMSD but share common interactions.Furthermore, results using hierarchical RMSD-based algorithms in particular are highly dependenton the choice of the RMSD cutoff used in theclustering, a parameter that needs to be optimized inorder to obtain meaningful results (see procedure inRef. 16). We have repeated the clustering using theDaura algorithm55 on our data set of 11,570 Aβconformations using a 0.2-nm cutoff for the defini-tion of neighbor lists (same parameters as in Ref. 55).In general, we obtain several small clusters (2170),the majority of which have very small sizes. The sixlargest clusters have populations in the range 2–6%.Looking at the central conformations of the clusters,we see a diverse group of structures, as expected.The conformations of the largest cluster are verysimilar to those obtained using our method incluster 6 (Fig. 4). This confirms that structures thatare close in RMSD space can also be close in thespace defined by the contact map definition.However, the opposite is not necessarily true.Finally, we made use of Laplacian scores30 to
identify pairwise residue interactions that can beused to discriminate between different conformation-al species, thus opening the possibility of designingexperimental labels to study transitions among suchconformations. The identified contacts, although notobserved in the REMD ensemble with high probabil-ity, show significant differences (on average) betweendifferent families of conformations (Fig. 7). Thisanalysis indicates that the short β-strand at residues

Fig. 7. Identification of discrimi-native contacts using Laplacianscores. The raw probabilities ofcontact formation between allpairs of residues i,j in Aβ42 accord-ing to a 4.5-Å distance threshold(lower right quadrant) are con-trasted to the extracted Laplacianscores for the same residue pair(upper left quadrant). According tothis analysis, we identify severalcontacts of high power in discrim-inating between different confor-mational species that are notapparent from a simple inspectionof the ensemble-derived statistics ofcontact formation, as discussed inthe text. This information can beused to design experimental probesto investigate transitions betweendifferent conformations.
579Aβ(1–42) Conformations in Water
38–40 may act as a conformational switch whosealternative interactions with other strands along thesequence of Aβ determine the conformational state ofthe peptide. To this extent, the REMD ensemble canprovide valuable predictions to experimentaliststowards the study of transitions between differentconformations with distinct aggregation and oligo-merization properties. If experimentally verified, thisinformation is valuable in designing strategies toblock transitions that lead to pathogenic conforma-tions, thus suggesting a novel approach in ADtreatment at the molecular level.
Methods
REMD simulations
Molecular dynamics simulations were performed usingthe REMD algorithm. The REMD is a generalizedensemble method56,57 that involves several identicalcopies of the system, or replicas, that are simulated inparallel over a range of temperatures. At frequentintervals, trials to exchange the temperature of all adjacentreplicas are performed, according to a Metropolis MonteCarlo criterion. To optimize the temperature spacing ofthe replicas, we performed 16 pilot constant temperature(and volume) simulations for 3 ns each, spanning differenttemperatures in the range 250–600 K. The histograms ofpotential energy obtained from these short trajectorieswere then used to define the temperatures of the replicas,such that the average exchange ratio is constant through-out the temperature space and equal to 15%, according to
the algorithm described previously.58 The range oftemperatures used in the final REMD simulations wasfrom 270.0 to 601.2 K. A total of 52 replicas were used tooptimally span the temperature space. Exchange moves intemperature were attempted every 4 ps between alladjacent replicas in temperature space. A detailedstructural analysis was performed only on conformationssampled by all replicas at seven temperatures in the range289–311 K. For all calculations, we used the FF99SB forcefield21 in combinations with the TIP4P-Ew water model.45
Previous calculations focusing on Aβ(10–35) by Fawzi etal. have shown that this combination of force field andwater model produces an ensemble of configurations thatis in good agreement with NMR data.41
To build the peptide system, we started from acompletely extended conformation of the full-lengthAβ(1–42) peptide with sequence:
1D AEFRHDSG10YEVHHQKLVF20FAEDVGSNKG30
AIIGLMVGGV40VIA
The following procedure was used to construct thesystem: First, we run a 1-ns MD simulation of the peptidein vacuo, at high temperature (~700 K), starting from acompletely extended conformation, followed by an energyminimization of the system. The collapsed peptide wasthen solvated in a cubic box, whose dimensions wereadjusted to accommodate 4947 water molecules (totalsystem size, 20,415 interaction sites). We chose a systemsize that reduces short-range interactions between peri-odic images of the peptide and is computationallytractable. The solvated system was then equilibrated atconstant temperature (300 K) and pressure (1 atm) for 1 nswith a short integration time step of 1 fs. This resulted in acubic simulation box of side length 53 Å in eachdimension. Finally, REMD simulations at constant volume

580 Aβ(1–42) Conformations in Water
were run for 225 ns/replica in total (aggregate simulationtime of 11.7 μs). At this stage, the application of theLINCS59 and SETTLE35 algorithms to constrain the bondlengths in the peptides and water molecules, respectively,allowed a relatively large integration step of 2 fs. We useda cutoff of 10 Å for the evaluation of Lenard–Jonesinteractions, while pair lists were updated every 10integration steps. We used the particle mesh Ewaldmethod60 with a 52 Å×52 Å×52 Å cubic grid to evaluatelong-range electrostatics. Charge neutrality of the systemis implicitly treated by the used of the Ewald method forthe computation of long-range electrostatics. This isclosely mimicking the NMR experimental conditions,where the sample salt concentration was kept minimal(20 mM potassium phosphate buffer with no other salt).27
Ions, especially ones of the cationic series, have beenshown to play important roles in the aggregation and fibrilmorphology of Aβ;61,62 however, this is a condition thatwas not explored in the current study.The system was coupled to a Nose–Hoover63 heat bath
to maintain a constant temperature between exchanges.All simulations were performed at 204 CPUs of Linux-based clusters at Rensselaer, with the use of theGROMACS64 simulation machine under a variety ofdomain decomposition schemes.
Comparison with experimental data
Avariety of experimental datawereused for thepurposesof (a) assessment of simulation convergence and (b)validation of the MD-derived conformational ensemble. Ina manner similar to the approach used previously,16 wehave monitored the correlation with experimental three-bond J-couplings as an indicator of convergence and as ameasure of validity. The correlation between two data setsX,Y is quantified in terms of the P.C.C.:
P:C:C: =Cov X;Yð Þr2 Xð Þ4r2 Yð Þ
where Cov(X,Y) is the covariance of the two variables andσ2(X),σ2(Y) are the corresponding standard deviations. Inorder to assess the reproducibility of the J-coupling data, weused two independent data sets of measured (3JHNHα data tocompare with simulations, the first published in a previousstudy by our group,16 while the second was collected underidentical sample conditions and the experimental protocolsdescribed by Yan et al.27 The two measurements of J-coupling constantswere very similar formost residues (P.C.C. of 0.92), with the exception of Glu11, which was found todiffer significantly between the two experimental data sets.In total, 21 experimental (3JHNHα values were used, of which17 were redundant between the two data sets. We used theKarplus equation to predict J-coupling constants from ourMD coordinates:65
J = a cos2 uð Þ + b cos uð Þ + b
where a, b, and c are semi-empirically derived coefficientsandθ=ϕ−60,whereϕ is thepeptide dihedral angle. Theuseof various published data sets of Karplus coefficients wasexplored. We used coefficients previously determined byfitting to X-ray structures,34 as well as a modified data setthat accounts for dynamics within a single harmonic well.33
Finally, motional averaging effects within our MD data set
were explicitly taken into account by fitting the Karpluscoefficients to the experimental data for Aβ. This resulted ina set of coefficients that optimally describes our data and iswithin previously published values, as reported by Brusch-weiler and Case.33 The fitted values were determined to bea=7.7, b=−1.9, and c=0.06, introducing a marginal changeto a and b and a significant decrease in c relative topreviously published values (reviewed in Ref. 33). With theuse of this set of fitted parameters, the RMSD from theexperimental data was reduced to 0.73 Hz from 1.46 Hz, forJ-couplings calculated using the coefficients published byVuister and Bax.34 When the corrected coefficients wereused,33 the RMSDwas 0.96 Hz (Fig. S1). For all calculations,we used the final 165 ns/replica of our simulationtrajectories, sampled every 100 ps. The MD data set wassplit into three samples of 3857 conformations each, whichwere used to estimate the error in the calculated values.In addition, we used RDCs measured in 10% polyacryl-
amide gels as an additional, independent measure of thevalidity of our simulations. Experimental RDCs wereobtained from a previously published study for 30 amidesin Aβ(1–42) under partial alignment conditions at273.3 K.27 From this data set, we extracted 22 RDCs forwhich the experimental error was less than 33%. Themethod PALES37,66 was used for the calculation of RDCvalues from the MD data. In summary, for eachconformation in our MD ensemble, the program calculatesan alignment orientation due to steric properties of themolecule, which is subsequently used to calculate RDCvalues. This is done by diagonalization of the moment ofinertia tensor. Finally, ensemble-averaged RDCs arecomputed according to the equation:
Dij =−A0gigjh
2p
�3 cos2 qij − 1
2r3
�
= Dmax
Xk;l
�sklr3
cos ukij cos ulij
�
where μ0 is the permeability of empty space, γi,γj are thegyromagnetic ratios of the i and j nuclei, h is Planck'sconstant, r3 is the length of the internuclear vector, and ϑijis the angle between the internuclear vector and theexternal magnetic field. Expressed in the molecular frame,all constants are absorbed in Dmax, which is the maximumpossible value of the RDC for a particular nuclei pair, skl isa component of order tensor describing the alignment ofthe protein in the laboratory frame, and cosij
k and cosijl are
the orientation cosines of the internuclear bond vector inthe molecular alignment frame. Ensemble-averaged RDCvalues were uniformly scaled to minimize the RMSD fromthe experimental data, due to the fact that the alignmenttensor magnitude depends on the fraction of moleculesthat are in the aligned state that depends on theexperimental conditions.
A contact-map-based representation of theconfigurational ensemble
We have used a numerical representation of the proteinconformations of our MD simulations (11,564 in total). Inour approach, every protein conformation is representedas a 2-dimensional table that we refer to as “contact maptable” in the sequel. In principle, we represent a

581Aβ(1–42) Conformations in Water
conformation as a binary table of residue-to-residueinteractions. We focus on 42 residues and on interactionswithin a distance threshold of 4.5 Å between any pair ofheavy atoms in the residue. Each of the 11,564 contact maptables has dimensions 42×42, where for all i,j=1,…, 42 the(i,j)th element of the table indicates the presence orabsence of an interaction (contact) between the ith andthe jth residues of the protein that corresponds to thisparticular table. We fill all elements of this table with zerosand ones such that a ‘0’ implies a broken contact and a ‘1’implies a formed contact. We further simplify this contactmap table by neglecting trivial short-range interactionsbetween residues with less than three sequence separa-tion; that is, the main diagonal as well as the three sub-diagonals around the main diagonal of every contact maptable are neglected. To organize the contact map tables in amore compact way, we first transform each of them to a 1-dimensional row vector. This vector has 741 dimensions,and since we discarded the central diagonals, we kept onlyhalf of it due to its symmetry. That way, every element ofthis 741-dimensional vector corresponds to a uniqueresidue-to-residue interaction in the protein. Finally, ourMD ensemble can be represented as an 11,564×741matrix, where each row corresponds to a snapshot (thevectorized contact map described above) and each columncorresponds to a residue-to-residue interaction. Thisbinary matrix is denoted as A in the sequel.
Spectral analysis of protein conformations
The goals of our computational are threefold:
1. Visualization: we want to visualize the conforma-tions in a small number of dimensions so that onewill be able to quickly understand the hiddenstructure of the complex conformation space.
2. Clustering: identification of a small number of“representative” conformations: we want to find asmall subset of conformations that efficiently sum-marize and characterize the protein ensemble.
3. Feature selection: identification of a small number of“representative” residue-to-residue interactions: wewant to find a small subset of residue-to-residueinteractions with high “discriminative power”, thatis, interactions that suffice to classify the conforma-tions into different groups.
The above goals are achieved by employing techniquestypically referred to as “spectral algorithms”; this charac-terization implies algorithms that use eigenvectors andeigenvalues of appropriate matrices.67 All of our techni-ques employ an eigenvalue-type analysis of the Laplacianmatrix of a proper graph describing the matrix A. In moredetail, we use:
1. The Laplacian eigenmaps approach28 to visualizethe conformations in a three-dimensional Euclidianspace. This is described in Appendix A1.
2. The spectral clustering approach based on normal-ized cuts29 to cluster the conformations into differentgroups and select representativeswithin each group.This technique is described in Appendix B.
3. The feature selection approach based on the Lapla-cian scores30 to identify contacts with high discrim-inative power (see Appendix C).
Supplementary materials related to this article can befound online at doi:10.1016/j.jmb.2010.10.015
Acknowledgements
We would like to thank Drs. Paul Maragakis,Kresten Lindorff-Larsen, and Xavier Salvatella foruseful discussions. This work is supported by theNational Institutes of Health Molecular LibrariesRoadmap Initiative (IP20HG003899-01), the NationalScience Foundation (MCB0543769 andDMR0117792),and IBM.
References
1. Soto, C. (2003). Unfolding the role of protein misfold-ing in neurodegenerative diseases. Nat. Rev., Neurosci.4, 49–60.
2. Rauk, A. (2009). The chemistry of Alzheimer's disease.Chem. Soc. Rev. 38, 2698–2715.
3. Lesne, S., Koh, M. T., Kotilinek, L., Kayed, R., Glabe,C. G., Yang, A. et al. (2006). A specific amyloid-betaprotein assembly in the brain impairs memory.Nature,440, 352–357.
4. Mucke, L., Masliah, E., Yu, G. Q., Mallory, M.,Rockenstein, E. M., Tatsuno, G. et al. (2000). High-level neuronal expression of abeta 1–42 in wild-typehuman amyloid protein precursor transgenic mice:synaptotoxicity without plaque formation. J. Neurosci.20, 4050–4058.
5. Luhrs, T., Ritter, C., Adrian, M., Riek-Loher, D.,Bohrmann, B., Dobeli, H. et al. (2005). 3D structure ofAlzheimer's amyloid-beta(1–42) fibrils. Proc. NatlAcad. Sci. USA, 102, 17342–17347.
6. Petkova, A. T., Ishii, Y., Balbach, J. J., Antzutkin, O. N.,Leapman, R. D., Delaglio, F. & Tycko, R. (2002). Astructural model for Alzheimer's beta-amyloid fibrilsbased on experimental constraints from solid stateNMR. Proc. Natl Acad. Sci. USA, 99, 16742–16747.
7. Paravastu, A. K., Qahwash, I., Leapman, R. D.,Meredith, S. C. & Tycko, R. (2009). Seeded growth ofbeta-amyloid fibrils from Alzheimer's brain-derivedfibrils produces a distinct fibril structure. Proc. NatlAcad. Sci. USA, 106, 7443–7448.
8. Zhang, S., Iwata, K., Lachenmann, M. J., Peng, J. W.,Li, S., Stimson, E. R. et al. (2000). The Alzheimer'speptide a beta adopts a collapsed coil structure inwater. J. Struct. Biol. 130, 130–141.
9. Baumketner, A., Krone, M. G. & Shea, J. E. (2008). Roleof the familial Dutchmutation E22Q in the folding andaggregation of the 15–28 fragment of the Alzheimeramyloid-beta protein. Proc. Natl Acad. Sci. USA, 105,6027–6032.
10. Wu, C., Murray, M. M., Bernstein, S. L., Condron,M. M., Bitan, G., Shea, J. E. & Bowers, M. T. (2009).

582 Aβ(1–42) Conformations in Water
The structure of A beta 42 C-terminal fragmentsprobed by a combined experimental and theoreticalstudy. J. Mol. Biol. 387, 492–501.
11. Frauenfelder, H., Sligar, S. G. &Wolynes, P. G. (1991).The energy landscapes and motions of proteins.Science, 254, 1598–1603.
12. Yang, M. F. & Teplow, D. B. (2008). Amyloid beta-protein monomer folding: free-energy surfaces revealalloform-specific differences. J. Mol. Biol. 384, 450–464.
13. Hou, L., Shao, H., Zhang, Y., Li, H., Menon, N. K.,Neuhaus, E. B. et al. (2004). Solution NMR studies of theA beta(1–40) and A beta(1–42) peptides establish thatthe Met35 oxidation state affects the mechanism ofamyloid formation. J. Am. Chem. Soc. 126, 1992–2005.
14. Riek, R., Guntert, P., Dobeli, H.,Wipf, B. &Wuthrich, K.(2001). NMR studies in aqueous solution fail to identifysignificant conformational differences between themonomeric forms of two Alzheimer peptides withwidely different plaque-competence, A beta(1–40)(ox)and A beta(1–42)(ox). Eur. J. Biochem. 268, 5930–5936.
15. Schweitzer-Stenner, R., Measey, T., Hagarman, A.,Eker, F. & Griebenow, K. (2006). Salmon calcitoninand amyloid beta: two peptides with amyloidogeniccapacity adopt different conformational manifolds intheir unfolded states. Biochemistry, 45, 2810–2819.
16. Sgourakis,N.G.,Yan,Y. L.,McCallum, S.A.,Wang,C.Y.& Garcia, A. E. (2007). The Alzheimer's peptides A beta40 and 42 adopt distinct conformations in water: acombined MD/NMR study. J. Mol. Biol. 368, 1448–1457.
17. Yu, L., Edalji, R., Harlan, J. E., Holzman, T. F., Lopez,A. P., Labkovsky, B. et al. (2009). Structural character-ization of a soluble amyloid beta-peptide oligomer.Biochemistry, 48, 1870–1877.
18. Sciarretta, K. L., Gordon, D. J. &Meredith, S. C. (2006).Peptide-based inhibitors of amyloid assembly. Meth-ods Enzymol. 413, 273–312.
19. Soto, C., Sigurdsson, E. M., Morelli, L., Kumar, R. A.,Castano, E. M. & Frangione, B. (1998). Beta-sheetbreaker peptides inhibit fibrillogenesis in a rat brainmodel of amyloidosis: implications for Alzheimer'stherapy. Nat. Med. 4, 822–826.
20. Fradinger, E. A., Monien, B. H., Urbanc, B., Lomakin,A., Tan, M., Li, H. et al. (2008). C-terminal peptidescoassemble into A beta 42 oligomers and protectneurons against A beta 42-induced neurotoxicity.Proc. Natl Acad. Sci. USA, 105, 14175–14180.
21. Hornak, V., Abel, R., Okur, A., Strockbine, B., Roitberg,A. & Simmerling, C. (2006). Comparison of multipleAmber force fields and development of improvedprotein backbone parameters. Proteins, 65, 712–725.
22. Cornell, W. D., Cieplak, P., Bayly, C. I., Gould, I. R.,Merz, K. M., Ferguson, D. M. et al. (1995). A 2ndgeneration force field for the simulation of proteins,nucleic acids, and organic molecules. J. Am. Chem. Soc.117, 5179–5197.
23. Esteban-Martin, S., Fenwick, R. B. & Salvatella, X.(2010). Refinement of ensembles describing unstruc-tured proteins using NMR residual dipolar couplings.J. Am. Chem. Soc. 132, 4626–4632.
24. Jensen, M. R., Markwick, P. R., Meier, S., Griesinger,C., Zweckstetter, M., Grzesiek, S. et al. (2009).Quantitative determination of the conformationalproperties of partially folded and intrinsically disor-
dered proteins using NMR dipolar couplings. Struc-ture, 17, 1169–1185.
25. Nodet, G., Salmon, L., Ozenne, V., Meier, S., Jensen,M. R. & Blackledge, M. (2009). Quantitative descrip-tion of backbone conformational sampling of unfold-ed proteins at amino acid resolution from NMRresidual dipolar couplings. J. Am. Chem. Soc. 131,17908–17918.
26. Lim, K. H., Henderson, G. L., Jha, A. & Louhivuori, M.(2007). Structural, dynamic properties of key residuesin A beta amyloidogenesis: implications of animportant role of nanosecond timescale dynamics.ChemBioChem, 8, 1251–1254.
27. Yan, Y., McCallum, S. A. & Wang, C. (2008). M35oxidation induces Abeta40-like structural and dynam-ical changes in Abeta42. J. Am. Chem. Soc. 130,5394–5395.
28. Belkin, M. & Niyogi, P. (2003). Laplacian eigenmapsfor dimensionality reduction and data representation.Neural Comput. 15, 1373–1396.
29. Shi, J. & Malik, J. (2000). Normalized cuts and imagesegmentation. IEEE Trans. Comput. 22, 888–905.
30. He, X., Cai, D. & Niyogi, P. (2006). Neural InformationProcessing Systems, Vancouver.
31. Kaminski, G. A., Friesner, R. A., Tirado-Rives, J. &Jorgensen, W. L. (2001). Evaluation and reparame-trization of the OPLS-AA force field for proteins viacomparison with accurate quantum chemical calcula-tions on peptides. J. Phys. Chem. B, 105, 6474–6487.
32. Jorgensen, W. L., Chandrasekhar, J., Madura, J. D.,Impey, R. W. & Klein, M. L. (1983). Comparison ofsimple potential functions for simulating liquid water.J. Chem. Phys. 79, 926–935.
33. Bruschweiler, R. & Case, D. A. (1994). Addingharmonic motion to the Karplus relation for spin–spin coupling. J. Am. Chem. Soc. 116, 11199–11200.
34. Vuister, G. W. & Bax, A. (1993). Quantitative Jcorrelation—a new approach for measuring homonu-clear 3-bond J(H(N)H(alpha) coupling-constants in N-15-enriched proteins. J. Am. Chem. Soc. 115, 7772–7777.
35. Miyamoto, S. & Kollman, P. A. (1992). Settle—ananalytical version of the shake and rattle algorithm forrigid water models. J. Comput. Chem. 13, 952–962.
36. Lindorff-Larsen, K., Piana, S., Palmo, K., Maragakis,P., Klepeis, J. L., Dror, R. O. & Shaw, D. E. (2010).Improved side-chain torsion potentials for the Amberff99SB protein force field. Proteins, 78, 1950–1956.
37. Zweckstetter, M. & Bax, A. (2000). Prediction ofsterically induced alignment in a dilute liquidcrystalline phase: aid to protein structure determina-tion by NMR. J. Am. Chem. Soc. 122, 3791–3792.
38. Kabsch, W. & Sander, C. (1983). Dictionary of proteinsecondary structure: pattern recognition of hydrogen-bonded and geometrical features. Biopolymers, 22,2577–2637.
39. Day, R., Paschek, D. & Garcia, A. E. (2010). Microsec-ond simulations of the folding/unfolding thermody-namics of the Trp-cage miniprotein. Proteins, 78,1889–1899.
40. Showalter, S. A., Johnson, E., Rance, M. & Bruschweiler,R. (2007). Toward quantitative interpretation of methylside-chain dynamics fromNMRbymolecular dynamicssimulations. J. Am. Chem. Soc. 129, 14146–14147.

583Aβ(1–42) Conformations in Water
41. Fawzi, N. L., Phillips, A. H., Ruscio, J. Z., Doucleff, M.,Wemmer, D. E. & Head-Gordon, T. (2008). Structureand dynamics of the Abeta(21–30) peptide from theinterplay of NMR experiments and molecular simula-tions. J. Am. Chem. Soc. 130, 6145–6158.
42. Maragakis, P., Lindorff-Larsen, K., Eastwood, M. P.,Dror, R. O., Klepeis, J. L., Arkin, I. T. et al. (2008).Microsecond molecular dynamics simulation showseffect of slow loop dynamics on backbone amideorder parameters of proteins. J. Phys. Chem. B, 112,6155–6158.
43. Wickstrom, L., Okur, A. & Simmerling, C. (2009).Evaluating the performance of the ff99SB force fieldbased on NMR scalar coupling data. Biophys. J. 97,853–856.
44. Best, R. B., Buchete, N. V. & Hummer, G. (2008). Arecurrent molecular dynamics force fields too helical?Biophys. J. 95, L07–09.
45. Horn, H.W., Swope,W. C., Pitera, J. W., Madura, J. D.,Dick, T. J., Hura, G. L. & Head-Gordon, T. (2004).Development of an improved four-site water modelfor biomolecular simulations: TIP4P-Ew. J. Chem. Phys.120, 9665–9678.
46. Wickstrom, L., Okur, A., Song, K., Hornak, V.,Raleigh, D. P. & Simmerling, C. L. (2006). Theunfolded state of the villin headpiece helical sub-domain: computational studies of the role of locallystabilized structure. J. Mol. Biol. 360, 1094–1107.
47. Ekins, S., Balakin, K. V., Savchuk, N. & Ivanenkov, Y.(2006). Insights for human ether-a-go-go-related genepotassium channel inhibition using recursive parti-tioning and Kohonen and Sammon mapping techni-ques. J. Med. Chem. 49, 5059–5071.
48. Garcia, A. E. (1992). Large-amplitude nonlinearmotions in proteins. Phys. Rev. Lett. 68, 2696–2699.
49. Mesentean, S., Fischer, S. & Smith, J. C. (2006).Analyzing large-scale structural change in proteins:comparison of principal component projection andSammon mapping. Proteins, 64, 210–218.
50. Zhang, Z. & Wriggers, W. (2006). Local featureanalysis: a statistical theory for reproducible essentialdynamics of large macromolecules. Proteins, 64,391–403.
51. Paccanaro, A., Casbon, J. A. & Saqi, M. A. (2006).Spectral clustering of protein sequences. Nucleic AcidsRes. 34, 1571–1580.
52. Sgourakis, N. G. & Garcia, A. E. (2010). Themembrane complex between transducin and dark-state rhodopsin exhibits large-amplitude interfacedynamics on the sub-microsecond timescale: insightsfrom all-atom MD simulations. J. Mol. Biol. 398,161–173.
53. Hartigan, J. A. (1975). Clustering Algorithms. JohnWiley and Sons, Inc., New York, NY.
54. Mclachlan, A. D. (1979). Gene duplications in thestructural evolution of chymotrypsin. J. Mol. Biol. 128,49.
55. Daura, X., Suter, R. & van Gunsteren, W. F. (1999).Validation of molecular simulation by comparisonwith experiment: rotational reorientation of trypto-phan in water. J. Chem. Phys. 110, 3049–3055.
56. Hukushima, K. & Nemoto, K. (1996). Exchange MonteCarlo method and application to spin glass simula-tions. J. Phys. Soc. Jpn. 65, 1604–1608.
57. Sugita, Y. & Okamoto, Y. (1999). Replica-exchangemolecular dynamics method for protein folding.Chem. Phys. Lett. 314, 141–151.
58. Garcia, A. E., Herce, H. & Paschek, D. (2006).Simulations of temperature and pressure unfoldingof peptides and proteins with replica exchangemolecular dynamics. Annu. Rep. Comput. Chem. 2,83–95.
59. Hess, B., Bekker, H., Berendsen, H. J. C. & Fraaije, J.(1997). LINCS: a linear constraint solver for molecularsimulations. J. Comput. Chem. 18, 1463–1472.
60. Darden, T., York, D. & Pedersen, L. (1993). ParticleMesh Ewald—anN·Log(N) method for Ewald sums inlarge systems. J. Chem. Phys. 98, 10089–10092.
61. Klement, K., Wieligmann, K., Meinhardt, J.,Hortschansky, P., Richter, W. & Fandrich, M.(2007). Effect of different salt ions on the propensityof aggregation and on the structure of Alzheimer'sA beta(1–40) amyloid fibrils. J. Mol. Biol. 373,1321–1333.
62. Narayanan, S. & Reif, B. (2005). Characterization ofchemical exchange between soluble and aggregatedstates of beta-amyloid by solution-state NMR uponvariation of salt conditions. Biochemistry, 44,1444–1452.
63. Nose, S. (1991). Constant temperature molecular-dynamics methods. Prog. Theor. Phys., Suppl. 103,1–46.
64. Van Der Spoel, D., Lindahl, E., Hess, B., Groenhof, G.,Mark, A. E. & Berendsen, H. J. (2005). GROMACS:fast, flexible, and free. J. Comput. Chem. 26, 1701–1718.
65. Karplus, M. & Anderson, D. H. (1959). Valence-bondinterpretation of electron-coupled nuclear spin inter-actions—application to methane. J. Chem. Phys. 30,6–10.
66. Zweckstetter, M. (2008). NMR: prediction of molecu-lar alignment from structure using the PALESsoftware. Nat. Protoc. 3, 679–690.
67. Golub, G. H. & Van Loan, C. F. (1996). , 3rd edit. JohnsHopkins University Press, Baltimore, MD.