atra (az) engaging & retaining key talent - role...
TRANSCRIPT

Engaging & Retaining Key Talent:The Role of Total RewardsFebruary 2015 Ron Keimach, Hay Group

2© 2015 Hay Group. All rights reserved
Today’s Discussion
Talent trends
Staying Competitive Turnover, Engagement, and Enablement
Next Practices
Implementation

3© 2015 Hay Group. All rights reserved
Targeting top talent
Engagement is no longeroptional
A new view onperformance
The bestsystem is not a substitute formanagement
Talent Management Challenges

4© 2015 Hay Group. All rights reserved
Why is this important?
Economy starting to recover Real wages are increasing
Unemployment down to 7.5%, and still falling 3.9% for college graduates
An increasing number of Americans are quitting their jobs There is a “demographic hole”
20% of employees intend to quit in the next two years
Number of job changes are increasing
5© 2015 Hay Group. All rights reserved
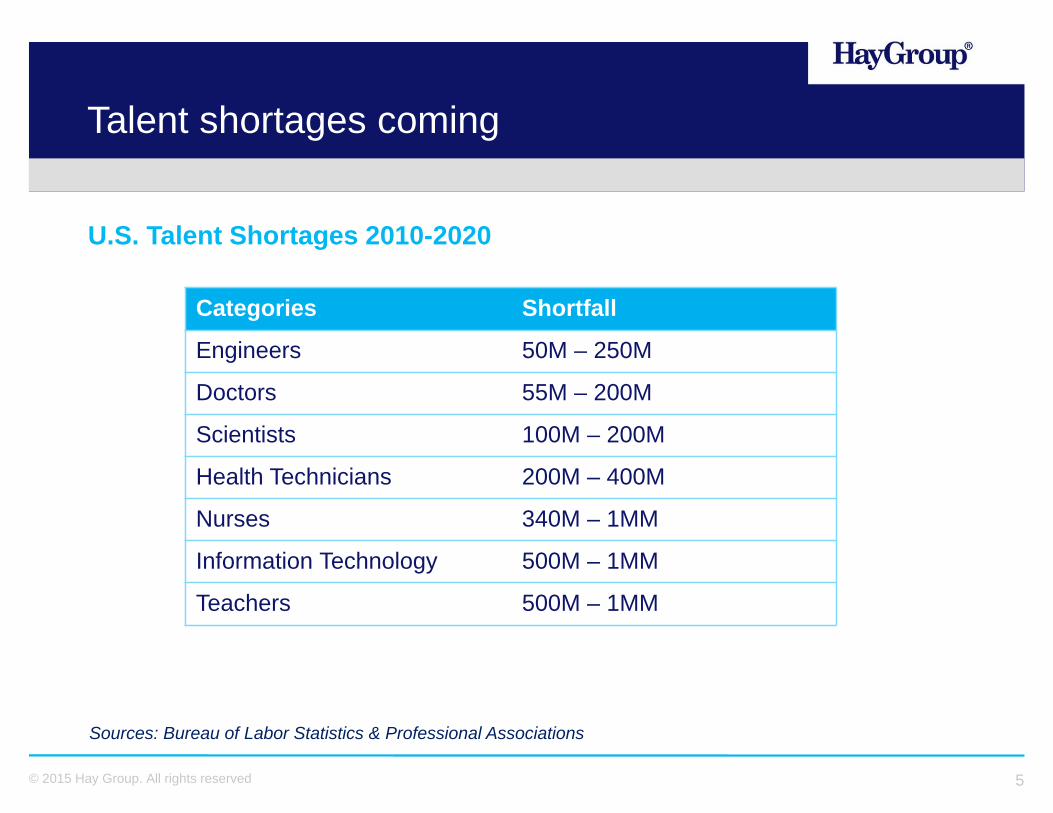
Talent shortages coming
U.S. Talent Shortages 2010-2020
Categories Shortfall
Engineers 50M – 250M
Doctors 55M – 200M
Scientists 100M – 200M
Health Technicians 200M – 400M
Nurses 340M – 1MM
Information Technology 500M – 1MM
Teachers 500M – 1MM
Sources: Bureau of Labor Statistics & Professional Associations

6© 2015 Hay Group. All rights reserved
Serious skills shortfall by sector
0% 10% 20% 30% 40% 50% 60% 70%
Other
Consumer Products
Industrial Products
Energy & Resources
Life Sciences & Med. Devices
Aerospace & Defense
Source: Manufacturing Industry Survey by Deloitte, Oracle, & Manufacturing Institute
7© 2015 Hay Group. All rights reserved
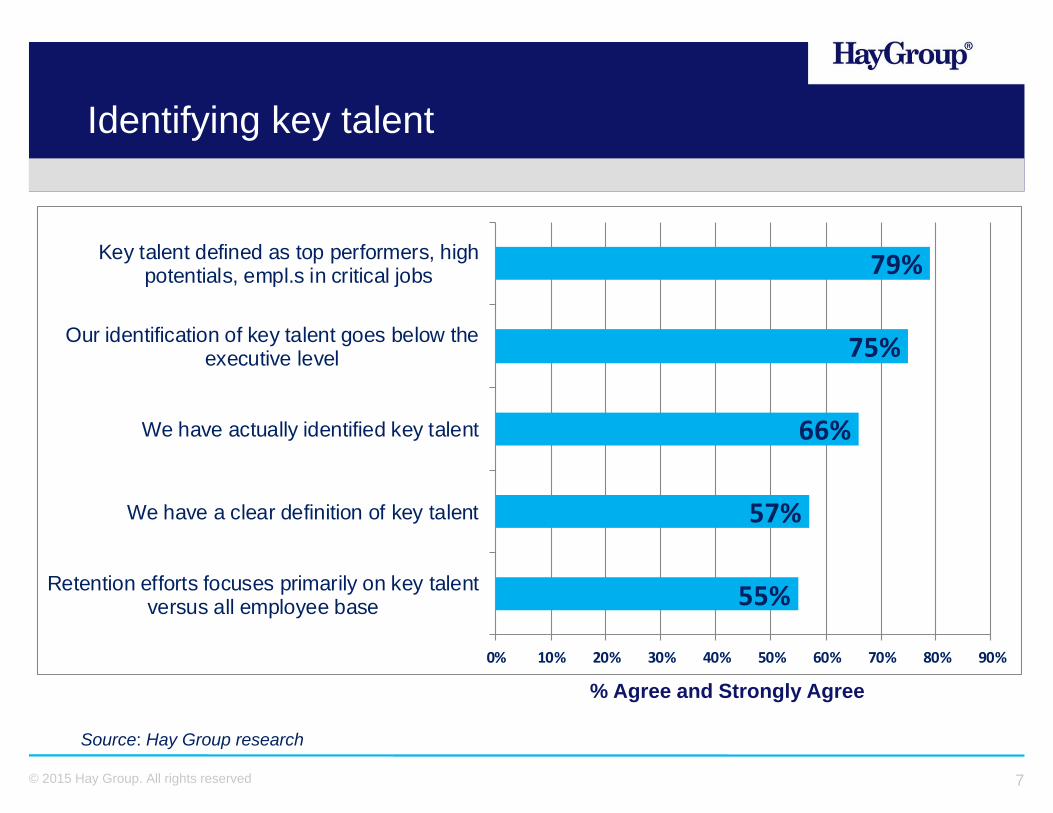
Identifying key talent
55%
57%
66%
75%
79%
0% 10% 20% 30% 40% 50% 60% 70% 80% 90%
Retention efforts focuses primarily on key talentversus all employee base
We have a clear definition of key talent
We have actually identified key talent
Our identification of key talent goes below theexecutive level
Key talent defined as top performers, highpotentials, empl.s in critical jobs
% Agree and Strongly Agree
Source: Hay Group research

8© 2015 Hay Group. All rights reserved
54%
57%
58%
60%
68%
81%
0% 20% 40% 60% 80% 100%
I expect a substantial number of key employees tosearch for a better job as the economy improves
Confident in my organization's ability to retain keytalent as the economy improves
Retention of key talent has become more difficultin recent months
I expect turnover of key talent to increasesubstantially when the economy improves
Employee retention of key talent is a majorconcern of senior management right now
Turnover of key employes is very costly for ourorganization
% Agree & Strongly AgreeSource: Hay Group research
Is retaining key talent a significant challenge?

9© 2015 Hay Group. All rights reserved
Easy for key talent to leave
Key talent always scarce especially during economic recovery You can’t hide key talent; Linked-in and social media promote their capabilities and
accomplishments Top talent can compare their “deal” with everyone else’s on salary.com, vault.com,
O’net.gov, etc. Your company reputation is always on the line; a disgruntled employee has an
audience of millions
Whole Foods employee’s rant goes
viral Workplace experts weigh in on a
commentary by departing Goldman
Sachs executive Greg Smith
Feds: trashing an employer on Facebook is
protected speech
10© 2015 Hay Group. All rights reserved
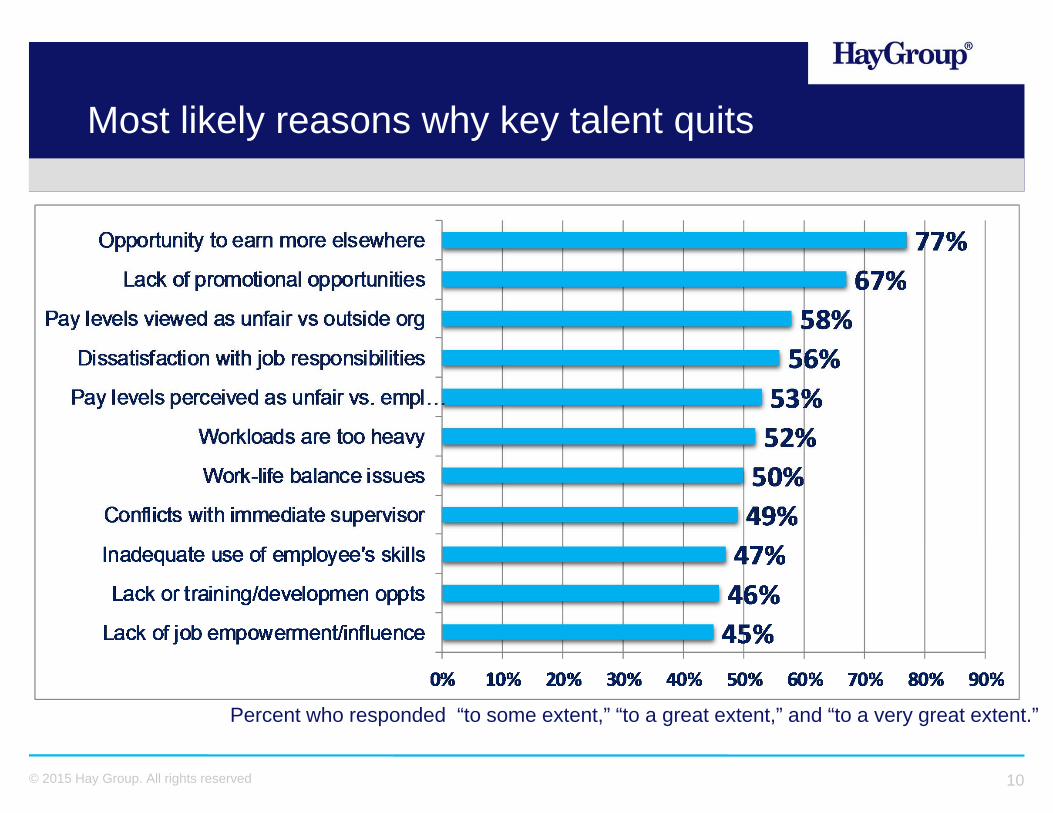
Most likely reasons why key talent quits
Percent who responded “to some extent,” “to a great extent,” and “to a very great extent.”

11© 2015 Hay Group. All rights reserved
Total Percent Favorable
Employees planning to stay
for >2 years
Employees planning to leave
within 2 yearsGap
Confidence in ability to achieve career objectives at company 64% 31% 33%
Trust and confidence in company senior management 60% 35% 25%
Opportunities for learning and development 71% 45% 25%
Benefits that meet employee needs 68% 45% 23%
Company demonstrates care and concern for employees 62% 39% 23%
Company is effectively managed and run well 73% 51% 23%
Adequate authority to do job 73% 51% 23%
Employees paid fairly for the work they do 53% 31% 22%Supervisory coaching for development 67% 45% 22%
Support for employee creativity and innovation 70% 48% 22%
Cross-work unit collaboration and support 63% 41% 22%
Direction and goals are the right ones for the company 73% 51% 22%
Source: Hay Group Employee Opinion Norms (2013)
Key predictors of employee retention

12© 2015 Hay Group. All rights reserved
Methods most often used to retain key talent
% Use these methods
65%
68%
73%
73%
74%
75%
80%
85%
0% 20% 40% 60% 80% 100%
Provided meaningful pay communications
Allowed for flexible hours or telecommunting
Provided tuition reimbursement/othereducational opportunities
Developed employees who may replace keyemployees who leave
Created a succession plan to replace individuals
Pay employees above the labor market
Discussed future opportunities within theorganization
Identified key employees who are essential tothe business
% Effective or Very Effective
75%
69%
73%
63%
64%
53%
67%
59%

13© 2015 Hay Group. All rights reserved
Job Type/Category Turnover cost ranges (% of annual wages)
Entry Level – Hourly, Non Skilled (e.g. Fast Food Worker) 30% ‐ 50%
Service/Production Workers ‐ Hourly (e.g. Courier) 40% ‐ 70%
Skilled Hourly (e.g. Machinist) 75% ‐ 100%
Clerical/Administrative (e.g. Scheduler) 50% ‐ 80%
Professional (e.g. Sales Representative, Nurse, Accountant) 75% ‐ 125%
Technical (e.g. Computer Technician) 100% ‐ 150%
Engineers (e.g. Chemical Engineer) 200% ‐ 300%
Specialists (e.g. Computer Software Designer) 200% ‐ 400%
Supervisors/Team Leaders (e.g. Section Supervisor) 100% ‐ 150%
Middle Managers (e.g. Department Manager) 125% ‐ 200%
Source: ROI Institute
Cost of turnover estimates

14© 2015 Hay Group. All rights reserved
Turnover cost components
Exit cost of previous employee
Lost productivity
Temporary worker cost
Recruiting cost
On-boarding costs
Training costs
Supervisor’s/coworkers’ time managing turnover
Loss of expertise/knowledge
Quality problems
Customer dissatisfaction

15© 2015 Hay Group. All rights reserved
A look at the cost of turnover
16© 2015 Hay Group. All rights reserved
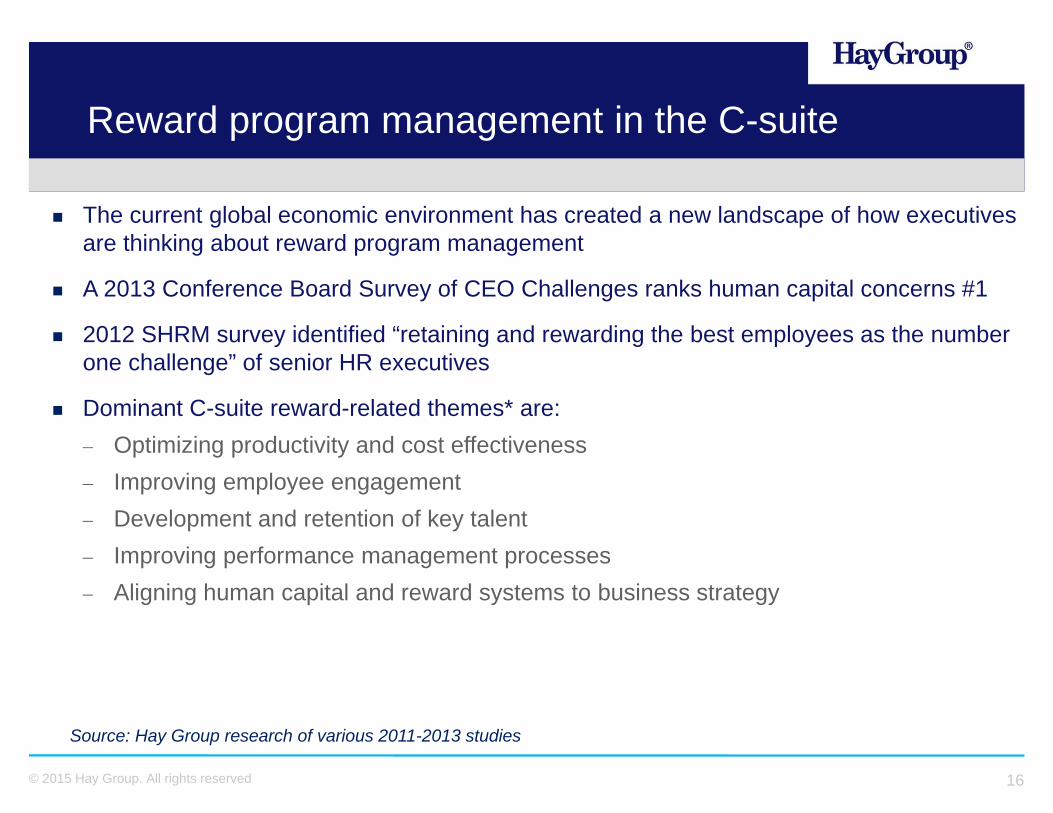
The current global economic environment has created a new landscape of how executives are thinking about reward program management
A 2013 Conference Board Survey of CEO Challenges ranks human capital concerns #1
2012 SHRM survey identified “retaining and rewarding the best employees as the number one challenge” of senior HR executives
Dominant C-suite reward-related themes* are: Optimizing productivity and cost effectiveness Improving employee engagement Development and retention of key talent Improving performance management processes Aligning human capital and reward systems to business strategy
Source: Hay Group research of various 2011-2013 studies
Reward program management in the C-suite

17© 2015 Hay Group. All rights reserved
Work environments must turn motivation into productivity
Stra
tegi
c in
tent
Bus
ines
s re
sults
Enablement
Engagement
Employee effectiveness
A positive intersection

18© 2015 Hay Group. All rights reserved
Clear & promising direction Confidence in leaders Quality & customer focus Respect & recognition Development opportunities Pay & benefits
Performance management Authority & empowerment Resources Training Collaboration Work, structure & process
Employee engagement
Commitment Discretionary effort
Employee enablement
Optimized roles Supportive
environment
DRIVERS
Productivity
Financial performance
Customer loyalty
Innovation
Enhanced reputation
Attracting and retaining talent
EMPLOYEEEFFECTIVENESS
Engagement and enablement are key to effectiveness

19© 2015 Hay Group. All rights reserved
The business case for engaging andenabling employees
Increase in employees above performance expectations
Reduction in turnover rates
Customer satisfaction rates
Revenue growth
Employee retention
Employee performance
Customer satisfaction
Financial success
10% -40% 71% x2.5High engagement only
50% -54% 89% x4.5High engagement +high enablement
Based on linkage case studies using Hay Group’s global normative database

20© 2015 Hay Group. All rights reserved
Engagement and enablement: Implications for action
HIGH
DETACHED EFFECTIVE
INEFFECTIVE FRUSTRATED
LOW HIGHEngagement
Enab
lem
ent
Engagement and enablement are both important determinants of employee performance
Organizations are unlikely to sustain one without the other
Frustrated employees will break through barriers, disengage, or leave the organization

21© 2015 Hay Group. All rights reserved
Engagement: The impact of financial rewards

22© 2015 Hay Group. All rights reserved
Engagement: The impact of non-financial rewards
23© 2015 Hay Group. All rights reserved
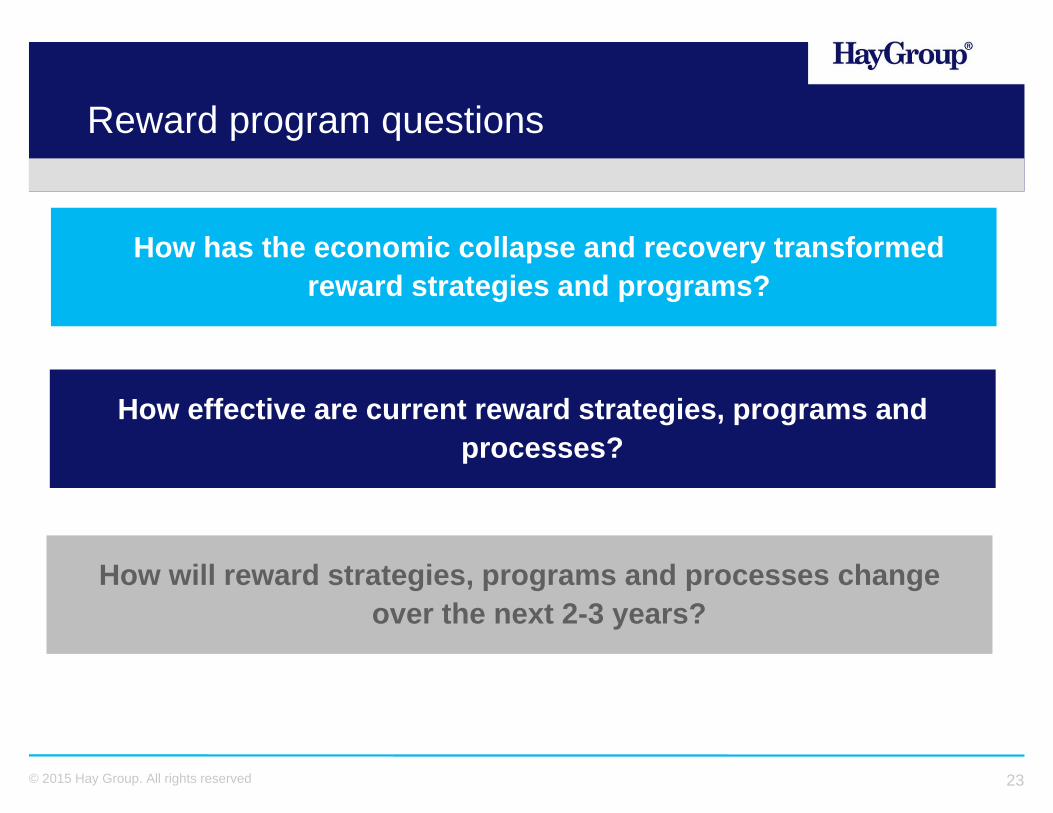
Reward program questions
How has the economic collapse and recovery transformed reward strategies and programs?
How effective are current reward strategies, programs and processes?
How will reward strategies, programs and processes change over the next 2-3 years?

24© 2015 Hay Group. All rights reserved
Characteristics of reward strategies
Effectiveness of reward program design
Implementation of reward programs
Degree of reward program consistency
Examine rewards from four perspectives

25© 2015 Hay Group. All rights reserved
Issues with reward practices today
Strategy and design
Implementation
Lack of robust reward strategies Extreme focus on benchmarking for many, with little concern
given to affordability of pay programs Reward components managed in isolation of each other Little input from employees on reward strategy and design Boards and CEOs concerned with risk and compliance
Performance management processes often weak The value of “total rewards” is not understood by employees Line managers are not well engaged in reward implementation Little done in terms of reward ROI assessment

26© 2015 Hay Group. All rights reserved
Is reward a cost or an investment?
11% 48%
80% 60% 40% 20% 0% 20% 40% 60% 80%
% current focus % greater focus in future
Our organization regularly measures the ROI on its reward
investment
Why do we care?
If pay is a cost, the obvious goal is to minimize it
If pay is an investment, the obvious goal is to optimize it

27© 2015 Hay Group. All rights reserved
If reward is viewed as an investment…
Organizations focus on…
Aligning rewards with its business and human capital strategy
Balancing employee and organization reward interests
Reinforcing the link between rewards and performance
Distilling down and sustaining key reward communications
Leveraging senior leaders, managers and employees in reward implementation

28© 2015 Hay Group. All rights reserved
Consistent strategy and designInconsistent strategy and design
TOFROM
ROI orientation of rewardCost orientation of reward
MotivationalExternally competitive
Balanced performance measuresFinancial performance measures
Longer term performance orientationShort term performance orientation
Reward strategy trends

29© 2015 Hay Group. All rights reserved
Increased emphasis on motivational value of reward programs
74%
39%
75%
64%
47%
67%
41%
53%
80% 60% 40% 20% 0% 20% 40% 60% 80%
% current focus % greater focus in future
Rewards at a reasonable cost
Is motivational
Is internally fair
Is externally competitive
Source: Hay Group/WaW Global Survey, 2012
Core reward strategy objectives

30© 2015 Hay Group. All rights reserved
Increased focus on drivers of financial performance and engagement
32%
21%
15%
41%
66%
56%
42%
39%
39%
39%
80% 60% 40% 20% 0% 20% 40% 60% 80%
A culture of innovation
Human capital development
Customer satisfaction
Financial performance
Employee engagement
“There are only three measurements that tell you nearly everything you need to know about your organization’s overall performance: employee engagement, customer satisfaction, and cash.“ Jack Welch, former CEO of GE
% current focus % greater focus in the futureSource: Hay Group/WaW Global Survey, 2012
Balanced performance

31© 2015 Hay Group. All rights reserved
Reward design trends
Variable pay program management
Paying for value/contribution
Defined contribution plans
Base pay program management
Paying for jobs/work
Defined benefit plans
TOFROM
Ttl remuneration/rewards orientationSiloed reward element orientation
Career dev’lmt, culture, recognitionFlexible work arrangements

32© 2015 Hay Group. All rights reserved
Non-financial reward program effectiveness
37%
48%
57%
38%
50%
39%
50%
31%
38%
48%
43%
32%
63%
54%
80% 60% 40% 20% 0% 20% 40% 60% 80%
% current focus % greater focus in future
Nonfinancial recognition
Flexible work arrangements
Career/development opportunities
Education & training programs
Work-life balance
Work climate/culture
Meaningful job design
Career/development opportunities primary focus in the future
Source: Hay Group/WaW Global Survey, 2012
33© 2015 Hay Group. All rights reserved
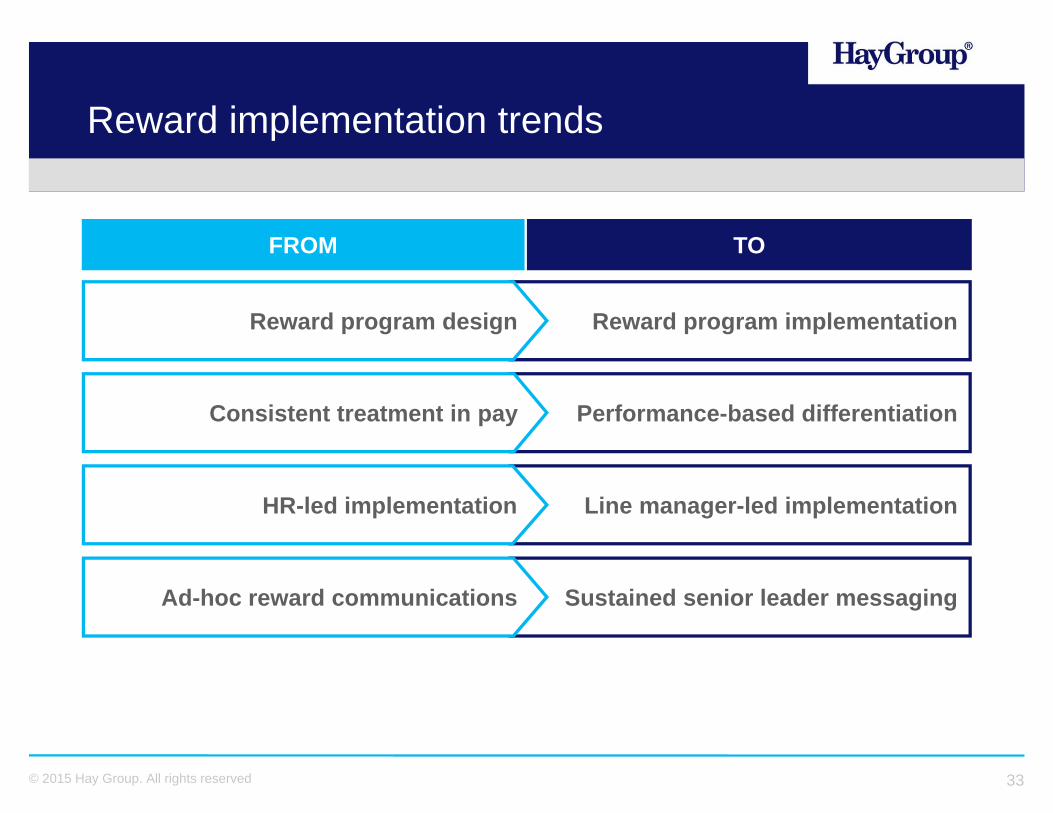
Reward implementation trends
Reward program implementation
Performance-based differentiation
Line manager-led implementation
Sustained senior leader messaging
Reward program design
Consistent treatment in pay
HR-led implementation
Ad-hoc reward communications
TOFROM
34© 2015 Hay Group. All rights reserved
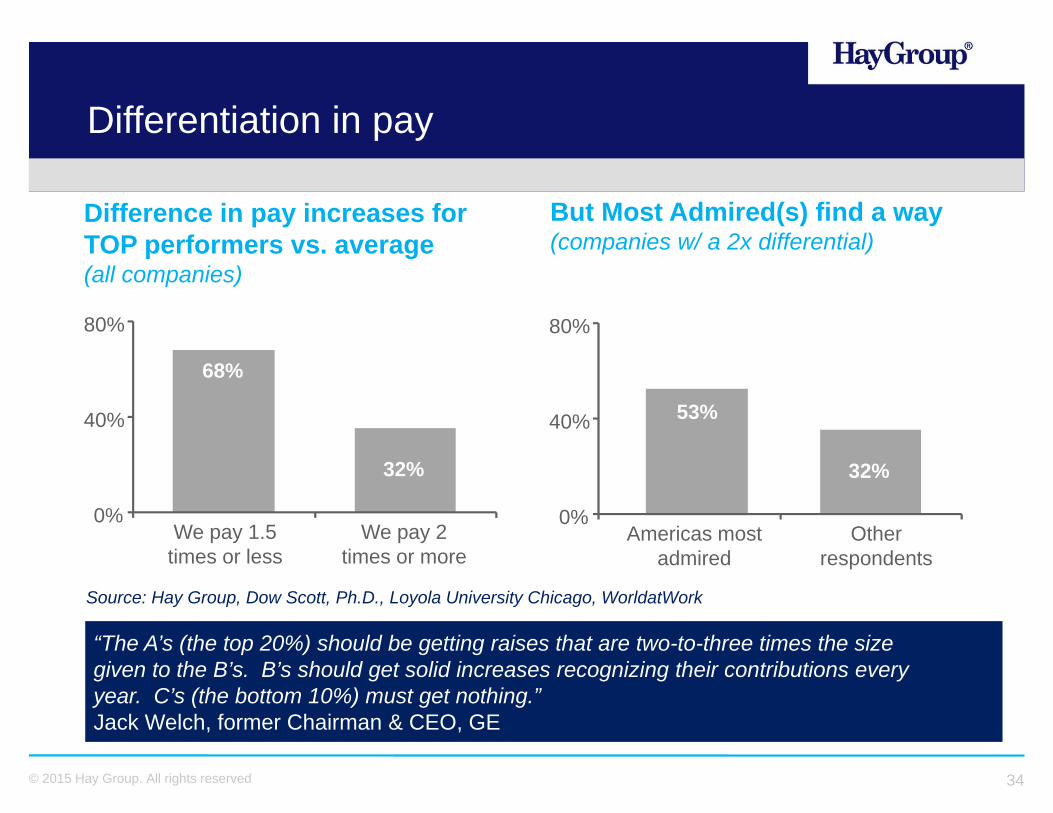
Differentiation in pay
Difference in pay increases for TOP performers vs. average (all companies)
But Most Admired(s) find a way (companies w/ a 2x differential)
“The A’s (the top 20%) should be getting raises that are two-to-three times the size given to the B’s. B’s should get solid increases recognizing their contributions every year. C’s (the bottom 10%) must get nothing.” Jack Welch, former Chairman & CEO, GE
Source: Hay Group, Dow Scott, Ph.D., Loyola University Chicago, WorldatWork
68%
32%
0%
40%
80%
We pay 1.5 times or less
We pay 2 times or more
53%
32%
0%
40%
80%
Americas mostadmired
Other respondents

35© 2015 Hay Group. All rights reserved
Future focus for managers to effectively communicate total rewards
15%
11%
57%
61%
80% 60% 40% 20% 0% 20% 40% 60% 80%
% current focus % greater focus in future
Managers effectively implement and communicate total rewards to
employees
Managers effectively manage overall pay-for-performance relationship for
employees
Source: Hay Group/WaW Global Survey, 2012
Role of line managers
36© 2015 Hay Group. All rights reserved
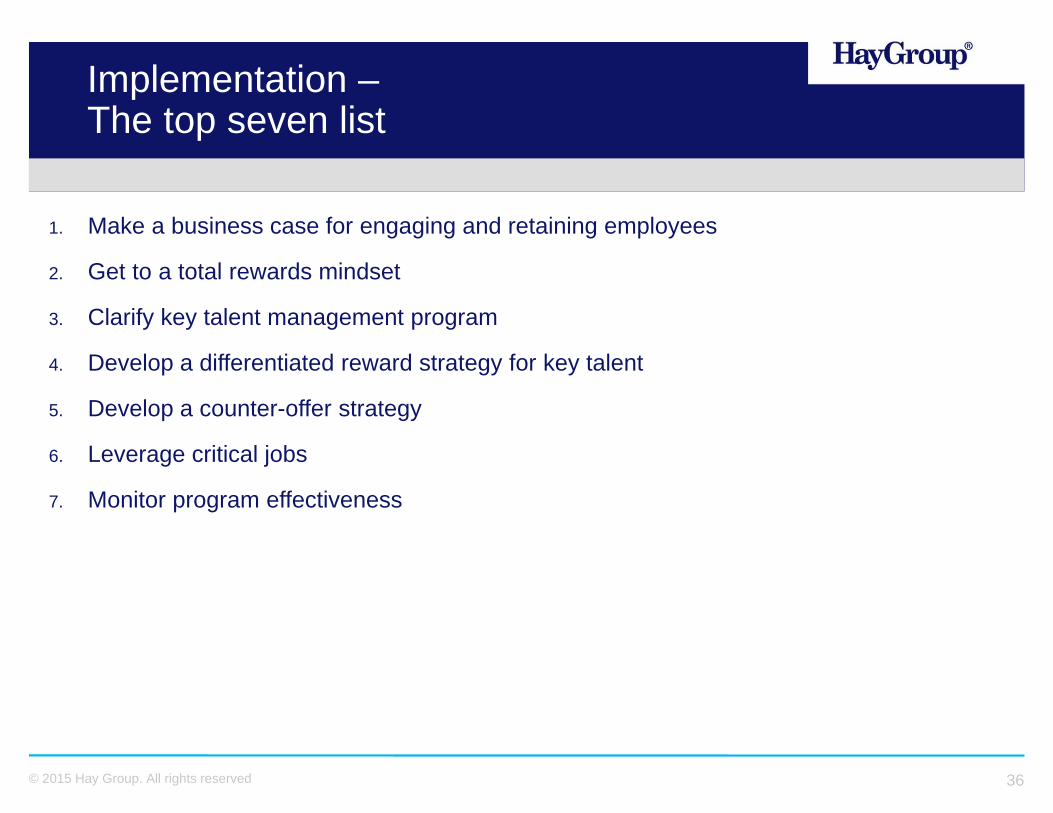
Implementation –The top seven list
1. Make a business case for engaging and retaining employees
2. Get to a total rewards mindset
3. Clarify key talent management program
4. Develop a differentiated reward strategy for key talent
5. Develop a counter-offer strategy
6. Leverage critical jobs
7. Monitor program effectiveness

37© 2015 Hay Group. All rights reserved
1. Make a business case for engaging and retaining employees
Educate management about the correlation between high engagement and hard business metrics
Educate management about cost of turnover to the company
Continually measure engagement and retention at your company

38© 2015 Hay Group. All rights reserved
Educate managers and employees about the total value proposition of working at your company
Develop tools for managers so they can effectively reward employees beyond the confines of compensation and benefits
Continually communicate the non-financial benefits of working at your company
2. Get to a total rewards mindset

39© 2015 Hay Group. All rights reserved
Develop clarity around what defines “key talent” and around the definition of “high potential,” specifically “potential for what?”
Identify governance structure and roles of corporate, BU and function leadership in key talent management processes
Ensure transparency in talent reviews and ensure a substantive role of functions to: Minimize sense of talent ownership by business Improve collaboration and calibration processes
Articulate top talent communications strategy Do we communicate status? Why? Why not? Identify the benefit and risks of communication Identify messages, messengers and mediums of communications
3. Clarify key talent management program

40© 2015 Hay Group. All rights reserved
4. Develop a differentiated reward strategy for key talent
Clarify reward strategy for key talent Determine degree of variation, if any, vs. other employee groups Include principles, design and communications Common programs include more aggressive base salary positioning, off-cycle pay
increase and restricted stock grants
Monitor performance and reward differentials for top talent vs. others to ensure appropriate differentiation Differentials across all cash reward elements Differentials in treatment across non-financial reward programs On a current year and multi-year (i.e., career income) basis

41© 2015 Hay Group. All rights reserved
5. Develop a counter-offer strategy
Develop a counter-offer strategy that consists of clarifying: The types of people/jobs that are eligible for counter-offers The role HR, management and senior management play The information to collect to formulate a counter-offer How to structure and communicate the counter-offer How to respond to other employees who may learn about the counter-offer How to limit the need for making counter-offers in the future
Recognize that work climate issues often trigger a search for a new job
Nonetheless, many counter-offer and retention strategies focus on pay increases, retention bonuses, and stock options
Ensure you have a good understanding of the real issues and take action on them
42© 2015 Hay Group. All rights reserved
6. Leverage critical jobs
Leverage the notion of a “critical job” or “accelerator experiences”
Clarify purposes, application and process of a critical job
Align top talent management with management of critical job post; clarifying eligibility requirement on who can assume a critical job
Develop principles around job evaluation “lean forward” or “grandfather” situations (e.g., eligibility, decision rights, time windows, communications)

43© 2015 Hay Group. All rights reserved
7. Monitor program effectiveness
Measure program effectiveness
Develop criteria for program effectiveness assessment
Involve top talent in developing the strategy and evaluation of top talent
Common measures include: Velocity of key talent through the pipeline Growing the amount of key talent in the organization Retention rate of top talent
Active involvement of CEO and C-suite is a key program enabler

44© 2015 Hay Group. All rights reserved
About Hay Group
Hay Group has consulted with 10,000 clients worldwide in a wide variety of areas, including:
Organizationaleffectiveness
Managerial and executive assessment
Compensation and benefits
Performance management
Executive remuneration and corporate governance
Employee and customer attitude research
89Offices in 47 countries (10 in NA)
2800+Employees worldwide
10,000International clients

45© 2015 Hay Group. All rights reserved
Contact Information
Ron [email protected](c) 510.285.7436
www.haygroup.com