attachment d.3 details of the loading operations incl ... statement dredging at port of cork ... the...
TRANSCRIPT

POC Maintenance Dredging Application | January 2014
Attachment D.3 Details of the Loading Operations incl.
Dredging Method Statement, Total Loading Quantities & Water Injection Dredging Tracer
Study by Van Oord (July 2012)
For in
spec
tion p
urpo
ses o
nly.
Conse
nt of
copy
right
owne
r req
uired
for a
ny ot
her u
se.
EPA Export 27-01-2014:23:27:23
Project Management Plan
Project: Cork Maintenance Dredging Contract Page: 1 of 22Project no 20.3432 Revision date: 12-Dec-2013
Client Port of Cork Reference: GOO
This document remains intellectual property of Van Oord UK Ltd and may not be published or distributed without written consent fromowner.
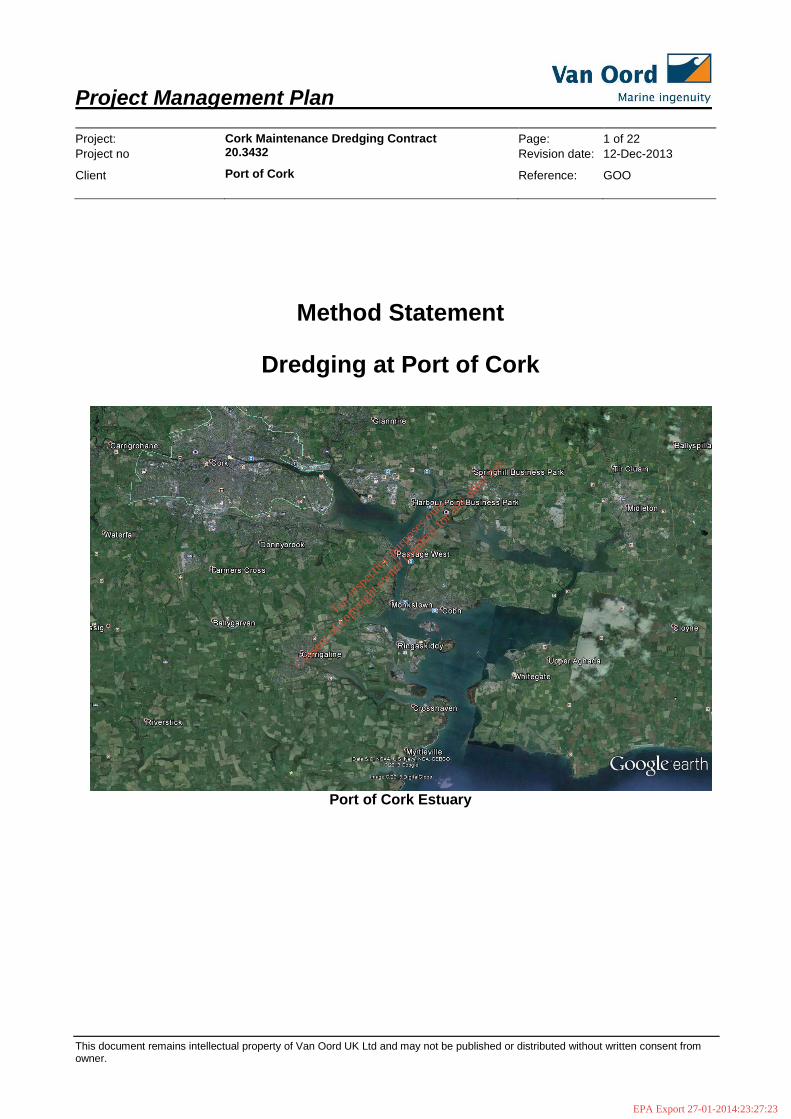
Method Statement
Dredging at Port of Cork
Port of Cork Estuary
For
insp
ectio
n pur
pose
s only
.
Conse
nt of
copy
right
owne
r req
uired
for a
ny ot
her u
se.
EPA Export 27-01-2014:23:27:23

Project Management Plan
Project: Cork Maintenance Dredging Contract Page: 2 of 22Project no 20.3432 Revision date: 12-Dec-2013
Client Port of Cork Reference: GOO
This document remains intellectual property of Van Oord UK Ltd and may not be published or distributed without written consent fromowner.
IMPORTANT
Any changes to working methods not identified within this method statement, will involve cessation of theworks until a full risk assessment has been conducted on these changes and the method statement has beenaltered accordingly to reflect these changes. Advice from the QHSE Department should also be sought onthese changes.
Revision record
Revision Number Description Date1.0 First Issue 02-12-2011
2.0 Updated MS for 2014 campaign 12-12-2014
Supporting documents
Document Number Document Name
PMP-20.3432 Project Management Plan Maintenance Port of Cork
Function Initials Date SignaturePrepared by Farrell McCullough FMC 12-Dec-2013
Verified by Farrell McCullough FMC 12-Dec-2013
Approved by Godfried van Oord GOO 12-Dec-2013
Authorized by Maurits den Broeder MAU 12-Dec-2013
Document owner Staff Manager QHSE
For in
spec
tion p
urpo
ses o
nly.
Conse
nt of
copy
right
owne
r req
uired
for a
ny ot
her u
se.
EPA Export 27-01-2014:23:27:23

Project Management Plan
Project: Cork Maintenance Dredging Contract Page: 3 of 22Project no 20.3432 Revision date: 12-Dec-2013
Client Port of Cork Reference: GOO
This document remains intellectual property of Van Oord UK Ltd and may not be published or distributed without written consent fromowner.
Distribution list
Denis Healy [Port of Cork]
Kevin O’Callaghan [Port of Cork]
Harbour / Survey offices [Port of Cork]
William Brown [RPS Group]
Maurits den Broeder [Van Oord - MD]
Godfried van Oord [Van Oord - OM]
Farrell McCullough [Van Oord - WM]
Jeanette Wright [Van Oord – QHSE]
Master & crew of HAM 316/HAM 317, Jetsed/Odin [Van Oord]
Newbury Operations (hardcopy) [Van Oord]
AbbreviationsHSE Health, Safety and EnvironmentITP Inspection and Test PlanMS Method StatementPPE Personal Protective EquipmentQA/QCCDMDOMPMWMSIKpWIDTSHDRACOSHHEMSIMSISMISPSPMPIRENLPEP
Quality Assurance / Quality ControlChart DatumManaging DirectorOperations ManagerProject ManagerWorks ManagerSuperintendentKilometer point/ChainageWater Injection DredgingTrailing Suction Hopper DredgerRisk AssessmentControl of Substances Hazardous to HealthEnvironmental Management SystemIntegrated Management SystemInternational Safety ManagementInternational Ship and Port Facility Security CodeProject Management PlanIrelandThe NetherlandsProject Emergency Plan
Definitions
n/a
For
insp
ectio
n pur
pose
s only
.
Conse
nt of
copy
right
owne
r req
uired
for a
ny ot
her u
se.
EPA Export 27-01-2014:23:27:23

Project Management Plan
Project: Cork Maintenance Dredging Contract Page: 4 of 22Project no 20.3432 Revision date: 12-Dec-2013
Client Port of Cork Reference: GOO
This document remains intellectual property of Van Oord UK Ltd and may not be published or distributed without written consent fromowner.
Table of ContentsREVISION RECORD ........................................................................................................................ 2SUPPORTING DOCUMENTS .......................................................................................................... 2DISTRIBUTION LIST........................................................................................................................ 31. INTRODUCTION ....................................................................................................................... 5
1.1 General Project Description ............................................................................................................... 51.2 Scope of this Document ..................................................................................................................... 51.3 Responsibilities ................................................................................................................................... 6
2. HEALTH, SAFETY & ENVIRONMENT...................................................................................... 72.1 Health and safety ................................................................................................................................. 72.2 Personnel ............................................................................................................................................. 72.3 Reporting of incidents and near misses ........................................................................................... 82.4 Emergency response .......................................................................................................................... 82.5 Risk assessment.................................................................................................................................. 82.6 Environment ......................................................................................................................................... 82.7 Pre-Check Procedure .......................................................................................................................... 82.8 Training ................................................................................................................................................. 9
3. SCOPE OF WORKS................................................................................................................ 103.1 Scope of Works..................................................................................................................................103.2 Resources ..........................................................................................................................................10
3.2.1 Personnel ...................................................................................................................... 103.2.2 Vessels .......................................................................................................................... 103.2.3 Commencement Date and Duration............................................................................. 10
4. EXECUTION OF THE WORKS ............................................................................................... 114.1 Mobilisation and Demobilisation .............................................................................................. 114.2. General Description of Dredge activities by a Trailing Suction Hopper Dredger........................... 11
4.2.1. Loading the TSHD ........................................................................................................ 134.2.2. Sailing Full ................................................................................................................... 134.2.3. Unloading the TSHD through bottom doors / valves.................................................. 134.2.4. Sailing Empty............................................................................................................... 14
4.3. Survey ...............................................................................................................................................144.4. Work Method .....................................................................................................................................14
4.4.1. Work Method................................................................................................................ 144.4.2 Weather Conditions.................................................................................................. 14
5. ASSISTING EQUIPMENT FOR THE TSHD ............................................................................ 165.1 Scope of Works: ................................................................................................................................165.2 Sequence of Works: ..........................................................................................................................165.3 Programme .........................................................................................................................................165.4 Limitations..........................................................................................................................................16
6. EQUIPMENT ........................................................................................................................... 176.1 Equipment for maintenance dredge [TSHD] ...................................................................................176.2 Equipment for maintenance dredge [WID]......................................................................................19
7. SURVEY.................................................................................................................................. 21
APPENDIX 1 .................................................................................................................................. 22
For
insp
ectio
n pur
pose
s only
.
Conse
nt of
copy
right
owne
r req
uired
for a
ny ot
her u
se.
EPA Export 27-01-2014:23:27:23

Project Management Plan
Project: Cork Maintenance Dredging Contract Page: 5 of 22Project no 20.3432 Revision date: 12-Dec-2013
Client Port of Cork Reference: GOO
This document remains intellectual property of Van Oord UK Ltd and may not be published or distributed without written consent fromowner.
1. Introduction
1.1 General Project Description
The Port of Cork Company has awarded Van Oord ac ontract for the Maintenance Dredging in Corkfor a 7 year period. The interval between campaigns is expected to be 3 years and the firstcampaign was in 2011. This involves the dredging of silt, clay, loose and hard compacted sand andgravel and other materials, including some debris normally encountered in the execution ofMaintenance Dredging contracts.
1.2 Scope of this Document
The purpose of this Method Statement is to give an adequate description of the dredging, disposal and surveymethods to be followed and the precautions to be aware of in carrying out the works. This Method Statementwill ensure that the works will be carried out in a safe, secure and efficient way. The Risk Assessment is partof this Method Statement and should be seen as a ‘live’ document which will be altered if there is any changein circumstances or knowledge
The sequence of operations described in this document is governed by weather and tidal conditions.
This Method Statement has developed and will be implemented with the health and safety and welfare of allpersonnel, the public, wild life and the environment being of utmost priority.
The contents of this Method Statement are to be verbally communicated to the workforce involved bythe Project Manager the day prior to the task commencing, this ensures that the correct personnel,tools and equipment are in place and gives enough time for suggestions or additional controlmeasures identified during the briefing to be included within the Method Statement, prior to the taskcommencing on each location.
The Method Statement will then be re-briefed in the form of a toolbox talk on the day of the activity, to ensurethat the requirements are fully understood. Feedback from the workforce is encouraged
This Method Statement is to be read in conjunction with the Project Management Plan
For
insp
ectio
n pur
pose
s only
.
Conse
nt of
copy
right
owne
r req
uired
for a
ny ot
her u
se.
EPA Export 27-01-2014:23:27:23

Project Management Plan
Project: Cork Maintenance Dredging Contract Page: 6 of 22Project no 20.3432 Revision date: 12-Dec-2013
Client Port of Cork Reference: GOO
This document remains intellectual property of Van Oord UK Ltd and may not be published or distributed without written consent fromowner.
1.3 ResponsibilitiesThe achievement of a satisfactory standard of quality is the responsibility of all those assigned to the project.The description of the responsibilities involved in the management of the site project team is provided in thetable below.
The following site staff have the following responsibilities: Operations Manager Overall responsibility for ensuring safe working systems and control; Works Manager: Coordination of the works, and the work related operations; Superintendent: Coordination of the works, liaise with Captain/crew; Surveyor: Responsible for all surveying work, contractual and requested.
QHSE RepresentativeJeanette Wright
ContractsManager
Project SafetyTo be advised Surveyor
Van Oord tba
Operations ManagerGodfried van Oord
Works ManagersFarrell McCullough
Matthew Hellyer
Equipment Crew/ Superintendent
Van Oord Ireland Project TeamDredging of Port of Cork
Van Oord UK - MDMaurits den Broeder
Port of Cork (Client)Denis Healy
For
insp
ectio
n pur
pose
s only
.
Conse
nt of
copy
right
owne
r req
uired
for a
ny ot
her u
se.
EPA Export 27-01-2014:23:27:23

Project Management Plan
Project: Cork Maintenance Dredging Contract Page: 7 of 22Project no 20.3432 Revision date: 12-Dec-2013
Client Port of Cork Reference: GOO
This document remains intellectual property of Van Oord UK Ltd and may not be published or distributed without written consent fromowner.
2. Health, Safety & Environment
Van Oord will execute all works in line with Contract requirements, UK legislation, European, and InternationalGuidelines and Standards. In view of the potential hazards for this type of work in these circumstances and inaddition to the project related procedures, special attention is drawn to, but not limited to, the following:
2.1 Health and safetyIn order to arrange, provide and maintain safe systems of work for all employees at all times:
Areas of HSE responsibility will be clearly defined and relayed to the whole project team; Adequate and proper facilities, equipment and apparatus will be provided and its correct use will be
ensured, Through training, all areas are to be kept clean and tidy and personnel will be responsible forensuring their equipment is stored correctly at all times.
Adequate training, instruction and information on Site specific Health, Safety and Environmentalhazards and risks will be provided.
A pro-active approach will be taken to Health, Safety and the Environment at all times, hazard spotsand near miss reporting will encouraged throughout the duration of the project and any incidents willbe investigated ensuring that procedures and / or RAMS are updated appropriately.
2.2 PersonnelAll construction personnel involved in the work will observe the following basic working rules, amongst others:
Relevant personnel protective equipment (PPE) will be issued and used prior to thecommencement of the work;
PPE shall be worn at all times on site with exception of the dedicated safe area(s) andwelfare facilities;
Proper training and induction in the various roles for the type of activity will be performed; Experienced and active supervision will be in place at all work times.
At least the following PPE should be worn to execute the works as described in this Method Statement:
Hi-Viz Safety Shoes Helmet Life Jacket
The indicated PPE should be worn at all times, excluding when inside the ships accommodation area.
The Life Jacket Must be worn when working near open water where no sufficient handrail or edge protection ispresent or when accessing / egressing the vessel
For
insp
ectio
n pur
pose
s only
.
Conse
nt of
copy
right
owne
r req
uired
for a
ny ot
her u
se.
EPA Export 27-01-2014:23:27:23

Project Management Plan
Project: Cork Maintenance Dredging Contract Page: 8 of 22Project no 20.3432 Revision date: 12-Dec-2013
Client Port of Cork Reference: GOO
This document remains intellectual property of Van Oord UK Ltd and may not be published or distributed without written consent fromowner.
2.3 Reporting of incidents and near missesIncidents and near misses will be timely reported in compliance Van Oord corporate procedure.
2.4 Emergency responseEmergency Response will be in compliance with Van Oord corporate procedure and the project EmergencyResponse Plan which is on board the dredger.
Before the start of the Project an actual plan with actual names and numbers will be made and provided to allconcerned.
2.5 Risk assessmentRisk assessments will be carried out in order to identify and control all hazards to the activities and toassociate the risk and/or reduce it to acceptable levels. The risk assessment for this method statement can befound in appendix 1.
2.6 EnvironmentIn order to minimize environmental impacts arisen from the work based on ecological knowledge and onregulatory background the following measures will be taken:
All personnel will be appropriately trained about environmental issues prior to the start of theoperation;
All equipment will be in good condition to avoid spillage or discharge of oil, smoke andexcessive noise;
Refuelling will be carried out by competent and trained people away from anyenvironmentally sensitive areas; and dredger to be moored up securely.
An appropriate waste container will be placed to collect waste before the final disposal byauthorised company and hazardous material storage areas will be identified, labelled, andproperly marked and fitted with spill containment systems;
Dredger will be checked for any fuel / oil leaks on a regular basis by the crew. Any spills we be reported immediately to the site agent/authorities In the event of a major spill due to damage to the dredger. Locate and isolate, inform
harbour authorities, Project manager and environmental agency.
2.7 Pre-Check Procedure
Prior to commencing operations, all vessels, plant and machinery will hold relevant up-to-date certification,carry sufficient emergency oil spill kits, first aid kits and be more than adequate for their respectiveresponsibilities.
Weather reports, both long and short range, will be available on a daily basis.
All relevant stakeholders will be informed of all operational movements
Prior to commencing operations, Port Control will be contacted daily to confirm the number andextent of other ongoing works by third party contractors within the Outer Harbour area. The location,type and extent of these works will be assessed and included as part of the Risk Assessment.
For
insp
ectio
n pur
pose
s only
.
Conse
nt of
copy
right
owne
r req
uired
for a
ny ot
her u
se.
EPA Export 27-01-2014:23:27:23

Project Management Plan
Project: Cork Maintenance Dredging Contract Page: 9 of 22Project no 20.3432 Revision date: 12-Dec-2013
Client Port of Cork Reference: GOO
This document remains intellectual property of Van Oord UK Ltd and may not be published or distributed without written consent fromowner.
2.8 TrainingAll personnel will be competent, experienced and hold all relevant certifications, a copy of which will be heldon the site files. VOUK will provide further training, as and when required. Safe working methods will berelayed to all personnel through RAMS Briefings and toolbox talks, this will also take place following anyrevisions and changes to the RAMS
For
insp
ectio
n pur
pose
s only
.
Conse
nt of
copy
right
owne
r req
uired
for a
ny ot
her u
se.
EPA Export 27-01-2014:23:27:23

Project Management Plan
Project: Cork Maintenance Dredging Contract Page: 10 of 22Project no 20.3432 Revision date: 12-Dec-2013
Client Port of Cork Reference: GOO
This document remains intellectual property of Van Oord UK Ltd and may not be published or distributed without written consent fromowner.
3. Scope of Works
3.1 Scope of Works
Maintenance dredging has to be carried out in the berths, on the approaches to the berths, in navigationalchannels and the harbour basins in the Port of Cork, all as is shown on the layout drawings and tablesreceived from the client.
The (river-)bottom in the designated areas shall be dredged to ensure that the design depths are providedthroughout the above described area. The design depths will be the advertised depth plus a specifiedadditional buffer depth to cater for future siltation
The method of dredging and transporting material shall be such as to avoid deposition of material in navigablechannels.
3.2 Resources3.2.1 Personnel
Site Staff:- WM- Surveyor
Equipment- Safe manning [as a minimum] + required for dredging. On request a Crewlist can be provided
3.2.2 Vessels
- TSHD HAM 316 or HAM 317 [or similar]- WID Jetsed and/or Odin [or similar]
Technical specifications can be found in 6
3.2.3 Commencement Date and Duration
Sept/Oct 2014 [subject to license and equipment/projectplanning]
For
insp
ectio
n pur
pose
s only
.
Conse
nt of
copy
right
owne
r req
uired
for a
ny ot
her u
se.
EPA Export 27-01-2014:23:27:23

Project Management Plan
Project: Cork Maintenance Dredging Contract Page: 11 of 22Project no 20.3432 Revision date: 12-Dec-2013
Client Port of Cork Reference: GOO
This document remains intellectual property of Van Oord UK Ltd and may not be published or distributed without written consent fromowner.
4. Execution of the Works
4.1 Mobilisation and Demobilisation
The TSHD which will be made available will be scheduled to arrive in Cork at a mutually agreed startdate. Prior to arrival the Harbour Master will be informed and all required documents will be submitted.
When the TSHD arrives in the Port of Cork, the survey department will board the vessel to install thenecessary survey equipment (if required) and the latest survey information from the insurvey.
The Project Manager will also board the vessel for an Kick-off meeting / Toolbox talk
4.2. General Description of Dredge activities by a Trailing Suction Hopper Dredger
A Trailing Suction Hopper Dredger is a vessel that is suited for deep-sea navigation with the ability to loadmaterial into its own hopper by means of centrifugal pump(s) and suction pipe(s). Figure 1 shows a possiblelayout of a TSHD.
Trailing Suction Hopper Dredgers belong to the type of non-stationary dredgers. This means that TSHD arerequired to sail during dredging operations.
Figure 1 TSHD HAM 317
When the Trailing Suction Hopper Dredger approaches the dredging area, at the start of a newdredging cycle, the TSHD will reduce its speed and will put the trailing suction pipes overboard
During the approach the suction heads at the end of the trailing suction pipes will be kept a couple ofmetres above the seabed until the indicated dredging area has been reached. Once close to theindicated dredging area the dredge pumps will be started. The dredge pumps will start taking inseawater through the trailing suction pipes. The seawater that will be taken in prior to the suction
For
insp
ectio
n pur
pose
s only
.
Conse
nt of
copy
right
owne
r req
uired
for a
ny ot
her u
se.
EPA Export 27-01-2014:23:27:23

Project Management Plan
Project: Cork Maintenance Dredging Contract Page: 12 of 22Project no 20.3432 Revision date: 12-Dec-2013
Client Port of Cork Reference: GOO
This document remains intellectual property of Van Oord UK Ltd and may not be published or distributed without written consent fromowner.
heads touching the soil, will be pumped overboard again or in some cases remains in the hopper.
As soon as the suction heads touch the seabed and bottom material is sucked through the suctionheads and trailing pipes, the dredger operator will divert the soil mixture into the hopper by closingthe pump overboard valve, thus avoiding spillage of dredged material.
During dredging the TSHD will sail with a speed around 1 to 3 knots, depending on the dredgelocation, surrounding marine activities, sea conditions and soil parameters. Due to the speed of theTSHD the suction heads will loosen the bottom material. In this way a mixture of soil and water iscreated that than can be sucked trough the suction heads, into the TSHD's own hopper. Water jetsor teeth (or both), which may be constructed in the suction heads, can assist in loosening the soil,hence optimising the production.
The material to be dredged will be stripped of the bottom in layers over the full width of thedredging area.
The position of the suction head and the trailing suction pipe can be monitored by checking thefollowing measurements:
- Measuring the pitch, heave and roll of the vessel in combination with the draught andtrim of the vessel;
- Measuring the angles of the different parts of the trailing suction pipes and suctionheads relative to a horizon with angle metres;
- Measuring the depths of the different parts of the trailing suction pipes by usingpressure readings from specially installed sensors.
As a backup system an open end thin tube from the start of the trailing suction pipe down to thesuction head is installed, through which air can be pumped under pressure. The air pressure at theexact moment bubbles appear gives an indication for the dredging depth.
The measurements as mentioned above make that the TSHD is more or less able to determine howdeep and under what angle the suction head is used while dredging. These measurements will alsogive an indication to the dredging operator in which way the profiles and depths already have beenreached.
The production of a TSHD depends on many factors, among which: soil characteristics (in-situ density,particle distribution, SPT and/or CPT values, etc...), dredging depth, weather conditions, sailing distances,marine traffic, tides, currents, etc
A dredging cycle manly exists of the following 4 consecutive operations
Loading Average trailing speed 1 to 3 knots, depending on the soil type;Sailing Full Average speed from 1 knot to maximum sailing speed, depending on wind, swell,
current, weather conditions, keel clearance and sailing distance;Unloading Average speed from 0 knot to 3 knots sailing speed, depending on the soil type,
wind, swell, current, weather conditions and keel clearance;Sailing empty Average speed from 1 knot to maximum sailing speed, depending on wind, swell,
current, weather conditions, keel clearance and sailing distance;
For
insp
ectio
n pur
pose
s only
.
Conse
nt of
copy
right
owne
r req
uired
for a
ny ot
her u
se.
EPA Export 27-01-2014:23:27:23

Project Management Plan
Project: Cork Maintenance Dredging Contract Page: 13 of 22Project no 20.3432 Revision date: 12-Dec-2013
Client Port of Cork Reference: GOO
This document remains intellectual property of Van Oord UK Ltd and may not be published or distributed without written consent fromowner.
The different steps in the dredging cycle are further elaborated in paragraphs 4.2.1 to 4.2.4
The time to complete on full cycle depends on:- The dredging time required for filling up the hopper and the load per trip will vary depending
on soil parameters, dredging depths and other circumstances.;- The sailing time, both full and empty, depend on traffic speed limits, currents, tides,
weather conditions, sailing distances and route to the unloading area, etc...;- The unloading time depends mainly on soil characteristics.
TSHD operates 24/7
4.2.1. Loading the TSHD
The maximum volume of dredged material a TSHD can load in its hopper depends mainly on the size of thehopper and the soil characteristics of the dredged material. The same volume of dredged material can differ inweight depending on the dredge location, caused by different soil characteristics. Due to the limitations involume and weight a TSHD can carry, the maximum volume of dredged material that can be loaded dependson the volume weight of the dredged material. The TSHD will start loading dredged material into its hopperuntil the maximum volume or the maximum weight has been reached, whatever comes first.
To control the dredging position, the TSHD is equipped with a RTK-DGPS system. The TSHD is alsoequipped with an automatic suction head control system to ensure a correct dredging depth.
During dredging generally, in soft materials the drag head sinks into the soil and with a slow forwardmovement a high concentration of materials can be lifted. In firmer materials the penetration depth is lessand a greater forward speed is required to maintain a sufficient high concentration of material.
Since the dredge pumps feeds the hopper with a diluted soil / water mixture, the soil will settle in the hopperand the excess water will be discharged via an overflow. Loading can be continued until the vessel's draughtreaches the load mark or until other circumstances do not allow for further loading. When dredging lightmaterials, such as silt, difficulties may arise in the settling of the dredged material in the hopper. Under thesecircumstances, the hopper capacity is usually increased by raising the overflow.
When the hopper is fully loaded, the suction head is lifted from the bottom and the pumping system isturned off. The suction pipes will be hoisted on deck and secured onboard.
4.2.2. Sailing Full
After loading, the TSHD leaves the dredging area and proceeds to the area where the load will beunloaded. During sailing the hopper remains closed with all valves shut.
4.2.3. Unloading the TSHD through bottom doors / valves
On arrival, at the discharge location, the speed of the TSHD is reduced and the vessel is carefully positionedin the middle of the disposal area. When the TSHD is positioned in the correct position the bottom valves areopened. All material is now discharged from the hopper in a very controlled short period.
For
insp
ectio
n pur
pose
s only
.
Conse
nt of
copy
right
owne
r req
uired
for a
ny ot
her u
se.
EPA Export 27-01-2014:23:27:23

Project Management Plan
Project: Cork Maintenance Dredging Contract Page: 14 of 22Project no 20.3432 Revision date: 12-Dec-2013
Client Port of Cork Reference: GOO
This document remains intellectual property of Van Oord UK Ltd and may not be published or distributed without written consent fromowner.
Unloading trough the bottom doors / valves of the TSHD can only be done if the water depth at theunloading area surpasses a minimum depth. When the required minimum depth is not available or hasbeen reached the water depth will be too shallow for the TSHD to sail / unload its next load through thebottom doors / valves.
4.2.4. Sailing EmptyWhen the hopper of the TSHD has been emptied the TSHD will set course again to the dredging location.When the dredger arrives at the dredging location, the entire dredging cycle can start over new.
4.3. SurveyFor more detailed information on the survey work reference is made to the Method Statement Survey
4.4. Work Method4.4.1. Work MethodThe area to be dredged is spread over the Port of Cork Estuary, from the City of Cork up to Ringaskiddy.
During the last dredging campaign the bulk of material was located between Black rock and LoughMahon. Therefore the TSHD Ostsee used to turn around at Tivoli.
However for this dredging campaign, due to the spread of the material, the TSHD will turn when the vessel is fullyloaded. This can be a problem in certain places where the width of the channel is limited. Therefore the dredgingsequence will be governed by tide and ship movements, e.g.: If the TSHD is going to be fully loaded half way up thelock, inbound, then it will need sufficient water to turn around in the channel wherever the TSHD will be at thatmoment. This will need to be on a flood tide. If there are shipping movements ongoing maybe the TSHD will have togo all the way up to Tivoli to turn as there is insufficient room to pass in the channel. The officer of watch will need tomake the decision each time they return form the dumping area as to where the vessel can commence dredging.
The following areas have to be dredged:
To be advised by client based on the insurvey to be done prior to the works.
City berths Tivoli berths Channel/Fairway Ringaskiddy basin and deepwater berth Turning circle Hauibowline Marino Point
Prior to start dredging Van Oord UK will meet with the Client to discuss points of concern, e.g. removal ofchannel buoys to allow unrestricted access for the dredger.
4.4.2 Weather Conditions
The dredging operation can be carried out during fair weather.
Limiting sea states for dredging and sand supply works are defined as Hs (significant wave height) ofapproximately 1.50 metres and wind speeds of approximately 6 Beaufort.
It should be noted that wave direction, wave period, wind direction, presence of currents and combinations of
For
insp
ectio
n pur
pose
s only
.
Conse
nt of
copy
right
owne
r req
uired
for a
ny ot
her u
se.
EPA Export 27-01-2014:23:27:23

Project Management Plan
Project: Cork Maintenance Dredging Contract Page: 15 of 22Project no 20.3432 Revision date: 12-Dec-2013
Client Port of Cork Reference: GOO
This document remains intellectual property of Van Oord UK Ltd and may not be published or distributed without written consent fromowner.
these will influence the limiting sea states significantly.The Master of the Vessel will determine when conditions are such that the works have to be suspended or canbe recommenced.
During periods of weather delay the TSHD can decide to go for anchorage. This anchorage can be outside thework site and not necessarily be in a harbour.
Weather forecasts will be available on a daily basis.
For
insp
ectio
n pur
pose
s only
.
Conse
nt of
copy
right
owne
r req
uired
for a
ny ot
her u
se.
EPA Export 27-01-2014:23:27:24

Project Management Plan
Project: Cork Maintenance Dredging Contract Page: 16 of 22Project no 20.3432 Revision date: 12-Dec-2013
Client Port of Cork Reference: GOO
This document remains intellectual property of Van Oord UK Ltd and may not be published or distributed without written consent fromowner.
5. Assisting equipment for the TSHD
Van Oord Ireland Ltd is the operator of the dredging system known as Water Injection Dredging. The WaterInjection Dredging system is unique. The silt is -in this case partially- re-liquefied by low-pressure injection ofwater. The layer thus formed is a liquid denser than water, which flows under the forces of nature present inthe area, and for the works above, the gravitational force of the bed slope. Within the confines of the area, thelayer formed will flow principally under the gravitational force of the bed slope only. For the works above theWID technique will be used for areas which are difficult to access by the TSHD, the WID will dredge thematerial towards an area where the TSHD can collect this material.
5.1 Scope of Works:
To clear accumulated silts and fine sands in conjunction with the TSHD from the - by TSHD - difficult to reachdredge areas and towline dredging by use of our Water Injection Dredger Jetsed and/or Odin to the requireddepths.
5.2 Sequence of Works:
Mobilization:The dredger will be mobilised to Cork and the survey will be installed on board the dredger.
24 hours prior to arrival Port Control will be informed about the ETA of the dredger [under tow in case of theJetsed and by lorries in case the Odin will be used]
Dredging Operations
The objective is to remove silts and fine sand in conjunction with the TSHD. The WID unit will prepare thedredge area for the TSHD by sweeping material out of berth boxes and near and under fenders/jetties.
5.3 ProgrammeThe dredging programme will be to work on a 6 hour working window and 6 hours off for the crew.
On daily basis a daily report will be submitted, a copy of the track plots per tide will be submitted as well.
5.4 LimitationsBig rocks or boulders and/or debris can’t be removed by using the water injection dredger but will be markedon the survey if applicable and can be dredged [to a certain limit by the TSHD].
For
insp
ectio
n pur
pose
s only
.
Conse
nt of
copy
right
owne
r req
uired
for a
ny ot
her u
se.
EPA Export 27-01-2014:23:27:24
Project Management Plan
Project: Cork Maintenance Dredging Contract Page: 17 of 22Project no 20.3432 Revision date: 12-Dec-2013
Client Port of Cork Reference: GOO
This document remains intellectual property of Van Oord UK Ltd and may not be published or distributed without written consent fromowner.
6. Equipment
6.1 Equipment for maintenance dredge [TSHD]
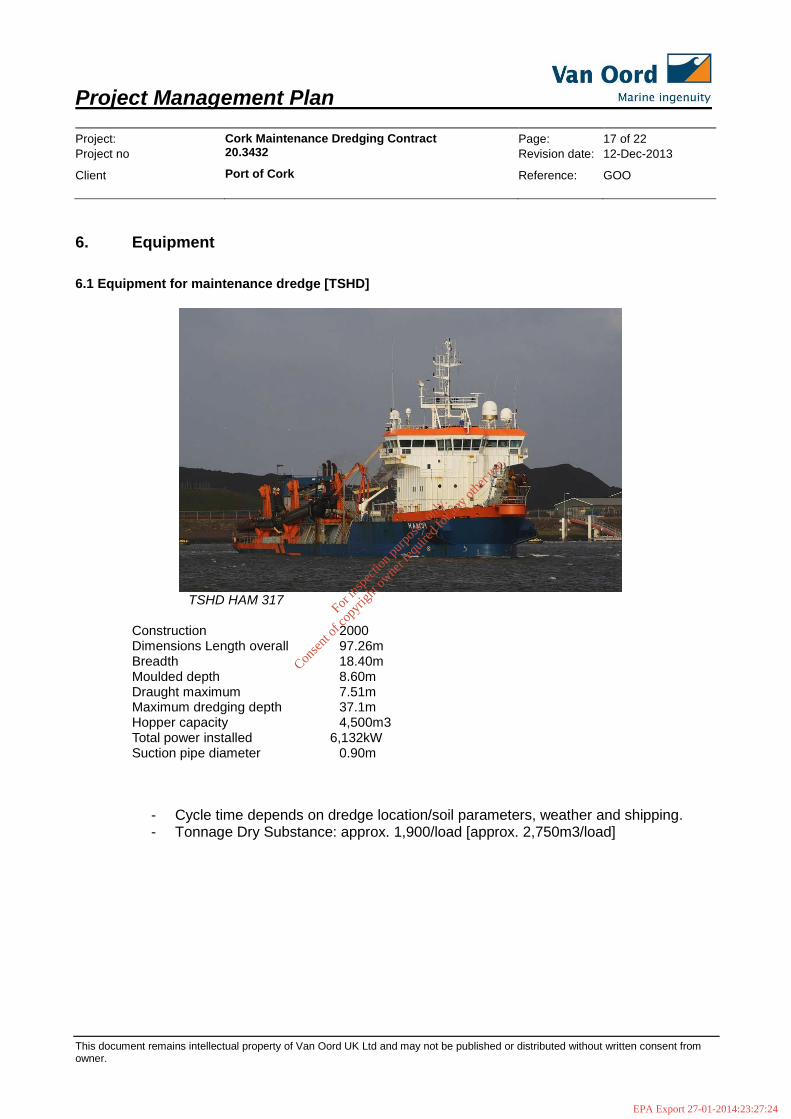
TSHD HAM 317
Construction 2000Dimensions Length overall 97.26mBreadth 18.40mMoulded depth 8.60mDraught maximum 7.51mMaximum dredging depth 37.1mHopper capacity 4,500m3Total power installed 6,132kWSuction pipe diameter 0.90m
- Cycle time depends on dredge location/soil parameters, weather and shipping.- Tonnage Dry Substance: approx. 1,900/load [approx. 2,750m3/load]
For
insp
ectio
n pur
pose
s only
.
Conse
nt of
copy
right
owne
r req
uired
for a
ny ot
her u
se.
EPA Export 27-01-2014:23:27:24

Project Management Plan
Project: Cork Maintenance Dredging Contract Page: 18 of 22Project no 20.3432 Revision date: 12-Dec-2013
Client Port of Cork Reference: GOO
This document remains intellectual property of Van Oord UK Ltd and may not be published or distributed without written consent fromowner.
TSHD HAM 316
Construction 1998Dimensions Length overall 128.46mBreadth 22.05mMoulded depth 10.00mDraught maximum 9.93mMaximum dredging depth 40.3mHopper capacity 9,535m3Total power installed 11,890kWSuction pipe diameter 1.10m
- Cycle time depends on dredge location/soil parameters, weather and shipping.- Tonnage Dry Substance: approx. 4,000/load [approx. 8,250m3/load]
For
insp
ectio
n pur
pose
s only
.
Conse
nt of
copy
right
owne
r req
uired
for a
ny ot
her u
se.
EPA Export 27-01-2014:23:27:24

Project Management Plan
Project: Cork Maintenance Dredging Contract Page: 19 of 22Project no 20.3432 Revision date: 12-Dec-2013
Client Port of Cork Reference: GOO
This document remains intellectual property of Van Oord UK Ltd and may not be published or distributed without written consent fromowner.
6.2 Equipment for maintenance dredge [WID]
WID dredger ‘Jetsed’
Name: JetsedConstruction 1987Dimensions Length overall 37.34mBreadth 13.85mMoulded depth 13.80mDraught maximum 1.40mMaximum dredging depth 24.90mWidth injection pipe 13.40mPropulsion 3 x 1x265kW; 1x380kW and 1x364kWTotal power installed 1,971kWJet pumps 1x452kW and 1x400kW
For
insp
ectio
n pur
pose
s only
.
Conse
nt of
copy
right
owne
r req
uired
for a
ny ot
her u
se.
EPA Export 27-01-2014:23:27:24
Project Management Plan
Project: Cork Maintenance Dredging Contract Page: 20 of 22Project no 20.3432 Revision date: 12-Dec-2013
Client Port of Cork Reference: GOO
This document remains intellectual property of Van Oord UK Ltd and may not be published or distributed without written consent fromowner.
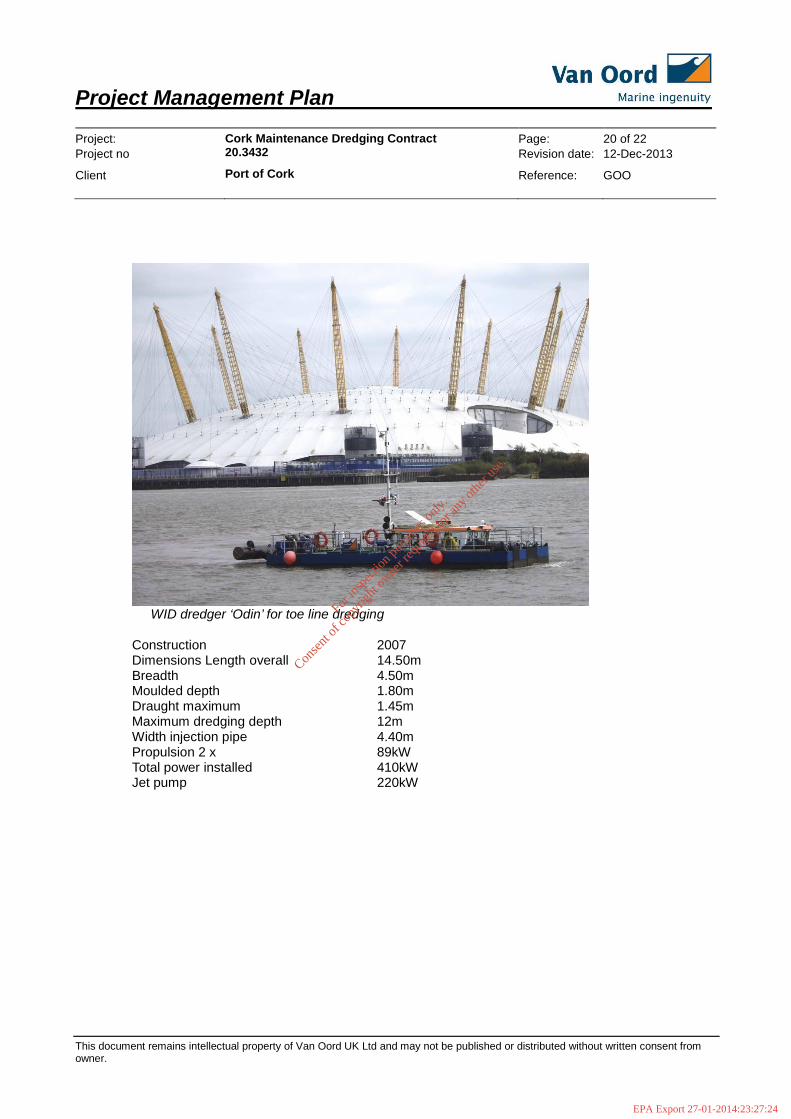
WID dredger ‘Odin’ for toe line dredging
Construction 2007Dimensions Length overall 14.50mBreadth 4.50mMoulded depth 1.80mDraught maximum 1.45mMaximum dredging depth 12mWidth injection pipe 4.40mPropulsion 2 x 89kWTotal power installed 410kWJet pump 220kW
For
insp
ectio
n pur
pose
s only
.
Conse
nt of
copy
right
owne
r req
uired
for a
ny ot
her u
se.
EPA Export 27-01-2014:23:27:24

Project Management Plan
Project: Cork Maintenance Dredging Contract Page: 21 of 22Project no 20.3432 Revision date: 12-Dec-2013
Client Port of Cork Reference: GOO
This document remains intellectual property of Van Oord UK Ltd and may not be published or distributed without written consent fromowner.
7. Survey
A separate Method Statement for the survey works has been submitted and is applicable for the duration ofthe contract. Any updates required will be submitted prior to the commencement of the works.
For
insp
ectio
n pur
pose
s only
.
Conse
nt of
copy
right
owne
r req
uired
for a
ny ot
her u
se.
EPA Export 27-01-2014:23:27:24

Project Management Plan
Project: Cork Maintenance Dredging Contract Page: 22 of 22Project no 20.3432 Revision date: 12-Dec-2013
Client Port of Cork Reference: GOO
This document remains intellectual property of Van Oord UK Ltd and may not be published or distributed without written consent fromowner.
Appendix 1
For
insp
ectio
n pur
pose
s only
.
Conse
nt of
copy
right
owne
r req
uired
for a
ny ot
her u
se.
EPA Export 27-01-2014:23:27:24

Project Name: Port of Cork Maintenance DredgingProject stage: Maintenance Dredging
Project no:20.3432 RA document number: SM 001
Revision / Date: 13-Dec-2013 rev. 2.0Prep:FMC Authorised: GOO Reference: Page 1 of 1 pages
Document number: VOMS-PR1.10-TE-01Prepared by: QHSERev. 1, 13-10-2011
Attendees:Name Job Company Name Job CompanyRA chairman:
Farrell McCulloughGodfried van Oordtba
Works ManagerOperations ManagerSurveyor
Van OordVan OordVan Oord
Crew TSHD/WID
Itemno.
Activity Hazard ConsequenceInitialRisk Van Oord Existing
Safeguards
AdditionalSafeguard
Vessel / ProjectBy Completion
Reference
ResidualRisk
S L R S L R
Working on or nearwater on board thevessel
Insufficientbarriers,Edge protection.
Falling in water causingHypothermia/drowning 4C
Barriers to beinspected prior towork.Experienced crew.Kick off meetingbefore works.Emergency rescueplan in place forMOB.Regular serviced lifejackets while ondeck.
No lone working.Sand/salt for non-slipdecks.
FMC 2C
For
insp
ectio
n pur
pose
s only
.
Conse
nt of
copy
right
owne
r req
uired
for a
ny ot
her u
se.
EPA Export 27-01-2014:23:27:24

Project Name: Port of Cork Maintenance DredgingProject stage: Maintenance Dredging
Project no:20.3432 RA document number: SM 001
Revision / Date: 13-Dec-2013 rev. 2.0Prep:FMC Authorised: GOO Reference: Page 1 of 1 pages
Document number: VOMS-PR1.10-TE-01Prepared by: QHSERev. 1, 13-10-2011
Itemno.
Activity Hazard ConsequenceInitialRisk Van Oord Existing
Safeguards
AdditionalSafeguard
Vessel / ProjectBy Completion
Reference
ResidualRisk
S L R S L R
Dredging Unsafe workingpractise 4D
Project plan.Method statement.Risk assessments.QHSE monitored.Emergencyprocedures.Emergency phone listGood maintenance.Competent crew.Professionalequipment.
Van Oord QHSE FMC 2C
Not using orincorrect use oflife jacket.
Falling in watercausinghypothermia/drowning
4B
Correct wearing oflife jacket.Training in use.Inspect before use bycompetent person.Annualinspection(tested).
Inspect before use. FMC 2B
Working on or nearwater on board thevessel.
Using electrictools & cominginto contact withwater.
Electrocution 3ASafety line on toolbeing used. Use tools only when
tied up alongside. FMC 1A
For
insp
ectio
n pur
pose
s only
.
Conse
nt of
copy
right
owne
r req
uired
for a
ny ot
her u
se.
EPA Export 27-01-2014:23:27:24

Project Name: Port of Cork Maintenance DredgingProject stage: Maintenance Dredging
Project no:20.3432 RA document number: SM 001
Revision / Date: 13-Dec-2013 rev. 2.0Prep:FMC Authorised: GOO Reference: Page 1 of 1 pages
Document number: VOMS-PR1.10-TE-01Prepared by: QHSERev. 1, 13-10-2011
Itemno.
Activity Hazard ConsequenceInitialRisk Van Oord Existing
Safeguards
AdditionalSafeguard
Vessel / ProjectBy Completion
Reference
ResidualRisk
S L R S L R
Access & Egressonto jetty.Using a ladder
Falling in water causinghypothermia/drowninghead/minor injury
4C
Use ladder in correctway.Only step across ifsafe to do so.Make clearinstruction of yourintentions to othercrew member.Wear life jacket.
Moore up on floatingpontoons(so noclimbing).
FMC 2C
Working on or nearwater on board thevessel
Working on deckat night
Falling in water causinghypothermia/drowninghead/minor injury 3B
Adequate lighting.Crew work together.Goodhousekeeping(cleandecks).Competent crew.Monitoring of waterlevels.First aider on board.Good radiocommunications.Avoid working ondeck at night.
Stay in wheelhouse atnight.Only moore up whenalongside.
FMC 2B
For
insp
ectio
n pur
pose
s only
.
Conse
nt of
copy
right
owne
r req
uired
for a
ny ot
her u
se.
EPA Export 27-01-2014:23:27:24
Project Name: Port of Cork Maintenance DredgingProject stage: Maintenance Dredging
Project no:20.3432 RA document number: SM 001
Revision / Date: 13-Dec-2013 rev. 2.0Prep:FMC Authorised: GOO Reference: Page 1 of 1 pages
Document number: VOMS-PR1.10-TE-01Prepared by: QHSERev. 1, 13-10-2011
Itemno.
Activity Hazard ConsequenceInitialRisk Van Oord Existing
Safeguards
AdditionalSafeguard
Vessel / ProjectBy Completion
Reference
ResidualRisk
S L R S L R
Working on or nearwater on board thevessel
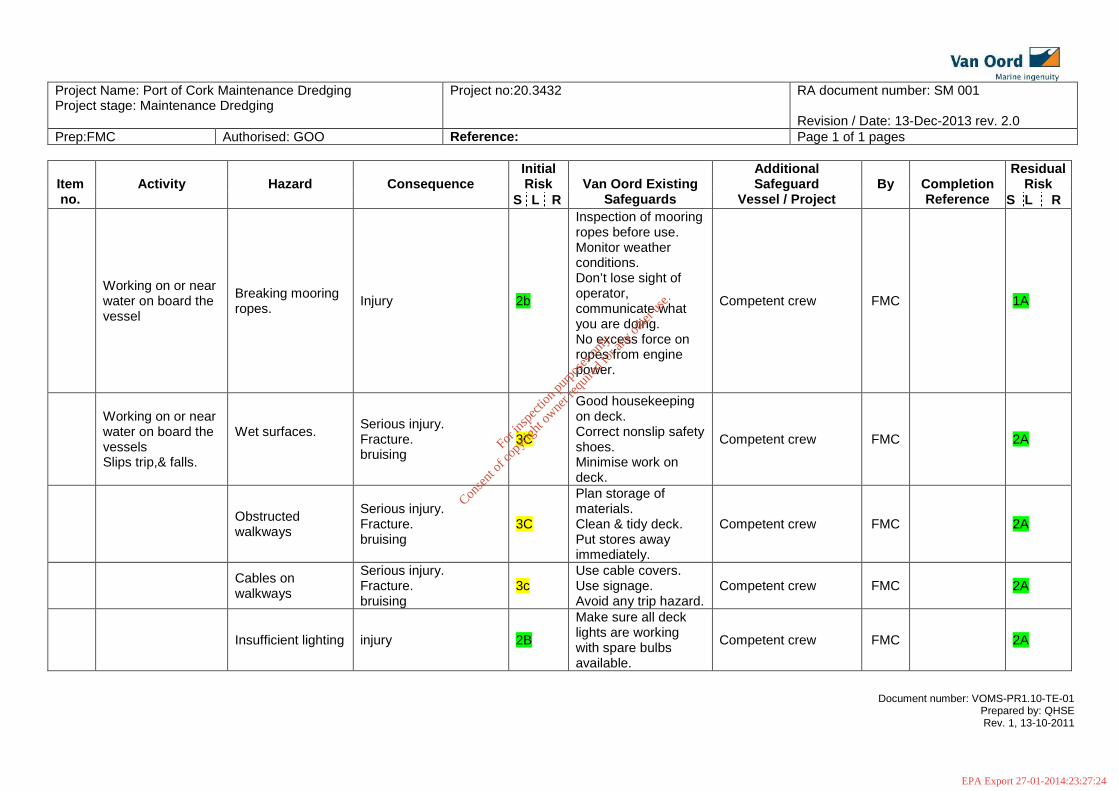
Breaking mooringropes. Injury 2b
Inspection of mooringropes before use.Monitor weatherconditions.Don’t lose sight ofoperator,communicate whatyou are doing.No excess force onropes from enginepower.
Competent crew FMC 1A
Working on or nearwater on board thevesselsSlips trip,& falls.
Wet surfaces. Serious injury.Fracture.bruising
3C
Good housekeepingon deck.Correct nonslip safetyshoes.Minimise work ondeck.
Competent crew FMC 2A
Obstructedwalkways
Serious injury.Fracture.bruising
3C
Plan storage ofmaterials.Clean & tidy deck.Put stores awayimmediately.
Competent crew FMC 2A
Cables onwalkways
Serious injury.Fracture.bruising
3cUse cable covers.Use signage.Avoid any trip hazard.
Competent crew FMC 2A
Insufficient lighting injury 2B
Make sure all decklights are workingwith spare bulbsavailable.
Competent crew FMC 2A
For
insp
ectio
n pur
pose
s only
.
Conse
nt of
copy
right
owne
r req
uired
for a
ny ot
her u
se.
EPA Export 27-01-2014:23:27:24

Project Name: Port of Cork Maintenance DredgingProject stage: Maintenance Dredging
Project no:20.3432 RA document number: SM 001
Revision / Date: 13-Dec-2013 rev. 2.0Prep:FMC Authorised: GOO Reference: Page 1 of 1 pages
Document number: VOMS-PR1.10-TE-01Prepared by: QHSERev. 1, 13-10-2011
Itemno.
Activity Hazard ConsequenceInitialRisk Van Oord Existing
Safeguards
AdditionalSafeguard
Vessel / ProjectBy Completion
Reference
ResidualRisk
S L R S L R
Working on or nearwater on board thevesselSlips trip,& falls.
Inappropriatefootwear.
Serious injuryFalling overboard 3B Safety shoes are
compulsorySafety shoes renewedon request. FMC 2B
Greasy / oilysurfaces
Serious injury.Fracture.bruising
3B
Clean spillagesimmediately.Spill kits available.Good housekeeping.Degreaser available.Report all spillages.
Clean tidy decks FMC 2B
Tripping over.Catching looseclothing on deck.Edge protectionnot in place.Ice.Not payingattention.
Serious injury.Fracture.bruising
3b
Barriers inspecteddaily.Competent persons.Toolbox talk on slipstrip & falls.No lone working.Emergency rescueplan in place.Clean decks.Good lighting.Serviced life jacketsworn.Monitor weatherconditions.No loose clothing.Wear overalls.
Salt bags on standbyfor cold weather. FMC 2b
For in
spec
tion p
urpo
ses o
nly.
Conse
nt of
copy
right
owne
r req
uired
for a
ny ot
her u
se.
EPA Export 27-01-2014:23:27:24

Project Name: Port of Cork Maintenance DredgingProject stage: Maintenance Dredging
Project no:20.3432 RA document number: SM 001
Revision / Date: 13-Dec-2013 rev. 2.0Prep:FMC Authorised: GOO Reference: Page 1 of 1 pages
Document number: VOMS-PR1.10-TE-01Prepared by: QHSERev. 1, 13-10-2011
Itemno.
Activity Hazard ConsequenceInitialRisk Van Oord Existing
Safeguards
AdditionalSafeguard
Vessel / ProjectBy Completion
Reference
ResidualRisk
S L R S L R
Wire handling Hand injury 3b
Wear gloves.No lone working.Inspect wire for anydeficiencies.
Avoid any wire work. FMC 2b
Working on or nearwater on board thevesselTidal works
Lone working.Stress.Lack of sleep.
Antisocial behaviour.Ill health.Lack of performance.Lack of concentration. 3b
No lone working.Agreed hours ofwork.6 hours off work in-between tides.Take breaks (shareoperating).Health assessments.
Keep working hours toa minimum for crew.Crew works 14 dayson 14 days off
FMC 2b
Working in verycold conditions. Hypothermia Time off work 2c
Wrap up warm ondeck.Hat & gloves.Take regular breaksin heated wheelhouse.Take extra care ondeck.Don’t rush.
Monitor weather FMC 2b
For
insp
ectio
n pur
pose
s only
.
Conse
nt of
copy
right
owne
r req
uired
for a
ny ot
her u
se.
EPA Export 27-01-2014:23:27:24

Project Name: Port of Cork Maintenance DredgingProject stage: Maintenance Dredging
Project no:20.3432 RA document number: SM 001
Revision / Date: 13-Dec-2013 rev. 2.0Prep:FMC Authorised: GOO Reference: Page 1 of 1 pages
Document number: VOMS-PR1.10-TE-01Prepared by: QHSERev. 1, 13-10-2011
Itemno.
Activity Hazard ConsequenceInitialRisk Van Oord Existing
Safeguards
AdditionalSafeguard
Vessel / ProjectBy Completion
Reference
ResidualRisk
S L R S L R
Working on or nearwater on board thevesselNoise
Over exposure tonoise inengine/pumproom.
Tinnitus.Ringing in ear.Loss of hearing. 2c
Use ear defenders.Noise monitoring.Display signs.No more than 5minutes exposure.
No going in engineroom or pump roomwhile working. FMC 1b
Manual handling Lifting heavy itemsSevere back pain.Muscle pain.Lifelong back pain.
3b
Wear possible uselifting aid.Manual handlingtraining to crew.Know the weight youare lifting.Can you spilt the loadto smaller weights.No trip hazardspresent.Avoid repetitivehandling.
Competent crew FMC 2b
For
insp
ectio
n pur
pose
s only
.
Conse
nt of
copy
right
owne
r req
uired
for a
ny ot
her u
se.
EPA Export 27-01-2014:23:27:24

Project Name: Port of Cork Maintenance DredgingProject stage: Maintenance Dredging
Project no:20.3432 RA document number: SM 001
Revision / Date: 13-Dec-2013 rev. 2.0Prep:FMC Authorised: GOO Reference: Page 1 of 1 pages
Document number: VOMS-PR1.10-TE-01Prepared by: QHSERev. 1, 13-10-2011
Itemno.
Activity Hazard ConsequenceInitialRisk Van Oord Existing
Safeguards
AdditionalSafeguard
Vessel / ProjectBy Completion
Reference
ResidualRisk
S L R S L R
Manual handling Lifting heavy itemsin wrong way.
Severe back pain.Muscle pain.Lifelong back pain.
3b
Instructions of correctlifting method.Use mechanical aidwear possible.Make sure no fingerscan get trapped.No obstructions inway.Good handles onitem to be lifted.Do not push or pullload that’s heavy.Do not lift if history ofback problems.
Competent crew FMC 2b
For
insp
ectio
n pur
pose
s only
.
Conse
nt of
copy
right
owne
r req
uired
for a
ny ot
her u
se.
EPA Export 27-01-2014:23:27:24

Project Name: Port of Cork Maintenance DredgingProject stage: Maintenance Dredging
Project no:20.3432 RA document number: SM 001
Revision / Date: 13-Dec-2013 rev. 2.0Prep:FMC Authorised: GOO Reference: Page 1 of 1 pages
Document number: VOMS-PR1.10-TE-01Prepared by: QHSERev. 1, 13-10-2011
Itemno.
Activity Hazard ConsequenceInitialRisk Van Oord Existing
Safeguards
AdditionalSafeguard
Vessel / ProjectBy Completion
Reference
ResidualRisk
S L R S L R
COSHH Hazardoussubstances.
Fire & explosion.Exposure.Inhalation of toxicsubstances.Contact with skin.
3b
All substances storedin well ventilated &lockable containers.Signage in place.Fire extinguishers inplace.COSHHassessments for allon board chemicalsavailable.No smoking signs.Appropriate PPEavailable.Crew aware of what& wear on board.Spill kits on stand bywhile refuelling.Stop any leakage inwater course usingspill kits.
FMC 2b
For
insp
ectio
n pur
pose
s only
.
Conse
nt of
copy
right
owne
r req
uired
for a
ny ot
her u
se.
EPA Export 27-01-2014:23:27:24
Project Name: Port of Cork Maintenance DredgingProject stage: Maintenance Dredging
Project no:20.3432 RA document number: SM 001
Revision / Date: 13-Dec-2013 rev. 2.0Prep:FMC Authorised: GOO Reference: Page 1 of 1 pages
Document number: VOMS-PR1.10-TE-01Prepared by: QHSERev. 1, 13-10-2011
Itemno.
Activity Hazard ConsequenceInitialRisk Van Oord Existing
Safeguards
AdditionalSafeguard
Vessel / ProjectBy Completion
Reference
ResidualRisk
S L R S L R
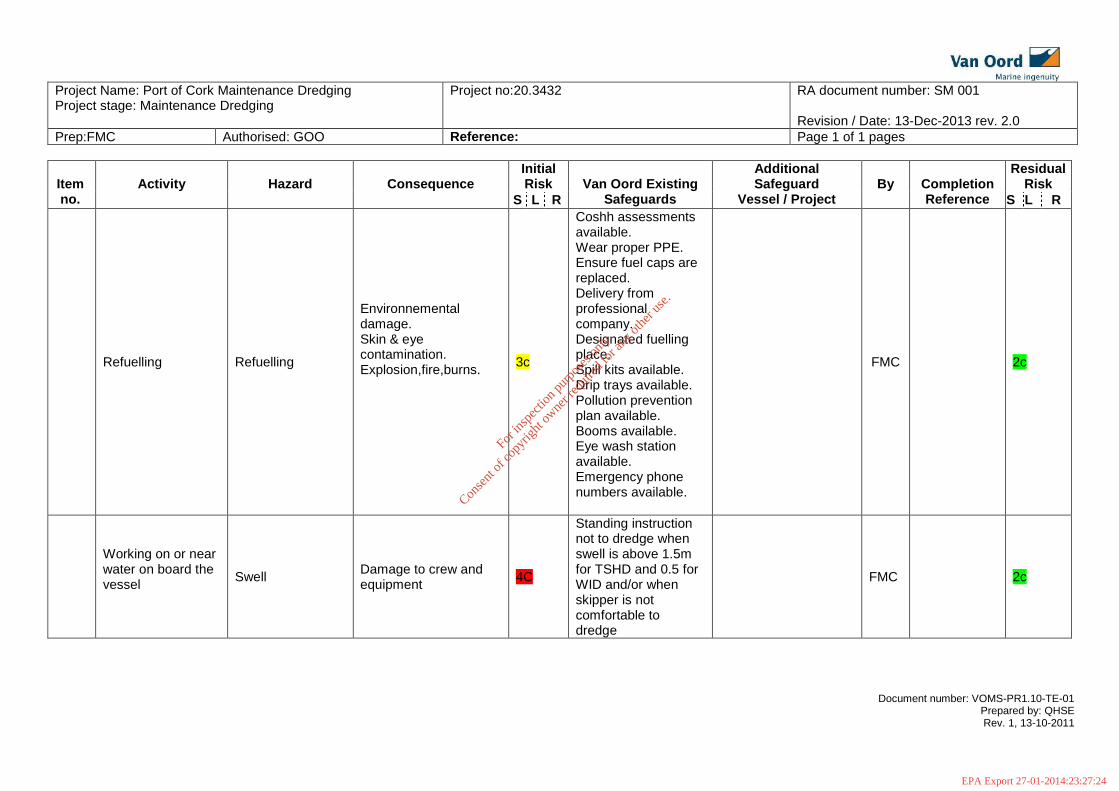
Refuelling Refuelling
Environnementaldamage.Skin & eyecontamination.Explosion,fire,burns. 3c
Coshh assessmentsavailable.Wear proper PPE.Ensure fuel caps arereplaced.Delivery fromprofessionalcompany.Designated fuellingplace.Spill kits available.Drip trays available.Pollution preventionplan available.Booms available.Eye wash stationavailable.Emergency phonenumbers available.
FMC 2c
Working on or nearwater on board thevessel Swell Damage to crew and
equipment 4C
Standing instructionnot to dredge whenswell is above 1.5mfor TSHD and 0.5 forWID and/or whenskipper is notcomfortable todredge
FMC 2c
For
insp
ectio
n pur
pose
s only
.
Conse
nt of
copy
right
owne
r req
uired
for a
ny ot
her u
se.
EPA Export 27-01-2014:23:27:24

Project Name: Port of Cork Maintenance DredgingProject stage: Maintenance Dredging
Project no:20.3432 RA document number: SM 001
Revision / Date: 13-Dec-2013 rev. 2.0Prep:FMC Authorised: GOO Reference: Page 1 of 1 pages
Document number: VOMS-PR1.10-TE-01Prepared by: QHSERev. 1, 13-10-2011
Itemno.
Activity Hazard ConsequenceInitialRisk Van Oord Existing
Safeguards
AdditionalSafeguard
Vessel / ProjectBy Completion
Reference
ResidualRisk
S L R S L R
Shipping
Collision/interference shipping withdredgingoperations
Damage to crew andequipment and portfacilities
3c
Stay in contact withPort Control via VHF.Especially duringdredging the berths,extra care should betaken.
Dredging in anotherarea as directed byport control in case ofshipping
HM/Port Control toprovide an dailyupdate aboutexpected shipmovements that day
FMC 2c
Others Live Document
For
insp
ectio
n pur
pose
s only
.
Conse
nt of
copy
right
owne
r req
uired
for a
ny ot
her u
se.
EPA Export 27-01-2014:23:27:24

Port of Cork Maintenance Dredging Application
Volumes / Tonnages Being Applied For
For Each Main Campaign years 2014, 2017 and 2020 For Each Interim Campaign years 2015 & 2016 then 2018 & 2019
Main Loading Areas by Trailer Suction Hopper Dredging Trigger Areas / Berths by Bed Levelling / Water Injection
Location Volume (m 3 ) Wet Tonnage (t) Location Volume (m 3 ) Wet Tonnage (t)City Quays Horgan's Wharf 4,100 4,510 Confluence of North and South Channels total below total belowCity Quays North Deepwater Quay 2,200 2,420 Blackrock Castle Bend total below total belowCity Quays Albert Quay 1,250 1,375 Ringaskiddy Approach Basin total below total belowCity Quays South Jetties 5,750 6,325City Quays South Deepwater Quay 1,250 1,375 Local Access Dredge Areas by Bed Levelling / Water InjectionBottom of Lough 67,600 74,360Tivoli Quigley Berth 5,000 5,500 Location Volume (m 3 ) Wet Tonnage (t)Tivoli Container Berth 750 825 Ringaskiddy Slipway and Pier total below total belowTivoli RoRo Berth 1,250 1,375 NMCI Loading Area and Drop Pool total below total belowTivoli Oil Jetty 1,250 1,375 Cobh Boat Camber total below total belowLough to Passage 200,100 220,110Haulbowline Industries Berth 7,000 7,700 20,000 22,000Ringaskiddy Approach Basin 35,000 38,500Ringaskiddy Deepwater Slot 10,500 11,550 .shp files are provided for each of these locations as lines / areas individually to both ITM and WGS84Whitegate 3,000 3,300Passage to Roche's Point 6,000 6,600
352,000 387,200
.shp files are provided for each of these locations as areas individually to both ITM and WGS84
Breakdown of Quantities per Year
Year Volume (m 3 ) Wet Tonnage (t) Method of Dredging2014 352,000 387,200 Trailer Suction Hopper Dredging2015 20,000 22,000 Bed Levelling / Water Injection Dredging2016 20,000 22,000 Bed Levelling / Water Injection Dredging2017 352,000 387,200 Trailer Suction Hopper Dredging2018 20,000 22,000 Bed Levelling / Water Injection Dredging2019 20,000 22,000 Bed Levelling / Water Injection Dredging2020 352,000 387,200 Trailer Suction Hopper Dredging
Totals 1,136,000 1,249,600
For
insp
ectio
n pur
pose
s only
.
Conse
nt of
copy
right
owne
r req
uired
for a
ny ot
her u
se.
EPA Export 27-01-2014:23:27:24

Appendix A
Water Injection Dredging Tracer Study – Cork
Environmental Impact and Sediment Transport
Study Utilizing Fluorescent Particle Tracers
Final Report
July 2012
Van Oord
Submitted by:
ETS Worldwide Ltd
For
insp
ectio
n pur
pose
s only
.
Conse
nt of
copy
right
owne
r req
uired
for a
ny ot
her u
se.
EPA Export 27-01-2014:23:27:24

Water Injection Dredging Tracer Study – Cork. Environmental Impact and Sediment Transport Study
ETS Worldwide Ltd
1
AUDIT INFORMATION
Water Injection Dredging Tracer Study – Cork
Environmental Impact and Sediment Transport Study Utilizing Fluorescent
Particle Tracers
Final Report – Version 1.0
Client Name: Van Oord Dredging
Client Contact: Farrell McCullough
Project Director Dr. Jonathan Marsh
Project Manager Fraser Taylor
Fieldwork conducted by: - Fraser Taylor / Aquatic Marine
Report written by: - Dr. Jonathan Marsh / Isabel Labrador / Amy Parry
Data processing undertaken by: Fraser Taylor / Isabel Labrador
Report authorised by: - Dr. Jonathan Marsh
Date Issued: - 10 July 2012
Client: Farrell McCullough, Project Manager Van Oord UK Lockside Place, Mill Lane Newbury, Berkshire, RG14 5 QS
Tel: +44 1635 529101 Mob: +44 7860 928134 Fax: +44 1635 521548 Email: [email protected] Web: www.vanoord.com
Contractor: Dr. Jonathan Marsh, Managing Director ETS Worldwide Ltd The Coach House, Bannachra Helensburgh, G84 9EF Tel: 01389 711001 Fax: 01389 850551 Email: [email protected] Web: www.environmentaltracing.com
Certif icate No. GB2001513 Registration No. 0044/1
Institute of Quality Assurance
IQA Affiliated Organisation
INTERNATIONAL
ACCREDITATION BOARD
ISO 9001
REGISTERED FIRM
INTERNATIONAL
ACCREDITATION BOARD
This document is confidential. The copyright remains with ETS Worldwide Ltd, The Coach House, Bannachra, Helensburgh,
G84 8EF. All rights reserved. Neither the whole nor any part may be disclosed to any third party nor reproduced, stored in any retrieval system, or transmitted in any form nor by any means (electronic, mechanical, reprographic, recording or otherwise) without the prior written consent of ETS Ltd.
For
insp
ectio
n pur
pose
s only
.
Conse
nt of
copy
right
owne
r req
uired
for a
ny ot
her u
se.
EPA Export 27-01-2014:23:27:24

Water Injection Dredging Tracer Study – Cork. Environmental Impact and Sediment Transport Study
ETS Worldwide Ltd
2
Table of Contents
1. Introduction .................................................................................................................................... 5
2. Sediment Tracer Characteristics and Deployment .............................................................................. 7
2.1. Tracer Colour .......................................................................................................................... 7 2.2. Tracer Particle size .................................................................................................................. 7 2.3. Tracer Density ........................................................................................................................ 8 2.4. Tracer Mixing and Release ....................................................................................................... 9
3. Field Equipment and Methodology .................................................................................................. 12
3.1. Seabed Sampler .................................................................................................................... 12 3.2. Sampling Survey ................................................................................................................... 12
4. Data and Results ........................................................................................................................... 16
4.1. Magenta tracer results ........................................................................................................... 16 4.2. Yellow tracer results .............................................................................................................. 20
5. Summary of Results ...................................................................................................................... 23
6. Interpretation and Mass Budget Calculation .................................................................................... 25
References ........................................................................................................................................... 31
APPENDIX A Settling Velocity Tests ........................................................................................................ 32
APPENDIX B Laboratory and Tracer Analysis Methods ............................................................................. 34
B.1. Standard Laboratory Procedure .............................................................................................. 34 B.2. Sample Analysis Techniques .................................................................................................. 34 B.3. Controls and Replicate Analysis .............................................................................................. 36 B.4. Microscope Photographs ........................................................................................................ 36
For
insp
ectio
n pur
pose
s only
.
Conse
nt of
copy
right
owne
r req
uired
for a
ny ot
her u
se.
EPA Export 27-01-2014:23:27:24

Water Injection Dredging Tracer Study – Cork. Environmental Impact and Sediment Transport Study
ETS Worldwide Ltd
3
List of Figures
Figure 1.1. Study Area, Cork and Ringaskiddy ........................................................................................... 5
Figure 2.1. Release sites for the yellow and red tracers ........................................................................... 10
Figure 3.1. Van Veen Grab sampler ........................................................................................................ 12 Figure 3.2. Map of background sampling locations .................................................................................. 13
Figure 3.3. Map of sampling locations for Cork City and Ringaskiddy ........................................................ 15
Figure 4.1. Cork Round 1 Magenta Tracer silt fraction results per cm2 ...................................................... 18
Figure 4.2. Cork Round 2 and Ringaskiddy Round 1 Magenta Tracer silt fraction results per cm2 ................ 18 Figure 4.3. Cork Round 3 and Ringaskiddy Round 2 Magenta Tracer silt fraction results per cm2 ................ 19
Figure 4.4. Ringaskiddy Round 3 Magenta Tracer silt fraction results per cm2 ........................................... 19
Figure 4.5. Cork Round 2 and Ringaskiddy Round 2 Yellow Tracer silt fraction results per cm2 ................... 21 Figure 4.6. Cork Round 3 and Ringaskiddy Round 3 Yellow Tracer silt fraction results per cm2 ................... 22
Figure 4.7. Ringaskiddy Round 3 Yellow Tracer silt fraction results per cm2 .............................................. 22
Figure 5.1. Areas used for mass budget calculations ................................................................................ 26
Figure A.1. Cumulative silt only and silt and tracer composite weights retained over 240 minutes .............. 33 Figure A.2. Cumulative Magenta and Yellow silt-sized tracer counts per milligram retained over 240 minutes
.................................................................................................................................................... 33 Figure B.1. Fluorescence micrographs of the magenta tracer particles from actual samples under white light
(left) and fluorescence illumination (right) ...................................................................................... 37 Figure B.2. Fluorescence micrographs of the yellow tracer particles from actual samples under white light
(left) and fluorescence illumination (right). ..................................................................................... 37
For
insp
ectio
n pur
pose
s only
.
Conse
nt of
copy
right
owne
r req
uired
for a
ny ot
her u
se.
EPA Export 27-01-2014:23:27:24

Water Injection Dredging Tracer Study – Cork. Environmental Impact and Sediment Transport Study
ETS Worldwide Ltd
4
List of Tables
Table 2.1. Summary of particle size data for natural sediment and manufactured tracer .............................. 7
Table 2.2. Tracer release summary for Cork............................................................................................ 10
Table 2.3. Tracer release summary for Ringaskiddy ................................................................................. 11
Table 3. 1. Summary of Activities and calendar ....................................................................................... 14
For
insp
ectio
n pur
pose
s only
.
Conse
nt of
copy
right
owne
r req
uired
for a
ny ot
her u
se.
EPA Export 27-01-2014:23:27:24
Water Injection Dredging Tracer Study – Cork. Environmental Impact and Sediment Transport Study
ETS Worldwide Ltd
5
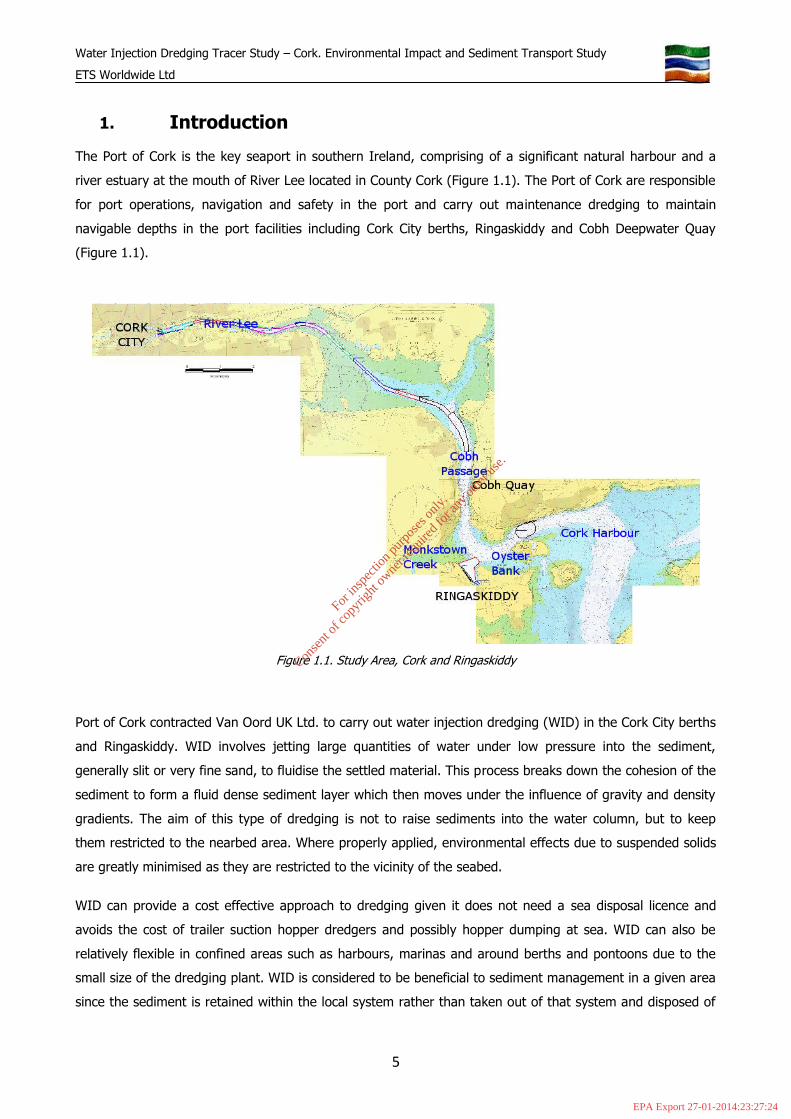
1. Introduction
The Port of Cork is the key seaport in southern Ireland, comprising of a significant natural harbour and a
river estuary at the mouth of River Lee located in County Cork (Figure 1.1). The Port of Cork are responsible
for port operations, navigation and safety in the port and carry out maintenance dredging to maintain
navigable depths in the port facilities including Cork City berths, Ringaskiddy and Cobh Deepwater Quay
(Figure 1.1).
Figure 1.1. Study Area, Cork and Ringaskiddy
Port of Cork contracted Van Oord UK Ltd. to carry out water injection dredging (WID) in the Cork City berths
and Ringaskiddy. WID involves jetting large quantities of water under low pressure into the sediment,
generally slit or very fine sand, to fluidise the settled material. This process breaks down the cohesion of the
sediment to form a fluid dense sediment layer which then moves under the influence of gravity and density
gradients. The aim of this type of dredging is not to raise sediments into the water column, but to keep
them restricted to the nearbed area. Where properly applied, environmental effects due to suspended solids
are greatly minimised as they are restricted to the vicinity of the seabed.
WID can provide a cost effective approach to dredging given it does not need a sea disposal licence and
avoids the cost of trailer suction hopper dredgers and possibly hopper dumping at sea. WID can also be
relatively flexible in confined areas such as harbours, marinas and around berths and pontoons due to the
small size of the dredging plant. WID is considered to be beneficial to sediment management in a given area
since the sediment is retained within the local system rather than taken out of that system and disposed of
For
insp
ectio
n pur
pose
s only
.
Conse
nt of
copy
right
owne
r req
uired
for a
ny ot
her u
se.
EPA Export 27-01-2014:23:27:24

Water Injection Dredging Tracer Study – Cork. Environmental Impact and Sediment Transport Study
ETS Worldwide Ltd
6
at sea, possibly in an area that does not have similar sediment properties to the maintenance dredge
material.
During dredging in the Port of Cork, Van Oord UK Ltd. and the Port of Cork commissioned bathymetric
surveys and suspended sediment monitoring. ETS Worldwide Ltd. (ETS) was contracted to undertake a
sediment tracer particle study to label and track the movement, deposition and ultimate fate of the WID
material from Cork City and Ringaskiddy. ETS has previously conducted nine similar WID studies throughout
the UK and Ireland including a study in County Waterford. ETS have also conducted over 85 sediment
transport studies worldwide over the past 20 years. ETS’ fluorescent tracer product has been included in
over 15 scientific papers and journals.
In order to assess the effects of WID in River Lee ETS released two tracers:
Magenta tracer was released during dredging at Cork City and monitored throughout the River Lee
downstream as far as Lough Mahon.
Yellow tracer was released during dredging at Ringaskiddy and was monitored in nearby
depositional areas, such as the Monkstown Creek mudflats, and environmentally-sensitive areas
such as Oyster Bank.
This document details:
Chapter 2: Tracer characteristics and release
Chapter 3: Field equipment and sampling methodology
Chapter 4: Results showing patterns of sediment tracer deposition of Magenta and Yellow tracers
including temporal and spatial distributions of tracer particles by size
Chapter 5: Discussion and conclusions.
For
insp
ectio
n pur
pose
s only
.
Conse
nt of
copy
right
owne
r req
uired
for a
ny ot
her u
se.
EPA Export 27-01-2014:23:27:24

Water Injection Dredging Tracer Study – Cork. Environmental Impact and Sediment Transport Study
ETS Worldwide Ltd
7
2. Sediment Tracer Characteristics and Deployment
2.1. Tracer Colour
In order to distinguish between the two different areas of dredging and the sediment re-distributed from
Cork City and Ringaskiddy, ETS manufactured two different fluorescent silt tracers. Magenta tracer was
released at Cork City and Yellow tracer was released at Ringaskiddy. The tracers were designed to mimic the
silt-size fraction re-distributed as a result of WID dredging in order to monitor the movement and fate of this
material spatially and temporally. To ensure this is achieved it is very important to make sure the tracer
particles match the natural sediments in terms of size, density and ultimately behaviour in terms of
flocculation and settling characteristics.
2.2. Tracer Particle size
Van Oord UK provided ETS with particle size data for the natural sediment for Cork City and Ringaskiddy
based on five samples; the data in microns (µm) are summarized in Table 2.1. Also detailed in Table 2.1 are
the particle size data for the silt tracer particles for each site. N.B. ETS only intended to mimic the silt
fraction of the dredged sediment for both sites, therefore to make the study and data comparable ETS
ensured that the tracer particles were similar in size.
Table 2.1. Summary of particle size data for natural sediment and manufactured tracer
Site D10 D50 D90
Ringaskiddy 3.8 14.2 65.6
Cork City 8.6 51.2 360.2
Magenta tracer
(Cork City) 4.0 12.0 62.3
Yellow tracer
(Ringaskiddy) 3.6 11.1 61.9
For
insp
ectio
n pur
pose
s only
.
Conse
nt of
copy
right
owne
r req
uired
for a
ny ot
her u
se.
EPA Export 27-01-2014:23:27:24

Water Injection Dredging Tracer Study – Cork. Environmental Impact and Sediment Transport Study
ETS Worldwide Ltd
8
The particle size data show that the Magenta tracer and Yellow tracer particles were very similar in particle
size to the sediment at Ringaskiddy, which was essentially silt. The particle size data for the sediment from
Cork City was coarser with very fine, fine and medium sand present in the sample. In ETS’ experience (Port
of London for example), the sand fraction is likely to be much less mobile during WID and disperse much
less in the environment and ETS and Van Oord UK Ltd were principally interested in the silt fraction only.
Based on the particle size tests carried out by Aquatec Services, the tracer material is representative for
90% of the dredged material in Ringaskiddy and 56% of the dredged material in Cork City.
2.3. Tracer Density
Both sediment tracers released had an identical sediment particle density of 2.65 g cm-³, equivalent to the
density of silica. Both batches of tracer particles were measured by an external accredited laboratory, Exova
(Glasgow, UK), following procedures set out in British Standard BS812. It is important to note, however, that
given the fact that ETS are releasing silt-sized tracer particles to mimic cohesive natural silt sediment, the
individual grain density becomes less important since electrochemical forces of the particles and flocculation
processes become more significant as they aggregate and settle and transport as loosely bound flocs. This is
particularly the case for cohesive sediment whereas for non-cohesive sand grains, the individual grain
density is a major factor in transport rates and processes.
2.3.1. Tracer particle charge, flocculation and settling characteristics
Having matched the particle size and density characteristics of the tracer particles, in order for the silt-sized
tracer particles to behave in the same way as the cohesive silty sediment, the primary need is to ensure that
the silt tracer particles have the same electrochemical charge as the natural sediment. This is achieved by
mixing the tracer particles with natural sediment prior to release, in order to ensure that the tracer particles
adsorb any available organics in the natural sediment. Electrophoretic mobility (or zeta potential) tests
carried out by ETS on many samples over several years, shows this adsorption process takes place in a
matter of seconds and that the tracer particles become incorporated and form within natural sediment flocs,
settling out in the water column. Therefore, the tracer particles act as a label of the natural sediment flocs
by being incorporated within them rather than a coating on a sediment grain, which could alter the grain
properties. As flocs are the principal carrier mechanism for suspended sediment transport, in particular in
many near-quiescent or low turbulence environments, by labelling the flocs, the tracers can be used to
understand the fate of sediment plumes and suspended sediment transport. If turbulence is higher then
sediment and tracer particles tend to form smaller more tightly-bound flocs or behave as individual grains
depending on the level of cohesiveness.
ETS carried out settling tests (as per Owen, 1970) (Appendix A), for natural sediment on its own and
sediment mixed with the tracer particles at concentrations similar to those expected in the field during the
dredging operations. The results confirmed that when the tracer particles were mixed with the natural
For
insp
ectio
n pur
pose
s only
.
Conse
nt of
copy
right
owne
r req
uired
for a
ny ot
her u
se.
EPA Export 27-01-2014:23:27:24

Water Injection Dredging Tracer Study – Cork. Environmental Impact and Sediment Transport Study
ETS Worldwide Ltd
9
sediment from the site, they flocculated and settled in a very similar way to the natural sediment without
tracer, indicating they do not affect the movement of the sediment and also behave in a very similar way
under laboratory conditions.
2.4. Tracer Mixing and Release
As previously described, Van Oord UK Ltd were proposing to dredge within two areas or sites; the upstream
area of the River Lee and Cork Harbour and the downstream area at Ringaskiddy. In order to assess the
movement and re-distribution of the sediment from WID in each area, ETS released magenta tracer in Cork
City and yellow tracer in Ringaskiddy as shown in Figure 2.1. In order to ensure that tracer was spread over
the entire area of dredging, the tracer particles were released in batches over several hours, at different
locations within the highlighted areas in Figure 2.1. The WID and tracer releases took place during ebb tide
conditions to ensure that the tracer particles were dispersed and transported downstream for each site away
from the dredge area.
ETS shipped the tracer particles in dry powder form and then “wetted” the material prior to release by
mixing the powder with seawater/river water in a large barrel with an electric drill and paddle. This
preliminary mixing prevents particles becoming airborne and contaminating the survey site, and facilitates
pumping of the tracer during release. Due to the interest and area of concern for material dredged in Cork
City and the extent of the sampling area principally covering Lough Mahon, ETS released 150 kg of Magenta
tracer in Cork City and 100 kg of Yellow tracer in Ringaskiddy since the area of interest was smaller.
For
insp
ectio
n pur
pose
s only
.
Conse
nt of
copy
right
owne
r req
uired
for a
ny ot
her u
se.
EPA Export 27-01-2014:23:27:24
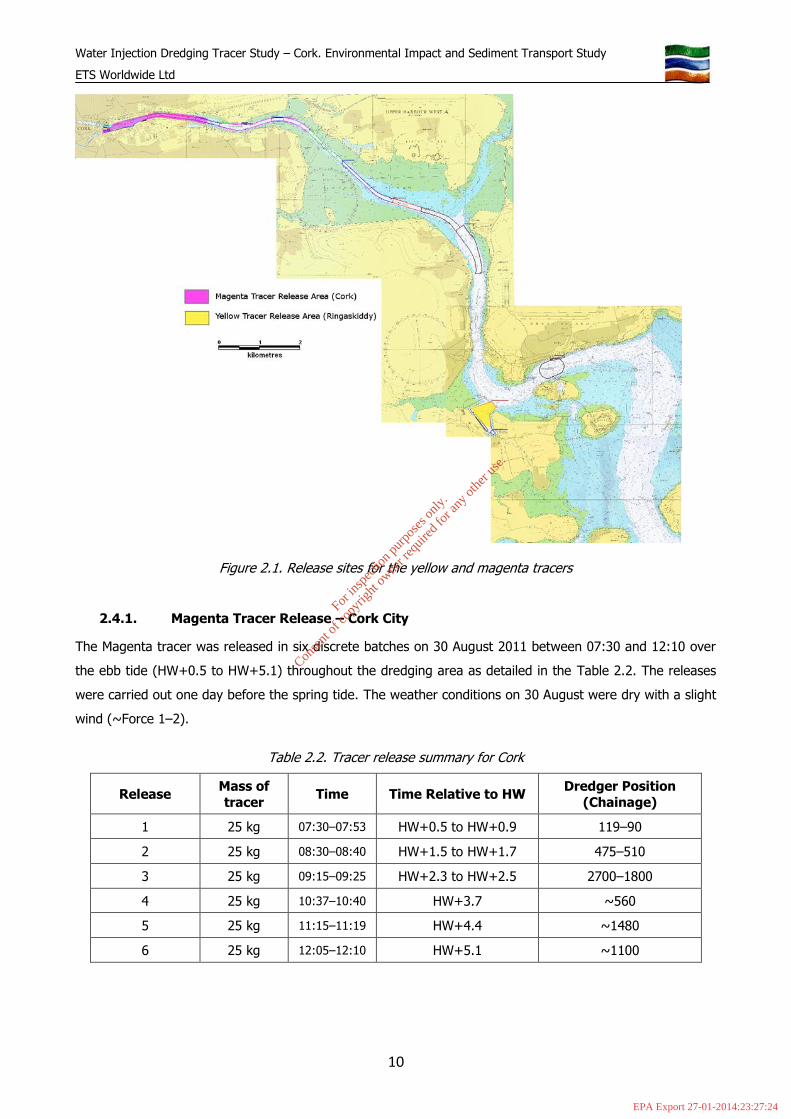
Water Injection Dredging Tracer Study – Cork. Environmental Impact and Sediment Transport Study
ETS Worldwide Ltd
10
Figure 2.1. Release sites for the yellow and magenta tracers
2.4.1. Magenta Tracer Release – Cork City
The Magenta tracer was released in six discrete batches on 30 August 2011 between 07:30 and 12:10 over
the ebb tide (HW+0.5 to HW+5.1) throughout the dredging area as detailed in the Table 2.2. The releases
were carried out one day before the spring tide. The weather conditions on 30 August were dry with a slight
wind (~Force 1–2).
Table 2.2. Tracer release summary for Cork
Release Mass of
tracer Time Time Relative to HW
Dredger Position
(Chainage)
1 25 kg 07:30–07:53 HW+0.5 to HW+0.9 119–90
2 25 kg 08:30–08:40 HW+1.5 to HW+1.7 475–510
3 25 kg 09:15–09:25 HW+2.3 to HW+2.5 2700–1800
4 25 kg 10:37–10:40 HW+3.7 ~560
5 25 kg 11:15–11:19 HW+4.4 ~1480
6 25 kg 12:05–12:10 HW+5.1 ~1100
For
insp
ectio
n pur
pose
s only
.
Conse
nt of
copy
right
owne
r req
uired
for a
ny ot
her u
se.
EPA Export 27-01-2014:23:27:24

Water Injection Dredging Tracer Study – Cork. Environmental Impact and Sediment Transport Study
ETS Worldwide Ltd
11
2.4.2. Yellow Tracer Release – Ringaskiddy
The Yellow tracer was released in four discrete batches on 6 September 2011 between 13:04 and 13:48 just
after high water throughout the dredging area as detailed in the Table 2.3. The releases were carried out
one day before the neap tide. The weather conditions on 6 September were wet with a strong wind (~Force
5–6).
Table 2.3. Tracer release summary for Ringaskiddy
Release Mass of
tracer Time Time Relative to HW
Dredger Position
(Chainage)
1 25 kg 13:04–13:06 HW+0.1 ~14400
2 25 kg 13:15–13:17 HW+0.3 ~14404
3 25 kg 13:30–13:32 HW+0.5 ~14322
4 25 kg 13:46–13:48 HW+0.8 ~14726
For
insp
ectio
n pur
pose
s only
.
Conse
nt of
copy
right
owne
r req
uired
for a
ny ot
her u
se.
EPA Export 27-01-2014:23:27:24

Water Injection Dredging Tracer Study – Cork. Environmental Impact and Sediment Transport Study
ETS Worldwide Ltd
12
3. Field Equipment and Methodology
3.1. Seabed Sampler
Seabed sampling was carried out using a Van Veen grab, which can be operated from a small vessel, if
required, allowing access to shallow water sites. The Van Veen grab (Figure 3.1.) is a lightweight sampler
designed to take large samples in soft bottoms. Its long lever arms and the sharp cutting edges on the
bottom of the scoops, enable it to cut deeply into the softer bottoms. The Van Veen grab sampler is
manufactured in two sizes from stainless steel. The weighted jaws, chain suspension, and doors and screens
allow flow-through during lowering to the bottom and assure vertical descent where strong underwater
currents exist. The relatively large surface area and the strong closing mechanism allow the jaws to excavate
relatively undisturbed sediments. When the powering cable is slowly made taut, the chains attached at the
top of the release exert great tension on the long arms extending beyond the jaws, causing them to lift, dip
deeper into the sediment, and trap material as they tightly close. The stainless-steel, 583 µm, door screens
have flexible rubber flaps which, during lowering, are lifted. When the grab settles on the bottom, the flaps
fall back and cover the screens completely, preventing any loss of sediment during retrieval.
Figure 3.1. Van Veen Grab sampler
3.2. Sampling Survey
3.2.1. Background sampling
Prior to a sediment tracer study, ETS typically collect background sediment samples from the study site,
before manufacturing the sediment tracers, to confirm presence of any fluorescence material and also
characterize the sediment, especially particle size. However, due to the timescales involved in this project
For
insp
ectio
n pur
pose
s only
.
Conse
nt of
copy
right
owne
r req
uired
for a
ny ot
her u
se.
EPA Export 27-01-2014:23:27:24

Water Injection Dredging Tracer Study – Cork. Environmental Impact and Sediment Transport Study
ETS Worldwide Ltd
13
there was insufficient time to collect and analyse background samples and use the information obtained to
produce an optimum silt particle tracer, in terms of colour (minimal interference with naturally occurring
fluorescence), density and particle size. Therefore ETS manufactured two silt-sized tracers with similar size
distributions and generic individual grain densities for marine silt sediment. In terms of fluorescent colour,
ETS chose two colours, which are easy to detect over and above any natural fluorescence present in marine
sediment.
In order to have some information on any background fluorescence present at the site, immediately after
arrival at the site, ETS collected background samples prior to the release of the tracer particles. These were
analysed in order to determine any fluorescence material at the sampling sites. The background samples
were also collected in order to asses the suitability and accessibility of each of the proposed sampling
locations for future sampling events.
Background sediment grab samples were collected by boat from 35 sites throughout the study area,
focussing on areas where silt is likely to deposit, along with samples from environmentally-sensitive sites,
such as shellfish banks (Figure 3.2.).
Figure 3.2. Map of background sampling locations
For
insp
ectio
n pur
pose
s only
.
Conse
nt of
copy
right
owne
r req
uired
for a
ny ot
her u
se.
EPA Export 27-01-2014:23:27:24

Water Injection Dredging Tracer Study – Cork. Environmental Impact and Sediment Transport Study
ETS Worldwide Ltd
14
3.2.2. Sampling Survey
After tracers release, Aquatic Marine with the support of ETS carried out three sampling rounds at
approximately: 1, 7 and 14 days following each tracer release (weather-depending) to assess the spatial and
temporal distribution of the tracer particles released (Table 3.1). Due to the Magenta tracer being released
in Cork City one week prior to the Yellow tracer being released at Ringaskiddy, ETS have four datasets for
the Magenta tracer, three from the around Cork and Lough Mahon and an additional dataset of samples
around Ringaskiddy, representing the last sampling survey for that site (23 days after magenta tracer
release). Given the one week gap between the two tracer releases, two of the datasets represent samples
from both the Cork City/Lough Mahon area and around Ringaskiddy indicating a wide coverage of Cork
Harbour and the River Lee.
37 locations were sampled for the area around Cork City and Lough Mahon and 37 samples for the area
upstream and downstream of Ringaskiddy (Figure 3.3). The sampling positions were based on depositional
areas and environmentally sensitive sites including shellfishery beds to determine any accumulation, impact,
effect or burial of these beds and habitats. Over the three rounds of sampling at each site (approximately
day 1, 7 and 14 after tracer release) 222 seabed samples were collected.
Table 3.1. Summary of Activities and calendar
Date Cork City Ringaskiddy
29 August 2011 Background Sampling
30 August 2011 Magenta Tracer Release Background Sampling
31 August 2011 Sampling – Day 1
06 September 2011 Yellow Tracer Release
08 September 2011 Sampling – Day 2
09 September 2011 Sampling – Day 10
13 September 2011 Sampling – Day 14
14 September 2011 Sampling – Day 9
22 September 2011 Sampling – Day 16
For all grab samples collected, the surface sediment down to 2.5 cm was scraped off and placed in a pre-
labelled clean bag and stored ready for shipment to ETS’ ISO 9001:2008 certified laboratory in the UK for
analysis. The same quantity was removed for each sample collecting all the fine and coarse sediment to
ensure that the results from sample to sample were comparable. The grab was rinsed thoroughly after each
sample was removed to reduce the risk of contamination between samples. Once a sample was collected in
a sample bag, each sample was individually stored and shipped to ensure the integrity of the samples was
not compromised. Once the samples arrive at ETS’ premise for analysis the laboratory procedures in place
ensure that the samples analysis is as accurate and precise as possible with limited contamination risks.
Details of the laboratory procedures and analysis are located in Appendix B.
For
insp
ectio
n pur
pose
s only
.
Conse
nt of
copy
right
owne
r req
uired
for a
ny ot
her u
se.
EPA Export 27-01-2014:23:27:24
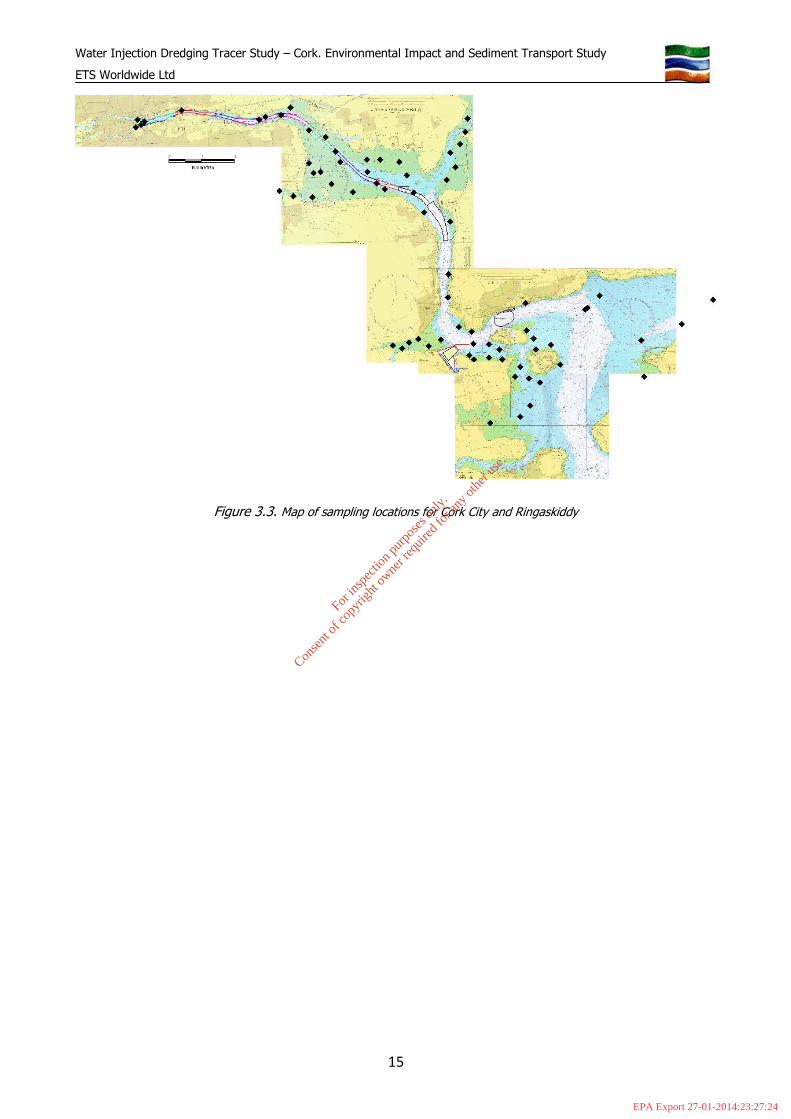
Water Injection Dredging Tracer Study – Cork. Environmental Impact and Sediment Transport Study
ETS Worldwide Ltd
15
Figure 3.3. Map of sampling locations for Cork City and Ringaskiddy
For
insp
ectio
n pur
pose
s only
.
Conse
nt of
copy
right
owne
r req
uired
for a
ny ot
her u
se.
EPA Export 27-01-2014:23:27:24

Water Injection Dredging Tracer Study – Cork. Environmental Impact and Sediment Transport Study
ETS Worldwide Ltd
16
4. Data and Results
4.1. Magenta tracer results
A total of four sampling events took place after the Magenta tracer release in Cork City, comprising three
sampling surveys covering the area River Lee and Lough Mahon at Day 1, 9-10 and 14-15 after the tracer
release and one around Ringaskiddy at Day 23. The results for the tracer concentrations measured in each
of the grab samples are shown in Figures 4.1 – 4.4 and are expressed as counts per dry gram of sediment
per square centimetre. Rather than describe each plot individually, the results and interpretation are based
on all the data.
Overall the Magenta tracer results show widespread and rapid dispersal of the tracer particles from Cork City
down-estuary with approximately 50% of the samples collected within Lough Mahon 1 day after the tracer
release and high concentrations upstream of the release site also with the highest concentration recorded as
the estuary starts to widen as the River Lee becomes Lough Mahon (Figure 4.1). By Round 2 sampling
around Cork and the first sampling around Ringaskiddy (Round 1), approximately 8 and 9 days after the
tracer release respectively, during the neap tide, the concentrations have increased significantly and much
more uniformly (Figure 4.2). Some of the highest concentrations measured throughout Lough Mahon from
the tidal limit for vessels towards the head of the estuary in Cork City, up Foaty Channel, the northeast arm
of Lough Mahon around Great Island and the western mudflats of Lough Mahon. The data also shows
widespread dispersal down-estuary to the sampling area around Ringaskiddy with similar very high
concentrations measured at three locations.
By Round 3 sampling for Cork City and Lough Mahon, 14-15 days after the tracer release, overall tracer
concentrations and patterns of deposition are similar to Round 2, although at certain sites some of the tracer
concentrations increased notably in the upstream areas of Cork City (Figure 4.3). This suggests that
Magenta tracer was still present in the WID area, possibly eroded and re-distributed from original tracer-
labelled ‘source’ dredge material that formed when the WID took place or material had returned and
deposited there on the flood tide. Very high concentrations were also recorded towards the upstream end of
sampling in Floaty Channel and also the western mudflats of Lough Mahon. Increased deposition and higher
tracer concentrations in these areas, and on the mudflats in general, is expected as tracer particles and
sediment are eroded and transported on the dominant (higher velocity) flood tide up to the tidal limits and
upper reaches (height wise) of the estuary. Slack water over High Tide is relatively prolonged in macrotidal
estuaries, compared with Low Water, which tends to be a very rapid change in current direction. Over the
High tide slack water, water pools and stagnates and as a result sediment and tracer particles settle out
depositing material on the mudflats, particularly as the water recedes on the ebb tide leaving puddles and
pools. The sediment and tracer particles trapped in these pools settles out, leading to an increase and build
up of the mudflats and higher tracer concentrations. This depositional process driven by the dominant flood
tide is a natural sediment transport process.
For
insp
ectio
n pur
pose
s only
.
Conse
nt of
copy
right
owne
r req
uired
for a
ny ot
her u
se.
EPA Export 27-01-2014:23:27:24

Water Injection Dredging Tracer Study – Cork. Environmental Impact and Sediment Transport Study
ETS Worldwide Ltd
17
Results for Round 2 Ringaskiddy area (Figure 4.3) show more of the samples are positive and a slight overall
increase in concentrations, where approximately 40% of the samples were positive for Round 1 compared
with approximately 75% positive samples for Round 2. The majority of the higher counts occurred around
Ringaskiddy rather than further afield. The highest concentrations were recorded in the berths at Cobh,
around Oyster Bank, off Black Point and the entrance to Monkstown Creek, although for both Round 2 and
Round 3, samples higher up in Monkstown Creek indicated no tracer fairly consistently.
The results for Round 3 for Ringaskiddy, 23 days after the tracer release (Figure 4.4), show a very similar
pattern in the data to Round 2 with the majority of the samples still positive (approximately 75%) and
continued presence in the berths at Cobh, around Oyster Bank, off Black Point and some but lower
concentrations at the entrance to Monkstown Creek.
The tracer results clearly show that the Magenta tracer particles were widely and rapidly dispersed, and
deposited in areas that are known to be depositional including mudflats and towards the upper limits of the
creeks, channels and inlets with relatively homogeneous concentrations measured across mudflats including
Loch Mahon. Several of the sites in the channel and more fast-flowing scoured areas did not show any
presence of tracer particles or in relatively low concentrations, as would be expected. During the 2 to 3
weeks of sampling, concentrations increased in mainly depositional areas and then remained relatively
constant over that time with little change apparent as a result of the tidal conditions during sampling. Very
few sites showed a decrease or reduction in concentration over time, suggesting the sites to be depositional
rather than the presence of tracer particles being transient. Several of the environmentally sensitive sites,
such as Oyster Bank and Monkstown Creek showed relatively high concentrations that persisted over time.
Deposition is a natural sediment transport process and is the key factor in mudflat formation that is driven
by the dominant flood tide (Dyer, 1988; Marsh, 1991).
For in
spec
tion p
urpo
ses o
nly.
Conse
nt of
copy
right
owne
r req
uired
for a
ny ot
her u
se.
EPA Export 27-01-2014:23:27:24

Water Injection Dredging Tracer Study – Cork. Environmental Impact and Sediment Transport Study
ETS Worldwide Ltd
18
Figure 4.1. Cork Round 1 Magenta Tracer silt fraction results per cm2
Figure 4.2. Cork Round 2 and Ringaskiddy Round 1 Magenta Tracer silt fraction results per cm2
For
insp
ectio
n pur
pose
s only
.
Conse
nt of
copy
right
owne
r req
uired
for a
ny ot
her u
se.
EPA Export 27-01-2014:23:27:24

Water Injection Dredging Tracer Study – Cork. Environmental Impact and Sediment Transport Study
ETS Worldwide Ltd
19
Figure 4.3. Cork Round 3 and Ringaskiddy Round 2 Magenta Tracer silt fraction results per cm2
Figure 4.4. Ringaskiddy Round 3 Magenta Tracer silt fraction results per cm2
For
insp
ectio
n pur
pose
s only
.
Conse
nt of
copy
right
owne
r req
uired
for a
ny ot
her u
se.
EPA Export 27-01-2014:23:27:24

Water Injection Dredging Tracer Study – Cork. Environmental Impact and Sediment Transport Study
ETS Worldwide Ltd
20
4.2. Yellow tracer results
Three sampling events took place at Day 2-3, 8-9 and 16 after Yellow tracer release around Ringaskiddy,
with the first and second surveys including the sampling around Lough Mahon and Cork City. The results for
the tracer concentrations measured in each of the grab samples are shown in Figures 4.5 – 4.7 and are
expressed as counts per dry gram of sediment per square centimetre. Rather than describe each plot
individually, the results and interpretation are based on all the data.
The Yellow tracer results for Ringaskiddy samples collected on 8 September (Round 1) (Figure 4.5) indicate
approximately 20% of the samples were positive, much less than the number of positive samples for Cork
City Round 1 (Figure 4.1), with very few high concentrations detected limited to Oyster Bank and Cobh
berths. By comparison, Cork City Round 2 samples collected on 9 September (Figure 4.5) indicate
approximately 75% of the samples were positive with much higher concentrations detected throughout
Lough Mahon and all the way up to Cork City and the most upstream sampling points. Similar to pattern of
deposition of the Magenta tracer results for Lough Mahon, the Yellow tracer results indicate very high
concentrations up Foaty Channel at the upstream end and the western mudflats of Lough Mahon and up
around Cork City with uniform concentrations throughout Lough Mahon.
The results for the Cork Round 3 sampling and Ringaskiddy Round 2 sampling, 8 and 9 days after the Yellow
tracer release respectively (Figure 4.6), show that the concentrations around Lough Mahon and up at Cork
City increased still further and consistently across the area. Very high concentrations were measured in the
upper reaches of Foaty Channel, around Great Island, across the western mudflats of Lough Mahon
including in and close to the channel where the channel widens and at the most up-estuary sampling
locations in Cork City. Conversely, around Ringaskiddy, the concentrations remain low, with higher
concentrations recorded around Oyster Bank, Cobh berths and on the edge of the main navigable channel to
the north of Ringaskiddy. Yellow tracer was detected at more sites compared with the previous sampling
round one-week prior, but on the whole the concentrations were low.
The Yellow tracer results from Ringaskiddy Round 3 (Figure 4.7) indicate an increase in concentration at
many of the sites, but generally only in the vicinity of Ringaskiddy rather than further afield with increased
concentrations and deposition in Bankstown Creek, almost throughout Oyster Bank, and continued high
concentrations in Cobh berths and on the edge of main navigable channel. As per Round 2 Ringaskiddy
samples the highest concentrations were both north of Ringaskiddy in a flood-tide direction up the main
navigable channel consistent with the very high and persistent concentrations measured throughout Lough
Mahon and Cork City in previous sampling surveys.
Overall the results indicate a very clear flood-dominated transport up-estuary to Lough Mahon and beyond,
up to Cork City, as is often the case for suspended sediment in macro-tidal estuaries with significant
deposition in the inter-tidal mudflats, smaller channels and berths. The data also show limited dispersal in an
For
insp
ectio
n pur
pose
s only
.
Conse
nt of
copy
right
owne
r req
uired
for a
ny ot
her u
se.
EPA Export 27-01-2014:23:27:24

Water Injection Dredging Tracer Study – Cork. Environmental Impact and Sediment Transport Study
ETS Worldwide Ltd
21
ebb tide direction with the majority of the Yellow tracer that did remain around Ringaskiddy limited to the
immediate area including environmentally sensitive areas such as Oyster Bank and Monkstown Creek.
Figure 4.5. Cork City Round 2 and Ringaskiddy Round 1 Yellow Tracer silt fraction results per cm2
For
insp
ectio
n pur
pose
s only
.
Conse
nt of
copy
right
owne
r req
uired
for a
ny ot
her u
se.
EPA Export 27-01-2014:23:27:24

Water Injection Dredging Tracer Study – Cork. Environmental Impact and Sediment Transport Study
ETS Worldwide Ltd
22
Figure 4.6. Cork City Round 3 and Ringaskiddy Round 2 Yellow Tracer silt fraction results per cm2
Figure 4.7. Ringaskiddy Round 3 Yellow Tracer silt fraction results per cm2
For
insp
ectio
n pur
pose
s only
.
Conse
nt of
copy
right
owne
r req
uired
for a
ny ot
her u
se.
EPA Export 27-01-2014:23:27:24

Water Injection Dredging Tracer Study – Cork. Environmental Impact and Sediment Transport Study
ETS Worldwide Ltd
23
5. Summary of Results
1. The sediment tracer results for Cork City (Magenta), released on a spring tide, indicate rapid and
widespread dispersal and re-distribution of the tracer particles from Cork City within a few days
of the initial release. Nine days after the release (Round 2 sampling) Magenta tracer particles
were detected to the east of Ringaskiddy on the south side of Great Island and in East Channel
and Whitegate Bay, although in relatively low concentrations. Magenta tracer was detected
around Ringaskiddy with increased deposition primarily limited to areas around Oyster Bank,
Monkstown Creek, Black Point and Cobh berths, similar to the Yellow tracer patterns of
deposition over time. Relatively little was measured in the main navigable channels over time
principally due to scouring and fast flowing currents. The majority of the tracer deposition
occurred on inter-tidal mudflats within Lough Mahon. Generally the highest concentrations of
Magenta silt-sized tracer particles were recorded at the upper limits of the sampling areas
including at the navigation limit for vessels in Cork City itself, at the head of Foaty Channel (the
northeast arm of Lough Mahon around Great Island) and on the western mudflats of Lough
Mahon.
2. Over time, Magenta tracer concentrations increased from Round 1 to Round 2 for the same sample
sites around Cork City and Lough Mahon, indicating either increased erosion of the labelled
source material and/or improved deposition and consolidation by Round 2 during neap tides
leading to an increase in tracer concentrations. Generally tracer concentrations increased further
for Round 3, conducted approximately during spring tides, suggesting increased erosion and re-
distribution of the labelled source material. Round 4 samples around Ringaskiddy only, showed
some decrease over that time period but relatively limited amounts, suggesting a plateau or
equilibrium in the concentration.
3. Yellow tracer concentrations in the upper estuary indicated a very similar pattern of distribution and
deposition to that seen for the Magenta tracer in Lough Mahon and Cork City area with very
high concentrations in the upper reaches of Foaty Channel, the western areas of mudflats and
within Cork City. Around Ringaskiddy, the Yellow tracer was detected in the general area, but
much less so further afield with higher concentrations around Oyster Bank and Cobh berths, and
later in the sampling surveys in Monkstown Creek plus on the edges of the main navigable
channel to the north. Overall concentrations increased over time in both Lough Mahon and Cork
City and at the positive sites around Ringaskiddy with no apparent decrease in concentration by
the third and final sampling survey, similarly to the Magenta tracer results.
4. The two sediment tracer datasets show that the addition of tracer particles into the WID plant over
an ebb tide period, provided a tangible marker for the dredged sediment and demonstrated that
For
insp
ectio
n pur
pose
s only
.
Conse
nt of
copy
right
owne
r req
uired
for a
ny ot
her u
se.
EPA Export 27-01-2014:23:27:24

Water Injection Dredging Tracer Study – Cork. Environmental Impact and Sediment Transport Study
ETS Worldwide Ltd
24
the tracer particles and therefore dredged sediment were advected and dispersed over a wide
area, covering the majority of the sampling area. The rate of excursion is in line with the strong
tidal currents in Cork Harbour. The areas of high concentrations and increased deposition
occurred in depositional areas with low concentrations measured in the navigable channel and
other areas with stronger currents.
For
insp
ectio
n pur
pose
s only
.
Conse
nt of
copy
right
owne
r req
uired
for a
ny ot
her u
se.
EPA Export 27-01-2014:23:27:24

Water Injection Dredging Tracer Study – Cork. Environmental Impact and Sediment Transport Study
ETS Worldwide Ltd
25
6. Interpretation and Mass Budget Calculation
1. The sediment tracer results for Cork City clearly show a net flood-tide dominant transport process
upstream from Ringaskiddy even though the WID and tracer release took place on the ebb tide.
It is possible that the tracer-labelled dredge sediment was transported by gravity and density
currents from Ringaskiddy into the deeper sections of the channel, during the ebb tide (Uncles
and Stephens, 1989). Then as the flood tide current velocities increased, the material was
eroded and transported up-estuary where it was re-distributed around the depositional areas
(Uncles et al., 1985). Increased deposition and higher tracer concentrations recorded at the
upper limits of the sampling area and on the mudflats in general is expected, as tracer particles
and sediment are eroded and transported on the dominant (higher velocity) flood tide up to the
tidal limits and upper reaches (height wise) of the estuary such as Lough Mahon. Slack water
over High Tide is relatively prolonged in macrotidal estuaries, compared with Low Water, which
tends to be a very rapid change in current direction. Over High tide slack water, water pools and
stagnates and as a result sediment and tracer particles settle out depositing material on the
mudflats, particularly as the water recedes on the ebb tide leaving puddles and pools (Uncles et
al., 1991). The sediment and tracer particles trapped in these pools settles out, leading to an
increase and build up of the mudflats and higher tracer concentrations. This depositional process
driven by the dominant flood tide is a natural sediment transport process and is the key factor in
mudflat formation (Dyer, 1988; Marsh, 1991).
2. The sediment tracer results for the Yellow tracer released at Ringaskiddy also indicate a very clear
flood-dominant up-estuary transport with only limited transport and deposition seaward in the
direction of the ebb tide over all three sampling surveys. McCabe et al. (1993) suggest that little
down-estuary transport is experienced on ebb tides due to vertical stability and stratification
diminishing vertical turbulent mixing (Darbyshire & West, 1991) enabling larger flocs to form
and settle to the bed and remain the upper estuary. However, the increase in concentrations of
Yellow tracer for Round 3 samples and the continued presence and persistence in the area,
despite the very apparent residual up-estuary transport evident from the data, perhaps suggests
that some of the original WID sediment labelled with tracer was eroded and re-distributed
between Round 2 and Round 3 sampling (Uncles et al., 1985; Stephens et al., 1992).
3. The wide dispersal of the two sediment tracer datasets suggests that it is unlikely that there would
be any build-up or accumulation of tracer particles and silt-sized sediment that would cause a
hindrance to shipping, however, not all areas were sampled and in the case of Ringaskiddy a
For
insp
ectio
n pur
pose
s only
.
Conse
nt of
copy
right
owne
r req
uired
for a
ny ot
her u
se.
EPA Export 27-01-2014:23:27:24

Water Injection Dredging Tracer Study – Cork. Environmental Impact and Sediment Transport Study
ETS Worldwide Ltd
26
relatively large proportion of the sediment was very fine, fine and medium sand which was not
traced and is unlikely to move during WID.
4. Making a number of assumptions based on the tracer results, ETS can attempt to estimate the
percentage of tracer particles accounted for within a given sampling area, expressed as a
percentage of the total tracer particles released at each site. ETS have assumed 3 areas
comprising the Cork City reach, Lough Mahon and the immediate vicinity up-estuary and down-
estuary from Ringaskiddy (Figure 5.1). The outlying individual points to the east of Ringaskiddy
are not included in the calculated areas since they are isolated and distant points with varying
location types, i.e. inter-tidal, sub-tidal and the main deeper channel. The area in km2 can be
determined for each of the three areas along with the average tracer concentrations in each
area to derive an average percentage of tracer accounted for expressed as a percentage of the
total number of tracer particles released.
Figure 5.1. Areas used for mass budget calculations
For
insp
ectio
n pur
pose
s only
.
Conse
nt of
copy
right
owne
r req
uired
for a
ny ot
her u
se.
EPA Export 27-01-2014:23:27:24

Water Injection Dredging Tracer Study – Cork. Environmental Impact and Sediment Transport Study
ETS Worldwide Ltd
27
5. The estimate can be made as follows as per Figure 5.1, with the following facts, information and
assumptions:
- Spatial homogeneity of the tracer concentrations between each sample location over the
entire sample area
- Surface area of Area 1 Cork City in km2: 0.4343
- Surface area of Area 2 Lough Mahon in km2: 10.01
- Surface area of Area 3 Ringaskiddy in km2: 8.44
- Number of Magenta tracer particles released Cork City 150kg 2.45E+14
- Number of Yellow tracer particles released Ringaskiddy 100kg 1.63E+14
- Average Wet:dry weight ratio for Cork City based on 3 sets of samples: 66%
- Average Wet:dry weight ratio for Ringaskiddy based on 3 sets of samples: 57.5%
Based on the above constants the percentages of tracer accounted for in each area can be
estimated as follows for Cork City Magenta tracer for Area 1 or 2 for example using the calculation:
Average tracer conc in dry g per cm2 x Area 1 or 2 in cm2 x Dry weight ratio
.
Total tracer particle numbers released
6. Assuming an hypothetical WID dredge volume of 20,000 m3 for both Cork City and Ringaskiddy and
by applying the wet:dry weight ratio above, the percentage of dredged sediment in an area can
be estimated and the average sediment thickness calculated based on this percentage. The data
for Cork City Round 1-3 sampling rounds and Ringaskiddy Round 1-3 sampling rounds are given
in Tables 5.1 and 5.2 respectively. The calculations are made based on the average tracer
concentrations.
For
insp
ectio
n pur
pose
s only
.
Conse
nt of
copy
right
owne
r req
uired
for a
ny ot
her u
se.
EPA Export 27-01-2014:23:27:24

Water Injection Dredging Tracer Study – Cork. Environmental Impact and Sediment Transport Study
ETS Worldwide Ltd
28
Table 5.1. Summary of the estimated average and maximum thickness of sediment (mm) around the Magenta tracer release site, Cork City
Cork City: Magenta
tracer release
Area Average tracer
concentration
(counts per dry g
per cm2)
Estimated
Average
Percentage
tracer in Area
Estimated
Average
thickness spread
in mm
Cork Round 1 Area 1 272 0.32 <0.5
” Area 2 306 8.26 <0.5
Cork Round 2 Area 1 917 1.07 0.5
” Area 2 1381 37.25 0.7
Ringaskiddy Round 1 Area 3 536 0.11 <0.5
Cork Round 3 Area 1 7921 9.27 4.3
” Area 2 2082 56.15 1.1
Ringaskiddy Round 2 Area 3 859 0.17 <0.5
Ringaskiddy Round 3 Area 3 1051 0.21 <0.5
Table 5.2. Summary of the estimated average and maximum thickness of sediment (mm) around the Yellow tracer release site, Ringaskiddy
Ringaskiddy: Yellow
tracer release
Area Average tracer
concentration
(counts per dry g
per cm2)
Estimated
Average
Percentage
tracer in Area
Estimated
Average
thickness spread
in cm
Ringaskiddy 1 Area 3 176 0.05 <0.5
Cork Round 2 Area 1 565 0.99 0.5
” Area 2 1005 40.69 0.8
Ringaskiddy 2 Area 3 500 0.15 <0.5
Cork Round 3 Area 1 4280 7.51 3.5
” Area 2 1624 65.69 1.3
Ringaskiddy 3 Area 3 826 0.25 <0.5
7. The Magenta tracer release in Cork City clearly shows increasing average tracer concentrations over
time in Area 1 and 2 (Cork City and Lough Mahon), compared with Area 3 around Ringaskiddy
although these concentrations also increase over time. The increase in average tracer
concentrations results in an increase in the estimated percentages for Area 1 and 2 increasing
from 0.3% up to 9% accounted for in Area 1 in Cork City for Round 3 sample event coincident
with an increase from 8% to 37% to 56% for Rounds 1, 2 and 3 respectively for Area 2. Based
For
insp
ectio
n pur
pose
s only
.
Conse
nt of
copy
right
owne
r req
uired
for a
ny ot
her u
se.
EPA Export 27-01-2014:23:27:24

Water Injection Dredging Tracer Study – Cork. Environmental Impact and Sediment Transport Study
ETS Worldwide Ltd
29
on the arbitrary WID volume of 20,000 m3 for Cork City, the average thickness for Area 1
increases from approximately <0.5 mm at Round 1 up to 0.5 mm for Round 2 and 4.3 mm for
Round 3. The significant increase in the average concentration indicates a relatively large
deposition of silt sediment in the Cork City area, Area 1, of around 0.5 cm. Given that the flood
tide is dominant (stronger velocities) and as a result there is a net residual up-estuary transport
and as a result it is likely that a turbidity maximum will form in the upper estuary close to the
tidal limit particularly in low river flow conditions (Dyer, 1988), observing deposition of 5m m is
not surprising. For Area 2, the tracer concentrations were lower than for Area 1; however, the
area is much larger and more spread out with large expanses of inter-tidal areas, with estimates
up to an average of 1.1 mm in Area 2 for the Round 3 sampling datatset. By comparison, the
percentage of Magenta tracer in the Ringaskiddy area is substantially lower increasing up to
0.21% by Round 3 equating to <0.5 mm average sediment thickness deposited.
8. The Ringaskiddy, Yellow tracer results show a similar pattern to the Magenta tracer results with
increasing concentrations over time, particularly in Lough Mahon and Cork City demonstrating
very clearly the net up-estuary transport process associated with the flood tide. The
concentrations and therefore percentages accounted for do increase over time around
Ringaskiddy (although some outlying sample locations were omitted from Area 3) ranging from
0.05% at Round 1 up to 0.25% accounted for by Round 3, equivalent to a predicted average
sediment thickness of <0.5 mm (effectively zero). By comparison and very much in agreement
with the Magenta tracer results, the average estimated percentages in Cork City and Lough
Mahon for Yellow tracer increased from 1% to 7.5% and from 41% to 66% respectively for Cork
City Round 2 and Round 3 sampling. This equates to an average deposit sediment thickness up
to approximately 3.5 mm and 1.3 mm respectively for Cork City and Lough Mahon.
9. Based on the calculations, assumptions and estimates, by the last sampling event for Cork City area
(Cork Round 3 & Ringaskiddy Round 2), ETS can account for approximately 2/3 of the Magenta
tracer particles released at Cork City with the vast majority accounted for within Lough Mahon
sampling area, Area 2. Similarly for the Yellow tracer released at Ringaskiddy, at the same point
equivalent to one week earlier after the Ringaskiddy release, ETS can account for 3/4 of the
tracer particles released again with the vast majority deposited in Lough Mahon. Clearly Lough
Mahon and Cork City area and berths are depositional areas, which concur with the formation
and existence of expansive inter-tidal mudflats and requirements for maintenance dredging
respectively. The ‘missing’ tracer or tracer particles unaccounted for (i.e. up to 100%) could
occur due to tracer particles being advected further up-estuary in Cork City and Lough Mahon
into areas above the sampling sites around the MHWS, or further up Foaty Channel or errors in
the assumptions and spatial homogeneity in the tracer concentrations within an area which is
also likely.
For
insp
ectio
n pur
pose
s only
.
Conse
nt of
copy
right
owne
r req
uired
for a
ny ot
her u
se.
EPA Export 27-01-2014:23:27:24

Water Injection Dredging Tracer Study – Cork. Environmental Impact and Sediment Transport Study
ETS Worldwide Ltd
30
7. Conclusions
1. Overall, the tracer results and mass budget estimates seem to account for the majority of the tracer
particles released and tend to show clear transport to depositional areas particularly the
extensive inter-tidal mudflats in Lough Mahon as well as other known or expected depositional
areas such as berth pockets, creeks and shallow sub-tidal areas.
2. The mass budget estimates for the tracer and resultant predictions for sediment thickness deposited
as a result of WID at Cork City and Ringaskiddy demonstrate that the WID has dispersed the
material and it has re-distributed to the wider estuarine system, but generally in the upper
estuary principally in volume terms to Lough Mahon. This re-distribution up-estuary from
Ringaskiddy and limited transport from Cork City area is a function of the flood-tide transport
process. Although larger concentrations and higher thicknesses were detected within the Cork
City area, it is unlikely to remain there in totality due to scouring as a result of spring tides,
increased seasonal river flow and vessel activity, the tracer results unequivocally confirm the
clear tidally dominated process and deposition that takes place. If the sampling surveys had
covered a wider area and/or over a longer time period it is possible that these estimated
deposits would have decreased as further transport and deposition takes place. As the data
stands, the results tend to show that WID dredging could lead to a more rapid return of
sediment to the Cork City leading to navigable depth decreases; however, this is a natural
process. Other than disposal at sea or more controlled beneficial use as has been demonstrated
successfully in other similar locations (Medway estuary), which in turn removes the material
from the local sediment regime, WID does offer a very effective way of dispersing a large
proportion of the maintenance dredge material to an area which does not impinge on port
operations as significantly and is beneficial for habitat conservation, namely Lough Mahon.
3. The results do show that tracer particles and therefore dredged silt sediment did deposit and
remain within the environmentally sensitive sites such as Oyster Bank and Monkstown Creek.
However, the data clearly show that this deposition is spread quite well with no concentrated
accumulations of sediment that would be harmful to the shellfishery and marine flora and fauna
at these sites. Furthermore, it is likely given the location of Oyster Bank in particular, that these
sites are directly and/or indirectly affected by storms and short-term sedimentation changes as a
result.
For
insp
ectio
n pur
pose
s only
.
Conse
nt of
copy
right
owne
r req
uired
for a
ny ot
her u
se.
EPA Export 27-01-2014:23:27:24

Water Injection Dredging Tracer Study – Cork. Environmental Impact and Sediment Transport Study
ETS Worldwide Ltd
31
References
Darbyshire EJ and West JR (1991) Spatial and temporal turbulence characteristics in the Tamar Estuary. In
Proceedings ECSA 19 Symposium on Estuaries and Coastal: Spatial and Temporal Intercomparisons. pp. 37-
41
Dyer KR (1988) Fine sediment particle transport in estuaries In: Physical processes in estuaries, Dronkers J
and Van Leussen W (eds). Springer-Verlag pp.560
Marsh JK, Bale AJ, Uncles RJ and Dyer JR (1991) A tracer technique for the study of suspended sediment
dynamics in aquatic environments. In proceedings of the International Association for Hydraulic Research,
International Symposium on the Transport of Suspended Sediments and it Mathematical Modelling, Florence,
Italy, 2-5 September. Pp665-682
McCabe JC, Dyer KR, Huntley DA and Bale AJ (1993) The variation of floc sizes within a turbidity maximu at
spring and neap tides. Processings 23rd International Conference on Coastal Engineering, Venice Chap. 243,
pp. 3178-3183
Owen MW (1970). A detailed study of the settling velocities of an estuary mud. Hydraulics Research Station,
Wallingford. Unpublished Report No. INT 78. 1970
Stephens JA, Uncles RJ, Barton ML and Fitzpatrick F (1992) Bulk properties of intertidal sediments in a
muddy macrotidal estuary. Marine Geology, 103: 445-460
Uncles RJ, Elliott RCA and Weston SA (1985) Observed fluxes of water, salt and suspended sediments in a
partially mixed estuary, Estuarine and Coastal Shelf Science, 20, 147-167
Uncles RJ and Stephens JA (1989) Distributions of suspended sediment at high water in a macrotidal
estuary, Journal Geophysical Research, 94, No. C10, 14395-14405
Uncles RJ, Stephens JA, Marsh JK and Bale AJ (1991) Synoptic observations of fine-sediment concentration
and transport in the turbidity maximum region of an estuary. International Symposium on the transport of
suspended sediment and its mathematical modelling. Florence, Italy pp.389-402
For
insp
ectio
n pur
pose
s only
.
Conse
nt of
copy
right
owne
r req
uired
for a
ny ot
her u
se.
EPA Export 27-01-2014:23:27:24

Water Injection Dredging Tracer Study – Cork. Environmental Impact and Sediment Transport Study
ETS Worldwide Ltd
32
APPENDIX A Settling Velocity Tests
Settling velocity tests provide an ultimate comparison in the laboratory between natural sediment from the
sites and the tracer particles used to mimic the sediment and ensure or compare behaviour in the
environment. ETS use a natural silt only sample (taken on site) and a natural silt and tracer composite for
testing. For each test the silt only or the silt and tracer composite samples are allowed to settle over time.
The weight retained at each sampling time is compared in order to assess if the silt and tracer composite
behaves/settles out in a similar pattern to that of the silt only sample. The tracer counts are also analysed
for each tracer colour to assess if the different tracers are behaving comparably. The method is detailed
below and follows Owen (1970):
1. A tube was filled with bottled H2O and allowed to equilibrate to room temperature. The temperature
was noted;
2. A 50 mL suspension of sediment or sediment and tracer was prepared in the salinity of seawater
relevant for the test and allowed to equilibrate overnight;
3. The bottled H2O was shaken and poured into the settling tube up to the 1 meter mark. The
sediment suspension was then added; this represented Time 0;
4. Samples were then collected at T0.5, T1.5, T5, T10, T15, T20, T30, T40, T50, T60, T80, T100,
T120, T140, T160, T180, T200, T220, T240 and >T240 minutes ;
5. All samples were then sub-sampled and diluted with 50 mL H2O. A known volume is then passed
through a MCE 0.8 µm membrane filter for microscope analysis; and
6. The remainder of the sample should be filtered and dried to a constant weight.
The results of the settling tests (Figure A.1) indicate that the silt and tracer composites are settling out in a
very similar pattern to that of the silt only sample. Therefore, the tracers behave very similarly to the natural
sediment in terms of settling characteristics in a laboratory settling environment. The results also show that
silt-sized tracer particles flocculate and form flocs with natural silt particles and settle out at a very similar
rate to the natural grains. For the first ten minutes the amount of silt particles that settle out increases quite
rapidly. For the remainder of the sampling time the amount that settles out begins to flatten off to a more
constant weight. Analysis of the tracer counts that settle out over time (Figure A.2) also shows that the
different tracers are behaving very similarly.
For
insp
ectio
n pur
pose
s only
.
Conse
nt of
copy
right
owne
r req
uired
for a
ny ot
her u
se.
EPA Export 27-01-2014:23:27:24

Water Injection Dredging Tracer Study – Cork. Environmental Impact and Sediment Transport Study
ETS Worldwide Ltd
33
Figure A.1. Cumulative silt only and silt and tracer composite weights retained over 240 minutes
Figure A.2. Cumulative Magenta and Yellow silt-sized tracer counts per milligram retained over 240 minutes
For
insp
ectio
n pur
pose
s only
.
Conse
nt of
copy
right
owne
r req
uired
for a
ny ot
her u
se.
EPA Export 27-01-2014:23:27:24
Water Injection Dredging Tracer Study – Cork. Environmental Impact and Sediment Transport Study
ETS Worldwide Ltd
34
APPENDIX B Laboratory and Tracer Analysis Methods
B.1. Standard Laboratory Procedure
During analysis a “good laboratory practice” regime was followed, where protocols included the following:
1. All equipment and work areas in the lab were cleaned (using surfactants and acetone) and checked
for contamination (using an ultraviolet lamp) prior to bringing any samples into the building. This
procedure was regularly undertaken throughout the analysis period;
2. No neat tracer/dye was permitted within the analysis area;
3. Clean laboratory coats and disposable gloves were worn during all sample preparation and handling;
4. All samples were logged using the information provided by the client, and sample information noted
such as: sample constituency, sample variation, weight, length etc. and missing samples (if any).
Any discrepancies between the documentation provided and the samples were reported to the client
and the samples quarantined until further instruction;
5. All samples were stored in a cool, dark place while not undergoing analysis;
6. Samples and reference numbers were cross-checked on several occasions during analysis; and
7. A unique ETS reference number was allocated to each sample, which was determined as follows:
the year (e.g. 08) followed by the next incremental number in the logging book (e.g. 11) followed
by sequential numbering of all samples within that batch (e.g. 001, 002, etc) to give a unique
number “MCR 08-11-001”. If the sample is further divided, or repeat analysis carried out then the
sub-sample was labelled 08-11-001a, 08-11-001b etc. Each sub-sample was analyzed as a
completely separate sample.
B.2. Sample Analysis Techniques
All the collected samples were shipped to ETS’ ISO 9001 accredited laboratory in the UK. All grab samples
were analysed for tracer particle counts, which were then converted into particle counts per gram per square
centimetre of dried sediment.
The following analysis protocol was used for the grab samples:
1. All samples that arrived in bags or sample containers were individually checked for integrity and
wiped down to remove any possible source of contamination;
2. The samples were then placed in order (according to the log sheet provided by the field team and
given a unique ETS number (Appendix A) following ETS SOP ‘QA003 Receipt of Samples’ document;
For
insp
ectio
n pur
pose
s only
.
Conse
nt of
copy
right
owne
r req
uired
for a
ny ot
her u
se.
EPA Export 27-01-2014:23:27:24

Water Injection Dredging Tracer Study – Cork. Environmental Impact and Sediment Transport Study
ETS Worldwide Ltd
35
3. The total wet mass of sediment sample received was recorded;
4. The total contents of each sample container were mixed until homogeneous and a sub-sample was
then removed for analysis and two sub-samples removed, 5 g for wet to dry weight ratio
calculations, 50 g for silt analysis. The remainder of the sample was re-sealed and stored for any
subsequent re-sampling if required;
5. Wet to Dry weight ratios:
i. A 30 mL weighing boat was labelled with ETS’ unique reference number and weighed. The
weight was recorded on a spreadsheet;
ii. The 5 g sub-sample was put into the weighing boat and weighed. The weight was recorded on a
spreadsheet. The sample was then dried to a constant weight in a drying oven (usually
overnight);
iii. Once dry, the sample was weighed immediately after being removed from the oven. The weight
was recorded on a spreadsheet;
6. Silt Samples:
i. An empty beaker with a bag inside was placed on the balance and the balance tared;
ii. The 50 g sub sample was placed in the bag and weighed. The weight was recorded on a
spreadsheet;
iii. The empty beaker was placed back on the balance with a second empty bag, and the balance
tared;
iv. Using a volumetric dispenser, 50 mL H2O was added to the bag containing the sub-sample;
v. Immediately after the sand settled the excess water was poured into the second bag;
vi. The last two steps were repeated until 150 mL had been washed through the sample;
vii. The weight of the second bag was weighed and the weight recorded on a spreadsheet;
viii. The second bag was shaken thoroughly and immediately after settling 50 mL was decanted into
a labelled centrifuge tube;
7. Microscope Slides:
i. From the silt suspension a known volume (0.1-30.0 mL) was passed through a prepared
filtration unit either using a disposable plastic syringe or via a pipette, using the reverse
pipetting technique;
For
insp
ectio
n pur
pose
s only
.
Conse
nt of
copy
right
owne
r req
uired
for a
ny ot
her u
se.
EPA Export 27-01-2014:23:27:24

Water Injection Dredging Tracer Study – Cork. Environmental Impact and Sediment Transport Study
ETS Worldwide Ltd
36
ii. Once all particulate material in the sample is deposited on the surface of the filter paper, at least
10 mL of bottled water was rinsed through the flask to ensure that no sample remained on the
said of the upper filtration unit;
iii. The upper section of the filtration unit was removed and the membrane was carefully removed
and transferred using tweezers to a labelled microscope slide;
iv. A coverslip is gently placed on the slide, and secured in place with adhesive;
v. The filter paper was examined under a fluorescence microscope;
vi. Two slides were prepared for each sample, one for analysis of both tracer colours; and
8. All original paperwork, forms and printouts were kept in the relevant folder in the Laboratory in
order to allow referral should the need arise. All data was then transferred and updated onto the
ETS digital file server, with routine data backups every 24 hours.
B.3. Controls and Replicate Analysis
For every ten slides that are produced for live samples (i.e. those that may contain tracer) as per the
method described (Section B.2) a blank slide is also produced. These slides are examined under the
fluorescence microscope to ensure that there is no tracer contamination during the sample preparation
procedure. Furthermore, approximately every tenth sample the sample analysts are assessed with the
sample analysis repeated by a different analyst.
Duplicate samples are usually collected at a number of sampling sites in order to duplicate the whole
sampling to analysis process and ensure quality control. However, due to time constraints the study team
did not manage to collect duplicate samples at each site. Therefore, ETS conducted replicate analysis for
10% of the samples analysed. For the silt analysis new microscope slides were prepared from the retained
silt suspension for randomly selected samples from each sampling rounds. The results indicated a R2 value
of 0.95.
B.4. Microscope Photographs
Figures B.1 and B.2 are images are taken of a single tracer grain surrounded by similar sized and shaped
natural grains. These images highlight the relative ease of identifying, separating and sizing both the
Magenta and Orange tracer particles found in a sample. Both colours of tracer particles are easy to
distinguish from natural sand grains once the white light illumination is turned to zero and only fluorescence
illumination is present, as per the right-hand images for both tracers.
For
insp
ectio
n pur
pose
s only
.
Conse
nt of
copy
right
owne
r req
uired
for a
ny ot
her u
se.
EPA Export 27-01-2014:23:27:24

Water Injection Dredging Tracer Study – Cork. Environmental Impact and Sediment Transport Study
ETS Worldwide Ltd
37
Figure B.1. Fluorescence micrographs of the magenta tracer particles from actual samples under white light (left) and fluorescence illumination (right)
Figure B.2. Fluorescence micrographs of the yellow tracer particles from actual samples under white light (left) and fluorescence illumination (right).
For
insp
ectio
n pur
pose
s only
.
Conse
nt of
copy
right
owne
r req
uired
for a
ny ot
her u
se.
EPA Export 27-01-2014:23:27:24

APPENDIX D TURBIDITY BUOYS
Three turbidity buoys were deployed for the project. One at Lough Mahon and two in the lowerharbour area.
Figure B-1: Buoy positions
Each of these buoy was equipped with a warning light, radar reflector, data logger, power supply(battery and solar panels), GPRS modem, and turbidity sensor.
Figure B-2: Buoy 1
Actual turbidity measuring was performed by the McVan NEP 395 turbidity sensor (See FigureB-4) mounted 2m below the surface on a buoy. This sensor measures turbidity in NTU’saccording to the Optical Back Scatter principle and is calibrated as per the supplier’s
For
insp
ectio
n pur
pose
s only
.
Conse
nt of
copy
right
owne
r req
uired
for a
ny ot
her u
se.
EPA Export 27-01-2014:23:27:24

specifications. Although the proposed sensors have a self-cleaning mechanism, regularlycleaning and calibration was conducted by ASU, approximately every two weeks.
Every 5 minutes turbidity values were recorded. One per hour these data were collected andsent to the Van Oord ftp server by the GPRS modem.
Figure B-3: Buoy 2 fouling (close-up) 22/8/2011. To prevent excessive fouling, the buoys werecleaned every two weeks.
Figure B-4: McVan Analite turbidity sensor
For
insp
ectio
n pur
pose
s only
.
Conse
nt of
copy
right
owne
r req
uired
for a
ny ot
her u
se.
EPA Export 27-01-2014:23:27:24
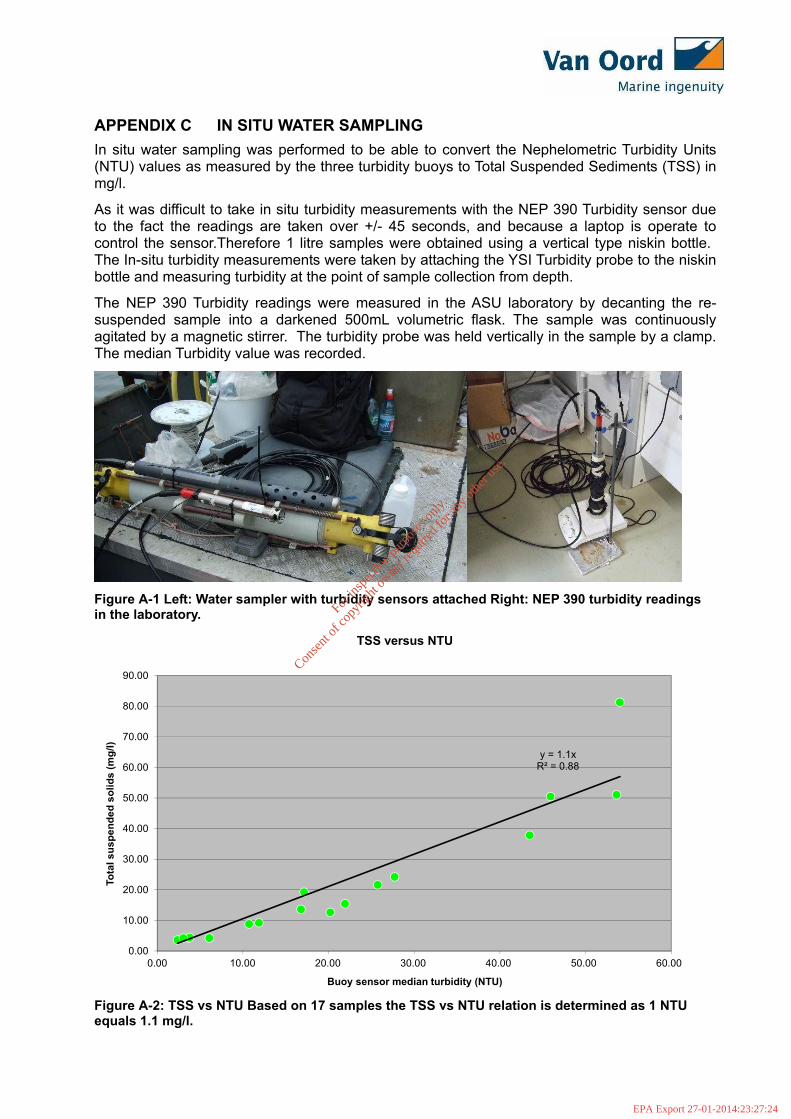
APPENDIX C IN SITU WATER SAMPLING
In situ water sampling was performed to be able to convert the Nephelometric Turbidity Units(NTU) values as measured by the three turbidity buoys to Total Suspended Sediments (TSS) inmg/l.
As it was difficult to take in situ turbidity measurements with the NEP 390 Turbidity sensor dueto the fact the readings are taken over +/- 45 seconds, and because a laptop is operate tocontrol the sensor.Therefore 1 litre samples were obtained using a vertical type niskin bottle.The In-situ turbidity measurements were taken by attaching the YSI Turbidity probe to the niskinbottle and measuring turbidity at the point of sample collection from depth.
The NEP 390 Turbidity readings were measured in the ASU laboratory by decanting the re-suspended sample into a darkened 500mL volumetric flask. The sample was continuouslyagitated by a magnetic stirrer. The turbidity probe was held vertically in the sample by a clamp.The median Turbidity value was recorded.
Figure A-1 Left: Water sampler with turbidity sensors attached Right: NEP 390 turbidity readingsin the laboratory.
y = 1.1xR² = 0.88
0.00
10.00
20.00
30.00
40.00
50.00
60.00
70.00
80.00
90.00
0.00 10.00 20.00 30.00 40.00 50.00 60.00
To
tals
us
pe
nd
ed
so
lid
s(m
g/l
)
Buoy sensor median turbidity (NTU)
TSS versus NTU
Figure A-2: TSS vs NTU Based on 17 samples the TSS vs NTU relation is determined as 1 NTUequals 1.1 mg/l.
For
insp
ectio
n pur
pose
s only
.
Conse
nt of
copy
right
owne
r req
uired
for a
ny ot
her u
se.
EPA Export 27-01-2014:23:27:24

sample Day TimeGPS N Lat /
Northing
GPS E Long /
EastingSite Sample YSI 6136 NEP
Hanna
HI93703YSI 6136 NEP Comment
1 01-09-2011 10:40 051°54.004 008°27.936 5.80 2 13.40 13.40 16.78 13.60 North Channell, Tied fast to bridge
2 01-09-2011 11:06 051°54.003 008°27.915 1.5 7.50 5.90 6.08 4.20
3 01-09-2011 11:16 051°53.966 008°27.720 9.50 5 26.00 37.60 43.49 37.80North Channell, sampling at the quay
wall
4 01-09-2011 11:30 051°54.028 008°27.315 7.40 1 27.80 25.31 27.72 24.18100m down stream from Jetsed while it
was dredging
5 01-09-2011 11:34 051°54.028 008°27.315 7.40 3 26.00 44.70 53.62 51.00100m down stream from Jetsed while it
was dredging
6 01-09-2011 11:38 051°54.028 008°27.315 7.40 5 22.00 41.96 45.92 50.42100m down stream from Jetsed while it
was dredging
7 01-09-2011 11:42 051°54.028 008°27.315 7.40 6 36.00 53.00 54.01 81.25100m down stream from Jetsed while it
was dredging
8 04-10-2011 12:20 178506 65146 7.8 2 3.4 3.09 3.3 3.70 4.20
near Ringaskiddy Turbidity Buoy.
Skipper was holding position with the
motor.
9 04-10-2011 12:29 17845 65162 12 10 3.3 3.54 2.8 2.36 3.56 samples collected at an angle
10 04-10-2011 12:48 177241 65541 7.5 6 3.8 3.45 3.4 3.79 4.40 Tied to Monkstown Turbidity Buoy
11 04-10-2011 13:51 173807 71242 8.55 2 12.1 13.8 8.7 10.72 8.80 Tied to Lough Mahon Turbidity Buoy.
12 04-10-2011 14:06 173807 71242 8.55 8 15.3 15.3 18.5 17.15 19.20
13 04-10-2011 14:29 171775 71911 5.8 5 21 24.6 20.9 25.74 21.60Tied to R18 red buoy at Blackrock 200M
d/s from Jetsed
14 04-10-2011 14:34 171775 71911 5.8 2 16.6 20.12 16.4 21.92 15.40Tied to R18 red buoy at Blackrock 200M
d/s from Jetsed
15 04-10-2011 15:00 169059 72176 8 3 15.9 21.95 14.4 20.20 12.60Tied to corner of blue jetty moored at
city quays
16 04-10-2011 15:05 169059 72176 8 7 10.8 12.15 10.4 11.88 9.20
17 04-10-2011 15:10 169059 72176 8 0 3.3 2.98 3 3.05 4.20
suspended
solids mg/l
Date (GMT+1) In-Situ Turbidity lab turbidityCoordinates Depth (m)
Figure A-3: Results of in situ turbidity measurements and laboratory measurements on samplestaken during in situ sampling
For
insp
ectio
n pur
pose
s only
.
Conse
nt of
copy
right
owne
r req
uired
for a
ny ot
her u
se.
EPA Export 27-01-2014:23:27:24

Appendix B
Cork Harbour
Sediment Pin Survey (December 2011)
Commissioned by: Van Oord Carried out by: Aquatic Services Unit December 2011
For
insp
ectio
n pur
pose
s only
.
Conse
nt of
copy
right
owne
r req
uired
for a
ny ot
her u
se.
EPA Export 27-01-2014:23:27:25

Aquatic Services Unit MS 111219 Cork Harbour Sediment Pin Report 2
1 INTRODUCTION AND BRIEF On behalf of Van Oord and Port of Cork., Aquatic Services Unit (ASU) undertook a survey of the soft sediment to assess the potential for sediment accretion or erosion at selected sites across the Lough Mahon and Ringaskiddy areas of Cork Harbour during maintenance dredging operations which were being undertaken at the time in the City Quays, Tivoli, Lough Mahon and Ringaskiddy Basin. ASU deployed sediment erosion pins across several key locations to assess vertical movement of sediment at these sites. 2 METHODOLOGY Paired sediment pins were placed across 13 locations within Cork Harbour at the positions indicated in Figure 2.1 and Table 2.1 A full list of sampling dates on which the pins were deployed and monitored is presented in the Appendix to this report. The baseline survey was undertaken on the 21st 22nd & 24th July, 2011 for pins LM1 – LM9 & LM11 – LM12. Baseline data was collected for LM10 & LM13 was collected on 12th August, 2011. Subsequent surveys were undertaken in August, September and October for all sites, and an additional run in November for the Lough Mahon sites (LM1-8)
Station Co-ordinates (Irish National Grid)
Easting (m) Northing (m)
Sediment Pin Locations
LM1 173854 70878
LM2 174267 69969
LM3 175568 69842
LM4 176030 70724
LM5 176195 70748
LM6 176559 70504
LM7 177374 70144
LM8 177502 70149
LM9 176300 65206
LM10 176570 65331
LM11 178257 64683
LM12 179125 64680
LM13 173909 69598
Table 2.1 Positions of sediment pin sampling stations. All sampling locations are
given in Irish National Grid. At each site, paired sediment pins 1m apart were driven sufficiently into the sediment so as not to further subside or be accidentally exhumed. A straight bar was levelled between the pins using a spirit level and five pre-defined, evenly spaced measurements from the bar to the sediment surface were taken. Measurements along the bar were not taken too close to the pins, so as to void the impact of possible localised scouring or accretion in the immediate vicinity of the sediment pins.
For
insp
ectio
n pur
pose
s only
.
Conse
nt of
copy
right
owne
r req
uired
for a
ny ot
her u
se.
EPA Export 27-01-2014:23:27:25

Aquatic Services Unit MS 111219 Cork Harbour Sediment Pin Report 3
During each monitoring event, the measuring bar was checked to see it was level and measurements were taken at the same locations from which the baseline measurements were taken. At each site the average of five measurements between the paired pins was taken to calculate the levels of accretion/erosion at that site. Although no Particle Size Analysis (PSA) was conducted during the present survey, samples for PSA were collected at each sediment pin location during each sampling effort and stored in the event that PSA would be required.
Figure 2.1 Figure showing the sediment pin sampling locations across Cork
Harbour.
For
insp
ectio
n pur
pose
s only
.
Conse
nt of
copy
right
owne
r req
uired
for a
ny ot
her u
se.
EPA Export 27-01-2014:23:27:25

Aquatic Services Unit MS 111219 Cork Harbour Sediment Pin Report 4
3 RESULTS Results from the sediment pin monitoring indicate that levels of erosion an accretion vary across the harbour. Graphical representation of these results is presented in Figure 3.1 and Table 3.1. A full list of all measurements taken and notes recorded for each site is presented in the Appendix. Results indicate the mid and low water sites in Lough Mahon showed large sediment variation during the survey period. Small levels of accretion were identified at LM1 during the course of the survey, but this wasn’t reflected in the remaining sites in the upper harbour. Erosion was identified at the remaining Lough Mahon sites (LM2 – LM8). The sediment pins at LM 7, LM 8 and to a lesser extent LM 4 showed signs of impact from algal debris in the water column collecting against them. This resulted in large amounts of erosion at these sites. The reasons for this observation is not known, although it is known that the site is subject to a large amount of wind-driven movement as the fetch is quite large ain this area and large volumes of water pass through the system from the Rivers Lee and Glashaboy. The lower harbour sites (LM9-LM12) showed small levels of accretion across all the sites, indicating that this area may be subjected to much smaller degrees of water movement across the sites. The levels of accretion would be considered small (in general, these levels were circa. 1cm across the area) although levels were slightly higher in the Monkstown Creek sites (LM9 & LM10). One point of note was the presence of a layer of green algae at all the sites during the course of the present survey. It is not known if this was a result of the dredging operations, e.g. releasing nutrients into the system, or whether this is just a seasonal trend in the harbour.
For in
spec
tion p
urpo
ses o
nly.
Conse
nt of
copy
right
owne
r req
uired
for a
ny ot
her u
se.
EPA Export 27-01-2014:23:27:25
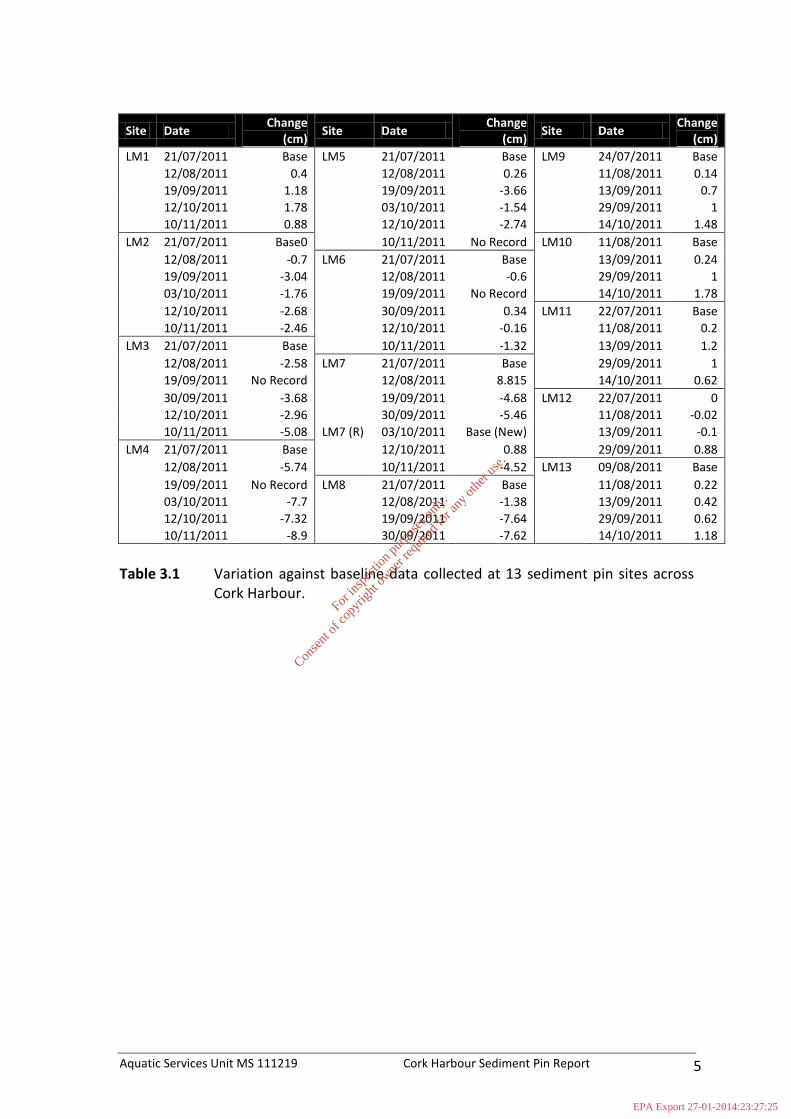
Aquatic Services Unit MS 111219 Cork Harbour Sediment Pin Report 5
Site Date Change
(cm) Site Date
Change (cm)
Site Date Change
(cm)
LM1 21/07/2011 Base LM5 21/07/2011 Base LM9 24/07/2011 Base
12/08/2011 0.4 12/08/2011 0.26 11/08/2011 0.14
19/09/2011 1.18 19/09/2011 -3.66 13/09/2011 0.7
12/10/2011 1.78 03/10/2011 -1.54 29/09/2011 1
10/11/2011 0.88 12/10/2011 -2.74 14/10/2011 1.48
LM2 21/07/2011 Base0 10/11/2011 No Record LM10 11/08/2011 Base
12/08/2011 -0.7 LM6 21/07/2011 Base 13/09/2011 0.24
19/09/2011 -3.04 12/08/2011 -0.6 29/09/2011 1
03/10/2011 -1.76 19/09/2011 No Record 14/10/2011 1.78
12/10/2011 -2.68 30/09/2011 0.34 LM11 22/07/2011 Base
10/11/2011 -2.46 12/10/2011 -0.16 11/08/2011 0.2
LM3 21/07/2011 Base 10/11/2011 -1.32 13/09/2011 1.2
12/08/2011 -2.58 LM7 21/07/2011 Base 29/09/2011 1
19/09/2011 No Record 12/08/2011 8.815 14/10/2011 0.62
30/09/2011 -3.68 19/09/2011 -4.68 LM12 22/07/2011 0
12/10/2011 -2.96 30/09/2011 -5.46 11/08/2011 -0.02
10/11/2011 -5.08 LM7 (R) 03/10/2011 Base (New) 13/09/2011 -0.1
LM4 21/07/2011 Base 12/10/2011 0.88 29/09/2011 0.88
12/08/2011 -5.74 10/11/2011 -4.52 LM13 09/08/2011 Base
19/09/2011 No Record LM8 21/07/2011 Base 11/08/2011 0.22
03/10/2011 -7.7 12/08/2011 -1.38 13/09/2011 0.42
12/10/2011 -7.32 19/09/2011 -7.64 29/09/2011 0.62
10/11/2011 -8.9 30/09/2011 -7.62 14/10/2011 1.18
Table 3.1 Variation against baseline data collected at 13 sediment pin sites across
Cork Harbour.
For
insp
ectio
n pur
pose
s only
.
Conse
nt of
copy
right
owne
r req
uired
for a
ny ot
her u
se.
EPA Export 27-01-2014:23:27:25
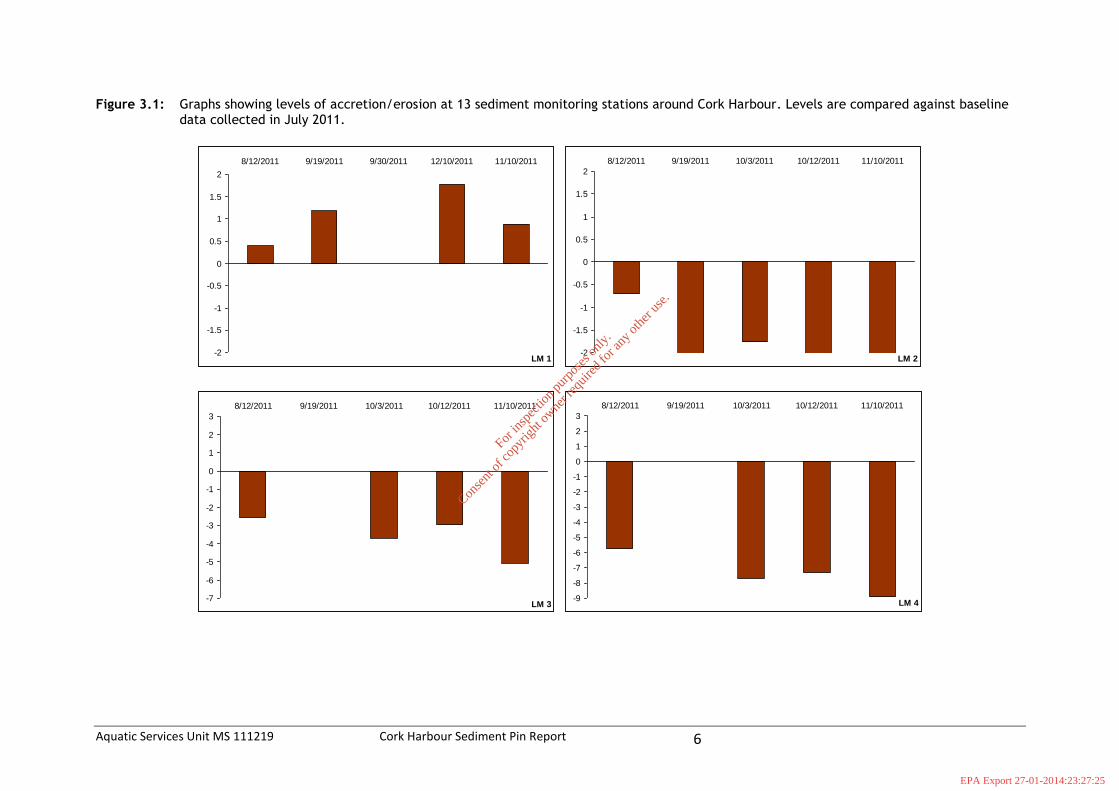
Aquatic Services Unit MS 111219 Cork Harbour Sediment Pin Report 6
Figure 3.1: Graphs showing levels of accretion/erosion at 13 sediment monitoring stations around Cork Harbour. Levels are compared against baseline data collected in July 2011.
-2
-1.5
-1
-0.5
0
0.5
1
1.5
28/12/2011 9/19/2011 9/30/2011 12/10/2011 11/10/2011
LM 1
-2
-1.5
-1
-0.5
0
0.5
1
1.5
28/12/2011 9/19/2011 10/3/2011 10/12/2011 11/10/2011
LM 2
-7
-6
-5
-4
-3
-2
-1
0
1
2
38/12/2011 9/19/2011 10/3/2011 10/12/2011 11/10/2011
LM 3
-9
-8
-7
-6
-5
-4
-3
-2
-1
0
1
2
38/12/2011 9/19/2011 10/3/2011 10/12/2011 11/10/2011
LM 4
For
insp
ectio
n pur
pose
s only
.
Conse
nt of
copy
right
owne
r req
uired
for a
ny ot
her u
se.
EPA Export 27-01-2014:23:27:25

Aquatic Services Unit MS 111219 Cork Harbour Sediment Pin Report 7
Figure 3.1 (contd): Graphs showing levels of accretion/erosion at 13 sediment monitoring stations around Cork Harbour. Levels are compared against baseline data collected in July 2011.
-4
-3
-2
-1
0
1
2
38/12/2011 9/19/2011 10/3/2011 10/12/2011 11/10/2011
LM 5
-2
-1.5
-1
-0.5
0
0.5
1
1.5
28/12/2011 9/19/2011 10/3/2011 10/12/2011 11/10/2011
LM 6
-8
-6
-4
-2
0
2
4
6
8
108/12/2011 9/19/2011 9/30/2011
LM 7a
-5
-4
-3
-2
-1
0
1
210/12/2011 11/10/2011
LM 7b
For
insp
ectio
n pur
pose
s only
.
Conse
nt of
copy
right
owne
r req
uired
for a
ny ot
her u
se.
EPA Export 27-01-2014:23:27:25

Aquatic Services Unit MS 111219 Cork Harbour Sediment Pin Report 8
Figure 3.1 (contd): Graphs showing levels of accretion/erosion at 13 sediment monitoring stations around Cork Harbour. Levels are compared against baseline data collected in July 2011.
-2
-1.5
-1
-0.5
0
0.5
1
1.5
28/12/2011 9/19/2011 9/30/2011
LM 8
-2
-1.5
-1
-0.5
0
0.5
1
1.5
28/11/2011 9/13/2011 9/29/2011 10/14/2011
LM 9
-2
-1.5
-1
-0.5
0
0.5
1
1.5
29/13/2011 9/29/2011 10/14/2011
LM 10
-2
-1.5
-1
-0.5
0
0.5
1
1.5
28/11/2011 9/13/2011 9/29/2011 10/14/2011
LM 11
For
insp
ectio
n pur
pose
s only
.
Conse
nt of
copy
right
owne
r req
uired
for a
ny ot
her u
se.
EPA Export 27-01-2014:23:27:25
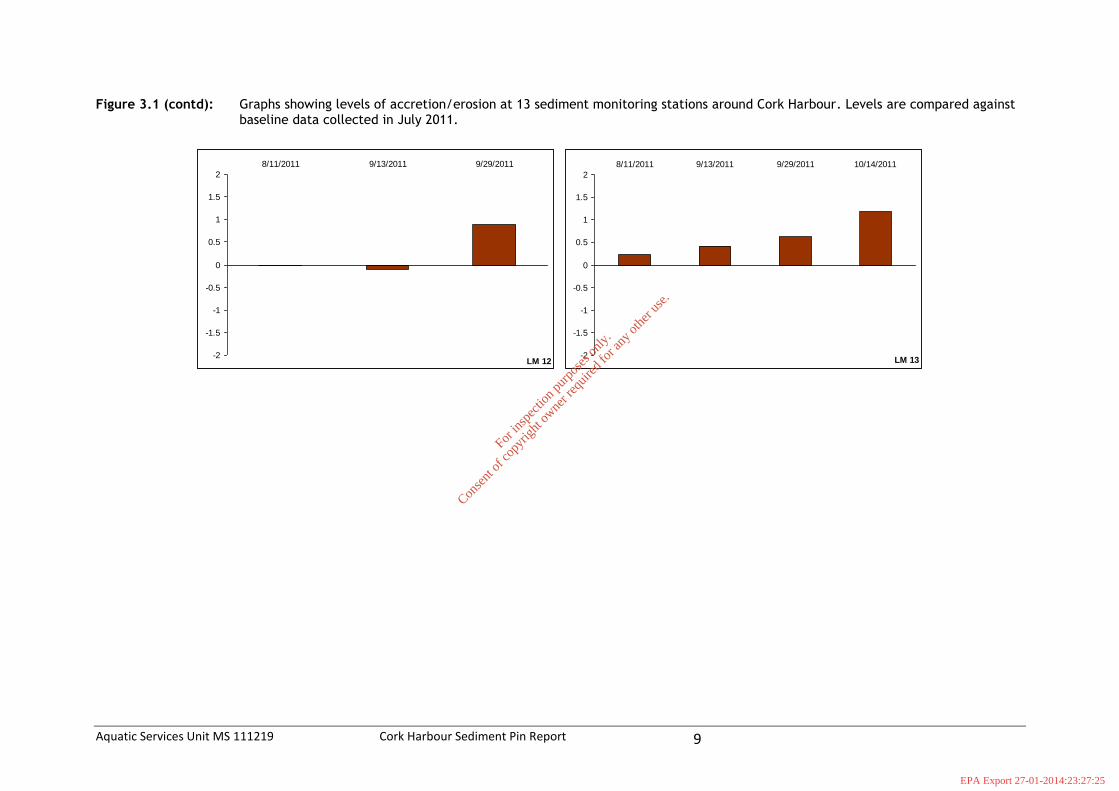
Aquatic Services Unit MS 111219 Cork Harbour Sediment Pin Report 9
Figure 3.1 (contd): Graphs showing levels of accretion/erosion at 13 sediment monitoring stations around Cork Harbour. Levels are compared against baseline data collected in July 2011.
-2
-1.5
-1
-0.5
0
0.5
1
1.5
28/11/2011 9/13/2011 9/29/2011
LM 12
-2
-1.5
-1
-0.5
0
0.5
1
1.5
28/11/2011 9/13/2011 9/29/2011 10/14/2011
LM 13
For
insp
ectio
n pur
pose
s only
.
Conse
nt of
copy
right
owne
r req
uired
for a
ny ot
her u
se.
EPA Export 27-01-2014:23:27:25

Aquatic Services Unit MS 111219 Cork Harbour Sediment Pin Report 10
4 CONCLUSIONS Results from the present survey show that the levels of erosion/accretion across the survey area are inconsistent. Levels of accretion were identified on the inner most site (LM1) although amounts were generally small (<+1cm). The remaining sites in the upper harbour area showed varying degrees of erosion across the survey area with amounts varying from about -0.5-2.0cm e.g. at LM2 up to -5cm to - 9cm at LM3 and LM 4 respectively. The reasons for the erosion are not known, although the large fetch in the area and large volumes of water from the River Lee may be influencing the results. In addition, large amounts of debris were present in the system, some of which became entangled with pins at three sites (LM 4, LM 7 & LM 8). All the lower harbour sites (LM 9 – LM 12) showed accretion only, similar to that identified in LM 1 (~1cm). This indicates perhaps that the lower harbour sites were located in a more sheltered environment, and subjected to less water movement that the Lough Mahon sites. It is not known from the results obtained whether the dredging exercise had an impact on the sediment accretion and erosion levels recorded at the monitoring sites. The upper harbour area showed levels of erosion at most of its sites, with only a single site showing any degree of accretion, while in the Lower Harbour survey area approximately 1cm of accretion was observed at all sites. In addition, it is not known if the observed levels of erosion and accretion are within the normal range of variation occurring at these sites.
For
insp
ectio
n pur
pose
s only
.
Conse
nt of
copy
right
owne
r req
uired
for a
ny ot
her u
se.
EPA Export 27-01-2014:23:27:25

Aquatic Services Unit MS 111219 Cork Harbour Sediment Pin Report 11
APPENDIX 1 – Raw Data collected at each of the sediment pins.
For
insp
ectio
n pur
pose
s only
.
Conse
nt of
copy
right
owne
r req
uired
for a
ny ot
her u
se.
EPA Export 27-01-2014:23:27:25
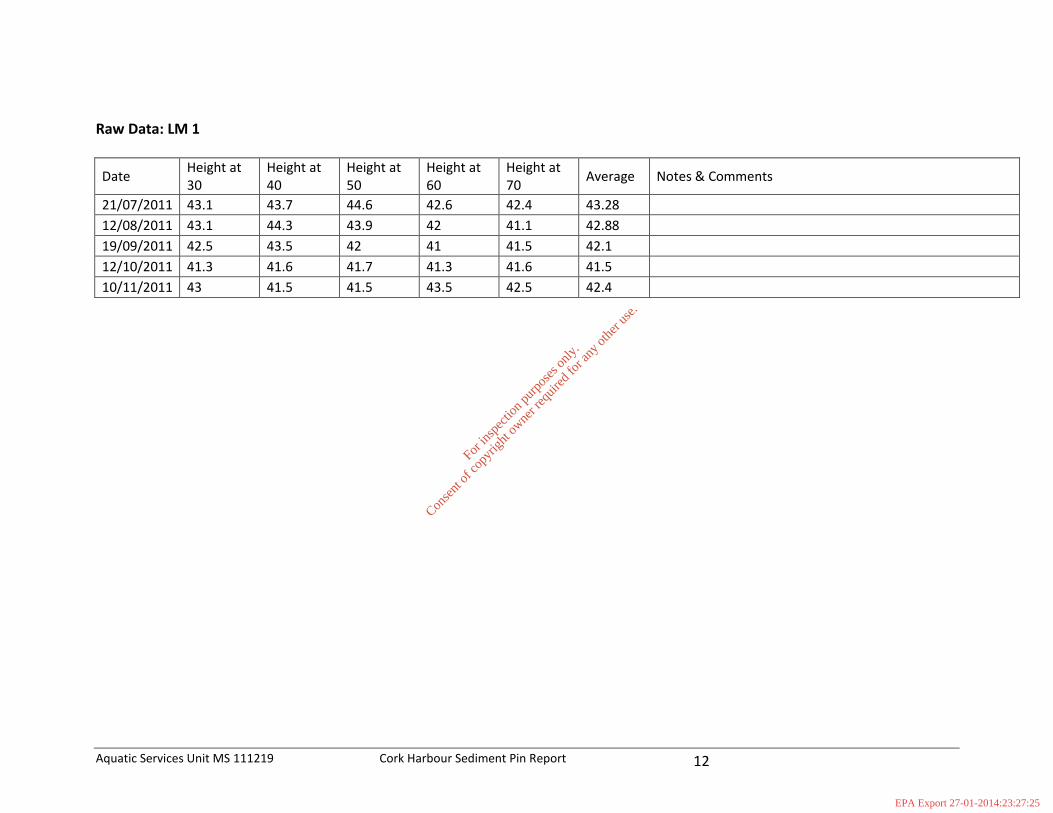
Aquatic Services Unit MS 111219 Cork Harbour Sediment Pin Report 12
Raw Data: LM 1
Date Height at 30
Height at 40
Height at 50
Height at 60
Height at 70
Average Notes & Comments
21/07/2011 43.1 43.7 44.6 42.6 42.4 43.28
12/08/2011 43.1 44.3 43.9 42 41.1 42.88
19/09/2011 42.5 43.5 42 41 41.5 42.1
12/10/2011 41.3 41.6 41.7 41.3 41.6 41.5
10/11/2011 43 41.5 41.5 43.5 42.5 42.4
For
insp
ectio
n pur
pose
s only
.
Conse
nt of
copy
right
owne
r req
uired
for a
ny ot
her u
se.
EPA Export 27-01-2014:23:27:25
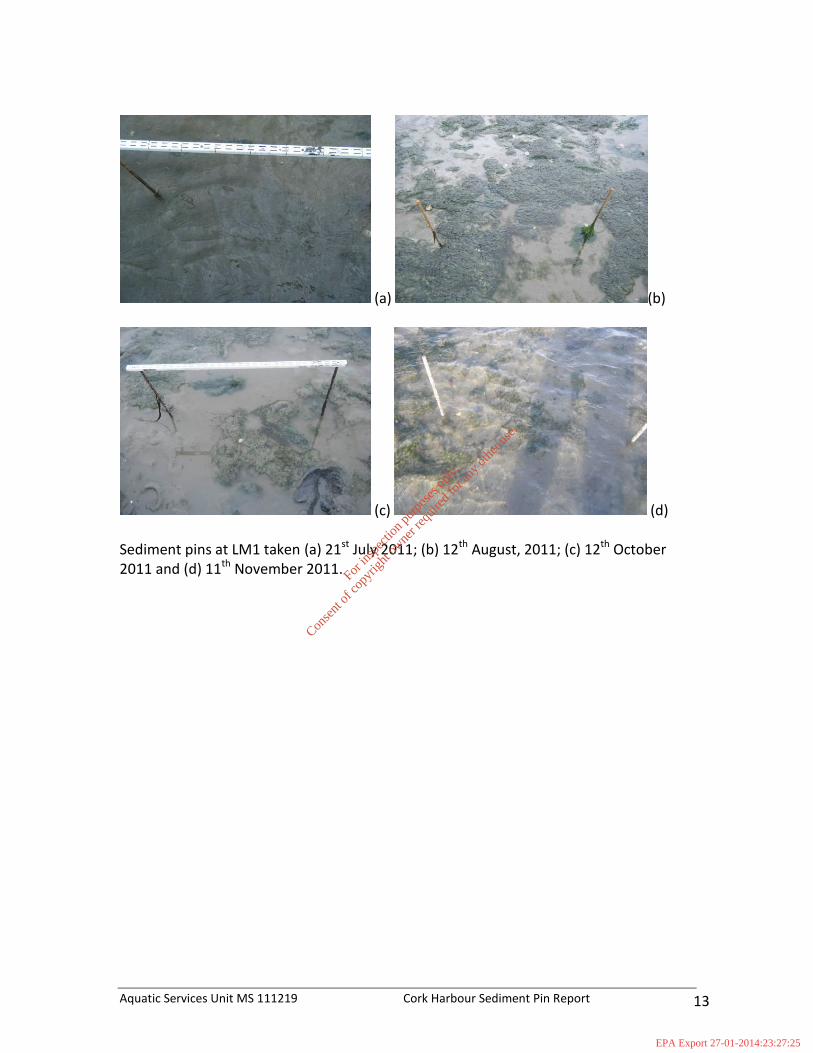
Aquatic Services Unit MS 111219 Cork Harbour Sediment Pin Report 13
(a) (b)
(c) (d) Sediment pins at LM1 taken (a) 21st July 2011; (b) 12th August, 2011; (c) 12th October 2011 and (d) 11th November 2011.
For
insp
ectio
n pur
pose
s only
.
Conse
nt of
copy
right
owne
r req
uired
for a
ny ot
her u
se.
EPA Export 27-01-2014:23:27:25

Aquatic Services Unit MS 111219 Cork Harbour Sediment Pin Report 14
Raw Data: LM 2
Date Height at 30
Height at 40
Height at 50
Height at 60
Height at 70
Average Notes & Comments
21/07/2011 34.8 35.2 36.6 35.5 35.8 35.58
12/08/2011 37 36.2 36 36.2 36 36.28
19/09/2011 38.5 37.7 38 38.9 40 38.62
03/10/2011 36.8 36.2 36.9 37.9 38.9 37.34
12/10/2011 38 37.8 37.8 38.7 39 38.26
10/11/2011 37.9 38 37.9 37.9 38.5 38.04
For
insp
ectio
n pur
pose
s only
.
Conse
nt of
copy
right
owne
r req
uired
for a
ny ot
her u
se.
EPA Export 27-01-2014:23:27:25
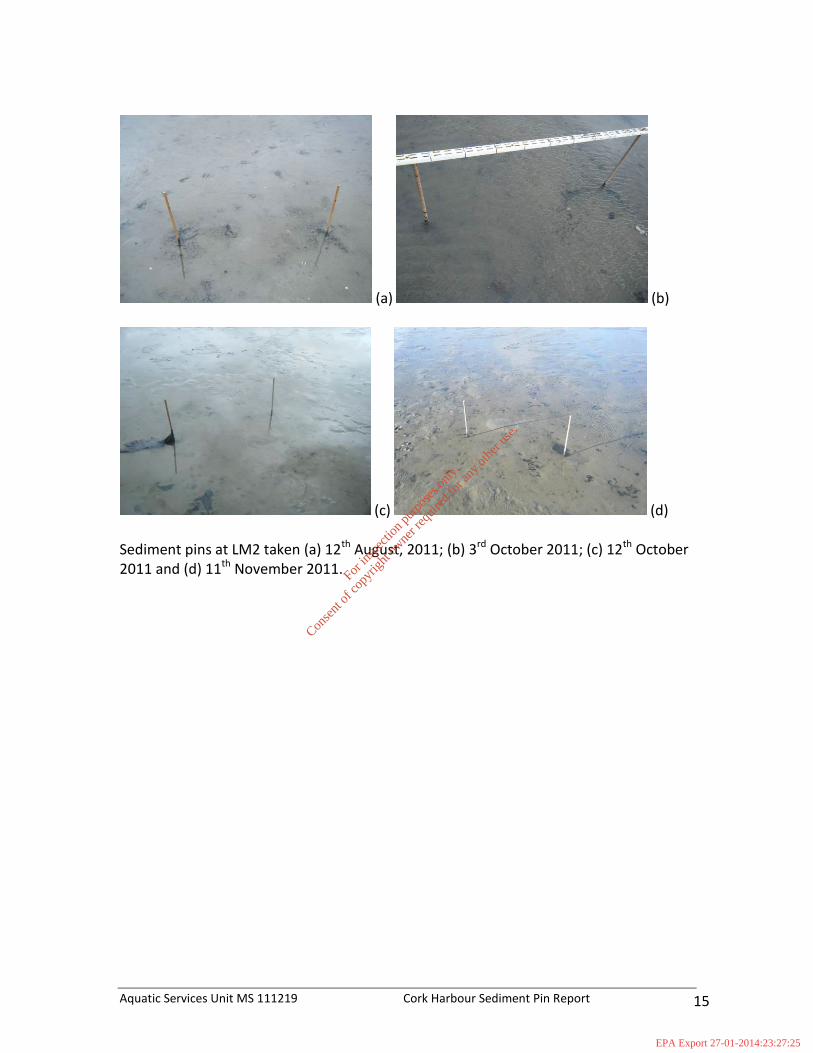
Aquatic Services Unit MS 111219 Cork Harbour Sediment Pin Report 15
(a) (b)
(c) (d) Sediment pins at LM2 taken (a) 12th August, 2011; (b) 3rd October 2011; (c) 12th October 2011 and (d) 11th November 2011.
For
insp
ectio
n pur
pose
s only
.
Conse
nt of
copy
right
owne
r req
uired
for a
ny ot
her u
se.
EPA Export 27-01-2014:23:27:25
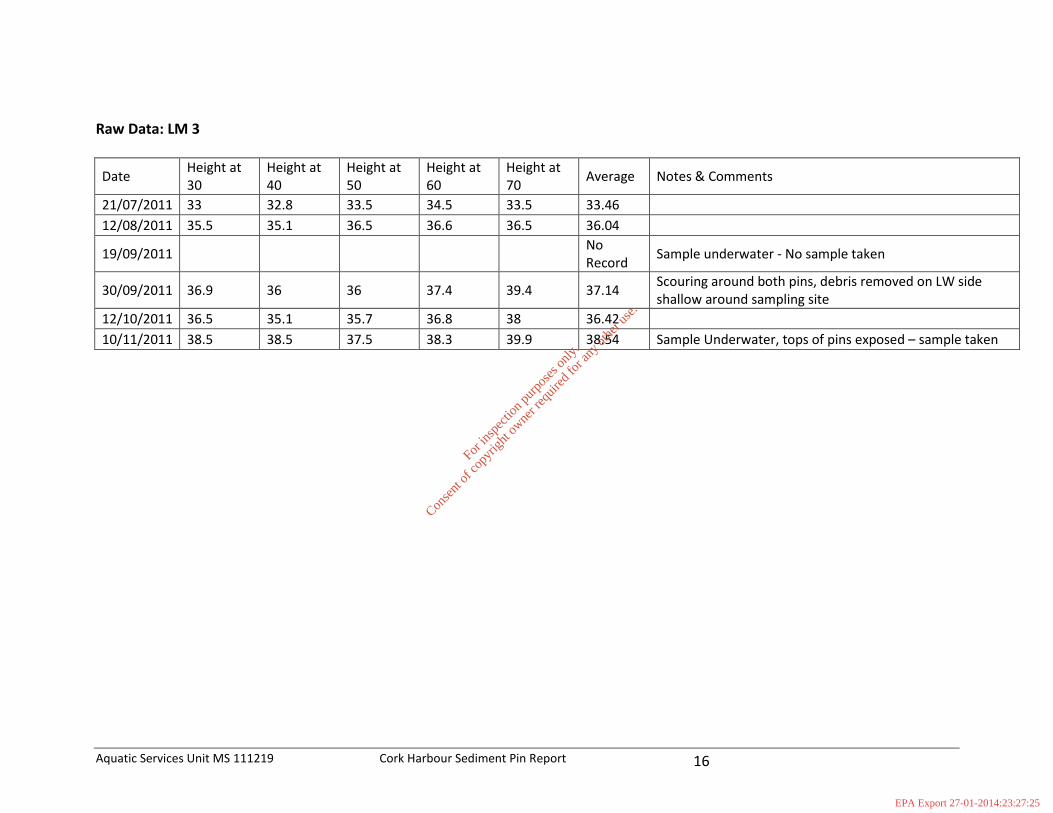
Aquatic Services Unit MS 111219 Cork Harbour Sediment Pin Report 16
Raw Data: LM 3
Date Height at 30
Height at 40
Height at 50
Height at 60
Height at 70
Average Notes & Comments
21/07/2011 33 32.8 33.5 34.5 33.5 33.46
12/08/2011 35.5 35.1 36.5 36.6 36.5 36.04
19/09/2011 No Record
Sample underwater - No sample taken
30/09/2011 36.9 36 36 37.4 39.4 37.14 Scouring around both pins, debris removed on LW side shallow around sampling site
12/10/2011 36.5 35.1 35.7 36.8 38 36.42
10/11/2011 38.5 38.5 37.5 38.3 39.9 38.54 Sample Underwater, tops of pins exposed – sample taken
For
insp
ectio
n pur
pose
s only
.
Conse
nt of
copy
right
owne
r req
uired
for a
ny ot
her u
se.
EPA Export 27-01-2014:23:27:25

Aquatic Services Unit MS 111219 Cork Harbour Sediment Pin Report 17
(a) (b)
(c) Sediment pins at LM3 taken (a) 12th August, 2011; (b) 30th September, 2011 with debris attached to one of the pins and (c) 12th October 2011.
For
insp
ectio
n pur
pose
s only
.
Conse
nt of
copy
right
owne
r req
uired
for a
ny ot
her u
se.
EPA Export 27-01-2014:23:27:25
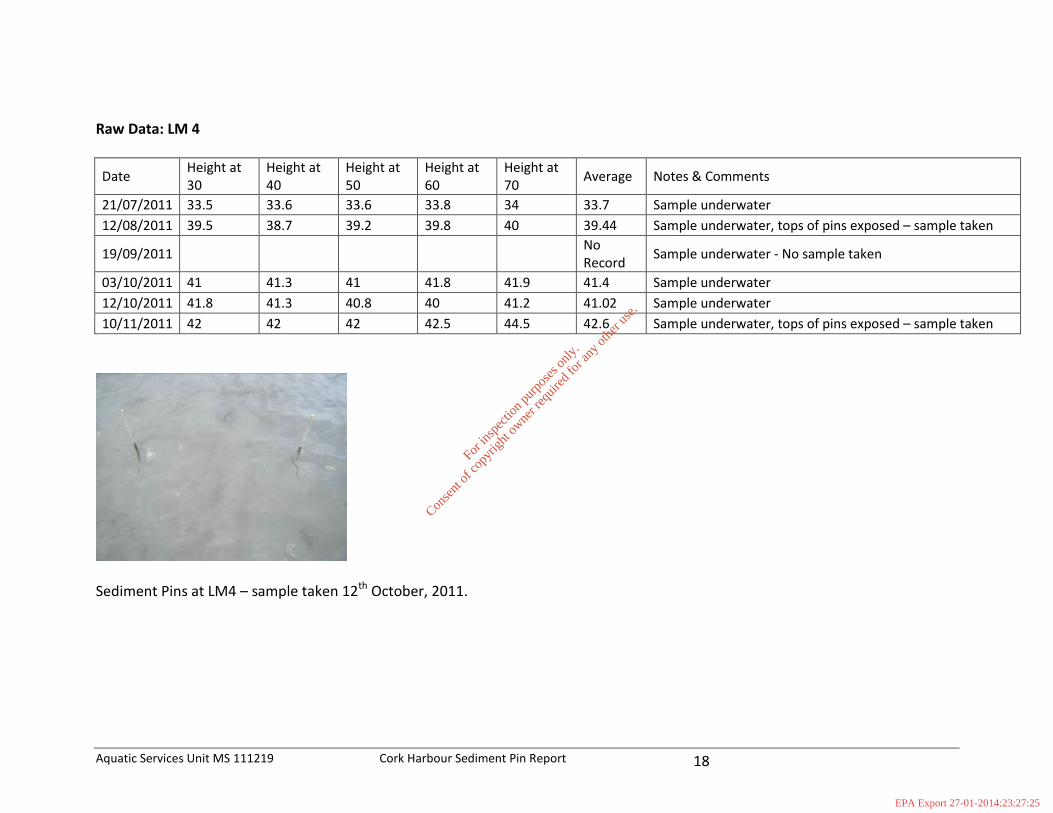
Aquatic Services Unit MS 111219 Cork Harbour Sediment Pin Report 18
Raw Data: LM 4
Date Height at 30
Height at 40
Height at 50
Height at 60
Height at 70
Average Notes & Comments
21/07/2011 33.5 33.6 33.6 33.8 34 33.7 Sample underwater
12/08/2011 39.5 38.7 39.2 39.8 40 39.44 Sample underwater, tops of pins exposed – sample taken
19/09/2011 No Record
Sample underwater - No sample taken
03/10/2011 41 41.3 41 41.8 41.9 41.4 Sample underwater
12/10/2011 41.8 41.3 40.8 40 41.2 41.02 Sample underwater
10/11/2011 42 42 42 42.5 44.5 42.6 Sample underwater, tops of pins exposed – sample taken
Sediment Pins at LM4 – sample taken 12th October, 2011.
For
insp
ectio
n pur
pose
s only
.
Conse
nt of
copy
right
owne
r req
uired
for a
ny ot
her u
se.
EPA Export 27-01-2014:23:27:25

Aquatic Services Unit MS 111219 Cork Harbour Sediment Pin Report 19
Raw Data: LM 5
Date Height at 30
Height at 40
Height at 50
Height at 60
Height at 70
Average Notes & Comments
21/07/2011 35 35.3 35.5 35.9 35.6 35.46
12/08/2011 35.3 34.9 35 35.1 35.7 35.2
19/09/2011 40.7 39 38.7 38.7 38.5 39.12
03/10/2011 38.1 37.1 36.2 36.2 37.4 37
12/10/2011 39.8 39.2 37.8 36.7 37.5 38.2
10/11/2011 No Record
Sample underwater - No sample taken
(a) (b) Sediment pins at LM5 taken (a) 12th August, 2011 and (b) 12th October 2011.
For
insp
ectio
n pur
pose
s only
.
Conse
nt of
copy
right
owne
r req
uired
for a
ny ot
her u
se.
EPA Export 27-01-2014:23:27:25

Aquatic Services Unit MS 111219 Cork Harbour Sediment Pin Report 20
Raw Data: LM 6
Date Height at 30
Height at 40
Height at 50
Height at 60
Height at 70
Average Notes & Comments
21/07/2011 34.9 35.2 35.6 36.3 36.2 35.64
12/08/2011 35.9 36.1 36.5 36.5 36.2 36.24
19/09/2011 No Record
Sample underwater - No sample taken
30/09/2011 35.1 35.4 35.1 35.4 35.5 35.3
12/10/2011 35.8 35.6 35.6 36 36 35.8
10/11/2011 36.5 37 37 37.8 36.5 36.96 Sample Underwater, tops of pins exposed – sample taken
(a) (b) (c) Sediment pins at LM6 taken (a) 12th August, 2011; (b) 30th September, 2011 and (c) 12th October 2011.
For
insp
ectio
n pur
pose
s only
.
Conse
nt of
copy
right
owne
r req
uired
for a
ny ot
her u
se.
EPA Export 27-01-2014:23:27:25

Aquatic Services Unit MS 111219 Cork Harbour Sediment Pin Report 21
Raw Data: LM 7
Date Height at 30
Height at 40
Height at 50
Height at 60
Height at 70
Average Notes & Comments
21/07/2011 46.8 46.1 45.9 45.6 46.8 46.24
12/08/2011 53(Hole) 37.5 37.6 37 37.6 37.425 Scour @ 30cm [Hole present] data position removed from further analysis
19/09/2011 53 50 48.9 49.2 53.5 50.92
30/09/2011 55.5 52.8 49.8 50.3 50.1 51.7 Scoured around pins, kelp present between pins, hollow present around sampling site.
03/10/2011 35.6 36.1 36.3 37.9 37.5 36.68 Reset Pins; New Baseline measurement
12/10/2011 35.8 35.6 35.6 36 36 35.8 Difference taken on measurement from 03/10/2011
10/11/2011 40.5 44.5 41.5 39.5 40 41.2 Difference taken on measurement from 03/10/2011 Sample Underwater, tops of pins exposed – sample taken
(a) (b) (c) Sediment pins at LM7 taken 12th August, 2011; (b) 30th September, 2011 and (c) 12th October, 2011.
For
insp
ectio
n pur
pose
s only
.
Conse
nt of
copy
right
owne
r req
uired
for a
ny ot
her u
se.
EPA Export 27-01-2014:23:27:25

Aquatic Services Unit MS 111219 Cork Harbour Sediment Pin Report 22
Raw Data: LM 8
Date Height at 30
Height at 40
Height at 50
Height at 60
Height at 70
Average Notes & Comments
21/07/2011 33.1 33.1 33.4 33.6 33.3 33.3
12/08/2011 35.1 35 34.3 34.5 34.5 34.68
19/09/2011 40.7 40.6 40.6 40.8 42 40.94 Sample underwater - Sample Taken
30/09/2011 40.7 40.7 40.7 40.5 42 40.92 Kelp on both pins, scoured out site, removed kelp and re-measured. Sample site removed from further analysis.
(a) (b) Sediment pins at LM8 taken (a) 12th August, 2011; (b) 30th September, 2011.
For
insp
ectio
n pur
pose
s only
.
Conse
nt of
copy
right
owne
r req
uired
for a
ny ot
her u
se.
EPA Export 27-01-2014:23:27:25

Aquatic Services Unit MS 111219 Cork Harbour Sediment Pin Report 23
Raw Data: LM 9
Date Height at 30
Height at 40
Height at 50
Height at 60
Height at 70
Average Notes & Comments
24/07/2011 27 27 26.6 26.6 26.1 26.66
11/08/2011 27.2 26.6 26.5 26.2 26.1 26.52
13/09/2011 26.3 26.1 26 25.8 25.6 25.96
29/09/2011 25.9 25.9 25.4 25.5 25.6 25.66
14/10/2011 25.4 25.3 25.2 25 25 25.18
For
insp
ectio
n pur
pose
s only
.
Conse
nt of
copy
right
owne
r req
uired
for a
ny ot
her u
se.
EPA Export 27-01-2014:23:27:25
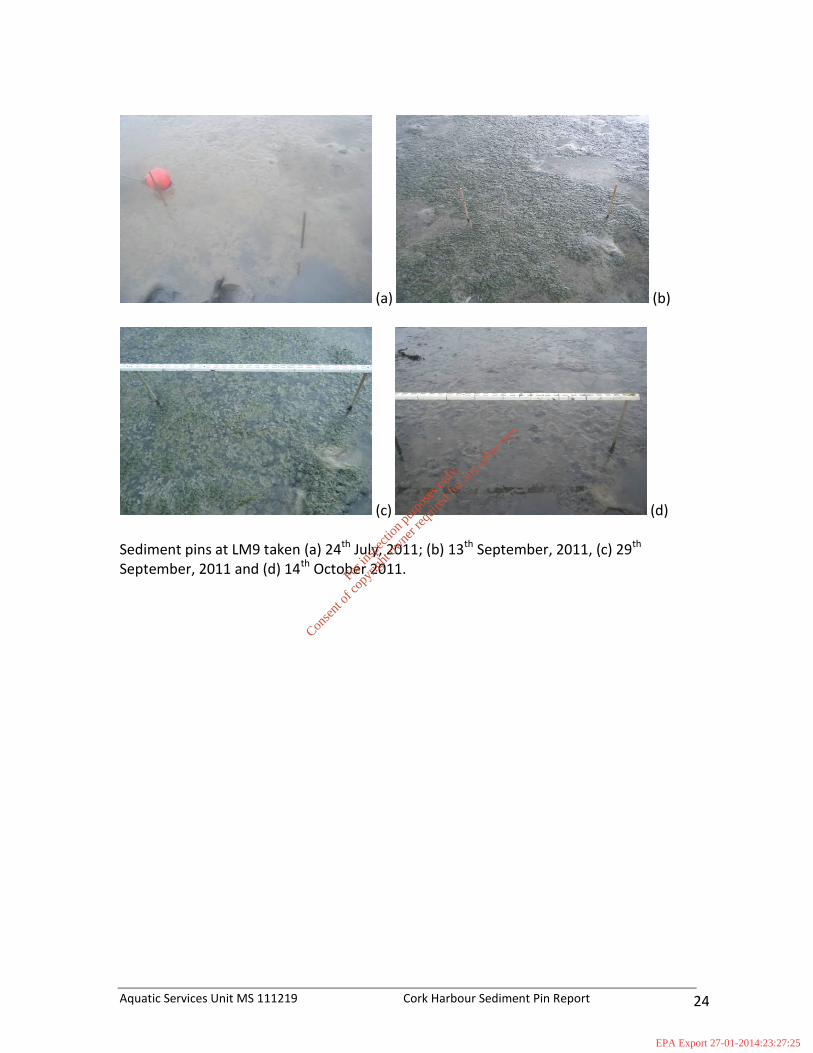
Aquatic Services Unit MS 111219 Cork Harbour Sediment Pin Report 24
(a) (b)
(c) (d) Sediment pins at LM9 taken (a) 24th July, 2011; (b) 13th September, 2011, (c) 29th September, 2011 and (d) 14th October 2011.
For
insp
ectio
n pur
pose
s only
.
Conse
nt of
copy
right
owne
r req
uired
for a
ny ot
her u
se.
EPA Export 27-01-2014:23:27:25
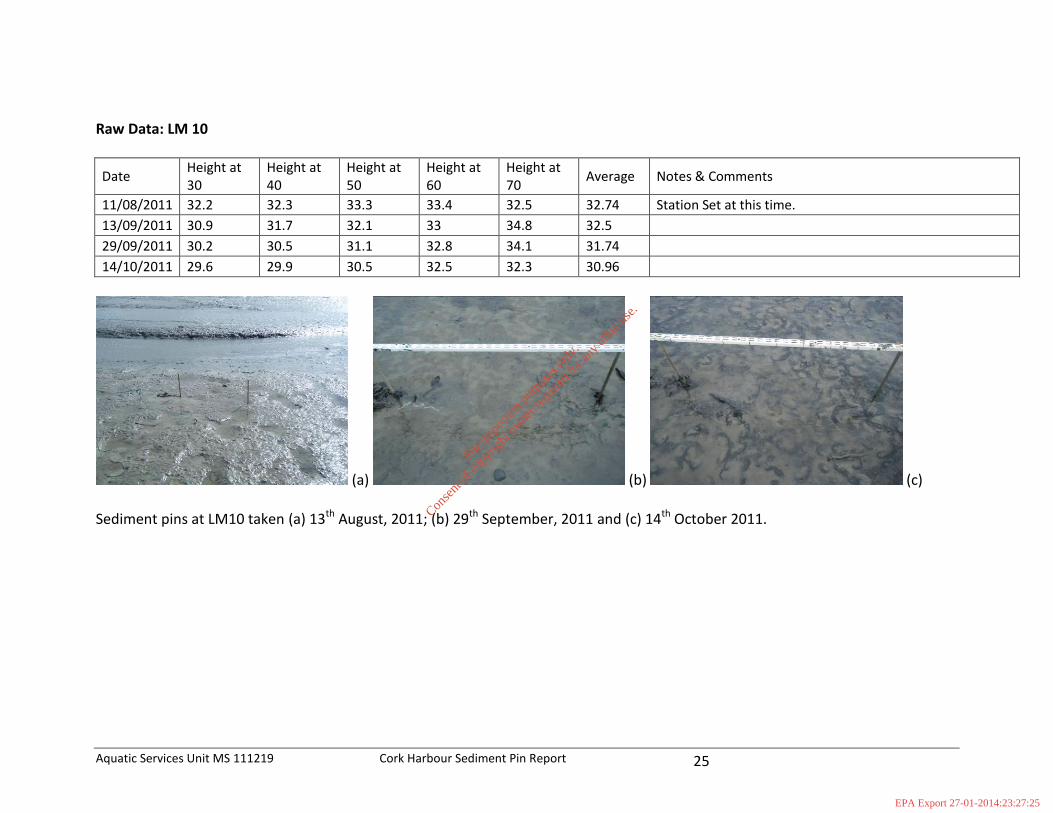
Aquatic Services Unit MS 111219 Cork Harbour Sediment Pin Report 25
Raw Data: LM 10
Date Height at 30
Height at 40
Height at 50
Height at 60
Height at 70
Average Notes & Comments
11/08/2011 32.2 32.3 33.3 33.4 32.5 32.74 Station Set at this time.
13/09/2011 30.9 31.7 32.1 33 34.8 32.5
29/09/2011 30.2 30.5 31.1 32.8 34.1 31.74
14/10/2011 29.6 29.9 30.5 32.5 32.3 30.96
(a) (b) (c) Sediment pins at LM10 taken (a) 13th August, 2011; (b) 29th September, 2011 and (c) 14th October 2011.
For
insp
ectio
n pur
pose
s only
.
Conse
nt of
copy
right
owne
r req
uired
for a
ny ot
her u
se.
EPA Export 27-01-2014:23:27:25

Aquatic Services Unit MS 111219 Cork Harbour Sediment Pin Report 26
Raw Data: LM 11
Date Height at 30
Height at 40
Height at 50
Height at 60
Height at 70
Average Notes & Comments
22/07/2011 29.6 29.5 29.5 30 29.7 29.66
11/08/2011 29.4 29 30.2 29.5 29.2 29.46
13/09/2011 28.4 28.7 29 28.2 28 28.46
29/09/2011 29.5 29 28.4 28.2 28.2 28.66
14/10/2011 29.3 29.5 29.4 29 28 29.04
(a) (b) (c) Sediment pins at LM11 taken 13th August, 2011; (b) 29th September, 2011 and (c) 14th October, 2011.
For
insp
ectio
n pur
pose
s only
.
Conse
nt of
copy
right
owne
r req
uired
for a
ny ot
her u
se.
EPA Export 27-01-2014:23:27:25

Aquatic Services Unit MS 111219 Cork Harbour Sediment Pin Report 27
Raw Data: LM 12
Date Height at 30
Height at 40
Height at 50
Height at 60
Height at 70
Average Notes & Comments
22/07/2011 38 37.6 38 38.4 37.9 37.98
11/08/2011 37.8 37.5 38 38.5 38.2 38
13/09/2011 37 37.2 38.4 39.8 38 38.08
29/09/2011 36.1 36.3 36.9 38.2 38 37.1
14/10/2011 No Sample – Sample Underwater
(a) (b) (c) Sediment pins at LM12 taken (a) 22nd July, 2011; (b) 13th August, 2011 and (c) 29th September, 2011
For
insp
ectio
n pur
pose
s only
.
Conse
nt of
copy
right
owne
r req
uired
for a
ny ot
her u
se.
EPA Export 27-01-2014:23:27:25

Aquatic Services Unit MS 111219 Cork Harbour Sediment Pin Report 28
Raw Data: LM 13
Date Height at 30
Height at 40
Height at 50
Height at 60
Height at 70
Average Notes & Comments
09/08/2011 36.3 35.8 36.2 35.3 35 35.72
11/08/2011 35.5 35.8 36 35 35.2 35.5
13/09/2011 36 35.2 35 35.3 35 35.3
29/09/2011 35.9 35.4 34.4 34.7 35.1
14/10/2011 34.9 34.8 34.3 34.3 34.4 34.54
(a) (b) (c) Sediment pins at LM13 taken 13th August, 2011; (b) 29th September, 2011 and (c) 14th October, 2011.
For
insp
ectio
n pur
pose
s only
.
Conse
nt of
copy
right
owne
r req
uired
for a
ny ot
her u
se.
EPA Export 27-01-2014:23:27:25

APPENDIX C IN SITU WATER SAMPLING
In situ water sampling was performed to be able to convert the Nephelometric Turbidity Units(NTU) values as measured by the three turbidity buoys to Total Suspended Sediments (TSS) inmg/l.
As it was difficult to take in situ turbidity measurements with the NEP 390 Turbidity sensor dueto the fact the readings are taken over +/- 45 seconds, and because a laptop is operate tocontrol the sensor.Therefore 1 litre samples were obtained using a vertical type niskin bottle.The In-situ turbidity measurements were taken by attaching the YSI Turbidity probe to the niskinbottle and measuring turbidity at the point of sample collection from depth.
The NEP 390 Turbidity readings were measured in the ASU laboratory by decanting the re-suspended sample into a darkened 500mL volumetric flask. The sample was continuouslyagitated by a magnetic stirrer. The turbidity probe was held vertically in the sample by a clamp.The median Turbidity value was recorded.
Figure A-1 Left: Water sampler with turbidity sensors attached Right: NEP 390 turbidity readingsin the laboratory.
y = 1.1xR² = 0.88
0.00
10.00
20.00
30.00
40.00
50.00
60.00
70.00
80.00
90.00
0.00 10.00 20.00 30.00 40.00 50.00 60.00
To
tals
us
pe
nd
ed
so
lid
s(m
g/l
)
Buoy sensor median turbidity (NTU)
TSS versus NTU
Figure A-2: TSS vs NTU Based on 17 samples the TSS vs NTU relation is determined as 1 NTUequals 1.1 mg/l.
For
insp
ectio
n pur
pose
s only
.
Conse
nt of
copy
right
owne
r req
uired
for a
ny ot
her u
se.
EPA Export 27-01-2014:23:27:25

sample Day TimeGPS N Lat /
Northing
GPS E Long /
EastingSite Sample YSI 6136 NEP
Hanna
HI93703YSI 6136 NEP Comment
1 01-09-2011 10:40 051°54.004 008°27.936 5.80 2 13.40 13.40 16.78 13.60 North Channell, Tied fast to bridge
2 01-09-2011 11:06 051°54.003 008°27.915 1.5 7.50 5.90 6.08 4.20
3 01-09-2011 11:16 051°53.966 008°27.720 9.50 5 26.00 37.60 43.49 37.80North Channell, sampling at the quay
wall
4 01-09-2011 11:30 051°54.028 008°27.315 7.40 1 27.80 25.31 27.72 24.18100m down stream from Jetsed while it
was dredging
5 01-09-2011 11:34 051°54.028 008°27.315 7.40 3 26.00 44.70 53.62 51.00100m down stream from Jetsed while it
was dredging
6 01-09-2011 11:38 051°54.028 008°27.315 7.40 5 22.00 41.96 45.92 50.42100m down stream from Jetsed while it
was dredging
7 01-09-2011 11:42 051°54.028 008°27.315 7.40 6 36.00 53.00 54.01 81.25100m down stream from Jetsed while it
was dredging
8 04-10-2011 12:20 178506 65146 7.8 2 3.4 3.09 3.3 3.70 4.20
near Ringaskiddy Turbidity Buoy.
Skipper was holding position with the
motor.
9 04-10-2011 12:29 17845 65162 12 10 3.3 3.54 2.8 2.36 3.56 samples collected at an angle
10 04-10-2011 12:48 177241 65541 7.5 6 3.8 3.45 3.4 3.79 4.40 Tied to Monkstown Turbidity Buoy
11 04-10-2011 13:51 173807 71242 8.55 2 12.1 13.8 8.7 10.72 8.80 Tied to Lough Mahon Turbidity Buoy.
12 04-10-2011 14:06 173807 71242 8.55 8 15.3 15.3 18.5 17.15 19.20
13 04-10-2011 14:29 171775 71911 5.8 5 21 24.6 20.9 25.74 21.60Tied to R18 red buoy at Blackrock 200M
d/s from Jetsed
14 04-10-2011 14:34 171775 71911 5.8 2 16.6 20.12 16.4 21.92 15.40Tied to R18 red buoy at Blackrock 200M
d/s from Jetsed
15 04-10-2011 15:00 169059 72176 8 3 15.9 21.95 14.4 20.20 12.60Tied to corner of blue jetty moored at
city quays
16 04-10-2011 15:05 169059 72176 8 7 10.8 12.15 10.4 11.88 9.20
17 04-10-2011 15:10 169059 72176 8 0 3.3 2.98 3 3.05 4.20
suspended
solids mg/l
Date (GMT+1) In-Situ Turbidity lab turbidityCoordinates Depth (m)
Figure A-3: Results of in situ turbidity measurements and laboratory measurements on samplestaken during in situ sampling
For
insp
ectio
n pur
pose
s only
.
Conse
nt of
copy
right
owne
r req
uired
for a
ny ot
her u
se.
EPA Export 27-01-2014:23:27:25

APPENDIX D TURBIDITY BUOYS
Three turbidity buoys were deployed for the project. One at Lough Mahon and two in the lowerharbour area.
Figure B-1: Buoy positions
Each of these buoy was equipped with a warning light, radar reflector, data logger, power supply(battery and solar panels), GPRS modem, and turbidity sensor.
Figure B-2: Buoy 1
Actual turbidity measuring was performed by the McVan NEP 395 turbidity sensor (See FigureB-4) mounted 2m below the surface on a buoy. This sensor measures turbidity in NTU’saccording to the Optical Back Scatter principle and is calibrated as per the supplier’s
For
insp
ectio
n pur
pose
s only
.
Conse
nt of
copy
right
owne
r req
uired
for a
ny ot
her u
se.
EPA Export 27-01-2014:23:27:25

specifications. Although the proposed sensors have a self-cleaning mechanism, regularlycleaning and calibration was conducted by ASU, approximately every two weeks.
Every 5 minutes turbidity values were recorded. One per hour these data were collected andsent to the Van Oord ftp server by the GPRS modem.
Figure B-3: Buoy 2 fouling (close-up) 22/8/2011. To prevent excessive fouling, the buoys werecleaned every two weeks.
Figure B-4: McVan Analite turbidity sensor
For
insp
ectio
n pur
pose
s only
.
Conse
nt of
copy
right
owne
r req
uired
for a
ny ot
her u
se.
EPA Export 27-01-2014:23:27:25

APPENDIX E HYDRODYNAMIC MODELLING (RPS)
A 2DH model hydrodynamic model has been set up by RPS for a previous study done for thePort of Cork. This model was improved on and adapted by RPS to be able to model the releaseof tracer material.
As the current model study is on hold, no report has been produced by RPS yet to explain thefull details.
Based on input provided by Van Oord RPS has attempted to simulate the tracer release at Corkand Ringaskiddy respectively. Several snapshots of the spread of the tracer concentrations anddepositions are presented in Figure C-1 and Figure C-2. The tidal conditions at the time of thesesnapshots are presented in Figure C-3.
For
insp
ectio
n pur
pose
s only
.
Conse
nt of
copy
right
owne
r req
uired
for a
ny ot
her u
se.
EPA Export 27-01-2014:23:27:25

Figure C-1: Snapshots of suspended sediment (left) and net sedimentation (right) after the Corktracer release at different times. Blue indicates no or very low relative levels concentration /sedimentation, green medium and red indicates the highest values. See Figure C-3 for releasetimes relative to the tides
For
insp
ectio
n pur
pose
s only
.
Conse
nt of
copy
right
owne
r req
uired
for a
ny ot
her u
se.
EPA Export 27-01-2014:23:27:25
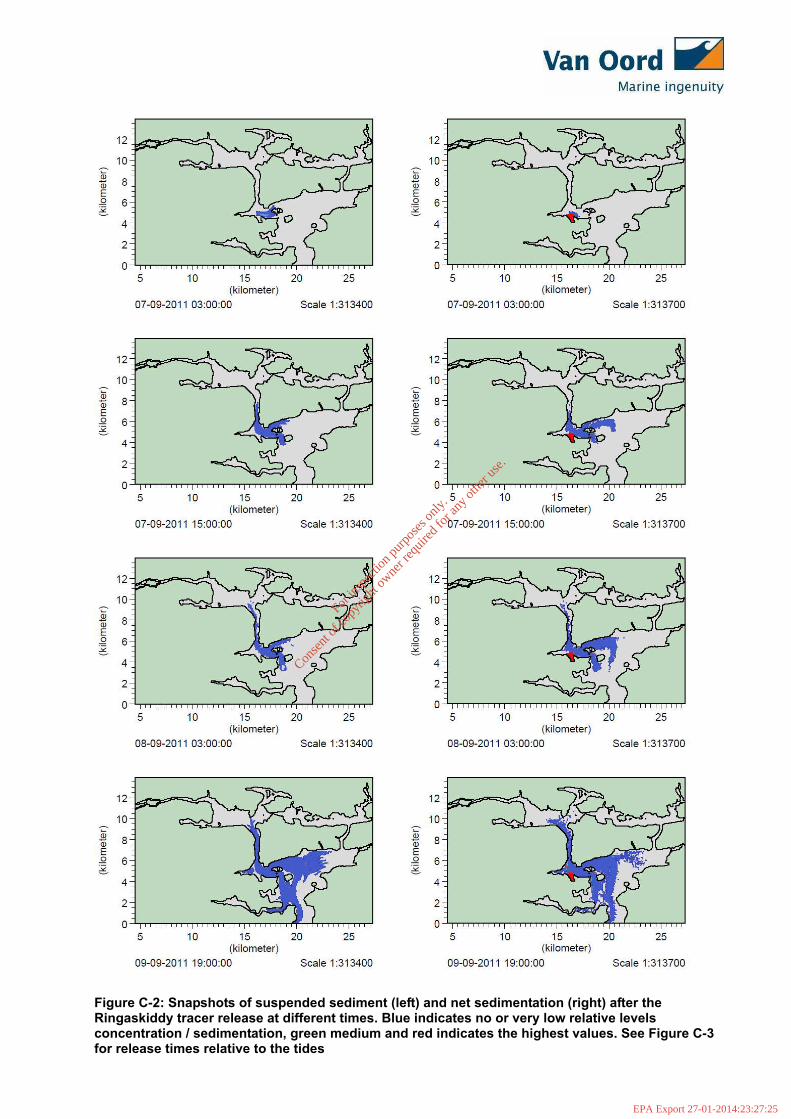
Figure C-2: Snapshots of suspended sediment (left) and net sedimentation (right) after theRingaskiddy tracer release at different times. Blue indicates no or very low relative levelsconcentration / sedimentation, green medium and red indicates the highest values. See Figure C-3for release times relative to the tides
For
insp
ectio
n pur
pose
s only
.
Conse
nt of
copy
right
owne
r req
uired
for a
ny ot
her u
se.
EPA Export 27-01-2014:23:27:25
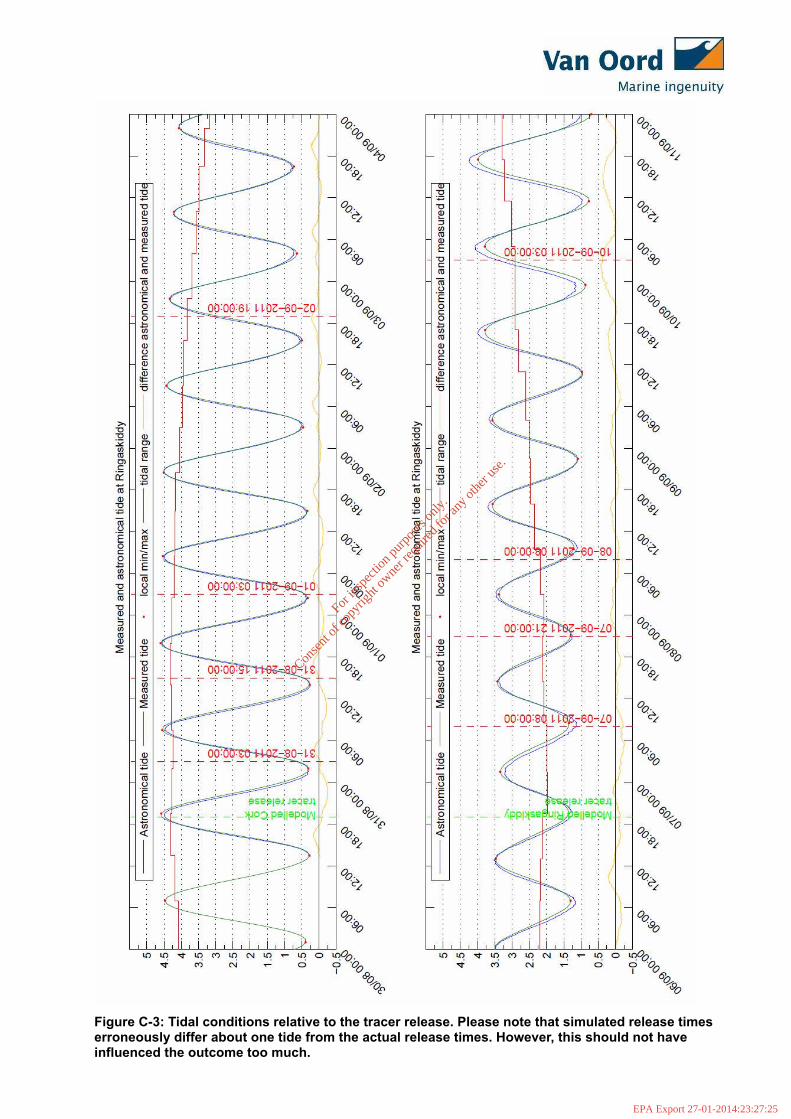
Figure C-3: Tidal conditions relative to the tracer release. Please note that simulated release timeserroneously differ about one tide from the actual release times. However, this should not haveinfluenced the outcome too much.
For
insp
ectio
n pur
pose
s only
.
Conse
nt of
copy
right
owne
r req
uired
for a
ny ot
her u
se.
EPA Export 27-01-2014:23:27:25