attila baráth; zsolt csattos; péter dudás, dr.; istván ... baráth; zsolt csattos; péter...
TRANSCRIPT


2
Editorial Board: Attila Baráth; Zsolt Csattos; Péter Dudás, Dr.; István Guba; Jenô Hancsók, Dr. Prof.; Pál Kapusy; Gábor Kis, Dr.; Lajos Kisdeák; Andrea Kiss; Márta Krámer, Dr.; László Lázár; Zsolt Molnár; Andrea Pánczél, Dr.; László Rácz, Dr.; László Rácz, Jr.; Gabriella Szalmás, Dr.; Artur TherneszChairman of the Editorial Board: György MosonyiManaging editor: Virág SimonEditor-in-chief: László Rácz, Dr.ISSN 2060-338X

3
ContentsMessages from WPC20, Doha György Mosonyi:WPC20 – Introduction 4
György Palásthy – Zsolt Molnár:WPC20 − Colourful future with serious challenges in Upstream 6
Sándor Fasimon:WPC20 − Cross-border pipelines: How to meet stakeholders’ interests 10
Artur Thernesz − László Tóth:WPC20 – Messages for Downstream 14
György Wilde, PhD:WPC20 – Biofuels and alternative energy sources 18
Norbert Miskolczi, PhD – András Angyal, PhD – László Bartha, PhD – István Valkai – Antal Tungler, DSc – Lajos Nagy, Dr. – László Vida – Gábor Nagy, Dr.:Petrochemical feedstock by mild cracking of polyolefin rich plastic wastes 22
Challenges Katalin Miklós – Melinda Czibulka – Réka M. Söjtöriné: New environmental challenge in Refining – How to minimise or eliminate unpleasant odour emissions? Part 2 28
FocusGyörgy Wilde, PhD:Face and faith – The 20 year history of the Hungarian Petroleum Association (HPA) in a nutshell 42
Development Judit Tóth, PhD – Beatrix Udvardi – István Kovács, PhD – György Falus, PhD –Csaba Szabó, PhD – Tamara Troskot-Čorbić, PhD – Renata Slavković:Analytical development in FTIR analysis of clay minerals 52
Zsolt Nagy – Amália Boros:Initiation of an electronic logging system in MOL refinery operation 60
WorkshopKatalin Milota, Dr:3D basin modelling: Simulation of hydrocarbon generation and migration 66
Imre Berkes:Examination of tanker truck utilisation in the Hungarian natural gas production 72
Judit Némethné Sóvágó, PhD – Olivér Bánhidi, PhD – Tivadar Gál, PhD – Gábor Barancsy – Gábor Nagy, Dr.:Investigation of acidification phenomena in process water- and steam systems of steam-cracker 80
ObituariesVratko Kaššovic, PhD (1943-2012) 88Gyula Nagypataki, CCs (1923-2012) 89

4 Messages from WPC20, Doha
The World Petroleum Congresses are the ‘Ol-ympic Games’ of the 79 year old World Petro-leum Council (WPC) (copyright: Randy GOS-SEN, the 2005-2011 president of the World Petroleum Council) covering the full verticality of the industry. Qatar was selected by the WPC Council in a secret electronic ballot vote in 2007 as the first ever Middle East country hosting a World Petroleum Congress. The venue of the 20th World Petroleum Congress predestined to deal with solutions aimed at providing global access for all to reliable, affordable and sus-tainable energy in both the near- and long-term future with special regards paid to the natural gas – as expressed in the respective motto of the Congress:
Energy Solutions for All - Promoting Coop-eration, Innovation and Investment.
The congress and exhibition attracted about 5,500 delegates, 600 media and over 550 pre-senters in the 21st century niveau Qatar Nation-al Convention Centre in Doha between Decem-ber 4 and 8, 2011.
Dr. Randy Gossen, the outgoing World Pe-troleum Council President, emphasised, that could not be more relevant or timely. The cen-tral challenge of achieving global energy solu-tions will be addressed in the context of those three key drivers:• Cooperation includes a renewed focus on strategic partnerships between independent energy companies and national energy com-panies, as well as cooperation between the service sector and governments as well as with NGO’s, academics and international institu-tions.• Innovation is all about harnessing technology to enhance and improve access to convention-al and non-conventional sources of oil and gas.• The focus on investment refers to the capital commitments that support the new projects and infrastructure required to respond to growing global energy demands.
TOP GLOBAL NAMESThe plenary sessions with a number of promi-nent global names drew large audiences. Qa-tar’s Minister of Energy and Industry, Dr. Mo-hammed Bin Saleh Al Sada, ExxonMobil’s CEO Rex Tillerson, Shell’s CEO Peter Voser, Serge
Dupont (Deputy Minister, Natural Resources, Canada), Antonio Brufau (Chairman & CEO, Repsol), Robert Dudley (Group Chief Execu-tive, BP), James Mulva (CEO, Conoco Phillips), Dr. Ibrahim Al Ibrahim (Economic Advisor to the Emir of the State of Qatar), Sergei Shmatko (Russia's Minister of Energy), Abdalla Salem El-Badri (OPEC Secretary General), Maria van der Hoeven (Executive Director of International Energy Agency), Nasser K. Al Jaidah (Qatar Petroleum International CEO), Christophe de Margerie (Total CEO), and Noé van Hulst (In-ternational Energy Forum Secretary General) were the key players of these sessions.
The ministerial sessions included Cal Dallas (Alberta's Minister of Intergovernmental, Inter-national and Aboriginal Relations), Raul Perez de Prado (President, Cubapetroleo, Cuba), Dr. Mohammad Mohsen Al Busairi (Kuwait's Minis-ter of Oil), and Mrs. Dieziani Allison-Madueke (Minister of Petroleum Resources, Nigeria), Dr. Mohammed Bin Saleh Al-Sada (Qatar’s Min-ister of Energy & Industry), Dr. Youcef Yousfi (Algeria’s Minister of Energy and Mines), Sayat Mynbaev (Kazakhstan’s Minister of Energy and Mineral Resources), Esperança Bias (Mozam-bique’s Minister of Mineral Resources), and Roberto Kreimerman (Uruguay’s Minister of In-dustry, Energy & Mining).
The ‘Nobel Prize’ of the WPC, named after Thomas Dewhurst, who organised the first World Petroleum Congress in 1933, was given to Guilherme De Oliveira Estrella, the Chief Ex-ploration and Production Officer and Member of the Executive Board of Brazil’s Petrobras for his scientific and technological excellence in the petroleum industry. In his lecture at this occasion he prudently highlighted the societal challenges of the e-society giving an opportuni-ty of de-personalisation of the classical demo-cratic structures.
Go ahead to the next destination: 21st WPC in Moscow 2014.
György MosonyiPresident of WPC Hungarian National
Committee
Introduction

5Messages from WPC20, Doha
Lectures and posters of the members of the Hungarian delegation
György Palásthy (in session Technology and Innovation in Upstream): Road to a new geological image; Advanced visualiza-tion techniques in mature basin exploration
Artur Thernesz: Refinery maintenance and operational reliability
Tibor Virányi: Three years experience with pure FAME (Fatty Acid Methyl Ester) trans-portation by pipeline (co-author: Attila Bíró)
Máté Zöldy: Development of more efficient fuels for niche markets (co-authors: Artur Thernesz and András Holló)
Norbert Miskolczi (University of Pannonia): Petrochemical feedstocks by mild cracking of polyolefin rich plastic wastes (co-authors: András Angyal, István Valkai, Gábor Nagy, Antal Tungler). Norbert Miskolczi received 2nd place of 2011 WPC Youth Excellence Award.
Forums, round tables
In block ’From the well to the consumer: Innovations in refining, transportation, fuel technology and petrochemistry’ forum ’Technology and feedstock changes in pet-rochemistry’ was chaired by Árpád Olvasó (presently ORPIC, Oman).
In block ’Complementary energy sourc-es’ forum ’Clean coal technologies’ was chaired by László Varró (presently IEA).
In block ’Complementary energy sources’ forum ’Geothermal options’ was vice-chaired by András Péntek.
In block ’Natural gas: The energy that makes a difference’ round table ’Cross bor-der pipelines: How to meet stakeholder’s in-terest’ was moderated by Sándor Fasimon.
In block ’Natural gas: The energy that makes a difference’ round table ’Gas price perspectives: High enough to attract invest-ment, low enough to attract consumers’ was attended by László Varró as panel member.
In block ’New exploration and production frontiers and technologies’, round table ’At-tracting investments to capital intensive ex-ploration & production projects’ was attend-ed by András Péntek as panel member.
In block ’Complementary energy sources’ round table ’Cost vs. benefits of non fos-sil fuels’ was attended by László Varró as panel member.
In block ’From the well to the consumer: Innovations in refining, transportation, fuel technology and petrochemistry’ round table ’Lessons learned from refinery project man-agement’ was moderated by Artur Thernesz.
New elected members
József Tóth has been re-elected for the first vice-president of the 11-members Executive Committee of the World Petroleum Council.
István Bérczi has been re-elected for the next congress cycle (Moscow, 2014) into the Congress Programme Committee.
András Péntek has been elected for the cycle 2011-2014 into the Youth Committee.
MOL at World Petroleum Congress, Doha, 2011, in a nutshell

6 Messages from WPC20, Doha
AbstractThe article summarises the main messag-es of lessons from project management in major gas projects and reviews the new ex-ploration and production frontiers and tech-nologies.
Lessons from project manage-ment in major gas projects The world demand for natural gas has renewed interest in the production and transportation of liquefied natural gas (LNG) from resource rich areas in Africa and the Middle East to custom-ers in Asia, Europe and the Americas. Latest Technological Developments in Liquefac-tion and Shipping session explored the op-portunities for innovation in LNG technology for liquefaction and shipping. In the LNG lique-faction area, the session focused on feed gas treating technology, optimisation of liquefaction output and key technologies in offshore lique-faction. The increase in LNG global demand and consumption has fuelled a higher demand for LNG ships and vessels. There are numer-ous challenges associated with growing LNG
supplies and the flexibility of such supplies. This session also explored the innovation in LNG loading and discharge terminals, current LNG tank technologies and optimising the ves-sel management portfolio. Project manage-ment was faced with new challenges in recent years developing and implementing world class LNG and GTL projects safely, on time, and on schedule:
• Technical challenges related to the ever increasing project complexity, under some-times harsh climate conditions, or compli-cated by very sour gas
• New logistics, infrastructure and social is-sues, caused by the increased size of LNG and GTL projects today, sometimes manag-ing more than 50,000 workers on site
• Environmental and geopolitical constraints of new frontier locations
• Optimum contracting & procurement strate-gies under extremely volatile market condi-tions
• Quality of project professionals, supervisors and craftsmen.
The world's GTL capacity has seen dramat-ic increases in recent years with Oryx GTL (30,000 bbl/d) in Qatar fully on stream, Pearl GTL (140,000 bbl/d) in Qatar coming on stream and Escravos GTL (30,000 bbl/d) in Nigeria under construction. Further activities in terms of launching new projects, however, have not been seen in recent years, mainly due to the escalation of construction costs. Several play-ers in the industry are nevertheless conducting R & D programmes for the progression of GTL technology towards higher efficiencies and low-er capital costs. Improving Efficiency, Safety and Economics for GTL session reviewed the status of the existing and potential new projects, progress on developing GTL technologies, en-
György Palásthy (47)Director, Chief Technology OfficerMOL Group, EPD Integrated Field [email protected]
Zsolt Molnár (37)ManagerMOL Group, EPD IFA Engineering and Technology [email protected]
WPC20 − Colourful future with serious challenges in Upstream

7Messages from WPC20, Doha
vironmental aspects of GTL as well as various aspects related to the marketing and usage of the unique GTL products.
With natural gas meeting an ever greater share of primary energy demand in many countries, ensuring reliability and security of supplies con-tinues to rise up the political agenda in import-ing nations. Those countries committing huge sums to develop gas for export are understand-ably looking for reassurance on their long-term access to markets. Transit countries need a fair return for maintaining the infrastructure and op-erations on behalf of both exporters and con-sumers. Recent experiences around the world indicate that balancing these varying stake-holder needs in the context of existing and planned gas pipelines is getting harder, rather than easier, to achieve. This Cross Border Pipelines round table discussion explored the views of a variety of such stakeholders which was moderated by Sándor Fasimon, Senior Vice President E & P, MOL Group (see his separate report on p. 10.).
New exploration and production frontiers and technologies Notwithstanding the odd reduction owing to specific financial or economic situations, the demand for hydrocarbons has grown steadily in the past and is set to follow the same trend in the future. In parallel to the increase in demand, the production from mature fields is regularly de-creasing. The upstream oil industry now faces a major challenge to increase production through the continuous development of new hydrocar-bon fields.
The need to satisfy the world’s growing thirst for hydrocarbons means producing from oil and gas fields at ever greater depths (deeply buried reservoirs), or under ever deeper water depths (ultra-deep offshore). Our industry has begun to tackle developments that require considerable technological boldness to produce:
• Either deeply buried reservoirs character-ised by High Pressures and High Tempera-tures (HP / HT) with all the problems gener-ated by these extreme conditions, or
• Reservoirs located at great water depths:
these fields have to be developed; some-times satellite reservoirs have to be tied back to a very distant processing unit, while coping with the difficulties of producing more and more viscous oils.
Through use of representative examples the Developments of Deep Offshore and Deeply Buried Reservoirs session illustrated some of the technical challenges that our industry has experienced, or still has to face, the ground-breaking solutions that have already been found, and the innovations we hope to see in the next few years.
Heavy oil and bitumen are found in many places worldwide, with the largest deposits in the world being in Canada (Alberta), Venezuela and the former Soviet Union. Other countries having such deposits include USA, Russia, Cuba, In-donesia, Brazil, Trinidad and Tobago, Jordan, Madagascar, Colombia, Albania, Romania, Spain, Portugal, Nigeria and Argentina. The main methods for extraction are generally min-ing and in situ. Within the in situ methods are the following processes:
• Steam Assisted Gravity Drainage (SAGD)• Cyclic Steam Stimulation (CSS)• The Vapour Extraction Process (VAPEX)• Toe to Heel Air Injection (THAI)• Cold Heavy Oil Production with Sand
(CHOPS).
The recovered bitumen may be upgraded at the plant site or diluted and sent through pipelines for production of synthetic crude. Bitumen and heavy oil are deficient in hydrogen, compared to typical crude oils. Upgrading is the process that changes bitumen into synthetic crude oil. There are four main steps to the upgrading process: thermal conversion, catalytic conversion, distil-lation and hydrotreating. Different companies use these processes in different ways and at different stages in the transformation of bitumen / heavy oil into synthetic crude but the basic principles behind this transformation remain the same. The state of the art of the industry world-wide was described in this Advances in Extra Heavy Oil Development Technologies ses-sion.
The success rate is lower today in hydrocarbon exploration than it was in the past, in particular between the 1930s and 1980s. In global terms, even if the earth still has sizeable oil and gas resources, worldwide consumption has out-stripped the discovery rate. Petroleum explor-

8 Messages from WPC20, Doha
ers now face a real challenge to be able to meet the long-term hydrocarbon needs of the world’s population, and to do so, the oil industry has to come up with new ideas continuously, pushing back its frontiers a little further each time.
The frontiers involved in frontier exploration are of many types:
• Geographical: exploration of new provinces, as yet barely explored or not at all: the Arc-tic, owing to its extreme weather conditions, is one of tomorrow’s challenges
• Geological: exploration of new geologi-cal formations in which hydrocarbons are trapped in nonconventional ways: new geo-logical concepts must be defined, and
• Technological: exploration under screens (basalt, salt) or in highly complex tectonic environments, which requires increasingly sophisticated seismic imaging techniques; access to deeply buried reservoirs or the ul-tra deep offshore demands cutting edge im-aging, drilling and production technologies.
The purpose of Exploring New Frontiers: In-novation and Vision forum was to give a state of play concerning current frontier exploration, and an outlook on our future exploration based on typical examples. It was shown that exploring new frontiers is inextricably linked to the devel-opment of innovative technologies. This session focused on providing a vision for the exploration landscape leading to the discovery of future re-serves.
Reservoir management is a continuous process that seeks to optimise the development and op-eration of oil and gas reservoirs for the purpose of maximising economic resource recovery over the reservoir lifecycle. The process utilises the most appropriate engineering and earth science technologies, while complying to environmental and safety regulations. The Advances in Res-ervoir Management forum discussed such as matrix / fracture characterisation geo-models, advanced simulation models that use dual po-rosity, dual permeability modelling, assisted history matching, and uncertainty analysis, ap-plication of I-Field technology, water injection / production management, production / injection optimisation, enhancing sweep efficiency, and maximising oil recovery.
Enhanced oil recovery (EOR) is a term com-monly used to describe processes for adding up reserves beyond the horizons of classical waterflood, and in specific cases of heavy oil,
recoveries above the primary limits. The three major widely acceptable EOR methods currently in operation are:
• Thermal (application of heat)• Miscible / immiscible (mixing oil with a sol-
vent)• Chemical (flooding with chemicals).
Other methods can involve CO2 injection and also, microbial EOR. All the challenges and tech-niques were covered in Enhanced Recovery: New Challenges and Technologies forum.
The toughest challenge facing the international E & P sector is to ensure high recovery oil and gas from geographically and technologically challenging reservoirs both onshore and off-shore. For that a consistent system of planning, drilling and completing of exploration, appraisal, production and injection wells is required, includ-ing but not limited to:
• Conducting an integrated plan of well archi-tecture
• Finding rigs and equipment optimised to the climatic and technologic challenges
• Selecting drilling techniques optimised to (reservoir) geological (well bore stability, pressure regime) conditions predicted
• Selecting optimal well test and completion and production techniques.
Full field case stories were shown at Drilling and Completion Technologies Applied to Challenging Reservoirs forum: balanced (on-shore and offshore) examples of how to cope in a cost-efficient way with this complex challenge through the teamwork of experienced profes-sionals.
The International Energy Agency in its 2008 World Energy Outlook - Reference Scenario projects that more than US$11 trillion will need to be invested in worldwide oil and gas infrastruc-ture over the 2007 to 2030 period to offset pro-duction declines and to meet growing demand. How this investment will be funded and execut-ed is a major challenge for the industry given volatile product prices, difficult credit and equity markets, long lead times and project life and the increasingly evolving relative roles of IOCs and NOCs (international and national oil companies) in many of the most prospective hydrocarbon areas of the world. Attracting Investments to Capital Intensive Exploration & Production Projects round table discussion brought to-gether representatives of IOCs, NOCs, financial

9Messages from WPC20, Doha
institutions, sovereign wealth funds and govern-ments to address the challenges of funding en-ergy investment in a changing world.
Climate change has to be at the top of the agenda of any energy company. The challenge is to produce much more energy at lower cost to the environment. Most of the oil companies have two objectives. One is to help provide en-ergy over the coming years to allow the world continued growth − and this will remain largely fossil fuels. At the same time they work on the lowering of the carbon dioxide footprint of the fu-ture energy mix. In the longer term the experts believe a global CO2 price will happen. A global price would allow the industry to invest in the right technologies in the future.
All in all the World Petroleum Congress is in-deed considered as the “Olympian Event of the Oil and Gas Industry”.
Keywords: LNG, GTL, deep offshore, extra heavy oil, reservoir management, EOR, drilling and completion
György Palásthy joined MOL (Hungarian Oil and Gas Co.) as a reservoir en-gineer in 1989. He is spe-cialised in oil and gas con-densate field development, horizontal well application, gas injection processes and reservoir management
and technology. Different positions in reservoir engineering and field development department of MOL were hold down by him. He was the manager of field development at MOL Pakistan between 2003 and 2005. In the period of 2005-2007 his position is asset manager at MOL Centre-European E & P region. In 2007 he moved to a new position at MOL E & P Division as a Director of Integrated Field Applications and Chief Technology Officer. He is author and co-author of several SPE papers, chair of SPE Hungarian Section and member of Hungarian Mining Society. He is graduated from Technical University of Miskolc, Hungary as MSc in petroleum engineering in 1987. He has postgraduate education in eco-nomics and management focusing on reserve and field development issues (1997).
Zsolt Molnár has been working for MOL Plc for 14 years. He is the Manager of Engineering and Technol-ogy Development. He led several projects in the area of E & P. Nowadays he is re-sponsible for reservoir mod-elling and surface facility engineering. He is a mem-ber of the Society of Petro-
leum Engineers (SPE). He is the Programme Chairman in the Hungarian SPE Section, and Associate Member of the Hungarian Mining and Metallurgical Society. He held several presenta-tions. He received an MSc degree in petroleum engineering from Miskolc University in 1998.

10 Messages from WPC20, Doha
AbstractWith natural gas meeting an ever greater share of primary energy demand in many countries, ensuring reliability and security of supplies continues to rise up the po-litical agenda in importing nations. Those countries committing huge sums to de-velop gas for export are understandably looking for reassurance on their long-term access to markets. Transit countries need a fair return for maintaining the infrastruc-ture and operations on behalf of both ex-porters and consumers. Recent experienc-es around the world indicate that balancing these varying stakeholder needs in the context of existing and planned gas pipe-lines is getting harder, rather than easier, to achieve. The WPC round table discus-sion on “Cross Border Pipelines: How to meet stakeholder’s interests” explored the views of a variety of such stakeholders. The article summarises the main outcomes of this discussion.
IntroductionDuring the 20th World Petroleum Congress Mr Sándor Fasimon, the EVP MOL Group’s Explo-ration & Production chaired a round table discus-sion with the title “Cross Border Pipelines: How to meet stakeholder’s interests”. Speakers rep-resenting international oil companies and other entities were Professor Andrey Konoplyanik (Gazprombank, Russia), Messrs. Nils Anreas Masvie (Det Norske Veritas, Norway), S. Venk-ataraman (GAIL Ltd., India), Peter M. Roberts
(South Asia Gas Enterprise PVT Ltd., India) and Adel Al Buainain (Dolphin Energy Ltd., Qatar).
BackgroundBoth oil and gas pipelines are the arteries of the global energy economy. The number of cross-border oil and gas pipeline projects re-cently completed or being currently developed, planned or discussed is continuously growing, mostly as a result of the increased concerns about security of energy supply, demand and diversification. BP Statistical Review of World Energy, 2011 confirms the tremendous growth in cross-border trade in oil and gas as the to-tal natural gas trade grew by 10.1% (y.o.y) in 2010 and the trade through pipeline route registered a 7% growth meaning that pipeline trade accounted for 69.5% share in the total natural gas trade. It is anticipated that there will be additional increase in the length of oil and gas pipelines in the future, due to the in-creasing discoveries of reserves in remote and land-locked locations, the depletion of reserves close to established markets, and improvements in cost-effective technological methods of exploration and production in pre-viously uneconomic reserves. Thus the ques-tion of secure and reliable transit has become also of paramount importance, because of the increasing distances between traditional mar-kets and petroleum producing countries, many of which are landlocked.
Issues in cross-border oil and gas pipelines As the share of pipelines in the total trade is increasing, a number of issues arise from
Sándor Fasimon (45)EVP of E & PMOL Group
WPC20 − Cross-border pipelines: How to meet stakeholders’ interests

11Messages from WPC20, Doha
cross-border oil and gas transportation that should be addressed. The growing number of stakeholders (who are sometimes newcomers on the energy market), being the driver of the challenges, generate
• Legal, political and transit-related disputes• Security and safety issues• Technical and economic issues.
To achieve a fully integrated international pipeline project, not only a strong co-operation among the sponsors is needed, but a constant support from the states to put in place bind-ing arrangements that ensure consistency of treatment, and reasonable uniformity of tech-nical and legal regime across the entire pipe-line route. In the absence of these require-ments the pipeline could become a series of pipeline segments.
LEGAL ISSUES Major legal issues that may arise in cross-bor-der pipeline projects include:
• Multitude of overlapping and potentially conflicting legal frameworks
• Conflict of jurisdiction• Pipeline in disputed maritime areas• Lack of harmonised standards and differ-
ent / lack of environment standards.
A cross-border project may observe that laws applying to the upstream facilities and the pipeline infrastructure within the same juris-dictional limits may have a detrimental effect on the downstream pipeline.
The legal issues may be addressed by adopt-ing a governing structure with single set of legal and regulatory rules treating the infra-structure as a single unit. However, such an outcome may be difficult to achieve given the reluctance of governments to forego control of important infrastructure. An essential step is to assess the suitability of the local law in each host jurisdiction and, where the laws are insufficient or too restrictive, to develop a plan to address particular issues or, in cases where the necessary legal framework is absent or unsatisfactory, to define a prevailing legal re-gime tailored to project requirements.
POLITICAL ISSUESAppropriate agreements must be signed, how-ever they are highly political. Complicating the matter further, pipelines tend to be built by consortia of energy companies and govern-
ments, and in many cases the desires of the stakeholders do not mesh.
In a cross-border infrastructure project, the means to guard against the issues of sov-ereign risk and political instability can be achieved through Intergovernmental Agree-ments (IGA) and by way of bilateral or mul-tilateral agreements like the Energy Charter Treaty (ECT). An IGA is a written agreement between two or more host countries in rela-tion to a multi-jurisdiction project, pursuant to which the countries mutually confirm their support for the project. The ECT was intro-duced in 1994 by the EU to govern cross juris-dictional energy infrastructure. The ECT is a unique agreement establishing a multilateral legal framework specifically targeted towards cross-border energy co-operations. By provid-ing a stable, comprehensive and non-discrimi-natory legal foundation for cross-border trade, the ECT reduces political risks associated with the cross-border pipeline project.
TRANSIT-RELATED ISSUESOnce the pipeline is in operation, the threat of disruption by the transit country exists mainly due to the following reasons
• A shift in bargaining powers to the transit country upon construction and operation of the pipeline
• Changes in the value of the throughput im-ply price changes that can affect the be-haviour of the transit country.
In many cases disputes are triggered by eco-nomic disagreements over attempts to unilat-erally renegotiate transit terms.
To mitigate the risk transit arrangements must be settled before development is able to com-mence. These arrangements include all the necessary details, such as transit fees, off-takes, input arrangements, taxation and regu-lation.
ECT also provides a way to mitigate transit-re-lated issues. It prescribes that member coun-tries are under an obligation to facilitate en-ergy transit on a non-discriminatory basis, and transit fees should cover the costs of trans-portation and effective services. However, the present transit regime established under the ECT is inefficient in resolving transit disputes. Some recent attempts to strengthen this re-gime by adopting a new Transit Protocol to the ECT have so far been futile.

12 Messages from WPC20, Doha
ISSUES RELATED TO SAFETY & SECURITY Pipelines can be exposed to natural disasters, vandalism and terrorist attacks. Some pipelines may also be vulnerable to ‘cyber-attacks’ on computer control systems or attacks on elec-tricity grids or telecommunications networks.
In order to cope with a disruption, it is neces-sary to have a robust and reliable system in place which is able to react coherently and credibly in the event of a supply crisis. The threat to offshore pipelines may be reduced by the depth at which they traverse the seabed, thereby presenting a significant difficulty for would-be attackers.
TECHNICAL ISSUES The major technical challenges of the onshore / offshore pipelines, namely mountain and river-crossings / marine crossings are thought to be managed by current technologies. Nonethe-less, cross-marine pipelines face additional challenges.
The pipelay challenge threshold was at 300 m in the early 1970s and was achieved with the so called ‘Norwegian Trench’. Nowadays this challenge sits beyond 3,500 m water depth, over 10 times deeper. There are now very few, if any, potential bilateral cross-border marine gas pipeline routes globally which are impos-sible to develop solely by virtue of the water depth. Thus, the only remaining technical chal-lenge to be met in satisfaction of all stakeholder interests in cross-border marine pipelines is to complete the pipelay industry’s inexorable progress into ever deeper water.
Technical solution is already in progress as sev-eral pipelay vessels that would be able to install large diameter pipes up to 3,500 m are in con-struction and coming to market. Also a grow-ing number of pipe mills have upgraded their presses to manufacture the large quantities of heavy-wall line. Less visible but equally impor-tant is the ‘commoditization’ of the deepwater remote operated equipment needed to support this incremental increase in the pipelay indus-try’s depth capability. This support equipment is typically used on marine pipeline projects to assist in profiling of the seabed route where the ocean floor is unduly corrugated, to inspect the finished pipeline or even to repair it in the remote possibility of damage. The capability of
such support equipment was established for re-search purposes many years ago and thanks to it accessing to deepwater support facilities for the drilling industry is a routine. Currently, the first cross-border marine gas pipeline expected to be laid into water at 3,500 m depth in the coming period will be the SAGE (South Asian Gas Enterprise) line taking natural gas from the Middle East to North-West India.
ECONOMIC ISSUESAs energy industry projects are capital inten-sive, the same is true for cross-border pipeline projects. In order to make them attractive to investors, including financing institutions, back-ing from each participating country is necessary including stable and uniform taxation structure, or even tax holidays / concessional tax rates.
Economic issues can be resolved to some extent by executing certain key documents among the participating countries, such as sales and pur-chase agreements, arrangements for the con-struction and operation of long distance pipelines and agreement on transmission tariffs. Gener-ally these documents are signed for long terms, considering different terms such as financing re-quirements, rights, guarantees and other details (e.g. quantities of supply, consumption flexibility, force majeure, take or pay clauses).
Future of cross-border pipelines Vast majority of oil transportation is accom-plished by ocean-going tankers, however the importance of pipelines has been raised in the past few decades as natural gas covers an ever greater share of primary energy demand in many countries, ensuring reliability and se-curity of supplies continues to rise up the po-litical agenda in importing nations. In line with the increasing number of concerned countries the number of the stakeholders is growing, thus to explore their needs and balance them in the context of existing and planned gas pipelines is crucially important. Nonetheless, the lack of ‘needs management’ could easily erode even the most viable project.
Keywords: cross border pipelines, marine pipe-lines, gas transportation, natural gas, Intergov-ernmental Agreement, Energy Charter Treaty

13Messages from WPC20, Doha
Sándor Fasimon has over 20 years of experi-ence in the energy indus-try, with over 10 years of executive experience. Mr Fasimon joined MOL Plc. in 1999 and worked as a Supply & Trading Direc-tor. From 2003 he was the Managing Director of
Natural Gas Division and from 2006 he acted as General Director of MOL-Russ LLc, the company’s Russian subsidiary. He worked as Senior Vice President of Supply & Trading Division from 2009 until 1st June, 2011 when he became Executive Vice President of MOL’s Exploration and Production Division. He grad-uated from the Institute for Foreign Affairs (IMO), Moscow with a degree in International Economic Relations and speaks English, Rus-sian and Arabic apart from native Hungarian.
14 Messages from WPC20, Doha
AbstractBeyond the crude oil refining overcapacity problem in European and the current eco-nomic environment, the downstream sector is further pushed by the growing number of refineries in Asia. To be competitive in such market, efficiency improvement actions are necessary. MOL Group was able to increase the mechanical availability of their assets with the optimisation of turnaround and maintenance processes. The professionals of the roundtable discussion have shared their views on the new challenges in the refinery project management.
Refinery mainte-nance and opera-tional reliability The golden age of the downstream is over. Pur-suing the effectiveness and efficiency of the re-finery operations to the limits is a must. About 65 billion USD is spent yearly for maintenance in hydrocarbon processing industry (HPI) which is a high potential to optimise.
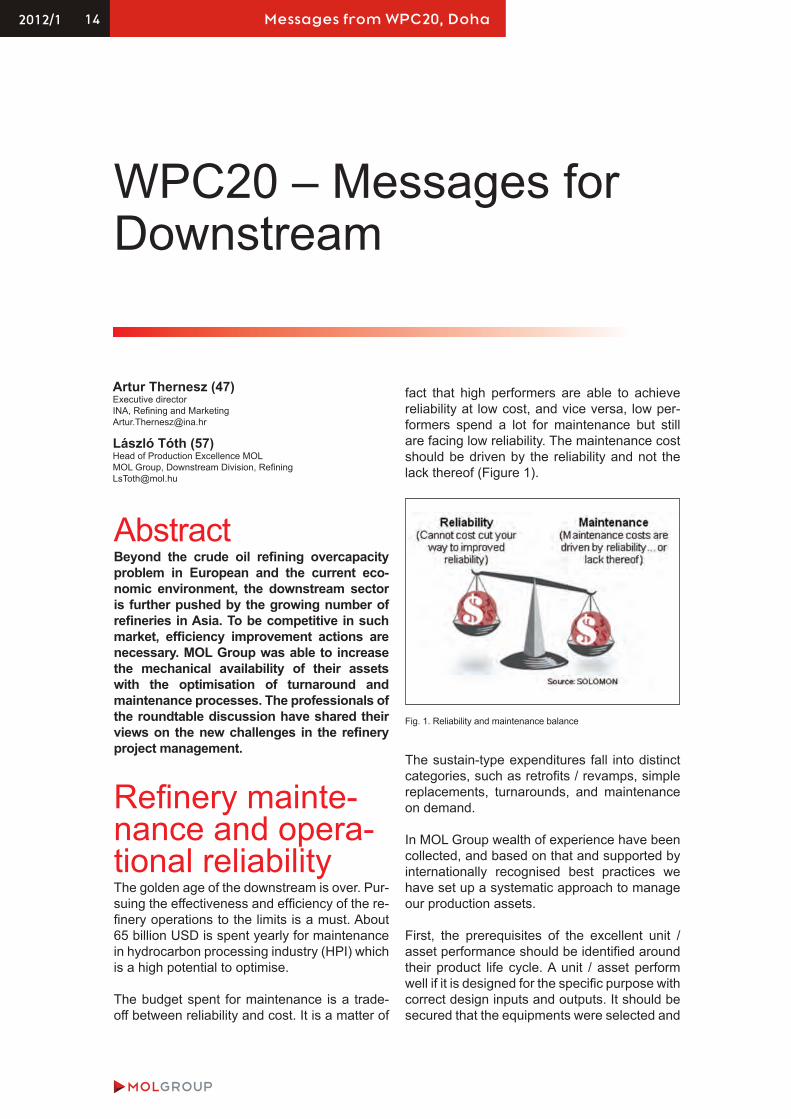
The budget spent for maintenance is a trade-off between reliability and cost. It is a matter of
fact that high performers are able to achieve reliability at low cost, and vice versa, low per-formers spend a lot for maintenance but still are facing low reliability. The maintenance cost should be driven by the reliability and not the lack thereof (Figure 1).
The sustain-type expenditures fall into distinct categories, such as retrofits / revamps, simple replacements, turnarounds, and maintenance on demand.
In MOL Group wealth of experience have been collected, and based on that and supported by internationally recognised best practices we have set up a systematic approach to manage our production assets.
First, the prerequisites of the excellent unit / asset performance should be identified around their product life cycle. A unit / asset perform well if it is designed for the specific purpose with correct design inputs and outputs. It should be secured that the equipments were selected and
Artur Thernesz (47)Executive directorINA, Refining and [email protected]
László Tóth (57)Head of Production Excellence MOLMOL Group, Downstream Division, [email protected]
WPC20 – Messages for Downstream
Fig. 1. Reliability and maintenance balance

15Messages from WPC20, Doha
manufactured according to the relevant project specifications. Sound quality control and in-spection procedures should be maintained to ensure that the equipment is constructed in line with the specifications.
It is an on-going task to ascertain that the as-sets are operated within the parameters set out in their respective operating envelope accord-ing to the design parameters.
The maintenance should be performed in the optimised time window set by the production scheduling, the health of the assets and the authority requirements. Any modification dur-ing maintenance must be done according to the original or improved (if justified) specifica-tions. Overlooking any of these fundamentals may lead to unexpected shutdowns.
To keep the procedures aligned needs specific management techniques to be implemented. Questions to be addressed can be grouped around the ‘what’ and ‘how’ (Figure 2).
Some of our fundamental tools (‘what?’) proved to be effective and efficient are:
• Sharpened risk matrix is used to prioritise the scope items
• The zero based budgeting categories have been redefined, and risk categorisation is based on probability calculations
• The scope is evolved with the feedback from incident investigations
• Cold eye reviews are conducted; inde-pendent expert engineering team checks the preliminary scope under predefined criteria.
The procedure is kept moving and the ou comes are controlled (‘how?’) by an array of management techniques:
• Steering Committee with the participation of all affected organisations governs the workflow
• Not only the ‘real’ investments but even the maintenance related tasks are handled as projects
• Projects are managed by dedicated teams under the matrix principles; every delegate represents the professional competencies of his mother organisation
• Active vendor management is pursued in contractor selection, and after.
One of the key success factors to achieve the excellence in asset management is the con-scious and organised application of incident investigations in order to
• Find the root causes• Define and feedback the corrective actions
to the affected phases and responsible or-ganisations of the product life cycle
• Roll out and channel in the lessons learnt to the knowledge management system.
MOL Group is keen to push effectiveness and
efficiency in asset management. We have been working under this systematic approach for 3 years. Our efforts already paid: according to the latest Solomon study [1] the Mechanical Avail-ability has increased by 1%, to 95.6%, with the simultaneous improvement of the Maintenance Index (Figure 3).
Refinery project managementAfter the years-long project boom, HPI stirred up by the global economic downturn. As imme-diate reaction, many corporate shifted priori-
Fig. 2. Management techniques to balance ‘what’ and ‘how’

16 Messages from WPC20, Doha
ties from investing funds in longer-run projects which will pay their return in the unpredictable future to those ones which offer preserving cash near-term.
The project landscape has become quite varied. While the low refinery margins are going to stay in the pit for a while, the European and North-Amer-ican refineries suffer from low capacity utilisation. The emergence of the alternative fuels – or the notion of dealing with motive energy in a broader context – may evoke further hesitation from in-vestors. In the regions with matured refineries the focus is now on the efficiency improvement initiatives and adding value to the existing assets rather than launching growing-type projects.
Alternatively, the steady increase of HPI product demand of the non-OECD countries attracts to build grass-root facilities; regions with growing customer markets and / or source of feedstock set the pace of investments.
The crisis has accelerated the ‘natural’ evolution of the project management by chucking it out of the ‘comfort zone’; the journey to converge project management and business strategy has nearly completed. The ‘dynamic’ project portfolio management, the wise use of project manage-ment offices, the right balancing between well-proven project structures and flexibility are all to manoeuvre corporate to the right direction on the troubled waters. Also, projects are under pressure to switch the mind sets from the ‘short’ project life cycle to the ‘long’ product life cycle.
The paramount efficiency, the total transparency required by the sponsors, pursuing sound risk management practices have become an obses-sion in project work.
The project managers’ rule is also changing. They need to possess strong ‘business-savvy’ attitude, high level of pro-activity, brilliant inter-personal and communication skills, and in the meantime to remain professional in technical matters. By now, the globe is the stage for the projects, and the cultural diversity and virtual teams are the props to the play.
However, the projects still suffer the worldwide deficit of skilled manpower. No sustainable project success exists without concise human strategies and proven knowledge transfer sys-tems. ‘It takes two to tango’ – it is easily ignored. Owners should understand the ECC’s (Engineer-ing and Construction Contracting) approach, how our contractors are thinking about the world. It may help in achieving the common optimum.
MOL Group, which has grown into a regional oil company in CEE is deeply affected with these factors and has been facing these issues. In the last decade methodologies, processes, structures were developed and evolved. Al-though this ‘toolset’ has helped to provide su-perior project results (with flourishing corporate achievements), and contributes to survive the crisis time with good health, MOL is also strug-gling as anybody else. These unique project practices, the identified ‘learning points’ may serve as a starting point to the discussion.• Portfolio management has a long tradition
at MOL Group. The well-regulated yearly top down and bottom up exercises are embraced with structured organisational framework: the DS Development acts as the divisional project management office. The divisional project portfolio is planned, approved, controlled and post-evaluated by DS Development, MOL Port-folio Board (‘Central Resource Allocation’), and MOL Executive Board.
• This arrangement serves, for sure the fierce competition for Group resources, provides deep transparency. However, in economic crash era the Investment Board imposes more and more restrictions on the indi-vidual projects, so that the flexibility and dynamism of the portfolio management may be injured. How can the right balance be drawn between the regulatory framework and the flexibility?
• The pragmatism between ‘business’ and ‘ex-ecution’ is provided through shared project leadership. The ‘business project manager’ in the project team, delegated by the Project Management Office represents the sponsor (safeguards the business strategy, provides the competency for FEL – Front End Loading).
Fig. 3. MOL achievements [1]. EDC – Equivalent Distillation Capacity

17Messages from WPC20, Doha
Alternately, the ‘investment project manager’, delegated by Investment Department renders the expertise to efficiently execute the project. This concept certainly results in full compliance with the business objectives, and superior project efficiency, partly through the on-going optimisation exercise. However, this ‘frag-mented’ leadership needs superior team players at all levels, and raises the question: do we have the ‘academic’ project manager profession and career path at MOL?
• The projects are under pressure by the end us-ers to focus more on the post-project results (TCO – Total Cost of Ownership). Similarly, all ‘capital’ project types (such as investment-, minor CAPEX- and turnaround) should be handled with identical project management approach. It underlines the importance of the multi-shared responsibility, and proves the ‘theory’ that the everyday business is fully im-bued with project management practices. Are the company cultures matured enough?
• MOL refineries in four countries dem-onstrate the difficulties of dealing with projects in various cultural and profes-sional sets. While relying on local staffs, the project procedures are being harmo-nised at a tolerant pace. Some argues from both sides that a more aggressive approach would be suitable. How much and how fast the project management procedures should be harmonised?
• No predominant (headquarter-like) but lo-cal knowledge centres exist. Do we need centralised knowledge centre? Since this area was neglected in the past, significant im-provement of the professional expert pool is necessary to act as effective knowledge cen-tre. How to vitalise the on-the-self knowledge base, what is the best ‘use’ of seniors?
• MOL has shifted late from being self-entre-preneur to the EPC (Engineering Procure-ment and Construction) contracting strat-egy. We went through rapidly the LSTK (Lump Sum Turn Key), CPF (Cost plus Fee) and part-nership concepts to the presently predominant one-by-one competition model. Although it is certainly one-off cost effective solution, that is the right way if looking ahead?
Reference[1] HSB Solomon Associates LLC: Europe, Afri-ca & The Middle East Fuels. Refinery Perform-ance Analysis (2010)
Keywords: World Petroleum Congress, main-tenance, turnaround, project management
Reviewed by Orsolya Kocsis-Kövér
Artur Thernesz has been ap-pointed to Executive Director of INA Refining and Marketing Division by the Management Board of INA in January, 2012. Previously he led the develop-ment activities of the Down-stream Division of MOL Group. Before invited to MOL, he as-sumed diverse international
leadership positions of ExxonMobil Supply and Fuels Marketing organisations. He is member of the Board of EUROPIA (European Petroleum In-dustry Association) and the BoD of the Hydrocar-bon Strategic Reserves Association of Hungary. He is an active lecturer at Budapest University of Technology and Economics, and Pannon Univer-sity of Hungary. He has an MSc degree in chemi-cal engineering from the University of Veszprém and earned an MBA in financial management from Budapest University. He speaks fluent busi-ness English, German, and Russian languages.
László Tóth is employed by MOL since 1977. He began his career as unit operator, then was employed by UOP Plc. as technical advisor. Rejoin-ing MOL he continued his car-rier as process engineer. From 1999 to 2005 he was the project
director of the Residue Upgrading, then the Ultra Low Sulphur Motor Fuels (EU2005) project pro-grammes in Duna Refinery. Between 2006 and 2011 he was the head of Project Development in MOL Group’s Refining and Marketing Division being responsible for the implementation of the refining and logistics investment projects. From 2012 he leads MOL Refining’s Production Excel-lence Department. László holds MS in chemical engineering from Pannon University, Veszprém.

18 Messages from WPC20, Doha
AbstractThe article summarises the main messages of WPC20 on biofuels and alternative fuels.
Introduction The above topics were discussed in Forum 13 (“Tailored fuels for future combustion engines”) of the Block 3 (“From the well to the consumer”) and in Forum 16 (“Biofuels and Biomass”) of the Block 4 (“Complementary energy sources”) but the subject of presenta-tion was not sharply separated.
No sensational notification has happened. The only exception might be the lecture of Süd-Chemie on ethanol production from lignocel-lulosic agricultural residues. Let’s start with it.
Biofuels THE SUNLIQUID® PROCESSThe process (that can be found in the homepage www.sunliquid.com) matches the ambitious targets for sustainable production and green-house gas reduction of 90% compared to fos-sil fuels [1]. The process offers the maximum yield of ethanol by converting cellulose and hemicelluloses into ethanol resulting in 50% higher ethanol yield compared to processes using only cellulose. The Sunliquid®-process is a turn-key ready production for cellulosic bio-ethanol with integrated enzyme supply through an integrated production and reduces the pro-duction costs for cellulosic ethanol significantly. The internal produced enzymes were optimised
and developed with a concerted process de-velopment which gives the Sunliquid®-process high product yields in shorter production times. In February 2009 a pilot plant for biocatalytic bio-ethanol production has been installed at Süd-Chemie’s central research laboratory in Munich and test operations having commenced at the beginning of the last year. So far avail-able laboratory and pilot plant data for process and strain development are demonstrating the economic competitiveness to first generation processes. Therefore Süd-Chemie is building a Sunliquid® demonstration plant (the plant was almost finished by the middle of December 2011) as a next step in the commercialisation of the Sunliquid®-process. Although no exact economical data were given (just they declared that it is competitive), it is important to mention that against the procedures of the first genera-tion here the raw material is non-edible, its ap-plication shall not increase the price of wheat or corn (starvation is not a rare thing in the ‘de-veloping world’).
LIFE CYCLE ANALYSIS FOR BIOFU-ELS (IN BRAZILIAN CONDITIONS) Biofuels can play a very important role to diver-sify the energy supply in the transportation sec-tor, currently almost fully based on fossil fuels [2]. In this context, the production and use of different biofuels have been increasing around the world. Nowadays, biofuels produced and consumed in large quantity are ethanol from sugar and amylaceous biomass and biodiesel from vegetable oils and animal fats, which sub-stitute gasoline and diesel oil, respectively. In this context, the objective of the study was to evaluate and compare the main environmental impacts and energy flows of ethanol from sug-arcane and biodiesel from soybean and palm oil, in Brazilian conditions, with their respec-tive fuels substitutes (gasoline and diesel). The
György Wilde, PhD (60)Secretary generalHungarian Petroleum [email protected]
WPC20 - Biofuels and alternative energy sources

19Messages from WPC20, Doha
methodological tool used was the Life Cycle Analysis (LCA), in well-to-tank assessment. The environmental analysis was done using the methodology, developed by the University of Leiden. The environmental impacts were quantified and ranked in impact categories. Such ranking helped to identify and quantify the major impacts of the system in each stage and proposing ways to reduce them.
LIFE CYCLE ANALYSIS FOR MICRO-ALGAE OIL PRODUCTIONMicroalgae oil production is the subject of in-tensive worldwide research and development, with several billion dollars invested in the past few years [3]. Microalgae are isolated from nature and then selected or genetically modi-fied for high vegetable oil (triglyceride) content and productivity. Some projects use genetic engineering to design microalgae strains that excrete actual hydrocarbons, which can then be recovered without need to harvest or even produce algae biomass. Many types of micro-algae are being investigated, and several companies and projects are currently moving into pilot and even demonstration projects. Over a score of Life Cycle Assessment stud-ies on microalgae oil production have been recently published, with a majority, but not all, concluding that algae biofuels could sub-stantially reduce greenhouse gas emissions, compared to fossil fuels. However, with the exception of fermentation processes (using sugar or starch as inputs), there is essentially no algae oil currently produced beyond small sample amounts for testing purposes. Thus, all LCA studies are based on extrapolations from laboratory experiments, small-scale out-door studies, and, mainly, on assumptions and projections of future technological advances. A more crucial problem is that these studies have not been based on engineering designs and systems analysis, required to derive en-ergy inputs and mass balances. A detailed LCA of microalgae oil production using open ponds, based on a recent detailed engineer-ing and economic cost study, was presented. It concludes that algae vegetable oil could be produced with essentially no fossil ener-gy inputs or net greenhouse gas emissions, based on realistic productivity, scale, site, and operating assumptions. For the near fu-ture improving the efficiency of the processes related to CCS (carbon capture and storage) will become more and more important. An in-teresting option is to feed CO2 to micro-algae for fixation of the CO2 in combination with the production of a range of bio-products.
LIFE CYCLE ANALYSIS OF BIODIE-SEL PRODUCED FROM WOFWaste oils and fats (hereinafter referred to WOFs) are kinds of non-edible oils which are generated more than 30 million t/y from the production and consumption of cooking oil over the world, including residues generated from refining edible oil, used frying oil, used cook-ing oil [4]. These WOFs will pollute the environ-ment if they are disposed improperly. It is very difficult that WOFs are transformed to biodiesel by base catalysed transesterification process because of its poor quality, especially extra more content of free fatty acids. Therefore, a new technology, super/sub-critical alcoholysis process (hereinafter referred to SRCA proc-ess) was developed successfully by Sinopec Research Institute of Petroleum Processing for producing biodiesel from WOFs. In order to research and develop SRCA process, many problems were solved in succession, such as how to dissolve methanol in WOFs, how to operate simultaneously the reaction of esteri-fication and transesterification, how to reach high conversion rates at catalyst free condi-tions, how to avoid producing harmful environ-mental materials, and how to product certified biodiesel. More than 20 patents about SRCA process were authorised. The first industrial SRCA process equipment of scale of 60 kt/y for biodiesel was set up in 2009, and operated continuously to produce biodiesel from WOFs, whose quality fulfill requirements prescribed by the national standard. On the basis of the data from laboratory and industrial operation, Life Cycle Analysis (LCA) of bio-diesel from WOFs by SRCA process was assessed, and the re-sults indicated it had a good environmental im-pact.
GREENHOUSE GAS CALCULATION OF HVO (HYDROTREATED VEGETA-BLE OIL) Neste Oil produces high quality HVO-type re-newable diesel [5] in four plants with combined capacity of about 2 mt/y. The product, mar-keted under trade name NExBTL diesel can be flexibly produced from a mix of vegetable oils and waste fats, such as from waste animal fats sourced from the food industry. Being a HVO-type renewable fuel, NExBTL easily out-performs both conventional bio-diesel (FAME) and fossil diesel in quality and performance. It is fully compatible with fossil diesel and can be used in all modern diesel engines without any modifications. Neste Oil has developed a concept for greenhouse gas (GHG) calcula-tion, complying with the European Renewable
20 Messages from WPC20, Doha
energy requirements. Based on the experi-ence from palm oil chain, a standard practice for GHG management has been developed to cover various feedstock. Verification of concept was carried out by SGS. Methodology of Neste Oil follows the Life Cycle Analysis as described in standards ISO 14040:2006 and 14044:2006. Greenhouse gas calculations apply standard ISO 14064-1:2006 and ISO 14067. The Green-house Gas Protocol Initiative Product Life Cy-cle Accounting and Reporting Standard (draft November 2009) is taken into account. The product complies with and exceeds the 35% greenhouse gas savings requirement with all feedstock currently in use.
Alternative fuels GTL (GAS-TO-LIQUID)Although GTL diesel has found its way as a blend component into the European niche die-sel market and even motor-sport applications, the use of neat GTL diesel as an automotive fuel remains an area of interest, especially in light of the European (CEN) and United States (ASTM) specification authorities' efforts to al-low neat GTL diesel to be marketed as a final product. The commercial scale operations of Oryx-GTL and the imminent commissioning of Shell’s Pearl GTL plant will increase the lev-els of GTL diesel in the market, making the application of neat GTL diesel a reality. This requires confidence in understanding the im-pact on engine durability and maintenance. Although much of this confidence has been gleaned by bench durability testing, the ulti-mate test of a fuel remains real-life applica-tion. A lecture [6] gave an overview of the various on-road experiences with neat GTL diesel, not only in the form of controlled, com-parative fleet tests, but also in real-life vehi-cle applications. Controlled trials include bus fleet and passenger car fleet tests, whilst oth-er experiences include a trans-Africa vehicle expedition using neat GTL diesel and a two vehicle wildlife census project covering more than 350,000 km. Although real-life, on-road tests benefit from exposure to real operating conditions, including fuel handling and dis-pensing, the extent of detailed engine evalua-tions are limited by operational, logistical and time constraints. The continuous monitoring of lubricant condition and regular evaluation of vehicle performance are indicators of gross component impact, while detailed, post-trial evaluation of various components allowed for a more in-depth understanding of long-term effects of neat GTL diesel on engines and
fuel systems. All of these on road evaluations showed GTL diesel to be a superior fuel from a performance, emissions and engine durability point of view.
LPG (LIQUEFIED PETROLEUM GAS) Growing oil prices and increasingly demanding environmental protection regulations mean that not only the construction of the engine needs to be continuously improved but also that newer and higher quality fuel has to be used in order to enable further reduction of exhaust gas emis-sions, improved engine performance and lower fuel consumption [7]. This is where alternative fuels play a major role, such as for example liq-uefied petroleum gas. The popularity of a cer-tain type of fuel on a given market depends, among other things, on governmental tax poli-cies. Low excise taxes translate into attractive prices compared to traditional petrol and diesel, LPG powered cars are expected to be much more environmentally friendly than cars pow-ered by petrol, while at the same time having comparable performance parameters. PKN Orlen had LPG compared to petrol in terms of engine durability, environmental aspects, fuel consumption and economics over a period of operation of up to 60,000 km. The results of the tests did not confirm LPG’s environmental superiority over petrol. The measured emission levels were comparable for the two types of fuel. In terms of the dynamic parameters of fuel consumption, acceleration and start up proper-ties in low temperatures, petrol was visibly su-perior.
OXYGENATESOxygenates may be an alternative to cope with future refining boundary conditions in Europe. Oxygenates may count for climate targets and / or for solving the diesel-gasoline imbalance without investments in bottom-of-the-barrel conversions [8]. Design-of-experiment-tech-niques were applied to determine the physical-chemical properties of fuel blends and to iden-tify potential interactions between FAME (fatty acid methyl esters), HVO, and oxygenates. De-spite the high oxygen content – leading to high densities and low energy contents – some oxy-genates, like polyethers, provided a substan-tial improvement in the diesel properties and combustion characteristics. The chosen poly-ether suited the hydrocarbon matrix including a huge cetane increase; density and cold flow properties partly exceeded the limits. Without adjustment of engine control, NOx emissions increased, but major soot, hydrocarbon, and carbon monoxide reductions were observed.

21Messages from WPC20, Doha
DME (DIMETHYL ETHER)Dimethyl ether (DME) as a clean fuel and inter-mediate product has received much attention in recent years. It is a multi-source multi-pur-pose chemical and fuel ensuring sustainable supply and energy security [9]. Compared to other potential alternatives, dimethyl ether shows the most promising properties. It can be produced from natural gas, coal or residual oil as well as renewable sources via synthesis gas chemistry. Consequently, it is a route to mon-etise and upgrade low-valued carbon sources. Dimethyl ether has been considered as a sub-stitute to liquefied petroleum gas (LPG) due to similar physical properties. It is a convenient fuel in high efficiency compression ignition en-gines and in fuel cell applications giving a high tank-to-well efficiency. It ranks among the best alternative fuels in terms of greenhouse gas emissions. Bio-DME synthesis can be an im-portant element of the future bio-refinery where biomass conversion processes are to produce energy fuels.
Not a wordThere were at least three topics that were not mentioned at all in the congress. No lecture was held on application of natural gas (neither CNG nor LNG) and hydrogen as fuels in inter-nal combustion engines or in fuel cells. No lec-ture was held on the latest development of the alternative propulsion systems (electric / hybrid vehicles).
References[1] A. Koltermann: The Sunliquid®-process: cel-
lulosic ethanol from lignocellulosic agricul-tural residues as a sustainable biofuel. F13 Paper 1
[2] R. Capaz et al: Life cycle analysis for biofu-els in Brazilian conditions. F16 Paper 1
[3] J. Benemann et al: Life cycle analysis for microalgae production. F16 Paper 2
[4] Z. Du et al: The industrial application and life cycle analysis for biodiesel produced by SCRA process from waste oils and fats. F16 Paper 3
[5] H. Erametsa: Green house calculation – us-ing actual values for HVO renewable diesel life cycle assessment. F16 Poster 9
[6] P. Schaberg et al: On road experience with neat GTL diesel. F13 Poster 3
[7] Z. Cieslikowski: Is LPG really competitive to petrol? F13 Poster 2
[8] M. Maly et al: Oxygenates new (bio) compo-nent for diesel. F13 Poster 4
[9] S. Sahebdelfar et al: Dimethyl ether: the al-ternative, multi-purpose source fuel of the future. F16 Poster 8
Keywords: biofuel, alternative fuel
György Wilde, PhD has been working for Hungar-ian Petroleum Association since 1992. He started to work in an ammonia plant, later on he was a scientific research worker in Hungar-ian Academy of Sciences, an expert in Ministry of In-
dustry and Trade, furthermore head of depart-ment in Mineralimpex Trading Co. He gradu-ated in University of Veszprém in 1976.

22 Messages from WPC20, Doha
AbstractThe cracking of raw materials has been car-ried out in a pilot scale tubular reactor at temperature of 530 °C and residence time of 10 min. Light distillates and middle dis-tillates from cracking reactions were fur-ther pyrolysed in steam-cracker unit. The steam-cracking parameters were tempera-ture of 860 °C, residence time of 0.3 s, and steam / raw material ratio of 0.54 in case of light distillate; while temperature of 830 °C, residence time of 0.3 and steam / raw mate-rial ratio of 0.85 in case of middle distillate. Products have been analysed by standard-ised and non-standardised methods. Liquid products contained olefin hydrocarbons in high concentration (25-50%) and had low contaminant levels. Products obtained from cracking of waste materials with polystyrene content resulted in liquid products with sig-nificant amounts of aromatic hydrocarbons, which reduced the yield of monomers in steam-cracking experiments.
IntroductionAs the world population increases, the con-sumption of the petrochemical products in-creases, too. Inside the petrochemical prod-ucts plastics play an important role in human life, but the proper handling of plastic waste is difficult. That is why in some countries, such as Germany, Japan or the USA, the recycling
Norbert Miskolczi, PhD (34)Associate professorDepartment of MOL Hydrocarbon and Coal Processing, University of Pannonia, Veszprém, [email protected]
András Angyal, PhD (31)Department of MOL Hydrocarbon and Coal Processing, University of Pannonia, Veszprém, [email protected]
László Bartha, PhD Department of MOL Hydrocarbon and Coal Processing, University of Pannonia, Veszprém, [email protected]
István Valkai (47)Head of Refinery Technology Development within Downstream Development MOL Group, [email protected]
Antal Tungler, DSc (68)Scientific advisor, Head of DepartmentHungarian Academy of Science, Centre for Energy Research, Bu-dapest, [email protected]
Lajos Nagy, Dr.Department of Chemical and Environmental Process Engineer-ing, Budapest University of Technology and Economics, Budapest, [email protected]
László VidaDepartment of Chemical and Environmental Process Engineer-ing, Budapest University of Technology and Economics, Budapest, [email protected]
Gábor Nagy, Dr. (48)Technology development managerMOL Group, DS, Petchem, [email protected]
Petrochemical feedstock by mild cracking of polyolefin rich plastic wastes
Dr. Norbert Miskolczi received 2nd place of 2011 WPC Excellence Award for Youth for delivering this topic

23Messages from WPC20, Doha
technologies have been researched and ap-plied since 80s. In those experiments mainly the energetic utilisation of the waste polymer recycling has been investigated. The EU has introduced stricter and stricter rules for waste management requiring the Member States to develop technologies which can manage the great quantity of waste produced.
It is clear that the utilisation of plastics and other wastes is an important environmental and energetic task. Plastics have relatively high so called hidden energy content, there-fore energy could be saved by their suitable recycling. Methods based on the pyrolysis of waste plastics polymers e.g. from house-holds and industrial companies are one of the prospective ways to ease the waste problem. The others are landfilling and incineration with or without energy recovery. Neither landfill-ing nor incineration can solve the increasing problem of huge amount of wastes, because the suitable and safe depots are expensive, and the incineration stimulates the growing emission of harmful and greenhouse gases e.g. NOx, SOx, COx etc. During chemical re-cycling the main carbon chains of polymers are cracked into lighter fractions (e.g. gaso-line, light, middle or heavy oils) in absence of oxygen in temperature range of 400-1,000 °C. The compositions of products are favour-able when moderate cracking conditions are applied, but the further utilisation of these hydrocarbons has not been solved yet. One possibility of their utilisation is fuel like appli-cation, blending in fuel as mixing components
or in mass flows of petrochemical industry. Generally these hydrocarbon mixtures have high olefin content which can be saturated with hydrogen, and isomerised by the use of catalysts to achieve improved properties. These steps result in a high quality synthetic diesel fuel, with high cetane number, and the-oretically these fuels are free from sulphur, nitrogen and metals. Figure 1 demonstrates some examples for industrial application of waste polymer cracking plants. These are usually catalytic (mainly fluid) technologies, which can only operate economically with rel-atively high capacity (~30,000-50,000 tonnes / year). Therefore many plants are partially un-der reconstruction and revision. In Hungary, it would be very difficult and expensive to collect 50,000 tonnes / year of the same type of plas-tic at a given place. Therefore a better solution is to develop an economical plant with smaller capacity (1,000-10,000 tonnes / year), which can be built near the regional selective waste collectors, and from which the products can be transported at relatively low costs.
Experimental Different polymer wastes (polyethylene − PE, polypropylene − PP and polystyrene − PS) have been used as raw materials in the experiments. All of the waste samples were derived from selective collected plastic waste streams. To ensure the more intensive cracking of plastic waste, zeolite catalyst was added to the raw material in 100/2 (plastic / catalyst) weight ratio. The layout of the proc-
Fig. 1. Industrial examples of waste polymer cracking plants (Source: John Scheirs − Walter Kaminsky: Feedstock Recycling and Pyrolysis of Waste Plastic, John Wiley and Sons Ltd, UK, 2006)

24 Messages from WPC20, Doha
ess is available in Figure 2. Cracking of poly-mer wastes was carried out in a pilot scale tubular reactor. The process could be divided into three main parts: waste pre-treatment, waste cracking and steam-cracking. First-ly, the waste plastics have been shredded and milled into suitable particles (< 10mm). The reaction temperature was 530 °C in the cracking stage. In steam-cracking section the steam-cracking parameters were tempera-ture of 860 °C, residence time of 0.3 s, and steam / raw material ratio of 0.54 in case of light distillate; while temperature of 830 °C, residence time of 0.3 and steam / raw mate-rial ratio of 0.85 in case of middle distillate. Both light distillates and middle distillates have been steam-cracked in the last stage.
Results and discussion Figure 3 shows the yields of volatile crack-ing products derived from various raw materi-als. Owing to the different activation energy of the degradation of the different polymers the product yields have been considerably different. Namely, the lowest yields of vola-tile products have been demonstrated in case of polyethylene. The highest yields of mid-dle distillates were measured in case of the cracking of low-density polyethylene − LDPE (50%) and PP (50%), while the mixture of
LDPE and PS have resulted in the highest yield of light distillate and the lowest amount of gaseous product.
According to data the light distillate frac-tions consisted of hydrocarbons in the C5-C11 range, while the middle distillates contained hydrocarbons from C9 to C26. The products obtained by mild cracking of PEPP had lo-cal maximums in every third carbon number, which was the consequence of the polypro-pylene constituent. As it is well known poly-propylene contained –CH3 groups in every second carbon atom in the main chain with low thermal stability. The decomposition of PEPS resulted in mainly styrene and its deri-vates, therefore the carbon number distribu-tion had maximum at C8. The aromatic con-tent was the highest in light distillates from PEPS raw material (48.1%) (see Table 1).
The sulphur content of cracking products was low (10-20 ppm), while the reference samples had sulphur content above 50 ppm. Other impu-rities could not be measured. The olefin content of steam-cracking feedstock derived from poly-mer cracking was high in all cases. The olefin concentration of cracking products was between 25 and 50%, while that of reference materials was under the limit of detection. The boiling point ranges have changed between 49-210°C and 138-369°C, in case of light and middle dis-tillates, respectively. Table 2 demonstrates the
Fig. 2. Layout of the process

25Messages from WPC20, Doha
Fig. 3. Product yields
Table 1. Composition of light and middle distillates (Ref. N. indicates reference naphtha and Ref. G. is reference gas oil)
Light distillates Middle distillates PE PEPP PEPS Ref. N. PE PEPP PEPS Ref. G. Aromatic content, % 1.4 2.1 48.1 10.6 0.8 0.9 8.5 7.5 n-olefin content, % 42.4 30.7 25.8 n.d. 49.5 28.7 30.2 n.d. n-paraffin, % 47.8 24.7 17.2 75.3 43.3 29.3 53.7 86.4 Branched, % 8.4 42.5 8.9 14.1 6.4 41.1 7.6 5.1 Naphtanes, % <1% <1% <1% <1% <1% <1% <1% <1%
main properties of heavy oils. According to data they have favourable properties for further en-ergetic utilisation. Contaminants in heavy oils had been analysed by standardised and non-standardised methods. It was found that the contaminant in heavy oils could be separated by high temperature press filtration and the level of remaining contaminants was below 20 ppm.
Following the cracking at 530 °C, a laboratory steam-cracking has been performed. The py-rogas composition is shown in Table 3. The pyrogas derived from different raw materials contained vast amount of methane, ethylene and propylene, while hydrogen was formed in low concentration beside the hydrocarbons. The highest ethylene yield has been found in
Feedstock PE PEPP PEPS. Aliphatic paraffins, % 61.5 62.0 62.1 Aliphatic olefins, % 29.4 30.1 31.4 Aromatics, % 9.1 7.9 6.5 M, g/mol 1,550 1,490 1,380 Flash point, °C 232 226 220 Melting point, °C 99 93 88 Heating value, MJ/kg 41.8 41.8 41.9 Density, g/cm3 0.859 0.857 0.855
Table 2. Main properties of heavy oils

26 Messages from WPC20, Doha
Light distillates Middle distillates PE PEPP PEPS Ref. N. PE PEPP PEPS Ref. G. Methane 24.89 29.78 32.25 20.32 15.42 19.38 19.58 24.03 Ethylene 50.48 45.38 45.94 42.89 45.18 43.75 39.45 45.89 Propylene 10.65 9.63 8.49 12.92 18.61 18.15 15.39 14.68 Other 13.98 15.21 13.32 23.87 20.79 18.72 25.58 15.40
Table 3. Pyrogas composition (Ref. N. is reference naphtha and Ref. G. is reference gas oil)
case of the steam-cracking of both light and middle distillates from polyethylene, further-more the ethylene concentration was higher than that of obtained from reference material steam-cracking. The yield of propylene was the highest, when the raw material contained 50% polypropylene beside 50% polyethyl-ene. The light distillates resulted in 52%, 44% and 29% of monomer yields from PE, PEPP and PEPS raw materials, respectively. It is important to note that the reference sam-ple resulted in 48% of monomer yield. Simi-lar results have been found in case of middle distillates, where the cumulative yields of eth-ylene and propylene were higher in case of polyethylene and polypropylene, than in the reference case. On the other hand the pres-ences of polystyrene in raw materials led to considerably lower monomer yields.
AcknowledgementThe authors are grateful to MOL Plc., TVK Plc. and Hungarian Academy of Sciences, János Bolyai Researching Foundation for fi-nancial support received for this work.
ReferenceThis manuscript have summarised the re-sults of the following paper: A. Angyal − N. Miskolczi − L. Bartha − A. Tungler − L. Vida − L. Nagy − G. Nagy: Production of steam cracking feedstock by mild cracking of plastic wastes. Fuel Processing Technology 91(11), 1717-1724 (2010)
Keywords: waste polymer, cracking, pyroly-sis, petrochemical feedstocks
Reviewed by József Kohán

27Messages from WPC20, Doha
Norbert Miskolczi, PhD between 2008 and 2009 worked at University of Leeds. His main research-ing areas are waste uti-lisations and polymer based composites. Now he is associate professor at MOL Department of Hy-
drocarbon and Coal Processing, University of Pannonia. Among others he is a member of IChemE, Society of Plastic Engineers. He obtained the M.Eng. in Chemical Engineer-ing degree at University of Veszprém in 2001; and PhD at same university in 2005.
István Valkai worked as R&D engineer on the de-velopment of high pres-sure catalytical amination, hydrogenation and prod-uct separation processes at NITROIL Chemical Research and Production Co. (Hungary) and later as
plant manager at Speciality Amine production unit. He joined MOL Plc. in 1995. Since 2004 he has been the head of Refinery Technology Development within Downstream Develop-ment supervising feasibility studies, project scoping, project proposals, project engineer-ing, laboratory catalyst testing and selection for MOL’s refineries. He has been involved in technology development related to motor fuel production covering all implemented technol-ogies. He got the MSc degree in chemical en-gineering at University of Veszprém in 1990.
Antal Tungler, DSc joined Research Group for Or-ganic Chemical Technolo-gy of the Hungarian Acad-emy of Sciences in 1967. Between 1996 and 2007 as a full professor he is the Head of Department of Chemical Technology
of Budapest University of Technology and Economics. From 2008 he is in the present position. He obtained MSc degree in chemi-cal engineering in 1967, PhD degree in 1978 and DSc in 1995. He has 84 publications in journals, and 2 chapters in two books.
Gábor Nagy, Dr. has started to work as a labo-ratory engineer in HDPE1 plant of TVK in 1988. From 1993 he worked as the head of Quality Con-trol, later as the head of Customer Service and Product and Application
Development. Since November of 2006 he has been managing the Technology Develop-ment’s work. He obtained degree of Chemi-cal Engineering at University of Veszprém (Hungary) in 1988 and got degree of Univer-sity Doctor in 1992. He received Professional Certificate in Management in 2004. He is an honorary associate professor of University of Pannonia.

28 Challenges
AbstractMOL Group has applied from international odour abatement practices among others odour patrol, odour reduction and (Leak De-tection and Repair) LDAR system. We have developed objective measurement and quan-tification methods for odour level determi-nation, and afterwards the odour mapping of three MOL refineries were performed to identify the potential odour sources. We re-vealed the available technical solutions for odour abatement and on that basis an odour reduction project is under implementation at the most affected Zala Refinery (Hungary). We implement permanent Leak Detection and
Repair (LDAR) programme to reduce fugitive emissions. Further developments are needed and planned in the field of on-line monitor-ing system, and automatic masking system. Parallel with the technical measures imple-mentation of management tools – an Odour Management Programme – is inevitable in order to achieve continuous and detectable improvements in the odour status of our re-fineries.
IntroductionWhy shall we deal with annoying odours?Although the petroleum refineries’ contribution to the anthropogenic VOC (volatile organic compounds) emission is only 0.7% petroleum refining is one of the most common and most complex major industrial odour sources. Emis-sions can occur in nearly all parts of the refin-ery including processing, flaring, wastewater treatment, storage of products.
The quantity and type of emission depend on the refinery size, type of crude processed (whether sweet or sour), types of processes used, presence of petrochemical processes, air pollution control measures in use, mainte-nance standards and practices of such equip-ments as pump and compressor seals, and
Katalin Miklós (27)Technology development engineerMOL Group, MOL, DS Development, Environmental and corrosion [email protected]
Melinda Czibulka (36)Technology development engineerMOL Group, MOL, DS Development, Environmental and corrosion [email protected]
Réka M. Söjtöriné (36)Technology development engineerMOL Group, MOL, DS Development, Environmental and corrosion [email protected]
New environmental challenge in Refining – How to minimise or eliminate unpleasant odour emissions? Part 2
29Challenges
general housekeeping standards [1].
The nose is an extremely sensitive detector of odours and can be matched by only the most sensitive instrumental techniques. Many smells are identified by comparison with pure compounds diluted by odour-free air until they are near to the odour threshold limit. How-ever, the introduction of gas chromatography coupled with mass spectrometry, has already made it possible to confirm the identity of many of the compounds generating odours in refineries.
In our previous article [2] we highlighted the objective methods of quantifying unpleas-ant odours and identifying their sources and reviewed the technical possibilities of odour abatement. In this second part the odour emission status of Duna, Zala and Bratislava Refineries will be reviewed presenting the technical measures which have already been taken and planned to be taken in the future in order to comply with the new regulations and avoid commu-nity complaints. We will even show a complex solution through introducing the case of Zala Refinery. Expectedly, we have to pay more attention to odour problems in the future – in parallel with other public nuisance items like noise and landscape. Supporting this activity the management tools (Odour Management Programme recommended by BAT – best available technique) and monitoring equip-ments (Electronic nose system) will be re-viewed in the second part of the article. Final-ly, an overview of some other oil companies’ odour control programmes provides useful information to cope with this future challenge.
Legislative background – Changes in the Hungarian odour controlThe recently renewed Hungarian air protec-tion legislation already imposed requirements to limit emissions and control odour impacts.
The Hungarian Government regulation No. 306/2010. (XII. 23.) on air protection states that loading the air with annoying odour is
prohibited. Besides, an activity which in-volves odour occurance can only be pursued if the emitter takes into account and applies the best available techniques (BATs). More-over, if the prevention of odour load is not technically guaranteed, that activities may be restricted, suspended or prohibited.
Under the law, a technology causing odour impact can not be operated. Therefore, it is important to analyse the odour sources thor-oughly in order to prevent odour emission, plan odour control, and manage occasional public complaints.
This is a difficult task from many aspects. First, the odour concentration at a residential area depends on the total emission of a given area, the physical and chemical processes in the atmosphere, the weather, the terrain and other factors together. Moreover, the real odour sense depends also on individual characteristics (age, gender, mental status, genetics, etc.) [3].
On the other hand, odour is not a property or characteristic of a material but a reaction from people affected by a material. We could say it is a sense created in the nose by hun-dreds of molecules. Changing the concentra-tion of just one component can significantly modify the sense of smell.
Odour sources of crude oil refineries Typical odour sources of refineries can be coupled with certain technologies. The main odour emitting procedures are the followings:
- Slop and waste oil reprocessing- Wastewater treatment, sewer system- Spent caustic treatment- Bitumen blowing, -loading, -storage- Storage of light hydrocarbons- Delayed coking and- Flaring.
According to the appearance of sources they can be classified as:
- Point sources: e.g. stacks, outlets of ventillation systems- Surface or diffuse sources: e.g. basins, landfills and- Fugitive sources: pipeline flanges, valves, leakages.
Generally the petrochemical and oil indus-

30 Challenges
try ‘stinks’ of pollutants such as hydrogen sulphide, sulphur dioxide, ammonia, organic acids and hydrocarbons; and the wastewater treatment system generates additional hydro-gen sulphide, mercaptans, ammonia, amine and indole emissions.
Odour emission status of MOL Refineries Odour mapping was conducted in three of MOL refineries in order to identify the po-tential odour sources. A part of them, the point sources, are easy to locate, moreover their emission can be reduced and control-led by up-to-date BAT technologies. Empha-sis should be placed on diffuse and fugitive sources, which usually are in connection with storage and wastewater treatment, when odorous substances are released into the air through vents, leakages and failed equip-ments.
The fugitive sources of refineries are general-ly the pumps, compressors, pipelines, flang-es and packing glands of closing and open-ing devices, flanges of equipments, sampling points and vents. Significant odour load origi-nates from the objects of wastewater treat-ment plant by evaporation.
The main pollutant components, emitted from processing units, are hydrocarbons (aromat-ics) and sulphur containing compounds such as hydrogen sulphide and mercaptans. These are typical, easily distinguishable odourants. . 2007-2008 INVESTIGATION IN THE VICINITY OF DUNA, ZALA AND SLOVNAFT BRATISLAVA REFINERIESIn specific processing technologies unpleas-ant odorous substances are emitted into the air. Our aim was to map these sources in or-der to develop a strategy on odour emission reduction and improve the quality of ambient air. Three of our refineries were thoroughly investigated in the years 2007-2008.
Duna RefineryA preliminary survey was carried out in June and July, 2007. The processing units and the neighbouring communities (Százhalombat-ta, Ercsi, etc.) were visited 3 times a week. Odour situation and the meteorological pa-rameters were recorded. Based on these
measurements a standard odour concentration assessment was performed from August to No-vember by an accredited external laboratory.
In Duna Refinery the following points were sampled: Bitumen unit, Delayed Coker unit, AV-2 unit, Lower Wastewater Treatment Plant (WWTP), Lower Railway Loading unit, Claus-4 unit, Upper WWTP – settling basin, Pilot Plant and Upper Railway Loading unit. Additional records were taken at several points of loca-tions of Százhalombatta, Dunafüred, Ercsi, Szigetcsép and Szigetújfalu.
Based on the test results the average odour concentration of the point sources exceeded 30 OU/m3 in all cases, which is considered to be unpleasant. At specific points – Lower and Upper Railway Loading unit, Claus-4 unit, Upper WWTP – settling basin, Pilot Plant – very strong odour (>100 OUE/m3) could be observed.
In the neighbouring communities the odour concentration was 0-50 OU/m3 depending sig-nificantly on the actual wind direction. Values exceeding 30 could be detected occasionally at Százhalombatta – Erkel ring, Szigetcsép – Kossuth and Dózsa Streets, and between Szigetújfalu and Tököl (uninhabited area) [4].
Zala Refinery (ZR)In Zala Refinery a three-day long test had been organised. The examined point sources were selected in connection with the major odour emitting technological processes, bi-tumen blowing and waste oil reprocessing. Additional immission points had been es-tablished in accordance with the local com-munities’ complaints. At the same time the efficiency of the existing odour depressing system was also tested.
In Zala Refinery the sampling points were as follows: bio-filter in Bitumen blowing unit, storm water basin in WWTP, vicinity of VILLAS site, car park, vent of storage tank No 2008, oil separator tank No V11, and slop storage tank No T301. In the vicinity of Zala Refinery observations and samplings took place in the Vineyard, the nearest residence area of ZR (towards Zalabesnyő) and in the town area (Peter Hill) during the waste oil reprocessing.
In 33-100% of the detections odours were ex-perienced in varying degrees of strength. The main point source was the bio-filter. Based on the test results the odour depressing system

31Challenges
did not reach the sufficient level of odour re-duction, so its further improvements were definitely required [4]. Details will be provided in the article.
Slovnaft Bratislava Refinery The olfactometric mapping was performed at the request of the Slovak Environmental Agency based on the complaints of inhabit-ants living near to the refinery. The first part of the task was the mapping: the refinery was drived through twice a day searching for po-tential odour sources. Afterwards an Expert Laboratory was invited to take samples in the Refinery and its vicinity during turnarounds and normal operational conditions.
According to the survey conducted at turna-round period the following places have sig-nificant odour potential: AVD-6, AD-5, Steam cracker, Phenol, API separator on block 50, FCC, CCR-5, Road tank cleaning and two more places located on the boundary of Re-finery. The character of odour was oily, bitu-men, aromatic and sulphurous in the neigh-borhood of the refinery.
Similar test results were gained in case of normal operating conditions. Odour from some units was observed as high but it was nothing uncommon compared with other sources similar to the refinery. Sometimes, in case of bad air conditions (cold weather, ad-verse wind direction, and wind calm) sensible unpleasant odour can occur in the vicinity of the refinery. Unfavorable weather conditions are the main reason of higher odour unit val-ues during normal operation. Maximum dis-tance, were the odour nuisance was meas-ured, was 3.6 km from the refinery during turnarounds; in case of normal operation it was even smaller [5].
Uncertainty of the test results The odour concentration tests were per-formed by dynamic olfactometry which main-ly can be used for measurements of stable sources with constant odour emissions; and additionally it can be suitable for immission odour surveys. The main uncertainty element of this testing method is the subjectivity of the assessors, ’noses’, which originated from the potential changes in their olfactory sensitivity in time. This weakness could be compensat-ed with applying a large number (at least four members) panel group, and the panel mem-bers should have been properly selected and qualified.
2009 INVESTIGATION AROUND ZALA REFINERYSince the previous investigation’s major amend-ment measures had not been implemented, during the 2009 investigations similar results were obtained for odour state of Zala Refinery. Besides recording odour concentrations of main odour sources the investigation had an additional task to model the odour dispersion around the refinery. For this purpose several odour samples had been taken in the emis-sion points, and immission points of the resi-dential areas. These samples were analysed by gaschromatography, detected for hydro-carbons from C5 to C14 and mono-aromatic compounds. The concentration of individual compounds was not determined but a ’finger-print’ was developed from the ratio of aromat-ic and aliphatic hydrocarbons.
Based on this ratio the emitting sources have been divided into two groups. The first group could be characterised with significant amounts of mono-aromatic contaminants compared with aliphatic hydrocarbons, as in wastewater treatment plant and vent of bio-filter. In the other group the intensity of mo-no-aromatic compounds is much lower; slop storage tank, bitumen blowing unit and rail-way unloading process belong to this group.
The ’fingerprint’ of immission and emission samples should be compared to identify the source(s) of ambient odour load. In the ma-jority of immission samples mono-aromatic hydrocarbon traces had been detected, but aliphatic ones were hardly ever present.
The identification of relevant sources was complicated by the fact that the contami-nated air block mixes well with ambient air before reaching the residential areas. There-fore the components, which could be used for identification, would be present in low concentrations. However, since in immission points mono-aromatic hydrocarbon traces have been detected, probably the first group of emitting source, the wastewater treatment plant and the biofilter, are responsible for odour complaints [6].
Following the investigation, the identified main odour source, the biofilter has been taken out from the process. The major problem to be solved remained the reduction of odour emis-sions from wastewater treatment plant. Ac-tions to reduce odours will be detailed later.

32 Challenges
Odour Manage-ment Programme (OMP) According to the Draft Reference Document on Best Available Techniques for Mineral Oil and Gas Refineries (Draft of 1 July 2010) re-fineries should have an odour management plan (OMP) as a well identified part of their environmental management system, includ-ing the following elements (see Figure 1):
- Odour management strategy- Protocols for conducting odour monitoring- Protocol for response to identified
odour events- Ongoing odour prevention and elimination
programme designed to identify the loca-tion, nature, emission and dispersion of the site odours, to characterise the odours, and to implement elimination and / or reduction measures in relation to these odours
- Implementation timetable for all actions to be taken within this programme
- Reporting procedures to regularly advise management on the results of the plan
- Review programme for regularly updating the plan [7].
Preliminary results from an EPA-funded (US Environmental Protection Agency) study in-dicate that, in a well-controlled refinery, fugi-tive sources are the major sources of volatile organic compounds (VOC) [1]. Therefore we review the BATs for VOC abatement.
Prevention, detec-tion and control of odour emission PROGRAMME FOR FUGITIVE EMISSIONSThe fugitive VOC emissions’ control repre-sents a major challenge to the oil industry and requires an overall strategy. In practice, it is usually managed successfully world-wide by implementing permanent ongoing Leak Detection and Repair (LDAR) programmes consisting of the following elements:
- Type of measurement: e.g. detection limit of 500 ppm for valves and flanges, against the interface of the flanges
- Frequency: e.g. twice a year- Type of components to be checked: e.g.
pumps, control valves, heat exchangers, connectors, flanges
- Type of compound lines: e.g. excluding lines that contain liquids with vapour pres-sure above 13 kPa
- Indication of which leaks should be re-paired and how fast the action should be taken [7].
Some techniques to be considered:- The essential first step of the programme
is the establishment of a fugitive release inventory, including the combination of sampling, measurements, environmental monitoring, dispersion modelling and esti-mates based on emission factors
- Identification of all potential sources of VOC releases
- Quantification of the VOC releases, initially as ’baseline’ estimates and subsequently to a more refined levels; using EPA pro-tocol (US EPA-453/R-95-017) for process component losses and API methods for storage losses
- Use of appropriate dispersion modelling techniques, predicting atmospheric mass flux and concentrations
- Employment of environmental monitoring techniques, comparing the predicted situ-ation with the measured one
- Minimising VOC releases from refinery utilities systems and during plant mainte-nance, turnarounds and cleaning opera-tions
- Vapour recovery / incineration / use
Fig. 1. Steps of Odour Management Programme [8]

33Challenges
- Emissions of relief valves are to be routed to flare or dedicated incineration system
- Minimising fugitive VOC emissions through double mechanical seals on pumps, com-pressors or agitators
- Use of low emission valve stem packing (500 ppm) on critical valves, particularly on gas / light liquid high pressure / tempera-ture duties
- Minimising the number of flanged con-nections on pipelines and the use of high specification jointing materials
- Use of totally closed-loop circuits in all rou-tine samplers [7].
Environmental benefits can be achieved by using a portable VOC detecting instrument to detect leaks during regularly scheduled in-spections of valves, flanges and pump seals. Leaks are then repaired immediately or are scheduled for repair as quickly as possible. An LDAR programme could reduce fugi-tive emissions by 40 to 64 percent, de-pending on the frequency of inspections [7].
PROGRAMME FOR ODOUR MONITORINGMonitoring devices equipped with electronic nose (see Figure 2) are often used at some polluted areas to comply with authorities re-quirements and to prevent complaints, es-
pecially in case of landfills and wastewater treatment plants [9].
The monitoring system typically consists of• Electronic nose(s) (e.g. RQ boxes (aiR
Quality)), installed preferably next to all major sources and / or next to the fence line into the two dominant wind directions
• Data processing and modelling software and
• Weather station.
These systems are in connection with a cen-tral computer to where the information will be transmitted. The software processes data and presents on-line odour map (see Figure 3). The central computer automatically gives an alarm signal in adverse weather conditions and it can be connected to different odour control technol-ogies, such as osmotic barrier, which can be au-tomatically started in case of alarm signal [10].
It is practical to connect this system with a weather forecasting station because the soft-ware alerts several hours before adverse weather conditions happen. Thus, this is a possibility for ‘active’ protection beside the ‘passive’ protection (osmotic barrier), with which the effect of significant odour emmit-ting technologies can be eliminated.
Fig. 2. Configuration of an on-line odour monitoring system [9]

34 Challenges
ODOUR CONTROL TECHNOLOGIES Process control techniques, various methods are available for controlling hydrocarbons and organic emissions.
Control of ammonia and hydrogen sulphide odoursAmmonia and hydrogen sulphide often oc-cur together, particulary in hydrocacking and reforming operations. The most common method of their removal from process vapour streams is water injection. Their particular waste stream is usually treated by sour-water stripping (stripped in the presence of acid or base) followed by incineration of ammonia or hydrogen sulphide. Ammonia and hydrogen sulphide produced in catalytic cracking units are also partially removed by water injection, but this is applicable only when ammonia and hydrogen sulphide are present together. If the gas stream contains only hydrogen sul-phide, it is commonly scrubbed with mono-ethanolamine (MEA) or di-ethanolamine (DEA) or their derivatives [1].
Control of odours in waste collection pitsOdours emitted from the collection pits for drainage water can be substantially reduced by covering the surface of the wastewater with a layer of plastic balls. These balls are hollow moldings of polypropylene that is re-sistant to almost all chemicals. They prevent heat loss and evaporation (and hence reduce odour, too). Tests showed that a single layer of Allplas floating balls reduce evaporation by up to 90% and additional layers provide only marginal reduction. Operators reported no
complaints of smell in DEA-Scholven Refin-ery, Karlsruhe [1].
Fuel gas sweeteningIn order to comply with the authority limit values of SO2 emission of process heaters, boilers etc. the refineries sweeten their proc-ess gases or remove hydrogen sulphide from them before burning them in process heaters or boilers.
Control of industrial odoursHydrogen sulphide is usually removed by scrubbing with solvents (e.g. MEA and DEA). Regeneration of the solutions involves strip-ping a side stream to produce concentrated hydrogen sulphide with smaller amounts of carbon dioxide, water vapour and hydrocar-bons. These gases are processed in a recov-ery facility, such as a Claus plant, to produce elemental sulphur [1].
The standards also require continuous moni-toring of the concentration of sulphur dioxide or hydrogen sulphide and reduced sulphur compounds’ concentrations in the gases dis-charged into the atmosphere. This is to en-sure proper operation and maintenance of the emission-control system [1].
Since refinery odours are widespread, inven-tories of odorous emissions for each source type should be developed, covering odour in-tensity, quality or character (compound iden-tity if feasible) and relative concentration. The relation between odour emission rate and community annoyance needs to be es-tablished. The results could be used in zon-ing and siting studies and in specifying con-trol measures.
Propagation control technique - Osmotic barriersOsmotic barriers can be divided into two groups based on their operating principles. The first is the ’easier’ solution of odour masking, when a deodorising compound (or mixture) is discharged into the ambient air, and suppresses the annoying odour (see Fig-ure 4), like the air fresheners in household use. In a proper dosage neither the smell of masker nor the smell of unpleasant odour can be detected by human nose, hereby no local complaint would occur. In the other solution a more complex mixture of compounds is sprayed into the air, it starts a chemical reac-tion with malodorous compounds and forms complex compaunds, thus reducing their vol-atility and their capability to cause odour.
Fig. 3. On-line odour map [9]

35Challenges
Efficiency of these osmotic barrier systems can be improved by automatic operation controlled by an odour monitoring system as mentioned above in ‘Programme for odour monitoring’ part.
Odour reduction in Zala Refinery Community complaints have started to occur more frequently as people realised their envi-ronment and individual rights.
Zala Refinery is located in an environmen-tally sensitive area not only because it is situ-ated on the watershed of Lake Balaton, but – in the absence of proper local regulations in the past – it is situated only 150 metres far from the residential area. The odour effect of open basins regularly annoys the local peo-ple of Zalabesenyő, situated just a few hun-dred metres south away from the wastewater treatment plant.
In the past, there was no problem with the
nuisance impact of the refinery, but decades have passed and the neighbourhood has changed into an aware and sophisticated suburban community. In the last years public complaints caused more and more conflicts forcing the company to take more actions.
It was proved that substantial improvement of the odour status of a site cannot be achieved unless dealing with all types of sources.
Our task was to define the significant odour sources (based on the odour maps prepared in 2007) and develop process solutions for eliminating, or reducing the odour impacts.
Four main parts of the planned scope are:– Technical modifications of the existing
wastewater system (incl. reduction of the odour emission, closing of wastewater cooling and some sewer systems). Imple-mentation of the exhaust gas collection system for the covered and closed units, and elimination of exhausted gases.
– Elimination of the odour impact of the stor-age tanks, installation of internal floating roofs and collecting the odorous tank ex-haust gases – which are vented directly
Fig. 4. Odour masking system in MOL Group Mantua Refinery (Italy)

36 Challenges
into the atmosphere – into a common, closed system for elimination.
– Implementation of an odour masking sys-tem to mitigate the odour impact of the stack of Bitumen blowing unit.
– Eliminate the odour emissions from the Railway Unloading unit. (Separate project belonging to Logistics manages the techni-cal details and the investment.)
For definition of the relating technical scope a feasibility study has been prepared in 2010. The project was devided into two phases (Y2011 and Y2012) and separate Individual Project Proposals (IPP) have been approved. The implementation of the installation of closed system will be completed expectedly by the end of 2012.
MODIFICATION OF THE OVERSIZED AND OPENED WASTEWATER SYSTEM Since crude oil distillation had been stopped in 2001 the influent quantity of wastewater fell down drastically. The number and size of ba-sins were far more than necessary, leading to extra VOC and odour load of the ambient air.
Obvious solution for the reduction of VOC and odour load was the enclosure and cover-ing of the basins and other objects. Rethink-ing the operation of wastewater pretreatment system was seemed to be useful in order to decrease the size of evaporating (odour emitting) surfaces before starting the design works of enclosure.
The wastewater volume of units, contami-nated with oil, is max. 30 m3/hour; oil con-tent (measured by organic solvent extrac-tion): 100-350 mg/l; pH value: 3.5-6 in case the flotation device at Bitumen blowing unit is in operation; otherwise, during non normal operation, or failure the oil content is max. 1,000 mg/l. In case of rains the influent wa-ter flow increases 5-10 times than the before mentioned volume, up to 400 m3/hour.
In order to decrease the size of evaporating surfaces and parallelly reduce the odorous gases which have to be collected and elimi-nated, the idea of using the stormwater basin only for rainwater storage in the future had come up. (Water from the stormwater basin is forwarded to the biological treatment ba-sin in the original configuration.) Covering the stormwater basin and equipping it with an au-tomatic scraper device would be too compli-
cated and expensive since the partition walls of the basin (insulated with HDPE foil) were statically inadequate for carrying weight. An external expert company has been involved to investigate whether the other elements of the system (without the stormwater basin) would be able to provide the water quality re-quired for the biological treatment inlet, after the necessary modifications.
The minimum required size of the basins had to be defined according to the given data of volume and temperature. Then this should be compared with the presently available basins. Based on the survey and the preliminary cost evaluation the expense of upgrading of the present basin (regarding its status) is nearly equal with the cost of building a new one, so the definition team has supported the latter. Thus gave an opportunity to determine the size and volume of the new basin in order to be optimal for skimming taking into consideration that the influent water temperature is approx. 55 °C. If the system is closed (covered) before the skim-mer, the water in the basin would expectedly reach the necessary temperature without any heating, since the effluent water of the floata-tion device is 56.5 °C in average.
Temperature, which improves the removal efficiency, causes difficulties at the biologi-cal treatment basin, since the maximum in-let temperature is 30 °C in summer time and 12 °C in winter time. The wastewater cannot cool down to the required temperature in the closed system; according to the calculations only a decrease of 8.4 °C can be achieved, hence installation of an air cooler became necessary [11]. Thermal disposal of odorous gases exhaust-ed from the covered space of the wastewater systemThe team decided to treat the exhausted va-pours from the covered space of the new basin of the wastewater treatment plant separately and to install a new, smaller incinerator (fur-nace) for the thermal disposal of odorous va-pours exhausted designed specifically to the character of the stream. The equipment to be installed (on the incinerator furnace) is a ther-mal afterburner equipment (TNV), supported by natural gas firing; which totally incinerates the hydrocarbon contaminant contents of vapours.
Cleaning of the stormwater basinFollowing the construction of the new, more closed wastewater sewage system no con-

37Challenges
taminated water having malodorous effects will enter the stormwater basin. This will be guaranteed by the safety oil separator to be installed upstream of it (see Figure 5). In or-der to eliminate the stormwater basin as a source of disturbing malodorous emissions all contaminants accumulated during its pre-vious operation have to be removed from it. The stormwater basin is located in a part of the refinery close to a populated area there-fore cleaning the basin is an inevitable pre-condition for achieving a significant reduction in malodorous emissions.
ELIMINATION OF THE ODOUR IMPACT OF TANKS Due to the previous years’ developments – implementing a closed system with collection of of blowdown gas on the bitumen storage tanks; receiving the gases (vapours) from road tanker loading unit; and the co-incin-eration of these gases with bitumen blowing gases in the preheater furnaces – the odour load has already significantly decreased.
The main odorous vapour sources beside the elements of wastewater system are the waste oil and flux oil storage tanks and tanks which are used for storing water generated during the waste oil processing.
Thermal disposal of odorous gases exhaust-ed from the tanksThe proposal is to have the gases exiting from the vents of waste oil and flux oil tanks disposed by burning in a single incinerator in-stalled close to the said tanks. The vapours of the waste oil and flux oil tanks may contain also some ‘light ends’ (naphtha vapour) at low concentration levels. This means that an ex-plosive gas concentration may develop while a tank is heated to 80 °C prior to operation.
From the air spaces of tanks used for storing water generated during waste oil processing malodorous substances may exit what need to be collected and treated. Tanks No. 306 and 155 are used for storing slops formed during the course of operations (asphalt blowing, waste oil processing) carried out at Zala Refinery. The proposal is to connect gases and vapours emitted from the vents of the tanks to a closed collection system, to install an exhaust network (from the tanks and wastewater system elements) and then dispose these substances by a third small in-cinerator located in the area of the Bitumen Modification Plant.
The project to be implemented would also in-clude the removal, collection and incineration of gases formed in the course of modified bi-tumen and chemically stabilised rubber bitu-men production.
Gathering the malodorous gases into a com-mon system (diverting the tanks’ gases on pipelines) has turned out to be an uneconom-ic solution due to the great distances and the differences in quality. Additionally, the possi-bility of units to utilise the heat generated by heat recovery furnaces is also limited; there-fore the external expert company recom-mended direct thermal disposal (combustion) without heat recovery.
INSTALLATION OF PROFESSIONAL MASKING SYSTEMMost of the odour sources identified in the refinery will be eliminated through the imple-mentation of the technical scope defined for the 1st and 2nd phases of the project ‘Reduc-tion of odour emissions at Zala Refinery’.
The only odour source which may involve malodorous emissions periodically in the fu-ture is the stack of the Asphalt blower. There-fore installing a system for masking the malo-dorous emissions of this stack – similar to the previously used deodorant additive system – is necessary with the potential malfunctions and other special operating conditions taken into consideration for its design and opera-tions.
These systems apply fine mist of special chemical forming complexes with the odour-ant molecules making them non-recognisa-ble for human olfactory system and making them heavier to enhance earlier fall-out, be-fore reaching the receptors.
The key factor for the cost-effective applica-tion of these barriers is the proper placement based on thorough olfactometric testing in several meteorological conditions. Another method for reducing chemical consumption of the osmotic barrier is the automatic control of injection by wind direction (i.e. injection of the chemicals only when the wind blows to-wards the sensitive recipients) [11].
POST EVALUATIONEliminating all the substantial odour sources is highly important also with respect to the evaluation and follow-up of the results of the overall project as control tests cannot be con-

38 Challenges
ducted while any of the sources remains in existence.
Beyond the implementation of the technical content of the project the proper communica-tion of the results to the public is essential to prevent the community complaints. In case of not adequate communication the ceasing of the further community complaints is not likely to be ensured.
After the implementation of the new system no oil contaminated water would load the Stormwater basin. In case of critical circum-stances (e.g. heavy rainstorm) the avoid-ance of contamination will be provided with a newly built-in security oil separator [12].
After the abandonment of old, downgraded basins a new, state of the art post-treatment basin is to be installed (see Figure 6). The odour effect will be eliminated by covering and collecting the evaporated gases.
Odour control practices in the world The practice of Shell and ExxonMobil Corporations is presented in the following part.
ODOUR PATROLSShell pays a great attention to odour emissions and is committed to be a good neighbour by contributing to the local community. The authority license of the refinery states that offensive odours must not be discharged beyond the boundary and requires Shell to have procedures to detect, control and minimise the discharge of odorous substances and to conduct odour patrols and odour audits.
Odours are minimised through a combination of well-designed plants and facilities and ongoing operational vigilance and control. This includes: twice a day calibrated ’noses’ (tested for sensitivity to odour) conduct odour patrols; and quarterly odour reviews carried out by members of the EPA, community odour panel (a team of community members with calibrated ’noses’) and Shell [14].
In case of a community odour complaint additional odour patrols are conducted in order to locate the source of the odour and afterwards take the corrective measures quickly.
For non-routine operations such as shutdown and restart of units, the potential odour impacts are considered during the planning stages and managed during the works. The refinery also encourages community members to call the refinery hotline if an odour is sensed that may be coming from the refinery and these complaints are promptly investigated [15]. ODOUR BRIGADEExxonMobil is committed to have zero impact on their neighbourhood, therefore providing quality products in a way that is environmentally responsible and community friendly. Being aware of the fact, that human noses are often more sensitive to odours than sophisticated analysers they have established an Odour Brigade programme to help in early detection. All refinery employees and contrac-tors are members of the Odour Brigade under the slogan of ‘If you have a nose, you’re on the brigade’. The information of unpleasant odours (location and description of the odour)
Fig. 5. Security oil separator [12]
Fig. 6. Covered post-treatment basin [13]
39Challenges
is reported to a 24-Hour Neighbourhood Hot-line helping to identify certain sources. Best way to response quickly to an odour complaint is preventing the odour. So the focal point of ExxonMobil’s odour activity is prevention in-cluding both procedural changes and equip-ment modifications, like:
- Installation of large vapour recovery system on tanks and units
- Injection of masking odourants into process streams
- Upgrades of flare system- Installation of flare meters and controls- Establishment of the Odour Brigade- Tracking / analysing odours to find solutions.
Additionally they are continually improving upon maintenance programmes and procedur-al controls [16]. OSMOTIC BARRIERSEcosorb® odour removal products can be used in a variety of areas around a refinery includ-ing water treatment facilities, sludge ponds, sulphur recovery units and API separators. To remove odours during tank cleaning and main-tenance operations, portable dispersion sys-tems can be used in the working area to control malodours. Ecosorb® products can be directly injected into flue gases and stacks and may be used as a substitute scrubbing solution in some applications [17,18].
References[1] Board on Toxicology and Environmental
Health Hazards; Odors from stationary and mobile sources; National Academy of Science, Washington D.C. (1979)
[2] K. Miklós − R. M. Söjtöriné − M. Czibulka − Gy. Isaák: New environmental chal-lenge in Refining: How to minimize or eliminate unpleasant odour emission – Part 1; MOL Scientific Magazine, 2010/2
[3] S. Vigneron − J. Hermia − J. Chaouki: Characterization and control of odours and VOC in the process industries; Else-vier Science B.V. (1994)
[4] M. Czibulka: Odour mapping of Duna and Zala Refinery; MOL internal report; DS Development Environmental and Corro-sion Protection, ECP 2007016 (2007)
[5] M. Čeppan − M. Michvocík − M. Czibulka: Olfactometric mapping of potential odour sources (Bratislava Refinery); MOL in-ternal report; DS Development Environ-mental and Corrosion Protection, ECP 2008010 (2008)
[6] Cs. Ágoston, PhD: Test report and expert opinion on identification of odour sources (at Zala Refinery); KVI-PLUSZ Environ-mental Testing Office Ltd. (2009)
[7] Draft Reference Document on Best Avail-able Techniques for Mineral Oil and Gas Refineries; Joint Research Centre, July 2010
[8] www.odormanagement.com; Download-ed 01.09.2011
[9] RQ Box Anywhere; Odor & pollutant gas-es: monitoring of one or more site(s) via Internet; AplhaMOS brochure;
http://env.alpha-mos.com/en/produits/rq_box_anywhere.php Downloaded 08.02.2012
[10] Electronic identification of odour sources; R&D report; VITUKI Nonprofit Kft. (2011)
[11] Project documentation – Reduction of odour emission at Zala Refinery; DS De-velopment Environmental and Corrosion Protection; 2010-2011
[12] J. Elemér: Feasibility study – Odour emis-sion control and reduction at MOL Zala Refinery; H.J.K. Engineering Office Ltd.; January, 2010
[13] http://www.powerplastics.co.uk/tank_cov-ers/service/keder_covers Downloaded 03.05.2012
[14] http://www.shell.com/home/content/au_en/about_shell/geelong/environment/community_amenity.html?LN=/left-navs/zzz_lhn2_1_3.html; Downloaded 26.09.2011
[15] Environmental Improvement Plan 2007-2009, Geelong Refinery http://www-static.shell.com/static/aus/downloads/geelong/eip_report.pdf; Downloaded 26.09.2011
[16] http://www.exxonmobil.com/NA-English/Files/whatisthatsmell.pdf; Downloaded 04.08.2011
[17] http://www.environmental-expert.com/articles/georgia-wastewater-utility-cred-its-ecosorb-for-significant-reduction-in-odour-complaints-250282/view-com-ments Downloaded 06.09.2011
[18] http://omi-industries.com/markets/refin-ing.php Downloaded 06.09.2011
in molecular biology. John Wiley & Sons, Inc. (1995)
Keywords: odour control, odour manage-ment, odour monitoring, electronic-nose, odour reduction.
Reviewed by György Isaák

40 Challenges
Katalin Miklós has been working at DS Develop-ment, Environmental and Corrosion Protection in project management field of HSE relating projects. Partially she deals with air quality protection and pol-lution dispersion modelling.
She has joint MOL Group with Growww 2008 Programme after graduated at Budapest Uni-versity of Technology and Economics as en-vironmental engineer, specialised in environ-mental technology.
Melinda Czibulka is a technology development engineer at Downstream Development, Environmen-tal and Corrosion Protec-tion. She has over 14 years of experience in air and noise investigations, pollu-tion control. She has dealt
with odour surveys and computer modelling in refineries since 2007. Her environmental stud-ies have completed at College of Technology, in Győr, and Budapest University of Technology and Economics (postgraduate education).
Réka Söjtöriné Mészáros has been working at DS Development, Environ-mental and Corrosion Pro-tection. Her main profes-sional field is management of HSE projects, since 1998. She has been gradu-ated at Budapest Business
School, College of Finance and Accountancy as economic engineer; and at Széchenyi István College as environmental engineer.

41Challenges

42 Focus
AbstractThe article summarises the main events of the Hungarian oil market following its liberalisa-tion, activities of the newly formed Hungarian Petroleum Association to fix and develop the local market and to represent interests of its members in the following 20 years and also some tasks for the near future.
Establishment of Hungarian Petro-leum Association Prior to the change of political system in 1989, we lived in a so called planned economy. This meant, among other things, that the State de-cides who has the right to conduct certain ac-tivities. In the case of the oil industry, this led to two monopolies. The National Oil & Gas Trust (the OKGT in Hungarian) which had the exclu-sive right to almost anything from oil produc-tion through refining to the sale of products in Hungary. The latter word is very important, be-cause all OKGT activities were limited to Hun-gary. The import of crude oil from the former Soviet Union and the export of products abroad were in the hands of the Mineralimpex Foreign Trading Company. Not very business-like, but it worked. Not smoothly, but it worked.
In the early nineties, the major international petroleum companies entered Hungary and started to operate in joint ventures in which the Hungarian partner was mostly ÁFOR, the retail part of OKGT, and / or Mineralimpex.
Parliament fatally removed OKGT’s produc-tion and domestic trade monopoly and that of Mineralimpex abroad in 1991 without drawing up relevant conditions for control. The situation thus descended into chaos. For the major inter-national oil companies already present in Hun-gary it was clear something had to be done.
On 13th December, 1991, 14 companies estab-lished the Hungarian Petroleum Association, namely
• AGIP Hungaria Co. Ltd.• Allcom Trading Co. Ltd.• Aral Hungaria Ltd.• Avanti Co. Ltd.• BP Oil Hungary Ltd.• Esso Oil Filling Station Ltd.• Kuwait-ÁFOR Ltd.• Mineralimpex Foreign Trade Company• Mobil-ÁFOR Ltd.• MOL Plc.• OMV-ÁFOR Ltd.• Shell & Interag Ltd.• Tamoil Hungaria Ltd.• Total Hungaria Ltd.
Their intention was to protect and represent the general and specific interests of the oil industry and trade, to contribute to the creation of im-proved market conditions and to promote busi-ness ventures and trading on the basis of free and fair competition.
The Association was to be based on profes-sional principles and on the initiation of excel-lent and reciprocal relationships with the ap-propriate authorities. Under its statutes, the Association was open: any industrial or trading entity operating in the Hungarian oil market might become a member, provided it accepted
György Wilde, PhD (60)Secretary generalHungarian Petroleum [email protected]
Face and faith – The 20 year history of the Hungarian Petroleum Association (HPA) in a nutshell

43Focus
and abided by the Statutes of Association.
On 17th February, 1992, the Court of Budapest registered the Association as a social organisa-tion.
To start serious work, technical, economic and legal workgroups were established. Later on new ones were established but the princi-ple remained unchanged: prepare answers to specific issues at a professional level in expert workgroups. The workgroups would then make proposals to the Association’s Presidium or An-nual General Meeting, but were not entitled to express opinions representing the standpoint of the Association to any outside body.
As there was obviously no compatibility be-tween Hungarian and West European legis-lation, we entrusted Arthur Andersen & Co. to make proposals as to how to reconcile the acts, modify laws on obligatory stockpiling, set up revenue control, VAT and local taxes, as well as to examine whether they met European Economic Community practices (the precur-sor of the European Union). The study stated that a bonded warehouse system should be established, since without it, wholesale trading activity – essential even to the operation of a future energy exchange – could not take place. Thanks partly to this study and to the momen-tum provided by our member companies, it became clear that there were issues with the security of supply so we started to set up an institution to handle strategic stocks and in the following year the Association of Crude Oil & Oil Products Stockpiling was established, en-suring strategic security to the country.
Activity of HPA in the following years In 1993 we were consulted about several draft provisions of legislation and our standpoints were usually taken into consideration, with the exception, however, of an act on excise tax which was of high importance to the oil industry and trade. Our main proposals were:
a) to make all petroleum products subject to excise tax with those not using them as fuel (reclaiming the tax)b) to permit communication of any activity in-volving petroleum products only if a guarantee for a considerable sum were provided. Had that been accepted, fraud causing losses totalling USD 1,000 million could not have occurred.
Thus ‘diesel’ would not have been created by blending untaxed petroleum with spindle oil. If a company were caught out by the authorities it could plead it had no money thus paying neither taxes nor fines. It should have been realised that fuel trading required an amount of capital at the very minimum to cover tax due on the goods.
The sale of a train of rail tanker cars loaded with fuel with a taxable value of HuF 100 million to a deposit company without any capital could not have taken place either. If the deposit company had provided a guarantee to the seller, it could equally well have done so to the State.
We were then and still are of the opinion that separate laws should have been framed for each product revenue group or at least one for oil and one for the other groups. We should have been granted such consideration, since every fifth forint of State tax revenue is to do with oil.
One of the key problems then was that to get a licence to trade in petroleum products only in-volved a simple registration procedure or even less. It is hard to believe that an undertaker with a sense of humour put down the address of the President of Hungary as the registered location of his company while someone else described a third floor flat as a storage tank. Both received their licences.
Fraud involving domestic heating oil (HTO) to be used as automotive diesel started up and quickly escalated. In a statement published in the daily papers, the Association called for a so-lution so that honest market players, who met the regulation, should not be at a disadvantage to competitors disregarding the law. (Technically the uncoloured diesel and the red-coloured do-mestic heating oil were of the same quality, but a higher tax was levied on diesel, while the lat-ter had no tax imposed at all.) Later, a decree was passed which initiated the inspection of fill-ing stations, supported by the Association with financial aid. We were able to proudly boast that no tainted diesel or gasoline was to be found at the filling stations of Association member com-panies.
In 1994, to further ensure order in the market-place, official inspections were instituted, sup-ported by the Association with token funds. We contributed one million forint to support Customs & Finance Guard computer inspections and an-other million forint to support Consumer Pro-tection Agency filling station control visits. The Ministry of Finance and the Ministry of Interna-

44 Focus
tional Economic Relations issued a joint decree permitting the import of revenue products with deferred payment of duty. It was usual, in those days in the EEC, that besides providing suitable guarantees, companies with a proven ability to meet all financial obligations towards the State, might pay duty only after the sale of goods. In Hungary, however, instead of such guarantees or blemish-free trading histories, a ‘certificate of reliability from the relevant trade association’ was required. As Hungarian legislation did not recognise such certificates of reliability, we pro-tested against this even during the preparatory work of the statutory provision. Our Association did not issue certificates of reliability to anyone, not even its own members. Despite this anoma-lous situation, several companies were able to defer tax payments when importing fuel. What then happened was that many trains arrived in Hungary without State imposts being paid, after which both importer and goods ‘disappeared’.
1995 was a difficult year for the local oil indus-try. Fraudsters, by their very nature, were con-tinually cooking up new scams. Bearing in mind the complexity of the tax law, the Association requested the imposition of two types of tax on fuels (revenue tax and VAT) – similar to EU prac-tices and leaving it to the government to appor-tion levies thus collected.
Despite this, the following public imposts were imposed on the import of unleaded gasoline: - consumption tax HuF 41.6/litre - product fee HuF 2.0/litre - statistics duty 3% - customs surcharge 8% - road fund tax HuF 9.5/litre - stockpiling contribution HuF 1.144/litre - customs duty 2% - VAT 25%.
Thus tax was imposed in 8 guises and was regu-lated by several legally binding rules. Some of the taxes were determined in percentage terms while others were fixed amounts. In the latter case, the basis for tax calculation was some-times value and sometimes volume. The situa-tion was exacerbated by the fact that the differ-ent taxes were not due at the same time. So it could well happen that imported fuel arrived at a phantom company through the trading chain (while physically remaining in the same place), which sold the fuel on to an existing company since the road tax and the environmental pro-tection product fee appeared to have been paid at customs clearance (it had to be paid only lat-er) with the new buyer – referring to this – pay-
ing nothing. This situation remained until our proposal to simplify taxation was ratified – but only some years later.
The other big scam was ‘bleaching’ domes-tic heating oil (HTO). HTO was practically the same quality as automotive diesel but was dyed red. Legislation prohibited it being fed into car tanks but it was much cheaper than un-dyed diesel since excise tax was levied on diesel but not on HTO. This misuse of HTO was most probably the greatest scam in the history of Hungary and that is saying a lot! The State lost tens of billions of forint in revenues even though the misuse was not kept secret, Parlia-ment not being ready to do anything about it. In the end controls were set up and samples were taken from car diesel tanks. Unfortunately Hungarians are very ingenious people and the chemical destruction of Sudan red started up. Sudan red was the substance that made HTO red and it was destroyed by sulphuric acid. The colour disappeared but the sulphuric acid generated resin formations in the diesel which destroyed car fuel pumps. Of course innocent and not so innocent drivers went to the major oil companies for damages. Since no bleached HTO was sold at any of their stations, they paid nothing. In the end Parliament imposed an ex-cise tax on HTO equal to the excise tax on die-sel and those genuinely using HTO to heat their homes got tax refunds. It now made no sense to abuse HTO.
In 1996, the Association acquired a 10% share in the Petroleum Products Quality Inspection Company (ÁMEI) – which it still enjoys. This institution played a decisive role in the elimi-nation of the black market and was regarded as independent because the Stockpiling Asso-ciation and the Petroleum Association were its owners and behind them stood all the players in the Hungarian marketplace.
Although there was now no point in misusing HTO, somebody realised there was no excise tax on lubricants and started to import diesel fuel under the name ‘lubricant’. Hungary’s real lubricant demand was around 100,000 tons a year. In 1996, when MOL Group was produc-ing lubricants at full speed and the major com-panies were importing them, organised crime imported 500,000 tons of ‘lubricants’, a strange situation indeed. In reality, 500,000 tons of die-sel were smuggled into the country. We man-aged to reach a solution to this problem in just two years but after entry to the EU, such im-ports became pointless.

45Focus
In 1997, the failures of car fuel pumps which occurred mainly in north-eastern Hungary caused serious problems. Examinations were carried out in parallel by MOL Group labora-tories, the affiliates of the international com-panies and Budapest Technical University. By the end of the year, it was stated that this was caused by contamination produced by the sul-phur compounds in virgin naphtha, delivered by pipeline. Subsequently, MOL did not pump gasoline via this pipeline any more and Tisza Refinery’s storage facilities and loading system were cleaned. Thereafter, such gasoline prob-lems no longer occurred.
This year witnessed the high point of unleaded gasoline misuse, a fairy-tale, however, com-pared to HTO misuse, but it still had to be stopped. The ‘procedure’ was as follows. Par-liament wanted to promote the use of unleaded gasoline and the excise tax on it was much less than that on leaded grades. Tricksters started selling leaded gasoline under the name ‘un-leaded’ and made a lot of money on the tax difference. The standard only prescribed a maximum for leaded grades. The Association managed to change this situation and most probably it was one of those ‘hungaricums’ that the standard for leaded gasoline contains a minimum lead concentration, as well.
In 1998, there was a continuous decrease in world crude oil market prices. In December, a barrel of crude could be bought at below USD 10. As a consequence, domestic prices started to go down. Despite this, the Hungarian Motor Club declared several times that traders were making billions of forint in profits because do-mestic fuel prices had not reflected decreases in crude prices in the world marketplace. It took a lot of effort to make it clear to the gen-eral public that gasoline was expensive due to taxes imposed on it and that the oil companies were not manipulating the situation in order to increase profits.
An important event occurred in this year. To stop misuse of lubricants, in other words to stop the smuggling of diesel, an ‘environmental product fee’ was levied on lubricants equal to the excise tax on diesel. One could get a rebate if the used oil generated from lubricants were collected and re-utilised. There was now no point in smuggling diesel meaning that an unexpectedly large sum of money poured into the empty environmental protection budget.
In 1999, world market trends changed drastical-
ly. Crude oil prices touched bottom in February (USD 9.64/bbl), then began to increase continu-ously. By December they were over USD 26.0/bbl. This trend was observed in product prices, as well.
The range of available products turned ‘green-er’. The sale of leaded AB 98 gasoline was stopped. An advertising campaign preceded this move using print and electronic media and the distribution of almost a million leaflets at filling stations informing drivers that from 1st April there would be no leaded AB 98 gasoline on sale any longer. The lead-replacing additive would be centrally blended into Superplus 98. So drivers who were used to buying leaded grades were given a choice – either buy Superplus with the additive or Euronormal 91 or Europlus 95 gaso-lines with the additive to be sold at every filling-station shop to then be blended in by the drivers. By this measure, Hungary preceded many EU member countries in ‘greening’ its motor fuels.
In 2000, modification of the excise tax act creat-ed the possibility for genuine wholesale trading of bonded warehouse supplies, a competitively neutral situation with the definition of the liable debtor. It was also compatible with other regula-tions such as the ‘fuel decree’ and other decrees issued by the Ministry of Finance in connection with the act on excise tax. At the same time, it was still difficult to understand the fine print of the act. One statutory provision regulated all revenue products and the act was not only a tax law but also had to deal with trading issues. The Ministry of Economy and its predecessors had been framing the law on trading for 10 years.
It was debated, for example, even in the EU, as to whether petrocoke, derived from residue upgrading, was a co-product or a dangerous waste. As a result of mediation by the Associa-tion, we managed to establish that in Hungary it was considered a product. This was very impor-tant because a delayed coking plant had been started at Százhalombatta by this time.
In 2001, a long overdue event occurred. In the first year of the new millennium revenue tax was not raised. Before, the Ministry of Finance had always said that due to inflation excise tax had to be ‘re-valued’. In our opinion, inflation itself was heated up in this way. Fuel consumption increased but not to the expected extent since pump prices were over HuF 200.-/litre and many drivers could not afford it.
To increase State income, some Hungarian Cus-

46 Focus
toms & Finance Guard (VPOP) regional centres decided to levy a tax on surpluses as was still permitted by law. We managed to get the VPOP not to impose a 0.5% tax on volumes marketed during the examination period as well as a 1% tax on volumes measured in storage tanks (so called ‘measurement uncertainty’). The centres were ordered to desist and to reimburse the un-necessarily paid tax to the oil companies.
It was in this year that we celebrated our 10th birth-day and on this occasion our website (www.petro-leum.hu) first appeared in Hungarian and English.
At the beginning of 2002, filling station standards ceased and were replaced, using practically the same wording, by Ministry of Interior decree No. 2/2002. This was very necessary because the EU had earlier objected to the unnecessarily high number of compulsory standards in Hungary.
Changes were then announced in the field of standards. When Hungary became a full mem-ber of the European Standardisation Committee (CEN) at the end of 2002, each CEN standard then had to be nationalised within 6 months after the publication. Nationalisation meant that old standards would be withdrawn and new ones published in English with Hungarian prefaces, known as ‘approval publications’.
The head of the Association’s PR Workgroup and the Secretary General developed and pub-lished the ‘Oil Industry Glossary of Terms’ on our website as information for outsiders. This compi-lation, consisting of technical, financial and com-mercial terms has enjoyed high traffic.
In 2003, OMV bought Aral’s filling station net-works in Hungary and Slovakia. Shell bought Total’s filling stations in Hungary as the result of a European deal between the two companies, Shell receiving some Total stations in France.
Due to higher tax levels in Hungary than in
neighbouring countries, both for excise and value-added tax, some motorists started mak-ing their fuel purchases abroad. Whilst paying taxes in another country, they continued to use their cars in Hungary. This meant that part of the funds that would serve to improve and develop the road system and repair environmental dam-age simply did not flow into the national budget.
Because of the high tax burden imposed on Hun-garian fuel, the Association addressed a letter to the Minister of Finance on the matter. It also communicated through the media that, due to lower taxes and fees in neighbouring countries, sales at domestic filling stations were decreasing meaning lower revenues for the national budget. In the middle of the summer, the Ministry of Fi-nance promised to lower the excise tax on diesel by HuF 5/litre but leaving the excise tax on gaso-line unchanged. It also envisaged decreasing VAT from 25% to 23%. However, neither of these proposals were presented to Parliament when tax laws were amended that Fall.
Neither did we obtain an amendment to Govern-ment Decree No. 21/2001 on air protection. The decree stipulated that all filling stations had to be surrounded by protection zones of at least 50 metres. However, the point at which this 50 metre distance should be measured was not specified. Moreover, the still existing decree is unbalanced since it prohibits the construction of a filling station within 50 metres of an existing house but it does not forbid the construction of a house within 50 metres of an existing filling station.
In 2004, the European Union was enlarged by ten new countries including Hungary. In con-nection with joining the EU, many questions were raised relating to the modification of prac-tices to-date. For example, at the end of April, it was unclear who had to pay the product fee on lubricants after 1st May. It may be due to hugger-mugger lawmakers that a lot of mixed-
Gasoline Diesel Total Difference Total Difference payments vs. Hungary payments vs. Hungary Austria 144.9 -8.48 106.4 -22.86 Croatia 145.1 -8.28 104.6 -24.66 Romania 91.7 -61.68 66.8 -62.46 Serbia 111.1 -42.28 70.5 -58.76 Slovakia 130.9 -22.48 121.4 -7.86 Slovenia 122.9 -30.48 108.3 -20.96 Ukraine 26.9 -126.48 17.4 -111.86 Hungary 153.38 0 129.26 0

47Focus
up “acts” appeared covering many areas and containing some very strange things.
Thus, at the beginning of May, but dated 28th April, Act XXIX of 2004 regulating many fields was published. Section four obliged oil compa-nies to pay for the security of power stations. Section five modified the payment of product fees but, due to unfortunate wording, it was simply impossible to pay them for lubricants deriving from EU countries between 28th April and 12th June because delivery from the EU was not technically an ‘import’ any longer. After a month, the Act was modified with retroactive effect by Act XLVIII of 2004. Under it, product fees had to be paid by the first buyer of the domestic producer or by companies importing lubricants from EU countries. In the ‘transition period’, domestic producers paying fees in-stead of first buyers had to write off all invoices issued after 18th April and point out to buyers that they had to pay the fees and then had to ask the State to rebate products fees paid ‘by mistake’.
In 2005, a strange situation occurred which exists to this day. Versus the 1973 and 1979 oil crises, the price of petroleum products was high, not because of high crude oil prices but the high prices of products pulled the price of crude oil up after them, the tail wagging the dog.
EU Member States had to implement Directive 2003/30/EC on bio-fuels within national legis-lation by 31st December, 2004. After some de-lay, in March, 2005, a government decree was published which was basically a translation of the Directive with all its errors. For example, it prescribed that bio-gen content must be in-dicated if it exceeded 5% while the European standard forbade selling gasoline with over 5% bio-ethanol content and diesel with over 5% bio-diesel content. The Hungarian Parliament modified the Act on Excise Tax in such a way as to offer, from 1st July, 2007, a tax incentive on gasoline if it contained at least 4.4% by vol-ume bio-ethanol directly blended or in the form of ETBE. In the case of diesel there was a tax incentive from 1st January, 2008 if it contained at least 4.4% bio-diesel by volume.
A regrettable event happened on 22nd April when the representatives of transport interests requested their members to tank-up abroad, if possible, due to the high price of diesel in Hungary. They furthermore announced that if the government did not reduce the excise tax
of diesel by HuF 10/l by 17th May, they would boycott production and storage depots. Fortu-nately this did not happen.We succeeded in settling two affairs with the VPOP (the Hungarian Customs & Finance Guard) in connection with sulphur content, in a positive way. The sulphur content of fuels had to be less than 10 ppm but the sulphur content of the additive used in two-stroke engine ‘mix-ture’ was already about 1% (10.000 ppm), re-sulting in the mixture’s sulphur content, repre-senting 1-2% of total sales, being over 10 ppm. The other problem was that fuels were being sold through rubber tubes made by vulcanisa-tion. If gasoline stands in a tube throughout the night and the next morning a sample is taken, its sulphur content shows the maximum per-mitted value. If before sampling in line with the relevant standard, at least 4 litres of gasoline flows through a tube, no such problem occurs. Therefore we requested that the sulphur con-tent of the ‘mixture’ not be investigated and that strict standard sampling be applied. The VPOP accepted both proposals.
In 2006 a significant change happened in rela-tion to strategic stocks. Under Act XXVI of 2006 on the future strategic stockpiling of natural gas, it was to be the task of the Association of Crude Oil & Petroleum Product Stockpiling to store natural gas. In line with the Act, Associa-tion Statutes were modified and as part of that, its name was changed to the Hungarian Hydro-carbon Stockpiling Association.
In 2007 under strong pressure from some car importers, the E85 standard was defined (a gasoline-ethanol mixture containing 70-85V% ethanol). Its sale, however, was permitted with-out the condition that it could only be used in cars with engines designed for this fuel. E85 dissolves materials which are not dissolved by gasoline and in the incomplete burning of etha-nol, a well-known carcinogen material, acetal-dehyde, is produced, so E85 should only be used in cars with catalysts.
2008 was a very nervous year. It started with an historic event. On 2nd January the price of oil exceeded USD 100/bbl in New York. Brent reached USD 98/bbl in London on the same day. The price of crude oil grew continuously in the first half of the year. Brent reached a histori-cal maximum on 4thJuly hitting USD 144.2/bbl but thereafter turned into free fall and reached the minimum of USD 33.6/bbl on 24th December.
Another saga also started both in the EU and

48 Focus
in Hungary. In June, László Kovács, the EU tax commissioner, proposed to introduce a so-called ‘Robin Hood’ tax. Its essence was that from the extra profits of the ‘rich’ oil companies the ‘poor’ i.e. the lowest consumer levels, might be supported. At the end of July, Italy introduced such a Robin Hood tax. Not much later, Hungary introduced a new tax defined by an act which was not officially an act on tax but on making re-mote heating more competitive. Our Association requested the Ministry of Finance to withdraw this proposal since it distorted fair competition, penalised effectiveness and performance (mak-ing investors lose confidence) and furthermore, it was not a proper way of solving a social prob-lem. But the bill was passed by Parliament, nev-ertheless, that November.
But this was only a small problem. In Magyar Közlöny (the official government newspaper) the text of the act was published including the words ‘energy supplier’ which, in our case, meant ‘the wholesaler of petroleum products having an ex-cise licence’. The only trouble was that Hungar-ian legislation knows nothing of such a licence. Our Association immediately turned to the Minis-try of Finance asking for a ruling on who should be considered taxable in the petroleum industry and what the basis of the tax was – each ac-tivity in the area or just those activities which were connected to the oil industry? No worth-while answer had arrived by the end of the year. The Ministry merely wrote to us that ‘due to the complexity of the question emerging between the ministries concerned, patience on our part was requested until they could agree a united standpoint’.
2009 was a significant jubilee year. 150 years before, oil appeared on the stage of history at Titusville, USA and within a short while became one of the formative factors of history. Unfortu-nately, there was no reason for great celebra-tion due to the global economic crisis of 2009 from which the oil industry could not extricate itself with any ease. To meet state budget reve-nue targets excise and value-added taxes were raised considerably in Hungary.
In November, the Ministry of the Environment & Water (KöViM) invited 36 participants (local authorities, civil environmental protection or-ganisations and concerned professional asso-ciations) to a meeting on the modification of the environmental product fee. Written proposals were requested prior to the meeting. Our Asso-ciation was one of the few who responded. We repeated our objections, having asserted them
for a long time: the lubricant product fee was too high. If it was not ready to reduce it, the Ministry should be allowed to use the ‘remaining’ money only on solving environmental problems related to the oil industry. In addition, the possible ways of avoiding payment should be blocked. Since we could not achieve our goals at the Ministry for the Environment, we visited the Finance Min-ister and thereafter wrote him a letter in which the product fee issues were listed (among oth-ers, that the regulation could be avoided with the budget losing some two billion forint). The Ministry replied that it found the regulation to be perfectly in order.
As mentioned above, at the end of 2008, we asked the Minister of Finance for a ruling. After four months, in March, 2009, the answer arriv-ing stating the Robin Hood tax was imposed on any company dealing in oil wholesale and that the tax would be imposed on all that company’s activities whether in connection with oil or not. One of the Association’s member companies proposed establishing an ad hoc workgroup with the aim of getting the act modified. As a first step, the workgroup would assemble all the act’s shortcomings and then invite representatives of other concerned fields to agree joint steps for-ward. The Hungarian Union of the Gas Industry did not attend (although it had promised to do so) and the Union of Hungarian Electric Energy Traders informed us that they did not plan to be involved in independent steps even though their members were impacted by the act to the same extent but, if others were intending to be involved, then they were ready to support the withdrawal of the act. As the largest oil company concerned proposed, in the meantime, that the Association should not itself appear as an initia-tor, the activities of the workgroup became point-less.
On 1st July, after a long period of ‘peace’, tax on fuel increased sharply. The excise tax on gaso-line rose to HuF 109/l from HuF 103.5 while that on diesel went up from from HuF 85 to HuF 90.5/l. At the same time, VAT rose from 20 to 25 per cent. This meant that the increase of HuF 5.5/l in excise tax was topped up with HuF 15/l VAT (calculated on a HuF 300/l pump price) which was a retail price increase of HuF 20/l. Such a big price hike had never happened in the history of the Association. Parliament passed another act in addition which again in-creased excise taxes on 1st January, 2010.
After the Robin Hood Tax of October, 2010, Parliament then passed bill on ‘extra tax lev-
49Focus
ied on some branches of commerce’. The act affected our members as ‘energy suppliers’ in a very disadvantageous way but, knowing the desperate economic situation of the country, they accepted it. Since the wording of the act was ambiguous, our Association asked Mr. György Matolcsy, the minister responsible, for a ruling on relevant points and after discus-sion with Mr. Ádám Balog, the Deputy Secre-tary of State, we outlined in a letter to him the parts of the extra tax only hitting the oil com-panies. We asked him to take our objections into consideration and modify the act. Further-more we said that it would be reasonable to eliminate the Robin Hood Tax because energy suppliers were paying double extra tax which was at odds with the theory of ‘equal sacrifice’ through taxation.
Then the Authority for Worker Protection made some comments on filling stations. Referring to the Minister of Health decree No. 26/2000, they wanted to make compulsory the con-struction of ‘black-white’ dressing rooms. The Secretary General outlined the problem to the National Superintendence for Labour Affairs & Worker Protection (OMMF) and asked the President for a meeting with the representa-tives of the Association. No meeting was held, however, with just a letter being sent in which our attention was drawn to the estimated risk at filling stations. After studying the letter member representatives agreed with its point on health monitoring but could not accept the need to measure benzene emissions at each filling station. Since the quality of gasoline (less than 1V% benzene content) and the technology used (vapour recovery) were the same at every station, we recommended to the authority that rather expensive benzene emission measurements be limited to four throughput categories: below 1 million litres, 1-2 million litres, 2-3 million litres and 3+ mil-lion litres for stations both inside and outside inhabited areas. Such measures had been carried out by MOL Group in the recent past and they revealed that filling station personnel exposure levels were far below the permitted minimum.
In July, the Ministry of National Economy and the National Transportation Coalition Forum concluded an agreement. The latter undertook that members would tank in Hungary even if it were cheaper to do so abroad. They expected a 20 million litre growth in consumption with the resulting tax amount being given to par-ties impacted by floods. If this increase were
achieved, the Government was ready to in-troduce so-called ‘commercial’ diesel with an excise tax HuF 8/l less than that imposed on ‘normal’ diesel, from 1st January, 2011. In the end the tax actually imposed was HuF 6.5/l less but many questions remained open. The Association proposed the authority rebate the tax difference only if the fuel buyer could pro-vide verification of bank payments for fuels. Its aim was to avoid tax difference rebates for people who had not actually paid pay for fuel.
From oil industry’s point of view, the nation-alisation of directives 2009/28/EC concern-ing enhanced use of renewable energies and 2009/30/EC about fuel quality were of great significance. Thus the Hungarian ‘bio act’ (act CXVI, 2010) was developed but related regu-lation at lower levels was not ready by the end of the year. Earlier publication of the direc-tives would have been of great help because if the Hungarian producer could not verify that production occurred in a sustainable way, the product could be sold in the marketplace in an unfair way and not in harmony with the direc-tives.
Year 2011 saw huge increases in retail fuel prices. At the very beginning of the year diesel cost was HuF 351/l and gasoline HuF 361/l. By end of the year these figures had increased to HuF 417/l and HuF 395/l, respectively. Such increases had never been seen before. Behind all this was the continuously weakening forint versus the US dollar and, in the case of diesel, an increase in excise tax. Fuel sales reacted: the volume of diesel sold at stations slightly increased whilst that of gasoline decreased. In the case of gasoline, one can simply state that the higher price reduced demand and that E85 was much cheaper. The different be-haviour for diesel can be understood. Firstly, due to the introduction of ‘commercial’ diesel, secondly, whether diesel is expensive or not, the transport of people and goods cannot be stopped.
In 2011, there were two important anniversa-ries: on 1st October MOL Group and on 13th December the Hungarian Petroleum Associa-tion both became twenty years old.
This has been the 20 year history of the Hun-garian Petroleum Association in a nutshell. There were, are and always will be issues to resolve. Of course, we cannot see what the future brings but, in short term, there are three key problems to be solved.

50 Focus
Problems to be solved in short runThe first one is really only an interpretation of the law. The authorities consider technological errors at filling stations as cheating. This means if a tanker lorry is not fully discharged prior to reloading at a depot and 1% of gasoline remains in it and if it is then filled with diesel of perfect quality, the flash point of the resulting mixture will reduce by 20-25oC. If some diesel remains in the tanker lorry and then gasoline is loaded there will be trouble with the end boiling point. The tanker lorry driver made the mistake in both cases. The resulting ‘mixture’ then arrives at the filling station where it is discharged. The fill-ing station personnel cannot control the quality. They only have the accompanying documents to go on. Taxation authority control officials then arrive, take a sample and state that it is not of standard quality and fine the filling station for the mistake. What is more, they state the qual-ity established cannot be traced back from the documentation, so the volume of fuel in the un-derground tank had evaded taxation, in other words, was smuggled. They again impose a fine and close the station for 30 days even though the personnel is innocent. Whereas we do not want to protect people who deliberately cheat, we cannot accept that an innocent individual or legal entity is fined.
The second issue is an old, old story, too. For the time being, some people as well as oil com-pany employees do not smuggle lubricating oils and do not want to. However, they are at a price disadvantage of more than one hundred forint per kilogramme, making it impossible to sell cheaper category lubes. After six years of effort, the regulation was finally changed on 1st Janu-ary, 2012. Its effect on the marketplace is, as yet, unknown. We can just hope that smuggling will be stamped out. If not, we will have to look for another solution.
The third issue is air quality at filling stations.
About ten years ago, we demonstrated to the authorities through tests that the concentration of benzene in the air at the average filling sta-tion was less than the limit dictated by Hungar-ian legislation. The authorities accepted this but then, one or two years ago, they had a new idea. They said that, under so called EU REACH regulation, which forbids materials having a car-cinogen concentration of more than 0.1%, the concentration of benzene in gasoline is higher so the minimum must be applied to black-white personnel changing rooms and special wash-ing for work overalls. If we did not believe it, we were invited to consult with the petroleum asso-ciations of other countries. The authorities were simply unable to understand that the concen-tration of benzene in the air of filling stations is much less than 0.1%. We of course asked the petroleum associations of a few other countries more developed than us, and all of them an-swered that the introduction of REACH did not call for any change whatsoever in the operation of filling stations. We now have to find a solu-tion for this ‘hungaricum’ issue because, in other countries, benzene that is not emitted into the ambient air is not carcinogenic. In any case, we have to find a solution that is acceptable both to the authorities and the oil companies.
Keywords: petroleum association, tax, oil product
Reviewed by László Rácz, Dr.
György Wilde, PhD has been working for Hungar-ian Petroleum Association since 1992. He started to work in an ammonia plant, later on he was a scientific research worker in Hungar-ian Academy of Sciences,
an expert in Ministry of Industry and Trade, furthermore head of department in Mineralim-pex Trading Co. He graduated in University of Veszprém in 1976.

51Focus

52 Development
Abstract In the oil industry clay minerals play a fun-damental role due to their swelling, poros-ity reducing and cation exchange properties which are all crucial factors in reservoir han-dling. The different Fourier Transform Infra-red methods (‘classic’ FTIR spectrometry with KBr-pellets and ATR-FTIR − Attenuated Total Reflectance) with non-polarised source
may provide cost-efficient and rapid, valu-able information not only on the identifica-tion of clay minerals, but also on the vary-ing adsorbed and interlayer water content of clay minerals with changing environmental conditions. Our summary gives an overview about developing a new infrared analytical routine for clay minerals in addition or, as an alternative to traditional analytical tech-niques (such as XRD − X-ray powder diffrac-tion, SEM – scanning electron microscopy, etc.). The combination of these techniques, as we shall demonstrate, may suite better the need of the oil industry. In the oil industry the ATR-FTIR spectra of minerals could serve as an important supplement to the data provid-ed by XRD, SEM and other methods.
IntroductionThe characterisation of clay minerals is nor-mally carried out by using precise instrumental techniques for qualitative and quantitative anal-ysis such as X-ray diffraction (XRD), X-ray fluo-rescence (XRF), transmission and scanning electron microscopy (TEM & SEM) just to men-tion the most common ones. However, these techniques require complex sample prepara-tion with dissolution or disaggregation of the sample, which may have an influence on the original properties of clay minerals. We utilise parallel investigations by the cited ‘traditional’ techniques to provide adequate characterisa-tion of the samples and to provide a sound basis for comparison with ATR-FTIR. XRD and XRF analyses are made in MOL Explora-tion Laboratories, IR methodical developments have been undertaken by ELGI (Eötvös Loránd Geophysical Institute), whereas SEM investi-gations are executed in the laboratories of INA.
FTIR spectrometry is a useful tool in the clay
Judit Tóth, PhD (31)Reservoir modelling expertMOL Group, MOL, Exploration & Production, Integrated Field Ap-plication, Engineering and Technology [email protected]
Beatrix Udvardi (24)PhD studentLithosphere Fluid Research Lab, Department of Petrology and Geochemistry, Eötvös Loránd UniversityEötvös Loránd Geophysical Institute of [email protected]
István Kovács, PhD (32)Research fellowEötvös Loránd Geophysical Institute of [email protected]
György Falus, PhD (35)Senior research fellowEötvös Loránd Geophysical Institute of [email protected]
Csaba Szabó, PhD (59)Associate professorLithosphere Fluid Research Lab, Department of Petrology and Geochemistry, Eötvös [email protected]
Tamara Troskot-Čorbić, PhD (49)Manager of the G&G BUMOL Group, INA, Exploration & Production BD, Field Engineering & Operations Sector, E & P Research Laboratory Department, Ge-ology & Geochemistry [email protected]
Renata Slavković, MSc geol. (56)Petrology and sedimentology specialistMOL Group, INA, Exploration & Production BD, Field Engineering & Operations Sector, E & P Research Laboratory Department, Ge-ology & Geochemistry [email protected]
Analytical development in FTIR analysis of clay minerals

53Development
sciences because as opposed to the other techniques it requires generally smaller sample quantity (<10 mg), the sample preparation is relatively easy and does not affect the sample considerably and the duration of analysis and evaluation is only a few minutes. The Attenu-ated Total Reflectance (ATR) does not require any sample preparation and it is suitable for the relative quantitative determination of differ-ent water species (adsorbed and interlayer wa-ter) as opposed to the classic KBr-pellet FTIR method. This may enable us to identify different clay minerals, including mixed clay structures and other species (i.e. quartz, calcite), in core samples. In addition, the developed sample preparation protocol involving heating and a new ATR-FTIR evaluation method for analys-ing the different water species in clays enables the objective analysis of clay minerals coming from different environments.
We provide details about our concept and a brief summary of the first results. Here we sum-marise results of ATR-FTIR measurements. Results of XRD measurements will not be pre-sented in the present discussion; those will be summarised in a separate paper.
Preliminaries Clay minerals are very important in oil industry and provide useful information on nearly any type of geologic problem within the reservoir. They can be used in interpreting and under-standing such problems as tectonics, source, age, boundaries, facies, environments, zona-tion, correlation and metamorphism ([1]: Weav-er, 1959). Clay minerals are of great impor-tance for reservoir geology due to their specific properties (cation exchange capacity, swelling, sorption, etc.). They play a key role mainly in the formation of oil and gas reservoirs, in ac-cumulation and migration of hydrocarbons, and recently in subsurface CO2 storage, as well as in controlling the permeability during hydrocar-bon production.
The new method based on the absorption of infrared radiation by minerals was developed from the middle of the last century for clay minerals (e.g. [2-6]: Keller and Picket, 1949, 1950; Hunt, 1950; Nahin et al., 1951; Nahin, 1952). However quantitative infrared spectrom-etry has not been widely applied in geology for many decades, as quantitatively accurate anal-ysis of minerals routinely become possible only in the last decades ([7-9]: Libowitzky and Ross-man, 1996; Kovács et al., 2008; Sambridge et
al., 2008). Analytical accuracy now reached a certain level, where very fine changes in the clay’s structure could be detected.
The employment of FTIR spectroscopy to the study of clay minerals has been historically un-dertaken to supplement mineral identification by XRD ([10]: Anderson et al., 2010). However, the OH stretching vibrations, v (OH) of layer silicates have been shown to be sensitive to changes in the cations in the tetrahedral and especially, octahedral sites, and also the inter-layer ([11]: Petit, 2006). Other useful applica-tions of FTIR spectroscopy include the interca-lation of these minerals with organic molecules ([10]: Anderson et al., 2010).
Brief summary of the applied clays In 2011 we have carried out detailed investiga-tion of international clay-bearing mineral stand-ards which are similar to those generally found in nature. All together 13 international standards were ordered from the American Clay Mineral Repository. We chose these standards because the Clay Minerals Society Source Clays project proposed to prove investigators with gently ho-mogenised clay materials, carefully collected and processed under the supervision of clay specialists ([12]: Moll, 2001). In 2001 in a spe-cial issue of the Clays and Clay Minerals scien-tific journal baseline studies of the Clay Miner-als Society Source Clays have been published. Geological origin ([12]: Moll, 2001), results of chemical analyses of major elements ([13]: Mermut and Cano, 2001), chemical analysis by inductively coupled plasma-mass spectroscopy ([14]: Kogel and Lewis, 2001), layer-charge de-termination and characteristics of those miner-als containing 2:1 layers ([15]: Mermut and La-galy, 2001), powder X-ray diffraction analyses ([16]: Chipera and Bish, 2001), infrared methods ([17]: Madejová and Komadel, 2001), thermal analysis ([18]: Guggenheim and Groos, 2001), cation exchange capacity measurements by the ammonia-electrode method ([19]: Borden and Giese, 2001), colloid and surface phenomena ([20]: Wu, 2001) have been reported.
The following international standards have been available (Table 1).
Three samples (RAr-1 rectorite, NAu-2 non-tronite, and SCa-3 Ca-montmorillonite) were excluded from the detailed IR investigations, because these are from hard rocks, which have

54 Development
relatively low clay mineral content. Previous analytical reports on these clays are relatively scarce.
In the next step we analysed 30 natural sam-ples, which were selected from Hungarian and Croatian core samples. Where chemical, XRD and geophysical well-logging data were avail-able the infrared results were correlated against these independently obtained data.
Hydrocarbon contaminated soil samples were also investigated. Ten of them were derived from a South-Hungarian gasoline polluted site and other 10 were treated with volatilised com-ponents of light hydrocarbon in laboratory (these latter were outcrop samples from a pit where Kiscell Clay Formation occurs). The ‘Kiscell
Clay’ samples were treated with hydrocarbons in a previous special column experiment, details of the laboratory model used have been described elsewhere ([21-22]: Tóth and Török, 2006; Tóth and Knapp, 2007).
Correlation with quantitative and qualitative in-formation on hydrocarbons was undertaken where this information was available.
Protocol for the advanced clay mineral analysis For the precise identification of different clay minerals a heating protocol is needed to sepa-
Number Code Long name Location 1 KGa-1b Kaolinite (low defect) Washington County Georgia USA 2 KGa-2 Kaolinite (high defect) Warren County Georgia USA 3 SHCa-1 Hectorite (contains calcite) San Bernardino County California USA 4 STx-1b Ca-montmorillonite (white) Gonzales County Texas USA 5 SWy-2 Na-montmorillonite Crook County Wyoming USA 6 CCa-2 Ripidolite (chlorite) Flagstaff Hill El Dorado County California USA) 7 RAr-1 Rectorite Garland County Arkansas USA (regular-mixed layer) 8 SCa-3 Montmorillonite (Otay) Otay San Diego County California USA 9 IMt-1 Illite (Cambrian Shale) Silver Hill Montana USA 10 IMt-2 Illite (Cambrian Shale) Silver Hill Montana USA 11 ISCz-1 Illite-smectite (I/S) Slovakia mixed layer (70/30 ordered) 12 NAu-2 Nontronite (brown colour South Australia Al-poor contains tetrahedral Fe from Uley Mine 13 SBId-1 Beidellite Idaho USA
Table 1. International clay standards which were investigated
Fig. 1. The figures show the change in the SWy-2 montmorillonite standard with the different heating temperatures applied in the Si-O (a) and O-H (b) stretching region

55Development
rate the interlayer from the adsorbed water as these two distinct water species have differ-ent bond strength, thus, leave the clay mineral structure at different temperatures.
The experiments have shown that most of the adsorbed water leaves the clay structure at ~70 °C after 30 minutes and the signal seen in in-frared spectra is attributed to the remaining in-terlayer water. The continuous loss of adsorbed water with temperature is obvious in ATR-FTIR infrared spectra during the heating experiments at 50, 70, 90, 110 °C (see Figures 1, 2). The clay samples were kept in standard glass weighing bottles covered by parafilm to prevent readsorption of water be-tween the experiments and the ATR-FTIR measurements.
This method can be applied for the identification of clay minerals in natural mixtures and it helps to evaluate the water content, not only the adsorbed, but also the interlayer water without the need for applying rather ‘artificial’ spectral deconvolution methods in the 3,000-3,500 cm-1 range, where the signal of molecular water generally occurs.
Identification of the different types of clay minerals Different absorption bands in clay minerals are related to the tetrahedral, octahedral layer and the constituents of the interlayer space in mid-dle infrared spectra (400-4,000 cm-1). These
bands can occur at either lower (‘Si-overtones’) or higher (‘water region’) wavenumbers de-pending on whether the bands are associated with vibrations related to the tetrahedral and octahedral layers of the clay structure and the way of their connections, namely number of the tetrahedral and octahedral layers or sheets, type of the interlayer cation and its hydration potential, hydroxyl ordering among the layers (see Figure 3).
Illite-smectite interstratified clay minerals are ubiquitous in sedimentary basins and they have been linked to the maturation, migration and trapping of hydrocarbons, rock cementa-tion, evolution of pore water chemistry during diagenesis and the development of pore pres-sure ([23]: Stixrude and Peacor, 2002). Due to the importance of these interstratified clay minerals, we pay particular attention to the I/S mixed structure. Study of the transformation of smectite to illite, chlorite or vermiculite via in-terstratified clay minerals needs precise quali-tative and quantitative determinations of the different layers in the mixed-layer clays and is generally based on XRD patterns after specific treatments of the clay samples ([24]: Mosser-Ruck et al., 2005).
The new results give a positive indication that with the investigation of a large number of sam-ple series there is a good possibility to be able to put better quantitative constraints on the
Fig. 2. Integrated area of O-H stretching of moisturized (1), original (2) and heated at 50 (3), 70 (4), 90 (5), 110 °C (6) for 30 minutes SWy-2 samples. Average spectra were represented by five infrared spectra
Fig. 3. The main characteristic absorption bands are shown in the infrared spectra of different types of observed clay minerals (kaolinite, illite, smectite, an illite / smectite (I/S), chlorite) after heating treatment

56 Development
proportion of the different illite and smectite do-mains ([25]: Kovács et al., 2011a).
Results and inter-pretation of data from natural drillings The comparison of ground and unground sam-ples revealed that there is only a slight differ-ence in the intensity of absorption bands, how-ever, their band positions remain unchanged. This implies that if the sample preparation pro-tocol is uniform then at least relative quantita-tive analysis is possible. In the samples from drillings, quartz, carbonates (dolomite and cal-cite in various proportions), kaolinite, chlorite and mica could be relatively easily identified by ATR-FTIR, in contrast, the proper identification of I/S and feldspar cannot be achieved under all circumstances. Although, the rate of I/S can be related to the size of O-H stretching band area which seems to be connected to the shift in the position of the main Si-O stretching.
Detailed comparison with the chemical data in-dicates that parameters obtained from the infra-red spectra could be correlated very well against LOI (loss on ignition) and CEC (cation exchange capacity). The LOI correlates reasonably well with the integrated area under the major ‘organ-ic’ bands at 2,800-3,000 cm-1. The CEC displays significant correlation with the area under the major silica overtone band at ~1,000 cm-1 and the position of the broad absorption band of wa-ter at 3,400 cm-1 (see Figure 4). This latter is a secondary effect because the CEC is correlated with the amount of clay minerals which contain the most exchangeable cations among all the minerals from drilling cores.
The infrared spectrometry with the significant extension of the present dataset and its inte-gration into a coherent database has the poten-tial to quantitatively identify minerals akin to the XRD technique.
Results and inter-pretation of hydro-carbon contami-nated soil sample analyses Although XRD method is a valuable technique for characterising interlamellar sorption, we have done further investigations by IR methods. The investigation of hydrocarbon contaminated sam-ples indicates if considerable time elapsed since the contamination (as for the ’Kiscell Clay’ sam-ples), then the concentration of hydrocarbons decreases close to the limit of detection. If the contamination is much closer in time to the anal-ysis the organic pollutants give a signal way ex-ceeding the background. Where the hydrocarbon pollution is relatively new and the samples con-tain relatively high amount of hydrocarbon com-pounds a clear infrared signal for organic com-ponents can be recognised in the 2,800-3,000 cm-1 range. The results can imply either that the different hydrocarbons selectively sorbed on clay minerals or the contaminated samples have dif-ferent clay mineral content, consequently vari-able sorption capacity.
Hydrocarbons are very complex mixtures of organic compounds; their composition can be altered by numerous chemical or physical proc-esses. Chemical alteration would be microbial degradation or abiotic chemical reactions (e.g. oxidation / reduction, hydrolysis), etc., while an example of physical alteration would be the pref-erential loss of light hydrocarbons by diffusion. In case of the ‘Kiscell Clay’ samples altering of the fluid phase hydrocarbon was not influenced by any natural attenuation processes apart from volatilisation. The volatilised compounds should have been sorbed on clays, and no other altera-tion process (e.g. biodegradation) was indicat-ed by the organic geochemical analyses.
XRD investigations of the contaminated ’Kiscell Clay’ samples presented that basal spacings (d001-values) for the clay minerals of the un-
Fig. 4. Projection of CEC and integrated area of the major silica band with depth

57Development
treated and polluted clays are nearly identical, indicating that adsorption on the external min-eral surfaces was the main sorption process. No insertion into the swelling clay minerals can be observed ([26]: Tóth, 2009). The infrared characteristics of hydrocarbon contaminated ‘Kiscell Clay’ samples also implies that hydro-carbons are not incorporated in the interlayer space of clay minerals, but in fact, only weakly adsorbed on their mineral surfaces. This is manifested in the fact that earlier contaminated samples containing only a negligible amount of hydrocarbons and that the newer one with con-siderable hydrocarbon content does not show any difference neither in the silica overtone nor in the ‘water’ region in their infrared spectra ([27]: Kovács et al., 2011b).
ConclusionsThe sample preparation protocol makes the objective comparison of different clay miner-als possible based on their ATR-FTIR spectra which eliminates the effect of adsorbed water. The position of band maxima can shift upon heating reflecting fine-scale changes in the mineral structure. The extents of band areas of O-H and Si-O stretching in spectra of different clay minerals are also characteristic.
During the qualitative identification of clay minerals and their components the position of the charac-teristic absorption bands is used, which could help fingerprinting clay minerals in natural mixtures.
Based on these developments, it seems rea-sonable to enhance the application of infrared spectrometry in the analysis of clays in the oil industry and also to revisit samples that have been already analysed by other traditional ana-lytical techniques. The methodology could po-tentially be rather beneficial for the analysis of core samples and could make it more cost and time effective.
AcknowledgmentAuthors express their thanks to Izabella Far-kas, Imre Drávucz and Mariann Gulyás (MOL IFA Exploration Laboratories) for analytical measurements and significant consultations. The support provided by András Németh, Viktor Sőreg (MOL Eurasian Exploration Projects), Zsolt Molnár (MOL Engineering and Technol-ogy Development) and Mária Törő (MOL New Technologies and R&D) is also highly appreci-ated. The paper has been greatly improved by the critical comments and constructive sugges-
tions of our reviewer, Mária Hámor-Vidó, Dr. We also would like to thank MOL Integrated Field Application for supporting the idea and financing this project.
References[1] Weaver, C.H., 1959: Possible uses of clay
minerals in the search for oil. Clays and Clay Minerals, 8, pp. 214-227. (1959)
[2] Keller, W.D. – Picket, E.E., 1949: Absorp-tion of infrared radiation by powdered silicate minerals. Am. Mineralogist, 34, pp. 855-864. (1949)
[3] Keller, W.D. – Picket, E.E., 1950: The absorp-tion of infrared radiation in clay minerals. Am. Jour. Sci, 248, pp. 264-273. (1950)
[4] Hunt, J.M., 1950: Infrared spectra of clay min-erals. Am. Petroleum Inst. Proj. 49 Prelim. Rep. 8, pp. 105-121, New York, Columbia University (1950)
[5] Nahin, P.G. – Merill, W.C. – Grenall, A. – Crog, R.S., 1951: Mineralogic studies of Cali-fornia oil-bearing formations. I. Identification of clays. Jour. Petroleum Technology (Am. Inst. Min. Met. Eng. Petroleum Trans.), 192, pp. 151-158. (1951)
[6] Nahin, P.G., 1952: Infrared analysis of clays and related minerals. Clays and Clay Miner-als, 1, pp. 112-118. (1952)
[7] Libowitzky, E. – Rossman, G.R., 1996: Prin-ciples of quantitative absorbance measure-ments in anisotropic crystals. Physics and Chemistry of Minerals, 23, pp. 319–327. (1996)
[8] Kovács, I. - Hermann, J. - O’Neill, H. St. C. - FitzGerald, J. - Sambridge, M. - Horváth, G., 2008: Quantitative IR spectroscopy with un-polarized light Part II: Empirical evidence and practical application. American Mineralogist, 93, pp. 765-778. (2008)
[9] Sambridge, M. – FitzGerald, J. – Kovács, I. – O’Neill, H. St. C. – Hermann, J., 2008: Quantitative IR spectroscopy with unpolar-ized light Part I: Physical and matemathical development . American Mineralogist, 93, pp. 751-764. (2008)
[10] Anderson, R.L. – Ratsliffe, I. – Greenwell, H.C. – Williams, P.A. – Cliffe, S. – Coveney, P.V., 2010: Clay swelling – A challenge in the oil field. Earth-Science Reviews, 98, pp. 201-216. (2010)
[11] Petit, S., 2006: Fourier Infrared Spectros-copy. In: Lagaly G. (Ed.): Handbook of Clay Science: Developments in Clay Science, 1, Elsevier, pp. 909-918. (2006)
[12] Moll, Jr.W.F., 2001: Baseline Studies of the Clay Minerals Society Source Clays: Geolog-

58 Development
ical Origin. Clays and Clay Minerals, 49/5, pp. 374-380. (2001)
[13] Mermut, A.R. - Cano, A.F., 2001: Baseline Studies of the Clay Minerals Society Source Clays: Chemical Analyses of Major Elements. Clays and Clay Minerals, 49/5, pp. 381-386. (2001)
[14] Kogel, J.E. – Lewis, S.A., 2001: Baseline Studies of the Clay Minerals Society Source Clays: Chemical Analysis by Inductively Cou-pled Plasma-Mass Spectroscopy (ICP-MS). Clays and Clay Minerals, 49/5, pp. 387-392. (2001)
[15] Mermut, A.R. – Lagaly, G., 2001: Baseline Studies of the Clay Minerals Society Source Clays: Layer-charge determination and char-acteristics of those minerals containing 2:1 layers. Clays and Clay Minerals, 49/5, pp. 393-397. (2001)
[16] Chipera, S.J. – Bish, D.L., 2001: Baseline Studies of the Clay Minerals Society Source Clays: Powder X-ray Diffraction Analyses. Clays and Clay Minerals, 49/5, pp. 398-409. (2001)
[17] Madejová, J. – Komadel, P., 2001: Baseline Studies of the Clay Minerals Society Source Clays: Infrared Methods. Clays and Clay Min-erals, 49/5, pp. 410-432. (2001)
[18] Guggenheim, S. – van Groos, K., 2001: Baseline Studies of the Clay Minerals Society Source Clays: Thermal Analysis. Clays and Clay Minerals, 49/5, pp. 433-443. (2001)
[19] Borden, D. – Giese, R.F., 2001: Baseline Studies of the Clay Minerals Society Source Clays: Cation Exchange Capacity Measure-ments by the Ammonia-Electrode Method. Clays and Clay Minerals, 49/5, pp. 444-445. (2001)
[20] Wu, W., 2001: Baseline Studies of the Clay Minerals Society Source Clays: Colloid and Surface Phenomena. Clays and Clay Miner-als, 49/5, pp. 446-452. (2001)
[21] Tóth, J. - Török, E., 2006: Geochemistry-based modelling of hydrocarbon contamina-tion in laboratory. European Geologist, 22, pp. 32-35 (2006)
[22] Tóth, J. - Knapp, E., 2007: Sorption proper-ties of light hydrocarbon contaminated clay under defined conditions. Central European Geology, 50/1, pp. 79-94 (2007)
[23] Stixrude, L. – Peacor, D.R., 2002: First-prin-ciples study of illite-smectite and implications for clay mineral systems. Nature, 420, pp. 165-168. (2002)
[24] Mosser-Ruck, R. – Devineau, K. – Charpen-tier, D. – Cathelineau, M., 2005: Effects of ethylene glycol saturation protocols on XRD patterns: a critical review and discussion.
Clays and Clay Minerals, 53/6, pp. 631-638. (2005)
[25] Kovács, I. – Udvardi, B. – Falus, Gy., 2011a: Project report: Making the complex analyti-cal investigation (with special respect to the use of infrared spectroscopy) of clay minerals more cost-effective I, ELGI, Budapest, p. 80. (2011)
[26] Tóth, J. 2009: Sorption of light hydrocarbons on clays from the Oligocene Kiscell Clay For-mation, Hungary. Mineralogia, 40/1-4, pp. 43-51. (2009)
[27] Kovács, I. – Udvardi, B. – Falus, Gy., 2011b: Project report: Making the complex analyti-cal investigation (with special respect to the use of infrared spectroscopy) of clay minerals more cost-effective II, ELGI, Budapest, p. 79. (2011)
Keywords: clays, clay minerals, FTIR spec-trometry, infrared spectra, heating protocol
Reviewed by Mária Hámor-Vidó, Dr.
Judit Tóth, PhD first involved with MOL in 2002 during her studies and joined MOL in 2007. She gained experience in the Integrated Field Appli-cations organisation, where she is employed in various positions. At present she is
a reservoir modelling expert at the Engineering and Technology Development unit of MOL EPD IFA. She worked as a R & D expert focusing on project management and earlier had employed as HC-exploration expert dealing with laboratory geological investigations. She is author or co-au-thor of several scientific publications. She gradu-ated at University of Szeged in 2003 as geology specialised geographer and obtained her PhD in 2009 at University of Pécs in earth sciences. She postgraduated at Budapest Business School in 2008 as an economist in economic diplomacy and international management.
Beatrix Udvardi is a PhD student in the frame of co-op-eration between Eötvös Uni-versity, Budapest and Eötvös Lorand Geophysical Institute of Hungary (ELGI). She is sup-ported as an excellent student by an innovative program of National Development Agency
(TAMOP) at Eötvös University. Her research ac-tivities concentrate on identification and quantita-

59Development
tive determination of swelling and non-swelling clay minerals in environmental problems. She was graduated at Eötvös University of Budapest as geologist in 2011.
István Kovács, PhD is a research fellow at Eötvös Loránd Geophysical Institute of Hungary since 2008. His research interests include water in nominally anhydrous minerals (NAMs), infrared spectroscopy, water and mantle metasomatism, evo-
lution of the subcontinental lithosphere, geo-dynamics of the Carpathian-Pannonian region. He took part in the development of a novel quantitative infrared methodology for minerals, which, under a wide range of absorption prop-erties, enables us to achieve geochemically meaningful accuracy when analysing different absorbing species in mineral structures. In the recent years his focus turned more towards the environmental application of quantitative infra-red spectroscopy with special respect to clay minerals. His scientific achievements were rec-ognised by the prestigious ’Junior Prima Award’ in 2011. He graduated in 2003 at Eötvös Uni-versity in geology and obtained his PhD in 2008 at the Australian National University (Canberra, Australia) in earth sciences.
György Falus, PhD is a senior researcher at Eötvös Loránd Geophysical Institute of Hungary since 2005. His research interests include upper mantle deformation, and carbon dioxide geologi-cal storage. He has been the national representative in sev-
eral CO2 storage related EU projects and has been involved in earlier R & D projects together with MOL. His scientific achievements were rec-ognised by Bolyai János Research Grant be-tween 2007 and 2010, and ’Bolyai Plaquette’ in 2011. He graduated in 2000 at Eötvös University in geology and obtained his PhD at University of Szeged in earth sciences in 2004.
Csaba Szabó, PhD is an associate professor at De-partment of Petrology and Geochemistry of Eötvös Uni-versity, Budapest. His main research activities concen-trate on geochemical proc-esses and physical state of
the lithosphere, lower crustal and upper mantle xenoliths, melt inclusions, geodynamics of the Carpathian-Pannonian region and also environ-mental geochemistry including radon potential mapping and carbon capture and storage. He is the author and co-author of several internation-al scientific publications and fills a wide variety of professional and academic positions. He is board member of the Geochemistry, Mineralogy and Petrology Committee of the Hungarian Acad-emy of Science. At present, he coordinates the Cooperative Research Centre for Environmen-tal Sciences (CRCES) project and the geologi-cal researches of submicroscopic material sci-ences at Eötvös University. Under his supervisor activity graduated near 100 BSc, MSc and PhD students. He graduated at Eötvös University in 1979 as a geologist and received his PhD at Vir-ginia Polytechnic Institute and State University of Blacksburg (USA) in geology.
Tamara Troskot-Čorbić, PhD is the manager of the Geology and Geochemistry Business Unit of INA’s E & P Research Laboratory Department. Her research activities concentrate on or-ganic petrology and organic geochemistry, scientific dis-
ciplines that are studying the organic matter in the sense of source rocks evaluation and source rocks-hydrocarbon correlation. She is the author and co-author of several scientific publications. She graduated from Faculty of Mining, Geology and Petroleum Engineering, University of Zagreb in 1987 as geologist and received her PhD at Faculty of Mining, Geol-ogy and Petroleum Engineering (University of Zagreb) in geology.
Renata Slavković, has been working at INA since 1985 at E & P Research Laboratory Department as a petrology specialist, of which the last 22 years on the SEM. Her research ac-tivities concentrate on iden-tification and determination
of all minerals that built the rocks, with special respect to clay minerals and pore space. She is the author and co-author of several scien-tific publications. She graduated at the Faculty of Science, University of Zagreb, Croatia as geologist – petrologist.

60 Development
AbstractThe electronic shift logbook software was ini-tiated during the realisation of MOL Refining Vision Programme. Opralog system selected for initiation is in use worldwide, in different industrial fields [1]. Its introduction can im-prove the process of shift handover, informa-tion flow, efficiency and process safety. This electronic logging system offers a possibility to build an up-to-date operational database for supporting the Refining operation. The software prepares reports with automatic sharing for functional organisations from shift logs made by the unit staff. Easy access to the archived contents of logbooks is useful for many organisations in daily routine. Using Opralog, their work becomes more integrated, they gain more insight into the activity of the related organisations or units and all these can improve the efficiency of co-operation. Opralog electronic shift logbook system is already in use in all units and dispatcher serv-ices of the Hungarian refineries, furthermore its initiation in Slovnaft Refinery is preceded.
IntroductionIn point of perspicuity, in a complex organisa-tion with several processes it is important to record the steps of the performed work. It is es-sential not to recognise logging as a necessary evil which requires continuous attendance. Logging can contribute to the improvement of operation and decision making efficiency and in
the meantime of return on investment.
An efficient logging system must provide the following functions:
• Collection of data / data storage• Logging• Reporting• Assistance for analysis• Sending warnings and notifications, preparing reports• Integration possibility with other systems.
Paper based logbook In the past MOL Group refineries used mainly a paper form shift logbook system for the com-munication among different shifts such as shift handover and events recording. Most of the shift logbooks were in paper format, but there were few exceptions (offline used templates prepared by MS Office programmes). Paper form logbooks’ construction is different, but their information content was structured in the same way. In practice, the entries of the shift logbooks were recorded not at occurrence of the events but before the end of the shift.
Besides the shift logbook there were numerous other – paper based or electronic – documenta-tions in use. These were for example the plant manager’s logbook, seal register, safety inter-lock logbook, blind register, rapport logbook and information systems used for data entry. All this very frequently led to parallel data entry.
As the first step of the project the so called elec-tronic dispatcher logbook was introduced, used for tracking the events in the refineries and handled exclusively by the Dispatcher Service.
Zsolt Nagy (32)Senior system engineerMOL Group, MOL, Process [email protected]
Amália Boros (31)Senior system engineerMOL Group, MOL, Process [email protected]
Initiation of an electronic logging system in MOL refinery operation

61Development
Based on experience the paper formed logging has the following attributes:
• Simple, offline system• No demand on maintenance, but difficult to improve• Manual retrievability• No reporting possibility• Slow and complicated communication with other units and organisations• Similar logbook structure• Parallel information recording in the used documentations• Difficult to monitor processes of the work.
Conception of the electronic logbook The main goal of MOL Group Vision Pro-gramme was to renew the refineries’ processes and optimise the operation of the company.
The introduction of the electronic shift log-book system was motivated by the Vision Pro-gramme’s following points:
• Refining is an organisation which learns on a continuous basis and is characterised by knowledge sharing and rotation within and amongst the refineries to support it
• Our operational procedures are simple which are supported by clear user-friend-ly informatics systems
• The high level knowledge and initiative of our staff is coupled with the approach of proprietary solicitude, every employee as-sumes responsibility for his / her activities.
Necessity of an electronic logbook system im-plementation was precomposed in the auto-mation strategy in 2008. Safety of the refinery processes is of emphasised importance, and it can be supported by the information sharing among the shifts. Several accidents in the in-ternational oil industry history can confirm that the incomplete information sharing about a critical activity – during interchange – can lead to breakdown or can cause serious accident. Nowadays the development of this area has become inevitable. ELEMENTARY FUNCTIONS The general requirements which have to be re-alised as the minimal solutions:
• Extendable multilingual environment• Customisation option (configurability) on
the business side• Simple handling on the input side• Reviewable contents
• Automatic or manual information sharing possibility among other units or organisa-tions
• Robust operation, low maintenance de-mand
• Support to a hierarchical role dependent authorisation system
• Uniform database structure• Structured templates, but they can be
made unique by the process unit• Filtered information retrievability from the
database• OSISoft PI communication (see Abbrevia-
tions).
The system has to support the handover meth-od while it
• Does not modify the actual procedure• Does not modify the method and the time
spent inserting data in small compass• Makes some additional information acces-
sible for the users• Maintains the important verbal notification-
confirmation method.
The new system requires a change in the log-ging practice of the operators. Logging of the events has to be done as soon as possible, in connection with the adaptability of the automat-ic sharing of information.
COMPLEMENTARY FUNCTIONS The elementary functions of the electronic log-ging application can handle all the tasks of the paper based form. Additionally, electronic log-ging provides other opportunities for the users, which can improve the process. Besides other functions, the communicative capability of the system can be broadened further to include:
• Extensibility• Modularity• Task management module, which helps to
integrate the plant manager’s logbook to the new logging system
• Integration and connection possibility to other information systems, like LIMS, NICE, SAP (see Abbreviations).
The electronic logging system has to fit in every aspect to the currently used refinery informa-tion systems. One advantage of the solution is the abolition of duplicate data entries due to the connected interfaces.
SelectionThe available logging applications on the mar-ket offer more facilities than the project team
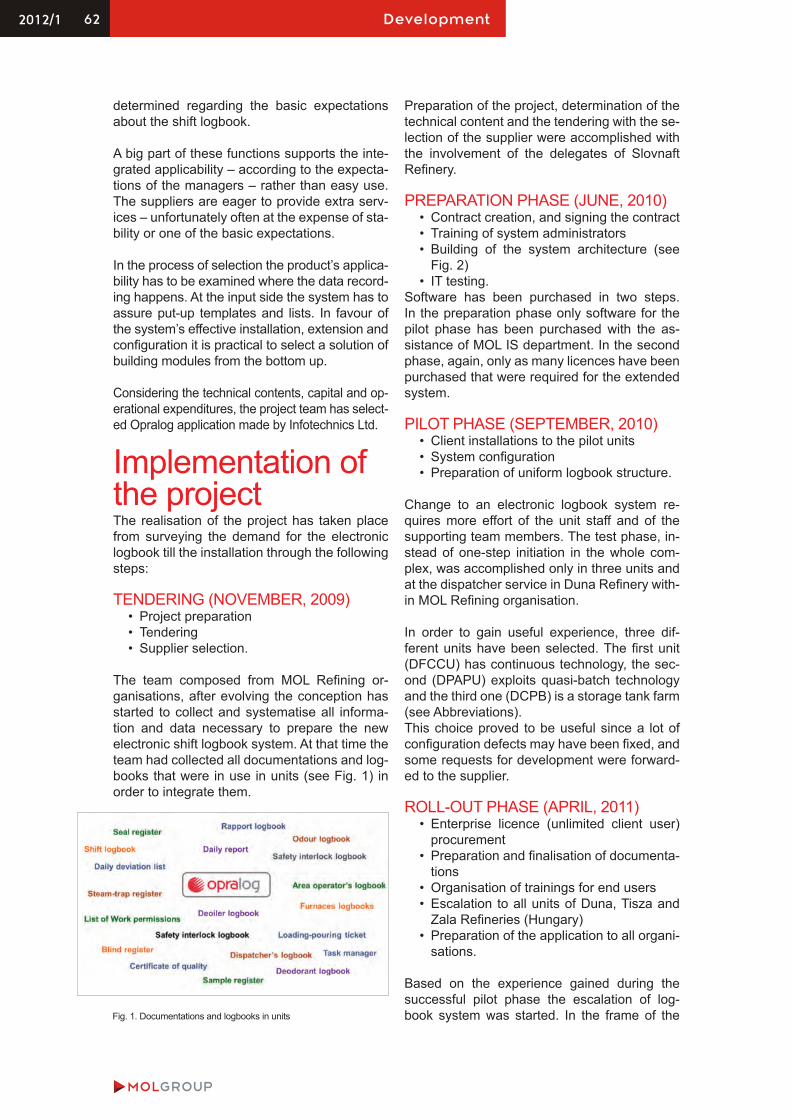
62 Development
determined regarding the basic expectations about the shift logbook.
A big part of these functions supports the inte-grated applicability – according to the expecta-tions of the managers – rather than easy use. The suppliers are eager to provide extra serv-ices – unfortunately often at the expense of sta-bility or one of the basic expectations.
In the process of selection the product’s applica-bility has to be examined where the data record-ing happens. At the input side the system has to assure put-up templates and lists. In favour of the system’s effective installation, extension and configuration it is practical to select a solution of building modules from the bottom up.
Considering the technical contents, capital and op-erational expenditures, the project team has select-ed Opralog application made by Infotechnics Ltd.
Implementation of the project The realisation of the project has taken place from surveying the demand for the electronic logbook till the installation through the following steps:
TENDERING (NOVEMBER, 2009)• Project preparation• Tendering• Supplier selection.
The team composed from MOL Refining or-ganisations, after evolving the conception has started to collect and systematise all informa-tion and data necessary to prepare the new electronic shift logbook system. At that time the team had collected all documentations and log-books that were in use in units (see Fig. 1) in order to integrate them.
Preparation of the project, determination of the technical content and the tendering with the se-lection of the supplier were accomplished with the involvement of the delegates of Slovnaft Refinery.
PREPARATION PHASE (JUNE, 2010) • Contract creation, and signing the contract• Training of system administrators• Building of the system architecture (see
Fig. 2)• IT testing.
Software has been purchased in two steps. In the preparation phase only software for the pilot phase has been purchased with the as-sistance of MOL IS department. In the second phase, again, only as many licences have been purchased that were required for the extended system.
PILOT PHASE (SEPTEMBER, 2010) • Client installations to the pilot units• System configuration• Preparation of uniform logbook structure.
Change to an electronic logbook system re-quires more effort of the unit staff and of the supporting team members. The test phase, in-stead of one-step initiation in the whole com-plex, was accomplished only in three units and at the dispatcher service in Duna Refinery with-in MOL Refining organisation.
In order to gain useful experience, three dif-ferent units have been selected. The first unit (DFCCU) has continuous technology, the sec-ond (DPAPU) exploits quasi-batch technology and the third one (DCPB) is a storage tank farm (see Abbreviations).This choice proved to be useful since a lot of configuration defects may have been fixed, and some requests for development were forward-ed to the supplier.
ROLL-OUT PHASE (APRIL, 2011) • Enterprise licence (unlimited client user)
procurement• Preparation and finalisation of documenta-
tions• Organisation of trainings for end users• Escalation to all units of Duna, Tisza and
Zala Refineries (Hungary)• Preparation of the application to all organi-
sations.
Based on the experience gained during the successful pilot phase the escalation of log-book system was started. In the frame of the Fig. 1. Documentations and logbooks in units

63Development
rapid extension required by the schedule every month one of the four production fields was in-volved, thus all shifts from all units in Duna Re-finery were trained for Opralog use during the next five months. By August of 2011 the exten-sions for Zala and Tisza refineries beside Duna Refinery site were finished. During this time an increasing number of users adapted the system to make reports (Fig. 3), so the training of func-tional organisations’ members has been started about report logbooks prepared for them.
Some of the new system’s properties:• Clients were installed to about 400 com-
puters• The system is used in 25 plants and 13
organisations• More than 150 training occasions hap-
pened – each of the 130 shifts was trained• Around thousand users are in the system• There are 311 templates and 70 custom
lists available• More than 120,000 entries are prepared in
one month..
Future plans By this time three interfaces are connected to the logbook system: one connects to the PI system where real-time data are available;
an other one connects to the database of the ORION scheduler software, from where the plan data can be imported for the daily produc-tion schedule; and the third one is connected to the SAP database, it delivers important mainte-nance information (see Fig. 2).
We plan to connect the logbook system to oth-er databases for decreasing the amount of the redundant data inputs, and starting with LIMS (see Abbreviations). We would like to roll-out this logging method and application to other
Fig. 2. The final architecture of the electronic shift logbook system
Fig. 3. Developments related to Opralog (see Abbreviations)

64 Development
sites. In the Slovnaft Refinery, this procedure is in progress at this time.
Abbreviations DCDU: Atmospheric Crude and Vacuum Distillation UnitDCPB: Crude oil and LPG Blending Unit in Duna RefineryDCS: Distributed Control SystemDFCCU: Fluid Catalytic Cracking Unit in Duna RefineryDPAPU: Paraffin Production Unit in Duna RefineryICA: Investigation and Corrective Actions processLIMS: Laboratory Information Management System NICE: Natural Info Centre contains most of the Refinery Information System’s applications OPM: Operational Production Manage- ment organisationOpralog: software of electronic logbook sys- tem developed by Infotechnics Ltd. ORION: scheduler software of productionPE: Production Excellence organisationPI: the Plant Information software of OSISoft Inc., it provides access to archived and real-time DCS data for usersSAP: System, Applications and Products in Data Processing; it is mentioned only as the SAP based Maintenance system
References[1] Brazier - B. Pacitti - M. Sedgwick: „The link
between Safety and Shift handover”, Eu-ropean Process Excellence Summit, Sept
27-28, 2011, Infotechnics homepage: http://www.infotechnics.co.uk (downloaded: 20.01.2012)
Keywords: shift handover, logbook, informa-tion sharing, implementation, process safety
Reviewed by Tibor Kom-róczkiZsolt Nagy joined MOL Group in 2007. He worked in different positions in shifts for two years at in DCDU1-2 block units and in DPAPU unit as shift leader and operator. He joined Process Informa-
tion in 2009. He is responsible for the reports, NICE applications, SCM support and the Opra-log system. He takes part in the Instrumenta-tion improvement, Production accounting and Refinery information system upgrade projects in INA refineries and supports the development of Opralog and NICE applications, too. He has graduated as an MSc chemical engineer in Veszprém.
Amália Boros joined the company in 2006 and is working in Százhalombatta as a member of Process Information organisation at present. She was a team member in implementation of KPI monitoring system called SEMAFOR. She
also took active part in the initiation of Opralog system in the Hungarian refineries. Currently she deals with supporting the operation of SE-MAFOR, ICA, Opralog systems and the assist-ance their development.

65Development

66 Workshop
AbstractThe term of the basin modelling is referring to a numerical modelling that simulates all elements of hydrocarbon system and in this way integrates all physical and chemical processes in a basin, related to hydrocar-bon generation, migration and accumula-tion in order to improve the success ratios of petroleum exploration.
Basin modelling is also a predictive tool to examine ‘what-if’ scenarios relatively cheaply and rapidly. The method is compar-atively simple. First of all, it uses the best available data and combines them with oth-er information and constructs a working nu-merical basin scale model. After running a simulation the results must be placed back into the basin development context. Thus it is easy to recognise problems with the data and assumptions, or recognise a gap in our knowledge. The most important achieve-ment of 3D modelling is the prediction of the amount of generated and accumulated hydrocarbons.
Introduction The term of the basin modelling is used to de-scribe the quantitative analysis of physical, ther-mal and geochemical processes in a basin. In the early 80s the basin model has been still under de-velopment, but currently it is becoming more and more trivial in the hydrocarbon exploration ([1]: Hantschel and Kauerauf, 2009). At an early stage the simulations were restricted to the calculation
of the burial and thermal history of the source rocks in geological time ([2]: Waples, 1980). The method was relatively fast and could be used in 1D. Later mainly new results of geochemical research works were built in, like component-geochemical kinetics. As the migration and ac-cumulation can not be simulated in 1D, the fluid related processes became important when 2D or 3D modelling began to prevail ([1,3]: Hantschel and Kauerauf, 2009; Tissot at al.,1987).
These days basin modelling is a very complex numerical modelling method that integrates and interprets all physical and chemical processes related to hydrocarbon generation, migration and accumulation, like compaction, multiphase fluid flow, heat flow, mass flow, and chemical kinetics as well.
The main principle in hydrocarbon explora-tion and simulation is the Hydrocarbon System (HCS) concept meaning that the generation, mi-gration and accumulation of hydrocarbons are basically determined by chemical and physical disciplines, but the frame of these processes is provided by the geological history of the basins ([4]: Magoon and Dow, 1994).
Nowadays 3D modelling seems to be the most effective tool to decrease the oil and gas explo-ration risk and increase the success rate.
Use of computer simulations makes possible to test geological ideas and hypotheses (Welte, 2009 in [1] (Hantschel and Kauerauf, 2009), to examine ‘what if’ types of scenarios in a rela-tively fast and cheap way. This approach allows using basin modelling as a predictive tool in the new basins with few data or later stepwise re-finement of the existing model with continuously improved input data. Expected amounts and composition of hydrocarbons can be calculated.
Katalin Milota, Dr. Model development specialistMOL Group, IMA, Geological Model [email protected]
3D basin modelling: Simulation of hydrocarbon generation and migration

67Workshop
Additionally, when constructing a working basin scale model it is easy to recognise problems of data and assumptions, or a gap in knowledge and even it is possible to simplify the nature’s incredibly complicated connections in a model.
The hydrocarbon system (HCS) concept The generally accepted principle of basin mod-elling is the simulation of the elements of HCS (see Fig. 1). There are different definitions to determine the HCS. According to Schlumberg-er’s Oilfield glossary (www.glossary.oilfield.slb.com) HCS is the sum of geological processes and objects that are needed for generation and accumulation.
Source, migration pathway, reservoir, trap and seal are equally important. In petroleum sys-tems all these elements must exist temporally and spatially jointly for the process of genera-tion, migration, and accumulation to occur. It means that the timing is a key factor and a simulation makes parallel investigation of hy-drocarbons’ existence and attributes possible.
The workflow The simulation workflow is principally the same in case of 1D, 2D and 3D simulations as shown on Fig 2.
It begins with the definition of well(s) / basin filling sediments and includes the time frame of deposition, the paleoenvironmental, litho-logical parameters and lateral facies con-junctions.
While in 1D only a well is created, the 3D model uses depth and facies maps to con-struct the entire basin. In a basin model, lay-ers are created from the beginning of sedi-mentation of the oldest layer till the present. The order of layers is identical with the order of deposition. Stratigraphy, age, lithology, as well as the hiatus, uplifts and the amount of the eroded sequences are defining the ba-sin filling. All these parameters have to be assigned to layers. During backstripping simulation the original deposition thickness is calculated for each layer from the present
Fig. 1. The elements of HCS and their connections [2] (green: oil, red: gas)
Fig. 2. Simplified workflow of HCS simulation

68 Workshop
day thickness and compaction curve of each special lithology. At each time step the actual porosity, palaeo-temperature, hydrocarbon generation, expulsion, migration and accu-mulation are calculated.
The modelling process continues with the def-inition of the elements of the HCS, from that the source rocks, and the source parameters should be highlighted. Besides TOC (Total Organic Carbon, in %) and kerogen type the compositional kinetic parameters make possi-ble prediction not only the amount of generated hydrocarbons, but also their phases behaviour during migration and within the reservoir.
As the rate of chemical reactions is determined by temperature, the formation temperature is the most sensitive parameter in hydrocar-bon generation. Therefore the reconstruction of temperature history is essential. ‘Boundary conditions’ on Fig. 2 cover three factors (palaeo water depth, palaeo surface temperature and heat flow (HF) history) directly affecting tem-perature during geological time ([5,6]: Sweeney and Burnham, 1990; Deming D., 1994).
The rate of hydrocarbon generation from kero-gen can be described by series of parallel reac-tions of decomposition of many organic compo-nents. As each reaction rate is an exponential function of temperature, in a model not only the actual temperature, but also temperature history must be considered. This can be rep-resented by a burial history combined with the HF history. If the calculated geologic scenario includes rifting or major unconformities, major temperature disturbances through time can be supposed. Cooling or uplift can stop the gen-eration. Accordingly, the tectonic history of the basin is strongly related to the generation his-tory, since the temperature fluctuations caused by tectonic events affect source rocks matura-tion during their generation history ([7]: Larson at al, 1993).
After generation of the set of inputs and the run of the first simulation, the calculated and measured parameters can be compared. The most frequently used parameters for calibra-tion are porosity, temperature profile and ther-mal maturity. It is essential, that the calculated values must be compared with the corrected measured ones ([2,3,8]: Waples 1980; Tissot at al.1987; Hermanrud et al. 1990).
In case they do not fit, the parameters should be changed and the model rerun again, un-
til a satisfactory fit has been obtained. When the calculated and measured values are close to each other, it indicates, that the basically geology-related constructed model can be re-garded as an appropriate one. Finally, after the simulation of the migration and accumulation the results must be placed back into the basin development context and only the results of the geologically reasonable model can be ac-cepted.
Migration simulation 3D hydrocarbon migration and accumulation sim-ulation is one of the most important parts of the basin- and petroleum system analysis as it high-lights the favourable hydrocarbon migration and accumulation zones, and the possible amounts of hydrocarbon accumulation can be predicted.
The first step of migration is the expulsion when the generated hydrocarbon leaves the source rock at a given saturation threshold. The oil created by chemical decomposition of kerogen fills pore spac-es of the source rock, causes local overpressure and when overcomes capillary resistance begins to expel. This is an important point on the HCS dia-gram (Fig. 3).
Following the expulsion, the hydrocarbon migra-tion can be buoyancy driven due to the density difference between the oil / gas and water, and also topography- and pressure driven, when hydrocarbons migrate from the higher potential place to a lower potential space as a separate phase. Carrier beds (rocks) are the links between source rocks and traps for hydrocarbon migration and accumulation in a petroleum system (see Fig. 1). Oil and gas commonly migrate along narrow
Fig. 3. Simulated HCS from the Pannonian basin with the elements of the hydrocarbon system: source, seal, reservoir, and overburden. The time graph also displays the time of generation / migration / accumulation coming from the results of simulation, trap formation as well as the user’s choice critical moment

69Workshop
and irregular pathways in porous rock. There are three migration models built in the programme used by MOL (PetroFlow in Petro-Mod, Schlumberger). The traditional model is based on Darcy law and is used for simulation of fluid migration through porous system. The so called Flow Path method was developed for buoyancy driven migration and is strongly re-lated to the palaeo-geometry of the basin. Fi-nally the so called Invasion-Percolation method handles also the buoyancy of a hydrocarbon column as the driving force of migration but couples it with capillary entry pressure at the beginning of the migration as the resisting force of buoyancy driven migration. This method is used for simulation of complex and fault related migration.
Simulation results In a simple case oil and gas fetch areas, and the migration paths to potential traps can be presented along the surface of a chosen layer (see Fig. 4).
The 3D basin modelling combines the burial / thermal history with migration modelling thus it is capable to analyse the hydrocarbon potential of a prospect, play or basin. Not only the gener-ated amount of hydrocarbons but also the accu-mulated ratio can be calculated. Additionally the most favourable places for accumulation can also be predicted (see Fig. 5) together with the fluid composition and density in the reservoirs.
Risk analysis Modelling of migration and accumulation re-
quires numerous data that are not always available, frequently it is needed to estimate some of them and the model construction can get extremely complicated. The best available data should be used and combined with other information.
Because of the different type and distribution of data it is not surprising that the uncertainty of the input as well as the calculated results should also be quantified. A risk management module handles the probability distribution of the most important parameters related to hy-drocarbon generation, charge and entrapment and calculates continuous distributions of oil and gas volumes. .
SummaryAlthough the 3D basin-model construction is very time consuming and sometime the quality of the measured data is poor, the computing requires significant processors’ power, and often takes several hours or even days to calculate, the 3D basin modelling is an effective tool in the petrole-um exploration to decrease its risks and increase the success ratio.
References[1] Hantschel T. − Kauerauf A.I. 2009: Funda-
mental of Basin and Petroleum Systems Modeling, Spriner pp. 1-404 (2009)
[2] Waples D.W. 1980: Time and tempera-ture in petroleum formation: application of Lopatin’s method to petroleum exploration. Bulletin of the American Association of Pe-troleum Geologists, 64, 916-926 (1980)
[3] Tissot B.P. − Pelet R. − Ungerer Ph. 1987: Thermal history of sedimentary basins,
Fig. 4. Simulated migration pathways (red lines) along the top of a layer
Fig. 5. Predicted (green colour spots) places for accumulation

70 Workshop
maturation indices, and kinetics of oil and gas generation. Bulletin of the American Association of Petroleum Geologists, 71, 1445-1466 (1987)
[4] Magoon L.B. − Dow W.G. 1994: The petro-leum system, in Magoon, L.B., and Dow, W.G., eds., The petroleum system − From source to trap: Tulsa, Okla., American As-sociation of Petroleum Geologists Memoir, 60, 3-24. (1994)
[5] Sweeney J.J. − Burnham A.K. 1990: Evalu-ation of a simple model of vitrinite reflect-ance based on chemical kinetics. Bulletin of the American Association of Petroleum Geologists, 74, 1559-1570 (1990)
[6] Deming D. 1994: in The Petroleum System − from Source to Trap, Overburden rock, temperature, and heat flow, AAPG Memoir 60, eds Magoon L. B., Dow W. G. pp. 165-186. (1994)
[7] Larson K. W. − Waples D. W. − Han Fu − Kodama K. 1993: in Basin Modelling: Ad-vances and Applications, Predicting tecton-ic fractures and fluid flow through fractures in basin modelling, ed. Doré A. G., et al. (Elsevier, Amsterdam), pp. 373-383 (1993)
[8] Hermanrud C. − Cao S. − Lerche I. 1990: Estimates of virgin rock temperature de-rived from BHT measurements: bias and error. Geophysics, 55, 924-931 (1990)
Keywords: basin analysis, hydrocarbon sys-tem, 3D modelling, migration modelling
Reviewed by István Czeller
Katalin Milota, Dr. is geochemist and basin modeller. Her professional profile includes source rock evaluation, oil-to-source and oil-to-oil correlation, hydrocarbon system evaluation, 1D to 3D basin modelling (burial and thermal history, multi 1D simulation, migration simula-tion), and gas geochemistry. She graduated at Szeged University as chemist and made her doctor thesis about the hydrocarbon potential of the Mesozoic part of Mecsek-Nagykőrös-Debrecen tectonic units.

71Workshop

72 Workshop
AbstractIn Hungary, only pipeline method has been applied for gas transportation between a gas well and the place of consumption since the beginning of the natural gas production. Recent developments in technology (tanks, compressors, CNG-motors) make it worthy to examine the economic aspects of tanker truck utilisation in natural gas transporta-tion. This article examines the gas transpor-tation usage of tanker trucks in the so called ’biogenic’ natural gas producing area, and gives recommendations on the logistic so-lution, the methodology of the transporting activity (using own resource or logistic com-pany’s service) and the fuel type (diesel or CNG) of the tractor.
Furthermore, the minimal lower heating val-ue (LHV) of the transported natural gas, and the distance of the transport are defined as the functions of the expected rate of return. It could be practical to connect several tank-er truck based projects in order to improve rate of return. Furthermore – in contrast to pipeline based natural gas transportation – all equipment is mobilisable, it can futher im-prove economics of the solution. Additional-ly, tanker trucks could transport biogas from local sewage works, animal husbandry and agricultural plants to Szank Sweetening Unit (Hungary) for processing, thus making sig-nificant profit, and, on the other hand provid-ing possibility to utilise the Sweetening Unit after depletion of the local gas fields.
IntroductionThe transport of produced hydrocarbons be-tween the mining area and the place of hy-drocarbon consumption is one of the oldest tasks in hydrocarbon industry. The place of the well and the place of the hydrocarbon consumption coincides with each other in only the rarest case (e.g. if gas power plant are established very close to the gas wells), so an economic producing – processing – transport system should be used.
Oil is relatively easy to store, and it can be transported by different methods (on water-way, on road and railway and in pipeline). In Oil Creek – western Pennsylvania (regarded as one of the earliest oil production field) be-tween 1850 and 1860 the oil was filled into wooden casks and floated down the river to a petroleum refinery, then the refinered oil was transported by railroad to the markets. In 1865 a railroad tank car was specially de-signed for carrying crude oil. The first pipeline was laid from Pithole City to the Oil Creek Railroad. It was two inches in diameter and thirty two thousand feet long [1]. If the pipe-line building proved to be uneconomic the horse-drawn tank transport was applied. The first motorised oil tanker truck was developed and used in 1905 by Standard Oil Co. [2].
Natural gas can be stored only using great en-ergy input. The history of gas transportation is different from oil one, gas pipeline transport method has been applied since B.C. 500 (in China there were some places where natural gas was seeping up to the surface, and the Chinese people formed pipelines made from bamboo to transport the gas for boiling sea water, in order to make drinkable water [3]).
Imre Berkes (50)expertMOL Group, E&P, [email protected]
Examination of tanker truck utilisation in the Hungarian natural gas production

73Workshop
The process of pipeline building takes very long time (more than 1 year) including
• Planning• Landowners procedures (identifying, con-
sultation, notification) • Archeological assessment• Purchasing of permits (e.g. environmental,
agricultural protection procedure for Land Registry Office).
Although the pipe building is one of the costliest parts of the field development, since after fin-ishing the gas production, at the abandonment process only the surface facility equipments can be mobilised, the pipeline remains underground usually without any future utilisation.
Recent years have witnessed significant tech-nical development of equipments for tanker truck based gas transportation (high pressure storage tanks, loading and filling compressors, CNG-motors, etc.). Storage tanks with 20 MPa (and higher) pressure level are produced and distributed, and higher gas volumes can en-sure profitability of tanker truck transport, even in countries where road freight weight limit takes effect (e.g. in Hungary 40 tonnes).
The background of the present article is the examination of Nagykőrös-South field (Hungary) discovery [4]. This gas field pro-vides low caloric value gas (LHV=18.1 MJ/m3), so called biogenic gas (containing only methane, CO2 and N2), and it is located far from any surface facility (pipeline connec-tion, gathering station, gas plant). Investment cost of the tanker truck based gas production would be only the half of the conventional technology since it does not need cold sepa-ration / cryogenic technology (biogenic gases do not contain HC-liquids at high pressure [at more than 20 MPa]).
In this study the same filling and extracting technology is taken into consideration that is planned in article “Discovery of Nagykőrös-South low caloric value gas field and its pro-duction possibilities” [4].
Economic calculations were made for storage tanks of different volumes and different types of materials (tank trailer from Cr-Mo alloy steel with volume of 21,000 litres [see Fig. 1]; tank trailer from aluminium with composite carbon fiber with volume of 44,800 litres [see Fig. 2]) depending on the production rate of the gas well, and considering the infrastructure of the extraction place.
Alignment of transporting tasks with logistic time diagrams Different versions of natural gas tanker truck transportation can be realised depending on the number of used trailers, tractors and the positions of the trailer-tractor systems (trac-tor is docked at extraction process or not).
The followings are supposed in the calcula-tions (in case of Cr-Mo tank):
- The maximum volume is 6,540 standard m3 (at operating tank pressure of 20 MPa). Accurate value depends on the absolute density of the transported gas. In this study 1.083 kg/m3 absolute density is taken into consideration
- The volume of the remaining gas after ex-traction (230 standard m3) (the minimum pressure of the tank is 1 MPa)
- The maximum transported volume is about 6,300 standard m3
- The extracting procedure takes about 2 hours (extracting system can be unloaded at speed of ca. 3,000 standard m3/hours).
The followings are supposed in the calcula-tions (in case of aluminium tank):
- The maximum volume is 11,840 standard m3 (operating pressure of the tank is 20 MPa),
Fig. 1. 21,000 litres tank trailer from Cr-Mo (Source:Tenaris Dalmine)
Fig. 2. 44,800 litres tank trailer from aluminium with composite fiber (Source: Rév és Társai Gázipari Kereskedelmi Kft.)

74 Workshop
- The volume of the remaining gas after ex-traction (540 standard m3)
- The maximum transported volume is ca. 11,300 standard m3
- The extracting procedure takes ca. 3 hours and 40 minutes (extracting system can be unloaded at speed of ca. 3,000 standard m3/hours).
The followings are supposed in the calcula-tions (in case of Cr-Mo and aluminium tank):
- The pressure of extraction is 1 MPa- The procedure of docking takes 30 min-
utes- The procedure of undocking takes 30 min-
utes- Tanker truck can travel 42 km by an hour.
In the following versions the best economic results have to be determined:
- Version 1: Cr-Mo tank, low distance range- Version 2: Cr-Mo tank, middle distance range- Version 3: Cr-Mo tank, high distance range- Version 4: Aluminium tank low distance range- Version 5: Aluminium tank middle distance range- Version 6: Aluminium tank high distance range.
For example, in Version 2 the best economic result is determined the following solution:
- Two filling panels at the filling station (tank trailers could be filled without stopping the gas well production)
- 3 operating tank trailers
- 2 operating tractors- Dropping of the tank trailer at the filling sta-
tion- No dropping of the tank trailer at the ex-
traction station- Operating capacity of the loading com-
pressor 1,310 m3/h- Operating capacity of the extracting com-
pressor 3,150 m3/h.
Fig. 3 shows a logistic time diagram of Cr-Mo tank, middle distance range (75 km), and Table 1 summarises the results of the logistic time diagram examinations.
Natural gas trans-portation service Tanker truck transportation of natural gas can be implemented by:
• Own workforce and equipments or• Rented workforce and equipments.
In this chapter we assess the second solu-tion, where a contracted company provides all the services incl. trailers, tractors and drivers during the project. The logistic com-pany carries out the following logistic tasks:
- GPS tracking of the route (current informa-tion on vehicles: place of residence, fuel consumption, speed of velocity, etc.; cur-rent information on filling and extraction processes)
Fig. 3. Logistic time diagram of the Cr-Mo tank for middle distance range (Version 2)

75Workshop
- Workforce issues (trainings, commanding for drivers)
- Authority issues regarding the trucks, ve-hicles: MoT tests (test of vehicle safety, roadworthiness aspects and exhaust emissions, etc.), operating permission of tanks (Hungarian laws prescribe hydro-static and pneumatic pressure tests every 36 months)
- Maintenance of vehicles (replace of en-gine oil, tire rotation, replace of tires, etc.)
- Insurance, compensation for damages.
A service-price bid was asked from a multi-national logistic company, pursuing consid-erable Hungarian logistic activity (in terms of numbers of vehicle, drivers and offices).
Possibility of CNG tractor usage At some selected extracting places (e.g. Szank Sweetening Unit) CNG tractors could be used.
In Szank (Hungary) MOL Upstream operates a CO2 separation technology (Sweetening Unit), where CO2 is captured from the feed gas produced from the natural gas fields con-taining 17-33 mol% CO2. At the end of the CO2 separation technology the cleaned gas has only 2-3 mol% CO2 content, so it is suitable for sale.
Brief description of the Szank Sweetening Unit is the following:
• CO2 is captured by metil-diethanol-amine (MDEA) within 50% water solution
• CO2 absorption into amine takes place at 6 MPa pressure and 80 °C temperature
• A-MDEA is regenerated in decreasing pres-sure steps: 1,7 MPa, 0.3 MPa, 0.03 MPa
• Quantity of the circulated A-MDEA solution is 360 m3/h
• Separated CO2 is pressurised by compres-sors in four stages upto 15 MPa
• CO2 is injected into Szank-North-East, Szank-South-East oil fields (for enhanced oil recovery − EOR)
• ‘Sales’ gas goes to inlet point of High-Pressure Pipeline System.
Calculations show (see Table 2) that sales gas of Szank Sweetening Unit is suitable for CNG fuel gas from 2012 second half year.
According to references in connection with CNG driven vehicles, the following technical aspects can commonly be mentioned [6]:
- The average fuel consumption at 100 km long journey (50 km full − 40 tons and 50 km empty − 33 tonnes) is 47 standard m3 (40 kg) (in case of diesel engine the con-sumption is 40 litres)
- CNG driven tractors are produced with 320 litres and 1,120 litres fuel tanks
- CNG driven tractor price is 20% higher than a diesel tractor.
Maintenance cost of a CNG driven tractor is 8% higher than a diesel tractor. Operational costs are significantly decreased by CNG tractors (Fig. 4).
Many CNG driven vehicles are in the countries of the world (Table 3).
When compare CNG fuel cost to diesel fuel cost among others the following points should be taken into account:
Table 1. Summarised results of the time diagram examinations
Num- Num- Time of Time of Drop Drop Operative Max ber of ber of filling extrac- swap swap capacity of the distanceVersion tank trac- (minu- ting (minu- by by loading (km)
trailers tors tes) tes) filling extrac- compressor ting (m3/h) 1 2 1 288 120 Yes No 1,310 38 2 3 2 288 120 Yes No 1,310 140 3 4 2 288 120 Yes No 1,310 >140 4 2 2 360 222 Yes No 1,880 27 5 3 2 360 222 Yes No 1,880 104 6 4 3 360 222 Yes No 1,880 >104
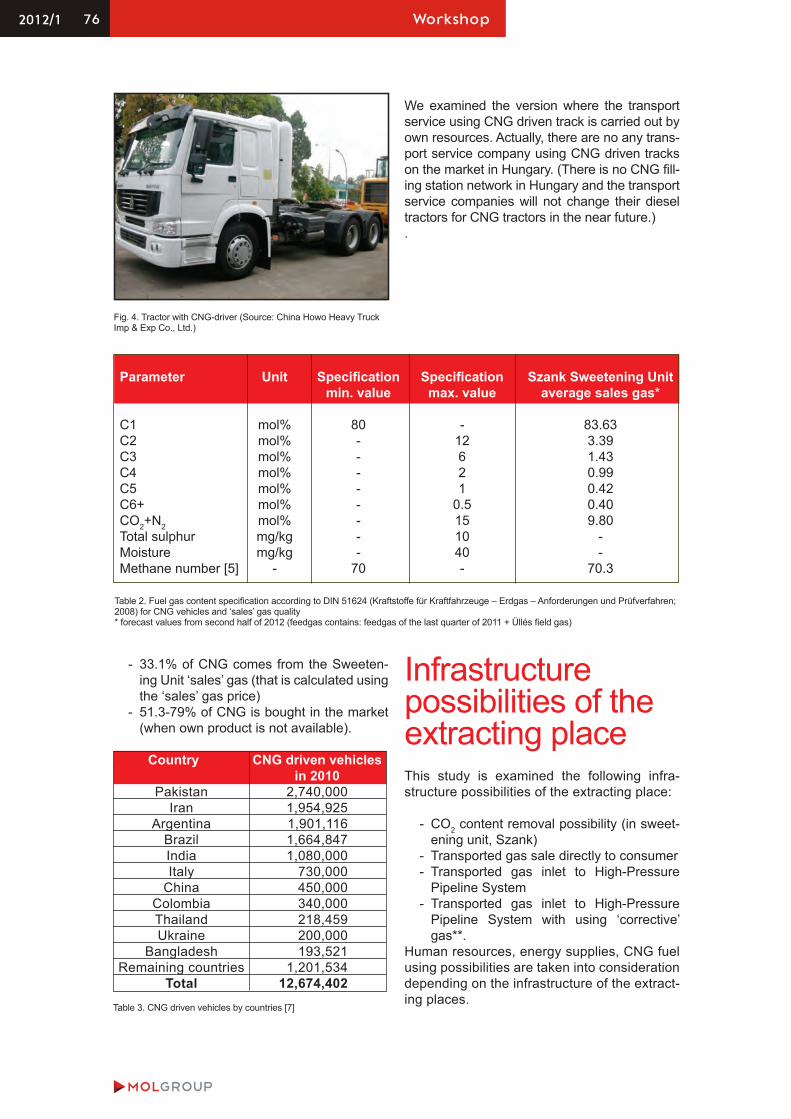
76 Workshop
- 33.1% of CNG comes from the Sweeten-ing Unit ‘sales’ gas (that is calculated using the ‘sales’ gas price)
- 51.3-79% of CNG is bought in the market (when own product is not available).
We examined the version where the transport service using CNG driven track is carried out by own resources. Actually, there are no any trans-port service company using CNG driven tracks on the market in Hungary. (There is no CNG fill-ing station network in Hungary and the transport service companies will not change their diesel tractors for CNG tractors in the near future.).
Infrastructure possibilities of the extracting place This study is examined the following infra-structure possibilities of the extracting place:
- CO2 content removal possibility (in sweet-ening unit, Szank)
- Transported gas sale directly to consumer- Transported gas inlet to High-Pressure
Pipeline System- Transported gas inlet to High-Pressure
Pipeline System with using ‘corrective’ gas**.
Human resources, energy supplies, CNG fuel using possibilities are taken into consideration depending on the infrastructure of the extract-ing places.
Table 2. Fuel gas content specification according to DIN 51624 (Kraftstoffe für Kraftfahrzeuge – Erdgas – Anforderungen und Prüfverfahren; 2008) for CNG vehicles and ‘sales’ gas quality* forecast values from second half of 2012 (feedgas contains: feedgas of the last quarter of 2011 + Üllés field gas)
Fig. 4. Tractor with CNG-driver (Source: China Howo Heavy Truck Imp & Exp Co., Ltd.)
Parameter Unit Specification Specification Szank Sweetening Unit min. value max. value average sales gas*
C1 mol% 80 - 83.63C2 mol% - 12 3.39C3 mol% - 6 1.43C4 mol% - 2 0.99C5 mol% - 1 0.42C6+ mol% - 0.5 0.40CO2+N2 mol% - 15 9.80Total sulphur mg/kg - 10 -Moisture mg/kg - 40 -Methane number [5] - 70 - 70.3
Table 3. CNG driven vehicles by countries [7]
Country CNG driven vehicles in 2010 Pakistan 2,740,000 Iran 1,954,925 Argentina 1,901,116 Brazil 1,664,847 India 1,080,000 Italy 730,000 China 450,000 Colombia 340,000 Thailand 218,459 Ukraine 200,000 Bangladesh 193,521 Remaining countries 1,201,534 Total 12,674,402

77Workshop
Results of the economic calculations Minimum lower heating values (LHVs) needed to meet the minimum expected economics rate (see Fig. 5) were determined in the fol-lowing cases:
- Case 1: The extracting place is Szank Sweet-ening Unit, with using the transport service by an independent company
- Case 2: The extracting place is Szank Sweet-ening Unit, with using the transport service by own resources (tractors are fuelled by diesel)
- Case 3: The extracting place is Szank Sweet-ening Unit, with using the transport service by own resources (tractors are fuelled by own produced natural gas [CNG-tractors])
- Case 4: The extracting place is very close to an inlet point of High Pressure Pipe-line System with ‘corrective’ gas using possibility, transport service is provided by an independent com-pany
- Case 5: The extracting place is very close to an inlet point of High Pressure Pipe-line System with ‘corrective’ gas us-ing possibility, transport service is provided by own resources (tractors are fuelled by diesel)
- Case 6: The extracting place is very close to an inlet point of High Pressure Pipeline System with ‘corrective’ gas using possibility, with using the transport service by own resources (tractors are driven by own pro-duced natural gas [CNG-tractors]).
According to the results of economic calcula-tions the best case is Case 1 where the trans-portation service is done by an independent logistics company due to the following rea-sons:
- The net present value (NPV) calculation does not contain the high investment cost of tank trailers
- Multinational logistic company can share the costs of the tractors and the drivers in other projects in Hungary
- Multinational logistic company has much experience in tank transportation, and the maintenance costs of vehicles, the com-pensations for damages can be minimised.
We compared the full costs (surface CAPEX and operating costs) of pipeline based gas production to tanker truck based gas produc-tion (at the asset of Nagykőrös-South-2 during of operational lifetime [12 years] of the project - Fig. 6).
According to Fig. 6 the best alternatives are depending on the transportation distance as follows:
- Under 29 km: pipeline based gas produc-tion
- 29-39 km: Cr-Mo tanker truck based gas production
- Above 39 km: Al tanker truck based gas production.
**: ‘Corrective’ gas: the corrective gas source is the High Pressure Pipeline System (getting directly the pipeline before the inlet point), this higher quality gas is used to increase the caloric values of the gas by mixing them in order to fulfill the needed minimal caloric values expectation according to gas selling contract. After the mixing procedure the mixed gas enters the High-Pressure Pipeline System. At the time of the preparation of this study the following existing inlet points exist: Hajdúszoboszló, Szank, and the following inlet points are under planning: Nagykanizsa, Kecskemét, Edde.
Fig. 5. Minimum lower heating values (LHV) of the source gas fields fulfilling the minimum expected economics rate in the examined cases (blue: the material of the tank is Cr-Mo, red: the material of the tank is Al)
Fig. 6. Comparing full costs of pipeline based natural gas production and sale to tanker truck based gas production
78 Workshop
Better economic results can be reached when more tank truck based gas production projects are launched after each other, and so the equipments of the first project can be re-used in the second gas field after depleting the first gas field and so on. At tanker truck based gas production all the equipment can be mobi-lised, but at pipeline based gas production the most expensive part of the project, the pipe-line remains under the ground. (Planning of the mobilisable equipments of a CH produc-tion system is already solved [8]).
Other possibility of tanker truck usage in connection with the sweetening unitsIn Hungary there are numbers of plants where biogas appears as ‘by-product’ (e.g. sewage works, animal husbandry, agricultural plants, etc.). Average content of biogases is shown in Table 4 [9].
Szank Sweetening Unit can capture CO2 and H2S gases from the feed gas, so biogases are suitable for the sweetening unit as feed gas. After capturing CO2 and H2S the caloric values of the produced gas will be higher, and it could be supplied to the High Pressure Pipeline System without using any good quality gas for mixture, so the produced gas can be sold at higher price.
Utilisation of the sweetening units (Szank ex-isting amine absorber sweetening unit and / or the planned other amine absorber sweetening unit(s)) would be maximised with biogen gas input as feedgas. Investment cost of amine absorber sweetening unit is about one tenth of the biogas plant using water scrubbing tech-nology for biogas purification.
References[1] Gretchen Krueger: Oppurtunities in Pe-
troleum Carreers – McGraw Hill (2008) ISBN: 0-071493-07-9
[2] Davies, Peter J. The World Encyclope-dia of Trucks - Anness Publishing Limited (2000) ISBN: 0-0754805-18-2
[3] Natural gas.org; http://www.naturalgas.org/overview/history.asp
[4] Péter Hatalyák – Péter Zahuczki – Géza Wittmann – Imre Berkes – Gyula Németh: Discovery of Nagykőrös-South low ca-loric value gas field and its production possibilities – MOL Scientific Magazin, 2011/2 (http://mol.hu/en/about_mol/news_media_centre/our_publications/mol_scientific_magazine/workshop/dis-covery_of_nagykoros-south_low_calor-ic_value_gas_field_and_its_production_possibilities/)
[5] EN ISO 15403-1:2008: Natural gas. Natu-ral gas for use as a compressed fuel for vehicles. Designation of the quality
[6] http://www.mgkke.hu/szakmai-anyagok/a-2011-november-24-i-konferencia-anyagai
[7] International Association for Natural Gas Vehicles (http://www.iangv.org/tools-re-sources/statistics.html)
[8] Juratovics Á. – Kószó Zs.: Portable gas collection system in 3D – The First Cen-tral- and Eastern European International Oil and Gas Conference and Exhibition, 14-16.09.2011., Siófok
[9] http://en.wikipedia.org/wiki/Biogas
Keywords: tanker truck, logistic time dia-gram, biogas, CNG fuel, transportation serv-ice, amine absorber sweetening unit
Reviewed by Péter Kubus
Imre Berkes is a field engineer at MOL Plc. Ex-ploration & Production Di-vision. He has begun his career as foreman. Later he changed to the produc-tion expert. Between 1996 and 2007 he dealt with quality management. He
joined Field Engineering in 2007. Currently he is responsible for solving different oil and gas production problems, creating project ideas and supporting implementations. He is a member of OMBKE and SPE. He graduated in Miskolc Technical University as a gas engi-neer in 1985.
Table 4. Average content of biogases
Compound Content (mol%) Methane (CH4) 50-75 Carbon dioxide (CO2) 25-50 Nitrogen (N2) 0-10 Hydrogen (H2) 0-1 Hydrogen sulphide (H2S) 0-3
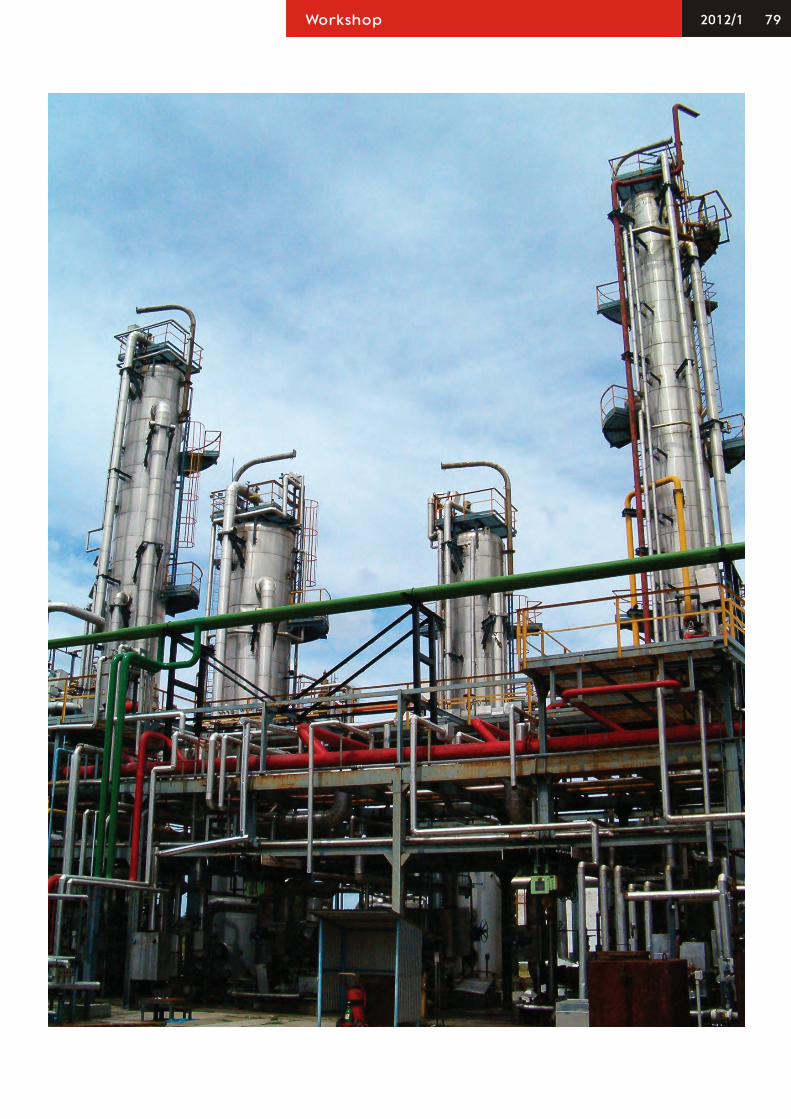
79Workshop

80 Workshop
AbstractThe corrosion damages of heat exchangers and pipes of the process water- and steam systems in TVK Olefin-1 Plant were investi-gated, which can be traced to the acidification of the scrubbing water had already occurred earlier. From the viewpoint of continuous op-eration of the technology it is very important to determine the components responsible for the failures, the technological points they can be found at and the way in that they affect the processes.
IntroductionAs a step of thermal cracking processes, cracked gases enter the water scrubber af-ter leaving the primary fractionator (where the pyrolysis heavy oil is separated). Pass-ing through the water-scrubber the cracked gases are cooled down and the process wa-
ter and the pygas (pyrolysis gasoline) are separated – together with a major part of liquid-phase contaminants. Concentration of these contaminants sometimes can reach such a high level that leads to acidification of the whole (process water- and steam) system causing significant corrosion of equipment of the system.
Aim of the present paper is to disclose the components / chemicals responsible for the corrosion by means of detailed labora-tory analyses and to determine the possible sources where these components can enter the system from..
Theoretical considerations CORROSION PHENOMENA OBSERVED IN PROCESS- AND COOLING WATER SYSTEMS Corrosion processes in these systems are ba-sically determined and driven by the composi-tion of water, that of the structural material as well as the set of process parameters related to the system. Since liquid-phase water is present, mainly the electrochemical corrosion shall be considered; role of chemical (dry) cor-rosion is much less significant in such circum-stances.
The basic peculiarity of the electrochemi-cal corrosion is that the oxidation (corrosion of metal) and the reduction occur separately in the system as cathode- and anode-proc-ess, respectively. Due to the separation in the space, cathode and anodic surfaces are formed separately and the corrosion rate can be extremely high.
Judit Némethné Sóvágó, PhD (42)Associate professorUniversity of [email protected]
Olivér Bánhidi, PhD (60)Associate professorUniversity of [email protected]
Tivadar Gál, PhD (59)Associate professor, head of UM-TVK Petrochemical DepartmentUniversity of [email protected]
Gábor Barancsy (46)TechnologistMOL Group, DS, Petchem, TVK – Olefin 1 unit [email protected]
Gábor Nagy, Dr. (48)Technology development managerMOL Group, DS, Petchem, [email protected]
Investigation of acidification phenomena in process water- and steam systems of steam-cracker

81Workshop
The anodic process – in case of unalloyed or low-alloyed steel structural materials – is the electrochemical oxidation of the iron (1):
Fe → Fe2+ + 2e- ε0 = - 0.441 V (1)
As long as special effects (contact- or galvanic corrosion, pitting, gap- or cavity corrosion, etc.) are not considered, two reactions can be ac-counted in the examined system (2,3):
O2 + 4 H+ + 4e- → 2 H2O ε0 = + 1.229 V (2)H+ + e- → ½ H2 ε0 = 0 V (3)
The two cathode reactions can also occur in parallel but this concept is not supported by the parameters of the system examined by us. For the first reaction (2), oxygen is necessary to be present. Yet, solubility of oxygen in water is very low and it is decreasing with rising temperatures.
In case of thermal cracking technology, the proc-ess water enters the water scrubber at 60 °C, while the other part of the water is used to gen-erate process-steam. Since the temperature is relatively high, concentration of oxygen is very low, even though the system can have contact with air at some points. As a consequence, con-tribution of oxygen to the corrosion processes can be neglected.
The second cathode-reaction (3) is the reduc-tion of hydrogen ions on the surface of iron or steel. Rate of this reaction is directly proportion-al with the concentration of hydrogen ions in the system so it has a direct relation with the pH of medium. According to the statements above, pH has a decisive role in corrosion processes in the system and in the rate of corrosion. Taking into account the relation between the pH and acidity / alkalinity of the solution, it can be easily con-cluded that high corrosion rates occur in case of acidic (pH<7) solutions [1-4].
Yet, the pH has another typical effect, which shall also be considered. In case oxygen is not present, the dissolved iron remains in +2 oxida-tive status while it can be oxidised to +3 status even in very short time in presence of air. The Fe2+ ion forms hydroxide precipitate in case of higher pH. Solubility multiplicator of this precipi-tate is 4.8*10-16 at 18 °C. This means that at an iron concentration of 10-4 mol/dm3 the precipita-tion of Fe(OH)2 already begins to form at 5,6 pH value.
Specific electric conductivity of the system plays a smaller but not negligible role in these
processes. Namely, conductivity of the system – since it is an electrolyte – makes the forma-tion of polarisation barrier more difficult, as a secondary effect. In conclusion, the presence of corrosion processes can evidently be attributed to the acidity of the system. As soon as the pH of the medium turns into acidic range, the corro-sion also starts immediately. This conclusion is also confirmed by the lab analyses performed in the University, as well as in Olefin plant. Con-centration of iron is always low when the pH≥7 and starts increasing as soon as the pH falls be-low 7.
CORROSION PHENOMENA OBSERVED IN PROCESS- AND COOLING WATER SYSTEMSSteam-crackers operating at TVK mainly proc-ess virgin naphtha composition of which is known from hydrocarbon-groups (paraffins, ole-fins, naphthenes, aromatics − PONA) analysis. There is no detailed information available as far as the special contaminants are concerned. Many scientific articles deal with the effects of feed composition on the product yields [5,6]. Though there is no significant amount of con-taminants forming within the steam-cracking cir-cumstances that can cause acidification, pres-ence of steam and the high temperature can cause thermal degradation of the components originally present in the fed naphtha. While concentration of these degradation products is very low in cracked gases (a few ppm only), de-pending on their solubility in water they can be enriched at some points of technology (mainly in water) and can have acidic dissociation. Mo-hammadzadeh et al. and other authors discuss about elimination possibilities of phenolic com-ponents from waters of olefin plants [7,8]. While the cracked gases contain about 1 ppm phenol only, its concentration can reach 30-60 ppm in process water.
Technologies based on oxidation are the most suitable ones for the complete degradation and elimination of phenol from water. As the first step of oxidation phenol transforms into hydro-quinone then into kathecol via benzoquinone. By further oxidation of formed products the aro-matic rings are broken and aliphatic acids are formed such as malonic acid, fumaric acid and oxalic acid. These chemicals can be further de-composed by bio-degradation.Shih-Hsiungsheu et al. applied the Fenton-reaction suitable for degradation of phenol to reduce H2S, mercaptan and phenol content of spent caustic below the limits of specification in crackers [9].

82 Workshop
Basically, the liquid is oxidised in presence of free OH. radicals and Fe2+ ions. Fenton-reagent is used as an oxidising agent [10,11]. From the catalytic effect mixture containing Fe2+ ions and H2O2, hydroxyl-radicals are formed in an extremely reactive way (4):
Fe2+ + H2O2 → Fe3+ + OH- + .OH (4)
The forming radicals initiate the oxidation processes of hydrocarbons (5):
OH. + RH → oxidised products (5)
This reaction mechanism also supports our assumption, according to which Fe2+ and H+
ions can be responsible for corrosion in a sys-tem that contains hydroxyl radicals and has acidic pH. Circumstances of steam-cracking and the presence of steam make formation of OH- radicals possible.
Li et al. examined the mechanism of degrada-tion and published a list of by-products form-ing with degradation of phenol in oxidative way [12]. This list also contains more organic acids with low carbon-atom number such as formic acid, propionic acid, which were also detected in process waters of TVK olefin unit. Intermediate products forming in the course of oxidative degradation of phenol are shown in Figure 1.
Another component that can cause acidifica-tion in steam-cracking processes is the tri-ethylene-glycol (TEG) and its oxidative prod-ucts. Degradation of TEG results in formic acid via di-ethylene-glycol (2EG) and mono-ethylene-glycol (EG) (6):
3EG → 2EG → EG → formic acid (6)
Photo-chemical degradation of EG in presence of hydrogen-peroxide (it is the modified Fenton-reaction) results in organic acids with low car-bon number such as glycolic acid, oxalic acid and others [13] as it is shown in Figure 2.
Koji et al. examined products of electrochemi-cal oxidation of ethylene-glycol in presence of platinum and they found that partial oxidation of glycolates takes place much faster than the total oxidation to carbon-dioxide [14]. In addi-tion, this process can take place in two ways. In the first way C1-type oxidation products (formiates) are formed, while in the second way oxalates are the products as it is shown in Figure 3.
In case glycol is present in technological processes, it is susceptible for oxygen ab-sorption. The mechanisms described above definitely prove that when this process takes place, carbonic acids with low carbon number are formed. Since these chemicals are slight-
ly acidic, their presence lowers the pH of the medium. If this occurs, corrosion processes will start on the surface of certain metals.
Fig. 1. Oxidative degradation of phenol [12]
Fig. 2. Photo-chemical degradation of ethylene-glycol [13]
Fig. 3. Possible ways of ethylene-glycol oxidation [14]

83Workshop
So as to support this theory the authors performed series of analyses to identify the components and their accurate quantity re-sponsible for acidification of the process wa-ter- and steam system. Samples were taken from many points of the system. Results of analyses are shown in the next chapter.
Experimental section The following analyses were performed with the samples taken from different points of the plant system:
- pH- m- and p-alkalinity- ammonia- conductivity, TDS (total dissolved salt)- Na-, K-, Ca-, Mg-, Fe-content- inorganic anions (fluoride-, chloride-, bromide-, nitrite-, nitrate-, phosphate-, sulphate- anions)- organic anions (oxalate-, formi- ate-, acetate-, propionate-ions)- hydrocarbons: C4-C10 hydrocar- bons, aromatics (benzene, toluene, o-,m-,p-xylene, styrene)- phenol- triethylene-glycol.
METHODS OF EXAMINATIONS In order to disclose the components that can cause acidification we measured first the usual water-chemical parameters (pH, p- and m-alkalinity, conductivity, TDS), then we searched for a large scale of components that can be responsible for acidification. We were using inductively coupled plasma-spec-trometric methods, Varian Inc. 720 ES type axial plasma-viewed instrument and meas-ured Na-, K-, Ca-, Mg- and Fe-content and were using photometric method for ammonia-content measurement. Organic- and inorgan-ic anions, phenol and total extractable gaso-line (TEG) from liquid samples [15,16] were determined by liquid-chromatography, using HPLC HP 1050 apparatus. For identification of some components there was no accurate method at our disposal. On basis of literature data we developed a method for determina-tion of glycols and a selective HPLC method was developed to measure phenol-content accurately [17]. The results of phenol content were also checked by photometric measure-ment. Amount of hydrocarbons absorbed in
water – including aromatics – was analysed by gas chromatography static vapour-space analysis by means of HP 5700A FID (flame ionization detector) apparatus.
EVALUATION OF RESULTS The usual water-chemistry parameters (pH, m- and p-alkalinity, conductivity, TDS) meas-urement results of the University were com-pared to the ones measured by the Olefin plant QC lab and to the ranges prescribed in specifications. The measured pH, alkalinity and conductivity results fell into the speci-fied ranges. It could be generally concluded that at the sampling locations where caustic is fed, the pH values approach the upper limit or even exceed the limit of specification and they are in alkaline range. The ammonia con-tent of water samples varied between 0.2 and 40 ppm and it was below 0.02 ppm in four of samples. Amongst the inorganic anions only the chloride and sulphate could be detected. The chloride varied between 2.5 and 13.7 ppm and was below 0.01 ppm in eleven of samples. Sulphate ion was only found in one sample in an amount of 23 ppm. The amount of alkaline metals and alkaline earth metals ions shows the following distribution: Na-ion 0.1-300 ppm, K-ion 0.3-1 ppm, Ca-ion 0.2-5 ppm and Mg-ion 0.01-0.55 ppm. Ca-ion content has an effect on oxalate-ion concen-tration since the Ca-oxalate can precipitate from the solution. Content of Fe-ion varied between 0.1-3.5 ppm.
Among hydrocarbons dissolved in water, we could identify aliphatic (C4-C10) and aro-matic (benzene, toluene, xylene and styrene) hydrocarbons. Within the applied measure-ment circumstances meta- and para-xylene can only be partly separated while orto-xy-lene and styrene cannot be separated at all. For this reason, their amounts are specified together. Dissolved hydrocarbons could only be found in three samples in higher amount (15-63 ppm) and ratio of aromatics was about 50%. The rest of samples contained 0.01-0.35 ppm hydrocarbons and these were ar-omatics. Except for one sample all the rest contained 30-100 ppm phenol. The pH of these samples varied between 8.49 and 9.84 that means the phenols are present in stable phenolate form, but in some cases anions of organic acids (oxalate, formiate) are also present, which indicates degradation. When the pH is lower, these organic anions are present more frequently. Triethylene-glycol was detected in concentration of 500-1,300

84 Workshop
ppm in one of the samples. Its decomposition products (EG, 2EG, glycolic acid, etc.) could also be detected on the chromatograms. These samples also contained oxalate and formiate ions and this fact also refers to de-composition. Triethylene-glycol content was lower in rest of the samples but the ratio of decomposition products was higher.
CHEMOMETRIC ANALYSIS OF MEASUREMENT RESULTSSo that the details concerning the acidification problem, which seemed to be rather complicat-ed, even during studying the literature, could be disclosed. The samples had been analysed for a considerable larger set of parameters than in the course of a routine analysis. The relations among the different parameters measured were analysed by chemometric methods and their effect on the iron concentration of the so-lutions was studied as well. The examinations were carried out with the help of the statistical programme package Statistica for Windows v. 8.2 of Statsoft. From the considerable number of parameters measured 16 variables were se-lected for further study (electric conductivity, TDS, pH, m-alkalinity, Na-, K-, Ca-, Mg-, Fe-, Cl-, oxalate-, formiate-ions, phenol, m- and p-cresol (together), o-cresol, triethylene glycol, and two new variables, which can be calcu-lated from the above mentioned parameters, were introduced as well. One of the new vari-ables is the ionic strength (without taking into account H3O
+ and OH- ions), and the other is the difference of m and p alkalinity, i. e. the m – p alkalinity.
Cluster analysis. At first cluster analysis was carried out on the data set, so that the ques-tion whether the variables form specific groups could be answered. The results showed that the most basic parameters used for character-ising the water chemistry (electric conductiv-ity, TDS, m-alkalinity, m – p-alkalinity) form a specific group. Triethylene glycol and iron join this group and the anions of middle-strength acids (oxalate, formiate) also join. A special group is formed by chlorine, alkaline metal ions and the ionic strength and there is one more group, which consists of pH, phenol, cresols and those of alkaline-earth metals. Examination the stochastic relations among the variables. As the cluster analysis is based upon the ability for correlations, next the cor-relation among the different parameters was studied. Special attention was paid to the cor-relations with the iron concentration in the solu-tion. In the careful examination several, partly
parametric, partly non-parametric tests for cor-relation were applied (Rank correlation test by Spearman, Tau test independence by Kendall, correlation test by Pearson [18-19]). The cor-relation coefficients determined with the help of the Spearman’s rank correlation test are pre-sented in Table 1.
Looking at the correlation coefficients among the iron concentration and those of the other parameters indicated in Table 1 it can be stat-ed that large positive, small positive and large negative values can be noticed. Regarding the positive coefficients the relation of the iron con-centration to the conductivity seems to be the strongest (the TDS is calculated from the con-ductivity, so it is not an independent parameter). Conductivity is a kind of integrating-type pa-rameter, i.e. its values are the summed up from the conductance of all the cations and anions present in the solution. In the system studied it has basically two main sources: the conductiv-ity caused by oxonium and hydroxide ions and the conductivity of all the other ions of the solu-tion. This distinction is important because their contribution to the conductivity of the solution is different when the solution is acidic, neutral or alkaline. From the values it also can be seen that there is only a marginal positive correlation between the ionic strength, which represents the effect of all the ions except for oxonium and hydroxide ions, and that of the iron concentra-tion. The relation of the iron concentration to the formiate-, oxalate-, tri-ethylene glycol con-centration and that of m-alkalinity and m – o alkalinity has a large positive coefficient. Large negative correlation features the relation of iron to the pH, to the concentration of phenol, and cresols. The negative correlation to the pH clearly indicates that the corrosion of iron (its anodic dissolution) increases with decreasing pH, i.e. the cathode process is the reduction of oxonium ions, therefore in lack of other cath-ode reaction the corrosion can take place only in acidic conditions. The large negative correla-tion of the iron to the phenol and cresols is also worth mentioning. This clearly refers to the fact that the danger of corrosion is caused not by these components, but by their decomposition products.
Summary, conclusions Although within the circumstances of steam-cracking there are no significant amounts of by-products forming that cause acidification,

85Workshop
presence of steam and high temperature can contribute to thermal degradation of contami-nants present in the system.
While these components are present in very low concentration in cracked gases, their concen-tration – depending on their solubility in water – can be much higher in liquid phases at differ-ent points of technology and can have acidic dissociation. According to the measurement
results components responsible for acidification can clearly be identified. The oxidation products originated from phenol and triethylene-glycol are definitely responsible for the eventual corrosion processes.
To prevent corrosion we suggest monitoring of pH at the existing sampling points of process water- and steam systems and dosage of caus-tic as soon as the pH gets into acidic domain.
Vk_uScm TDS pH m_alkalin. Phenol m.p Cresol o Cresol Vk_uScm 1.000000 0.999316 -0.,52402 0.862518 -0.563646 -0.513862 -0.417105TDS_ 0.999316 1.000000 -0.52547 0.863262 -0.566461 -0.518168 -0.418605pH -0.524025 -0.525465 1.00000 -0.294280 0.681451 0.629708 0.532271m_alkalin. 0.862518 0.863262 -0.29428 1.000000 -0.528828 -0.527818 -0.426535Phenol -0.563646 -0.566461 0.68145 -0.528828 1.000000 0.919305 0.768443m.p Cresol. -0.513862 -0.518168 0.62971 -0.527818 0.919305 1.000000 0.870515o Cresol. -0.417105 -0.418605 0.53227 -0.426535 0.768443 0.870515 1.000000Cl 0.621599 0.606427 -0.05518 0.651725 -0.218415 -0.197628 -0.147824Oxalate ion 0.065537 0.059986 -0.12056 0.238122 -0.174374 -0.278826 -0.414653Formiate i. 0.163082 0.166521 -0.30229 0.268697 -0.297896 -0.467119 -0.572155Trieth. gl. 0.920570 0.920422 -0.51993 0.867024 -0.537661 -0.470639 -0.357879Fe ppm 0.718912 0.720245 -0.77128 0.638094 -0.707302 -0.740747 -0.791243Ionic str. 0.213797 0.215195 -0.23573 0.165163 -0.208322 -0.363091 -0.248648m – p 0.829153 0.828306 -0.48108 0.913423 -0.720555 -0.749823 -0.664340[H3O+ ] 0.524025 0.525465 -1.00000 0.294280 -0.681451 -0.629708 -0.532271 Cl Oxalate ion Formiate i. Trieth. Gl. Fe ppm Ionic str. m – pVk_uScm 0.621599 0.065537 0.163082 0.920570 0.718912 0.213797 0.829153TDS 0.606427 0.059986 0.166521 0.920422 0.720245 0.215195 0.828306pH -0.055182 -0.120557 -0.302286 -0.519929 -0.771276 -0.235729 -0.481076m_alkalin. 0.651725 0.238122 0.268697 0.867024 0.638094 0.165163 0.913423Phenol -0.218415 -0.174374 -0.297896 -0.537661 -0.707302 -0.208322 -0.720555m.p Cresol -0.197628 -0.278826 -0.467119 -0.470639 -0.740747 -0.363091 -0.749823o Cresol -0.147824 -0.414653 -0.572155 -0.357879 -0.791243 -0.248648 -0.664340Cl 1.000000 0.002590 -0.067300 0.672722 0,154150 0.194463 0.645559Oxalate ion 0.002590 1.000000 0.904685 0.048008 0.414205 -0.356355 0.274045Formiate i. -0.067300 0.904685 1.000000 0.142036 0.541239 -0.161218 0.370155Trieth. Gl. 0.672722 0.048008 0.142036 1.000000 0.632528 0.137223 0.852107Fe ppm 0.154150 0.414205 0.541239 0.632528 1.000000 0.144516 0.684372Ionic str. 0.194463 -0.356355 -0.161218 0.137223 0.144516 1.000000 0.275470m – p 0.645559 0.274045 0.370155 0.852107 0.684372 0.275470 1.000000[H3O+] 0.055182 0.120557 0.302286 0.519929 0.771276 0.235729 0.481076
Table 1. Correlation coefficients determined by Spearman’s rank correlation test Vk_uScm – conductivity, μS/cm; TDS – Total Dissolved Solids, mg/dm3; m_alkalin – m alkalinity; Trieth. Gl. – triethylene-glycol, ppm; Ionic str. – ionic strength. In the table the red colour signs those correlation coefficients, for which the probability of the anti-hypothesis is very little (there is no stochastic correlation between the two variables) and the correlation is significant.

86 Workshop
Acknowledgement The described work was carried out as part of the TÁMOP-4.2.1.B-10/2/KONV-2010-0001 project in the framework of the New Hungar-ian Development Plan. The realisation of this project is supported by the European Union, co-financed by the European Social Fund.
References[1] Shreir L.L. as editor: Corrosion Volume
1, Metal/Environment Reactions, Second Edition 1976, ISBN 0 408 00267 0
[2] Bockris, J.’OM. − Drazic, D.: Electrochemi-cal Science, Taylor and Francis, London (1972)
[3] Bockris, J.’OM. − Reddy, A.K.N.: Modern Electrochemistry, Plenum Press, London (1970)
[4] Hoare, J.P.: The Electrochemistry of Oxy-gen, Interscience, New York (1962)
[5] Ji-chang Liu − Ben-xian Shen − Da-qi Wang − Ji-hong Dong: Separating group compositions in naphtha by adsorption and solvent extraction to improve olefin yields of steam-cracking process; Journal of Petroleum Science and Engineering, 66, 156–160 (2009)
[6] Kevin M. Van Geema − Damien Hudebine − Marie Francoise Reyniers − Francois Wahl − Jan J. Verstraete − Guy B. Marin: Molecular reconstruction of naphtha steam-cracking feedstocks based on com-mercial indices; Computers and Chemical Engineering, 31, 1020-1034 (2007)
[7] J.S.S. Mohammadzadeh − A.B. Khosh-fetrat – Kaynejad: Pilot Scale System for removal of phenol in phenolic wastewater of Olefin Plant; Process Safety and Envi-ronmental Protection, 82(B5): 365–370 (2004)
[8] Azni Idris − Katayon Saed: Degradation of phenol in wastewater using anolyte pro-duced from electrochemical generation of brine solution; Global Nest: the Int. J. Vol. 4, No. 2-3, 139-144 (2002)
[9] Shih-Hsiungsheu − Hung-Shan Weng: Treatment of Olefin Plant spent caustic by combination of neutralization and Fenton reaction; Wat. Res. Vol. 35, No. 8, 2017-2021 (2001)
[10] R. Maciel − G.L. Sant Anna Jr. − M. De-
zotti: Phenol removal from high salin-ity effluents using Fenton’s reagent and photo-Fenton reactions; Chemosphere 57, 711-719 (2004)
[11] Torabian A. − Jamshidi N. − Azimi A.A. − Bidhendi G.R.N. − Jafarzadeh M.T.: Pho-tochemical Oxidation of Phenol in Olefins Plant Effluent by UV/H2O2 and Photo-Fenton Processes (Case Study); Asian Journal of Chemistry; Vol. 21, Issue: 7, 5310-5318, Published: Aug-Sep, 2009
[12] Li, LX – Chen, PS – Gloyna, EF.: General-ized Kinetic-Model for Wet oxidation of or-ganic compounds, AIChe Journal., Vol. 37, 1687-1697 (1991)
[13] Laís C. Santos − Alessandra L. Poli − Carla C. S. Cavalheiro − Miguel G. Neu-mann: The UV/H2O2 - Photodegradation of Poly(ethyleneglycol) and Model Com-pounds; J. Braz. Chem. Soc., Vol. 20, No. 8, 1467-1472, (2009)
[14] Koji Matsuoka − Yasutoshi Iriyama − Take-shi Abe − Masao Matsuoka − Zempachi Ogumi: Electro-oxidation of methanol and ethylene glycol on platinum in alkaline so-lution: Poisoning effects and product anal-ysis; Electrochimica Acta, 51, 1085-1090 (2005)
[15] M. Riedmann: Sensitive HPLC Analysis of Anions Using Standard Equipment, Hewlett Packard Application Note 12-5091-4851E (1992)
[16] O. Zerbinati: Clean-up procedure for De-termination of Inorganic Anions by Ion Chromatography, J. Chromatography A, 706, 137-140 (1995)
[17] L. Nitschke − L. Huber: Determination of Glycols by HPLC with Refractive Index Detection, Fresenius Journal of Analitical Chemistry, Vol. 349, No. 6, 451-453 (1994)
[18] L. Wasserman: All of Nonparametric Sta-tistics, Springer (2007)
[19] G.W. Corder − D.I. Foreman: Nonparamet-ric Statistics for Non-Statisticians: A Step-by-Step Approach, Wiley (2009)
Keywords: steam-cracking, acidification, proc-ess water- and steam system, corrosion, chem-ometry
Reviewed by János Lakatos – University of Miskolc, director, Institute of Chemistry

87Workshop
Judit Némethné Sóvágó, PhD has conducted scientific research in organometallic area at the Academic Petro-chemical Research Group of Veszprém University, Hunga-ry (1992-1995). She has ob-
tained industrial practice in development, invest-ment and supply chain management areas at TVK from 1996 to 2008. From 2008 she works as an associate professor in Chemical Department of Miskolc University (Hungary). In line with edu-cation activity (chemistry, chemical technology, etc) she co-ordinates education of the Chemical Technology Faculty. She graduated as chemical engineer and also received PhD degree.
Olivér Bánhidi, PhD has worked as deputy head of laboratories of metal industry and as the head of Labora-tory of Machine Factory of Diósgyőr and its ancestors 2001 to 2007. He is an asso-ciate professor in Chemical
Department of Miskolc University (from 2001). He received MSc degree in chemistry (1976, Univer-sity of Debrecen, Hungary) and PhD degree on environmental science (1998). Fields of his sci-entific interest include chemometrics and atomic spectroscopy. He owns 78 scientific publications with cumulative impact factor of 15.1.
Tivadar Gál, PhD joined TVK in 1977 where worked at differ-ent production units. Between 1992 and 1998 he worked for foreign companies in some countries of Asia and Africa. In 1999 he returned to TVK Tech-
nology Development, gained experience in mod-elling, simulation and performance monitoring of production units. He retired from TVK in 2011 and at present he is the Head of Affiliated (TVK) Petro-chemical Department of Miskolc University.
Gábor Barancsy has been working for TVK since 1990 in different positions like proc-ess engineer, section deputy manager then manager in Olefin 1 unit. At present he works as a technologist at
Technology Development Department. He rep-resents MOL PetChem in European Ethylene Producers Committee. He obtained chemical engineer degree at Budapest Technical Univer-sity in 1990.
Gábor Nagy, Dr. has started to work as a laboratory engineer in HDPE1 plant of TVK in 1988. From 1993 he worked as the head of Quality Control, later as the head of Customer Serv-ice and Product and Application Development. Since November
of 2006 he has been managing the Technology De-velopment’s work. He obtained degree of Chemical Engineering at University of Veszprém (Hungary) in 1988 and got degree of University Doctor in 1992. He received Professional Certificate in Manage-ment in 2004. He is an honorary associate professor of University of Pannonia.

88 Obituary
Vratko Kaššovic, PhD(1943-2012)
The former CEO of SLOV-NAFT, and the former head of the Petrochemical Divi-sion of the MOL Group, Vratko Kaššovic, died at the age of 69 after a short
severe illness in April 2012. Leaders of the MOL and Slovnaft Group, as well as many former colleagues of Slovnaft came to say goodbye to the major figure of the Slovak petrochemical in-dustry to the crematorium in Bratislava.
Ing. Vratko Kaššovic, PhD (1943) had a degree in engineering from Slovak Technical Univer-sity in Bratislava and after one-year practice in CKD Prague he joined Bratislava Slovnaft in 1969. Along the work he passed a postgradu-ate study of chemical engineering at the Uni-versity of Chemical Technology in Prague. Sub-sequently, he was awarded a scientific degree in the scientific field of chemical engineering theory at the Chemical Technology Faculty of the Slovak Technical University.
Vratko Kaššovic started his career in Slovnaft as an investor’s technical supervisor, later be-
came a senior technologist and process engi-neering research team leader. Due to his exten-sive knowledge and human qualities, he was appointed the director of the Plastics plant and consequently he became deputy director gen-eral for Production and Technical and Invest-ment Development. From 1998 to 2001 he was the vice-president for Strategy and Finance. He took the position of the director general since 2002, and since 2004 he was in parallel the head of the Petrochemical Division of the MOL Group. In 2006 he retired after 37 years of work in the oil and petrochemical industry.
The name and expertise of Vratko Kaššovic will always remain linked to the key develop-ment of Slovnaft as he was co-deciding on its direction among the most modern European refineries. As a prominent of oil chemistry and petrochemical industry in Slovakia, with proper education, insight, but also human qualities, he contributed to the transformation of Slovnaft into a powerful and efficient company that puts great emphasis on the level of technology, but also the quality of its employees and ecological principles.
Honour his memory.

89Obituary
Gyula Nagypataki, CCs(1928-2012)
Dr. Nagypataki, founder and long-time editor-in-chief of the predecessor journals of our MOL Scien-tific Magazine, former head of research laboratories of
Komárom and Duna Refineries (Hungary) and highly recognised and respected figure of the community life of his hometown Százhalom-batta has passed away in 6th of May 2012.
He was a miraculous child being able to read at the age of 4 years in his native German. When he finished his high school in Budapest (with excellent results), he spoke German, English, French and Hungarian. He graduated at Eötvös Loránd University (Budapest) in 1951 as chem-ist. Later he also received economist (1959) and candidate of chemical science (PhD, 1971) degrees.
Dr. Nagypataki started his carrier at Szőny (to-day Komárom) Refinery, where he became the head of the quality control and research labora-tory. In the first half of the sixties with several other members of the refinery staff, he was in-vited to the newly established Duna Refinery (Százhalombatta). Here, he was responsible for the preparation of the new plants products’ quality control and later for the research of new products and technologies. He is the co-owner of ten patents and more numerous innovations in the fields of desalting of crude oils, produc-tions of high octane gasoline, jet fuel, lube oils with high viscosity index, blown bitumen, etc. His technology-oriented achievements and thoughts appeared in around 150 publications.
He has retired from the refinery in 1988.
He was the founder and editor-in-chief of the predecessor Hungarian journals (‘Danube Crude Oil’, ‘MOL Technical and Scientific Publi-cations’) of our MOL Scientific Magazine for 37 years, till 2008. In this position he taught young-er generation how to express themselves and write publications and invited prominent manag-ers to deliver regularly more general messages.
For more than two decades he served in the capacity of the elected head of the local (Százhalombatta) Group of Hungarian Chemi-cal Society. He organised 13 countrywide and international conferences, and numerous lo-cal and countywide meetings for information sharing. In the seventies and eighties when Hungarians had limited travelling opportunities abroad, he organised yearly visits to western oil refineries.
He was a highly recognised and respected figure of the community life of his hometown Százhalombatta. In 1989 he became the elect-ed member of the local administration and headed its Environmental Committee in three terms. Among others, they declared that no fur-ther environmental load of factories (oil refin-ery, power station, etc.) in the town is allowed. He always put great challenges for himself and realised most of them. Recognising his local achievements town Százhalombatta provided an honorary grave for Dr. Nagypataki.
He will be remembered for his outstanding and long-lasting creations and excellent personality. He will be deeply missed by his family and former colleagues. We preserve Dr. Gyula Nagypataki's memory with respect and affection.