auditor quality and the presence of audit committees : an
TRANSCRIPT

UNIVERSITY OF TASMANIA
School of Accounting and Finance
Auditor Quality and the Presence of Audit Committees:
An Association with Income Smoothing
A dissertation submitted to the School of Accounting and Finance, University of
Tasmania, in partial fulfilment of the requirements for the Masters degree in
Commerce
By Sasono Adi
January 2000
Supervisor: Professor Jayne M. Godfrey

STATEMENT OF ORIGINAL WORK
The dissertation is the sole work of the author whose name appears on the title page. It
contains no material which the author has previously submitted for assessment at the
University of Tasmania or elsewhere. To the best of the author's knowledge, the dissertation
contains no material previously written or published ly another person except where reference
is made in the text of the dissertation.
Sasono Adi
January 2000
11

ACKNOWLEDGMENTS
Fist and foremost, I would like to thank my supervisor, Professor Jayne M. Godfrey from
whom I received valuable comments, suggestions, guidance, encouragement and support. I
therefore would like to dedicate this thesis to Professor Jayne M. Godfrey.
Many thanks go to Barry Hicks, Sue Hrasky and other staff members at the School of
Accounting and Finance who provided an enormous amount of support and
encouragement to me during difficult periods.
I would also like to express my appreciation to George Piggiot and Lu Bai for their
encouragement to me during times of difficulty. Many thanks to Margaret Eldridge for
proof-reading my work.
Finally, I would like to thank Ausaid who provided the financial support for me to
undertake the Masters program. My special thanks go to my wife — Sitarina Widyarini and
my parents for their loving, caring and support.

ABSTRACT
Income smoothing is the intentional reduction of reported earnings fluctuations with
respect to some "target" level or trend. This study investigates whether auditor quality or .•
the presence of audit committees is associated with income smoothing by managers of •
Australian firms. It is motivated by the lack of evidence of an association between income .
smoothing and corporate governance structures. Discretionary accruals, estimated using a :-
cross-sectional accruals model, are used as a proxy for earnings management, and -
smoothing is measured as the excess of (a) the difference between actual reported :
operating profit before taxes and targeted operating profit before taxes over (b) the'
difference between targeted operating profit before taxes and pre-managed earnings. The
smaller the excess, the more smoothing takes place. This study is mostly inconclusive• •
about whether auditor quality is associated with income smoothing. In contrast, the
presence of an audit committee has no association with smoothing. While they are ..
inconclusive, the results generally do not support predictions that the more firms use audit
committees and high quality auditors, in combination, the less likely they are to smooth'..-
reported income. Australian firms tend to smooth reported earnings more than their US
counterparts. While the difference may be attributable to international differences in
requirements for the use of an audit committee, again the results are not conclusive.
iv
TABLE OF CONTENTS
Page
Statement of original works ii
Acknowledgement iii
Abstract iv
List of figures and tables vii
Chapter 1: Introduction 1
1.1 Motivation 4
1.2 Objectives 5
1.3 Methodology 8
1.4 Results 8
1.5 Implications 9
1.6 Structure of the thesis 10
Chapter 2: Literature review and institutional background
11
2.1 Introduction 11
2.2 Background
11
2.3 Reasons for income smoothing 14
2.4 Corporate governance: Institutional differences 20
2.5 Conclusion 28
Chapter 3: Hypotheses development
29
3.1 Introduction 29
3.2 Agency theory 29
3.3 The audit committee 32
3.4 External auditing 35
3.5 Relationship between audit committees and external auditing 39
3.6 Corporate governance: Audit committee and auditing regulations 41
3.7 Conclusion 45
r

Chapter 4: Method 46
4.1 Introduction 46
4.2 Sample selection 46
4.3 Estimation of discretionary accruals 49
4.4 Income smoothing 50
4.5 Research design and measurements 53
4.6 Conclusion 60
Chapter 5: Analysis of results 61
5.1 Introduction 61
5.2 Results 61
5.3 Discussion 76
5.4 Sensitivity analysis: An alternative test of income smoothing 81
5.5 Sensitivity analysis: Unrestricted sample 88
5.6 Conclusion 90
Chapter 6: Summary and Conclusion 91
6.1 Introduction 91
6.2 Regulatory background 91
6.3 Predictions of the study 92
6.4 Method 92
6.5 Results and Conclusions 93 .
References 95
vi

LIST OF TABLES AND FIGURES
Table 1 Sample selection
Table 2 Descriptive statistics used to calculate discretionary accruals and descriptive
statistics of dependent and independent variables in the period between
1993 - 1995
Table 3 Pooled correlation matrix
Table 4 Pooled univariate tests: independent variables and their association with
smoothing
Table 5 Logit analysis of explanatory variables associated with smoothing
Table 6 Logit analysis of explanatory variables associated with smoothing by
industry
Table 7 Logit analysis of explanatory variables associated with positive discretionary
accruals
Table 8 Distribution of firms by sign of discretionary accruals and predictive
indicator variable Smooth1b
Table 9 Logit analysis of explanatory variables including smoothing variable,
Smooth1b, in association with positive discretionary accruals
Table 10 Logit analysis of explanatory variables associated with smoothing in all
industries classification for the US sample
Figure 1 Income smoothing: I TargetY, t - I I TargetY,t - NDE I
Figure 2 The use of discretionary accruals to adjust reported earnings to target
earnings, subject to GAAP limitations, for measuring income smoothing.
vii

Chapter 1: Introduction
By definition, income smoothing is driven by incentives to mitigate volatility in the
reported earnings. Income smoothing dampens the oscillations of earnings numbers
around their trend. Ma (1988) argues that smoothing reported earnings may be defined
as the intentional reduction of earnings fluctuations with respect to some "normal"
level. He finds that for US commercial banks, management tends to raise (lower) loan
provisions in periods of high (low) operating income.
Income smoothing is the result of either real or artificial earnings management. Real
income smoothing involves managing the underlying transactions that give rise to
reported earnings (see Ronen and Sadan, 1981). It involves altering the timing of the
occurrence of real transactions to achieve the smoothing objective. These transactions
include capital asset acquisitions, discretionary spending on advertising, research and
maintenance or the recognition of sales transactions. Timing the recognition of real
transactions might be considered a special case of real smoothing. For example, firms
may delay (after shipment) or accelerate (before shipment) the recognition of sales
transactions at year-end. There are relatively few studies detecting real smoothing,
primarily because there are no disclosures to signal its presence (Bitner and Dolan,
1998).
This study focuses upon artificial smoothing. Artificial income smoothing reflects the
use of accounting techniques to smooth the level of earnings reported. Artificial

income smoothing is achieved by using discretionary accounting procedures that allow
the shifting of costs and/or revenues from one accounting period to another. This type
of smoothing is more readily identifiable than real smoothing because the use and
effects of artificial smoothing tools generally are disclosed in the financial statements.
There is a variety of specific actions that can facilitate artificial smoothing. Each
affects either accounting policy choice or accounting estimates. Examples of changes
in accounting procedures include changes in methods of inventory valuation, and
depreciation. Changes in accounting estimates may involve decisions surrounding bad
debts, capital assets' lives, litigation costs, obsolete inventory, or pension assumptions.
The general practice of income smoothing has been documented in the accounting
literature. Most research has been conducted using US data (e.g., Ronen and Sadan,
1981; Moses, 1987; Ma, 1988; Hunt, Moyer and Shevlin, 1995; Defond and Park,
1997), but there are several studies using data relating to non-US firms (Saudagaran
and Sepe, 1996; Booth et al., 1996; and Young 1998). The extant literature reports that
smoothing is in common usage. These studies report that firms' characteristics such as,
management compensation, leverage, firm size and signalling of future cash-flows have
been consistently associated with smoothing
Booth et al., (1996) document that Finnish accounting legislation offers more ways to
intentionally smooth financial accounting income than are available to manage taxable
income. For example, while the Accounting Act does not regulate the amount of annual
depreciation and does not specify any particular depreciation method, the Business Tax
Act contains detailed instructions on the maximum depreciation rates for machinery
2

and plant (30 percent and 10 percent, respectively). Secondly, firms are allowed to
create untaxed reserves, such as an inventory reserve, a bad debt reserve, an operational
reserve, a warranty reserve and an investment reserve. Thirdly, firms do not have to
record their pension liabilities contributed to pension foundations on an accrual basis,
and can thereby affect reported earnings figures'. Not all this accounting flexibility
exists in all countries.
In a UK context, Young (1998) reveals that income smoothing considerations are the
major variant influencing differences in managerial accounting discretion. Young
suggests that reasons for income smoothing could be the manager's desire to signal
future positive cash flow performance. Young (1998) also reports variation over time in
the relationship between accounting policy decisions and leverage, where that variation
may be due to changing probability of debt covenant violation relating to changes in
the macroeconomic climate. The Finnish and UK evidence implies that different
countries' economic and regulatory regimes are likely to create different incentives to
smooth in any given period.
In the Australian context, there is strong evidence that large listed companies are
actively engaged in income smoothing (e.g., Craig and Walsh, 1989; Godfrey and
Jones, 1999). Craig and Walsh (1989) find that the larger Australian firms are more
Other examples as follows: firms are allowed either to expense their exchange losses in the year the exchange rate has changed, or to capitalize them to the balance sheet until the corresponding amount has been paid; then expense or capitalize the costs relating to their research and development activities; and they are allowed to deduct income tax from earnings in income statements or from retained profits in the balance sheet. They can also add certain tax-free revenues, such as dividends, directly to the shareholders' equity without presenting them in the income statement.
3

likely than small firms to use extraordinary items adjustments to smooth reported
operating earnings.
Their results are consistent with Moses' (1987) study using a US sample, but not
supported by Godfrey and Jones (1999), who use an Australian sample. Nor are they
consistent with results from Craig and Walsh's Australian study, and the UK &
Canadian study, Saudagaran and Sepe (1996). Godfrey and Jones (1999) give evidence
that companies with highly unionised workforces, indicating labour-related political
costs, are more likely to smooth earnings via extraordinary item classification.
The conflicting results of Moses (1987), Craig and Walsh (1989), Saudagaran and
Sepe (1996), and Godfrey and Jones (1999) suggest that international differences may
affect managers' incentives to smooth income. Indeed, on the basis of their
UK/Canadian study, Saudagaran and Sepe (1996) conclude that size could proxy for
different phenomena in the US and other countries.
1.1 Motivation
The lack of observed association between income smoothing and the impact of
corporate governance motivate this investigation as to whether the requirements to
form audit committees provide incentives for Australian managers to smooth reported
earnings. The research questions addressed by this thesis are (1) Do Australian firms
smooth income? (2) Does the presence of an audit committee affect the propensity of
firms to smooth income? (3) Is audit quality associated with levels of artificial income
smoothing? (4) Are income smoothing incentives similar for Australian and US firm
4

managers, given that the two countries have different regulations concerning audit
committees and responsibility to detect fraud?
There is a dearth of studies of national differences in corporate governance in relation
to income smoothing. The extant studies on corporate governance mostly focus on
different legal, financial, and cultural factors (e.g., Rubach and Sebora, 1998; Maclean,
1999). Meanwhile, some studies suggest earnings management might depend on the
effectiveness of corporate governance mechanisms, which are known to vary across
firms (Dechow et al., 1996 and Beasley 1996). Dechow et al. (1996) investigate the
governance attributes of firms subject to SEC enforcement actions, Beasley (1996)
examines the link between board composition and financial statement fraud, and
Peasnell et al. (1998) examine further the board effectiveness in constraining earnings
management. To date, however, relatively little attention has been paid to the way in
which income smoothing might be associated with different patterns of governance in
relation to monitoring and controls. Another motivation for this study is Porter's (1994)
discussion about international comparison of auditing standards of the US and
Australia. The present study empirically examines her conjectures about different
requirements to detect fraud, in relation to income smoothing.
L2 Objectives
This thesis examines factors associated with income smoothing. It provides insights
about how the presence of an audit committee and auditor quality by managers of
Australian firms are associated with management of reported earnings through the
manipulation of discretionary accruals. Australian public companies are currently not
5

required to form audit committees, either by statute or by the Australian Stock
Exchange. However, in the US, the requirement has become mandatory 2 . Unlike
Australia, the main movement has increased auditors' duty to detect fraud in response
to criticisms that many US litigation cases are due to audit failure to detect fraud (see
Porter, 1994).
Agency theory explains the role of audit committees and auditors. Agency costs arise
from information asymmetries between owners/debtholders/other parties with claim
against firm, and managers. Contracts reduce these information asymmetries by
limiting management ability to manipulate earnings only if doing so will (a) maximize
firm value through the reduction of the agency costs that result from these information
asymmetries; and (b) reduce opportunistic earnings management that increases
information asymmetry. One way to limit managements' ability to manipulate earnings
is to increase the costs associated with making opportunistic accounting adjustments.
However, the choice to limit managerial discretion is also influenced by other
management decisions associated with the firm's capital 3 and organisational structure
(see Watts and Zimmerman, 1990). As a consequence, management has more firm-
specific information than owners/debt-holders. This gap enables managerial
opportunism (Becker et al., 1998).
2 These committees have to comprise external directors only, but in Australia, audit committees should consist of the majority of non-executive directors. 3 Agency theory recognises that the interests of managers and shareholders may conflict and that, left on their own, managers may make major financial policy decisions, such as the choice of a capital structure that is sub-optimal from the shareholders' standpoint (Mehran, 1992).
6

Audit committees and external auditing can reduce opportunistic reporting by
managers [see Watt and Zimmerman (1986), DeFond and Jiambalvo (1991), Anderson
et al., (1993)]. Based on the premise that firms with audit committees are more
frequently involved in evaluating the possibility of earnings management, it is
predicted that firms with audit committees are less likely to smooth earnings than firms
without audit committees.
Recent research documents positive associations between potential agency costs and
choice of top tier auditing firms (e.g., Becker et al., 1998; Francis et al., 1999). It is
argued that a Big Six auditor appointment signals that the opportunity to transfer
wealth from lenders, shareholders, or other claimholders was not taken, because it
would otherwise be detected and reported by a high quality auditor. The top tier auditor
has high reputational capital at stake for any poor audit performance. On that
assumption, earnings management is less likely to occur when a Big Six auditor is
appointed. It is predicted that firms that use top tier auditors are less likely to smooth
earnings than firms that do not use top tier auditors.
It is also hypothesised that since effective communication between audit committee
members and auditors can enhance the oversight function in corporate governance,
audit committee members tend to support auditors when there is disagreement between
auditors and management in relation to aggressive earnings management. This
argument treats top tier auditors and audit committees as complementary forms of
corporate governance and leads to the prediction that firms with audit committees and
7

big six auditors are less likely to smooth earnings than firms without the combined
audit committee and top tier auditor governance.
In particular, this thesis also predicts that since Australian regulations are less stringent
than US requirements to form an audit committee, Australian firms have more
opportunities and are more likely to smooth earnings than US firms.
1.3 Methodology
The predicted associations between income smoothing and corporate governance
attributes are tested by regressing measures of earnings management on proxies for
incentives to smooth earnings, as reported in Subramanyam (1997). Discretionary
accruals, estimated using a cross-sectional version of a model developed in Jones
(1991), are used as a proxy for earnings management. Dechow, Sloan and Sweeney
(1995) have evaluated several commonly used accrual-based models for detecting
earnings management and they find that all variations of the Jones (1991) model appear
well-specified in a random sample of firms, including the model used in this thesis.
Managers use discretionary accruals to reduce the volatility of (a) the difference
between actual operating profit before taxes and targeted operating profit before taxes,
and (b) the difference between target earnings and pre-managed earnings.
1.4 Results
The results are inconclusive as to whether firms with top tier auditors are less likely to
smooth income than firms without top tier auditors. However, there is evidence that
the presence of audit committees is unassociated with income smoothing.
8

Generally, the results do not support predictions that the more Australian firms use
audit committees and high quality auditors, in combination, the less likely they are to
smooth reported income. The prediction that US firms smooth less than Australian
firms is supported. While the difference may be attributable to international differences
in requirements for the use of an audit committee, again the results are not conclusive.
Overall, the study finds mixed, and only weak support for the use of audit-related
corporate governance in the reduction of income smoothing.
1.5 Implications
The study indicates that auditor quality and the presence of audit committees are
=associated with income smoothing or its reduction. This has implications for the
effectiveness of the alternative forms of auditing-related corporate governance.
Also, the findings can alert financial statement users not to rely upon audit-related
controls over earnings management when interpreting financial data. Regulators, in
deciding the extent to which they should monitor and control managers' actions in
order to protect external parties such as present and potential investors, can also use
these findings in determining the disclosure of financial reporting and governance
practices. Finally, the findings may contribute insight into international differences and
whether they should be accommodated in order to promote international harmonisation
of accounting or auditing regulations.
9

1.6 Structure of the Thesis
• The balance of the thesis is structured as follows. Chapter 2 examines the literature and
provides an institutional background to the investigation of income smoothing in
Australia. Chapter 3 develops the arguments explaining how variation in regulatory
settings of audit committees and external auditing create incentives to smooth earnings.
Chapter 4 outlines the research design. Chapter 5 presents results and analyses of the
results. Finally, summary, conclusions and implications follow in Chapter 6.
10

Chapter 2: Literature Review and Institutional Background
2.1 Introduction
This chapter reviews much of the literature relevant to the thesis and explains the
Australian auditing framework. In the background section, previous studies of
corporate governance are examined. Section 2.3 discusses reasons for income
smoothing according to prior studies of income smoothing. Section 2.4 outlines the
requirement for firms to have audit committees, and the role of external auditing in
Australia and the US, and section 2.5 concludes the chapter.
2.2 Background
In practice, the corporate governance focus has moved from the concept of good
governance to practical issues of how to harness the oversight process to accomplish
high quality corporate financial reporting. "While earnings management is not
necessarily inappropriate, it can become abusive when it obscures the true financial
performance of the company" (Blue Ribbon, 1999). In the same sense, a number of
publicised financial reports have been criticised for their application of earnings
management in order to satisfy financial analysts and to intentionally smooth earnings.
The Chairman of the SEC, Levitt (1998) mentions some of the inappropriate specific
practices of US firms, such as :
• Deliberately overstating one-time "big bath" restructuring charges in order to provide a cushion to satisfy future earnings.
• The misuse of the acquisition accounting, specifically inadmissible write-off of acquired in-process research and development, to inappropriate overstate future earnings.
• "Cookie jar reserves" where companies over-accrue charges for such items as sales returns, loan losses or warranty costs in good times and use those reserves to smooth future earnings in bad times.
11

• Premature revenue recognition, before a sale is complete, before a product is delivered to a customer, or at a time when the customer still has options to terminate, void or delay the sale.
• Improper deferral of expenses to improve reported results and misuse of the concept of materiality to mask inappropriately accounting treatment.
The practices described above can misrepresent a company's true financial condition
and results of operations. Accounting practices become biased, where earnings reports
reflect the desires of management rather than the underlying financial performance of
the company.
The governance structure of a firm is affected by different legal, financial, and cultural
factors that can cause it to vary from other firms' structures. Internationally, each
governance system develops under different circumstances, creating differences in the
focus of the respective governance systems and the measure of their effectiveness
(Rubach and Sebora, 1998).
There is an extensive body of positive accounting literature that examines corporate
governance issues and earnings management (e.g., Auditing: A Journal of Practice and
Theory, The Accounting Review, Journal of Accounting and Economics). Corporate
governance processes are formed to maintain the credibility of firms' financial reports
and protection against earnings manipulation. Dechow et al. (1996) investigate the
relation between earnings manipulations and corporate governance structure. They find
that firms which manipulate reported earnings are more likely to have weak
governance structure and find that those firms are less likely to have audit committees
and less likely to have a Big Six auditor. Drawing from the theory that outside or non-
executive directors have incentives to exercise their monitoring tasks to flag to the
12

market that they are decision experts and understand the importance of decision control
(see Fama and Jensen, 983), Beasley (1996) finds that no-fraud firms have significantly
higher percentages of outside directors than firms with earnings management (financial
statement fraud). Therefore, the composition of the board of directors appears to be
important for reducing the likelihood of earnings manipulation (i.e., financial statement
fraud or its detection).
Peasnell et al. (1998) examine further the board effectiveness in constraining earnings
management, after controlling for managerial ownership (i.e., the proportion of board
equity ownership) and discretionary accruals variables. They find that income-
increasing discretionary accruals are negatively related to the percentage of outside
board members. Their results are consistent with the boards' legal responsibility in the
UK, where the board of directors is legally responsible for the preparation and
presentation of financial reports since the presence of outside directors is negatively
associated with aggressive income reporting.
Audit committees are viewed as monitoring mechanisms that increase the audit
attestation function of external financial reporting. This committee has several
functions, such as to increase the credibility of annual audited financial statements, to
assist directors in meeting their responsibilities and to enhance audit independence
(Bradbury, 1990). Bradbury (1990) finds that audit committees of New Zealand firms
might be an efficient mechanism for reviewing the audited financial statements and
accounting controls as the size of board of directors increases. His study focuses on the
influence of boards of directors on formation of audit committees.
13

Anderson et al. (1993) investigate monitoring mechanisms used for corporate
governance in association with firms' production-investment attributes (i.e., assets-in-
place versus growth options). They argue that external auditing is a function of a
firm's mix of assets-in-place and growth options. Their results support the prediction
that the role of external auditing increases relative to directors' monitoring when the
proportion of firm value explained by assets-in-place increases.
However, there appears to be little research concerning corporate governance in the
frequency or the nature of income smoothing behaviour. Specifically, the presence of
audit committees and auditor quality can be associated with income smoothing. It
appears that there is no study that focuses on the presence of audit committees or on
auditor quality in association with income smoothing.
2.3 Reasons for Income Smoothing
Reasons for earnings management are varied. Early studies hypothesise that improving
shareholders' welfare is the basic motive for management to smooth income because a
stable stream of income sustains a higher level of dividend (Gordon, 1964). Income
smoothing conforms with the objective of reducing uncertainty of expected net cash
flows, therefore resulting in a lower risk premium in the pricing of capital assets
(Ronen and Sadan, 1975). Beidleman (1973) concludes that income smoothing also
reduces the correlation between a firm's expected returns and the return of the market
portfolio. This occurs because earnings variability is interpreted as a risk for the firm
and has a direct effect on investor's capitalisation rates and an adverse effect on the
value of a firm's shares. Accordingly, firms smooth income to create an impression of
14

reduced risk in the eyes of the financial markets. According to Ronen and Sadan
(1981), this can bring about a consequently lower cost of capital, and in turn, a higher
market valuation. Assuming a positive risk-return relation, Trueman and Titman (1988)
assume that managers act in the interest of shareholders, and that shareholders (and
capital markets in general) prefer assets delivering smooth returns. Trueman and
Titman (1988) provide a theory that a manager may rationally seek to smooth reported
income, to lower claim holders' perceptions of the variance of the firm's underlying
economic earning. In turn, they show that such action could have a positive effect on
the firm's market value.
Later studies consider that income smoothing practices mainly arise as a consequence
of agency problems. Management might smooth income if the firm's compensation
scheme is related to the steady growth of income. Ronen and Sadan (1981) have
demonstrated that bonus schemes based on reported earnings can spur smoothing
behaviour.
Lambert (1984) explains that income smoothing can allow financially constrained
managers with earnings-based management compensation to smooth their own income.
In his two-period model, at the beginning of the first period, the principal offers the
agent a contract, which specifies how the agent will be compensated in period one and
period two. Accordingly, the agent's effort in the second period is dependent on the
function of his production in the first period. This condition creates incentives for the
agents to manipulate their effort over time as a function of their past performance. If
the agents have high performance in the first period, they decrease their effort to
15

balance the low production that is likely to occur in the second period. However, if
performance is low in the first period (implying low compensation), the agents increase
their effort.
Healy (1985) hypothesises that income smoothing is motivated by bonus contracts that
pay managers a fixed salary in each period, plus an additional monetary bonus that is
only awarded if a predetermined target level of profits is achieved. These capped
incentives would lead managers to transfer from periods in which they are far above
the level that triggers the bonus, to periods in which they are below such a target4 . His
argument is developed by Holthausen et al. (1995) to show that as earnings before
discretionary accruals increase above managers' prespecified targeted performance
goals, managers have incentives to take income decreasing discretionary accruals; and
as earnings before discretionary accruals decrease below a managers' prespecified
targeted performance, managers have incentives to take income increasing
discretionary accruals up to but not exceeding targeted performance, as long as they are
above the lower bound of their contract.
Holthausen et al. (1995) argue that performance goals are increased in years in which
firm performance exceeds targeted performance, but are not decreased when firms
performance is less than targeted performance. Thus, managers smooth performance to
influence the financial performance goal established for the target payout.
4 However, when profits are below the threshold, managers "take a bath" in the current period and keep potential earnings for a future period.
16

Meanwhile, Fudenberg and Tirole (1995) have proposed an explanation of income
smoothing based on incumbent managers' rents (e.g., private benefits of control),
owners' inability to commit to long-term contracts, and information decay 5 . This
implies that the fear of losing future rents by being replaced during a low-profits
punishment phase stimulates managers to shift income. In other words, in equilibrium,
managers smooth reported profits because given information decay, some periods of
low profits may lead shareholders to replace the manager even if profits have been high
in the past.
Moses (1987) argues that smoothing via accounting policy changes is positively
associated with the degree to which current earnings (before the accounting change)
diverge from expectations. His argument is that smoothing provides signals that allow
for more accurate forecasts, and that within the signalling framework, management is
assumed to be penalised to the degree that realisations differ from user expectations.
Therefore, incentives to smooth should increase as the divergence between actual
earnings and expectations increases.
By using US data, Moses (1987) concludes that bonus plans may provide incentives to
avoid fluctuations in earnings. He also finds that political costs (as proxied by firm size
and market share) are associated with smoothing. The strong relationship between
smoothing and pre-change earnings deviations suggests that attempts to smooth
5 In evaluating management's performance, a good current performance will not compensate for poor future performance. Therefore, when future performance is expected to be poor, managers have an incentive to smooth reported earnings by decreasing current earnings for the benefit of future earnings in order to avoid dismissal.
17

earnings are triggered by earnings realisations that differ greatly from expectations. The
inverse relation between smoothing and the directional impact of accounting changes
on the level of reported earnings suggests that management may make trade-offs
between the risk and return aspects of the firm's earnings numbers when adopting
accounting changes. However, when Saudagaran and Sepe (1996) replicate Moses'
(1987) income smoothing tests with Canadian and UK data, they find results that are
different from those of Moses (1987). In particular, they find no association between
smoothing and firm size. They conclude that in countries outside the US, it might not
be appropriate to proxy political costs with a size variable. The Saudagaran and Sepe
(1996) finding in relation to firm size is consistent with the Godfrey and Jones (1999)
finding of no significant association between income smoothing and firm size in an
Australian context. In combination, Moses (1987), Saudagaran and Sepe (1996), and
Godfrey and Jones (1999) indicate that international differences may significantly
affect managers' incentives to smooth income.
Ashari et al. (1994) studied income smoothing in association with nationality using
Singaporean and Malaysian companies to examine the relative incidence of smoothing
in each country. Although the general accounting principles (GAAP) in Singapore and
Malaysia are almost identical, they found that companies across different nationalities
have different income smoothing indices. Ashari et al. (1994) concluded that
differences in the financial reporting and regulatory framework are important
influences on income smoothing behaviour. In particular, the Singapore regulatory
environment is more stringent than the Malaysian environment. In Singapore, a
government-established Commercial Affairs Department has a role in monitoring
18

financial reports of companies. In addition, Singapore is more developed than Malaysia
as a financial and business centre. Those conditions place Singaporean companies
under more scrutiny. The more stringent the environment, the more difficult it is for
companies to exercise income smoothing.
More recently, Langendijk and Van Praag (1996) identify four variables of institutional
differences. The first is a legal system that influences the incentive to smooth income
in Germany, the Netherlands and the UK. In Germany, where the law is highly codified
and prescriptive, managers of listed firms are more likely to manage earnings,
compared with the other two countries. According to the law, management is
prohibited from retaining more than half of the net income for the year, leaving
disposition of the unappropriated profit and certain retained earnings to the discretion
of shareholders at the annual meeting. This creates incentives for managers to manage
reported earnings in order to attain a desired dividend because higher reported earnings
may create shareholder pressure for higher dividends. Second is the tax system.
Accounting practices in the Netherlands and UK reflect a much less rigid approach to
financial accounting because accounting profit is not the same as taxable income. In
contrast, in Germany, the tax laws determine accounting practice by requiring
companies to book revenues and expenses in order to claim them for tax purposes.
Langendijk and Van Praag (1996) also contend that German companies are more
conservative in using an income smoothing strategy, in contrast with UK and
Netherlands companies that are more inclined to use earnings maximising strategies.
They argue that the difference arises because UK and Netherlands companies report
19

their earnings based upon unbiased estimates of future earnings and firm's future cash-
generating capacity. In contrast, German companies rely heavily on debt financing by a
relatively small number of banks. As a consequence, they focus on maintenance of
sufficient resources to pay debt. The fourth reason for differences between Germany
and the other two countries is the differences in accounting regulations. Managers of
German companies are more likely to smooth because discretionary provisions are
permitted, while in the UK and the Netherlands purely discretionary provisions are not
allowed.
2.4 Corporate Governance: Institutional differences
In this study, corporate governance issues, auditor quality and the presence of an audit
committee, are employed to investigate how Australian firms smooth earnings. US
corporate governance practices are considered to provide a comparison. The
comparison is investigated because corporate governance practices are influenced by
management, government regulations, accounting profession, stock exchanges, and
users of financial statements, that may be different in each country (Gray et al., 1984).
Contrasting the US and Australian practices is useful since Australia and the US are
arguably similar in many of their business approaches, but have some significantly
different regulated auditing requirements.
Corporate governance is clearly defined in Corporate Practices and Conduct produced
by the Working Group chaired by Henry Bosch. "Corporate governance is the system
by which companies are controlled. Shareholders have delegated many of their
responsibilities as owners to the directors who oversee the management of the business
20

on their behalf. Directors are accountable to their shareholders and shareholder
participation is necessary to make that accountability effective".
In the US, listing rules require certain particular governance practices, such as the
appointment of an audit committee, but there is no requirement to disclose governance
practices. In contrast, on 1 July 1995, the Australian Stock Exchange (ASX) introduced
listing rule 3c(3)(j), which requires listed companies to set out their main corporate
governance practices in their annual report. The rule requires disclosure of:
A statement of the main corporate governance practices that the company has had in place during the reporting period. When the statement identifies a corporate governance practice that has been in place for only part of the reporting period, the part of the period for which it has been in place must be disclosed.
However, corporate governance issues are very broad because companies vary so much
in size, complexity, and ownership structure. The mechanisms adopted involve the
division of responsibilities, the composition of the board of directors, the role of
institutional investors, the role of an audit committee, and the role of external auditors.
This thesis focuses on two aspects only, the quality of external auditing and the
presence of an audit committee.
The use of audit committees and top tier external auditing can be considered to provide
important and credible signals of high quality monitoring by boards of directors. The
formation of an audit committee provides an avenue of communication between the
board of directors and management in relation to the oversight function. The existence
of an audit committee can reduce the information asymmetries between management
and the board, since auditing stems from a demand to monitor and arbitrate on the
21

application of accounting methods, including detecting fraud and irregularities. The
value of the auditor depends on the auditor's independence of management to report
any detected fraud and irregularities of contracting parties (Watts and Zimmerman,
1986). In Australia the Corporations Law (1990) obliges external auditors engaged by
public companies to be registered, and establishes a minimum level of quality which
the external auditor must provide. Nonetheless, differences in audit quality are
generally perceived to be associated with auditors' designations as Big 5 auditors (or,
previously Big 8 or Big 6 auditors).
In the US, the inclusion of audit committees in the structure of corporate governance
should be understood as part of the reaction to perceived corporate abuses occurring
over the last three decades. Alleged fraudulent financial reporting, defalcations, and
accounting method choice abuses serve as evidence that management was not
effectively accountable to the full board of directors. The audit committee was an effort
to specifically designate responsibility for accounting-related matters, to provide a
reporting structure for insiders that would circumvent managerial retribution, and to
supervise relations with the external auditor. CICA (1981) chose to define an audit
committee as "a committee of directors of corporations whose specific responsibility is
to review the annual financial statements before submission to the board of directors.
The committee generally acts as liaison between the auditor and the board of directors
and its activities may include the review of nomination of the auditors, overall scope of
the audit, (and) results of the audit..."
22

The SEC has forced a number of corporations to adopt audit committees as a remedial
measure. Although many large companies had voluntarily formed audit committees by
the mid-1970s, a key event occurred when audit committees were mandated for New
York Stock Exchange firms in 1978, and for those listed on the National Market
System (NASDAQ) by the National Association of Security Dealers in 1989 (see
Vanasco, 1994).
Unlike the US situation, the Australian Stock Exchange (ASX) is concerned that such a
requirement will burden many listed companies. Although there have been suggestions
from a number of Parliamentary Committees that audit committees should be made
mandatory for all listed companies 6, the ASX has determined not to make audit
committees mandatory. The ASX requires listed companies to state in their annual
reports whether they have an audit committee, and if not, they should provide a
disclosure explaining why they do not have one 7 . There has been no statutory
legislation requiring the formation of audit committees and the ASX has no
requirements for forming of audit committees. The primary spur for establishing of
audit committees has come from unexpected company failures. It seems that the
development audit committees in Australia are part of an emphasis on promoting the
best practice of corporate governance in the business conununity 8 . It is the result of
self-regulation rather than government regulation. Other reasons that oppose a
6 The Report of the Senate Standing Committee on Legal and Constitutional Affairs on Company Directors' Duties in November 1989 and on Corporate Practices and the Rights of Shareholders in November 1991 (see ASX, 1994) 7 ASX Discussion Paper: Disclosure of Corporate Governance Practices by Listed Companies, September 1994, at para 47. 8 It has similar emphasis that the development of audit committees in UK focuses on promoting the best practice of corporate governance in the business community.
23

mandatory requirement are that it would place a great burden on small companies and
it may give the impression that audit committees constitute a supervisory tier within
boards of directors. In addition, the history of audit committee development indicates
that these committees have been formed as a result of public and political concern
about corporate failures and corporate misconduct. Therefore, although audit
committees are not required by legislation or regulation, they have been constituted
mainly as a consequence of the regulatory environment (see Porter and Gendall, 1993).
Furthermore, the opposition to legal requirements for audit committee formation
maintains that it is not only due to the costs entailed, but also to the assumption that
members of boards of directors know better than government how to determine the
usefulness of audit committees in different situations (CICA, 1981).
Nonetheless, a survey by Ernst & Young in July 1990 revealed that audit committees
are becoming popular in Australia, particularly among companies listed on the
Australian Stock Exchange; and there has been a significant increase in the number of
listed companies with audit committees. Only 27% of listed companies had an audit
committee, according to a survey in 1982 by Davidson (The Chartered Accountant July
1984), compared with 66% in Ernst & Young's survey (1990). Meanwhile, the findings
of Arthur Andersen (1992) provide evidence of the benefits of a publicly listed
company having an audit committee, such as:
• Companies with audit committees take a more active role in assessing the risk of
fraudulent or otherwise misleading financial reporting.
24

• Companies with audit committees are more active in raising accounting and
regulatory issues with both management and external auditors.
• Companies with audit committees use the committee to focus on regulatory
requirements and internal controls.
In regards to external auditing, in the US, as in Australia, auditors' duties in relation to
fraud have continued in recent years. However, unlike Australia, the main US trend has
affected auditors' duty to detect, rather than to report, fraud. Under SAS No.1 (AICPA
1972), auditors were required to identify when fraud might affect their opinion on the
financial statements and to consider this possibility when conducting the audit. SAS
No.16 (AICPA 1977) imposed on auditors a duty, within the limitations of the audit
process, to search for fraud, that would have a material effect on the financial
statements and to plan and perform their audit. SAS No.53 (AICPA 1988) further
requires auditors not only to find irregularities, but also to exercise due care in
planning, performing and evaluating the results of audit procedures and a proper degree
of "professional scepticism".
In Australia, the auditor's responsibility to detect and report fraud and irregularities is
promulgated in Statement of Auditing Practice AUP 16, "Fraud and Error", which was
effective from June 1983. In March 1993 the Auditing Standard Board (AuSB) revised
AUP 16 "The Auditor's Responsibility for Detecting and Reporting Irregularities
including Fraud, Other Illegal Acts and Error". It emphasises that the auditor's role is
not to prevent irregularities; rather it is to exercise skill and care so as to have a
reasonable expectation of detecting material mis-statements arising from irregularities.
25

In July 1996, Statement of Auditing Practice AUP 16 was superseded by Auditing
Standards 210, "Irregularities, Including Fraud, Other Illegal Acts and Errors". This
new standard has the same emphasis as the previous standard. It states that
The responsibility for the prevention and detection of irregularities rests with management. Through the implementation and continued operation of adequate internal control structure, management aims to derive reasonable assurance that irregularities are prevented as far as is possible, and detected if they occur... (para 9).
The auditor is not legally or professionally responsible for preventing irregularities, However, the auditor has a legal and professional duty to exercise reasonable skill and care in the planning and conduct so as to have a reasonable expectation of detecting material misstatements arising as a result of irregularities... (para 10).
In addition, unlike auditors in Australia, auditors in the US are not (yet) required (or
permitted) to report to third parties fraud (or suspected fraud) uncovered during an
audit, except in restricted and carefully defined circumstances (AICPA 1988 para 29).
In Australia, although the statute requires auditors to report fraud to the relevant
government body, in practice, they are likely to avoid that provision. Prior to 1989, the
Companies Act and Codes ss285(10) requires auditors to report to the National
Companies and Securities Commission (NCSC), when during an audit period of a
company, they (auditors) find that "(1) there has been a contravention of, or failure to
comply with, a provision of the Code; and (2) in their opinion, the matter will not be
dealt with adequately by comment in the audit report or by referring it to the
company's directors." The Commission states that the auditors are not obligated to be
satisfied beyond reasonable doubt that a contravention of the Code has occurred. It
states that
[The auditor] need not conduct exhaustive and conclusive investigations nor rely exclusively on evidence which would be admissible in criminal proceedings. However, the auditor is required to assemble and assess all relevant facts in order to reach a considered opinion as to whether, on balance, a contravention is likely to have occurred.
26
Furthermore, referring to the second condition, the NCSC provides direction for
auditors to make their decision, for example:
• The failure to comply with approved accounting standards or failure to keep proper accounting records can be dealt with by comment in the audit report (para 6).
• Where a member of staff (other than a director) obstructs the auditor, or the company fails to lodge an annual return, the matter may be remedied effectively by referring it to directors (para 7).
• Serious offences such as fraud, breach of directors' duty of care and breach of other fiduciary duties are unlikely to be dealt with adequately otherwise than by reporting the matter to the NCSC (para 8).
Since 1989, auditors have had to report to the Australian Securities Commission (ASC)
under the Corporations Law sections 332. The auditor has the right to attend the
general meetings and must inform the Commission of breaches by the
company/directors of the Corporations Law. In July 1998, ASC changed its name to the
Australian Securities and Investments Commission (ASIC), which has additional
responsibilities for consumer protection in the financial system.
However, it appears auditors have not used the provisions widely (Godsell, 1990).
Godsell (1990) lists some possible causes. Firstly, auditors are reluctant to make
disclosures of highly confidential information, which is likely to embarrass their
relationship with the client's directors. Secondly, auditors are concerned about
difficulties and uncertainties in interpreting the legislation. Finally, auditors are likely
to be concerned about the extent of defamation proceedings in making disclosures.
27

2.5 Conclusion
In summary, incentives for managers to smooth income may differ. Managers can
smooth income to achieve a stable income that sustains a higher level of dividend for
shareholders, to generate an impression of reduced risk to the financial market, and to
avoid dismissal during low profit periods. The presence of an audit committee or of a
high quality external auditor is expected to enhance monitoring function of the board
and, in turn, to reduce managers' opportunity to smooth earnings. However, the
incentives for managers to smooth are also influenced by different regulatory
environments. For example, different approaches to form an audit committee and to
detect fraud by auditors can also affect managers' incentives to smooth earnings. This
leads to the question of whether managers of Australian firms smooth earnings more
frequently than managers of firms facing different regulatory requirements, as in the
US.
28

Chapter 3: Hypotheses Development
3.1 Introduction
In this chapter, two variables are employed to explain smoothing behaviour, namely,
the presence of an audit committee and the quality of the reporting firm's external
auditor. Audit committees and external auditors have become a major means for
companies to monitor the reliability of the financial statement process. Existing
research investigates whether potential for high agency costs is associated with demand
for audit committees (see Knapp, 1987; Bradbury, 1990) and high quality external
auditors (Chow, 1982; Francis et al., 1999). To investigate their effectiveness, agency
theory is used to explain the associations between earnings management, particularly
via income smoothing and (a) the presence of audit committees and (b) top tier external
auditors. The rest of this chapter develops the hypotheses.
• 3.2 Agency Theory
The separation of management from ownership in the modern corporation provides an
ideal context for the operation of agency theory. Shareholders (and debtholders in the
context of debt agency contracts) are principals with interests in deriving maximum
utility from the actions of management, serving as their agent. Agency costs arise
because of the separation of ownership and management and the resulting inability of
the owners to observe the actions of management who have incentives to act in their
own interest rather than the principals' (Jensen and Meckling, 1976). In an efficient
labour market, principals price-protect ex ante and settle-up, ex-post, for agency costs
(Fama, 1980). Hence, agents have incentives to invest in various information systems
29

and control devices to reduce agency costs associated with information asymmetry.
Methods include auditing, formal control systems, budget restrictions, and the
establishment of incentive compensation systems (Fama and Jensen, 1976). These
control devices can offer Pareto optimality (i.e., maximum gains for all parties) since
the agent would otherwise bear agency costs that occur when principals discount the
value of the firm, based on the likelihood of adverse selection, shirking, and moral
hazard (Alchian and Demsetz, 1972; Jensen and Meckling, 1976).
Agency costs of equity occur when managers have opportunities to enlarge their own
wealth at the expense of the shareholders' wealth. This causes shareholders to price
protect against such wealth transfers. The costs of price protection are borne by the
managers. The greater the potential agency costs of equity, the greater the likely price
protection and the greater the net benefit to managers of bonding activities, such as
expenditures to ensure that agents will restrict their activities in accordance with
contractual terms, and submitting to inspection and reports on matters related to
contract compliance activities.
In similar fashion, agency costs of debt arise from the debtholder-manager relationship.
In this relationship, managers are deemed to act on behalf of shareholders while being
the agents of lenders. The debtholders protect themselves in the original debt issue
price against the prospect that managers will behave in a manner contrary to lenders'
interest. When agency cost of debt increases, managers face increasing incentives for
bonding to reduce the costs of price protection activities. To prevent wealth transfers
from debtholders, tight covenants can be written into debt contracts. A demand for
30

monitoring therefore increases to ensure that the agents do not breach covenants (see
Smith and Warner, 1979, for extensive discussion of the agency costs of debt).
Management may use various means to indicate to others the quality of the information
they are providing. Bonding activities can involve submitting to higher quality auditing
or audit constraints than are otherwise required, for example. Demands for high quality
monitoring may result in the engagement of top tier external auditors for external
auditing purposes9 (see Chow, 1982; Anderson et al., 1993) and the use of audit
committees (see Pincus et al., 1989; Bradbury, 1990). The use of audit committees and
top tier external auditors can be considered an important part of the decision control
system for monitoring by boards of directors (see Fama and Jensen, 1983). Fama and
Jensen state:
Internal control in the open corporation is delegated by residual claimants to a board of directors. Residual claimants generally retain approval rights (by vote) on such matters as board membership, auditor choice , mergers, and new stock issues. Other management and control functions are delegated by the residual claimants to the board (p.313).
In sum, agency theory places economic self-interest at the centre of theoretical
expectations. Certain contractual relationships, combined with information asymmetry,
indicate a corresponding demand for investment in control and monitoring
mechanisms i° to (a) prevent or detect behaviour not corresponding with principals'
interests; and (b) signal an alignment of principal and agent interests.
9 In this study, the term "top tier auditing firms" is used to refer to Big Eight, Six, and Five auditing firms, depending upon the temporal setting.
To a large extent, this study focuses on opportunistic behaviour (e.g., shirking and perquisite taking) of managers. Such behaviour cannot be entirely eliminated in the presence of positive information costs (see Ball, 1989).
31

3.3 The Audit Committee
An audit committee is defined as a subcommittee of board of directors that helps the
board of directors to monitor and oversee management. The role of this committee is to
review the annual financial statements before submission to the board of directors, to
review the financial statements, the effectiveness of the company's accounting and
internal control systems and the findings of the auditors (see Marrian, 1988). The
effectiveness of audit committees should be influenced by the factors believed to
influence agency costs (Kalber and Fogarty, 1998). For example, audit committees can
be viewed as oversight mechanisms which will be employed in high agency cost
situations to improve the quality of the information flow between principals and agents
(see Watts and Zimmerman, 1986). Appointment of a top tier auditor serves a similar
function.
Pincus et al. (1989) use agency theory to discuss reasons for the voluntary formation of
audit committees. They find that there are six characteristics that are associated with
voluntary audit committee formation: lower percentage of managerial ownership,
higher leverage, larger firm size, a greater proportion of outside directors to total
directors, appointment of Big Eight (now Big Five) auditors; and participation in the
national market system. Their results are supported by later studies (e.g., Collier,
1993). Collier (1993) argues that audit committees can reduce agency costs because
audit committees ensure audit quality and improve the effectiveness of monitoring. He
suggests that the incentives to form audit committees increase with increasing numbers
of shareholders. Collier (1993) also contends that another motivation to form audit
committees is related to agency costs of debt. Increasing debt and increasing agency
32

costs of debt lead managers to improve monitoring in order to reduce the costs of price
protection from debtholders.
In relation to earnings management, Collier (1993) finds that audit committees are
efficient in reducing information asymmetries between non-executive directors and
executive directors. Non-executive directors can mitigate earnings management
because they can help to control agency problems between managers and shareholders.
Since non-executive directors represent shareholders' interests, the likelihood of
decisions contrary to shareholders' interests should decrease with the fraction of non-
executive directors on the board (Brickley et al., 1994).
Defond and Jiambalvo (1991) find that firms with accounting errors are less likely to
have audit committees. They argue that the audit committee is an important element of
a firm's internal control environment, and can reduce the likelihood of overstatement
errors. Defond and Jiambalvo (1991) find that overstatement errors are the result of
managers responding to economic incentives. Since overstatement errors are part of
managing reported earnings, it is possible that the existence of audit committees leads
to reduced earnings manipulation including income smoothing.
McMullen (1996) finds that audit committees can be associated with reduced
incidence of errors, irregularities and some indicators of unreliable financial reporting.
Shareholders' litigation alleging management fraud, quarterly earnings restatements
and illegal acts are variables used to measure errors and irregularities. SEC actions and
auditor turnover involving an accounting disagreement are used to measure other
33

indicators of unreliable financial reporting. McMullen's evidence indicates that when
audit committees are in place, there is less incidence of intentional or unintentional
inappropriate accounting measurements, less incidence of intentional or unintentional
inadequate accounting disclosure, and less incidence of management fraud and illegal
acts. She contends that firms with reliable financial reporting are more likely to have
audit committees. When this is the case, it can be assumed that the existence of audit
committees can lessen the propensity to manipulate earnings.
The 1992 Arthur Andersen Survey of Audit Committees reported that despite the
absence of regulatory requirements, 48% of Australian firms had established an audit
committee. The Arthur Andersen Survey provides considerable evidence that those
companies with audit committees had stronger corporate governance mechanisms in
place. In general, the survey found that managers of companies with audit committees
were more frequently involved in evaluating the possibility of fraudulent or other
misleading financial reporting' l .
To sum up, research indicates that audit committees can mitigate management's
opportunistic behaviour in transferring wealth from shareholders/lenders. Therefore, it
can be predicted that firms with audit committees are less likely to manipulate earnings
than firms without audit committees. Income smoothing is a form of earnings
management. Hence, it is hypothesised that:
t In an Australian context, Baxter and Pragasam (1999) argue that it is difficult for users to assess the performance and effectiveness of an audit committee from annual reports since ASX listing rules only require disclosure of whether companies have audit committees. They do not require disclosure of additional information such as the audit committee's composition, rights, functions and numbers of yearly meetings.
34

Hl: Firms with audit committees are less likely to smooth earnings than firms
without audit committees.
3.4 External auditing
Several auditing guidelines relating to auditors' duties to detect and report fraud have
been promulgated by professional accounting bodies world-wide. In general, those
auditing standards require auditors to detect fraud. Auditors should plan and perform
their audits so as to have a reasonable expectation of detecting fraud or material mis-
statements resulting from fraud.
A survey of auditors reveals that there are several signs that auditors should be aware of
in attempting to detect fraud. Auditors cannot simply rely on complying with auditing
standards in their work because these official standards do not identify practices that
suggest the presence of fraud in financial reporting. The auditor must look for other
conditions or environments that are conducive to fraud. These signs include aggressive
reporting positions (Heiman-Hoffman et al., 1996).
Auditing mitigates information asymmetries that exist between management and
shareholders by allowing outsiders to verify the validity of financial statements. Firms
are subject to agency costs because of those information asymmetries. As such, it may
be efficient for contracts to reduce such information asymmetries by constraining
management's ability to manage earnings. Since accounting information is an outcome
of a management process in a firm, auditing is derived from a necessity to monitor and
arbitrate on the application of accounting methods. Boards of directors need auditing
35

because they have the function to oversee management actions, to provide advice and
to vote on behalf of the stockholders 12 (Anderson et al., 1993).
High quality auditors derive their reputation from being, or being perceived to be,
independent from management in reporting any detected irregularities and fraud
(Watts and Zimmerman, 1986). In line with this view of auditing quality, Thoman
(1996) argues that auditors can reduce their legal exposure by reporting more
conservatively on audited financial statements. Top tier auditors charge a premium for
their services, consistent with the arguments that (a) they require compensation for the
costs invested in acquiring their skills and reputation; and (b) that firms are prepared to
pay a premium for high quality monitoring of accounts (Craswell et al., 1995). Thoman
(1996) suggests that since auditors are more conservative, they cannot tolerate earnings
management, whether it be income increasing or income smoothing in its effect.
Big Six (currently Big 5 and previously Big 8) accounting firm designation is often
used to proxy audit quality. Palmrose (1988) suggests that the big accounting firms (the
Big Six) are less frequently sued than other audit firms because they provide higher
quality audits. Audit quality is defined as the probability that financial statements
contain no material omissions or mis-statements. Litigation against auditors generally
involves a process that starts from earliest detection of potentially false or misleading
financial statements, to filing of lawsuits. That process comes as a consequence of
audit failures.
12 Auditing is also derived from a demand by management for a mechanism to protect and to enhance its reputation because they want to ensure that the process production is consistent with management intentions and to reduce employees' frauds.
36

The litigation is costly because auditors must pay litigation costs and face other costs
such as sanctions from professional associations and regulators (e.g., ASC). Most
importantly, those costs can result in loss of reputation and future audit fees. Hence,
auditors have incentives to enhance their audit quality and also to reduce the risk of
reputation damage by issuing conservative opinions, for example. Therefore, Palmrose
(1988) concludes that high quality auditors that have a reputation for detecting and
correcting/revealing material omissions or mis-statements, have greater incentives to
minimise audit failures to maintain their reputation.
DeAngelo (1981) proposes that external parties use audit firm size as a surrogate for
audit quality. The probability of discovering a "breach" in the client's accounting
system partially depends on the auditor's technological capabilities, which are likely to
be better for a Big Six firm 13 . Drawing on Watts and Zimmerman (1981), DeAngelo
(1981) defines audit quality as the joint probability of detecting and reporting material
financial statement errors, which will depend partially on the auditor's independence.
Implicitly included in this definition is the auditor's ability to reduce earnings
manipulation (Becker et al., 1998). Becker et al. (1998) maintain that higher quality
audit firms have skilled professionals who can develop more effective tests for
detecting errors. Also, due to their greater independence and higher level of
professional scepticism, higher quality auditors are less willing to accept questionable
13 However, the probability of reporting a breach depends on an auditor's independence. Drawing on DeAngelo (1981), client-specific quasi-rents are expected to lower auditor independence because of the incentive "to cheat" to retain the client. However, the quasi-rents specific to other clients of a given auditor provide a disincentive "to cheat." These other quasi-rents act as a collateral bond against opportunistic behaviour because the auditor risks losing these other quasi-rents due to lower perceived audit quality. Since larger firms have a larger collateral bond, ceteris paribus, the larger the auditor the lower the incentive to cheat (Becker et al., 1998)
37

accounting methods, are less willing to accept changes in accounting estimates without
reasonable support, and are more likely to report errors and irregularities. Since high
quality auditors are proxied by Big Six auditor designation, Becker et al. (1998)
conclude that non-Big Six auditors allow more income increasing earnings
management, via discretionary accruals, than Big Six auditors.
Specifically, Becker et al. (1995) argue that managers of firms with large changes in
earnings before discretionary accruals choose discretionary accruals that smooth
income 14. They find that firms with non-Big Six auditors reported significantly greater
earnings manipulation in response to income smoothing incentives compared to firms
with Big Six auditors.
In summary, agency theory and empirical research indicate that there is a negative
association between the quality of auditors and earnings manipulation and it is
hypothesised that:
112: Firms with Top Tier Auditors are less likely to smooth earnings than firms
without Top Tier Auditors.
14 In their working paper, Becker et al. (1995) define income smoothing by. looking at the ratio of non-discretionary earnings minus total earnings in the prior year and whether the ratio was in the top or bottom ten percent of such ratio in its industry. They argue that firms have incentives to smooth earnings downward when the ratio is in the top ten percent of the industry ratio. On the other hand, firms have incentives to smooth earnings upward when the ratio is in the bottom ten percent of industry ratio. They used those criteria to detect the use of discretionary accruals for reducing the variance of reported earnings.
38

3.5 Relationship between Audit Committees and External Auditing
In their 1992 survey, Arthur Andersen found that companies with audit committees had
effective and productive relationships with external auditors. In general, the audit
committee met with external auditors to discuss the findings of the audit prior to the
board of directors signing the annual accounts. In contrast, in firms without audit
committees, the board met with external auditors less frequently. Furthermore, firms
with audit committees were more likely to have a program to ensure a meaningful
response by management to the external auditors' management letter (i.e., 92%),
compared to companies without audit committees (i.e., 58%). One benefit of audit
committees is to enhance communication between the external auditors and the board.
That communication is pivotal. Ernst and Young's (1990) survey reports some issues
that should be included: fraudulent or illegal acts, significant judgements and
accounting estimates made by management, and areas of disagreement with
management.
The ability and motivation of audit committees to serve as active and objective
intermediaries in audit conflicts has been questioned because audit committees often
fail to reduce management pressure on auditors when disputes arise during an audit
(Knapp, 1987). Knapp (1987) investigates factors such as background of audit
committee members, size of the audit firms, nature of conflict issues and the auditee's
financial condition. He finds that when the issue of a dispute is the subject of objective
technical standards (i.e., accounting and auditing matters), audit committee members
tend to support auditors rather than management. This is especially the case, where the
firm has a top tier auditor, or where the firm is in a weak financial position. Knapp
39

(1987) argues that there are several motivations for this finding. Firstly, audit
committees are more likely to be hesitant to engage actively and objectively in the
corporate oversight role because they do not have expertise to evaluate technical issues.
As such, they are more likely to agree with auditors. Secondly, audit committees
generally support top tier auditors more than non top tier auditors since top tier auditors
have capability to absorb a greater portion of potential litigation losses than non top tier
auditors. As a consequence, audit committee members can constrain their potential
litigation losses to a greater degree when the auditor is a top tier auditor. Finally, firms
in weak financial positions provide increased legal exposure of directors. This creates
incentives for audit committee members to support the auditor in an audit conflict and
it shows audit committee members have fulfilled their fiduciary responsibility.
Income-increasing procedures are likely to be issues that create disagreement between
management and auditors (see DeFond and Jiambalvo, 1993). DeFond and Jiambalvo
(1993) find that firms in which there is a disagreement are more likely to violate debt
covenants, have higher leverage, experience a decline in earnings and have big eight
auditors than firms with no such disagreement. However, no study to date has
examined the incidence of auditor/management conflict in relation to income
smoothing.
In summary, effective interaction between audit committee members and auditors can
enhance the oversight of management. Audit committee members tend to support
auditors when disagreement between auditors and management occurs in aggressive
earnings management. To the extent that income smoothing is a form of earnings
40

management that distorts the reported financial performance of and position of the
firm, a similar response is likely if management smooth reported earnings. Based on
the discussion above, it can be hypothesised that:
113: Firms with both audit committees and top tier auditors are less likely to
smooth earnings than firms without both audit committees and top tier auditors.
3.6 Corporate Governance: Audit committee and auditing regulations
Audit committees are compulsory for listed companies in the US but not in Australia.
The New York Stock Exchange (NYSE) requires that domestic companies should have
an audit committee comprising only directors independent of management and free
from any relationship that would conflict with the exercise of independent judgement
as committee members. However, the NYSE does not have a disclosure-based rule for
corporate governance practices. In contrast, the Australian Stock Exchange (ASX)
requires listed companies to state in their six monthly announcements whether a
formally constituted audit committee is established. Therefore, listed companies
should report in their annual reports whether they have an audit committee and, if they
do not, provide a statement explaining why. This indicates that the regulatory body in
the US is stricter than in Australia in regards to requirements to form audit committees,
even though Australian firms are strongly encouraged to have them.
Internationally, the development of auditors' duties in relation to fraud have been
affected by criticisms that many litigation cases are due to audit failure to detect fraud.
In 1974, the AICPA established the Commission on Auditors' Responsibilities (the
41

Cohen Commission) to investigate auditors' responsibility to detect fraud. The
commission recommended that "an audit should be designed to provide reasonable
assurance that financial statements are not affected by material fraud". In 1986 the
National Commission on Fraudulent Financial Reporting (the Treadway Commission)
was established in the US. The commission stated that auditors must play their full role
in detecting fraud. They recommended that auditing standards be changed to require
auditors to take affirmative steps to assess the potential for fraudulent financial
reporting and to design tests to provide reasonable assurance of detection. Porter (1994)
conjectures that criticism of auditors involves auditors' role in detecting and reporting
illegal acts and other audit expectation-performance gap issues 15 . In Australia though,
Porter presumes that the auditor regulatory body has reluctantly acknowledged the
duties imposed on auditors by statute and does not encourage auditors to go beyond the
minimum legal requirements, hence, the somewhat defensive tone of AUP 16. AUP 16
para 31 states that "the auditor should normally regard the duty of confidentiality to the
entity as preventing the reporting of any matters concerning the entity's affairs to a
third party... ". Arguably, corporate fraud did not emerge as a matter of significant
public concern until the late 1980s and the profession has not yet fully responded. Also,
in general, Australian auditors have met less public and political pressure to extend
their duties in this regard than have US auditors.
15 The audit expectation gap is defined as the gap between the public's expectations of auditors and auditors' perceived performance. There are two components of the gap. Firstly, a gap between what the public expects auditors to achieve and what they can reasonably be expected to accomplish. Secondly, a gap between what the public can reasonably expect auditors to accomplish and what they are perceived to achieve from the law and professional promulgation (Porter, 1991).
42

Tomasic and Bottomley (1993) mention that the auditing profession in Australia has
long held the view that management has the role of detecting financial fraud, and that
detection of fraud by auditors is secondary to their primary duty of reporting whether
the accounts are true or fair. The Statement of Auditing Standards, AUS 1 para 7 states
that
While the auditor is responsible for forming and expressing an opinion on the financial information, the responsibility for its preparation lies with the management of the entity... (and) the audit of the financial information does not relieve management of its responsibilities.
Moreover, there is no statutory obligation for the auditor to report fraud where the
auditor believes that the financial statements give a true and fair view of the accounts
of the company [Corporations Law s332(10)].
Porter (1994) explicitly identifies differences between . Australian and US auditing
regulations relating to detection of fraud since 1986. In Australia, the requirements
have been promulgated in the Statement of Auditing Practice (AUP) 16, "The
Auditor's Responsibility for Detecting and Reporting Irregularities Including Fraud,
Other Illegal Acts and Error", (AARF, 1993) 16, whereas in the US, they are
promulgated in Statement of Auditing Standards (SAS) No.53, "The Auditor's
Responsibility to Detect and Report Errors and Irregularities" (AICPA, 1988) 17 . AUP
16 states in paragraph 12 that primary responsibility for detecting fraud rests with the
management/governing body, but SAS No.53 does not mention this explicitly. SAS
No.53 para 28 also requires auditors to inform the audit committee or board of
16 This statement is now superseded by Statement of Auditing Standards (AUSs) 210, "Irregularities, Including Fraud, Other Illegal Acts and Errors", but it has the same emphasis. t7 It is replaced by SAS No.82, which has similar requirements (see Eining et al., 1997).
43

directors when suspected fraud is encountered. However, Porter notes the somewhat
defensive statement mentioned earlier, included in AUS 16 para 13, to the effect that
auditors have no responsibility in relation to irregularities which do not have a material
effect on the financial report.
Such a statement is not included in SAS No.53 which requires auditors to plan and
conduct their audits to reasonably detect irregularities, which have a material effect on
the financial report. Porter (1994) argues that it seems that in the US auditors have
accepted a more significant responsibility for detecting fraud.
To sum up, it is not mandatory for firms to form audit committees in Australia,
compared to a mandatory requirement in the US. In terms of auditing regulations, the
auditors' responsibility to detect fraud appears to be more significant for auditors in the
US, than for auditors in Australia. This implies that Australian managers can have more
opportunity to manage earnings than US managers. It can also be assumed that auditors
face a more litigious environment in the US than in Australia. As a consequence, there
is more onus on auditors in the US to detect misstatement and irregularities. This can
mitigate management incentives to manage earnings. In the context of income
smoothing it is predicted that:
114: The incidence of income smoothing is higher for firms originating from
Australia than for firms originating from the US.
44

3.7 Conclusion
To conclude this chapter; agency costs that arise from contractual relationships,
combined with information asymmetry, lead to a demand for investment in control and
monitoring mechanisms. Audit committees and external auditing are elements in
corporate governance. The presence of audit committees and top tier auditor
designation, are predicted to be associated negatively, both individually and in
combination, with the opportunity for Australian managers to smooth earnings. The
governance practices within the US and Australia developed under different
circumstances, create differences in the focus of the respective systems. Since it is
arguable that the regulatory body in the US is stricter than in Australia in regards to the
requirement to form audit committees and to detect fraud, Australian managers appear
to be more likely to be involved in income smoothing than US managers. The
following chapter describes the research design used to test these hypotheses.
45

Chapter 4: Method
4.1 Introduction
The objective of this chapter is to describe the methods and measurements employed to
test the hypotheses developed in the previous chapter. The chapter comprises four
sections. The sample selection section describes criteria used to select firms from the
COMPUSTAT and Connect4 databases. Section 4.3 explains why discretionary
accruals are appropriate to capture earnings management and how they are measured.
Income smoothing measurement is described in section 4.4, and the last section in this
chapter explains the research design. The logistic multivariate regression models are
defined and the independent variables are explained.
4.2 Sample selection
The sample is chosen from firms contained in the 1998 COMPUSTAT Industrial Files
and Connect4 databases. The sample includes companies with COMPUSTAT data
available for each of the fiscal years ending in 1992 through to 1995. The firms listed
on the database are supplemented with firms with similar data listed on Connect4. The
sample years of 1992-1995 are employed as a means of capturing the effectiveness of
auditing and audit committee regulations in Australia. In March 1993, the AuSB
revised AUP 16 and on 1 July 1995, the ASX introduced disclosures of corporate
governance practices.
The study employs an industry cross-sectional research design. Candidates for
inclusion in the sample are required to have financial statement data available on
46

COMPUSTAT industrial files for 1992 to 1995. They are also required to have a
minimum of ten firms (with available financial statement data) in the two digit ASX
industry group. The use of a two-digit ASX code reflects a trade-off between narrowly
defining industry groupings to capture industry specific effects versus having enough
firms in each industry grouping to obtain statistically meaningful estimates of non-
discretionary accruals in equation (1a) in section 4.3 (Dechow et al., 1995). Identical
criteria are applied to the US sample firms, which are matched with the Australian
firms, based on SIC-ASX equivalent industry classification. Financial institutions are
deleted because discretionary accruals estimation is problematic for these firms 18 .
Firms are eliminated due to missing data that are needed to measure accruals. Firms are
also excluded because of extreme values. This selection process yields a full sample of
2402 firm-year observations (948 firms) with sufficient data to measure discretionary
accruals and the variables required for the multivariate analysis. There are 335
Australian firm years (147 firms) and 2067 US firm years (801 firms). Tablel
summarises the sample and its industry breakdown 19 .
18 Financial institutions have different financial structures and regulations compared to non-financial institutions. 19 In terms of the US sample, firms are selected from SP500 and NASDAQ.
47

Table 1 Sample Selection
Aus data US data *)
Firm-years (1992-1995) for firms with non-missing accruals data 411 2121 1993-1995 and excluding financial institutions
Less Industry-year combination with < 10 observations 76 Less Extreme value of reported earnings before taxes 0 54
Final sample (firm-years) 335 2067
*) The sample consists of industries with SIC Classification similar to ASX Industry Classification of the Australian sample. The initial number before excluding industries, which are not equivalent to ASX Industry Classification is 8872 firm-years in 43 industries (3447 firms).
Industry representation of firms in sample
Australian data Firm-years US data Firm-years
- Gold 73 - Metal mining 125 - Other metals 42 - Oil and Gas extraction 313 - Oil & Gas 38 - Constructions 35 - Dev & Contr 34 - Food & Kindred products 262 - Building materials 32 - Apparel 89 - Food & Household 48 - Printing, Publishing & Allied 127 - Engineering 11 - Primary metal industries 116 - Retail 33 - Fabr Metal 135 - Media 24 - Communications 246
- Wholesale - durable goods 339 - Wholesale - non durable goods 134 - Retailer 23 - General merchandise stores 67 - Food stores 56
Total 335 Total 2067 Number of firms 147 Number of firms 801
In terms of selecting Australian firms, this study employs the ASX code rather than the
SIC code in order to mitigate the possibilities that Australian firms are classified
wrongly in non-Australian databases. For example, investment services are not
classified as financial institutions in the SIC coding. Miscellaneous and diversified
industries are excluded from the sample to obtain similar characteristics in each
industry as much as possible for both sub samples.
48

4.3 Estimation of discretionary accruals
The literature uses several models for estimating discretionary accruals. Dechow, Sloan
and Sweeney (1995) evaluate several commonly used accrual-based models for
detecting earnings management, including techniques used in Healy (1985), DeAngelo
(1986) and several variations of the Jones (1991) model (or modified Jones (1995)
model). They conclude from their evaluation that the modified Jones (1995) model
appears well-specified in a random sample of firms.
The Jones (1991) time series approach to discretionary accruals measurement requires
a substantial time series of data as well as a stationarity assumption20 . Hence, it
introduces survivorship bias. As a means of mitigating this problem, Young (1998)
employs a cross sectional version (modified) of the Jones (1991) model. Young also
mentions that an additional benefit of this approach is that it does not need the
assumption of a stationary association between non-discretionary accruals and the
explanatory variables through time. Discretionary accruals are measured in this study
using the cross-sectional modified Jones (1995) accruals estimation model reported in
Subramanyam (1996). This technique estimates "normal" accruals as a function of the
change in revenues and the level of property, plant and equipment. These variables
control for changes in accruals that are due to changes in the firm's economic condition
and treat those accruals as "normal" or non-discretionary, as opposed to accruals
manipulation. The change in revenue is included because changes in working capital
accounts, part of total accruals, depend on changes in revenue. Property, plant and
equipment is used to control for the portion of total accruals related to nondiscretionary
49
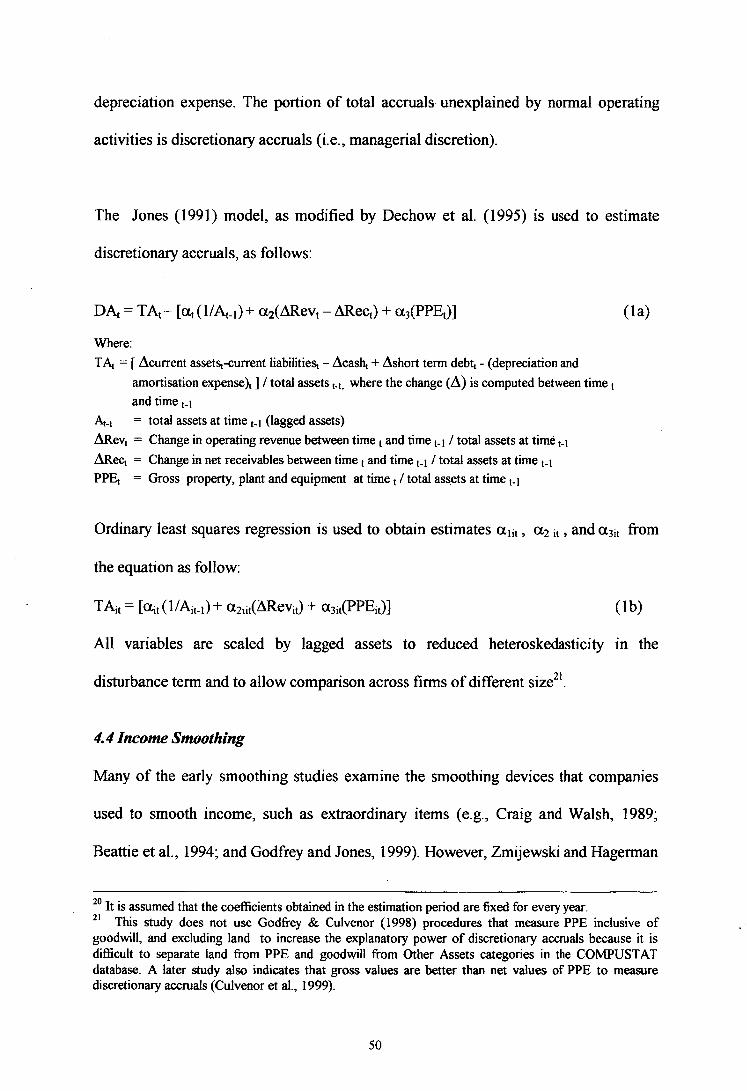
depreciation expense. The portion of total accruals unexplained by normal operating
activities is discretionary accruals (i.e., managerial discretion).
The Jones (1991) model, as modified by Dechow et al. (1995) is used to estimate
discretionary accruals, as follows:
DA t = TAX — [at ( 1A-i)+ a2(ARevt — ARec) ± ()LOPE)]
(la)
Where: TA, = [ Acurrent assetsrcurrent liabilities, — Acash, + Ashort term debt, - (depreciation and
amortisation expense), ] / total assets ,_,, where the change (A) is computed between time , and time
At-i = total assets at time ,_, (lagged assets) ARev, = Change in operating revenue between time ,and time ,_, / total assets at time ,_, ARec, = Change in net receivables between time , and time ti / total assets at time ,_, PPE, = Gross property, plant and equipment at time , / total assets at time ,_,
Ordinary least squares regression is used to obtain estimates alit a2it , and a m from
the equation as follow:
TAit = [ait (1/Ai1_ 1 )+ aztit(ARevi) a3i1(PPEi)] ( 1 b)
All variables are scaled by lagged assets to reduced heteroskedasticity in the
disturbance term and to allow comparison across firms of different size21 .
4.4 Income Smoothing
Many of the early smoothing studies examine the smoothing devices that companies
used to smooth income, such as extraordinary items (e.g., Craig and Walsh, 1989;
Beattie et al., 1994; and Godfrey and Jones, 1999). However, Zmijewski and Hagerman
20 i It s assumed that the coefficients obtained in the estimation period are fixed for every year. 21 This study does not use Godfrey & Culvenor (1998) procedures that measure PPE inclusive of goodwill, and excluding land to increase the explanatory power of discretionary accruals because it is difficult to separate land from PPE and goodwill from Other Assets categories in the COMPUSTAT database. A later study also indicates that gross values are better than net values of PPE to measure discretionary accruals (Culvenor et al., 1999).
50

(1981) suggest that the election of accounting procedures is not exercised
independently. Rather, management considers the overall effect of all accounting
procedures on income. This can be achieved through a range of decisions that affect
accruals. Contemporary studies have therefore used accruals based measures of
accounting discretion as a means of improving the specification of the managements'
reporting decisions (see Wardfield, 1995; Young, 1998).
Managers who engage in income smoothing use discretionary accruals to reduce the
volatility of reported earnings around target earnings over time. This involves reducing
the difference between actual operating profit before taxes and targeted operating profit
before taxes, using discretionary accruals. To measure income smoothing, NDE (non-
discretionary earnings) is measured using the industry based cross-sectional version of
the Jones model scaled by total assets, and a smoothing proxy, "Smooth_l" is
calculated as follows:
Smooth_l = 1 if I TargetY tt - Yit I TargetYit - NDE/t ;
Otherwise, Smooth_l =0
Where: TargetY„ = Target earnings it = median earnings for industry t / total assets t-i NDEt = Yt - Dat Da = discretionary accruals / total assets at time t-i NDEt = earnings before discretionary accruals / total assets at time
(pre-managed earnings) Yt = operating profit before tax / total assets at time t_ t (reported earnings)
Figure 1 illustrates how managers move earnings in the direction to get closer to their
assessment of target earnings. Assume that Y t* represents the target earnings level in
year t. Firms smooth earnings when reported earnings exceed target earnings by less
51

than the excess of pre-managed earnings over target earnings. Graphically, in t 1 , it is
represented that lao — a l l is less than lao — a21. In t2 , it is represented that lb° — 1) 1 1 is less
than lbo — b2 1. The use of absolute values is assumed because the measurement focuses
on the fluctuation around earnings targets rather than the direction of earnings
management to get closer to target earnings. However, it should be noted that since
target earnings are measured by using the median of reported earnings in t-1,
smoothing becomes sensitive to the changes in the macro economic growth in certain
industries.
Figure 1: Income smoothing: I Target)(it - Y1 I < I TargetYit - NDEit I
Accruals
b1
bo az
b2
ao
al
Target Earnings
t i
Notes: Yi: actual reported earnings for year ,, N,: pre-managed earnings for year t (i.e., computed as YrDa,, Da,: discretionary accruals for year t, and Y'' : previous year median industry earnings.
Time
52

4.5 Research design and measurements
Logit regression is used to test the hypotheses. The logit model can be considered to be
more powerful than OLS when modelling dichotomous data. The general form of the
categorical response model in logit form that is employed in this thesis is as follows:
Pi = P(fi, Xi ) + st with Efed = 0
The logistic regression model assumes that E t follows a log normal distribution. Hence
Pi (i.e., the probability of a firm being classified as a smoother) is a function of:
Ln [Pi / (I - P)]
which can be written as: -
Logit (P) = a+ ,4)
with X being a vector of explanatory variables representing the unknown parameters
estimated from the data. The significance of the model is tested using the -2 log-
likelihood ratio, distributed as a chi-square with k-1 degree of freedom, with k equal to
the number of independent variables.
Firm classification is regressed on a series of independent variables reflecting whether
the firms have audit committees, use top tier auditors, or have Australian or US listing.
Additional variables are incorporated to control for additional smoothing incentives
related to leverage, firm size and growth. The coefficients in the following regression
model are estimated, with predicted signs indicating the expected direction of the
coefficients.
53

The multivariate analysis regression models are as follows:
SMOOTHJ ft = a + flotCti + NAUD t, + 133SIZE ft + fi4LEVft+ 13 5INDft + (361STATIONft + 117GR0WTHft + eh (-) (-) (+) CO (-1-) (+) (-)
SMOOTH 1 ft = a + OISIZE it + 112LEVet+ 03114Dt t + (NATION it + fl5GROWT1 It + f36(ACft a AUDIO + get (+) (+) (+) (+) (-) (-)
SMOOTH_l u = a + 13 1ACk + 112AU1) it + fi3SIZEft + 114LEVit+ 1351ND It + f36NATION + ii7(AC ft a AUDft) + (-) (-) (+) (+) (+) (+) (-)
fisOROWTHft + en (4) (-)
Equation (2) is used to test H1, H2, and H4, equation (3) is employed to test H3 and
H4. Equation (4) is employed to test H1, H2, H3 and H4 simultaneously.
The definition for each variable is as follows:
SMOOTH I
Smooth_l, the dependent variable, indicates the probability of a firm being an income
smoother. It is a zero (0) or one (1) categorical variable with the value equal to one (1)
if the firm is identified as an income smoother. A firm is classified as an income
smoother if ITargetY-YI is less than ITargetY-NDEI; and 0, otherwise.
AUDIT COMMITTEE (AC)
A dummy variable is coded 1 if the board of directors has an audit committee, 0,
otherwise. Negative sign of the coefficient is expected to capture audit committees'
roles in reducing income smoothing.
54

TOP TIER AUDITOR (AUD)
The most common proxy for audit quality in empirical studies is a dummy variable for
Big Six/non-Big Six membership (currently Big Five, previously Big Eight) - a top tier
auditor (Palmrose, 1988; DeFond and Jiambalvo, 1991) and results are fairly consistent
in support of this measure. The variable is coded 1 if the firm is audited by a top tier
auditor, 0 otherwise. A negative sign is expected.
LEVERAGE (LEV)
In the extant literature leverage is frequently used as a proxy for closeness to debt
covenants and is associated with the presence and tightness of those covenants (see
Press and Weintrop, 1990). Corporate lending contracts often contain accounting-based
covenants. A covenant is a provision, such as a limitation on the payment of dividends,
which restricts the firm from engaging in specified actions after the bonds are sold.
Debt covenants are either affirmative or negative covenants. Affirmative covenants
require borrowing firms to maintain specific levels of accounting-based numbers (e.g.,
minimum working capital and interest coverage). Negative covenants restrict the
financing and investing activities of borrowing firms (e.g., dividend payments and
issuance of new debt).
Dechow et al. (1996) find that there is an association between avoiding debt covenant
restrictions and motivations for earnings manipulation. A covenant that becomes
restrictive imposes costs on firms. Managers have incentives to choose accounting
procedures that reduce the probability of a breach (Watts and Zimmerman, 1986). Such
procedures can increase assets, reduce liabilities, increase revenue, and decrease
55

expense (ie non-conservative procedures) if they are close to covenant violation.
Hence, it has been predicted that the larger a firm's debt/equity ratio (leverage ratio),
the more likely the firm's manager is to select accounting procedures that shift reported
earnings from future periods to the current period. The closer a firm is to a particular
restrictive accounting based covenant, the more likely the manager is to use procedures
that increase current earnings. However, the application of an aggressive policy may
arouse auditor concerns because it violates the accounting principle of conservatism.
Also, in a multi-period context, managers may prefer to smooth income if their firms
have high debt. This enables them to draw upon "reserve" earnings to boost assets and
reduce leverage in future periods.
In this study, leverage is measured as total debt scaled by total assets. A positive sign is
predicted since there is a trade off between managers' efforts to choose income-
increasing discretionary accruals when the leverage ratio is high, and auditors' efforts
to constrain earnings management.
FIRM SIZE (SIZE)
Regardless of whether they have audit committees, firms' propensity to smooth may
vary with firm size. Davidson (1984) reported that of the largest 56 companies that
owned assets greater than $201 million, 46 percent had audit committees. Of
companies with less than $201 million in assets, only 20 percent had audit committees.
He concluded that the larger the company, the more likely that it would have an audit
committee. In the 1992 survey conducted by Arthur Andersen, larger companies which
56

had an annual turnover of more than $100 million, were significantly more likely than
other companies to have established an audit committee (p<0.01).
Pincus et al. (1989) argue that the existence of economies of scale associated with audit
committee formation and operation implies that the net benefit of audit committee
formation increases with firm size. This leads to an expected positive relation between
firm size and use of audit committees. Small firms may not form an audit committee
in particular circumstances since they may have other options for handling corporate
governance matters, such as through the full board of directors. In addition, small
firms may not find it economically feasible to finance audit committees. Therefore,
forming and maintaining an audit committee would be more cost effective for larger
firms. Consistent with this argument, Defond and Jiambalvo (1991) use firm size to
proxy for the strength of the firms' internal controls. The above arguments, in
combination with hypothesis 141, imply that large firms are less likely to smooth
income than small firms.
However, the political cost hypothesis provides a contrary argument. Size is often used
as a proxy for political attention (Watts and Zimmerman, 1986). The underlying reason
is that it is costly to find information about whether accounting numbers (e.g.,
earnings) reflect monopoly benefits and to then reach agreement with others in the
political process to legislate laws and regulations that increase their welfare (Watts and
Zimmerman, 1990). Since information and monitoring are costly to obtain and process,
rational political players will focus on readily available and verifiable information,
such as large firms' high reported earnings, to provide evidence of monopoly rents or
57

to indicate that industry protection is no longer necessary. In turn, this creates
incentives for managers of large firms to apply discretion over accounting profits (i.e.,
earnings management) used in the political process. Firms with high political costs
exposures have been found to engage in income smoothing more than other firms
(Godfrey and Jones, 1999). Managers, lenders and shareholders, alike, have similar
interests in avoiding government intervention (e.g., abolishing tariff barriers) and
public scrutiny. Hence, in contrast to hypothesis H1, it is expected that the incidence of
income smoothing is greater in larger firms than in small firms.
Size is defined as the natural log of total assets. It is predicted that there is a positive
relation between firm size and smoothing since large firms are more likely to be
exposed to high political costs, and to use accounting techniques to smooth income.
The political cost hypothesis predicts that firms will use income-reducing techniques.
However, in a multi-period context, managers are likely to be concerned about the
political attention attracted by volatile earnings as well as by high levels of
earnings (Godfrey and Jones, 1999).
INDUSTRY (IND)
Industry (ND) is used as a control for differential earnings management, which can
occur in different industries (Beattie et al., 1994). It is calculated using a dummy
variable, 1 for the mining industry and 0 for the non-mining industry classification. The
purpose of this variable is to control the effects of the set of accounting methods, which
varies between industrial and several mining industries because the sample firms are
drawn from several industries (Watt and Zimmerman, 1990). For example, accounting
58

for pre-production costs and mineral reserves differs considerably from retail firms'
methods of accounting for inventories (Culvenor et al., 1998).
GROWTH
Growth is measured as current year operating profits minus prior year operating profits,
scaled by total assets. Total assets form the denominator because research on earnings
management has shown that management compensation is usually linked to some
earnings based performance measure. The results of Healy's (1985) study suggest that
managers may have incentives to increase earnings to reach a "target" level of earnings
growth. Meanwhile Defond and Jiambalvo (1991, 1993) find that companies that
restate annual earnings have lower growth in earnings than companies without earnings
corrections. In line with this, firms in a weak financial position are more likely to look
for ways to increase earnings and thus may override controls (McMullen, 1996). The
purpose of using this variable is to proxy other incentives to manage reported earnings.
NATION
Nation is a variable that takes the value 1 for firms listed on the Australian Stock
Exchange but not on the US stock exchange, and 0 for all firms listed on the US
exchange. A nationality variable is employed for other studies of international
differences in income smoothing (Ashari et al., 1994 and Langendijk and Van Praag,
1996). A positive sign is expected to support the hypothesis that Australian firms are
more likely to smooth earnings than US firms.
59

AC_AUD
AC AUD is a variable that depicts the interaction of audit committees with a top tier
auditor in constraining smoothing behaviour. The variable is coded 1 if firms have both
audit committees and top tier auditors; 0 otherwise. A negative sign is expected to
reflect the high level of ability of audit committees in monitoring and overseeing
management activities when in conjunction with top tier external auditing.
4.6 Conclusion
This chapter describes the research design employed to test the hypotheses developed
in Chapter 3. The following chapter reports the results.
60

Chapter 5: Analysis of results
5.1 Introduction
The results are reported in this chapter. The descriptive statistics, univariate tests and
logit analyses are summarised in section 5.2. In section 53, the results are discussed
and analysed. The following sections explain the sensitivity analysis used to verify the
robustness of the results, and section 5.6 concludes the chapter.
5.2 Results
The descriptive statistics of the observations are presented in Panel A Table 2. In terms
of accrual variables, there are some differences and variances between the national sub
samples. Average reported earnings (Y) are 1.26% of the lagged total assets. Average
total accruals are negative, while mean and median discretionary accruals (Da) are
close to zero. The standard deviation of reported earnings (Y) is less than reported for
the pre-managed earnings variable (NDE), suggesting that the accrual process in this
study smooths reported earnings. The mean and [median] pre-managed earnings of
Australian firms are higher than those for US firms (i.e., 0.0673 and [0.0751]; and
0.0023 and [0.0336] respectively). The standard deviation of reported earnings of
Australian firms (i.e., 0 -.1318) is less than that reported for pre-managed earnings (i.e.,
0.1907), suggesting that the accrual process smooths reported earnings. Similarly, in
the US data, the standard deviation of reported earnings (i.e., 0.2740) is less than that
reported for pre-managed earnings (i.e., 0.3284).
61

Table 2 Panel A: Descriptive statistics used to calculate discretionary accruals and other variables in the period between 1993 - 1995
Mean Median SD Skew Min Percent 25 Percent 75 Max
Pooled sample
Total Accruals -0.0255 -0.0390 02417 -0.7858 -3.4537 -0.0984 0.0234 1.8093 cg(Rev -Rec) 0.2070 0.0783 0.6164 4.2943 -3.8596 -0.0082 0.3001 9.4264 PPE 0.8471 0.6460 1.1884 8.4453 0.0000 0.3054 1.0491 23.1591 DA 0.0013 -0.0057 0.2111 0.5983 -2.3047 -0.0687 0.0537 2.5284 NDE 0.0113 0.0411 0.3136 2.9606 -2.5624 -0.0810 0.1438 6.5668 Y 0.0126 0.0458 0.2597 6.0340 -0.9996 -0.0656 0.1270 6.5385
Aus sample
Total Accruals -0.0478 -0.0458 0.1716 0.5721 -0.9777 -0.1062 0.0054 0.8493 cg(Rev -Rec) 0.1264 0.0468 0.4398 3.4256 -1.2283 -0.0144 0.1690 3.3181 PPE 0.7743 0.7112 0.5593 2.3999 0.0031 0.4248 1.0181 4.5298 DA -0.0010 0.0022 0.1360 1.7365 -0.4836 -0.0517 0.0431 0.9774 NDE 0.0673 0.0751 0.1907 -1.2599 -1.1266 -0.0017 0.1582 0.8754 Y 0.0663 0.0758 0.1318 -0.9743 -0.6463 0.0292 0.1283 0.6580
US sample
Total Accruals -0.0219 -0.0379 0.2511 -0.8671 -3.4537 -0.0971 0.0274 1.8093 cg(Rev -Rec) 0.2201 0.0846 0.6396 4.2568 -3.8596 -0.0067 0.3220 9.4264 PPE 0.8588 0.6374 1.2609 8.1631 0.0000 0.2821 1.0620 23.1591 DA 0.0017 -0.0076 0.2209 0.5385 -2.3047 -0.0716 0.0582 2.5284 NDE 0.0023 0.0336 0.3284 3.0915 -2.5624 -0.0951 0.1411 6.5668 Y 0.0039 0.0375 0.2740 6.0664 -0.9996 -0.0795 0.1266 6.5385
Total Accruals = [ Acurrent assets -current liabilitiest - Acash t + Ashort term debt - (depreciation and amortisation expense) t I / total assets t_t , where the change (A) is computed between lime t and time t.I.
ARev = Change in operating revenue between time s and time t.,/ total assets at time ARec = Change in net receivables between time t and time t., / total assets at time PPE = Gross property, plant and equipment at time t / total assets at time t., NDE = Y - Da Da = discretionary accruals / total assets at time t-I NDE = earnings before discretionary accruals / total assets at time t_,
= operating profit before tax / total assets at time
62

Table 2 Panel B: Descriptive statistics of dependent and independent variables in the period between 1993 - 1995
Mean Median SD Skew Min Percentile Percentile 25 75
Max
Pooled sample SMOOTH_1 0.5745 1.0000 0.4945 -0.3016 0.0000 0.0000 1.0000 1.0000 SMOOTH_2 8.1383 0.9175 282.5763 48.7370 0.0007 0.5244 1.3392 13825.1581 G ROWTH1 0.0614 0.0105 0.2351 13.6565 0.0000 0.0000 0.0498 5.4301 SIZE 4.8119 4.7442 0.9875 0.4417 2.0645 4.0956 5.3774 7.9488 AUD COMM 0.9742 1.0000 0.1587 -5.9800 0.0000 1.0000 1.0000 1.0000 AUD 0.7398 1.0000 0.4388 -1.0938 0.0000 0.0000 1.0000 1.0000 IND 0.2460 0.0000 0.4308 1.1800 0.0000 0.0000 0.0000 1.0000 AC_AUD 0.7132 1.0000 0.4524 -0.9432 0.0000 0.0000 1.0000 1.0000 LEVI 0.4608 0.4823 0.2370 -0.1102 0.0000 0.2881 0.6372 0.9974
Aus sample SMOOTH_1 0.6179 1.0000 0.4866 -0.4875 0.0000 0.0000 1.0000 1.0000 SMOOTH_2 1.5153 0.8964 3.1882 8.0395 0.0011 0.4779 1.2712 41.3595 GROWTH 0.0509 0.0092 0.3153 15.4747 0.0000 0.0000 0.0363 5.4301 SIZE 5.3218 5.2310 0.8103 -0.2207 2.7202 4.8624 5.9082 7.4799 AUD COMM 0.7918 1.0000 0.4067 -1.4448 0.0000 1.0000 1.0000 1.0000 AUD 0.7433 1.0000 0.4375 -1.1189 0.0000 0.0000 1.0000 1.0000 IND . 0.4567 0.0000 0.4989 0.1746 0.0000 0.0000 1.0000 1.0000 AC_AUD 0.5522 1.0000 0.4980 -0.2111 0.0000 0.0000 1.0000 1.0000 LEV 0.4395 0.4684 0.1904 -0.2338 0.0111 0.3052 0.5721 0.9957
US sample SMOOTH_1 0.5675 1.0000 0.4955 -0.2726 0.0000 0.0000 1.0000 1.0000 SMOOTH_2 9.2117 0.9212 304.6095 45.2121 0.0007 . 0.5303 1.3528 13825.1581 GROWTH 0.0631 0.0106 0.2194 12.1637 0.0000 0.0000 0.0526 5.1751 SIZE 4.7292 4.6116 0.9890 0.5919 2.0645 4.0216 5.2819 7.9488 AUD COMM 1.0000 1.0000 0.0000 1.0000 1.0000 1.0000 1.0000 AUD 0.7392 1.0000 0.4392 -1.0906 0.0000 0.0000 1.0000 1.0000 IND 0.2119 0.0000 0.4088 1.4110 0.0000 0.0000 0.0000 1.0000 AC_AUD 0.7392 1.0000 0.4392 -1.0906 0.0000 0.0000 1.0000 1.0000 LEV 0.4769 0.4936 0.2342 -0.0842 0.0023 0.2975 0.6530 0.9974
Smooth_1 = 1 if I TargetY it - Y,t I < TargetY it - NDE it I; 0, otherwise. Smooth_2 = I TargetY,t - Y id / TargetYit - NDEit I Where:
NDE = Y - Da Da = discretionary accruals / total assets at time NDE = eamings before discretionary accruals / total assets at time
= operating profit before tax/ total assets at time TargetY,t = Target Eamings = Median earnings for industry 1/ total assets at time
AUD COMM : A dummy variable is coded 1 if there is an audit committee, 0, otherwise. AUD : A dummy variable is coded 1 if firm audited by top tier auditors, 0, otherwise. SIZE : Logi 0 of Total Assets LEV : Total Liabilities scaled by TotaLAssets IND : A dummy variable is coded 1 for mining firms, 0, otherwise. NATION : A dummy variable is coded 1 for Australian firms, 0, otherwise. AC_AUD : A dummy variable is coded 1 if firms have audit committees and top tier auditors, 0, otherwise. GROWTH : Current year's operating profits - prior year's operating profits scaled by total assets
63

Table 2 also includes explanatory and control variables described in previous chapters,
except for the presence of audit committees (AUD COMM) of US firms since it is
assumed that all US firms have audit committees. In panel B, the Australian sample is
dominated more by mining firms than is the US sample (IND=0.4567 and IND=0.2119,
respectively). Furthermore, the Australian firms are more likely to smooth earnings
than are the US firms. This is indicated by the higher mean of Smooth) and the lower
mean of Smooth_2 for Australian firms (i.e., 0.6179 and 1. 5153, compared with
0.5675 and 9.2117 for US firms). The standard deviations of those variables
(Smooth_l) for Australian firms are lower than the standard deviations of firms from
the US (i.e., 0.4866 and 0.4955 respectively). Since the continuous form of smoothing
index (SMOOTH_2) is highly skewed for both sub-samples, the binary code is used in
analysing the data.
Table 3 Correlation matrix (pooled sample) Variable AC_AUD GROWTH END LEV SWF AU!) AU!) COMM NATION
AC_AUD 1.000
GROWTH -0.049 1.000
END -0.127 0.099 1.000
LEV 0.197 -0.035 -0.345 1.000
SIZE 0.410 -0.191 -0.301 0.354 1.000
AUD 0.935 -0.036 -0.095 0.177 0.425 1.000
AUD COMM 0.265 -0.038 -0.059 0.057 -0.039 0.032 1.000
NATION -0.143 -0.018 0.197 -0.057 0.208 0.003 -0.433 1.000
AUD COMM : A dummy variable is coded 1 if there is an audit committee, 0, otherwise. AUD : A dummy variable is coded 1 if firm audited by top tier auditors, 0, otherwise. SIZE : Logi 0 of Total Assets LEV : Total Liabilities scaled by Total Assets IND : A dummy variable is coded 1 for mining firms, 0, otherwise. NATION : A dummy variable is coded 1 for Australian firms, 0, otherwise. AC_AUD : A dummy variable is coded 1 if firms have audit committees and top tier auditors, 0, otherwise. GROWTH : Current years operating profits - prior years operating profits scaled by total assets
64

The correlation matrix appears in Table 3. Top tier auditors (AUD) are highly
correlated with the variable called "interactions between audit committees and top
tier audit committees" (AC_AUD) as is to be expected, given that it forms part of the
measure. Large firms tend to use both top tier auditors and have audit committees
(Pearson correlation = 0.410). The correlation is also significant for SIZE and top tier
auditor designation, and for industry categorisation (i.e., mining and non-mining
firms), nationality, and size (p<0.01). Another high correlation occurs between SIZE
and leverage (Pearson correlation = 0.354).
To assess whether the independent variables differ significantly across smoothers and
non-smoothers, t-tests and Mann-Whitney U tests are performed. The results of these
univariate tests are summarised in Table 4.
65

Table 4 Descriptive Statistics and Univariate Results (Pooled Australian and US data):
Independent Variables and their association with Smoothing
Variable SMOOTH_1 N Mean SD t-test Mann-Whitney U t p (1-tailed) p (1-tailed)
AC_AUD 1 1380 0.705797 0.455849 -0.926355 0.177177 692984.00 0.177124 0 1022 0.723092 0.447690
NATION 1 1380 0.150000 0.357201 1.731884 0.041711 687723.00 0.041711 0 1022 0.125245 0.331158
IND 1 1380 0.257246 0.437275 1.481191 0.069343 686615.00 0.069327 0 1022 0.230920 0.421628
LEV 1 1336 0.475507 0.227995 0.958273 0.169013 630748.00 0.156897 0 968 0.466249 0230116
SIZE 1 1380 4.848392 0.963222 2.108892 0.017529 656801.50 0.001996 0 1022 4.762510 1.017749
AUD 1 1380 0.735507 0.441223 -0.557044 0.288774 698065.00 0.288721 0 1022 0.745597 0.435738
GROWTH 1 1380 0.057603 0.183163 -0.925445 0.177414 686505.00 0.125020 0 1022 0.066582 0.290891
AUD COMM 1 1354 0.972674 0.163093 -0.525108 0.299779 678699.00 0.299726 1006 0.976143 0.152679
AUD COMM : A dummy variable is coded 1 if there is an audit committee, 0, otherwise. AUD : A dummy variable is coded 1 if firm audited by top tier auditors, 0, otherwise. SIZE : Logi 0 of Total Assets LEV : Total Liabilities scaled by Total Assets IND : A dummy variable is coded 1 for mining firms, 0, otherwise. NATION : A dummy variable is coded 1 for Australian firms, 0, otherwise. AC_AUD : A dummy variable is coded 1 if firms have audit committees and top tier auditors, 0, otherwise. GROWTH : Current year's operating profits - prior year's operating profits scaled by total assets Smooth_1 : A dummy variable is coded 1 if smoother, 0, otherwise.
It can be seen that nationality and firm size are statistically significant in t tests of
their association with smoothing (p=0.042 and p=0.018, respectively). In Mann-
Whitney U tests, those variables and size are also significant (p=0.042, and p=0.002,
respectively). However, none of the other variables are significantly different across
smoothers and non-smoothers.
To investigate the results further in a multivariate context, logit analyses are performed.
The logit analyses are employed for each sub sample (Australia and US data) and also
in particular for a period in which it is believed that positive/negative macro economic
66

growth can affect the incidence of income smoothing (i.e., 1994). The results are
summarised in Table 5 and Table 6. Table 5 and 6 provide logit results using several
multivariate models. The first includes the main effects for the presence of an audit
committee and the use of a top tier external auditor, but not their interaction. The
second model includes their interaction and not their main effects. Table 5 Panel A also
reports the expanded model which includes both the main and interaction effects. The
predictive accuracy of the model ranges from around 58% to 64.50%.
67

Table 5 Panel A
Logit Analysis of explanatory variables associated with smoothing in the period between 1993 - 1995 Dependent variable: Smooth_1
AUD COMM AUD SIZE LEV IND NATION AC_AUD GROWTH Intercept Chi-Square p (2-tailed) Overall % Correctly
0.049400 -0.245900 0.129900 0.263000 0.256100 0.072500 -0.044000 -0.363900 14.653000 0.040700 58.20 (0.435650) (0.012750) (0.010150) (0.103800) (0.011650) (0.320200) (0.406950) (0.168550)
0.115300 0.245500 0.253900 0.047100 -0.197000 -0.053100 -0.272600 13.004000 0.043000 58.16 (0.018850) (0.116950) (0.011500) (0.364350) (0.032550) (0.387850) (0.135300)
0.340100 -0.637200 -0.180600 -0.732500 -0.119000 -5.848400 2.287900 15.573000 0.016200 64.44 (0.152950) (0.035650) (0.200700) (0.202450) (0.335250) (0.032700) (0.017100)
-0.172900 -0.491500 -0.147800 -0.106300 -2.811900 1.868100 8.674000 0.122800 63.08 (0.183400) (0.253200) (0.282250) (0.346650) (0.078350) (0.024000)
0.330700 -0.646100 -0.180900 -0.732300 -0.118600 0.012500 -5.848000 2.295300 15.573000 0.029300 64.44 (0.305750) (0.155300) (0.200850) (0.202550) (0.336100) (0.493300) (0.032650) (0.024500)
- -0.189200 0.152400 0.328500 0.338300 0.180500 -0.524600 14.459000 0.012900 58.06 - (0.053250) (0.004650) (0.063900) (0.003400) (0.219550) (0.023300)
Variable Prediction sign
Pooled data (n=2402) (1) B
p (1-tailed)
(2) B p (1-tailed)
Aus data (n=335)
(1)B p (1-tailed)
(2) B p (1-tailed)
(3) B p (1-tailed)
US data (n=2067) B p (1-tailed)
AUD COMM : A dummy variable is coded 1 if there is an audit committee, 0, otherwise. NATION : A dummy variable is coded 1 for Australian firms, 0, otherwise. AUD : A dummy var is coded 1 if firm audited by top tier auditors, 0, otherwise. AC_AUD : A dummy variable is coded 1 if firms have AC and top tier auditors, SIZE : Logi 0 of Total Assets 0, otherwise. LEV : Total Liabilities scaled by Total Assets GROWTH : Curr year's operating profits (op) - prior year's op scaled by tot assets IND : A dummy variable is coded 1 for mining firms, 0, otherwise. Smooth_1 : I if 'Target Y- YI < 'Target Y-NDEI, 0, otherwise.
68

Table 5
Panel B Logit Analysis of explanatory variables associated with smoothing in 1994
Dependent variable: Smooth_1
AUD COMM AUD SIZE LEV IND NATION AC_AUD GROWTH Intercept Chi-Square p (2-tailed) Overall % Correctly
0.391000 -0.147200 -0.047000 0.798400 0.190600 0.615200 -0.075900 -0.231000 10.813000 0.147000 58.23 (0.253200) (0.222550) (0.313300) (0.016000) (0.169150) (0.016050) (0.391050) (0.371900)
0.044100 0.750300 0.553700 0.192000 -0.331700 -0.126100 -0.094700 8.683000 0.192200 57.65 (0.324100) (0.022000) (0.003100) (0.222100) (0.040450) (0.323800) (0.413500)
0.149300 -1.519400 0.319000 0.198200 1.017300 -21.172200 0.268500 17.259000 0.008400 71.59 (0.414650) (0.027150) (0.251600) (0.458500) (0.049000) (0.002000) (0.457100)
0.382600 -0.372600 0.676200 -0.462400 -16.617700 -0.724000 11.020000 0.051000 68.69 (0.177800) (0.405600) (0.101400) (0.190250) (0.003050) (0.362500)
0.412600 -1.278400 0.317700 0.192700 1.009300 -0.335200 -21.270200 0.104500 17.301000 0.015600 71.59 (0.387550) (0.180000) (0.252550) (0.459600) (0.050900) (0.418250) (0.001950) (0.968000)
-0.020100 -0.095600 0.789900 0.130200 -0.045300 0.311300 4.744000 0.447900 55.84 (0.460600) (0.168450) (0.019350) (0.273550) (0.434650) (0.243900)
Variable Prediction sign
Pooled data (n=787)
(1)B
p (1-tailed)
(2) B p (1-tailed)
Aus data (n=101)
(1) B p (1-tailed)
(2) B p (1-tailed)
(3)B p (1-tailed)
US data (n=886)
p (1-tailed)
AUD COMM : A dummy variable is coded 1 if there is an audit committee, 0, otherwise. NATION : A dummy variable is coded 1 for Australian firms, 0, otherwise. AUD : A dummy var is coded 1 if firm audited by top tier auditors, 0, otherwise. AC_AUD : A dummy variable is coded 1 if firms have AC and top tier auditors, SIZE : Log10 of Total Assets 0, otherwise. LEV : Total Liabilities scaled by Total Assets GROWTH : Curr year's operating profits (op) - prior year's op scaled by tot assets IND : A dummy variable is coded 1 for mining firms, 0, otherwise. Smooth_1 : I if 'Target Y- VI < 'Target Y-NDEI, 0, otherwise.
69

Panel A in Table 5 illustrates that during 1993 - 1995, auditor quality is significantly
negatively associated with smoothing for Australian firms (p=0.0357) as predicted, and
the association is only marginally insignificant for US firms (p=0.0533). These results
suggest top tier auditors are more likely to mitigate management's opportunities to
smooth earnings, compared with non top tier auditors. For Australian firms, other
variables are not significant, except the growth ratio in one model only (p<0.05). In
contrast, US milling firms and US large firms are more likely to be smoother than US
non-mining or small firms (p<0.001).
Table 5 Panel A also reports that the interaction between audit committees and external
auditors (i.e., top tier auditors) is not significantly associated with the incidence of
smoothing for Australian firms. A pooled model is not reported because it would be
influenced by US firms which all have audit committees.
The third model in Table 5 Panel A for the Australian sample reports the results from
testing hypotheses H1, H2, H3, and H4 simultaneously. None of the key variables
(AUD COMM, AUD, AC_AUD, NATION) is significant in any of the models.
Young (1998) finds evidence that contrasting periods of economic performance in 1988
and 1991 affect income smoothing for industrial firms in the UK. To investigate
whether income smoothing is influenced by macro economic growth in 1994, a year of
economic growth, logistic analysis is also performed using data from 1994 only.
70

It can be seen in Panel B Table 5, for the pooled sample, that nationality is significant
at p<0.01 in the first model. This may indicate that economic growth in Australia gave
incentives for managers to smooth earnings. For Australian firms, auditor quality and
industry categorisation are statistically significant (p< 0.05). Audit committees are
insignificant both for the pooled sample and the Australian sample. Only leverage is
significant for the US sample. The overall hold-out accuracy rate for the Australian
sample is improved from previous models in panel A (i.e., 71.59% & 68.69%,
compared with 64.441% & 63.08%). In contrast, the logistic regression results using
US data are not significant.
The results indicate that income smoothing may be affected by macro economic
conditions in certain periods and may vary across industry. In Table 5 Panel A using
1993-1995 data, industry classification coefficient is significant and positive as
expected, but this occurs for the pooled sample and the US sample only. However,
when the analysis was conducted using 1994 data (Panel B Table 5), it is only for
Australian firms that there are any significant results. In the first and third models,
Australian firms that smooth earnings in 1994 are more likely come from the mining
industry (p<0.05) and to have negative growth during 1994 (p<0.01).
Table 6 reports logistic regression models within different industry samples: mining
and non-mining industries using the pooled sample. In the non-mining sample (Panel
A), only control variables (SIZE, LEV, GROWTH) are significant at p<0.05.
Approximately 58% of firms are correctly classified according to whether they smooth
income. For the mining sample, top tier designation of external auditors is negatively
71

associated with smoothing (Panel B) as is the combination of top tier external auditor
and use of an audit committee (p<0.05). Approximately 61% of firms are correctly
classified according to whether they smooth income.
72
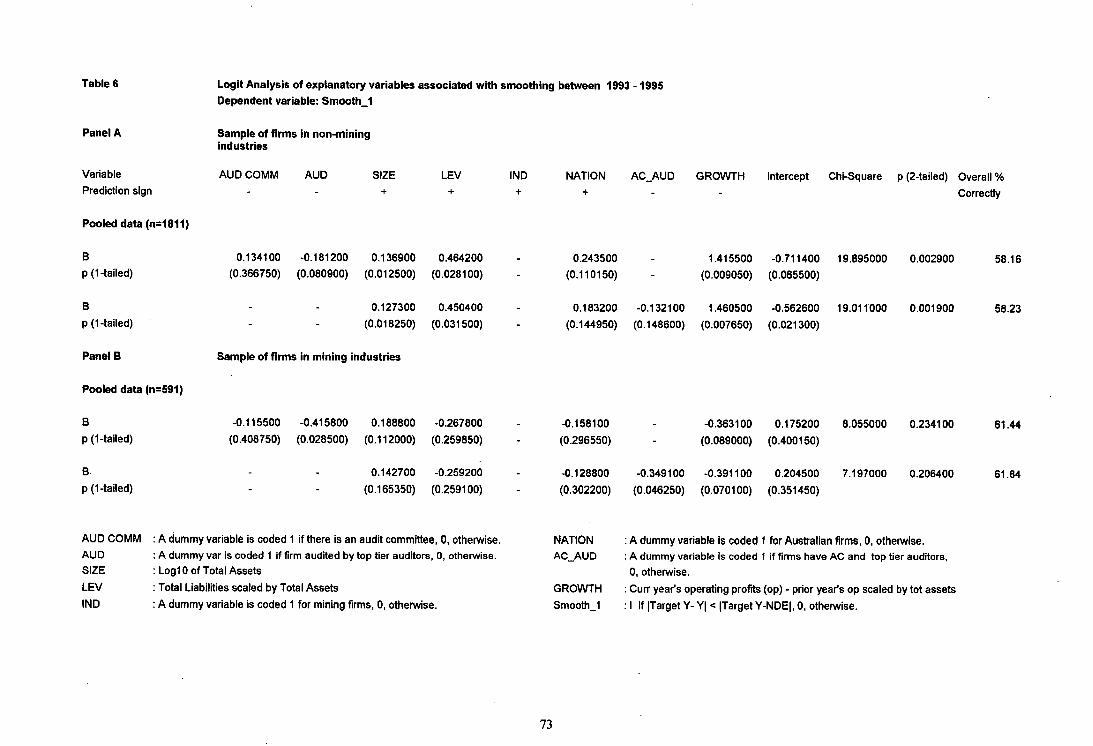
p (1-tailed)
Logit Analysis of explanatory variables associated with smoothing between 1993 - 1995 Dependent variable: Smooth_1
Sample of firms in non-mining industries
AUD COMM AUD SIZE LEV IND NATION AC_AUD GROWTH Intercept Chi-Square p (2-tailed) Overall % Correctly
0.134100 -0.181200 0.136900 0.464200 0.243500 1.415500 -0.711400 19.895000 0.002900 58.16 (0.366750) (0.080900) (0.012500) (0.028100) (0.110150) (0.009050) (0.065500)
0.127300 0.450400 0.183200 -0.132100 1.460500 -0.562600 19.011000 0.001900 58.23 (0.018250) (0.031500) (0.144950) (0.148600) (0.007650) (0.021300)
Sample of firms in mining industries
-0.115500 -0.415800 0.188800 -0.267800 -0.158100 -0.363100 0.175200 8.055000 0.234100 61.44 (0.408750) (0.028500) (0.112000) (0.259850) (0.296550) (0.089000) (0.400150)
0.142700 -0.259200 -0.128800 -0.349100 -0.391100 0.204500 7.197000 0.206400 61.84 (0.165350) (0.259100) (0.302200) (0.046250) (0.070100) (0.351450)
Table 6
Panel A
Variable Prediction sign
Pooled data (n=1811)
p (1-tailed)
Panel B
Pooled data (n=591)
p (1-tailed)
B- p (1-tailed)
AUD COMM AUD SIZE LEV IND
: A dummy variable is coded 1 if there is an audit committee, 0, otherwise. : A dummy var is coded 1 if firm audited by top tier auditors, 0, otherwise. : Logi 0 of Total Assets : Total Liabilities scaled by Total Assets : A dummy variable is coded 1 for mining firms, 0, otherwise.
: A dummy variable is coded 1 for Australian firms, 0, otherwise. : A dummy variable is coded 1 if firms have AC and top tier auditors,
0, otherwise. : Curr year's operating profits (op) - prior year's op scaled by tot assets : I if 'Target Y- VI < 'Target Y-NDEI, 0, otherwise.
NATION AC_AUD
GROWTH Smooth_1
73

To examine whether firms use income increasing/decreasing discretionary accruals
rather than income smoothing, logistic analysis is conducted with a dummy variable
(Inc_da). This variable takes the value 1 if the firm has positive discretionary accruals;
0, otherwise. As summarised in Table 7, auditor quality (AUD) is negatively associated
with earnings management for both the pooled and the US samples. The presence of
audit committees and nationality of firms are not significant, and the combination of
auditor quality and the presence of audit committees is marginally insignificant in its
association with aggressive reported earnings (p=0.0681). Some control variables are
also significantly associated with positive discretionary accruals for the US and pooled
samples. For the Australian sample, no variables are significantly associated with
positive discretionary accruals.
74

Table 7 Logit Analysis of explanatory variables associated with positive discretionary accruals in the period between 1993 - 1995
Dependent variable: Inc_da
Variable AUD COMM AUD SIZE LEV IND NATION AC_AUD GROWTH Intercept Chi-Square p (2-tailed) Overall % Prediction sign Correctly
Pooled data (n=2402)
0.046500 -0.311800 0.096800 -0.605700 -0.351600 0.140400 0.199300 -0.029000 26.003000 0.000500 54.79 p (1-tailed) (0.438450) (0.002100) (0.039850) (0.001800) (0.000850) (0.177050) (0.148050) (0.469000)
Aus data (n=335)
-0.066600 -0.461000 0.127900 0.105100 0.060500 -0.783300 -0.308700 4.314000 0.634200 53.17 p (1-tailed) (0.416750) (0.072750) (0.532000) (0.449600) (0.410400) (0.224550) (0.379200)
0.083100 0.029500 0.034100 -0.387100 -0.628600 -0.143500 3.986000 0.551500 54.15 p (1-tailed) (0.325300) (0.483450) (0.445400) (0.068050) (0.198550) (0.435800)
US data (n=2067)
-0.299900 0.091100 -0.671800 -0.438000 0.434600 0.071600 27.602000 0.000000 55.03 p (1-tailed) (0.005050) (0.057500) (0.000900) (0.000250) (0.038800) (0.391700)
AUD COMM : A dummy var is coded 1 if there is an ac, 0, otherwise. NATION : A dummy variable is coded 1 for Australian firms, 0, otherwise. AUD : A dummy var is coded 1 if firm audited by top tier auditors, 0,
otherwise. AC_AUD : A dummy var is coded 1 if firms have audit committees and
top tier auditors, 0, otherwise. SIZE : Logi 0 of Total Assets GROWTH : Current year's operating profits (op) - prior year's op scaled by total assets LEV : Total Liabilities scaled by Total Assets Inc_da : A dummy variable is coded 1 if DA>0, 0, otherwise. IND : A dummy variable is coded lfor mining firms, 0, otherwise.
75

5.3 Discussion
The results provide evidence that audit committees alone do not mitigate earnings
management (i.e., income smoothing). So, hypothesis H1 is not supported. One
possible explanation is that audit committees are often formed for the purpose of
appearances and as having an image of forestalling regulations and quieting the press
rather than to enhance stockholders' control on management (see Menon and Williams,
1994; Bradbury, 1990). Therefore, audit committees do not directly control how
management smooths earnings.
Corporate governance literature (e.g., A Guide to Audit Committees) mentions that
there are several aspects that influence the effectiveness of audit committees to monitor
management, such as the composition of audit committee membership 22, the activity of
audit committees which can be represented by numbers of meetings attended, and the
skill of the members. In practice, time constraints and lack of competence can reduce
the effectiveness to monitor and to oversee management activities.
Menon and Williams (1994) argue that the formation of an audit committee does not
mean that the board actually relies on the audit committee to improve its monitoring
ability. Their argument can be explained by using institutional theory. Institutional
theory suggests that certain practices within a culture take on a "rulelike status".
Individuals or organisations within the culture that conform to these practices benefit
through increased stability and enhanced survival prospects. These benefits are such
22 The Bosch Committee suggested that audit committees should comprise at least a majority of independent Non Executive Directors.
76

that the individual or organisation is willing to forego alternative practices that may
result in increased efficiency through better control (Meyer and Rowan, 1977).
Applying this to audit committees, it suggests that the mere existence of an audit
committee is sufficient for a company to receive benefits from its formation by
obtaining acceptance from the business community. It is not necessary for the
committee to provide any functional benefit to the company (see Arkley-Smith, 1999).
In the Australia context, the ASX in 1995 issued a listing rule requiring companies to
disclose the existence of an audit committee, including disclosure of the reasons for not
having an audit committee if no such committee existed. So audit committee formation
may have achieved a "rulelike status" within the business community.
The results support hypothesis H2, that auditor quality is more likely to lessen the
occurrence of income smoothing. Previous studies of earnings management have
shown that auditor quality is associated with reducing earnings manipulation,
especially aggressive reported earnings. The results of this study support arguments that
top tier auditors are concerned with income smoothing since they have more to lose
from damage to their reputation for any type of earnings manipulation than non-top-
tier external auditors.
The outcomes of the tests also indicate that for Australian firms, smoothing activity is
more associated with top tier auditor designation than is US firms' smoothing activity.
This can be seen in Panel A Table 5 by comparing the coefficients on AUD (i.e., -
0.6372 and -0.1892, respectively, with p<0.05 and p<0.10). These results support
77

Porter's conjectures, that the auditors' responsibility to detect fraud appears to be more
significant to auditors in the US, than for auditors in Australia. If Porter's conjecture
holds, it is to be expected that all US auditors play a role in mitigating income
smoothing, whereas in Australia that effect would be strongest for audit firms with US
affiliations (i.e., top tier external auditors).
The interaction of audit committees and top tier auditors does not significantly affect
the mitigation of income smoothing for Australian firms. Hence, hypothesis H3 is not
supported. The insignificant results of that are probably caused by the strong influence
of image value in audit committee formation. Since the board size and dominant
personality were strongly significant for audit committee formation among Australian
firms, directors may seek to conform to the requirement of their professional groupings
and form an audit committee once board size exceeds four23 (see Arkley-Smith, 1999).
Arkley-Smith (1999) defines dominant personality as independent chairpersons who
are expected to place pressure on an entity to conform to the "rules" advocated by
professional directors' associations. If this is the case, it may suggest that members of
audit committees are not greatly concerned about income smoothing.
The results of this study suggest that the interaction between the combination of
having an audit committee members and top tier auditor does not necessarily enhance
the oversight of management's financial reporting.
23 See for example Bosch's report (1995) which mentions that groups representing directors have argued for the mandatory formation of an audit committee where board size exceeds four directors.
78
The results do not support arguments that Australian firms smooth income more than
US firms. Hypothesis H4 is significantly supported by univariate tests. However, in
multivariate tests, the results (NATION) are insignificant.
The positive sign on the industry variable indicates mining firms are more likely to
smooth earnings than non-mining firms, but the results are mixed in terms of their
significance. In the period 1993 to 1995, US mining firms were more likely to smooth
earnings than US non-mining firms, but the result does not hold for 1994. For the
Australian sample, there is no significant association. In contrast, when the sample
period is narrowed to the year 1994, two models indicate that Australian mining firms
were more likely to smooth earnings than Australian non-mining firms.
In a US context, large firms tend not to smooth earnings more than small firms. The
result i8 inconsistent with previous studies that indicate large firms are intire
complicated and have greater opportunities for income smoothing- despite potentially
closer monitoring by audit committees and top tier external auditors (see Moses, 1987;
Chaney and Jeer, 1997). Since Forge fir is have a wide array Of discretionary revenues
and expenditures, they are more likely to have larger discretionary accruals (see
Chaney and Jetter, 1997). However, they are more likely - to be subject to scrutiny and
may use "real" techniques, such as the timing of transactions, to smooth reported
earnings. Australian firms that gtri0Oth iritOill0 tend to have lower growth returns on
79

assets (Table 5) but growth is unassociated with their use of positive accruals (Table
7)24
Since lower growth indicates firms in a weak financial position, compared to firms
with higher growth, it can be argued that managers of firms in a weak financial position
are more likely to use income smoothing discretionary accruals to improve the firm's
apparent financial stability. The results are consistent with Chaney and Jeter's (1997)
findings that high growth firms are less likely to employ income smoothing than lower
growth firms. The results suggest that more mature Australian firms are more likely to
smooth earnings than new firms.
An alternative argument is that high growth firm managers have incentives to increase
reported earnings to signal their growth potential. This argument is inconsistent with
the findings for Australian firms. However, it is consistent with the US results: growth
is insignificant for US firms except in Table 7 where there is a positive association
between growth and income increasing discretionary accruals. Leverage is not
significantly associated with income smoothing in this study.
In conclusion, the results indicate that top tier auditors can mitigate income smoothing,
particularly in Australia'. Other predictions are not supported.
24 This study refers to positive growth rather than negative growth since high returns on assets can increase managers performance, then increase their bonuses.
80
5.4 Sensitivity analysis: An alternative test of income smoothing
Another measurement of smoothing was also employed to examine whether firms
engaged in income smoothing. Accounting standards permit some discretion in the
recognition of certain expenses and revenues. When managers use their discretion to
signal positive future earnings, earnings management is viewed positively. On the other
hand, if managers use their discretion to manipulate earnings for their own benefit (i.e.,
transfer of wealth through a bonus scheme, for example), discretion is viewed
negatively. Under the permanent earnings hypothesis, the two competing motivations
are not necessarily in opposition (Chaney et al., 1998).
Chaney et al. (1998) argue that smoothing represents managers' efforts to manage
reported earnings closer to managers' assessment of permanent earnings (i.e., target
earnings/potential earnings) than in the absence of discretionary accruals. When target
earnings are less than pre-managed earnings, which are limited by accounting
standards, managers will use negative discretionary accruals to achieve reported
earnings closer to target. On the other hand, when target earnings are higher than pre-
managed earnings, it means that managers use positive discretionary accruals.
81

Ffit
Figure 2: The use of discretionary accruals to adjust reported earnings to permanent earnings, subject to GAAP limitations for measuring income smoothing.
FP2r rt . rif
Notes: Y' t : permanent earnings for year t; Re,: reported earnings equal to permanent earnings for year t; 131Zit : potential reported earnings for year t for scenario j; Rit : actual reported earnings for year t for scenario j; 17.0 : pre-managed earnings for year t for scenario j.
Source: Taken from Chaney, Paul K., D.C. Jeter, and C.M. Lewis, 1998, The Use of Accruals in Income Smoothing: A Permanent Earnings Hypothesis. Advances in Quantitative Analysis of Finance and Accounting 6, 107.
82

Figure 2 depicts managers' use of discretionary accruals to move earnings in the
direction of their assessment of permanent earnings. In period t, the earnings are Yit. In
this case, managers recognise that the earnings they might report (PRO would be
overstated and would lead to an unappealing downward trend in future periods. They
would like to report Rt but are limited by GAAP. Therefore, managers use discretion
without breaching GAAP and report R It . Discretionary accruals will be negative and
are represented graphically as R 1t - PRI , In contrast, when the earnings for period t are
Y2, the managers realise that the current period includes a net negative transitory
component, and they report positive discretionary accruals to offset (in part) that
component. They can only report RA rather than R, because of GAAP limitations. This
is still higher than the potential reported earnings PR, so discretionary accruals are
represented as R2t — PR2t. Smoothing can be captured by looking at reported earnings
(R1t and Ra), which are closer to the permanent earnings assessment, than the potential
reported earnings (PRit and PR2t).
Table 8 provides a 2x2 distribution of the numbers of firms in the sample by the sign of
discretionary accruals and the predictive indicator variable, Smooth lb. Smooth lb is set
equal to I if pre-managed earnings exceed the target earnings25 . In this case if
managers smooth income, it is expected that they use negative discretionary accruals. If
Smooth lb is zero, target income exceeds pre-managed earnings, and if managers
smooth income, they will use positive discretionary accruals.
25 Chaney et al. (1998) use prior period's earnings as target earnings and a sum of cash form operation & non discretionary accruals to calculate earnings before discretionary accruals.
83

The distributions in Table 8 for each of the pooled, Australian and US samples confirm
that managers do use discretionary accruals to smooth income (p<0.000).
84

Table 8 Distribution of firms by sign of discretionary accruals and predictive
indicator variable Smooth_lb
Pooled sample Discretionary Accruals Negative Positive Totals
Aus Data Discretionary Accruals Negative Positive Totals
US data Discretionary Accruals Negative Positive Totals
Smoothl b = 0 (pre-managed earnings below target earnings) 451 751 1202 47 116 163 404 635 1039
18.78% 31.27% 50.04% 14.03% 34.63% 48.66% 19.55% 30.72% 50.27%
Smooth1b = 1 (pre-managed earnings above target earnings) 811 389 1200 116 56 172 695 333 1028
33.76% 16.19% 49.96% 34.63% 16.72% 51.34% 33.62% 16.11% 49.73%
Totals 1262 1140 2402 163 172 335 1099 968 2067
52.54% 47.46% 100.00% 48.66% 51.34% 100.00% 53.17% 46.83% 100.00%
Chi-square 217.6435 49.93307 171.21809
Prob (1-tailed) 0.000000 0.000000 0.000000
Notes: Smooth1b : 1 if pre-managed earnings >Target income; 0 , otherwise
85

The logistic regression reported in Table 9 shows signs of the difference between target
income and pre-managed earnings is significant in predicting signs of discretionary
accruals for both Australian and US data. Firms appear to use their discretionary
accruals to smooth reported earnings. For Australian firms, auditor top tier designation
and the presence of an audit committee are associated negatively with the use of
positive discretionary accruals, but only in combination. Neither is significant on its
own. For US firms, the use of a top tier external auditor is negatively associated with
the use of positive discretionary accruals. An interesting finding from this study is that,
while all samples of firms appear to smooth income, income increasing accruals are
positively associated with firm size, in contrast to the political cost hypothesis. Similar
results occur that in contrast to positive predicted sign, income increasing accruals are
negatively associated with leverage.
86

Table 9 Logit Analysis of explanatory variables associated with positive discretionary accruals in the period between 1993 - 1995
Dependent variable: Inc_da & independent variable: Smooth1b
Variable SMOOTH1b AUD COMM
AUD SIZE LEV
IND
NATION AC_AUD GROWTH Intercept Chi-Square p (2-tailed) Overall Prediction sign
Pooled data (n=2402)
-1.5717 -0.072800 -0.281200 0.478100 -0.993300 -0.145100 -0.076000 0.423400 -0.836700 288.755000 0.000000 66.02 (0.000000) (0.410100) (0.007600) (0.000000) (0.000000) (0.113450) (0.318550) (0.024250) (0.018200)
-2.395400 -0.405700 -0.386400 0.944300 -0.538300 0.412900 -0.918100 -3.002600 69.683000 0.000000 71.13 (0.000000) (0.133300) (0.147300) (0.000100) (0.284800) (0.088300) (0.179300) (0.005300)
-2.385900 0.941000 -0.488900 0.404300 -0.486200 -0.771900 -3.318500 75.371000 0.000000 70.77 (0.000000) (0.000050) (0.270000) (0.078450) (0.049200) (0.189600) (0.001000)
-1.495600 -0.271300 0.446300 -1.040100 -0.245800 0.774300 -0.780000 236.799000 0.000000 64.83 (0.000000) (0.013800) (0.000000) (0.000000) (0.032400) (0.002750) (0.002850)
AUD COMM AUD IND Inc_da GROWTH
: A dummy variable is coded 1 if there is an audit committee, 0, othw. : A dummy var is coded 1 if firm audited by top tier auditors, 0, otherwise. : A dummy variable is coded 1 for mining firms, 0, otherwise. : A dummy variable is coded 1 if DA>0, 0, otherwise. : Current year's operating profits (op) - prior year's op scaled by total assets
SIZE LEV NATION AC_AUD Smooth lb
: Log10 of Total Assets : Total Liabilities scaled by Total Assets : A dummy var is coded 1 for Aus firms, 0, otherwise. : A dummy var is coded 1 if firms have ac and top tier auditors, 0, otherwise. : 1 if pre-managed earnings >Target income; 0 , otherwise
p (1-tailed)
Aus data (n=335)
p (1-tailed)
p (1-tailed)
US data (n=2067)
p (1-tailed)
87

5.5 Sensitivity analysis: Unrestricted US sample
Prior tests using US firms include only firms in industries corresponding to the industry
composition of the Australian sample. Tests using all industry groups of available US
data are also conducted. This sample consists of 43 industries, including 14 industries
in the previous US sample. Multivariate tests are reported in Table 10. The equivalent
table using the restricted sample is Table 5. Many results are inconsistent with previous
results (see Table 5 panel A). Since the difference is driven entirely by the different US
sample, the following analysis focuses on the US firms. The role of top tier external
auditors ceases to be significant in the expanded sample, while leverage and growth in
returns on assets become significantly positively associated with smoothing. In the
pooled sample, the nationality of firms becomes significant with the positive predicted
sign. This indicates Australian firms are more likely to smooth earnings than US firms.
However, the significance of nationality is caused by the inclusion of all industry
groups for the US sample, in which more US firms do not smooth earnings. It appears
that income smoothing is less common in certain industries than others, and that the
industries that do not smooth are under-represented in Australia.
88

Table 10 Logit Analysis of explanatory variables associated with smoothing in the period between 1993 - 1995
Dependent variable: Smooth_1, with all industries for US sample
p (1-tailed)
AUD COMM AUD SIZE LEV IND NATION AC_AUD GROWTH Intercept Chi-Square p (2-tailed) Overall % Correctly
0.076200 -0.054600 0.075700 0.195900 0.285100 0.262000 0.281600 -0.428700 37.003000 0.000000 53.57 (0.401100) (0.170100) (0.002850) (0.023000) (0.001400) (0.036800) (0.010050) (0.091850)
0.072200 0.194300 0.289600 0.252200 -0.042900 0.282300 -0.345100 38.514000 0.000000 53.51 (0.004150) (0.023650) (0.001100) (0.022300) (0.224950) (0.010050) (0.001950)
0.340100 -0.637200 -0.180600 -0.732500 -0.119000 -5.848400 2.287900 15.573000 0.016200 64.44 (0.152950) (0.035650) (0.200700) (0.202450) (0.335250) (0.032700) (0.017100)
-0.172900 -0.491500 -0.147800 -0.106300 -2.811900 1.868100 8.674000 0.122800 63.08 (0.183400) (0.253200) (0.282250) (0.346650) (0.078350) (0.024000)
-0.028600 0.080200 0.209700 0.352200 0.393600 -0.410700 33.207000 0.000000 53.59 (0.312050) (0.001900) (0.017050) (0.000350) (0.001250) (0.000350)
Variable Prediction sign
Pooled data (n=9207)
(1) B p (1-tailed)
(2) B p (1-tailed)
Aus data (n=335)
(1) B p (1-tailed)
(2) B p (1-tailed)
US data (n=8872)
AUD COMM : A dummy variable is coded 1 if there is an audit committee, 0, otherwise. NATION : A dummy variable is coded 1 for Australian firms, 0, otherwise. AUD : A dummy var is coded 1 if firm audited by top tier auditors, 0, otherwise. AC_AUD : A dummy variable is coded 1 if firms have AC and top tier auditors, SIZE : Logi 0 of Total Assets 0, otherwise. LEV : Total Liabilities scaled by Total Assets GROWTH : Curr year's operating profits (op) - prior year's op scaled by tot assets IND : A dummy variable is coded 1 for mining firms, 0, otherwise. Smooth_1 : I if 'Target Y- YI < 'Target Y-NDEI, 0, otherwise.
89

5.6 Conclusion
The results do not unambiguously support the hypotheses. There are national, temporal
and industry differences in the association of income smoothing with corporate
governance through the use of audit committees and top tier external auditors.
90

Chapter 6: Summary and Conclusion
6.1 Introduction
Income smoothing is driven by incentives to mitigate volatility in reported earnings,
e.g., reducing volatility around target earnings. In the Australian context, there is strong
evidence that large listed companies are actively engaged in income smoothing. To
date, however, relatively little attention has been paid to the way in which income
smoothing might be affected by auditor quality or the presence of an audit committee.
Porter's (1994) discussion about international differences between Australia and the
US auditing standards and the requirement for audit committee formation also
motivates this empirical study. The thesis addresses several research questions. (1) Do
Australian firms artificially smooth reported earnings? (2) Does the presence of an
audit committee affect the propensity of firms to smooth earnings? (3) Is audit quality
associated with artificial income smoothing? (4) Are income smoothing incentives
similar for Australian and US firms' managers, given that the two countries have
different regulations concerning audit committee formation and responsibility to detect
fraud?
6.2 Regulatory background
Australian public companies are currently not required to form audit committees, either
by statute or by the Australian Stock Exchange. However, in the US, the requirement
has become mandatory. In terms of auditing regulations, the auditor regulatory body•
has reluctantly acknowledged the duties imposed on auditors by statute and does not
encourage auditors to go beyond the minimum legal requirements to detect fraud
91

(Porter, 1994). Furthermore, there is an opinion held by the auditing profession in
Australia that management has the role of detecting financial fraud, and that detection
of fraud by auditors is secondary to their primary duty of reporting whether the
accounts are true or fair (Tomasic and Bottomley, 1993).
6.3 Predictions of the study
Accounting literature documents the need for audit committees and auditing. The
agency costs that arise from contractual relationships, combined with information
asymmetry, lead to a demand for investment in control and monitoring. Audit
committees and external auditing are elements of corporate governance practices.
Based upon that assumption, auditor quality and the presence of audit committees
should mitigate firms' propensity to smooth earnings. Since corporate governance
practices are affected by different legal and financial factors that cause them to vary,
differences in those factors can create differences in focus of the respective governance
• systems. This leads to an assumption that since the regulatory body in the US is
arguably stricter than in Australia in regards to requirements of audit committee
formation and detecting fraud, Australian managers have more opportunity to smooth
earnings than US managers.
6.4 Method
The study investigates the role of auditing-related corporate governance using samples
of both Australian and US firms. The classification of firms as income smoothers is
modelled as a function of the use of audit committees, use of top tier external auditors,
92

combination of both audit committee and top tier auditor, and firms' US/Australian
nationality. Logit analysis is performed.
6.5 Results and Conclusions
The results indicate that firms smooth reported income. There is inconclusive evidence
about whether firms' use of high quality auditors is associated negatively with the
propensity for income smoothing, and there is scope for further research in relation to
the role of auditors in reducing the propensity of income smoothing. For example, this
study does not examine the role of second tier versus third tier auditors.
There is no evidence that audit committees alone mitigate income smoothing. The
insignificant results are probably caused by the strong influence of image value in audit
committee formation in an Australian context (all US firms are required to have audit
committees). That argument possibly also explains why the interaction between top tier
auditors and audit committees is not significant for Australian firms in association with
income smoothing.
There is inconclusive evidence that, since requirements for firms to form audit
committees and for auditors to detect management fraud in the US are stricter than in
Australia, managers of Australian firms are more likely to smooth earnings than
managers of US firms. Macro economic conditions and industry types are more likely
to give incentives for managers to smooth earnings.
93

The results have implications for the effectiveness of the alternative forms of corporate
governance. While it is possible that external auditing deters income smoothing, there
is little evidence supporting arguments that use of a top tier external auditor and/or an
audit committee reduces the likelihood that firms will smooth earnings. However, there
is a negative association between the use of income increasing earnings management
and top tier external auditor designation or combination of top tier external auditor and
presence of an audit committee.
These findings can inform financial statement users about exercising caution when
interpreting financial data and disclosure. There is a difference between having an
audit committee and having an effective audit committee. In deciding the extent to
which they should monitor and control managers' actions in order to protect external
parties such as present and potential investors, regulators can also be guided by the
weak results. Whether the effectiveness of audit committees could be enhanced if
regulators ensure that the objectives and responsibilities of the audit committee are
clearly defined in a written assertion, warrants investigation. Finally, the findings may
contribute insight into international differences in reporting practices. The results do
not provide strong evidence that international harmonisation of auditing requirements
would reduce the incidence of income smoothing. In this study, for example, the
insignificance of firm nationality in predicting income smoothing indicates that the US
mandatory requirement of having an audit committee is not associated with reduced
income smoothing or less use of positive discretionary accruals.
94
References
American Institute of Certified Public Accountants, 1972, Statement on Auditing Standards No. 1, New York, AICPA.
American Institute of Certified Public Accountants, 1977, Statement on Auditing Standards No. 5: The Auditor Responsibility to Detect and Report Errors and Irregularities, New York, AICPA.
American Institute of Certified Public Accountants, 1988, Statement on Auditing Standards No. 53: The Auditor Responsibility to Detect and Report Errors and Irregularities, New York, AICPA.
American Institute of Certified Public Accountants, 1997, Statement on Auditing Standards No. 82: Consideration of Fraud in a Financial Statement Audit, New York, AICPA.
Alchian, A. A. and H. Demsetz., 1972, Production, Information Costs, and Economic Organization, American Economic Review 62, 777-795.
Anderson, D., J.R. Francis, and D.J. Stokes., 1993, Auditing, Directorships and the Demand for Monitoring, Journal of Accounting and Public Policy 12, 353-375.
Arkley-Smith, T., 1999, Audit Committees: An Institutional Theory Perspective, The International Journal of Business Studies 7, 15-34.
Arthur Andersen, 1992, Audit Committees in the 1990s, Arthur Andersen: Sydney.
Ashari, N., H.C. Koh, S.L. Tan, W.H. Wong., 1994, Factors Affecting Income Smoothing among Listed Companies in Singapore, Accounting and Business Research 24, 291-301.
Australian Accounting Research Foundation, Auditing Standard Board, 1983, Statement of Auditing Practice AUP 16: Fraud and Error.
Australian Accounting Research Foundation, Auditing Standard Board, 1993, Statement of Auditing Practice AUP 16 (revised): The Auditor's Responsibility for Detecting and Reporting Irregularities including Fraud, Other Illegal Acts and Error.
Australian Accounting Research Foundation, Auditing Standard Board, 1995, Auditing Standards AUS 210: Irregularities, Including Fraud, Other Illegal Acts and Error.
Australian Institute of Company Directors, 1995, Corporate Governance Practices and Conduct (Bosch Committee).
Australian Stock Exchange, 1994, Disclosure of Corporate Governance Practices by Listed Companies, Discussion Paper, ASX: Sydney.
95

Ball, R., 1989, The Firm as a Specialist Contracting Intermediary: Application to . - Accounting and Auditing, Working paper, William E Simon Graduate School of Business Administration, University of Rochester.
Barnea A., J. Ronen, and S. Sadan, 1975, The Implementation of Accounting . • Objectives: An Application to Extraordinary Items, The Accounting Review 50, 58-68.
Baxter, P and J. Pragasam, 1999, Audit Committees: One size fits all?, Australian CPA (April), 42-43.
Beasley, M.S, 1996, An Empirical Analysis of the Relation between the Board of Director Composition and Financial Statement Fraud, The Accounting Review 71, 443- 465.
Beattie, V., S. Brown, D. Ewers, B. John, S. Manson, D. Thomas and M. Turner, 1994, Extraordinary Items and Income Smoothing: A Positive Accounting Approach. Journal of Business Finance and Accounting 21, 791-810.
Becker, C., M.L. DeFond, J. Jiambalvo, and K.R. Subramanyam, 1995, The Effect of Audit Quality on Earnings Management, Working paper.
Becker, C., M.L. DeFond, J. Jiambalvo, and K.R. Subramanyam, 1998, The Effect of Audit Quality on Earnings Management, Contemporary Accounting Research 15, 1-24.
Beidleman C., 1973, Income Smoothing: The Role of Management, The Accounting • Review, 653-668.
Bitner, L. N. and R. Dolan., 1998, Do Smoothing Earnings Add Value?, Management Accounting 80, 44-48.
Blue Ribbon Committee, 1999, Report and Recommendations of the Blue Ribbon Committee on Improving the Effectiveness of Corporate Audit Committees.
Booth, G.G., J. Kallunki and T. Martikainen, 1996, Post-announcement Drift and Income Smoothing: Finnish Evidence, Journal of Business Finance and Accounting 23, 1197-1209.
Bradbury, M. E., 1990, The Incentives for Voluntary Audit Committee Formation, Journal of Accounting and Public Policy 9, 19-36.
Brickley, J.A., J.L. Coles and R.L. Terry, 1994, Outside Directors and the Adoption of Poison Pills, Journal of Financial Economics 35, 371-390.
Bureau of Industry Economics, 1994, Australian Industry Trends (November), 2-37.
Bureau of Industry Economics, 1995, Australian Industry Trends (November), 2-43.
96

Canada Institute of Chartered Accountants, 1981, Audit Committee, CICA, Toronto.
Chaney, P.K. and D.C. Jeter, 1997, Income Smoothing and Firm Characteristics ., Accounting Enquiries 7, 1-50.
Chaney, P.K., D.C. Jeter, and C.M. Lewis, 1998, The Use of Accruals in Income Smoothing: A Permanent Earnings Hypothesis, Advances in Quantitative Analysis of Finance and Accounting 6, 103-135.
Chow, C. W., 1982, The Demand for External Auditing: Size, Debt and Ownership Influences, The Accounting Review 57, 72-91.
Collier, P., 1993, Factors Affecting the Formation of Audit Committees in Major UK Listed Companies, Accounting and Business Research 23, 421-430.
Connect4, 1999, The Annual Report Collection (Electronic Database).
Craig, R. and P. Walsh, 1989, Adjustments for Extraordinary Items in Smoothing Reported Profits of Listed Australian Companies: Some Empirical Evidence, Journal of Business Finance and Accounting 16, 229-245.
Craswell, A., J. Francis and S.Taylor, 1995, Auditor Brand Name Reputations and Industry Specializations, Journal of Accounting and Economics 20, 297-322.
Culvenor, J., J.M. Godfrey and G. Byrne, 1999, Modelling Total Accruals in an International Environment: The Impact of Alternative Measures of PPE, Journal of International Accounting, Auditing & Theory (forthcoming).
Davidson, A., 1984, Audit Committees in Australia, The Chartered Accountant in Australia (July), 38-39.
DeAngelo, L., 1981, Auditor Size and Audit Quality, Journal of Accounting and Economics 3, 183-189.
DeAngelo, L., 1986, Accounting Numbers as Market Valuation Substitutes: A Study of Management Buyouts of Public Stockholders, The Accounting Review (July), 400-420.
Dechow, P.M., R.G. Sloan and A.P. Sweeney, 1995, Detecting Earnings Management, The Accounting Review 70, 193-225.
Dechow, P.M. R.G. Sloan and A.P. Sweeney, 1996, Causes and Consequences of Earnings Manipulation: An Analysis of Firms Subject to Enforcement Actions by the SEC, Contemporary Accounting Research 13, 1-36.
Defond, M.L. and C.W. Park, 1997, Smoothing Income in Anticipation of Future Earnings, Journal of Accounting and Economics 19, 29-74.
97

DeFond, M.L. and J. Jiambalvo, 1991, Incidence and Circumstances of Accounting Errors, Accounting Review 66, 643-655.
DeFond, M.L. and J. Jiambalvo, 1993, Factors Related to Auditor-Client disagreements over Income-increasing Accounting Methods, Contemporary Accounting Research 9, 411-431.
Eining, M.M., D.R. Jones and J.K. Loebbecke, 1997, Reliance on Decision Aids: An Examination of Auditors' Assessment of Management Fraud, Auditing: A Journal of Practices and Theory 16, 1-19.
Ernst & Young, 1990, A Guide to Audit Committees. Ernst & Young, Sydney.
Fama, E. F., 1983, Agency Problems and the Theory of the Finn, Journal of Political Economy 88, 288-307
Fama, E. F. and M. C. Jensen, 1983, Separation of Ownership and Control. Journal of Law and Economics 26(June), 301-325.
Francis, J.R., E. Maydew and H.C. Sparks. 1999, The Role of Big 6 Auditors in the Credible Reporting of Accruals, Auditing: A Journal of Practice and Theory 18(2).
Fudenberg, K. and J. Tirole, 1995, A Theory of Income and Dividend Smoothing Based on Incumbency Rents, Journal of Political Economy 103, 75-93.
Godfrey J.M. and K.L. Jones, 1999, Political Cost Influences on Income Smoothing via Extraordinary Item Classification, Accounting and Finance 39, 229-254.
Godsell, D., 1990, Auditors' Legal Duties and Liabilities in Australia. Australian Accounting Research Foundation, 117-122.
Gordon, M.J., 1964, Postulates, Principles, and Research in Accounting, The Accounting Review (April), 251-263.
Gray, S.J., L.G. Campbell, and J.C. Shaw, 1984, International Financial Reporting: A Comparative International Survey of Accounting Requirements and Practices in 30 Countries, McMillan: London, 13-28.
Healy, P., 1985, The Effect of Bonus Schemes on Accounting Decisions, Journal of Accounting and Economics 7, 85-107.
Heiman-Hoffman, V.B., K.P. Morgan, and J.M. Patton, 1996, The Warning Signs of Fraudulent Financial Reporting, Journal of Accountancy 182 (Oct), 73- 75.
Holthausen, R.W., D.F. Larcker, and R.G. Sloan, 1995, Annual Bonus Schemes and the Manipulation of Earnings, Journal of Accounting and Economics 19, 29-74.
98

Hunt A., S.E. Moyer and T. Shevlin, 1996, Managing Interacting Accounting Measures to Meet Multiple Objectives: A Study of LIFO firms, Journal of Accounting and Economics 21, 339-374.
Jensen, M. C. and W. H. Meckling, 1976, Theory of the Firm: Managerial Behavior, Agency Costs and Ownership Structure, Journal of Financial Economics 3, 305-360.
Jones J., 1991, Earnings Management during the Import Relief Investigations, Journal of Accounting Research 29, 193 -228.
Kalbers, L.P. and T.J. Fogarty, 1993, Audit Committee Effectiveness: An Empirical Investigation of the Contribution of Power, Auditing: A Journal of Practice & Theory, 12, 24-48.
Knapp, M.C., 1987, An Empirical Study of Audit Committee Support for Auditors Involved in Technical Disputes with Client Management, The Accounting Review 57, 578-588.
Lambert R.A., 1984,. Income Smoothing as Rational Equilibrium Behaviour. The Accounting Review (October), 604-618.
Langendijk, H.P.A.J. and B. Van Praag, 1996, An Empirical Analysis of Income Smoothing in Germany, the Netherlands and the United Kingdom. Working paper, University of Amsterdam.
Levitt, A., 1998, The Number Game (Remark at NYU Center of Law and Business).
Ma, C.K., 1988, Loan Loss Reserves and Income Smoothing: The Experience in the US Banking Industry, Journal of Business Finance and Accounting, 487-497.
Maclean, M., 1999, Corporate governance in France and the UK: Long-term Perspective on Contemporary Institutional Arrangements, Business History 41, 88-90.
Marrian, I.F.Y., 1988, Audit Committees, The Institute of Chartered Accountants of Scotland, Edinburgh.
McMullen, D.A., 1996, Audit Committee Performance: An Investigation of the Consequences Associated with Audit Committees, Auditing: A Journal of Practice and Theory 15, 87-103.
Mehran, H., 1992, Executive Incentive Plans, Corporate Control, and Capital Structure, Journal of Financial and Quantitative Analysis 27, 522-539.
Menon, K. and D. D. Williams, 1994, The Use of Audit Committees for Monitoring, Journal of Accounting and Public Policy 13, 121 - 139.
99

Meyer, J.W. and B. Rowan, 1977, Institutionalized Organizations: Formal Structure as .* • Myth and Ceremony, American Journal of Sociology 83, 340-363.
Moses 0.D., 1987, Income Smoothing and Incentives: Empirical Tests Using - Accounting Changes, The Accounting Review 62, 358-377.
OECD., 1997, Economic Survey — Australia, 16-23.
Palmrose, Z., 1988, Analysis of Auditor Litigation and Audit Services Quality,. Accounting Review 63, 55-73.
Parliament of the Commonwealth of Australia, Joint Statutory Committee on Corporations and Securities, 1992, Audit Committees: An Issues Paper.
Peasnell, K.V., P.F. Pope and S. Young, 1998, Outside Directors, Board Effectiveness, .. and Earnings Management, Working paper, Lancaster University.
Pincus, K., M. Rusbarslcy, and J. Wong, 1989, Voluntary Formation of Corporate Audit Committees Among NASDAQ Firms, Journal of Accounting and Public Policy 8(2), 239-265.
..
Porter, B.A., 1991. Narrowing the Audit Expectation-Performance Gap: -A Contemporary Approach. Pacific Accounting Review 3(June), 1-36.
Porter, B.A. and P.J. Gendall, 1993, An International Comparison of the Development and Role of Audit Committees in the Private Corporate Sector, Discussion Paper Series, Massey University, Palmerston North, NZ.
Porter, B.A., 1994, Auditors' Responsibility to Detect and Report Corporate Fraud: A Comparative Historical and International Study, Discussion Paper Series, Massey University, Palmerston North, NZ.
Press, E.G. and J.B. Weintrop, 1990, Accounting-based Constraints in Public and Private Debt Agreements: Their Association with Leverage and Impact on Accounting Choice, Journal of Accounting and Economics 12, 65-95.
Ronen J. and S. Sadan, 1981, Smoothing Income Numbers: Objectives, Means and Implications, Addison-Wesley Publishing Company, Reading MA.
Rubach, M.J. and T.C. Sebora, 1998, Comparative Corporate Governance: Competitive Implications of an Emerging Convergence, Journal of World Business, Summer 33(2), 167-185.
Saudagaran, S.M. and, J.F. Sepe, 1996, Replication of Moses' Income Smoothing Tests with Canadian and UK Data: A Note, Journal of Business Finance and Accounting 23, 1219-1223.
100

Smith, C. W. and J. B. Warner, 1979, On Financial Contracting: An Analysis of Bond Covenants, Journal of Financial Economics (June), 117-161.
Standard & Poor's COMPUSTAT, 1998, The McGraw-Hill Companies inc., Eaglewood.
Statistical Package for Social Sciences (SPSS) for Windows Release 9.0.1, 1999
Subramanyam, K.R., 1996, The Pricing of Discretionary Accruals, Journal of Accounting and Economics 22, 249-281.
Thoman, L., 1996, Legal Damages and Auditor Efforts, Contemporary Accounting Research 13.
Tomasic, R and S. Bottomley, 1993, Directing the Top 500: Corporate Governance and Accountability in Australian Companies, NSW: Allen and Unwin.
Trueman B. and S.Titman, 1988, An Explanation for Accounting Income Smoothing, Journal of Accounting Research 26 (Supplement), 127-139.
Vanasco, R.R., 1994, The Audit Committee: An International Perspective, Managerial Auditing Journal 1 09 Issue 8.
Watts, R. and J. Zimmerman, 1981, The Markets for Independence and Independent Auditors, Unpublished manuscript, University of Rochester, Rochester, NY.
Watts, R. and J. Zimmerman, 1986, Positive Accounting Theory, Prentice-Hall: Englewood Cliffs, NJ.
Watts, R. and J. Zimmerman, 1990, Positive Accounting Theory: A Ten Year Perspective, The Accounting Review 65, 131-156.
Young, S., 1998, The Determinants of Managerial Accounting Policy Choice: Further Evidence for the UK, Accounting and Business Research 28, 131-143.
Zmijewski, M.E. and R.L. Hagerman', 1981, An Income Strategy Approach to the Positive Theory of Accounting Standard Setting/Choice, Journal of Accounting and Economics 3, 129-149.
101