augenheilkunde - media.heidelbergengineering.com
TRANSCRIPT

Vorsicht: Bildbreite 134 mm ►
Christian Mardin
OCT Diagnosis in Glaucoma: Tips & Tricks
2020Volume 10Page 49–63
Translation fromGerman
Reprint
up2dateAugenheilkunde
Copyright & Ownership © 2021. Thieme. All rights reserved. The journal Augenheilkunde up2date is owned by Thieme. Georg Thieme Verlag KG, Rüdigerstraße 14, 70469 Stuttgart, Germany ISSN 1616-9719

Optical coherence tomography in glaucoma is indispensable for documentation,diagnostic assistance and monitoring progression. Critical findings must be consid-ered in conjunction with the patientʼs clinical condition. This paper uses case studiesto illustrate possible applications.
ABBREVIATIONS
AMD Age-related macular degeneration
APS Anatomic positioning system
BMO Bruchʼs membrane opening
BMO‑MRW Minimum rim width
GCL Ganglion cell layer
NRR Neuroretinal rim
OCT Optical coherence tomography
RNF Retinal nerve fibre
RNFL Retinal nerve fibre layer
SD‑OCT Spectral-domain OCT
SS‑OCT Swept-source OCT
TSNIT temporal-superior-nasal-inferior-
temporal
IntroductionThe use of optical coherence tomography (OCT), in glau-coma diagnostics, has become standard of care. Spectral-domain OCT (SD‑OCT) and swept-source OCT (SS‑OCT)acquire high-resolution images with up to 100,000A‑scans per second. Structures of interest, such as themacular ganglion cell layer, the retinal nerve fibre layer,and the optic disc, inclusive of the lamina cribrosa, canbe resolved with a digital axial resolution of 3.9 μm. Thisresolution is comparable to an in vivo histological sectionand measurable variability does not exceed 1.4 μm [1].
The precision with this level of resolution measures thenatural age-related loss of the neuroretinal rim (NRR)and retinal nerve fibre layer (RNFL). Differentiating thesefrom early glaucomatous changes is challenging regard-less of the measurement technique. Repeated, precisemeasurements are essential, since each patient manifestsan individual rate of progression [2].
High-resolution OCT has rapidly become widespread inroutine care. Glaucoma screening has advanced with the
RNFL and BMO-MRW measurement, with high sensitivityin the preperimetric stage of glaucoma. Macular ganglioncell layer (GCL) thickness measurement by SD‑OCT dis-criminates between normal and early glaucoma.
In a literature review of three different OCT devices,Oddone et al. [3] found that RNFL thickness was superiorto the macular GCL thickness measurements. The mini-mum neuroretinal rim width (BMO-MRW) measurementin the optic disc is the latest application. The disc marginis precisely indicated by BMO-MRW, which detects theend of Bruchʼs membrane and the internal limiting mem-brane [4]. BMO‑MRW is measured at 48 points and ex-trapolated to sectoral or total values. Initial clinical stud-ies proved BMO‑MRW to be almost as meaningful as theRNFL thickness measurement, by OCT, for glaucoma as-sessment [4–6]. The extrapolated area of the BMOroughly indicates the disc area. It correlates marginallywith the disc area as measured by HRT, which is basedon the inner margin of the Elschnig scleral ring.
CaveatBMO and the disc area are not the same.
This paper will answer general questions with respect toassessing OCT images in glaucoma.
How does OCT illustrate measurementsrelevant to glaucoma?
Retinal nerve fibre layer (RNFL) and minimum rim width(BMO‑MRW) measurements are acquired in 360 degreesand displayed in a TSNIT (temporal-superior-nasal-in-ferior-temporal) X-Y or linear graph. The acquired mea-surements, as displayed on the TSNIT graph, are com-pared to the normative database. The twofold standarddeviation is shown in each sector and averaged over allsectors. Each measurement for a particular sector will be
OCT diagnosis in glaucoma:tips & tricks
Christian Mardin
Glaucoma
1Mardin C. OCT diagnosis in… Augenheilkunde up2date 2021; 11: 1–10 | © 2021. Thieme. All rights reserved.

color-coded green, yellow (95% percentile or borderline)or red (99% percentile or pathological).
The macular ganglion cell layer thickness of a volumescan is shown in regional absolute values (and as a to-pography map) or shown colour-coded. Differences fromnormal thickness values are highlighted in yellow and redand provide a rapid overview of the topography of themacular layers overlaying the ocular fundus image.
▶ Fig. 1 is an example showing an overview of the righteye.
What indicates glaucoma?When assessing OCT images, pay attention first to theRNFL (most reliable in early glaucoma [6]), followed bythe minimum neuroretinal rim width (BMO‑MRW) andganglion cell layer (GCL) thickness. The RNFL thicknessprofile and BMO‑MRW should display harmonious transi-tions between peaks and troughs. Abrupt breaks andnotches in the thickness profile suggest focal defects inthe RNFL or minimum rim width (most commonly tem-poral superior and temporal inferior).
The thickness profile should lie within the green refer-ence range. Furthermore, the B-scan images and seg-mentations demand another close look.
The infrared fundus image can provide information aboutpossible optic disc haemorrhages (visible in 50% ofcases), the peripapillary atrophy zone and shape of theexcavation (light) relative to the NRR shape (dark). FocalRNFL defects can be readily detected (dark on light).
The central macular topography map should show theperifoveolar thickening of the retina as a ring-shaped ele-vation (doughnut shape). Various manufacturers use col-our-coded thickness maps on which differences from thereference can be detected rapidly. Maps depicting differ-ences from the normal population are also offered, whichprovide information about differences from normal layerthicknesses in green, yellow and red. If the topographyshows any abnormalities, the B-scan and segmentationshould be re-examined.
The temporal aspect of the GCL ring typically is the firststrucutre to show atrophy in glaucoma, correspondingto the superior and inferior temporal RNFL defects. Axonsare located in this region, with the raphe, the axis be-
▶ Fig. 1 An example showing an overview of a right eye with the TSNIT (temporal-superior-nasal-inferior-temporal) graphs for minimum rim width(BMO‑MRW), retinal nerve fibre layer (RNFL) (top) and the retina and ganglion cell layer (GCL) thickness (bottom). Between the graphs at thebottom there is an image showing macular hemisphere symmetry (the degree of deviation is coded grey).
2 Mardin C. OCT diagnosis in… Augenheilkunde up2date 2021; 11: 1–10 | © 2021. Thieme. All rights reserved.
Glaucoma

CASE STUDY 1
Right eye of a 32-year old female patient. Familial juvenile open-angle glaucoma with extremely high intraocular pressure greater than
40mmHg at the time of diagnosis. Intraocular pressure now controlled, 9–20mmHg. Distant vision is 1.0 bilaterally, and the central
corneal thickness is 542 µm on R, 536 µm on L. The disc is slightly excavated (a, white arrow), pale; probably because of the initial high
pressure, there is also simple atrophy. There is early glaucomatous change in the visual field (b, blue arrows).
The thickness of the retinal nerve fibre layer (RNFL) is significantly reduced because of the simple optic atrophy component
(d, bottom), and the minimum neuroretinal rim width (BMO area 2.56mm2) is atrophied especially in the inferior region of the disc
(d top, black arrow). The topography of the macular ganglion cell layer is reduced inferiorly and temporally (c, cold colours, white
arrows), and in the deviation map the thinning beyond the 99% percentile is shown in red (e, white arrow).
▶ Fig. 2 Familial juvenile open-angle glaucoma.
3Mardin C. OCT diagnosis in… Augenheilkunde up2date 2021; 11: 1–10 | © 2021. Thieme. All rights reserved.

tween the fovea and the centre of the disc, as dividingline. Advanced glaucoma often presents with diffusethinning of the retinal nerve fibre layer (RNF), minimumrim width (BMO‑MRW) and ganglion cell layer (GCL) inOCT images.
Asymmetry between right and left eye is also an impor-tant marker in unilateral glaucoma. OCT devices offerasymmetry analysis for this purpose. Asymmetry withinthe GCL is meaningful since atrophy is more pronouncedhere either superiorly or inferiorly.
If in doubt about whether glaucoma is the cause, follow-up observation provides good information. The averageperipapillary nerve fibre layer thickness (normal, meanRNFL) is approximately 100 μm. If a reduction in thicknessis greater (RNFL loss > 1.2 µm/year) than age-related loss(RNFL about 0.6 µm/year), this may also be interpreted asprogressive atrophy. Graphic illustration of this as anevent or trend provides clarity.
Trend analysis shows poorer local resolution than theevent analysis but gives the examiner slightly more cer-tainty in assessing progression through a statistical state-ment (loss of howmany µm per year, with what statisticalsignificance). The patient should be seen more oftenthan just once a year, e.g., every three or six months, sothat short-term changes are more likely to be noted.Since statistical significance is shown in trend analysisafter the 5th measurement, the patient can, for example,be examined again 3 months after the baseline examina-tion and then 4 more times in the first 2 years.
The causes of artefacts and incorrect measurements liefirstly in the scanning technique and secondly in the indi-vidual pathology of the examined eye. The latter includesanatomical peculiarities such as vitreoretinal traction,cystoid oedema (such as widening of the inner macularnuclear layer), soft drusen, areas of myopic stretching,and, on the other hand, optic nerve pathology not associ-ated with glaucoma such as drusen or simple optic atro-phy of ascending and descending origin. For this reason,it is essential to carefully examine the anterior and poste-rior chamber of the eye before evaluating the OCT scan.The same applies for evaluating the OCT B-scans for seg-mentation errors, anatomical features (optic disc haem-orrhage) and scan quality.
TIP
One must be aware of numerous factors (segmenta-
tion errors, sector classification) in order not to be
deceived by “green disease” or “red disease” when
comparing thickness measurements to the reference
database.
CaveatAn OCT scan does not provide an automatic diagnosiscomparable to a black box. This topic will becomeeven more important in future with increasing use ofartificial intelligence.
What to pay attention to duringscan acquisition?
Correctly position the patientʼs head to avoid tilting.Head tilting has great influence on follow-up examina-tions as these cannot be completely corrected by the de-vice. Different degrees of tilting to the left or right sub-sequently leads to different positions in the x,y axes ofthe fundus image. Consequently, rotational artefacts areintroduced, especially with peripapillary circular scans.One option to correct this in a follow-up examination isto align the centre of the optic disc on the fovea (FoDi,Heidelberg Engineering) for proper alignment of the sub-sequent peripapillary circular scans.
CASE STUDY 2
Male patient, 67 years old, normal-tension glauco-
ma. In the left eye, there is an NRR notch in the disc
at 5 oʼclock (a, white arrow), and the retinal nerve
fibre layer (RNFL) shows marked temporal thinning
in the OCT (b, black arrow) (▶ Fig. 3).
The retinal thickness (c, black arrow) is superiorly and
inferiorly symmetrical although a clear curved RNFL
loss inferiorly (f, white arrow) is visible on the infrared
image (d, white arrow). In this area (d, green line),
the inner nuclear layer shows obvious cystoid disten-
sion (e, h, white arrow), but the ganglion cell layer
(GCL) is thinned (g, white arrow). Therefore, there is
no thinning of overall retinal thickness.
On the deviation map shown below (i), significantly
more pronounced atrophy (middle, red) can be seen
in red in the GCL thickness map than in the retinal
thickness map (right, top).
continued next page
4 Mardin C. OCT diagnosis in… Augenheilkunde up2date 2021; 11: 1–10 | © 2021. Thieme. All rights reserved.
Glaucoma

CASE STUDY 2
▶ Fig. 3 Normal-tension glaucoma.
5Mardin C. OCT diagnosis in… Augenheilkunde up2date 2021; 11: 1–10 | © 2021. Thieme. All rights reserved.

Three-dimensional scans in particular require multiple,well aligned B-scans without image shift (e.g., by usingan anatomic positioning system [APS]). Involuntary eyemovements are the main reason for motion artefacts,which have a negative effect on scan quality. Tremor,slow deviation and microsaccades must be corrected.The manufacturers attempt to compensate for this withvarious hardware and software solutions (e.g., TruTrack,Heidelberg Engineering; VTrac Active Tracking, Optovue;FastTrac, Zeiss; SmartTrac, Topcon).
The same applies for selecting the correct distance be-tween the eye and the lens, which affects the qualityand position of the scan (sensitivity roll-off in spectral-domain OCT).
A dry eye with pathological tear film is managed with ar-tificial tears before the examination. A prolonged exami-nation can lead to drying of the corneal surface some-times resulting in a considerable reduction in scan qual-ity. The tear film and corneal epithelium are the first in-terface between air and solid medium and thus influencerefraction of the laser beam. This can be counteracted byadministering artificial tears prior to the scan.
Fixation, whether internal or external, in poor or func-tionally monocular vision can be challenging.
It is essential to obtain correct illumination of the infraredfundus image without shadows at the margin and clearfocus on the structure being examined.
Correct positioning and centring of the peripapillarycircular scans and centring the macular volume on thefoveola are crucial for reference database comparison.
Severe astigmatism and long axial lengths can be man-aged with the following measures:▪ Wearing contact lenses/glasses▪ Attachment of astigmatic lenses▪ Correct device setting:
– Normal– Myopic– Highly myopic
TAKE HOME MESSAGE
Scan quality must be in the normal range in order to
draw conclusions from the examination.
What factors in OCT measurementsare associated with glaucoma?
In focal defects of the RNFL, cystoid expansion of theunderlying inner nuclear layer can occur as a result offocal loss of the corresponding ganglion cell layer. Expan-sion of the inner nuclear layer and thinning of the over-lying ganglion cell layer (GCL) can lead to total retinalthickness that appears normal although pronounceddamage is already present. In other words, it is pseudo-normal. The cystoid expansion may indicate glaucomaprogression. This change is clearly recognizable inB‑scans of the macular volume and is a marker for diseaseseverity in multiple sclerosis and other types of opticatrophy.
Progression is no longer to be expected in a mean RNFLthickness of about 50 µm [7]. At this stage, macular GCLthickness and a reduction in capillary density in OCT an-giography appear to be more conclusive [8].
Optic disc haemorrhage extending to the periphery canlead to artificial thickening of the layer, with subsequentthinning of the RNFL.
In order to assess glaucoma-associated anatomicalchanges, the high-resolution B-scans should be consid-ered as histological sections.
What anatomical factors in OCTmeasurements are not associatedwith glaucoma?
Changes independent from glaucoma can influence theanatomy and thereby thickness measurements of the ret-inal nerve fibre layer (RNFL), the ganglion cell layer (GCL)and the minimum rim width (BMO‑MRW). These changesoften affect the vitreoretinal interface, such as epiretinalmembranes and tractions, that lead to fraying of the al-ready diseased RNFL. Macular tractions can also lead toincorrect segmentation of the volume scan.
Intraretinally, cystoid oedema due to neovascular age-related macular degeneration (AMD), diabetic retinopa-thy and retinal vascular occlusion can lead to incorrectsegmentation of the retinal layers or cause excessivelyhigh values. Furthermore, age-related macular degenera-tion with soft confluent drusen and elevations of the ret-inal pigment epithelium can impair RNFL segmentation inOCT, resulting in altered values of layer thickness.
6 Mardin C. OCT diagnosis in… Augenheilkunde up2date 2021; 11: 1–10 | © 2021. Thieme. All rights reserved.
Glaucoma

Artificial measurements of retinal vessels or shadowingeffects, vitreous opacities at the internal limiting mem-brane or an atypical end of Bruchʼs membrane are prob-lematic. The latter are found in the periphery of the tem-poral sector of shallow myopic discs and lead to inaccu-rate thickness values of the outer retinal layers. Thereforeall measurement points in the B-scan must be checked bythe examiner and corrected if necessary.
Highly myopic eyes with a long axial length and posteriorstaphyloma display a different distribution of the retinalnerve fibres (RNF) in the fundus and thus in the scancircle as well. The RNFL peaks tend to shift temporallyand therefore fall outside the normal TSNIT graph. TheOCT devices attempt to compensate this artefact by tak-ing the corneal curvature and refraction into account.However, these are not always entered in practice, sothe defaulted values are used by the software. A longaxial length, in highly myopic eyes, leads to the scan circlebeing imaged too far from the optic disc. Due to the
curved course of the RNF to the disc, the RNF maximaare shifted too far temporally.
Posterior staphyloma and oblique optic nerve entrysometimes make useful segmentation of the RNF impos-sible. The SPECTRALIS‑OCT (Heidelberg Engineering, Hei-delberg) offers scan circles with a diameter greater than3.5mm to allow RNFL measurements in regions outsidethe staphyloma (4.1 and 4.7mm). Alternatively, the mac-ular ganglion cell layer thickness can also be used as aglaucoma marker. If this is unsuccessful, other parame-ters relevant to glaucoma, such as disc morphology andfocal RNF defects can be considered.
The shape and size of the optic disc can affect the analysisof the minimum neuroretinal rim width in OCT. Exceed-ingly small discs show minimum neuroretinal rim width(BMO‑MRW) values in the upper percentile range due tothe small diameter of the scleral canal. In contrast, due to
CASE STUDY 3
52-year-old female patient with suspected glaucoma and oblique, vital, myopic disc (image top left) (▶ Fig. 4). The
macular OCT (right) shows irregular retinal thickness topography due to segmentation of the epiretinal membrane
(B-scan, below), which also leads to thickening of the central retina.
This examination is therefore not conclusive.
▶ Fig. 4 Suspected glaucoma.
7Mardin C. OCT diagnosis in… Augenheilkunde up2date 2021; 11: 1–10 | © 2021. Thieme. All rights reserved.

the NRR distribution along a larger scleral canal, largediscs show values in the lower percentile range.
Especially in myopic eyes, the disc area and BMO area cor-relate positively with axial length [9]. This can lead to in-correct estimation of the BMO‑MRW. Large and smallBruchʼs membrane openings influence the degree of de-viation from the normal population [6]. In small discswith early glaucoma, the values of the BMO‑MRW canshow greater deviation from the reference database thanthose of the RNFL. The opposite tends to be true in largediscs.
TAKE HOME MESSAGE
All pathological anatomical changes of the fundus
can influence OCT measurements.
How do I distinguish other formsof ganglion cell and optic atrophy inthe differential diagnosis of glaucomawith OCT?
Even when the scan and segmentation of the neuroreti-nal rim (NRR), the retinal nerve fibre layer (RNFL) and theganglion cell layer (GCL) are error-free, there can still bepathological findings not associated with glaucoma. Allcauses of optic atrophy, whether it is ascending (fromthe inner retinal layers to the lamina cribrosa) or descend-ing (from the lamina cribrosa to the geniculate ganglion),affect OCT thickness measurements and can be consid-ered pathological.
CaveatIf glaucoma damage is indeterminate, the disc mustbe examined by ophthalmoscopy and simple opticatrophy must be excluded. This is supported by visualfield examination.
Certain combinations of OCT measurements can also in-dicate non-glaucomatous optic atrophy.
NoteIn glaucoma, thinning of the retinal nerve fibre layer(RNFL) and minimum neuroretinal rim width(BMO‑MRW) with an arcuate shape most commonlyappear in the superior and inferior temporal regions.In the temporal sector, thinning appears ata later stage.
Deviations from this pattern with a normal disc shape andnormal position of the retinal vascular tree (mainly supe-rior nasal) and with predominant temporal RNFL thinningmay indicate, for instance, postneuritic atrophy. A seg-
mental RNFL thinning, primarily in horizontal orientation,can be associated with a hemispheric retinal vascularocclusion or non-arteritic disc atrophy. With simple opticatrophy there is flattening of the neuroretinal rim (pres-ervation of astroglia and loss of axons) with slightly in-creased excavation. Therefore, the NRR thickness is lesslikely abnormal or reduced.
Macular ganglion cell layer loss in glaucoma follows thecurved focal RNFL defect with atrophy of the ganglion cellbodies. The thickness map is thus pathological in the su-perior or inferior temporal sector at the start of the dis-ease (shape of a bitten doughnut or nautilus shell). Withcomplete simple optic atrophy, the GCL thickness is re-duced diffusely and resembles advanced glaucomatousoptic atrophy. Concurrently, the RNFL thickness is dif-fusely pathological. In contrast to these findings, theBMO‑MRW thickness is usually only slightly thinned inOCT.
TIP
If the macular thickness of the ganglion cell layer and
retinal nerve fibre layer are reduced in OCT and the
minimum rim width is nearly normal, a degenerative
neurological condition such as Alzheimerʼs disease
should be considered. Astonishingly, initial patho-
logical OCT changes are quite often found in the
thickness of the ganglion cell layer.
Homonymous or binasal vertical alignment of ganglioncell layer thinning indicates descending atrophy of theoptic nerve due to cerebral midline disorders. This mayindicate a pituitary adenoma causing compression, orleft- or right-sided cerebral disease with transsynaptic de-generation. The OCT scan should then be followed byvisual field examination because homonymous or bi-temporal defects congruent with the OCT result are oftenapparent.
CaveatThe differential diagnosis of glaucomatous discdamage can be vitally important for the patient.
What to do in case of disc drusen,papilloedema or papilla leporina?
Optic disc drusen and papilloedema increase thicknessmeasurements of the minimum rim width. However, withedema, the retinal nerve fibre layer (RNFL) appears eventhicker. This is due to congestion, inflammation and is-chemia, and tends to form folds with congestion (Patonʼslines). Shadowing due to retinal vessels, oedema anddrusen can make it more difficult to identify the end ofBruchʼs membrane and thus complicate segmentation.
8 Mardin C. OCT diagnosis in… Augenheilkunde up2date 2021; 11: 1–10 | © 2021. Thieme. All rights reserved.
Glaucoma
Retinal nerve fibre layer (RNFL) thickness is an alternativemeasurement to assess atrophy. RNFL thinning occursboth with drusen and after a neuritic or ischaemic event.Measuring ganglion cell layer (GCL) thinning is also agood marker for assessing simple atrophy occurring afterthe ischemic event.
Complex disc atrophy, caused by an increase of astrogliawith simultaneous loss of axons (e.g., after arteritic disc
apoplexy) leads to a pale, blurred disc. This is reflectedby RNFL thinning in the OCTscan with above-normal min-imum neuroretinal rim width (BMO‑MRW). Here, too, as-sessment of the thinned out GCL is helpful for diagnosis.
Myelination of the retinal nerve fibres, in papilla leporina,leads to artificial thickening of the BMO‑MRW and RNFL.Both make it more difficult to assess glaucomatous dam-age. It is advisable here, too, to assess the GCL thickness.
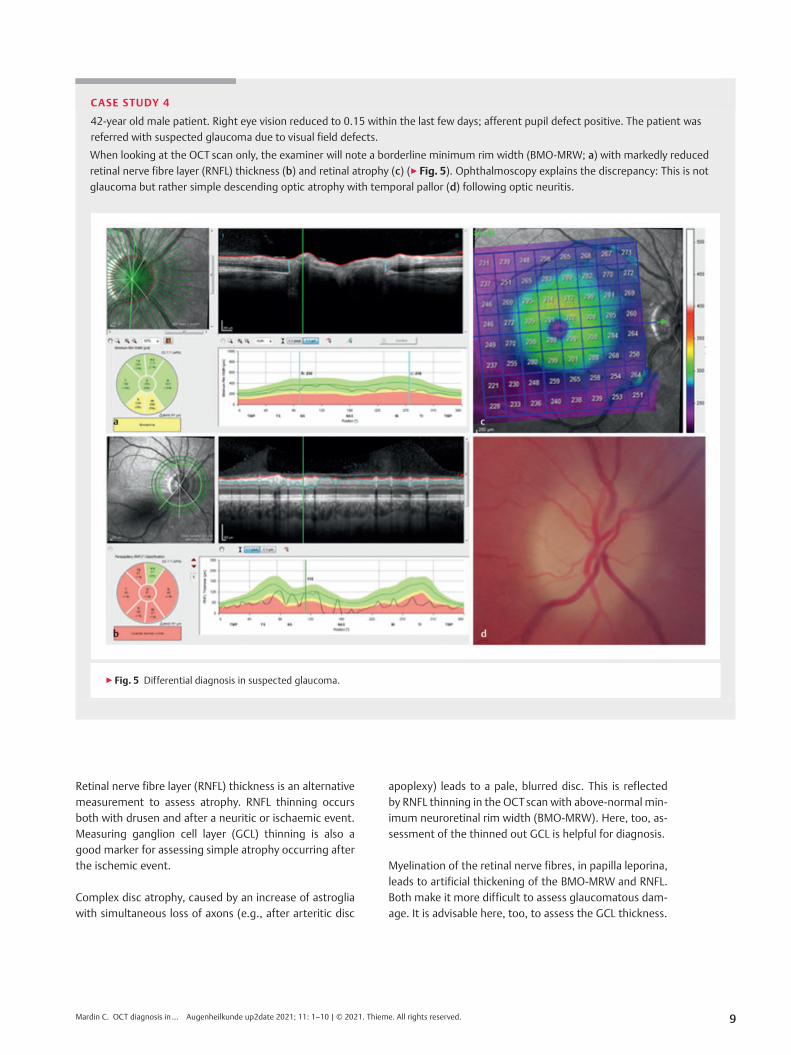
CASE STUDY 4
42-year old male patient. Right eye vision reduced to 0.15 within the last few days; afferent pupil defect positive. The patient was
referred with suspected glaucoma due to visual field defects.
When looking at the OCT scan only, the examiner will note a borderline minimum rim width (BMO‑MRW; a) with markedly reduced
retinal nerve fibre layer (RNFL) thickness (b) and retinal atrophy (c) (▶ Fig. 5). Ophthalmoscopy explains the discrepancy: This is not
glaucoma but rather simple descending optic atrophy with temporal pallor (d) following optic neuritis.
▶ Fig. 5 Differential diagnosis in suspected glaucoma.
9Mardin C. OCT diagnosis in… Augenheilkunde up2date 2021; 11: 1–10 | © 2021. Thieme. All rights reserved.

Acknowledgements
Special thanks to Claudia Holzhey and Martin Long of theHeidelberg Engineering Academy for the intensive dialogueon OCT scans over many years and for their critical review ofthe article.
Conflict of Interest
Declaration of financial interestsResearch grant received: no; fee/financial benefit for speakingengagement received: yes, from a different institution (phar-maceutical or medical technology company etc.).; paid advi-ser/internal training consultant/salaried employee: no; pa-tent/business shares/stocks (author/partner, spouse, children)in a company (non-sponsor of the event): no; patent/businessshares/stocks (author/partner, spouse, children) in a company(sponsor of the event): no.
Declaration of non-financial interestsMemberships: ARVO, DOG, BVA, NOS, SIDUO
Author
Christian Y. Mardin
Prof. MD, study of medicine 1985–1991(Friedrich-Alexander University Erlangen-Nürn-berg), graduation 1991. Specialist training1991–1996 at the Department of Ophthalmol-ogy, Friedrich-Alexander University Erlangen);adjunct professor 2006. Deputy Head of
Department since 2013. Member of the DOG, ARVO, SIDUO,NOS. Extraclinical involvement with the Christoffel Missionfor the Blind in Nepal since 2002 and German-Vietnamesecollaboration in ophthalmology.
Correspondence
Prof. Christian Y. Mardin, MDUniversitätsklinikum ErlangenAugenklinikSchwabachanlage 691054 [email protected]
Scientifically responsible accordingto certification rules
Prof. Christian Y. Mardin, MD, Erlangen, is responsiblescientifically for this paper according to certification rules.
Citation format for this article
Klinische Monatsblätter für Augenheilkundedoi:10.1055/a-1098-3466
References
[1] Schrems-Hösl L, Schrems W, Lämmer R et al. Precision of opticnerve head and retinal nerve fibre layer parameter measure-ments by Spectral domain optical coherence tomography.J Glaucoma 2018; 27: 407–414
[2] Mardin C. Structural diagnostics of course observation forglaucoma. Ophthalmologe 2013; 110: 136–144
[3] Oddone F, Lucenteforte E, Michelessi M et al. Macular versusnerve fibre layer parameters for diagnosing mainfest glauco-ma. Ophthalmology 2016; 123: 939–949
[4] Chauhan BC et al. Enhanced detection of open-angle glauco-ma with an anatomically accurate OCT-derived NRR parame-ter. Ophthalmology 2013; 120: 535–543
[5] Pollet-Villard F, Chiquet C, Romanet JP et al. Structure-functionrelationships with spectral-domain optical coherence tomog-raphy retinal nerve fiber layer and optic nerve head measure-ments. Invest Ophthalmol Vis Sci 2014; 2; 55: 2953–2962
[6] Gmeiner JM, Schrems WA, Mardin CY et al. Comparison ofBruchʼs membrane opening minimum rim width and peripa-pillary retinal nerve fibre layer thickness in early glaucoma as-sessment. Invest Ophthalmol Vis Sci 2016; 57; 575–584
[7] Mwanza JC, Kim HY, Budenz DL et al. Residual and dymanicrange of retinal nerve fiber layer thickness in glaucoma. InvestOphthalmol Vis Sci 2015; 56: 6344–6351
[8] Moghimi S, Bowd C, Zangwill LM et al. measurement floorsand dynamic ranges of OCT and OCT angiography in glauco-ma. Ophthalmology 2019; 126: 980–988
[9] Tan NYQ, Sng CCA, Jonas JB et al. Glaucoma in myopia: diag-nostic dilemmas. Br J Ophthalmol 2019; 103: 1347–1355
Bibliography
Augenheilkunde up2date 2021; 11: 1–10DOI 10.1055/a-1445-9743ISSN 0023-2165© 2021. Thieme. All rights reserved.Georg Thieme Verlag KG, Rüdigerstraße 14,70469 Stuttgart, Germany
KEY MESSAGES
▪ High-resolution OCT allows imaging and measurement of the
retinal ganglion cell layer (GCL) and nerve fibre layer with high
resolution similar to a histological section.
▪OCT measurement of structures in the ocular fundus relevant in
glaucoma facilitates diagnosis of and follow-up in early disease
states.
▪ The colour-coded visualisation of differences from the normal
population provides the examiner with a rapid overview of path-
ological measurements.
▪ The image quality of OCT scans is crucial for the reliability of the
measurements.
▪ It is the task of the reporting physician to identify artefacts and
incorrect measurements so as to avoid misinterpretations.
▪ Artefacts can be caused both by glaucoma-associated pathology
and by non-glaucomatous changes in the posterior pole of the
eye.
▪Myopic discs with thinned retinal layers and oblique optic nerve
entry also present a challenge for OCT scanning.
▪ It is important in differential diagnosis to identify neurological
diseases and the changes they produce in the retinal ganglion cell
and nerve fibre layers.
10 Mardin C. OCT diagnosis in… Augenheilkunde up2date 2021; 11: 1–10 | © 2021. Thieme. All rights reserved.
Glaucoma