august 11, 2009 shrm poll: education assistance benefits
TRANSCRIPT

August 11, 2009
SHRM Poll: Education Assistance Benefits
SHRM Poll, August 10, 2009 | ©SHRM 2009 2
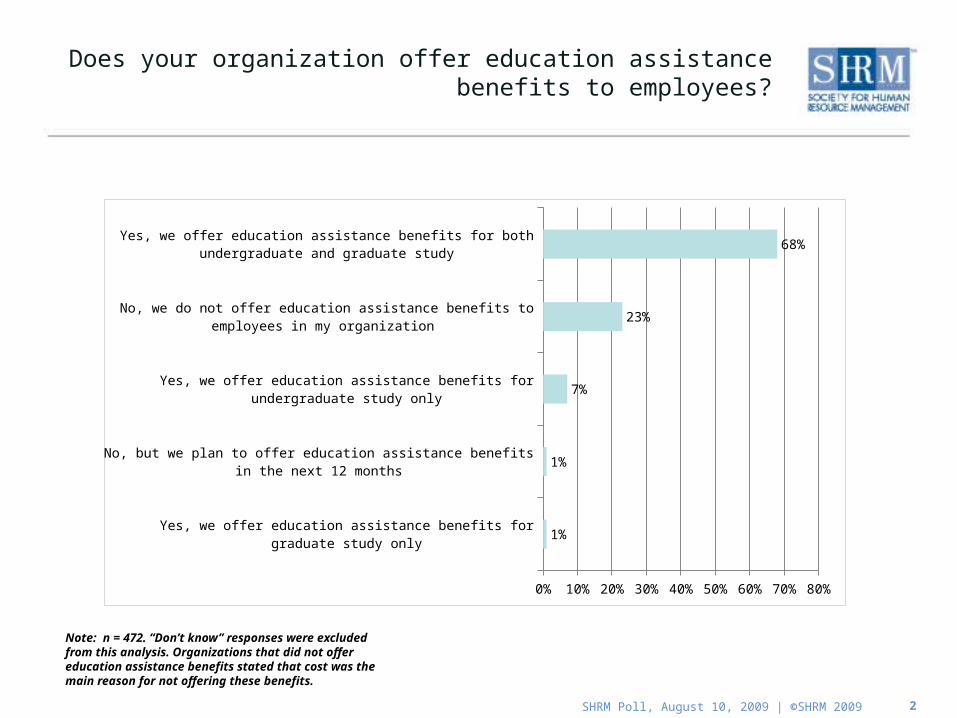
Does your organization offer education assistance benefits to employees?
Note: n = 472. “Don’t know” responses were excluded from this analysis. Organizations that did not offer education assistance benefits stated that cost was the main reason for not offering these benefits.
Yes, we offer education assistance benefits for graduate study only
No, but we plan to offer education assistance benefits in the next 12 months
Yes, we offer education assistance benefits for undergraduate study only
No, we do not offer education assistance benefits to employees in my organization
Yes, we offer education assistance benefits for both undergraduate and graduate study
0% 10% 20% 30% 40% 50% 60% 70% 80%
1%
1%
7%
23%
68%

SHRM Poll, August 10, 2009 | ©SHRM 2009 3
What is the PRIMARY reason that your organization offers education assistance benefits to employees?
Note: n = 333.
Other
As a retraining tool (i.e., help current employees for a different employment position within organization).
To provide basic knowledge skills education for employees who need to gain skills in these areas (e.g., basic science, math, business
courses).
As an employee recruitment tool that makes my organization more competitive.
To provide advanced knowledge skills education for employees who need to gain expertise in a specialized area (e.g., engineering,
software development, advanced science knowledge, etc.).
To encourage employees to pursue undergraduate and graduate degrees for their own personal development.
As an employee retention tool that makes my organization more competitive.
0% 5% 10% 15% 20% 25% 30% 35% 40%
8%
4%
6%
8%
16%
22%
36%
SHRM Poll, August 10, 2009 | ©SHRM 2009 4
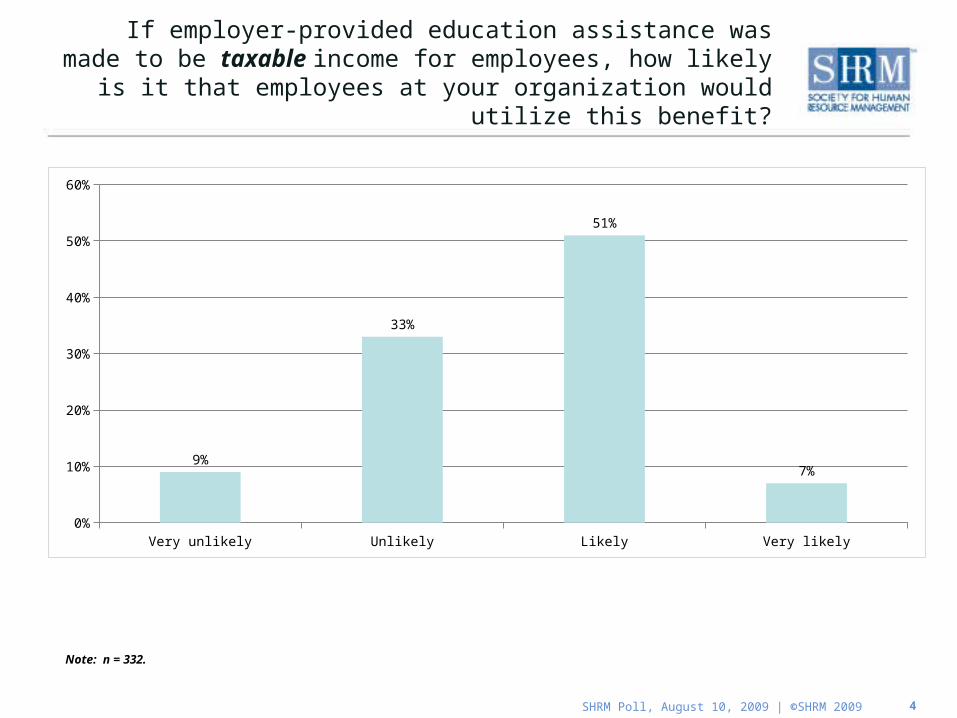
If employer-provided education assistance was made to be taxable income for employees, how likely is it that employees at your
organization would utilize this benefit?
Very unlikely Unlikely Likely Very likely0%
10%
20%
30%
40%
50%
60%
9%
33%
51%
7%
Note: n = 332.

SHRM Poll, August 10, 2009 | ©SHRM 2009 5
Do you provide education assistance benefits below, at or above the annual nontaxable federal limit of $5,250?
Below the $5,250 limit At the $5,250 limit Above the $5,250 limit0%
10%
20%
30%
40%
50%
60% 56%
24%20%
Note: n = 329.

SHRM Poll, August 10, 2009 | ©SHRM 2009 6
What is the career level of employees who utilize education assistance benefits the MOST at your organization?
Note: n = 306, “Don’t know” responses were excluded from this analysis.
Late-career workers (20+ years of professional experience)
New entrants to the workforce (less than 1 year of professional experience)
Mid-career workers (6-19 years of professional experience)
At all career levels
Early-career workers (1-5 years of professional experience)
0% 5% 10% 15% 20% 25% 30% 35% 40%
1%
2%
27%
35%
35%

SHRM Poll, August 10, 2009 | ©SHRM 2009 7
In the past 12 months, which academic fields did employees who use your organization’s education assistance benefits study/take courses in?
Note: n = 277. “Not sure“ responses were excluded from this analysis. Multiple responses were allowed. “Other” academic fields included: law/legal, medical, criminal investigation, etc.
Other
Education
Vocational
Life/physical Sciences
Undeclared or not in a degree program
Humanities/social sciences
Health
Human resources
Math/engineering
Other technical/professional
Computer/information sciences
Business (e.g., accounting, business administration, finance, marketing)
0% 10% 20% 30% 40% 50% 60% 70% 80%
12%
4%
4%
6%
8%
8%
9%
17%
18%
24%
25%
70%
SHRM Poll, August 10, 2009 | ©SHRM 2009 8
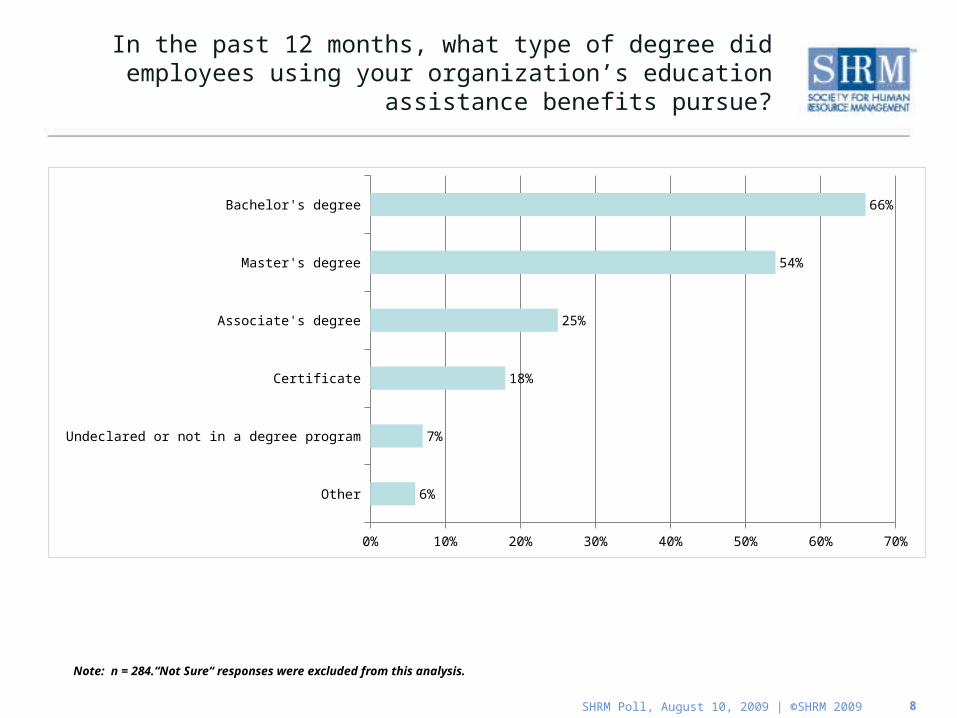
In the past 12 months, what type of degree did employees using your organization’s education assistance benefits pursue?
Other
Undeclared or not in a degree program
Certificate
Associate's degree
Master's degree
Bachelor's degree
0% 10% 20% 30% 40% 50% 60% 70%
6%
7%
18%
25%
54%
66%
Note: n = 284.“Not Sure“ responses were excluded from this analysis.
SHRM Poll, August 10, 2009 | ©SHRM 2009 9
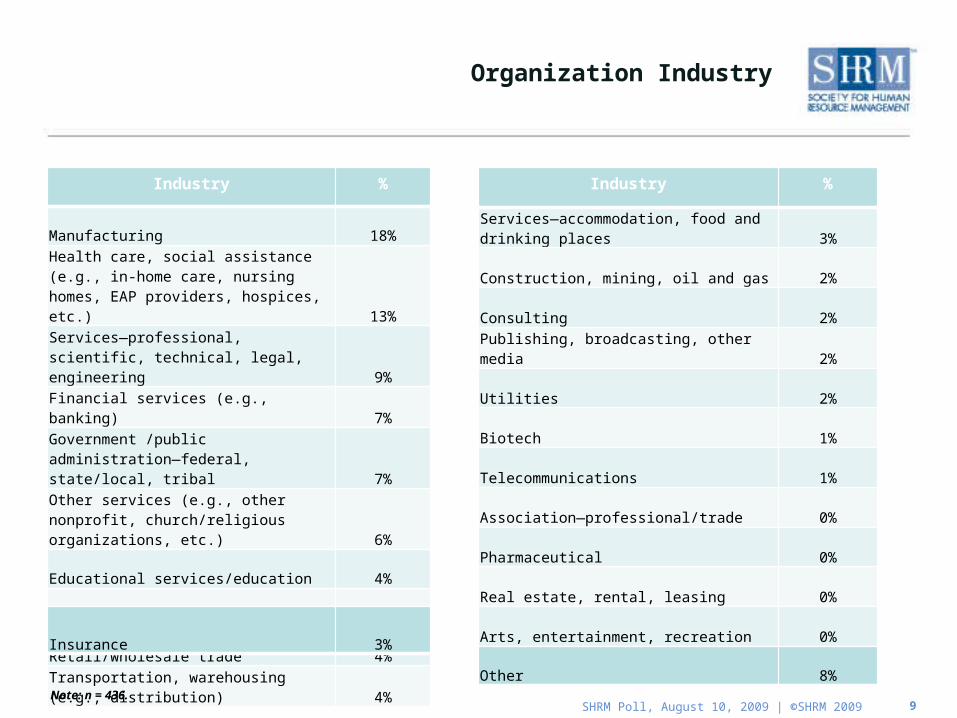
Organization Industry
Industry %
Manufacturing 18%Health care, social assistance (e.g., in-home care, nursing homes, EAP providers, hospices, etc.) 13%
Services—professional, scientific, technical, legal, engineering 9%
Financial services (e.g., banking) 7%
Government /public administration—federal, state/local, tribal 7%
Other services (e.g., other nonprofit, church/religious organizations, etc.) 6%
Educational services/education 4%
High-tech 4%
Retail/wholesale trade 4%
Transportation, warehousing (e.g., distribution) 4%
Industry %
Services—accommodation, food and drinking places 3%
Construction, mining, oil and gas 2%
Consulting 2%
Publishing, broadcasting, other media 2%
Utilities 2%
Biotech 1%
Telecommunications 1%
Association—professional/trade 0%
Pharmaceutical 0%
Real estate, rental, leasing 0%
Arts, entertainment, recreation 0%
Other 8%
Insurance 3%
Note: n = 436.

SHRM Poll, August 10, 2009 | ©SHRM 2009 10
Organization Staff Size (Full- and Part-Time)
Small (Fewer than 100 employees) Medium (100 to 499 employees) Large (500 or more employees)0%
10%
20%
30%
40%
50%
30%
40%
30%
Note: n = 312.
SHRM Poll, August 10, 2009 | ©SHRM 2009 11
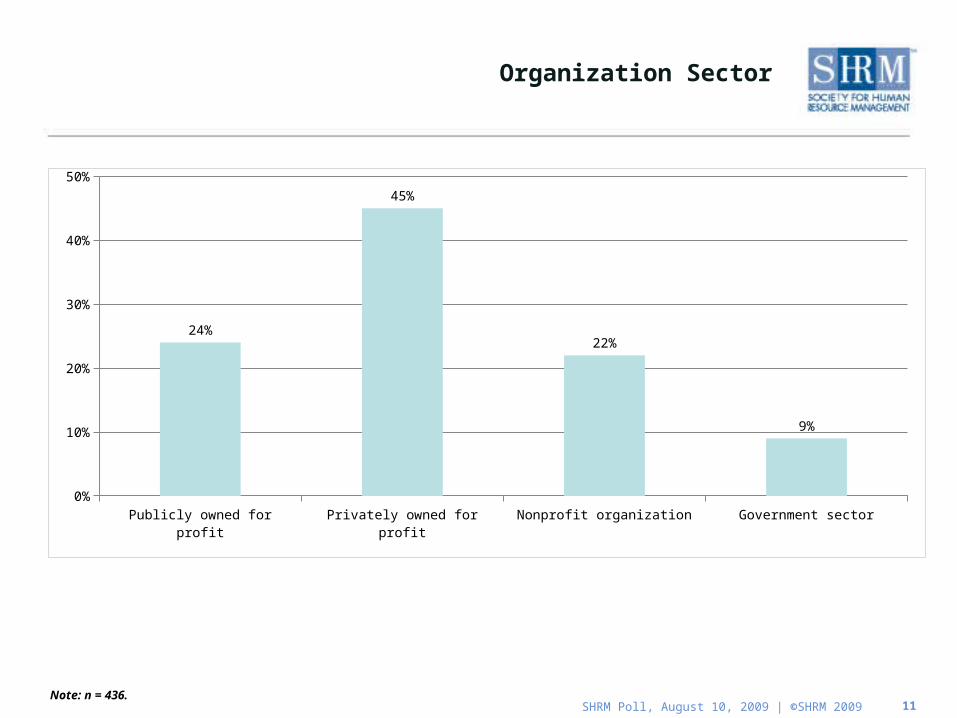
Organization Sector
Publicly owned for profit Privately owned for profit Nonprofit organization Government sector0%
10%
20%
30%
40%
50%
24%
45%
22%
9%
Note: n = 436.

SHRM Poll, August 10, 2009 | ©SHRM 2009 12
SHRM Poll: Education Assistance Benefits
• Response rate = 20%• Sample comprised of 479 randomly selected HR professionals from SHRM’s
membership.• Margin of error = +/- 5%.• Survey fielded the week of August 10, 2009.
Methodology