austin pedestrian safety action plan
TRANSCRIPT

Austin Pedestrian Safety Action PlanPedestrian Advisory CouncilNovember 7th, 2016
11/7/2016 1

Austin PSAP
peds = 29% of fatalities
11/7/2016 2

11/7/2016 3

11/7/2016 4
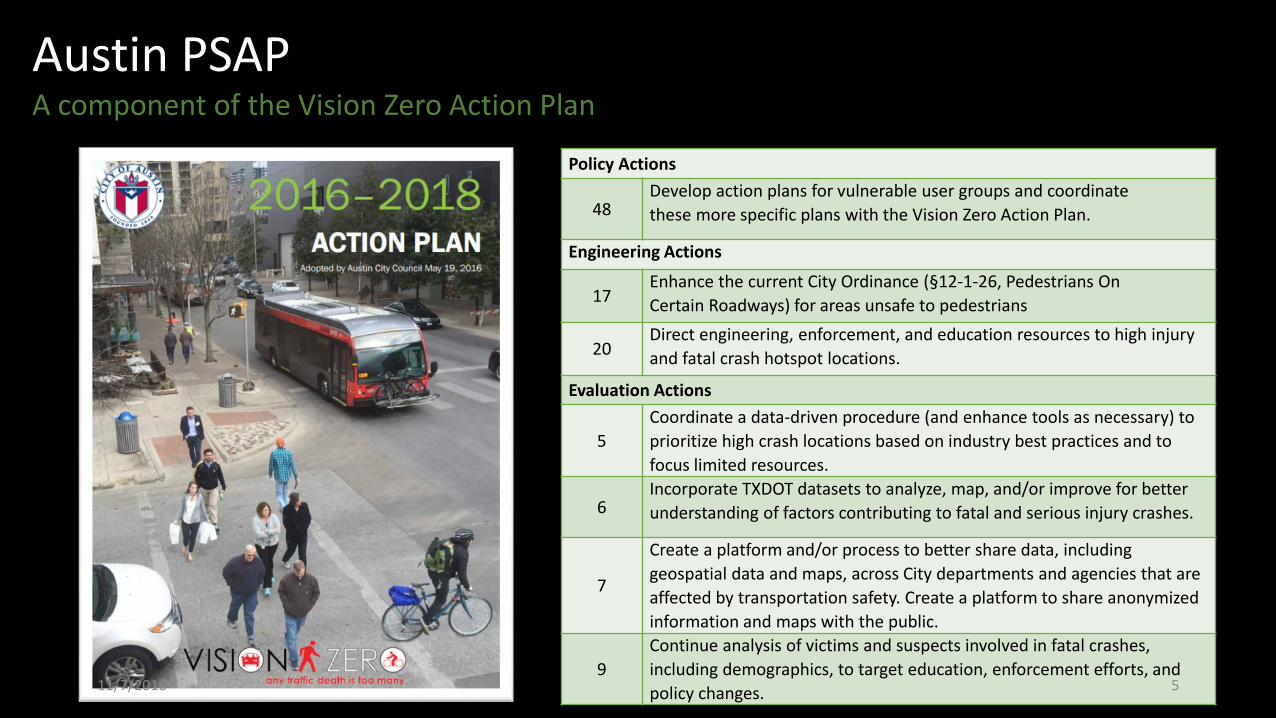
Austin PSAPA component of the Vision Zero Action Plan
Policy Actions
48Develop action plans for vulnerable user groups and coordinate
these more specific plans with the Vision Zero Action Plan.
Engineering Actions
17Enhance the current City Ordinance (§12-1-26, Pedestrians On
Certain Roadways) for areas unsafe to pedestrians
20Direct engineering, enforcement, and education resources to high injury
and fatal crash hotspot locations.
Evaluation Actions
5
Coordinate a data-driven procedure (and enhance tools as necessary) to
prioritize high crash locations based on industry best practices and to
focus limited resources.
6Incorporate TXDOT datasets to analyze, map, and/or improve for better
understanding of factors contributing to fatal and serious injury crashes.
7
Create a platform and/or process to better share data, including
geospatial data and maps, across City departments and agencies that are
affected by transportation safety. Create a platform to share anonymized
information and maps with the public.
9
Continue analysis of victims and suspects involved in fatal crashes,
including demographics, to target education, enforcement efforts, and
policy changes.11/7/2016 5

Austin Pedestrian Safety Action Planplan objectives
Support the Vision Zero Action Plan by developing a holistic strategy for addressing pedestrian safety through engineering, education, enforcement and encouragement strategies;
Utilize crash data to gain a detailed understanding of the frequency, location and causes of pedestrian-related crashes, with a focus on serious injuries and fatalities;
Identify and prioritize intersections and corridors with unsafe pedestrian conditions for further study and implement appropriate countermeasures at these locations;
Identify and prioritize areas with latent pedestrian demand that could benefit from safer crossings (i.e. Safe Routes to Schools, proximity to transit, Imagine Austin Activity Centers, etc.);
Develop a framework for evaluating the effectiveness of pedestrian safety countermeasures in Austin and for reporting these results;
Develop an ADA Transition Plan for crossings and signals as part of the PSAP.
1
2
3
4
5
6
11/7/2016 6
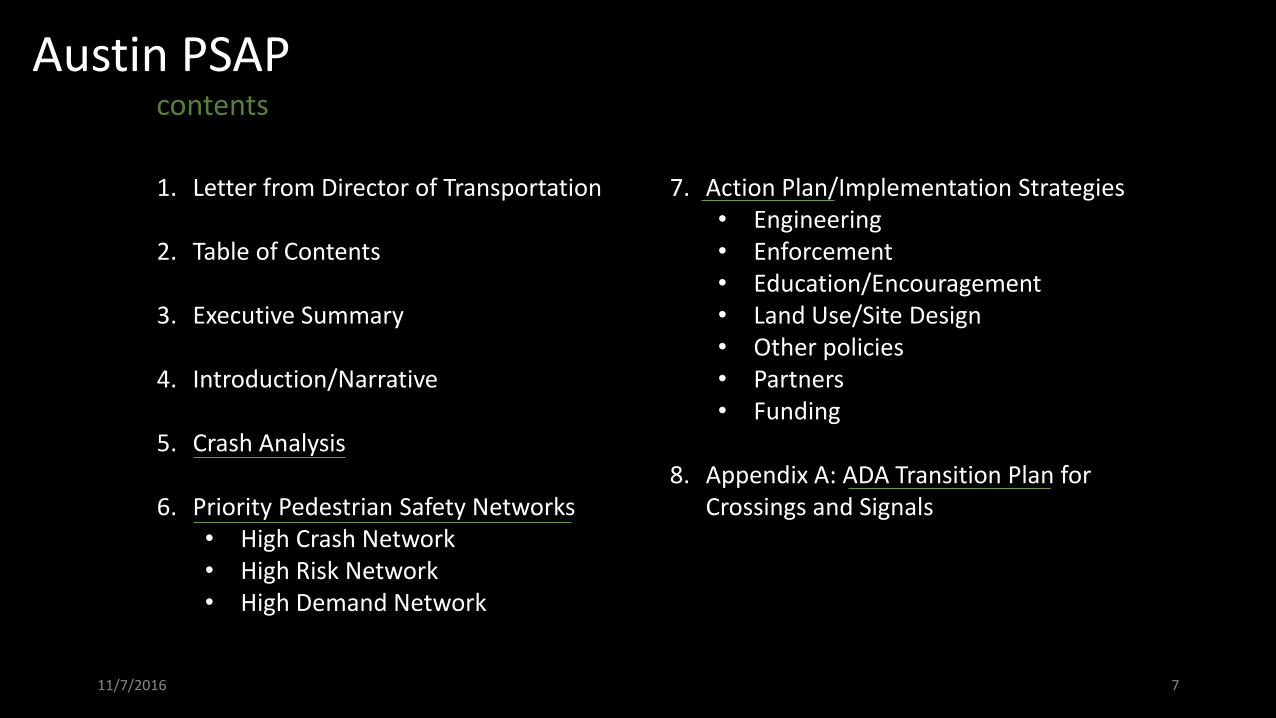
Austin PSAPcontents
1. Letter from Director of Transportation
2. Table of Contents
3. Executive Summary
4. Introduction/Narrative
5. Crash Analysis
6. Priority Pedestrian Safety Networks• High Crash Network • High Risk Network• High Demand Network
7. Action Plan/Implementation Strategies• Engineering• Enforcement• Education/Encouragement• Land Use/Site Design• Other policies• Partners• Funding
8. Appendix A: ADA Transition Plan for Crossings and Signals
11/7/2016 7

Austin PSAPADA Transition Plan for Crossings and Signals
“Any project for construction or alteration of a facility that
provides access to pedestrians must be made accessible
to persons with disabilities.”
42 U.S.C. §§ 12131 - 12134; 28 CFR §§ 35.150, 35.151; Kinney v. Yerusalim, 9 F.3d 1067 (3d Cir. 1993), cert. denied, 511 U.S. 1033 (1994). (9-12-06)”
11/7/2016 8

Austin PSAPprioritization
High Crash Network
High Risk Network
High Demand Network
11/7/2016 9

Austin PSAPprioritization
High Crash Network
High Risk Network
High Demand Network
Example Goal:
Proactively identify and implement pedestrian safety
treatments at X number of locations per year:
x# of low-cost/medium-cost treatments at High Crash locations
x# of low-cost/medium-cost treatments at High Risk locations
x# of low-cost/medium-cost treatments at High Demand locations
11/7/2016 10
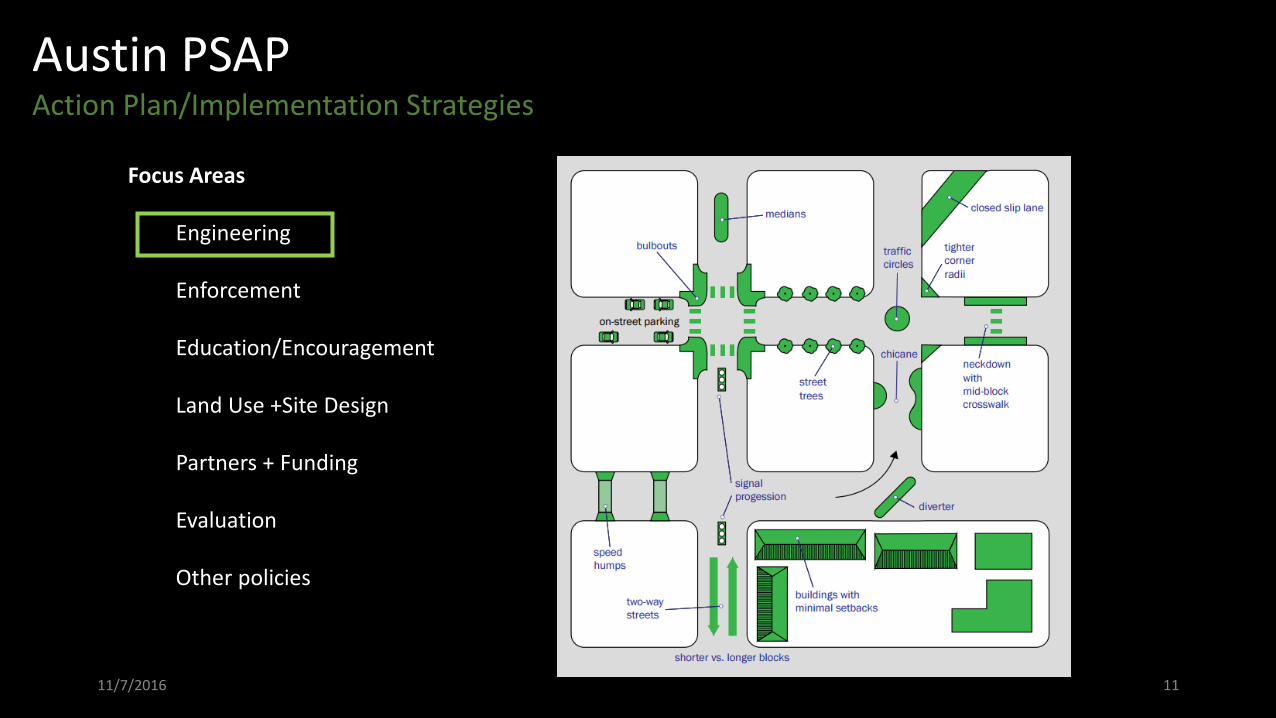
Austin PSAPAction Plan/Implementation Strategies
Focus Areas
Engineering
Enforcement
Education/Encouragement
Land Use +Site Design
Partners + Funding
Evaluation
Other policies
11/7/2016 11

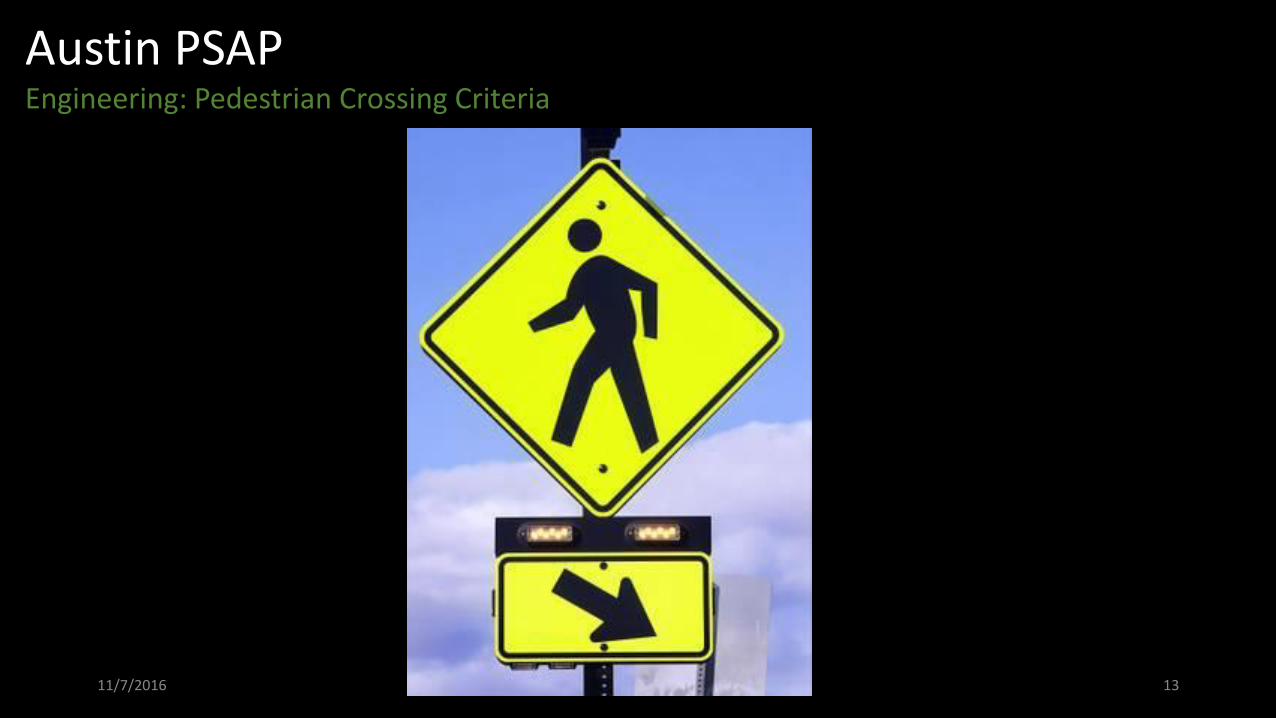
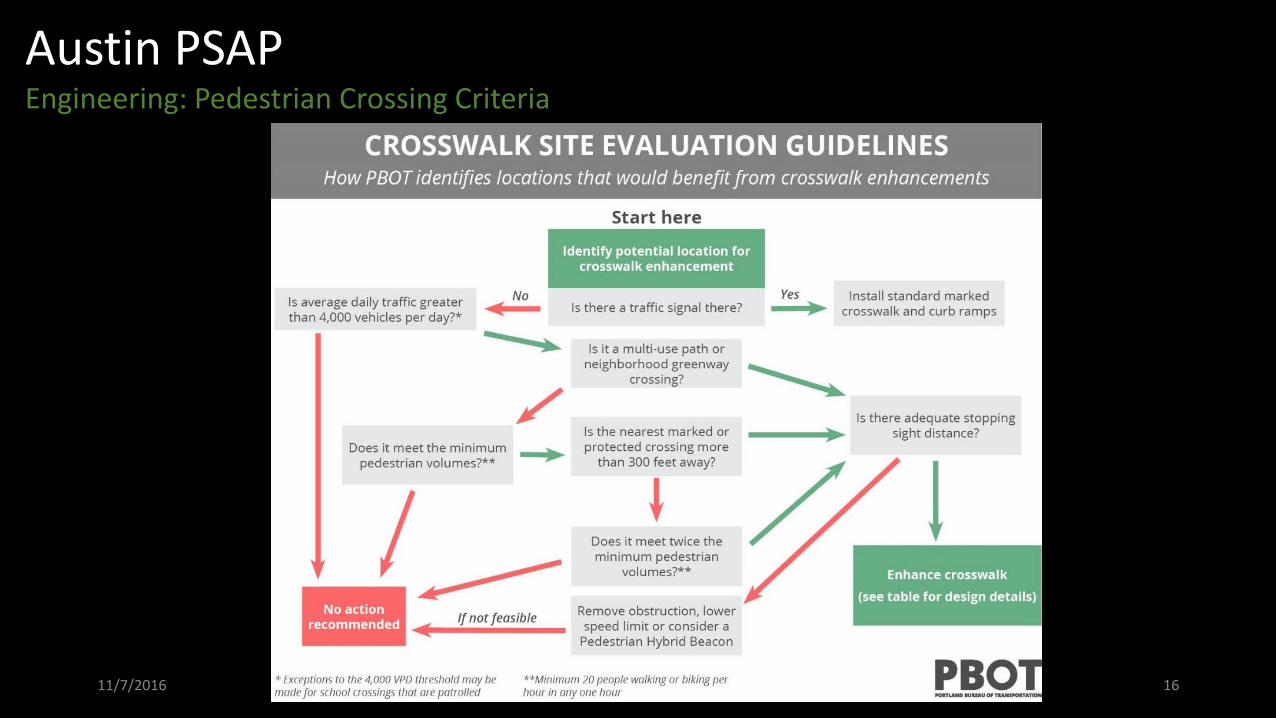
Austin PSAPEngineering: Pedestrian Crossing Criteria
11/7/2016 12
Austin PSAPEngineering: Pedestrian Crossing Criteria
11/7/2016 13
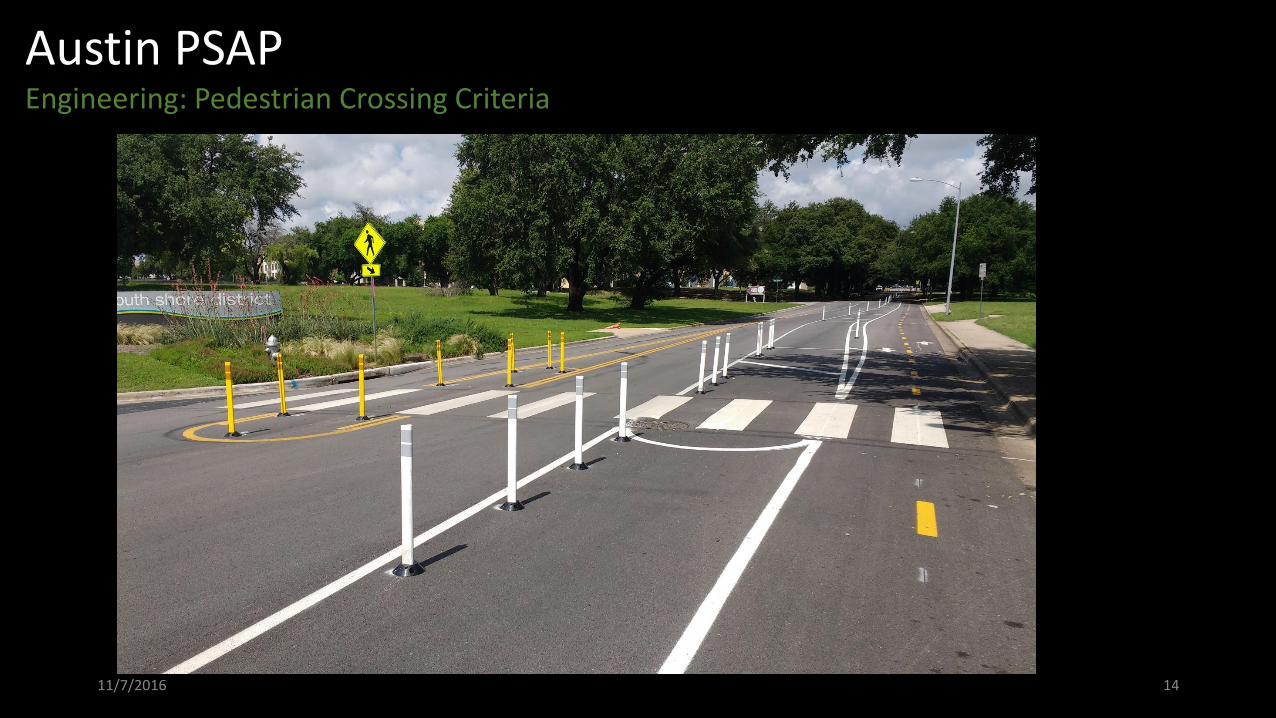
Austin PSAPEngineering: Pedestrian Crossing Criteria
11/7/2016 14

Austin PSAPEngineering: Pedestrian Crossing Criteria
11/7/2016 15
Austin PSAPEngineering: Pedestrian Crossing Criteria
11/7/2016 16

Austin PSAPEngineering: Pedestrian Crossing Criteria
11/7/2016 17

Austin PSAPcrash analysis
Objective 1: Characterize Victim Characteristics • Who is involved in pedestrian crashes/injuries/fatalities?
Objective 3: Identify and quantify High Risk Factorsassociated with pedestrian crashes, serious
injuries and fatalities
• Answers the what, when, why, and how of pedestrian
crashes.
• e.g. roadway characteristics, contributing factors,
previous movement, etc.
Objective 2: Map High Crash Network (Hot Spots) of
pedestrian serious injuries and fatalities• Answers the question, where are serious pedestrian crashes
occurring?
Objective 4: Map High Risk Network based on top
roadway risk factors
• Answers the question, what streets are prone to serious
pedestrian crashes (but may not appear in the crash
history)?
Objective 5: Map High Demand locations
• Map areas where a safer pedestrian realm might serve
latent pedestrian demand
• Answers the question, how can we help achieve
citywide objectives through a safer pedestrian
environment?
11/7/2016 18

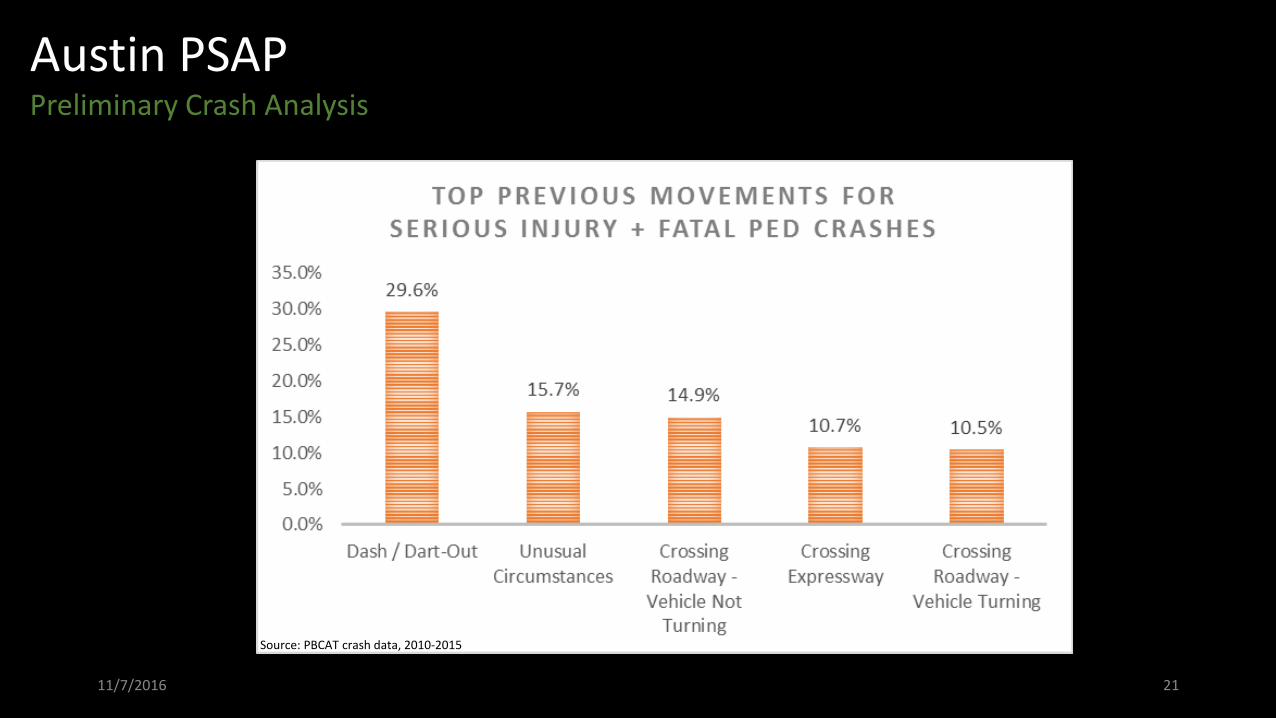
Austin PSAPPreliminary Crash Analysis
11/7/2016 19

Austin PSAPPreliminary Crash Analysis
11/7/2016 20
Austin PSAPPreliminary Crash Analysis
11/7/2016 21
Source: PBCAT crash data, 2010-2015

Austin PSAPPreliminary Crash Analysis
1361
95 51 37 180
200
400
600
800
1000
1200
1400
1600
LocalRoad/Street
InterstateHighway
State Highwayor Loop
US Highway Other (FM, Park,Private)
ALL PEDESTRIAN CRASHES BY ROAD CLASSIFICATION
11/7/2016 22
Source: PBCAT crash data, 2010-2015
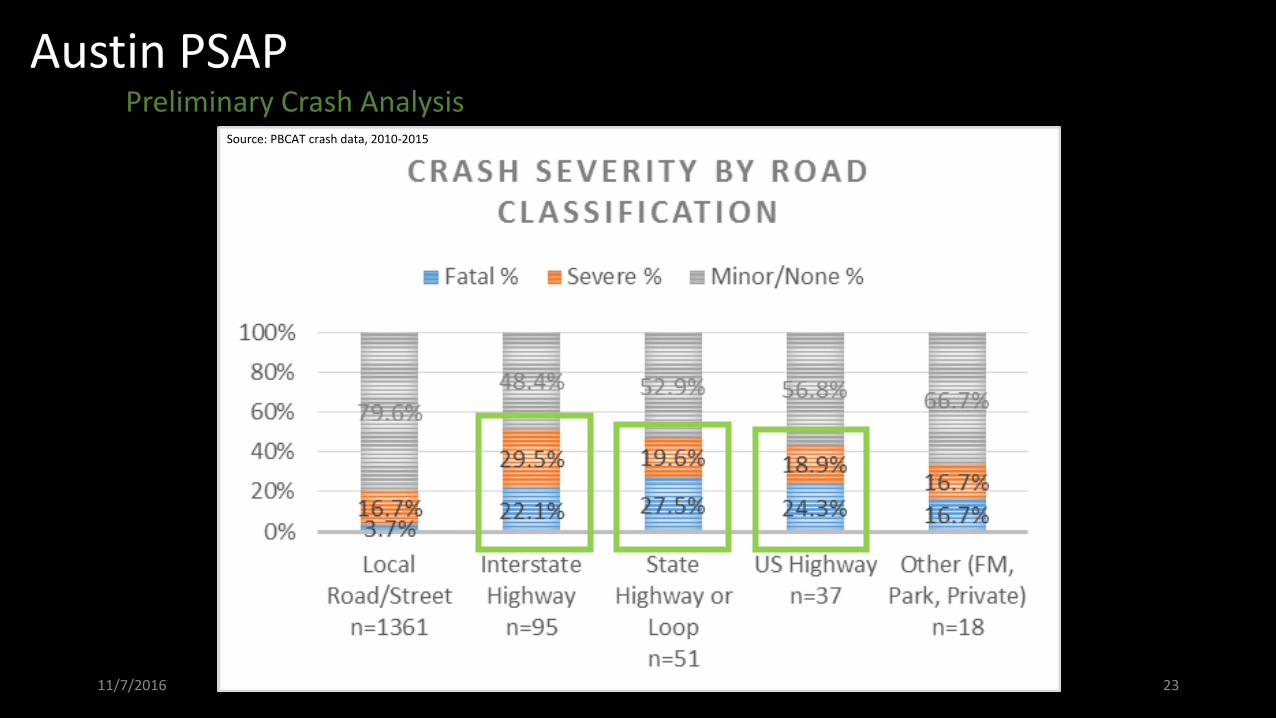
Austin PSAPPreliminary Crash Analysis
11/7/2016 23
Source: PBCAT crash data, 2010-2015
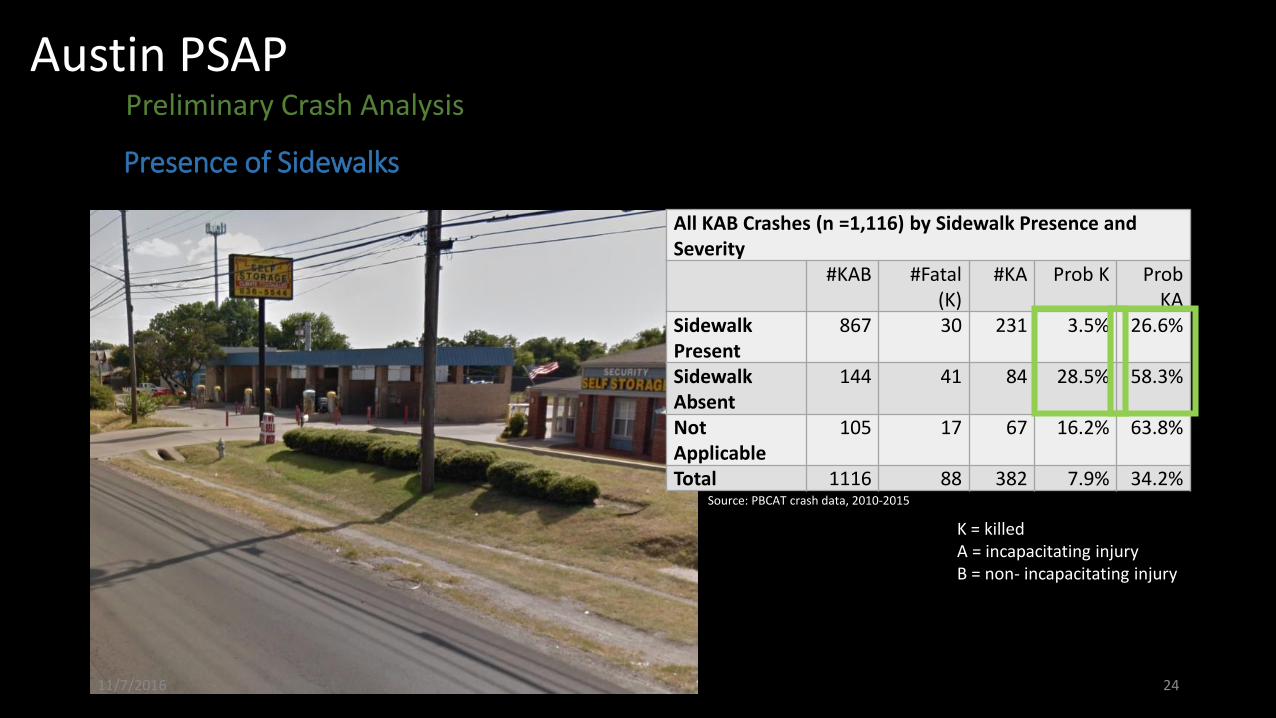
Austin PSAPPreliminary Crash Analysis
Presence of Sidewalks
All KAB Crashes (n =1,116) by Sidewalk Presence and Severity
#KAB #Fatal (K)
#KA Prob K Prob KA
Sidewalk Present
867 30 231 3.5% 26.6%
Sidewalk Absent
144 41 84 28.5% 58.3%
Not Applicable
105 17 67 16.2% 63.8%
Total 1116 88 382 7.9% 34.2%
K = killedA = incapacitating injuryB = non- incapacitating injury
11/7/2016 24
Source: PBCAT crash data, 2010-2015

Austin PSAPPreliminary Crash Analysis
Presence of Lighting
All Crashes, by lighting conditions and severityCondition All K SI K+SI %Total %K %K+SI Prob K Prob
KSIDaylight 846 16 110 126 54.2% 16.3% 33.8% 1.9% 14.9%Dark, Lighted 483 50 118 168 30.9% 51.0% 45.0% 10.4% 34.8%Dark, Not Lighted
132 29 27 56 8.5% 29.6% 15.0% 22.0% 42.4%
Dawn/Dusk 48 2 10 12 3.1% 2.0% 3.2% 4.2% 25.0%Unknown 53 1 10 11 3.4% 1.0% 2.9% 1.9% 20.8%Grand Total 1,562 98 275 373 100% 100% 100% 6.3% 23.9%
K = killedSI = seriously injured
11/7/2016 25
Source: PBCAT crash data, 2010-2015

Austin PSAPPreliminary Crash Analysis
Time of Day
K = killedSI = seriously injured11/7/2016 26Source: PBCAT crash data, 2010-2015
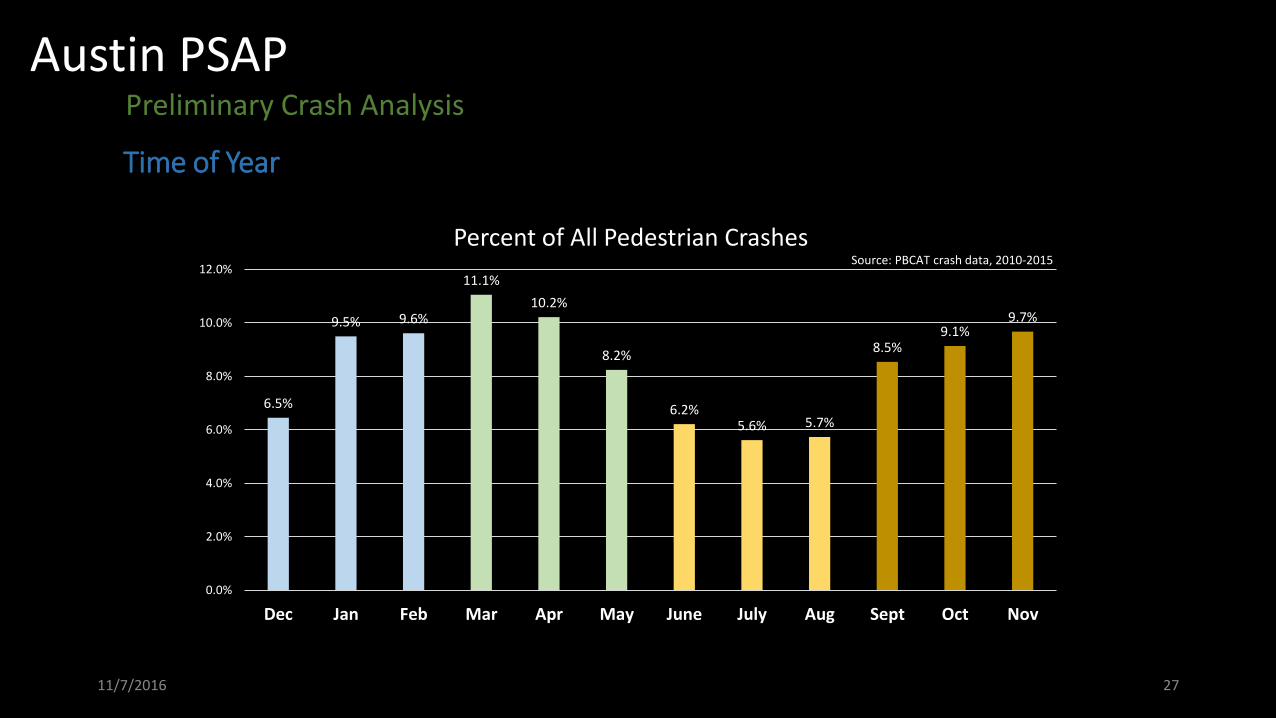
Austin PSAPPreliminary Crash Analysis
Time of Year
6.5%
9.5% 9.6%
11.1%
10.2%
8.2%
6.2%5.6% 5.7%
8.5%9.1%
9.7%
0.0%
2.0%
4.0%
6.0%
8.0%
10.0%
12.0%
Dec Jan Feb Mar Apr May June July Aug Sept Oct Nov
Percent of All Pedestrian Crashes
11/7/2016 27
Source: PBCAT crash data, 2010-2015

Austin PSAPPreliminary Crash Analysis
Time of Year
21.3%23.3% 23.6% 24.3%
21.6%
18.1%
27.9%29.8%
22.9% 23.1%
18.3%
24.1%
0.0%
5.0%
10.0%
15.0%
20.0%
25.0%
30.0%
35.0%
Dec Jan Feb Mar Apr May June July Aug Sept Oct Nov
Percentage of Crashes Resulting in K/SI by Month K = killedSI = seriously injured
11/7/2016 28
Source: PBCAT crash data, 2010-2015
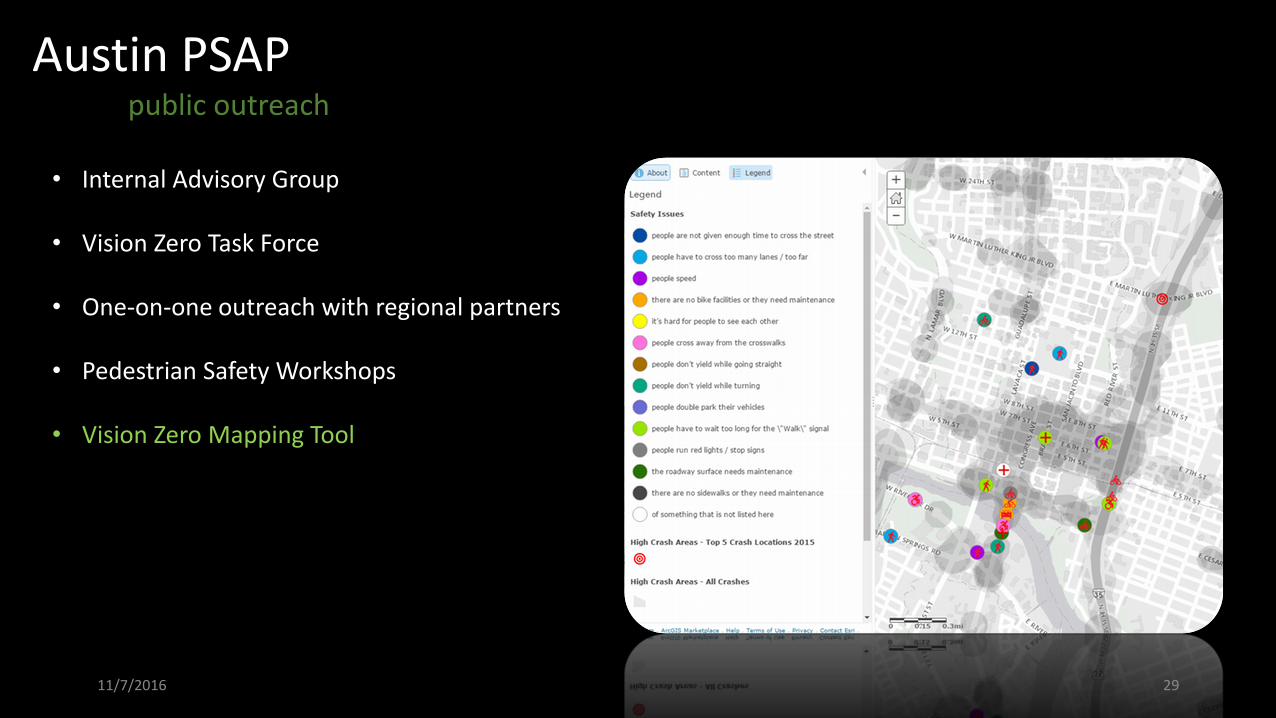
Austin PSAPpublic outreach
• Internal Advisory Group
• Vision Zero Task Force
• One-on-one outreach with regional partners
• Pedestrian Safety Workshops
• Vision Zero Mapping Tool
11/7/2016 29

Austin Pedestrian Safety Action PlanPedestrian Advisory CouncilNovember 7th, 2016
Questions?
11/7/2016 30