australia economics update - anz...economic expansion • fuel prices in australia are low relative...
TRANSCRIPT

1
Australia Economics update
Australia and New Zealand Banking Group Limited
August 2008

2
-1
0
1
2
3
4
5
6
7
8
9
70 75 80 85 90 95 00 05 10
WorldG7Emerging Economies
Real % change from year earlierGlobal economic growth
Global growth is slowing to the weakest in 5 years.......but keep it in perspective
Note: GDP is measured in US$ at purchasing power parities
Sources: IMF and Economics @ ANZ

3
Developing Asian growth will remain strong even as developed country growth slows – US not (yet) in recession
2007 2008 2009 2010
United states 2.2 0.7 0.8 2.3
Eurozone 2.7 1.8 1.4 2.2
United Kingdom 3.1 1.5 1.2 2.4
Japan 2.0 1.3 1.0 2.0
China 11.6 9.9 9.3 9.9
East Asia ex Japan & China
5.9 4.8 4.3 5.4
India 9.0 8.0 8.0 8.5
World 4.8 3.6 3.4 4.4
Sources: Economics @ ANZ
4
0
1
2
3
4
5
6
7
8
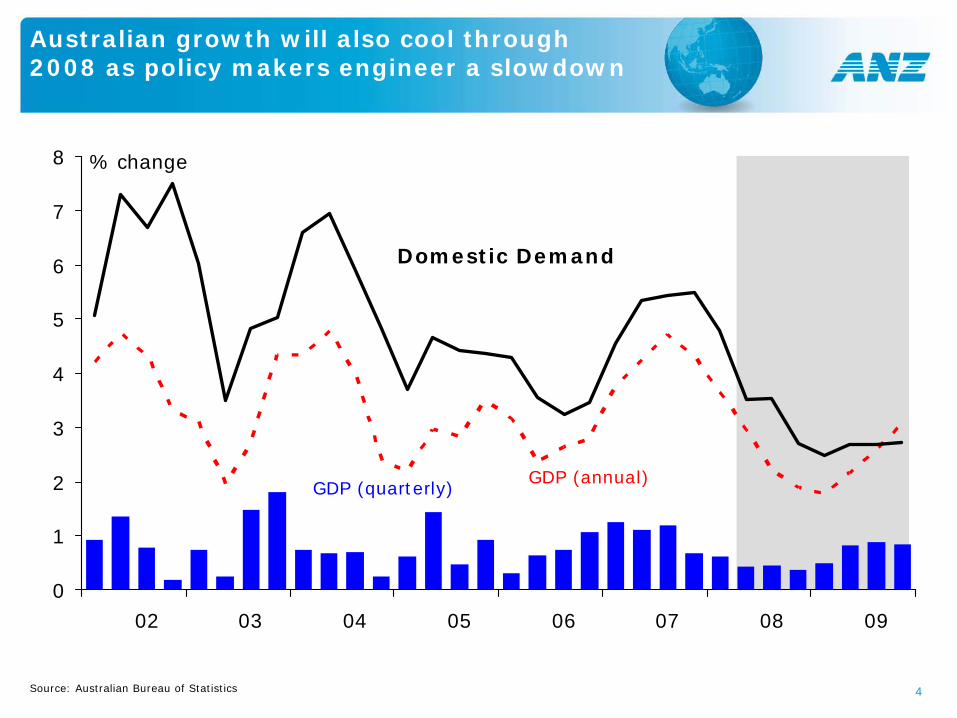
02 03 04 05 06 07 08 09
% change
GDP (quarterly)GDP (annual)
Domestic Demand
Source: Australian Bureau of Statistics
Australian growth will also cool through 2008 as policy makers engineer a slowdown

5
0.0
0.5
1.0
04 05 06 07 08
80
90
100
110
120
130
140% change (trend)
consumer confidence annualised monthly
retail sales monthly % change
Retail sales and consumer sentiment
Economic momentum slowing from higher interest rates, petrol prices and drop in confidence
Business credit
0
5
10
15
20
25
00 01 02 03 04 05 06 07 08
% change from year earlier
0
1
2
3
4
5
6
7
8
NSW SA VIC TAS ACT QLD WA NT
2006-07 (e)2007-08 (f)2008-09
%
Real Gross State Product
Sources: Australian Bureau of Statistics and Economics@ANZ & WBC

6
0
1
2
3
4
5
6
7
8
9
90 94 98 02 06
% change from year earlier
Developed Economies
Total World
Global inflation
Global inflation has spiked in 2008 to the highest since 1999 …and developed countries highest since 1991!
Note: Inflation is GDP weighted
Sources: IMF and Economics @ ANZ
5.3%
3.5%
7
0
50
100
150
200
250
300
350
01 02 03 04 05 06 07 08
US$/tonne
100
150
200
250
300
350
400
450
500
550
01 02 03 04 05 06 07 080
2
4
6
8
10
12
14
16
18
20US US
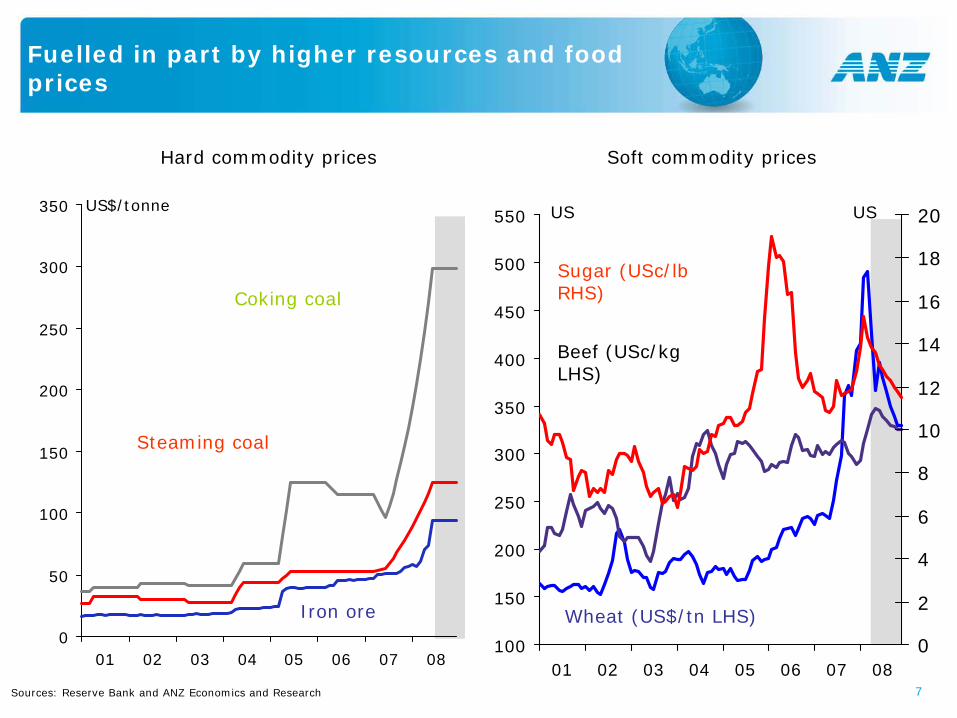
Hard commodity prices Soft commodity prices
Coking coal
Steaming coal
Iron ore
Sources: Reserve Bank and ANZ Economics and Research
Wheat (US$/tn LHS)
Beef (USc/kgLHS)
Sugar (USc/lbRHS)
Fuelled in part by higher resources and food prices

8
0
1
2
3
4
5
97 99 01 03 05 07
annual % change
Targetband
Core inflation
-1.0
0.0
1.0
2.0
3.0
4.0
5.0
6.0
02 03 04 05 06 07
annual % change
Tradeables and non-tradeables
Source: Australian Bureau of Statistics
Non tradeables
Tradeables
In Australia core inflation is at decade highs and much of it is home grown

9
65
70
75
80
85
90
95
100
105
110
115
120
2-Apr 14-May
25-Jun
6-Aug 17-Sep
29-Oct
10-Dec
21-Jan
3-Mar 14-Apr
26-May
7-Jul
Index, 2 April=100
Japan
UK
Australia
USA
Global equity markets are still taking a hammering and Australia has not been immune
International equity market comparisons
Source: Bloomberg

10
-80-40
04080
120160200
94 96 98 00 02 04 06 08
Australia’s housing market has also softened, but is unlikely to become as dire as US
-20-15-10-505
101520
01 02 03 04 05 06 07 08
% change from year earlier
Australia
US
House prices
* 90 days or more past due. For Australia, securitized mortgages only. Sources: ABS; US Commerce Department; S&P; Mortgage Bankers’ Association of America, Economics@ANZ
Mortgage delinquency rates*
0
1
2
3
4
5
01 02 03 04 05 06 07 08
% of total loans outstanding
Australia
US
0.0
0.5
1.0
1.5
2.0
01 02 03 04 05 06 07 08
% change from year earlierAustralia
US
Population growth
Housing market balance
Underlying Requirement
Completions
Forecast
11
-5
0
5
10
15
20
25
30
35
40
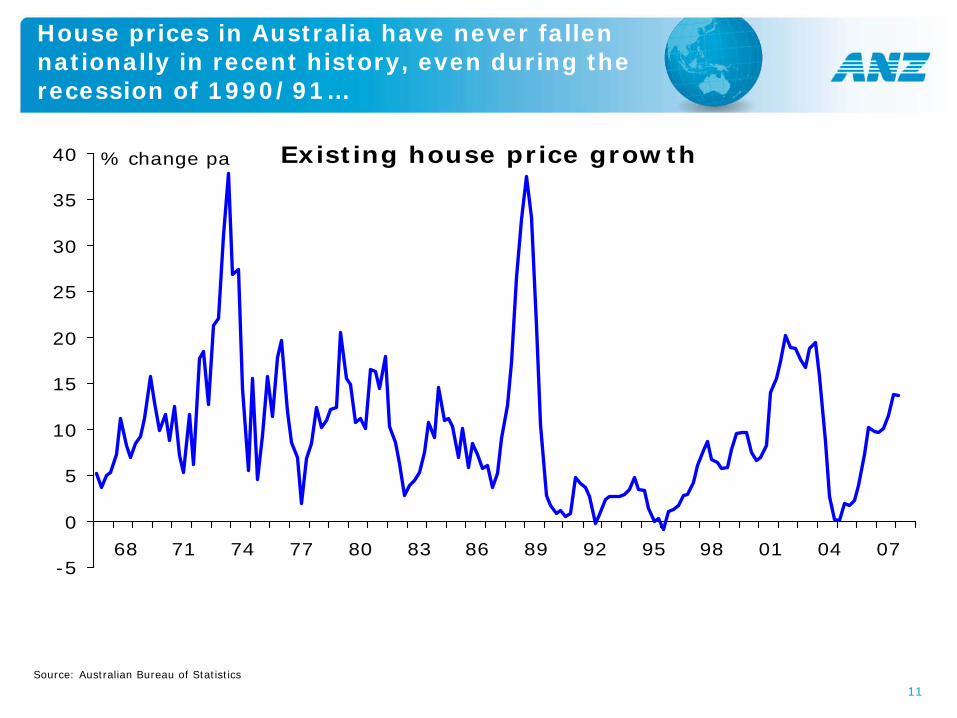
68 71 74 77 80 83 86 89 92 95 98 01 04 07
% change pa Existing house price growth
Source: Australian Bureau of Statistics
House prices in Australia have never fallen nationally in recent history, even during the recession of 1990/91…

12
Existing house prices
…although individual markets have at times gone south with Sydney the most recent example
Sources: Australian Bureau of Statistics and Economics@ANZ
100
150
200
250
300
350
400
450
500
550
02 03 04 05 06 07
$'000Sydney
Perth
Hobart
Canberra
Melbourne
Brisbane
Adelaide
Darwin

13
0
3
6
9
97 98 99 00 01 02 03 04 05 06 07 08 09
%
Australia
USA
UK
Europe
NZ
Japan
Global cash rates
Global cash rate moves have been desynchronised
Sources: Bloomberg and Economics @ ANZ

14
0
20
40
60
80
100
120
140
160
86 90 94 98 02 0660
80
100
120
140
160
180US$bbl
Crude (LHS)
Aust Petrol (RHS)
Ac litreGlobal oil and Australian petrol prices
Third oil price shock - record price highs for global oil and Australian petrol
Sources: BP Review and Economics @ ANZ
15
-100
-50
0
50
100
150
200
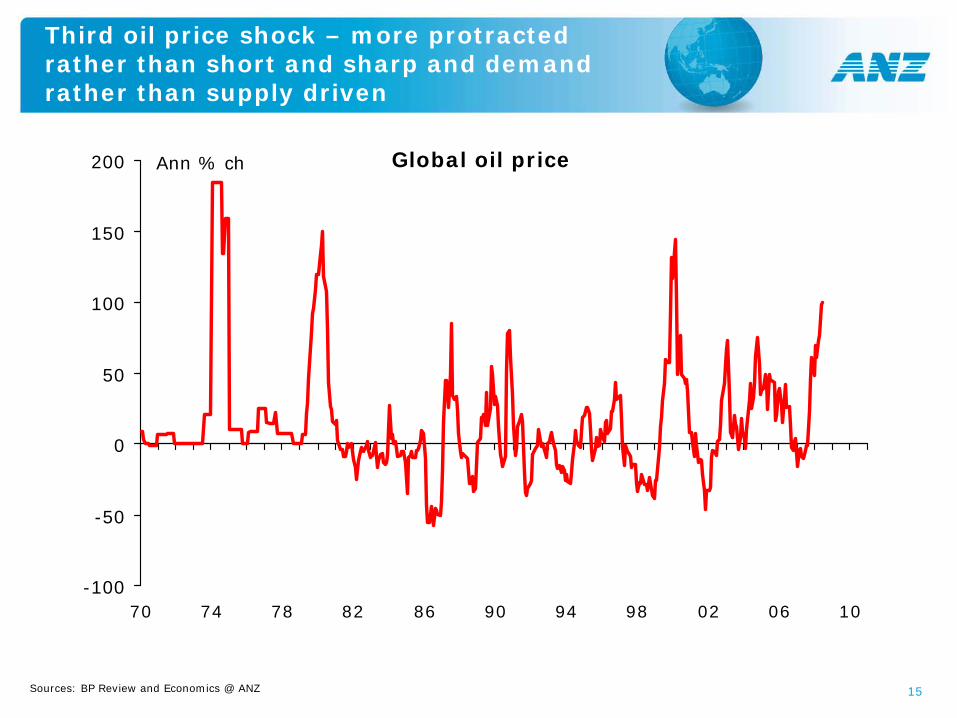
70 74 78 82 86 90 94 98 02 06 10
Ann % ch Global oil price
Third oil price shock – more protracted rather than short and sharp and demand rather than supply driven
Sources: BP Review and Economics @ ANZ

16
200
400
600
800
1000
1200
1400
80 85 90 95 00 05
Thousand million barrels
“Proven” oil reserves may be plateauing – and most reserves are in OPEC hands – although production expected to keep rising for now, so globally not yet at “peak oil”
Sources: BP Statistical Review
60
65
70
75
80
85
90
90 95 00 05 10
Mn barrels a day
World oil production
Total Reserves
OPEC Reserves
World Reserves

17
0
5
10
15
20
25
30
90 95 00 05 10
% global consumption
USA
China
US still biggest oil consumer – but it is the growth of China which is driving the big increase in demand
Sources: BP World Energy Review
Consumption of oil
18
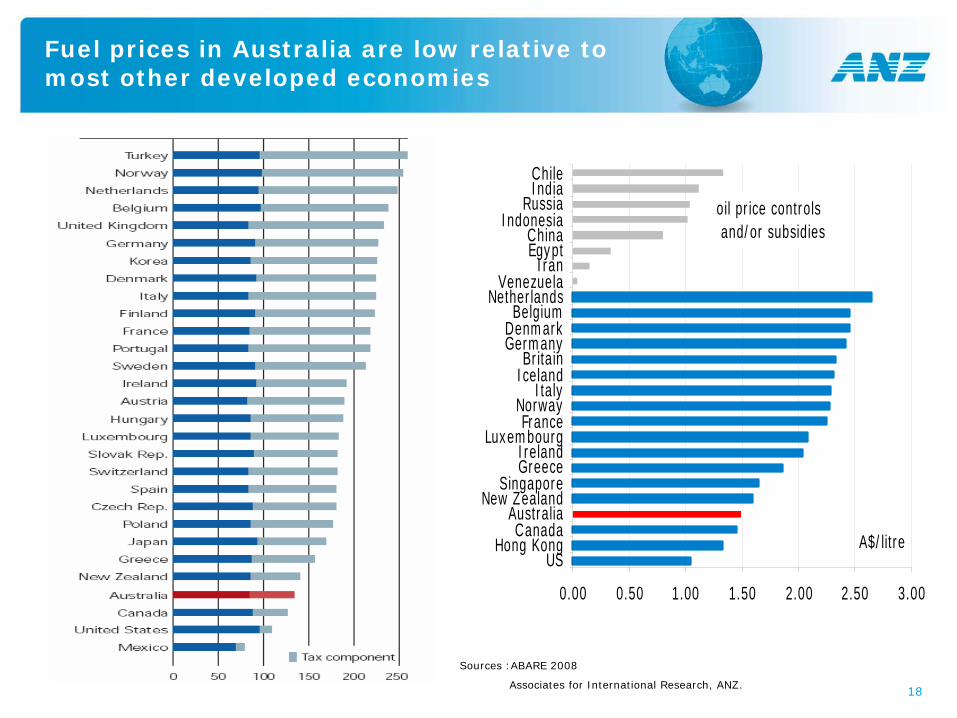
Fuel prices in Australia are low relative to most other developed economies
oil price controls and/or subsidies
0.00 0.50 1.00 1.50 2.00 2.50 3.00
USHong Kong
CanadaAustralia
New ZealandSingapore
GreeceIreland
LuxembourgFrance
NorwayItaly
IcelandBritain
GermanyDenmarkBelgium
NetherlandsVenezuela
IranEgyptChina
IndonesiaRussia
IndiaChile
A$/litre
Sources :ABARE 2008
Associates for International Research, ANZ.
19
Impacts of higher fuel costs
• For households, fuel is a smaller component of spending than commonly believed at under 3% total household spending.
• Nevertheless, if petrol price increases were at the expense of other retail spending, then each 10c increase would reduce retail spending by 0.5%.
• Average household purchases 35 litres petrol and 2.6 litres diesel weekly. At $1.50 litre that amounts to $56.40. Note that 10% households have no car so for those that do cost could be $62.65.
20
0
100
200
300
400
500
600
700
800
900
1000
70 75 80 85 90 95 00 05
000s bbls day
Consumption
Production
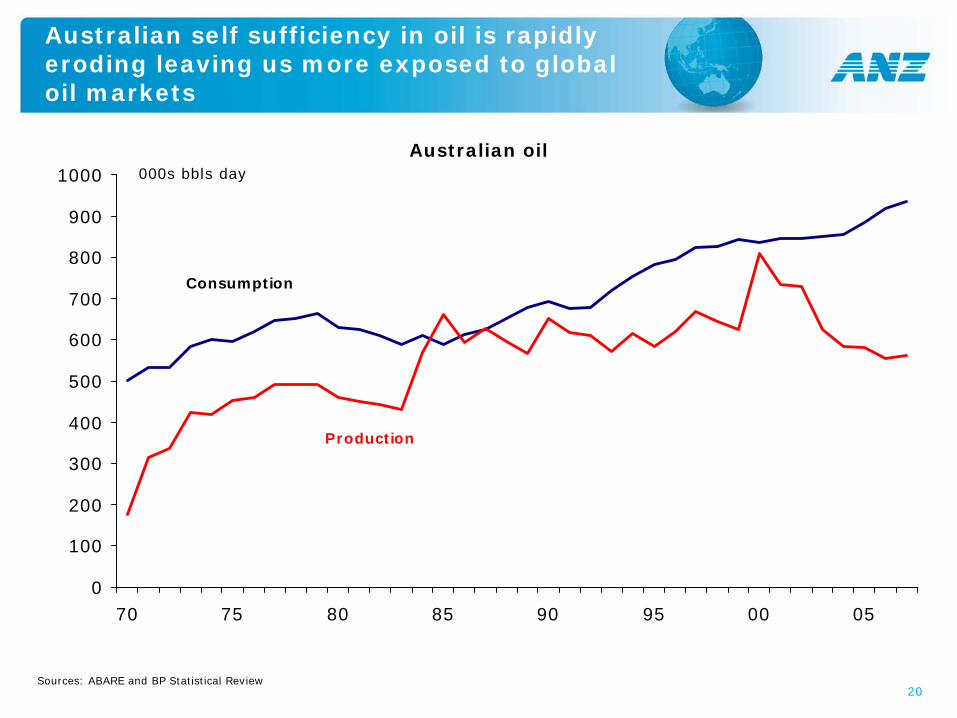
Australian oil
Australian self sufficiency in oil is rapidly eroding leaving us more exposed to global oil markets
Sources: ABARE and BP Statistical Review
21
Oil shortages – Are biofuels the answer?
• First generation biofuels essentially use food – grains and sugar and vegetable oils – to make synthetic petrol and diesel
• World Bank reports that biofuels have increased global food prices by up to 75% since 2002. More than a third of US corn now used for ethanol and half of vegetable oils in EU used for biodiesel
• Higher energy and fertiliser costs have accounted for 15% of higher food prices
• Income growth in developing nations has not been a major factor
• Biofuels derived from sugar cane have not had such a dramatic effect
• The answer might lie in “second generation” biofuels which use plant waste like sugar bagasse, stalks and wood waste

22
First Garnaut – and now the Carbon Pollution Reduction Scheme Green Paper
Reducing carbon emissions means reducing use of carbon releasing fossil fuels like oil, gas and coal, and also reducing clearing of carbon sequestering trees
The primary mechanism for reducing use of carbon is to increase its price, which will be achieved via a cap and trade emissions trading scheme
– Commencing in 1 July 2010
– Covers 1000 significant-emitting companies, responsible for around 75% of Australia’s total GHG emissions – other companies should not panic
– Agriculture, which is responsible for around 16% of GHG emissions, will be excluded till at least 2015
– Petrol will be included in the scheme, but price effect will be offset by equivalent reduction in fuel excise
– Money raised from the scheme will be used to compensate households and business. For example, emissions intensive trade exposed industries will receive free permits equivalent to up to 90% of estimated permit requirement
An emissions trading system will:
– result in higher prices for energy (+16% for electricity and +9% for gas), fuel and food
– increase inflation (+0.9%) and reduce growth
– potentially have a big impact on coal, electricity generation, transport, agriculture
Crucial details of the scheme are still to be released (such as the short-term targets and who qualifies for concessions), and the final design is still open to discussion. But it is worth keeping in mind the overall effect of the ETS must hurt to be effective and to change behaviour!
Climate Change – Adapt or Perish!

23
0
5
10
15
20
25
30
Australia USA EU UK Japan China India World
Carbon dioxide equivalents Mt pa
Greenhouse Gas Emissions per capita
Source: Stern Review
Climate change – Australia is one of the world’s biggest carbon emitters per capita

24
0
50
100
150
200
250
300
350
Electricity Industry Agriculture Methanefrom
landfill
Land use Transport FugitiveEmissions
Carbon dioxide equivalents Mt pa
Australia’s Greenhouse Gas Emissions 2006
Source: Department of Climate Change. Greenhouse gases include carbon dioxide, methane, nitrous oxide, hydrofluorocarbons, perfluorocarbons, sulphur hexafluoride
Climate change – Power generation is Australia’s biggest greenhouse gas emitter

25
Climate Change – See the opportunities, not the costs
Massive investment required in
• Water saving infrastructure
• Low carbon fuels “clean coal”
• Energy saving technology for households and business
• Alternative energy (wind, thermal, hydro, solar)
• Forestry and other carbon sequestration
• Many initiatives will be government supported and in part government funded

26
Australia – Still the lucky country despite the challenges ahead
• Although global growth is slowing, the international environment relevant to Australia will remain buoyant
• Further massive rises in commodity prices will boost income flows into Australia
• Australia has moved early to combat inflation – rates may have peaked – RBA will restore low inflation environment to underpin continued economic expansion
• Fuel prices in Australia are low relative to most other developed economies
• Climate change is a big challenge – Australia has a lot to lose from inaction but costs of mitigation will not be trivial – nevertheless presents opportunities to be a world leader
• Overall still the lucky country, still a great time to be Australian

27
0
5
10
15
20
25
00 01 02 03 04 05 06 07 08
% change from year earlier
Credit growth slowing sharply across all sectors
Sources: RBA; Economics@ANZ
Housing credit Personal credit
Business credit Total credit
0
5
10
15
20
00 01 02 03 04 05 06 07 08
% change from year earlier
0
5
10
15
20
25
00 01 02 03 04 05 06 07 08
% change from year earlier
0
5
10
15
20
00 01 02 03 04 05 06 07 08
% change from year earlier
28
-4
-2
0
2
4
6
8
10
12
14
00 01 02 03 04 05 06 07 08
% pa
China
India
Japan
Korea
Vietnam
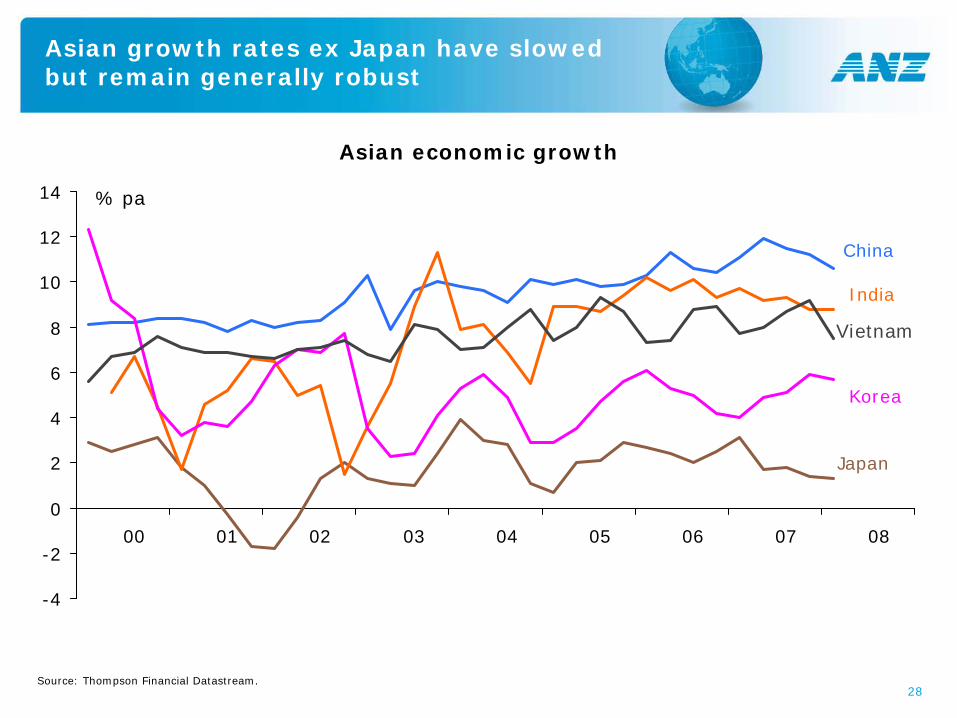
Asian growth rates ex Japan have slowed but remain generally robust
Source: Thompson Financial Datastream.
Asian economic growth
29
-5
0
5
10
15
20
25
00 01 02 03 04 05 06 07 08
% pa
China
India
Japan
Korea
Vietnam
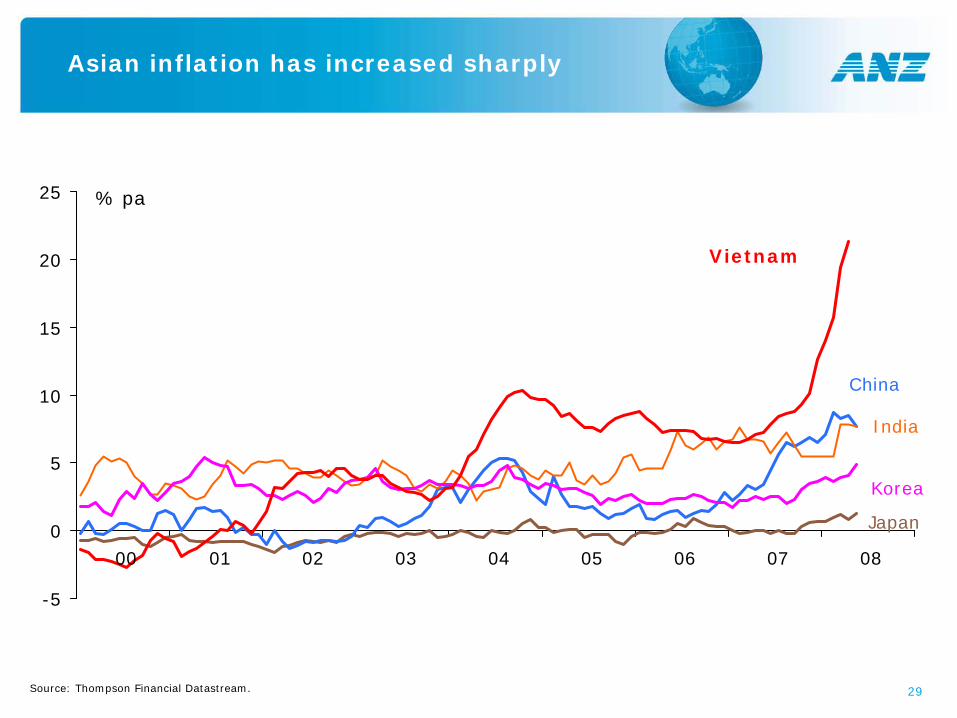
Asian inflation has increased sharply
Source: Thompson Financial Datastream.
30
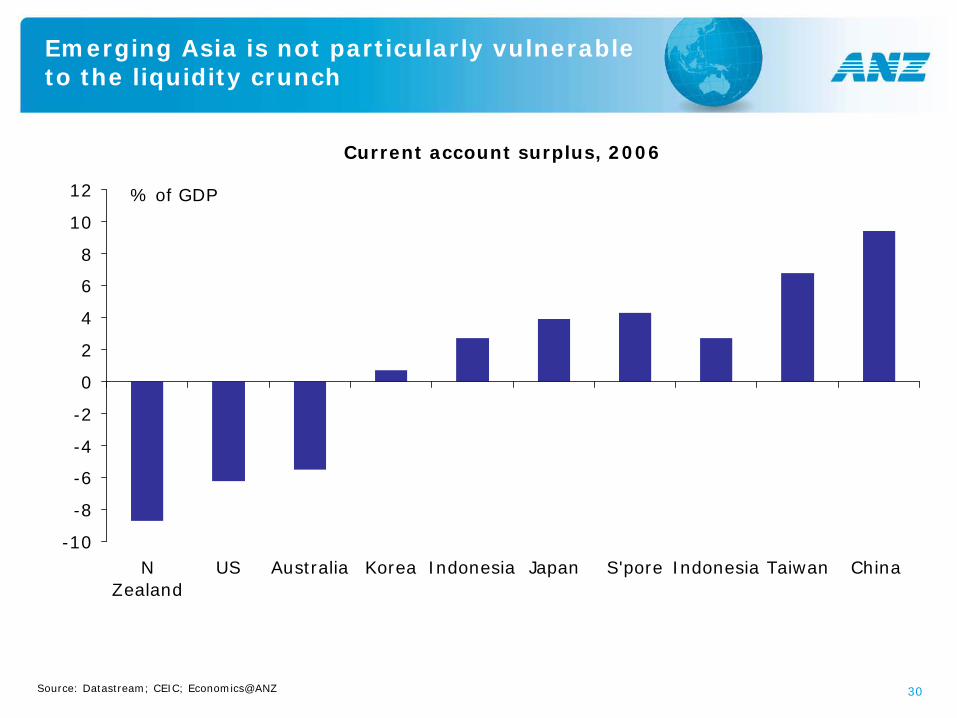
Emerging Asia is not particularly vulnerable to the liquidity crunch
-10
-8
-6
-4
-2
0
2
4
6
8
10
12
NZealand
US Australia Korea Indonesia Japan S'pore Indonesia Taiwan China
% of GDP
Current account surplus, 2006
Source: Datastream; CEIC; Economics@ANZ
31
0
200
400
600
800
1000
1200
1400
1600
90 93 96 99 02 05 08
US$bn
Japan
Russia
India
China
TaiwanKorea
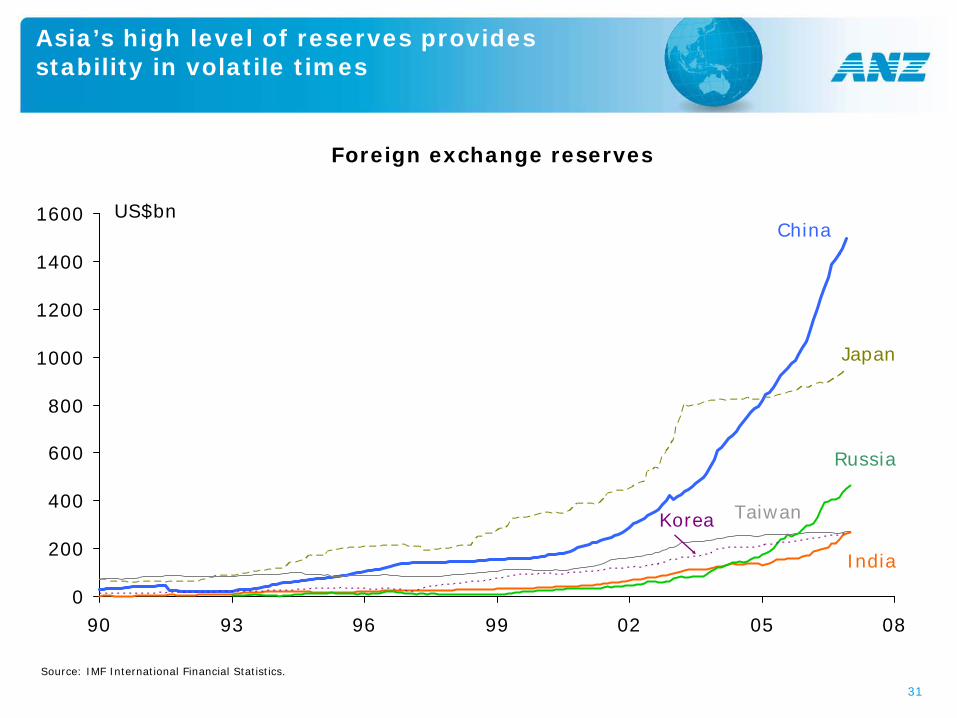
Asia’s high level of reserves provides stability in volatile times
Source: IMF International Financial Statistics.
Foreign exchange reserves

32
Disclaimer
• This document (“document”) is distributed to you in Australia and the United Kingdom by Australia and New Zealand Banking Group Limited ABN 11 005 357 522 (“ANZ”) and in New Zealand by ANZ National Bank Limited (“ANZ NZ”). ANZ holds an Australian Financial Services licence no. 234527 and is authorised in the UK by the Financial Services Authority (“FSA”).
• This document is being distributed in the United States by ANZ Securities, Inc. (“ANZ S”) (an affiliated company of ANZ), which accepts responsibility for its content. Further information on any securities referred to herein may be obtained from ANZ S upon request. Any US person(s) receiving this document and wishing to effect transactions in any securities referred to herein should contact ANZ S, not its affiliates.
• This document is being distributed in the United Kingdom by ANZ for the information of its market counterparties and intermediate customers only. It is not intended for and must not be distributed to private customers. In the UK, ANZ is regulated by the FSA. Nothing here excludes or restricts any duty or liability to a customer which ANZ may have under the UK Financial Services and Markets Act 2000 or under the regulatory system as defined in the Rules of the FSA.
• This document is issued on the basis that it is only for the information of the particular person to whom it is provided. This document may not be reproduced, distributed or published by any recipient for any purpose. This document does not take into account your personal needs and financial circumstances. Under no circumstances is this document to be used or considered as an offer to sell, or a solicitation of an offer to buy.
• In addition, from time to time ANZ, ANZ NZ, ANZ S, their affiliated companies, or their respective associates and employees may have an interest in any financial products (as defined by the Australian Corporations Act 2001), securities or other investments, directly or indirectly the subject of this document (and may receive commissions or other remuneration in relation to the sale of such financial products, securities or other investments), or may perform services for, or solicit business from, any company the subject of this document. If you have been referred to ANZ, ANZ NZ, ANZ S or their affiliated companies by any person, that person may receive a benefit in respect of any transactions effected on your behalf, details of which will be available upon request.
• The information herein has been obtained from, and any opinions herein are based upon, sources believed reliable. The views expressed in this document accurately reflect the author’s personal views, including those about any and all of the securities and issuers referred to herein. The author however makes no representation as to its accuracy or completeness and the information should not be relied upon as such. All opinions and estimates herein reflect the author’s judgement on the date of this document and are subject to change without notice. No part of the author's compensation was, is or will directly or indirectly relate to specific recommendations or views expressed about any securities or issuers in this document. ANZ, ANZ NZ, ANZ S, their affiliated companies, their respective directors, officers, and employees disclaim any responsibility, and shall not be liable, for any loss, damage, claim, liability, proceedings, cost or expense (“Liability”) arising directly or indirectly (and whether in tort (including negligence), contract, equity or otherwise) out of or in connection with the contents of and/or any omissions from this communication except where a Liability is made non-excludable by legislation.
• Where the recipient of this publication conducts a business, the provisions of the Consumer Guarantees Act 1993 (NZ) shall not apply..
Important NoticeAustralia and New Zealand Banking Group Limited is represented in:AUSTRALIA by:Australia and New Zealand Banking Group Limited ABN 11 005 357 52210th Floor 100 Queen Street, Melbourne 3000, AustraliaTelephone +61 3 9273 6224 Fax +61 3 9273 5711UNITED KINGDOM by:Australia and New Zealand Banking Group LimitedABN 11 005 357 52240 Bank Street, Canary Wharf, London, E14 5EJ, United KingdomTelephone +44 20 3229 2121 Fax +44 20 7378 2378
UNITED STATES OF AMERICA by:ANZ Securities, Inc. (Member of NASD and SIPC)6th Floor 1177 Avenue of the AmericasNew York, NY 10036, United States of AmericaTel: +1 212 801 9160 Fax: +1 212 801 9163NEW ZEALAND by:ANZ National Bank LimitedLevel 7, 1-9 Victoria Street, Wellington, New ZealandTelephone +64 4 802 2000

33
The material in this presentation is general background information about the Bank’s activities current at the date of the presentation. It is information given in summary
form and does not purport to be complete. It is not intended to be relied upon as advice to investors or potential investors and does not take into account the investment
objectives, financial situation or needs of any particular investor. These should be considered, with or without professional advice when deciding if an investment is
appropriate.
For further information visit
www.anz.comor contact
Jill CraigHead of Investor Relations
ph: (613) 9273 4185 fax: (613) 9273 4091 e-mail: [email protected]