australian aviation safety in review · pdf fileaustralian aviation safety in review chapter 1...
TRANSCRIPT
ATSB TRANSPORT SAFETY REPORT Aviation Research and Analysis Report
First edition 2007
Australian Aviation Safety in Review
AT
SB
A
ustralian Aviation Safety in Review
Firstedition
2007
Mar
2007
/DO
TAR
S 50
154
Australian Aviation Safety in R
eview

ATSB TRANSPORT SAFETY REPORT Aviation Research and Analysis Report
First edition 2007
Australian Aviation Safety in Review

ii Australian Aviation Safety in Review
Published by: Australian Transport Safety Bureau
Postal address: PO Box 967, Civic Square ACT 2608
Office location: 15 Mort Street, Canberra City, Australian Capital Territory
Telephone: 1800 621 372; from overseas + 61 2 6274 6440
Accident and serious incident notification: 1800 011 034 (24 hours)
Facsimile: 02 6274 6474; from overseas + 61 2 6274 6474
E-mail: [email protected]
Internet: www.atsb.gov.au
© Commonwealth of Australia 2007.
This work is copyright. In the interests of enhancing the value of the information contained in this
publication you may copy, download, display, print, reproduce and distribute this material in unaltered form
(retaining this notice). However, copyright in the material obtained from non-Commonwealth agencies,
private individuals or organisations, belongs to those agencies, individuals or organisations. Where you want
to use their material you will need to contact them directly.
Subject to the provisions of the Copyright Act 1968, you must not make any other use of the material in
this publication unless you have the permission of the Australian Transport Safety Bureau.
Please direct requests for further information or authorisation to:
Commonwealth Copyright Administration, Copyright Law Branch
Attorney-General’s Department, Robert Garran Offices, National Circuit, Barton ACT 2600
www.ag.gov.au/cca
ISBN: 978-1-921164-48-4
Australian Aviation Safety in Review iii
CONTENTS
Purpose of the report iv
Deputy Prime Minister’s foreword v
Part 1: The Australian aviation sector 1
How is Australia’s aviation industry organised? 1
How many aircraft are registered in Australia? 2
Annual flight hours 1995–2005 5
Aircraft age 9
How many licensed pilots and engineers are in Australia? 11
Sport aviation 17
Part 2: Aviation accidents, fatal accidents and fatalities 21
ATSB’s incident and occurrence database 21
Regular public transport accident statistics 22
General aviation accident statistics 26
Fixed vs. Rotary wing accident statistics 30
Part 3: Aviation accident analysis 35
Classifying accidents 36
Phase of flight analysis 41
Weather – an influential factor 45
Part 4: International comparisons 47
How does Australia’s aviation safety record compare with that of other Western countires 47
Appendices 51
About the ATSB 51
Data sources 52
Glossary 53

iv Australian Aviation Safety in Review
Purpose of the report
Each year the United States’ Aircraft Owner’s and Pilots Association (AOPA) Air Safety Foundation releases a report summarising the accident trends and factors for general aviation (GA) for the previous calendar year. The Nall Report has established itself as one of the aviation community’s benchmark reports and its release is anticipated across the industry. The report provides essential data in an easy-to-read format, giving a broad overview of the state of general aviation and safety trends in the US.
As part of the Australian Transport Safety Bureau’s (ATSB) mission to enhance public awareness of aviation safety, the Australian Aviation Safety in Review – 2007 has been developed to provide a readily accessible analysis of the Australian aviation sector, with a strong focus on safety trends. Unlike the Nall Report, this publication covers all major categories of aircraft operations, from Regular Public Transport (RPT) to general aviation, and even some information about sports aviation.
Additionally, some demographic data on Australian aviation is provided in order to measure the levels of aviation activity in Australia, and provide a context within which to examine the accident trends. Accident rates are presented both in terms of the number of accidents and as rates per 100,000 hours, to enable comparison between operational categories. The latest year for which flying hours are available is 2005. Accordingly, this inaugural edition of the Australian Aviation Safety in Review – 2007 covers the calendar years 2001 to 2005, offering insights and information about key trends and emerging issues.
The ATSB intends to release this report on a regular basis as a means of informing both the aviation community and the wider public about Australian aviation accident and activity trends.
If you have any comments or suggestions about the format of this report or the information it covers, the ATSB would be keen to receive your feedback. You can contact us at <[email protected]> or by mail to:
Aviation Research ATSB PO Box 967 Civic Square ACT 2608 Australia

Australian Aviation Safety in Review v
Deputy Prime Minister’s foreword
I am very pleased to release the first edition of Australian Aviation Safety in Review, which is published by the Australian Transport Safety Bureau. The review aims to make some basic information about Australian aviation available to a broad audience in an easy to read format.
The report covers the years from 2001 to 2005 and is divided into four parts. The first part deals with the size and structure of Australia’s aviation sector. It includes data on the organisation of Australian aviation and useful information about the number of
aircraft, the hours flown each year, and the age of different categories of aircraft.
The next two sections deal with aspects of aviation safety. Part 2 examines the number of accidents, fatal accidents and the rate of accidents and fatal accidents expressed as a proportion of annual flying hours. Part 3 takes a closer look at the nature of accidents in Australia. It identifies the most common type of accidents and analyses accidents by phase of flight.
Part 4 is a special topic section that compares Australia’s aviation safety with the United States, Canada, New Zealand and the United Kingdom.
The review highlights Australia’s strong air safety record, but we must never become complacent about it. The only way to maintain the safety of our skies is through constant vigilance and the efforts of everyone in the aviation industry.
I commend the report to you.
MARK VAILE

vi Australian Aviation Safety in Review
“By the end of 2005 there were 12,536 aircraft
with a VH registration operating in Australia.”

Australian Aviation Safety in Review �
Chapter 1
The Australian aviation sector
How is Australia’s aviation industry organised?The Australian aviation industry can be divided into four categories.The two main categories are regular public transport (often abbreviated to RPT), and general aviation (normally referred to as GA). The RPT services are airline operations that operate according to a fixed schedule, providing carriage for fare-paying passengers and/or cargo services. Regular public transport services are further divided into high capacity and low capacity, determined by the number of passengers that can be carried or the amount of cargo that can be loaded. The other major portion of the aviation industry is categorised as general aviation. General aviation covers a very diverse set of aviation activities including chartered flights, aerial agriculture, flying training and private flying. The two other categories of flying operation are military aviation (not covered by this report) and sport aviation, which includes gliders, ballooning and ultralight aircraft. The definitions for each category are set out in the glossary.
FIGURE 1: The composition of the Australian aviation industry
All Australian Aviation
Regular public transport General aviation
Sport aviationMilitary aviation
CharterHigh capacity regular public transport
Low capacity regular public transport
Agriculture
Other aerial workFlying training
Private/business

� Australian Aviation Safety in Review
How many aircraft are registered in Australia?Aircraft in Australia are registered with the Civil Aviation Safety Authority (CASA), the government agency responsible for regulating civil aviation in Australia. Aircraft having the prefix ‘VH’ identify them as Australian registered. By the end of 2005 there were 12,536 aircraft with a VH registration operating in Australia. That’s nearly 1000 more aircraft than 5 years earlier, and around 2000 more than a decade ago. The vast bulk of aircraft registered in Australia come within the GA category, which accounts for more than 80 per cent of aircraft in Australia.
CASA records data on aircraft registrations with categories determined by an aircraft’s maximum take-off weight (MTOW). For historical reasons, a distinction is made between aircraft with a MTOW below 5,700 kg and those above that weight. Aircraft below 5,700 kg include most aircraft in the GA category, from small two-seat training aircraft to aircraft typically used in charter and low capacity RPT. Aircraft above this weight category include turboprop and turbofan aircraft found in corporate aviation and the airlines.
FIGURE 2: Australian aircraft registered 1928 to 2005
14,000
12,000
10,000
8,000
6,000
4,000
2,000
0
1928
1930
1935
1940
1945
1950
1955
1960
1965
1970
1975
1980
1985
1990
1995
2000
2004
2005
Num
ber o
f airc
raft
regi
ster
ed
Calendar year
Source: CASA
There were nearly 10,000 fixed-wing aircraft on the Australian register in 2005. By comparison, there were 1,291 rotary-wing aircraft (helicopters) registered by the end of 2005. Although fewer rotary-wing aircraft are registered in Australia, the number has been growing steadily over the last decade. Just 700 helicopters were registered in Australia in 1995.

Australian Aviation Safety in Review �
FIGURE 3: Proportion of aircraft by category in 2005
Source: CASA
2005 at a glance
Number of aircraft registered
Aircraft below 5,700 kg MTOW 9,218
Aircraft above 5,700 kg MTOW 569
Helicopters 1,291
Sport 1,458
Total 12,536
Aircraft below 5,700 kg MTOW 73%
Aircraft above 5,700 kg MTOW 5%
Sport 12%
Helicopters 10%

� Australian Aviation Safety in Review
“Total flying activity has been on the rise
since the middle of the last decade...”
Australian Aviation Safety in Review �
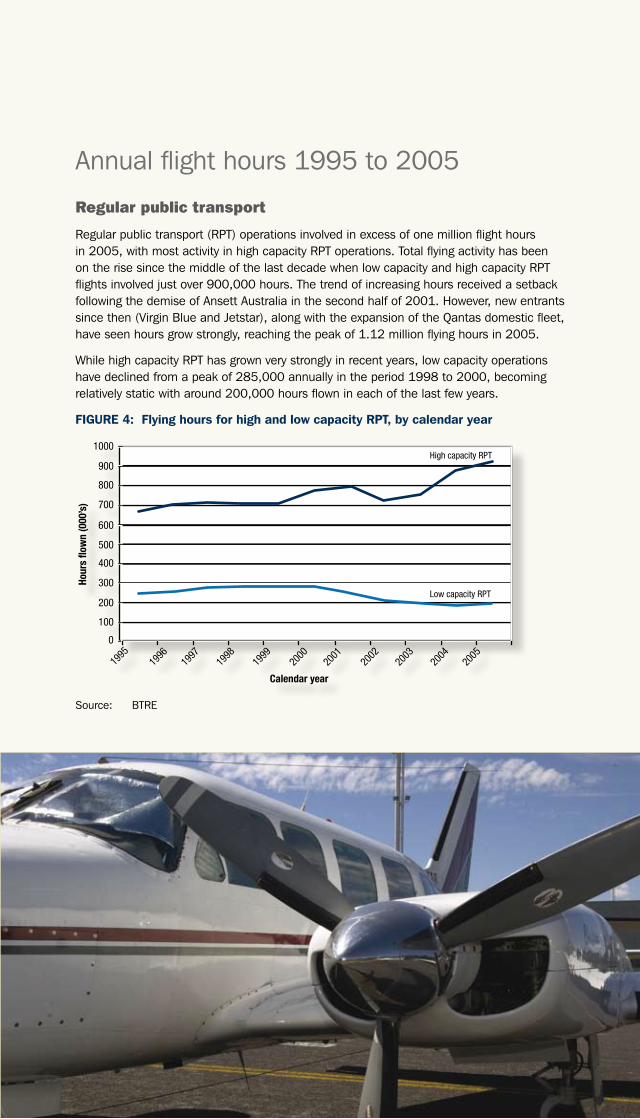
Annual flight hours 1995 to 2005
Regular public transport
Regular public transport (RPT) operations involved in excess of one million flight hours in 2005, with most activity in high capacity RPT operations. Total flying activity has been on the rise since the middle of the last decade when low capacity and high capacity RPT flights involved just over 900,000 hours. The trend of increasing hours received a setback following the demise of Ansett Australia in the second half of 2001. However, new entrants since then (Virgin Blue and Jetstar), along with the expansion of the Qantas domestic fleet, have seen hours grow strongly, reaching the peak of 1.12 million flying hours in 2005.
While high capacity RPT has grown very strongly in recent years, low capacity operations have declined from a peak of 285,000 annually in the period 1998 to 2000, becoming relatively static with around 200,000 hours flown in each of the last few years.
FIGURE 4: Flying hours for high and low capacity RPT, by calendar year
Source: BTRE
Calendar year
High capacity RPT
Low capacity RPT
Hour
s flo
wn
(000
’s)
1995
1996
1997
1998
1999
2000
2001
2002
2003
2004
2005
0
100
200
300
400
500
600
700
800
900
1000

� Australian Aviation Safety in Review
General aviation
Nearly twice as many hours are flown each year by GA aircraft in Australia. However, the relatively large number of GA aircraft on the register means that on average, each aircraft flies considerably less than RPT aircraft. General aviation flight hours increased in the period of 1995 to 1998 from 1,750,000 hours in 1995 to a peak of 1,870,000 hours in 1998 before decreasing over subsequent years to 1,640,000 hours in 2004. There was some recovery of GA flying hours in 2005 with 1,720,000 hours flown.
FIGURE 5: Flying hours for all general aviation aircraft by calendar year
Source: BTRE
General aviation by type of operation
Within the GA category, most hours are flown by aircraft involved in charter operations, followed by private/business and flying training operations. The trend for private/business flying has been generally downwards over the past decade, but appears to have stabilised at just under 400,000 hours annually. As a result of incomplete statistical data for flying training in 2004, the hours shown here are an estimate derived by averaging the 2003 and 2005 data. Aerial agriculture is the smallest of the GA sectors. The decline in hours for 2002 and 2003 was probably a consequence of the drought in many parts of Australia. Although hours for this type of operation recovered somewhat in 2004 and 2005, worsening drought conditions may see the activity in this sector reduce again.
Calendar year
Hour
s flo
wn
(000
’s)
1995
1996
1997
1998
1999
2000
2001
2002
2003
2004
2005
0
200
400
600
800
1000
1200
1400
1600
1800
2000

Australian Aviation Safety in Review �
FIGURE 6: General aviation flying hours by operation
Source: BTRE
2005 at a glance
Hours flown
High capacity RPT 922,618 Ultralight aircraft 134,218
Low capacity RPT 199,215 Hang gliders 92,904
Charter 477,531 Gyroplanes 32,854
Training 420,408 Balloons 8,749
Private/business 389,666
Aerial work 324,565 Fixed-wing (GA) 1,385,794
Aerial agriculture 101,889 Rotary-wing 328,264
Calendar year
Hour
s flo
wn
(000
’s)
1995
1996
1997
1998
1999
2000
2001
2002
2003
2004
2005
0
100
200
300
400
500
600
Charter
Training
Private/Business
Aerial work
Agriculture

� Australian Aviation Safety in Review
“Australia’s domestic and international airlines operated
a fleet of aircraft with an average age of just 7 years...
By 2005, piston engine aircraft had an average age
of 30 years...”

Australian Aviation Safety in Review �
Aircraft age
The average age of aircraft, 1995 to 2005
The average age of aircraft on the Australian register varies considerably. By 2005, Australia’s domestic and international airlines operated a fleet of aircraft with an average age of just 7 years. This is lower than was the case in 2000 and 2001. This change was largely brought about by the financial collapse of Ansett Australia in 2001, and the entry of Virgin Blue and Jetstar with their new Boeing 737 and Airbus A320 fleets. For turbofan aircraft with a maximum take-off weight (MTOW) in the range 50,001 kg to 100,000 kg the average age was just 6 years. Aircraft with a MTOW above 100,000 kg had an average age of 11 years in 2005.
By comparison, the average age of aircraft operating in GA and low capacity RPT was considerably higher. The combined average age of piston and turboprop aircraft types was 28 years. Within this group, the average age of turboprop aircraft was 18 years in 2005. The aircraft with the highest average age in Australia are the piston engine aircraft, which also account for the highest proportion of aircraft on the Australian register. By 2005, piston engine aircraft had an average age of 30 years, and it seems likely this will continue to increase over the coming years.
FIGURE 7: Average age of aircraft by calendar year
Source: CASA
Calendar year
Aver
age
age
1995
1996
1997
1998
1999
2000
2001
2002
2003
2004
2005
5.0
0.0
10.0
15.0
20.0
25.0
30.0
GA/regional airlines
Major airlines

�0 Australian Aviation Safety in Review
The increasing average age of piston engine aircraft is not unique to Australia. The average age of these type of aircraft in the United States is about the same, which is not surprising as the vast majority of GA aircraft were manufactured in the US. The production of piston engine aircraft reached its peak in the late 1970s. However, lawsuits brought against manufactures in the 1980s and 1990s devastated US aircraft manufacturing, falling from around 17,000 aircraft delivered each year in the late 1970s to less than 500 aircraft by 1994. Partly in response the unavailability of new factory built aircraft, recreational pilots shifted towards a new form of aircraft ownership. The owner-builder phenomenon in Australia has gained increasing acceptance, in line with a similar trend in the US.
Amateur-built aircraft are restricted to private/business operations. Nevertheless, these aircraft have grown in popularity, with pilots seeking new and affordable aircraft. The number of amateur-built aircraft on the Australian register is still small, but the number entering the register has been growing steadily. Nearly 500 amateur-built aircraft, built between 1996 and 2004, entered the Australian register, while only 350 factory-built piston-engine aircraft manufactured over the same period were registered. On current trends, it seems likely that amateur-built aircraft will become more prominent in the skies over Australia in the coming decade.
FIGURE 8: Year of production of certified and amateur-built aircraft, as at 31 December 2005
Source: CASA
2005 at a glance
Average aircraft age (fixed-wing)
Piston engine 30 years
Turbofan 18 years
Turbofan (50,000 kg to 100,000 kg) 6 years
Turbofan (above 100,000 kg) 11 years
Year of manufacture
Num
ber o
f airc
raft
regi
ster
ed
1981–85 1986–90 19991–95 1996–2000 2001–2004
700
600
500
400
300
200
100
0
Amateur built
Factory built

Australian Aviation Safety in Review ��
How many licensed pilots and engineers are in Australia?
Pilot licences
The Civil Aviation Safety Authority is responsible for issuing flight crew licences for all pilots flying intending to fly VH-registered powered aircraft. The issuing of a licence to a pilot indicates that the holder has achieved a required level of training, skill and knowledge. There are various classes of licence that can be obtained by pilots wanting to operate a fixed-wing or rotary-wing aircraft.
Student pilot licence (SPL): The student licence is a permit to learn to fly. Student pilots can fly with a qualified instructor, or can conduct limited solo flights within their local training area to consolidate their learning.
Private pilot licence (PPL): Private pilots may fly themselves or passengers anywhere in Australia for recreational purposes.
Commercial pilot licence (CPL): Commercial pilots are authorised to fly as pilot in command for a single pilot aircraft engaged in any operation, or as a co-pilot in multi-crew aircraft.
Air transport pilot licence (ATPL): Air transport pilots may fly an aeroplane as pilot in command or co-pilot in any operation, including a large airline type aircraft.
Number of pilot licences issued, 1995 to 2004
Complete data for pilot licence numbers was not available from CASA at the time of writing, so while this section examines the number of pilots for each category of licence until the end of 2005, data for the number of new licences issued only covers the period until the end of 2004. As holders of higher categories of licence will normally also hold a licence in a lower category, gained during their earlier training, the data here refers to the highest category of licence held.
For a licence to be current, the holder must have a valid medical certificate for that class of licence. In 2005, there were 31,593 people in Australia holding a current pilot licence, including those who had been issued a student licence. The most common licence type held is the private pilots licence, accounting for around half of all licences. Airline transport and commercial licences are the next most common, with a combined total of around 11,700 licence holders in Australia at the end of 2005.
While the total number of pilot licence holders has declined slightly since 2002, when there were 32,652, the number of licences held in 2005 was 612 more than in 2004. Around two thirds of all new licences issued are either student or private licences. In 2004, there were 4,233 new licences of all types issued, compared with 5,458 licences issued in 1995.

�� Australian Aviation Safety in Review
FIGURE 9: Number of current pilot licences, by type, 2002 to 2005
Source: CASA
FIGURE 10: Number of newly-issued pilot licences, by type, 1995 to 2004
Source: CASA
The vast majority of pilot licences held in Australia are for fixed-wing aircraft. Only around 5 per cent of pilots in Australia hold a licence for rotary-wing aircraft, although rotary-wing aircraft account for around 10 per cent of aircraft on the register. While the number of new licences for fixed-wing aviation has fallen slightly over recent years, the number of new licences issued for rotary-wing aircraft has been growing, albeit from a small base. In 2004, 361 licences for rotary-wing aircraft were issued, compared with 261 licences issued in 1995.
Calendar year
Num
ber o
f cur
rent
lice
nces
2000
2003
2004
2005
0
2000
4000
6000
8000
10000
12000
14000
16000
18000Private
Air transport
CommercialStudent
Calendar year
Num
ber o
f lic
ence
s is
sued
2500
2000
1500
1000
500
0
Private
Air transport
Commercial
Student
1995
1996
1997
1998
1999
2000
2001
2002
2003
2004

Australian Aviation Safety in Review ��
FIGURE 11: Number of current pilot licences, fixed-wing vs. rotary-wing, 2002 to 2005
Source: CASA
2005 at a glance
Number of licensed pilots
By licence type: By aircraft type:
Air transport 6614 Fixed-wing 29770
Commercial 5131 Rotary-wing 1823
Private 15999
Student 3849
Total 31593
Calendar year
Num
ber o
f cur
rent
lice
nces
35000
30000
25000
20000
15000
10000
5000
0
Fixed-wing
Rotary-wing
2002
2003
2004
2005

�� Australian Aviation Safety in Review
Aircraft maintenance engineer licences
While the quality and skills possessed by pilots will influence the safety of flights, the quality of maintenance given to the aircraft on the ground will also influence flight safety. Aircraft maintenance engineers (AMEs) are responsible for maintaining and servicing the aircraft, as well as its engines and systems. CASA is responsible for the licensing of AMEs and there are five categories of AME licences: airframes, engines, electrical, instruments and radio. These separate categories allow licence holders to certify maintenance only on specific parts of the aircraft, however, an AME is permitted to apply for more than one category. After an AME has accumulated four years experience and has passed the theoretical examinations administered by CASA, he or she may apply to become a licensed aircraft maintenance engineer (LAME).
Number of aircraft maintenance engineer licences
During the period 1995–2005, the number of current LAMEs increased, despite the number of newly qualified LAMEs remaining relatively steady indicating that qualified LAMEs tend to stay in their career path.
FIGURE 12: Number of aircraft maintenance engineer licences, current and newly issued, 1995 to 2005
Source: CASA
Calendar year
Num
ber o
f lic
ence
s
7000
6000
5000
4000
3000
2000
1000
0
Current
Newly issued
1995
1996
1997
1998
1999
2000
2001
2002
2003
2004

Australian Aviation Safety in Review ��
“While the quality and skills possessed by pilots will influence
the safety of flights, the quality of maintenance given to the
aircraft on the ground will also influence flight safety.”

�� Australian Aviation Safety in Review
“The lack of reliable data on accidents involving sport aircraft
has resulted in their omission from this report”
Australian Aviation Safety in Review ��
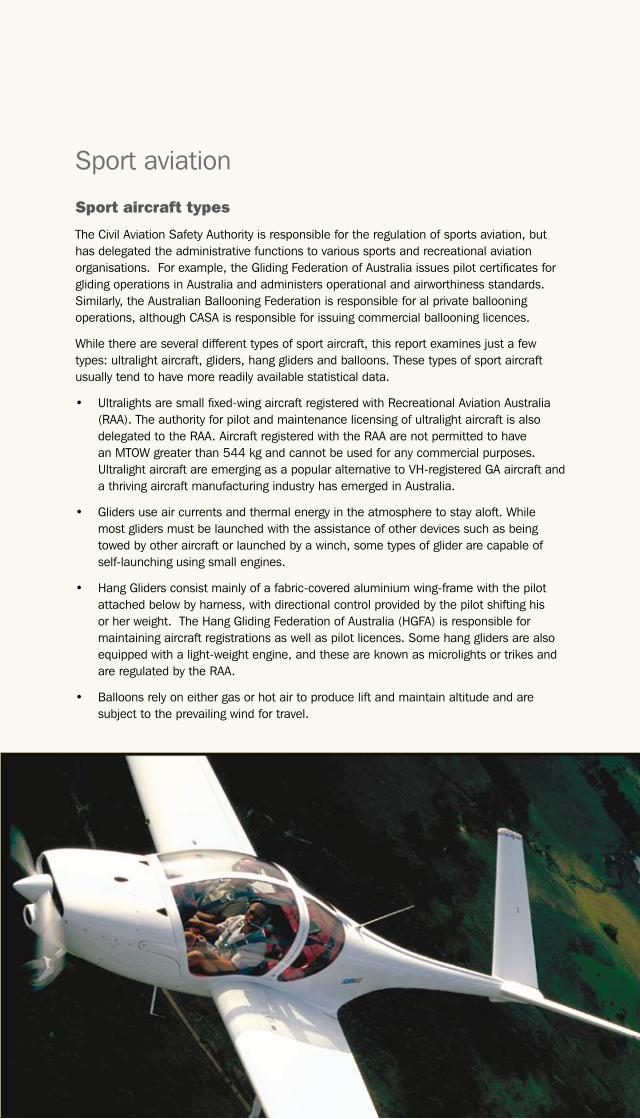
Sport aviation
Sport aircraft types
The Civil Aviation Safety Authority is responsible for the regulation of sports aviation, but has delegated the administrative functions to various sports and recreational aviation organisations. For example, the Gliding Federation of Australia issues pilot certificates for gliding operations in Australia and administers operational and airworthiness standards. Similarly, the Australian Ballooning Federation is responsible for al private ballooning operations, although CASA is responsible for issuing commercial ballooning licences.
While there are several different types of sport aircraft, this report examines just a few types: ultralight aircraft, gliders, hang gliders and balloons. These types of sport aircraft usually tend to have more readily available statistical data.
• Ultralights are small fixed-wing aircraft registered with Recreational Aviation Australia (RAA). The authority for pilot and maintenance licensing of ultralight aircraft is also delegated to the RAA. Aircraft registered with the RAA are not permitted to have an MTOW greater than 544 kg and cannot be used for any commercial purposes. Ultralight aircraft are emerging as a popular alternative to VH-registered GA aircraft and a thriving aircraft manufacturing industry has emerged in Australia.
• Gliders use air currents and thermal energy in the atmosphere to stay aloft. While most gliders must be launched with the assistance of other devices such as being towed by other aircraft or launched by a winch, some types of glider are capable of self-launching using small engines.
• Hang Gliders consist mainly of a fabric-covered aluminium wing-frame with the pilot attached below by harness, with directional control provided by the pilot shifting his or her weight. The Hang Gliding Federation of Australia (HGFA) is responsible for maintaining aircraft registrations as well as pilot licences. Some hang gliders are also equipped with a light-weight engine, and these are known as microlights or trikes and are regulated by the RAA.
• Balloons rely on either gas or hot air to produce lift and maintain altitude and are subject to the prevailing wind for travel.

�� Australian Aviation Safety in Review
Sport aviation data
Data for sports aircraft tend to be held by different sporting bodies rather than with CASA. Sporting bodies use different methods to keep track of aircraft registrations. For example data on gliders, hang gliders and gyroplanes are recorded in financial year by their respective sporting bodies, while data on ultralights are kept in calendar year format. Another problem is that, while CASA is obligated to keep updated records of aircraft registered with them, sporting bodies can vary in terms of their recording obligations. This can result in missing or incomplete data.
Obtaining accurate accident data for sport aircraft is also more challenging. The lack of reliable data on accidents involving sport aircraft has resulted in their omission from this report. Nevertheless, sufficient demographic data on sport aircraft has been gathered for this report to present an indicator of sport activity in recent years.
Sport aircraft registrations 1995 to 2004
Hang gliders are the most common sporting aircraft. From 1995 to 2004 their numbers steadily increased from approximately 3,000 to 3,500. By contrast, the balloon fleet was the least common of the sports aircraft aircraft, totalling approximately 250 in 1995, although this number had increased to 350 by 2004. Gliders and ultralight aircraft operate in numbers between these two levels. The number of registered gliders remained steady at 1,000–1,100 throughout the last 10 years, but ultralight aircraft experienced an upward trend in registrations. In 1995 there were approximately 1,200 registered ultralight craft, but the number had grown by two thirds to 2,000 registered aircraft by 2004.
FIGURE 13: Number of registered sport aircraft, by type, 1995 to 2004
Note: Statistics on ultralight aircraft and balloons are in calendar year while all other categories of sport aircraft are in financial year.
Source: BTRE analysis of data gathered from CASA and various sport aircraft organisations.
Calendar year
Num
ber o
f airc
raft
1995
1996
1997
1998
1999
2000
2001
2002
2003
2004
0
500
1000
1500
2000
2500
3000
3500
4000Hang Gliders
Gliders
Balloons
Ultralights
Australian Aviation Safety in Review ��
Hang Gliders 51%
Gliders 16%
Balloons 5%
Ultralights 25%
Calendar year
Flig
ht H
ours
(000
’s)
2001 2002 2003 2004 2005
20
0
40
60
80
100
120
140
160
Hang Gliders
Gliders
Balloons
Ultralights
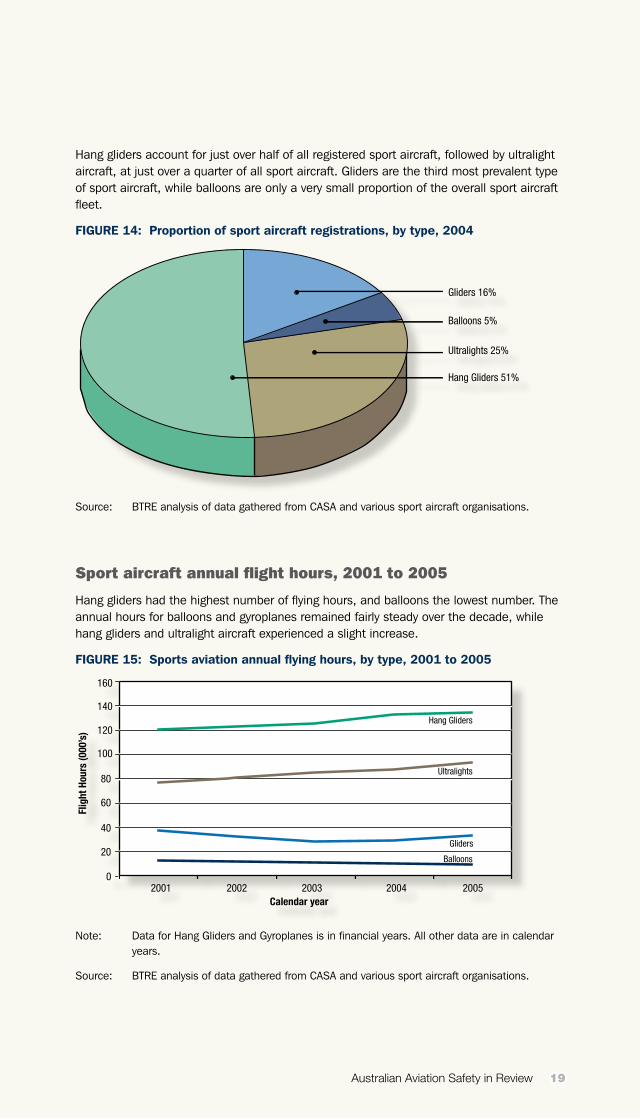
Hang gliders account for just over half of all registered sport aircraft, followed by ultralight aircraft, at just over a quarter of all sport aircraft. Gliders are the third most prevalent type of sport aircraft, while balloons are only a very small proportion of the overall sport aircraft fleet.
FIGURE 14: Proportion of sport aircraft registrations, by type, 2004
Source: BTRE analysis of data gathered from CASA and various sport aircraft organisations.
Sport aircraft annual flight hours, 2001 to 2005
Hang gliders had the highest number of flying hours, and balloons the lowest number. The annual hours for balloons and gyroplanes remained fairly steady over the decade, while hang gliders and ultralight aircraft experienced a slight increase.
FIGURE 15: Sports aviation annual flying hours, by type, 2001 to 2005
Note: Data for Hang Gliders and Gyroplanes is in financial years. All other data are in calendar years.
Source: BTRE analysis of data gathered from CASA and various sport aircraft organisations.

�0 Australian Aviation Safety in Review
“Accident numbers alone
do not tell the complete story...
...it is necessary to calculate the accident rate.”

Australian Aviation Safety in Review ��
Chapter 2:
Aviation accidents, fatal accidents and fatalities
The ATSB’s incident and occurrence databaseThe Australian Transport Safety Bureau (ATSB) is Australia’s prime agency for the independent investigation of civil aviation accidents, incidents and safety deficiencies. It does so in accordance with Annex 13 to the Convention on International Civil Aviation (Chicago Convention 1944). Annex 13 has legal force through the Transport Safety Investigation Act 2003 (TSI Act) which applies to all investigations commenced from 1 July 2003. Annex 13 was also incorporated into the now repealed Part 2A of the Air Navigation Act 1920 which applied to all investigations commenced on and before 30 June 2003.
The TSI Act contains a provision for the mandatory reporting of occurrences that are classified as either Immediately Reportable Matters (accidents & serious incidents) and Routine Reportable Matters (incidents). It is from these initial reports that the ATSB makes a decision on whether or not to investigate. The decision is based on factors such as safety value to be obtained from the investigation and where available resources may best be targeted.
All reported occurrences that meet defined criteria are entered into the ATSB database. The reliability of the database is therefore dependent on individual compliance with the compulsory reporting requirements.
Accident numbers and rates
This section sets out the number of accidents, fatal accidents and the number of fatalities for the period 2001 to 2005. The data is drawn from the ATSB database. However, accident numbers alone do not tell the complete story. In order for the data to be properly interpreted, and for meaningful comparisons to be made, it is necessary to calculate the accident rate. This is often calculated as the number of accidents in a period divided by the number of hours flown in that category of operation. The accident rate and fatal accident rate are normally calculated per 100,000 hours flown.
This section examines accident numbers and rates for Regular Public Transport (RPT) operations and the various types of general aviation activity.

�� Australian Aviation Safety in Review
Regular public transport accident statistics
Regular public transport accident, fatal accident and fatality numbers 2001 to 2005
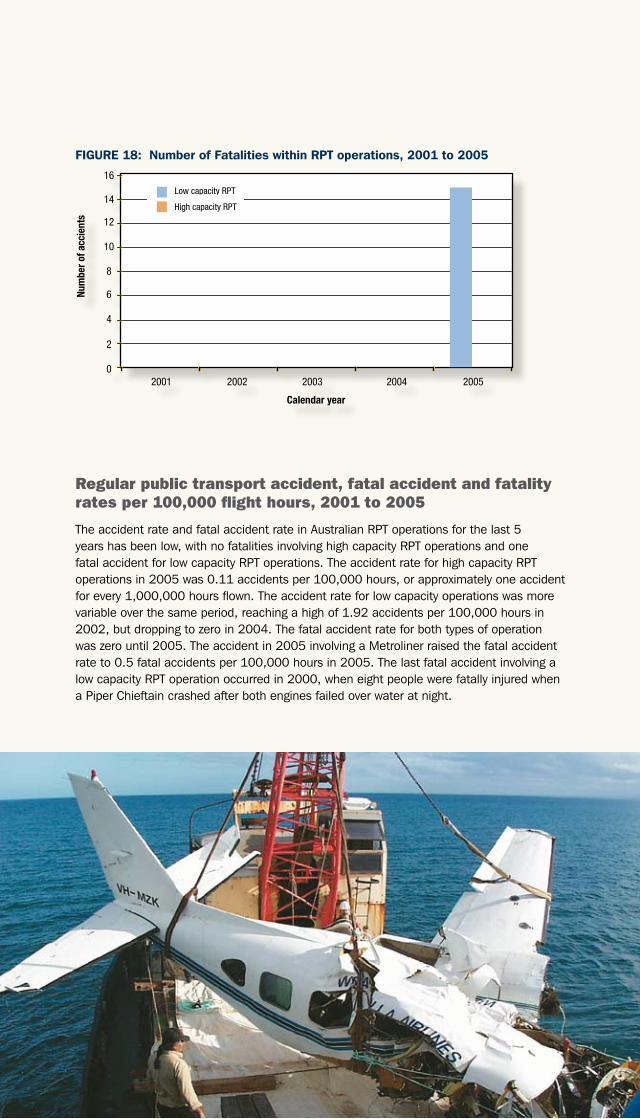
Over the last 5 years there has been a total of seven occurrences classed as accidents (see the Glossary, p.53) involving high capacity RPT operations and 12 accidents involving low capacity RPT operations. One of these accidents involved fatalities: in May 2005 a Fairchild Metroliner collided with the ground during an approach to Lockhart River in far north Queensland. The accident claimed the lives of all 13 passengers and two crew. This was the most serious fatal accident in Australia since the loss of a Vickers Viscount in 1968, which claimed 26 lives.
Accidents involving high capacity RPT operations involved damage to the aircraft during ground handling, or injuries to passengers caused by in-flight turbulence, or during boarding or embarkation (including during an evacuation).
FIGURE 16: Regular public transport accidents, 2001 to 2005
FIGURE 17: Regular public transport fatal accidents, 2001 to 2005
Num
ber o
f acc
ient
s
Calendar year
2001 2002 2003 2004 2005
0
1
2
3
4
5Low capacity RPT
High capacity RPT
Calendar year
2001 2002 2003 2004 2005
0
1
2
3
4
5Low capacity RPT
High capacity RPT
Num
ber o
f fat
al a
ccie
nts
Australian Aviation Safety in Review ��
FIGURE 18: Number of Fatalities within RPT operations, 2001 to 2005
Regular public transport accident, fatal accident and fatality rates per 100,000 flight hours, 2001 to 2005
The accident rate and fatal accident rate in Australian RPT operations for the last 5 years has been low, with no fatalities involving high capacity RPT operations and one fatal accident for low capacity RPT operations. The accident rate for high capacity RPT operations in 2005 was 0.11 accidents per 100,000 hours, or approximately one accident for every 1,000,000 hours flown. The accident rate for low capacity operations was more variable over the same period, reaching a high of 1.92 accidents per 100,000 hours in 2002, but dropping to zero in 2004. The fatal accident rate for both types of operation was zero until 2005. The accident in 2005 involving a Metroliner raised the fatal accident rate to 0.5 fatal accidents per 100,000 hours in 2005. The last fatal accident involving a low capacity RPT operation occurred in 2000, when eight people were fatally injured when a Piper Chieftain crashed after both engines failed over water at night.
Calendar year
2001 2002 2003 2004 20050
2
4
6
8
10
12
14
16Low capacity RPT
Num
ber o
f acc
ient
s
High capacity RPT

�� Australian Aviation Safety in Review
“The accident rate for aerial agriculture is broadly similar
to that for private/business flights”

Australian Aviation Safety in Review ��
FIGURE 19: RPT Accident rates per 100,000 hours, 2001 to 2005
FIGURE 20: RPT Fatal Accident Rates per 100,000 hours, 2001 to 2005
FIGURE 21: RPT Fatality Rates per 100,000 Hours, 2001 to 2005
Calendar year2001 2002 2003 2004 2005
0.00
0.50
1.00
1.50
2.00
2.50
Acci
dent
rate
(per
100
,000
hou
rs)
Low capacity RPT
High capacity RPT
Calendar year
2001 2002 2003 2004 20050.00
0.10
0.30
0.20
0.40
0.50
0.60
Fata
l acc
iden
t rat
e (p
er 1
00,0
00 h
ours
)
Low capacity RPT
High capacity RPT
Calendar year
2001 2002 2003 2004 2005
0.00
1.00
3.00
2.00
4.00
5.00
6.00
7.00
8.00
Fata
litie
s (p
er 1
00,0
00 h
ours
)
Low capacity RPT
High capacity RPT

�� Australian Aviation Safety in Review
General aviation accident statistics
General aviation accident, fatal accident and fatality numbers 2001 to 2005
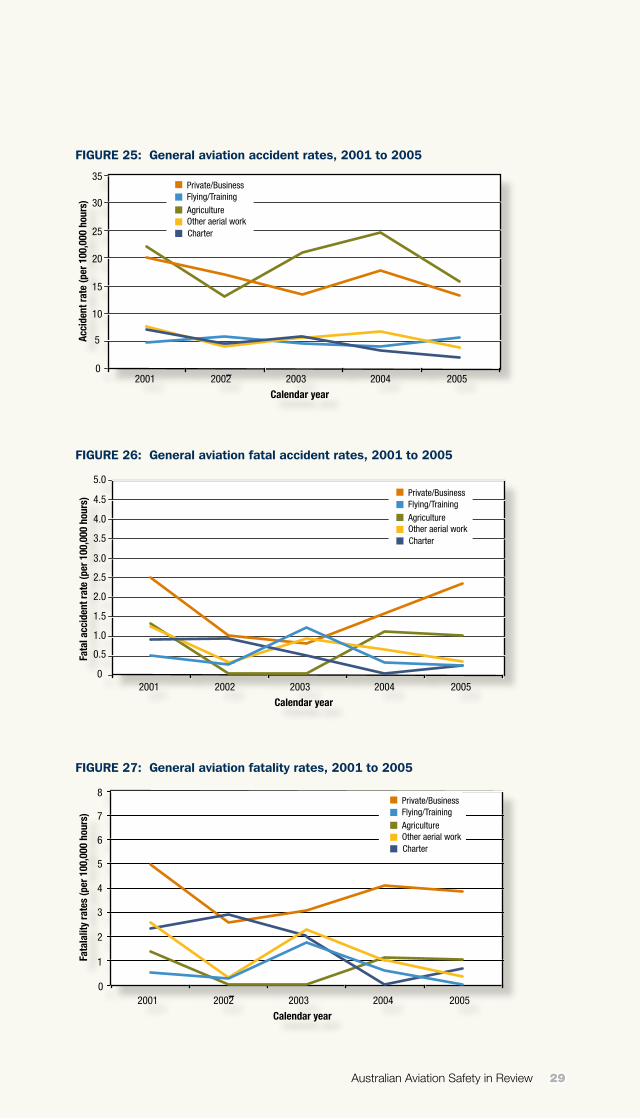
General aviation involves a diverse set of activities, albeit in aircraft typically much smaller than those used in RPT operations. By far, most accidents in Australia involve general aviation operations, but within this group, the number of accidents (and fatal accidents) varies greatly.
Accidents in the private/business category were the most prevalent, although the number of accidents has decreased in the last 3 years compared with earlier in the decade. The number of accidents from within commercial activities has also generally fallen, particularly in charter operations. The number of fatal accidents and fatalities largely mirrors the pattern of accidents, although the larger number of passengers normally carried during charter operations means that these fatal accidents tend to result in relatively higher numbers of fatalities.
FIGURE 22: General aviation accidents, 2001 to 2005
FIGURE 23: General aviation fatal accidents, 2001 to 2005
Calendar year
2001 2002 2003 2004 2005
90
80
70
60
50
40
30
20
10
0
Num
ber o
f acc
iden
ts
Charter
Flying/TrainingPrivate/Business
Other aerial workAgriculture
Calendar year
2001 2002 2003 2004 2005
12
10
8
6
4
2
0
Num
ber o
f fat
al a
ccid
ents
Charter
Flying/TrainingPrivate/Business
Other aerial workAgriculture

Australian Aviation Safety in Review ��
FIGURE 24: Number of general aviation fatalities, 2001 to 2005
General aviation accident, fatal accident and fatality rates per 100,000 flight hours 2001 to 2005
Given the differences in flying activity, it is especially important to examine accident and fatal accident rates to understand the relative safety of each type of general aviation operation. Commercial operations are generally much safer than either private/business or aerial agriculture operations. Accident and fatal accident rates for charter operations have generally declined over the 5 years to 2005. As a consequence of the Lockhart River accident, charter operations had a lower fatality rate than low capacity RPT in 2005.
The accident rate for aerial agriculture is broadly similar to that for private/business flights, underscoring the inherently more demanding environment of aerial agriculture operations. However, the fatality rate for aerial agriculture is substantially lower than for private/business, suggesting that accidents in aerial agriculture tend to be survivable.
Calendar year2001 2002 2003 2004 2005
12
14
16
18
20
10
8
6
4
2
0
Num
ber o
f fat
aliti
es Charter
Flying/TrainingPrivate/Business
Other aerial workAgriculture

�� Australian Aviation Safety in Review
“Any small increase in the number of fatal
accidents in any one year will be amplified
in terms of fatal accident rates”
Australian Aviation Safety in Review ��
FIGURE 25: General aviation accident rates, 2001 to 2005
FIGURE 26: General aviation fatal accident rates, 2001 to 2005
FIGURE 27: General aviation fatality rates, 2001 to 2005
Calendar year2001 2002 2003 2004 2005
Acci
dent
rate
(per
100
,000
hou
rs)
20
25
30
35
15
10
5
0
Charter
Flying/TrainingPrivate/Business
Other aerial workAgriculture
Calendar year2001 2002 2003 2004 2005
Fata
l acc
iden
t rat
e (p
er 1
00,0
00 h
ours
)
2.0
2.5
3.0
3.5
4.0
4.5
5.0
1.5
1.0
0.5
0
Charter
Flying/TrainingPrivate/Business
Other aerial workAgriculture
Calendar year2001 2002 2003 2004 2005
1
2
3
4
5
6
7
8
0
Charter
Flying/TrainingPrivate/Business
Other aerial workAgriculture
Fata
lalit
y ra
tes
(per
100
,000
hou
rs)

�0 Australian Aviation Safety in Review
2005 at a glance
Accident data – number of accidents
Accidents Fatal accidents Fatalities
High capacity RPT 1 0 0
Low capacity RPT 2 1 15
Charter 9 1 3
Private/business 51 9 14
Flying Training 23 0 0
Aerial Work 12 1 1
Agriculture 16 1 1
Total 114 13 34
Accident data – accident rate (per 100,000 hours)
Accidents Fatal accidents Fatalities
High capacity RPT 0.11 0.00 0.00
Low capacity RPT 1.00 0.50 7.53
Charter 1.88 0.21 0.63
Private/business 13.09 2.31 3.59
Flying Training 5.47 0.21 0.00
Aerial Work 3.70 0.31 0.31
Agriculture 15.70 0.98 0.98
Fixed vs. Rotary wing accident statistics
Fixed-wing and rotary-wing accident, fatal accident and fatality numbers, 2001 to 2005
Rotary-wing (helicopter) operations are a small, but growing segment of the Australian aviation industry. The number of helicopters on the Australian register has nearly doubled over the last decade, and the number of newly issued pilot licences for rotary-wing aircraft has increased over the same period. Despite the relatively small number of helicopters on the register, the proportion of rotary-wing accidents is relatively high compared with fixed-wing aircraft. Over last 5 years since 2001 there has been an average of nearly 33 accidents per year involving helicopters, or nearly one fifth of all accidents recorded over this period. Despite the growing proportion of rotary-wing aircraft, the number of accidents has been reasonably stable over the 5 years to 2005, while accidents involving fixed-wing aircraft have reduced from 137 in 2001 to 83 in 2005.

Australian Aviation Safety in Review ��
“Rotary-wing (helicopter) operations are a small, but growing
segment of the Australian aviation industry.”

�� Australian Aviation Safety in Review
Fixed-wing and rotary-wing accident, fatal accident and fatality rates per 100,000 hours, 2001 to 2005
The relatively high number of accidents involving rotary-wing aircraft is reflected in the accident rate. With the exception of 2002, when accident rates were similar, the accident rate for helicopters has been more than double that for fixed-wing aircraft, and was nearly triple their rate in 2005. The trend for the fatal accidents rate is more difficult to interpret. The fatality rate for rotary-wing accidents has been consistently above the fatal accident rate for fixed-wing aircraft for each of the last 5 years. However, the rotary-wing fatality rate has been extremely volatile over these years, and was similar to the rate for fixed-wing aircraft in 2005 despite having a relatively higher proportion of all accidents for that year. Some of this variability seen between years for rotary-wing aircraft is probably a result of the relatively small size of the fleet, meaning any small increase in the number of fatal accidents in any one year will be amplified in terms of fatal accident rates.
FIGURE 28: Number of accidents, fixed-wing and rotary-wing aircraft, 2001 to 2005
FIGURE 29: Accident rates per 100,000 hours, fixed-wing and rotary-wing aircraft, 2001 to 2005
Calendar year
Num
ber o
f acc
iden
ts
0
20
40
60
80
100
120
140
160
Fixed wing
Rotary wing
20022001 2003 2004 2005
Calendar year
0
2
4
6
8
10
12
14
16
18
Fixed wing
Rotary wing
20022001 2003 2004 2005
Acci
dent
rate
(per
100
,000
hou
rs)
Australian Aviation Safety in Review ��
FIGURE 30: Fatal accident rates per 100,000 hours, fixed-wing and rotary-wing aircraft, 2001 to 2005
FIGURE 31: Fatality rates per 100,000 hours, fixed-wing and rotary-wing aircraft, 2001 to 2005
2005 at a glance
Fixed-wing and rotary-wing data
Numbers Accidents Fatal accidents Fatalities
Fixed-wing 83 11 32
Rotary-wing 31 2 2
Rates
(per 100,000 hours) Accidents Fatal accidents Fatalities
Fixed-wing 3.31 0.44 1.28
Rotary-wing 9.44 0.61 0.61
Calendar year
Fata
l acc
iden
ts (p
er 1
00,0
00 h
ours
)
0
0.5
1.0
1.5
2.0
2.5
Fixed wing
Rotary wing
20022001 2003 2004 2005
Calendar year
fata
lity
rate
(per
100
,000
hou
rs)
0
1.0
1.5
0.5
2.0
2.5
3.5
4.5
3.0
4.0
5.0
Fixed wing
Rotary wing
20022001 2003 2004 2005

�� Australian Aviation Safety in Review
“Of the 749 accidents recorded over the period,
just over a quarter (197) were attributed to
mechanical problems.”

Australian Aviation in Review – 2007 ��
Chapter 3:
Aviation accident analysis
The preceding sections set out some basic measures of aviation activity and accident rates in Australia over the 5 years to 2005. This section takes a closer look at the nature of accidents in Australia over this period, to provide some insights about the types of accidents in Australia, and the phase of flight where these accidents occurred.
The clear majority of accidents in Australia occur in general aviation, and more specifically, within the private/business flying category. Only a small proportion of accidents result in fatal injuries. To understand the reasons for this it is important to take a closer look at the kinds of accidents that occur, and in which phase of the flight accidents occur.
Before examining the pattern of accidents, it is worth noting that accidents are complex occurrences, often involving a chain or sequence of events. The challenge is to classify an accident meaningfully, and in doing so, capture the main character of the accident. The distinction between mechanical and operations factors and their contribution to the accident is sometimes blurred. Nevertheless, this report classifies the accident according to the event in the sequence from which an accident was inevitable, which may not be the first event in the accident sequence. The aim has been to ensure that the classification of accidents has been consistent, so that useful comparisons can be made.
The data analysed in this section covers all VH-registered aircraft, including gliders and balloons. For the period 2001 to 2005 there were seven accidents involving balloons and 35 involving gliding operations. None of the ballooning accidents involved fatalities. However, four of the gliding accidents, including three in 2005, involved fatal injury to the occupants.
�� Australian Aviation Safety in Review
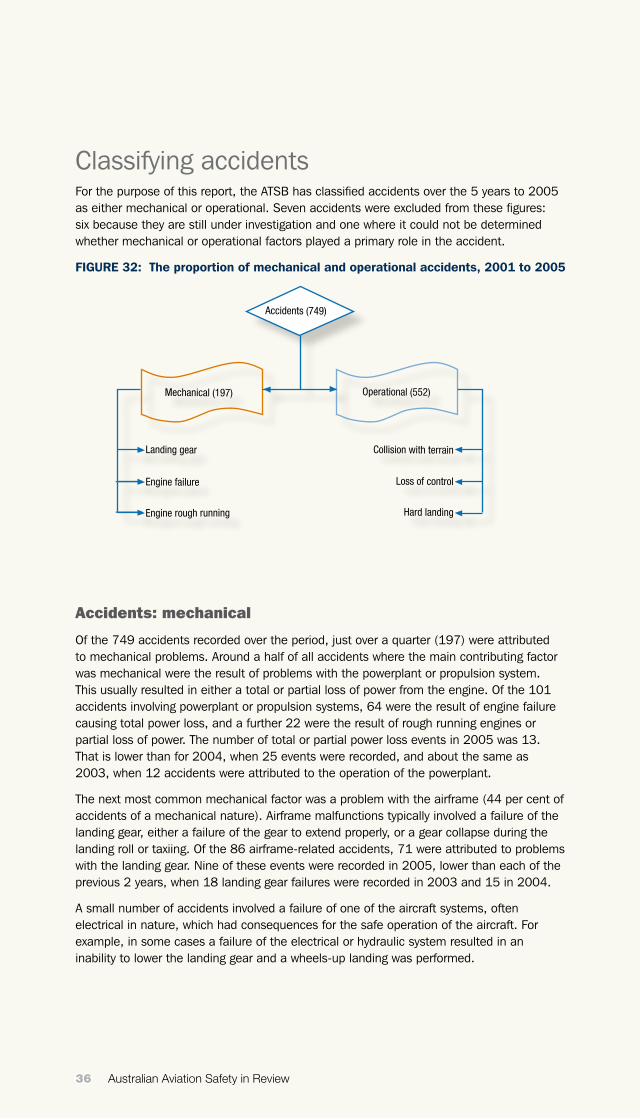
Classifying accidentsFor the purpose of this report, the ATSB has classified accidents over the 5 years to 2005 as either mechanical or operational. Seven accidents were excluded from these figures: six because they are still under investigation and one where it could not be determined whether mechanical or operational factors played a primary role in the accident.
FIGURE 32: The proportion of mechanical and operational accidents, 2001 to 2005
Accidents: mechanical
Of the 749 accidents recorded over the period, just over a quarter (197) were attributed to mechanical problems. Around a half of all accidents where the main contributing factor was mechanical were the result of problems with the powerplant or propulsion system. This usually resulted in either a total or partial loss of power from the engine. Of the 101 accidents involving powerplant or propulsion systems, 64 were the result of engine failure causing total power loss, and a further 22 were the result of rough running engines or partial loss of power. The number of total or partial power loss events in 2005 was 13. That is lower than for 2004, when 25 events were recorded, and about the same as 2003, when 12 accidents were attributed to the operation of the powerplant.
The next most common mechanical factor was a problem with the airframe (44 per cent of accidents of a mechanical nature). Airframe malfunctions typically involved a failure of the landing gear, either a failure of the gear to extend properly, or a gear collapse during the landing roll or taxiing. Of the 86 airframe-related accidents, 71 were attributed to problems with the landing gear. Nine of these events were recorded in 2005, lower than each of the previous 2 years, when 18 landing gear failures were recorded in 2003 and 15 in 2004.
A small number of accidents involved a failure of one of the aircraft systems, often electrical in nature, which had consequences for the safe operation of the aircraft. For example, in some cases a failure of the electrical or hydraulic system resulted in an inability to lower the landing gear and a wheels-up landing was performed.
Mechanical (197)
Landing gear Collision with terrain
Loss of control
Hard landing
Engine failure
Engine rough running
Operational (552)
Accidents (749)

Australian Aviation Safety in Review ��
FIGURE 33: Number of accidents attributed to mechanical problems, 2001 to 2005
FIGURE 34: Mechanical accident events, 2001 to 2005
2005 at a glance
Mechanical
Powerplant/propulsion 14
Airframe 11
Systems
Powerplant/propulsion
Airframe 86
101
10
Number of accidents2020 40 60 80 100 120
Systems 5%
Powerplant/propulsion 51%
Airframe 44%

�� Australian Aviation Safety in Review
Accidents: operational
Nearly three quarters of accidents are the consequence of the operation or handling of an aircraft (or matters related to the aerodrome surface) rather than as a result of a failure of a mechanical system.
Operational factors were grouped into 15 categories and accidents were assigned to the group that reflected the nature of the accident. Of the 552 accidents over the 2001 to 2005 period, six categories account for 85 per cent of the accidents, and just three categories accounted for two thirds.
FIGURE 35: Number of accidents by occurrence type, 2001 to 2005
Collision
Accidents involving a collision were the most common operational-related occurrence. This grouping covers several types of collision, including controlled flight into terrain (CFIT), collision with terrain, collisions on the ground, wirestrike, and though relatively infrequent, mid-air collisions. Of the 197 accidents involving a collision, 30 involved fatal injuries to the aircraft occupants. Six fatal accidents were recorded in 2005.
The most common occurrence in this group was collision with terrain, accounting for 103 accidents, or just over half of all occurrences within this category, and around a fifth of all operational-related accidents over the last 5 years.
Events that fall within the definition of collision with terrain are ones where the aircraft was airborne immediately prior to the accident, and where the crew had a reasonable awareness of the local terrain and obstacles. The crew may or may not have control of the aircraft at the time of the collision. Around a third (35) of these accidents had weather as a contributory factor to the collision.
By contrast, CFIT accidents are defined as collisions where the aircraft was under controlled flight, but terrain awareness was lacking (often as a consequences of flight in instrument meteorological conditions or at night).
A reasonably high number of collisions occurred while the aircraft was on the ground. Thirty collisions on the ground were recorded over the period 2001 to 2005, though only one of these events occurred in 2005.
Aerodrome relatedAircraft controlAircraft loading
Bird/animal strikesCollision
Fuel relatedGround operations
Ground strikeHard landing
Inflight breakupMedical injury related
Significant event – otherSmoke/fumes/fire
Weather/environmentWheels up landing
400 80 120 160 200 220
15105
321
19732
2916
741
64
141
34
Number of accidents
Australian Aviation Safety in Review ��
Wirestrike accidents were also reasonably common, with 33 occurrences recorded over the 5 years examined. Most wirestrike accidents involve agricultural operations and aerial work operations, such as powerline survey or pest control operations. The ATSB recently produced a study of wirestrike accidents covering the period 1994 to 2004. A copy of this report is available on the ATSB website or in hard copy by request.
Aircraft control
These accidents involve the loss of control of the aircraft either in the air or on the ground. Loss of control was most common during the approach and landing phases, or during the take-off phase of a touch-and-go landing. Weather-related factors were identified in 22 accidents in this category, when the aircraft was particularly vulnerable to strong or gusting wind. The most serious loss of control accidents occurred where the aircraft entered an aerodynamic stall or spin at a height from which recovery was not possible.
Twenty one loss of control accidents occurred in 2005, with only two having weather identified as a contributing factor. Over the 5 years from 2001, there were 19 fatal accidents involving loss of control, with six fatal accidents occurring in 2005.
Incorrect aircraft configuration also contributed to a small number of accidents (16) resulting from the loss of control. Configuration problems included the incorrect trim setting for the aircraft for takeoff or landing, and the incorrect or inadvertent change to flaps or landing gear causing the aircraft to respond to control inputs differently than the pilot had expected.
Hard landing
The third most common accident category involved hard landings. A total of 74 hard landings were recorded over the 5 years from 2001, of which 16 were recorded in 2005. Weather was a more prominent factor, cited in nearly a third of all hard landing accidents.
Wheels-up landing
Though a smaller proportion of accidents, wheels-up landing remain one of the more common accident types. Over the 5 years since 2001, 34 wheels-up accidents were recorded, though none resulted in any injuries to the occupants. Ten wheels-up landings were recorded in both 2001 and 2002, but only two were recorded in 2005. Wheels-up

�0 Australian Aviation Safety in Review
landings are typically thought of as preventable accidents, but these type of events persist. In many cases the pilot reported a distraction that interrupted checklist procedures during the approach phase.
Fuel related events
Accidents related to fuel are of three types: fuel contamination, fuel exhaustion, and fuel starvation. Starvation is the most common fuel related event, accounting for two thirds of the fuel related accidents between 2001 and 2005. Starvation is the situation where the supply of fuel to the engine is interrupted, although adequate fuel is being carried. Examples of fuel starvation include circumstances where a fuel line becomes blocked, or where the pilot selects a fuel tank with insufficient fuel causing engine to stop, although useable quantities of fuel are available in other tanks.
There were five fuel related accidents in 2005, including two occurrences each for starvation and contamination.
Ground operations
Twenty nine accidents were classified as ground operation events. These involve runway overruns, and accidents during the start, taxi, landing or take-off phases of flights. Accidents in this category include runway excursions, foreign object damage (FOD) and other occurrences involving ground handling operations. Excursions were the most common event, accounting for 23 of the 29 events over the 5 years. Among the remaining events were three that involved a helicopter being left unattended with the engine running. On each occasion the helicopter became airborne and was destroyed or substantially damaged.
2005 at a glance
Operational
Collision 26
Aircraft control 21
Hard landing 16
Fuel related 5
Ground operations 5
Wheels-up landing 2

Australian Aviation Safety in Review ��
Phase of flight analysisThe popular belief that the landing and takeoff phases are the most hazardous stages of any flight are largely supported by an analysis of accidents for the period 2001 to 2005. However, while more accidents occur in these phases, and especially in the approach and landing phase, accidents in the manoeuvre and cruise phases tend to have a higher proportion of fatal outcomes compared with the other phases of flight. Sixteen per cent of accidents in this phase of flight result in fatal injuries, while only 4 per cent of accidents in the approach and landing phases involve fatal injuries. Around 10 per cent of accidents in the takeoff and initial climb phases are fatal accidents. Of the 749 accidents covering the 5 years from 2001, 67 or 8.9 per cent resulted in fatal injury. The six accidents not considered for analysis here, as these were still under investigation, also involved fatal injury. If they were included for the purpose of examining the fatality rate of accidents, the rate would increase slightly to 9.6 per cent.
FIGURE 36: Proportion of accidents by phase of flight, 2001 to 2005
Standing and taxiing 6%
Approach and landing 49%
Take-off and initial climb 21%
Climb, cruise, manoeuvre and descent 24%

�� Australian Aviation Safety in Review
FIGURE 37: Number of accidents by phase of flight, 2001 to 2005
Nearly 40 per cent of all accidents over the period 2001 to 2005 occurred during the landing phase, and a further 11.5 per cent occurred at takeoff. In both cases the aircraft was operating at lower speeds, where the effects of wind are more pronounced, close to the stall speed, and near the ground and other obstacles. Mechanical turbulence from buildings and other structures on the ground can also make aircraft control more difficult.
Although the greatest proportion of accidents occurred in the landing phase, the vast majority of accidents did not result in injury. Of the 288 accidents in the landing phase, 256 resulted in no injuries, and 26 resulted in minor injuries. Only one fatal accident was recorded against this phase of flight between 2001 and 2005.
Similarly, accidents during the takeoff phase involve lower aircraft speeds and consequently, injury levels are lower than for other phases of flight.
The phase of flight with the highest proportion of fatal accidents was the descent where two of seven accidents (28 per cent) occurred. However, the highest number of fatal accidents occurred in the manoeuvring/airwork phase, which had 19 fatal accidents from a total of 117 accidents.
The phases of flight with relatively high rates of fatal injury from accidents are:
Phase of flight Number of accidents Number of fatal accidents
Manoeuvre/airwork 117 19
Initial climb 67 13
Approach 70 12
Cruise 52 9
Descent 7 2
Standing
Taxiing
Takeoff
Initial climb
Climb
Cruise
Manoeuvring/airwork
Descent
Approach
Landing
Unknown
21
27
4
51
117
7
71
288
9
87
67
Number of accidents (2001 to 2005)
0 50 100 150 200 250 300 350
Australian Aviation Safety in Review ��
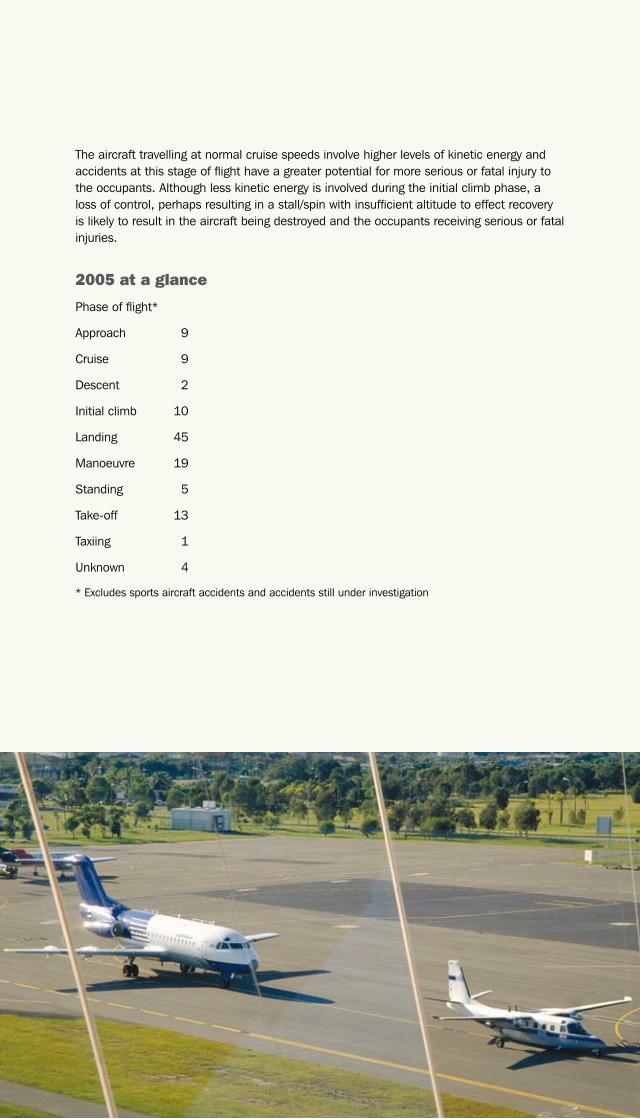
The aircraft travelling at normal cruise speeds involve higher levels of kinetic energy and accidents at this stage of flight have a greater potential for more serious or fatal injury to the occupants. Although less kinetic energy is involved during the initial climb phase, a loss of control, perhaps resulting in a stall/spin with insufficient altitude to effect recovery is likely to result in the aircraft being destroyed and the occupants receiving serious or fatal injuries.
2005 at a glance
Phase of flight*
Approach 9
Cruise 9
Descent 2
Initial climb 10
Landing 45
Manoeuvre 19
Standing 5
Take-off 13
Taxiing 1
Unknown 4
* Excludes sports aircraft accidents and accidents still under investigation

�� Australian Aviation Safety in Review
“On 18 January 2001, a Boeing 737-476 aircraft
encountered microburst windshear while conducting a
go-around from runway 19 at Brisbane aerodrome during
an intense thunderstorm.”

Australian Aviation Safety in Review ��
Weather – an influential factorOf the 749 accidents that occurred between 2001 and 2005, weather was a factor in just under one fifth (18 per cent).
Aircraft typically found in general aviation have less inertia than heavier RPT aircraft. They also tend to have lower demonstrated crosswind capability than airliners. That makes these smaller aircraft more vulnerable to sudden gusts of wind during the landing or takeoff phase, as they tend to respond more quickly to changes in wind speed and/or direction. It is not surprising that so many accidents in general aviation occur in this phase of flight. Nearly one third (31 per cent) of hard landing accidents, and one fifth of aircraft control accidents cited weather as a factor. Strong or gusting winds were a common feature in the accident reports.
Larger turbofan aircraft found in the RPT fleet have much higher levels of inertia and are harder to displace from their flight path. However, they are subject to the effects of severe windshear, which can reduce aircraft performance dramatically or affect the flight control systems. The two examples below illustrate how windshear can affect large aircraft. The first was an incident involving a Boeing 737 on approach to Brisbane in 2001. The second was a windshear accident affecting a Boeing 767 aircraft during the cruise.
On 18 January 2001, a Boeing 737-476 aircraft encountered microburst windshear while conducting a go-around from runway 19 at Brisbane aerodrome during an intense thunderstorm. As the aircraft passed 1,000 ft during the landing approach, it encountered rain and some isolated hail. The approach lights for runway 19 were visible to the crew, and the pilot in command elected to continue the approach. At about 500 ft, the weather deteriorated rapidly, and the aircraft encountered hail and turbulence. The pilot in command discontinued the approach and applied go-around engine thrust. The aircraft commenced to climb normally at about 3,600 ft/min, however, shortly after the go-around was initiated, the climb performance substantially reduced to less than 300 ft/min due to the effects of the microburst downdraft and from flight through heavy rain. The pilot in command applied maximum engine thrust to improve the aircraft’s climb performance, and advised the Aerodrome Controller that the aircraft had encountered severe windshear. The crew then diverted the aircraft to Maroochydore, where it landed without further incident. You can read the full investigation report at <www.atsb.gov.au> (ATSB Report: 200100213).
In April 2002 windshear affected a Boeing 767 during descent while passing through FL350. A flight attendant in the aft galley fell during an autopilot disconnect and pitch-up manoeuvre, and broke her lower right leg. The disconnect and pitch up coincided with the application of full speed brake by the crew to prevent a mach number overspeed, which was necessary after the aircraft encountered a rapid windshear change from 30 kts of tailwind to 15 kts of crosswind component. This exceeded the capabilities of the automatic flight system and resulted in the crew immediately taking over. A doctor on board provided initial treatment to the flight attendant, and the aircraft was met by medical personnel on arrival at the gate.
Turbulence is another factor that can affect the safety of aircraft occupants, particularly for passengers and crew on high capacity RPT flights. One form of turbulence, known as clear air turbulence, is common at high altitudes and its presence cannot be easily predicted. As a consequence, many airlines now have a policy that passengers must keep their seatbelts fastened whenever they are seated. Also, all passengers and crew are required to be seated with their seatbelt fastened whenever the seatbelt sign is illuminated.

�� Australian Aviation Safety in Review
“In the period studied, Australia had no high capacity
regular public transport fatal accidents and one low capacity
regular public transport fatal accident.”

Australian Aviation in Review – 2007 ��
Chapter 4:
International comparisons
How does Australia’s aviation safety record compare? An ATSB study completed in 2006 compared the rate of fatal accidents in Australia with the fatal accident rates in the United States, Canada, the United Kingdom and New Zealand. The study examined the period 1995 to 2004 (the latest year for which comparable data was available).
Two matters make an international comparison of aviation safety problematic. The first is that countries may define accidents differently, leading to one country apparently over-reporting accidents, while another may be apparently under-reporting. This problem is largely resolved by comparing the accident rate for fatal accidents, for which reliable and consistent data is available.
The second challenge is a consequence of the way the aviation industry is organised and regulated in each country. That is, the definitions used with respect to Australia’s aviation sector may not be the same as countries with which we wish to make comparison. The ATSB chose the four developed countries above as each has a similar mix of general aviation and scheduled passenger transport operations. Some effort went into aligning categories of operation as much as possible in order to minimise differences that would threaten the validity of any comparison.
In the period studied, Australia had no high capacity regular public transport fatal accidents and one low capacity regular public transport fatal accident.
The key findings indicated that the fatal accident rate for Australian air carrier (passenger transport) operations, which includes all regular public transport and commercial charter operations, was slightly higher than the rate for the United States for all years, except for 2002 when it was marginally lower, and for 2004, when Australia’s rate was zero.
�� Australian Aviation Safety in Review
The fatal accident rates for the non-general aviation sector for both countries are largely influenced by the commercial charter (Australia) and on-demand (United States) operational categories, which each have a much higher fatal accident rate than scheduled airline services. In Australia, commercial charter operations account for 32 per cent of the total air carrier activity. This has a greater influence on the overall air carrier fatal accident rate compared with the United States, where on-demand operations account for only 15 per cent of the total air carrier activity. If Australia’s activity profile mirrored that of the United States, Australia’s overall fatal accident rate would fall below that of the United States. Both Australia and the United States recorded a significant downward trend for the general aviation fatal accident rate.
For most years, the rate of fatal accidents for all operations in Australia was slightly lower than that for Canada. Australia also recorded a significant decline in the rate of non-public transport fatal accidents during this period, compared with the United Kingdom. Australia recorded one low capacity regular public transport fatal accident, which resulted in eight fatalities, and New Zealand recorded two fatal accidents, which resulted in a total of 10 fatalities.
The general aviation fatal accident rate for Australia was lower than the rate recorded for New Zealand, and showed a downward trend.
Overall, the findings showed that Australia’s fatal accident and fatality rates were mostly similar to the corresponding rates of the other developed countries examined. Using North America and the United Kingdom as a benchmark of best-practice aviation safety, the findings demonstrate that Australia has a good safety record.
The full report can be retrieved from the ATSB website <www.atsb.gov.au> by following the links to the Aviation Research Publications.

Australian Aviation Safety in Review ��
“If Australia’s activity profile mirrored that of the
United States, Australia’s overall fatal accident rate
would fall below that of the United States.”

�0 Australian Aviation Safety in Review
The Australian Transport Safety Bureau (ATSB) is an
operationally independent body within the
Australian Government Department of Transport
and Regional Services and is Australia’s prime agency
for transport safety investigations.

Australian Aviation Safety in Review ��
Appendices
About the ATSBThe ATSB is an operationally independent body located within the Australian Government Department of Transport and Regional Services (DOTARS) and is Australia’s prime agency for transport safety investigations. Its mission is to help maintain and improve transport safety in Australia and public confidence in the safety of Australia’s transport systems.
Among other things, the ATSB performs its work by conducting independent investigations of transport accidents and incidents and the making of safety action statements and recommendations that draw on the results of those investigations. It is not the purpose of the ATSB investigations to lay blame or provide a means for determining liability.
Under the Transport Safety Investigation Act 2003 all accidents and incidents involving Australian civil aircraft must be reported to the ATSB. The ATSB will generally investigate those accidents or incidents which will yield the most useful safety benefits, however reporting of all accidents or incidents is still required to allow the ATSB access to accurate data for future statistical analysis. The ATSB can investigate accidents and the more serious incidents involving both general aviation (GA) and regular public transport (RPT), but does not have the resources to investigate accidents or incidents involving sports aviation (although it records events involving sport aviation into its database for future statistical analysis).
The role of other aviation bodies in Australia
The ATSB works closely with organisations such as CASA, Airservices Australia as well as various aircraft manufacturers and operators, and foreign investigation agencies with the aim of improving Australian aviation safety.
�� Australian Aviation Safety in Review
Data sourcesInformation on accidents, fatal accidents and fatalities in this report was based on data derived from the Australian Transport Bureau’s (ATSB) safety occurrence database unless otherwise stated.
Data on pilot licences was derived from the Civil Aviation Safety Authority (CASA).
Data on flight hours, aircraft registrations and passenger movements was derived from the collections produced by the Bureau of Transport and Regional Services (BTRE) within DOTARS.
Various sporting aviation bodies were also contacted in order to provide any relevant data on non-VH registered aircraft that were available.

Australian Aviation Safety in Review ��
Glossary:Accident – An occurrence which takes place between the time the first person boards the aircraft with the intention of flight until such time as the last person has disembarked, in which:
a) a person is fatally or seriously injured as a result of:
a. being in the aircraft
b. direct contact with any part of the aircraft including parts which have become detached from the aircraft, or
c. direct exposure to jet blast
except when the injuries are from natural causes, self inflicted or inflicted by other persons, or when the injuries are to stowaways hiding outside the areas normally available to the passengers and crew; or
b) the aircraft incurs substantial damage or is destroyed; or
c) the aircraft is missing or is completely inaccessible.
Agricultural operations – Operations involving the carriage and/or spreading of chemicals, seed, fertiliser or other substances for agricultural purposes, including the purposes for pest and disease control.
Charter – Operations that involve the carriage of cargo or passengers but do not involve scheduled flights. The lack of scheduled flights and fixed departure and arrival points distinguishes charter operations from RPT operations.
Fatal accident – An aircraft accident in which at least one fatality results within 30 days of the accident.
Fatality – Any injury acquired by a person involved in an aircraft accident and which results in death within thirty days of the accident.
Flying training – Flying under instruction for the issue or renewal of a licence, rating, aircraft type endorsement or any other type of flying aimed at upgrading an individual’s flight qualification, including solo navigation exercises conducted as part of a course of applied flying training. Check and training operations conducted by RPT operators are also included.
General aviation (GA) – Covers non-scheduled flying activity with the exception of ultralights, gliders, hang gliders, rotorcraft, balloons and military aircraft. It can be divided between commercial and non-commercial operations. Commercial operations are those which are performed on a hire and reward basis, including charter, agricultural operations, flying training and other aerial work. Non-commercial operations are those that are not performed for hire and reward such as private/business operations.
Hours flown – Calculated from the time that the wheels start, with the intention of flight, to the time the wheels stop after completion of the flight.
Incident – An occurrence, other than an accident, associated with the operation of an aircraft that affects or could affect the safety of operation.

�� Australian Aviation Safety in Review
Military aviation – Any aircraft registered to a military authority such as the Australian Defence Force.
Minor injury – An injury sustained by a person in an accident that was not a fatal or serious injury and does not require hospitalisation.
Missing aircraft – An aircraft is considered to be missing when the official search has been terminated and the wreckage has not been located.
Other aerial work – Includes operations conducted for the purposes of aerial work other than ‘flying training’ and ‘agricultural operations.’ Operations classified as other aerial work include aerial surveying and photography, spotting, aerial stock mustering, search and rescue, ambulance, towing (including glider, target and banner towing), advertising, cloud seeding, fire fighting, parachute dropping, and coastal surveillance.
Regular public transport (RPT) – Refers to aircraft that transport passengers and/or cargo according to fixed schedules and fixed departure and arrival points in exchange for monetary reward. These services can be further divided into low and high capacity aircraft.
• Low capacity RPT – An RPT aircraft that provides a maximum of 38 passenger seats and a maximum payload no greater than 4,200 kg.
• High capacity RPT – An RPT aircraft that provides more than 38 passenger seats and a maximum payload greater than 4,200 kg.
Private/business – Private flying is conducted for recreational or personal transport, while the business category refers only to the use of aircraft as a means of transport to support a business or profession, but the aircraft is not used to generate revenue directly.
Sport aviation – Any aircraft excluded from the RPT, GA or military aircraft categories including ultralights, glider, hang gliders, rotorcraft and balloon aviation. Most, if not all sport aviation craft are registered with various sporting bodies rather than with the Civil Aviation Safety Authority (CASA), although exceptions to this rule occur.
Serious Injury – An injury which is sustained by a person in an accident and which:
a) requires hospitalisation for more than 48 hours, commencing within seven days from the date the injury was received; or
b) results in a fracture of any bone (except simple fractures of fingers, toes, or nose); or
c) involved lacerations which cause severe haemorrhage, nerve, muscle or tendon damage; or
d) involves injury to any internal organ; or
e) involves second or third degree burns, or any burns affecting more than 5 per cent of the body surface; or
f) involves verified exposure to infectious substances or injurious radiation.