australian hydrogen market study
TRANSCRIPT

Australian hydrogen
market study
Sector analysis summary
24 May 2021

Advisian 1
Disclaimer
This report has been prepared by Advisian Pty Ltd. (Advisian) for the Clean Energy Finance
Corporation, and is subject to and issued in accordance with the consultancy agreement between the
Clean Energy Finance Corporation and Advisian Pty Ltd.
Advisian Pty Ltd accepts no liability or responsibility in respect of any use of or reliance upon this
report by any third party. Use of the information and data contained in this report is at the user’s sole
risk. If users rely on the information, they are responsible for ensuring independent verification of its
accuracy, currency and completeness.
Copying or modifying this report without the permission of Advisian Pty Ltd is not permitted.
Company details
Advisian Pty Ltd
ABN 50 098 008 818
Level 31, 12 Creek Street
Brisbane QLD 4000
PO Box 15081, City East QLD 4002
Australia
T: +61 7 3377 7000
F: +61 7 3377 7070
PROJECT 411001-00078 - Australian hydrogen market study - Sector analysis summary
Rev Description Author Review Advisian
approval
Revision
date
Client
approval
Approval
date
4 Issued for use
24 May 2021
R. de Vos P O'Neil P. Israel
-

Advisian 2
:
“Access to low carbon hydrogen is set
to be a key decarbonisation lever.
This study explores which sectors
have the most promise, in the
Australian context”

Advisian 3
Table of contents
Executive summary .............................................................................................................. 5
1 Study context ......................................................................................................... 20
1.1 Current hydrogen use in Australia............................................................................................ 20
1.1.1 Australian hydrogen regulations and policies......................................................... 21
2 Hydrogen production.............................................................................................. 22
2.1 Grey hydrogen .............................................................................................................................. 23
2.2 Blue hydrogen............................................................................................................................... 24
2.3 Green hydrogen ........................................................................................................................... 25
2.3.1 “Farm gate” production cost ....................................................................................... 25
2.3.2 Delivered hydrogen supply cost................................................................................. 33
3 End-use economic gap assessment ........................................................................... 40
3.1 Economic gap assessment key findings .................................................................................. 41
3.2 Transport........................................................................................................................................ 45
3.2.1 Light vehicles .................................................................................................................. 46
3.2.2 Materials handling......................................................................................................... 49
3.2.3 Heavy-duty vehicles – Line haul ................................................................................. 50
3.2.4 Heavy-duty vehicles – Return to base....................................................................... 53
3.2.5 Heavy-duty vehicles – Mining..................................................................................... 55
3.2.6 Heavy haul rail................................................................................................................ 58
3.2.7 Ferries............................................................................................................................... 61
3.2.8 Marine shipping............................................................................................................. 62
3.2.9 Aviation............................................................................................................................ 64
3.3 Fuel for industry ........................................................................................................................... 67
3.3.1 Synthetic natural gas (SNG) ........................................................................................ 67
3.3.2 Gas network – H2 blends.............................................................................................. 67
3.3.3 Gas network with hydrogen recovery ....................................................................... 68
3.3.4 100% hydrogen gas network ...................................................................................... 68
3.3.5 Combined heat and power.......................................................................................... 69
3.4 Power and grid balancing .......................................................................................................... 71

Advisian 4
:
3.4.1 Grid balancing ................................................................................................................ 71
3.4.2 Remote power................................................................................................................ 72
3.5 Feedstock for industry................................................................................................................. 74
3.5.1 Alumina calcining .......................................................................................................... 74
3.5.2 Steel mills ........................................................................................................................ 75
3.5.3 Other high grade heat applications........................................................................... 76
3.5.4 Ammonia ......................................................................................................................... 77
3.5.5 Methanol ......................................................................................................................... 79
3.5.6 Oil refining ...................................................................................................................... 80
4 Export pathways ..................................................................................................... 82
4.1.1 Export of liquid hydrogen............................................................................................ 82
4.1.2 Export of ammonia........................................................................................................ 83
5 Accelerating market development and sector competitiveness................................... 86
5.1 Market development ................................................................................................................... 86
5.2 Complimentary business models.............................................................................................. 86
5.3 Sector competitiveness summary ............................................................................................. 87
5.4 Activities to accelerate hydrogen market development ...................................................... 89
6 Key concepts explained ........................................................................................... 92
6.1.1 “Water splitting” electrolysis ....................................................................................... 92
6.1.2 Demand – Supply framework ..................................................................................... 93
6.1.3 Thermal price parity ...................................................................................................... 93
6.1.4 Centralised Vs decentralised production.................................................................. 94
6.1.5 Capacity factor and load factor .................................................................................. 95
6.1.6 Carbon neutral carbon dioxide................................................................................... 95
6.1.7 Total direct costs Vs total installed costs.................................................................. 96
Acronyms and abbreviations .............................................................................................. 98
References ...................................................................................................................... 103

Advisian 5
Executive summary

Advisian 6
:
Figure 1-1 – Market study range of scope
Hydrogen
production
Solar farms
Wind farms
Market balancing
& spill export
Water
supply
SNG
manufactureCO2
CHP
Hydrogen
recovery
Grid balancing
Remote power
Alumina calcining
Steel mills
Other high
grade heat
Ammonia
Methanol
Oil refining
Dispensing
Hydrogen delivery
Port faciliites
"Green" ammonia
Liquid hydrogen

Advisian 7
Executive summary
The CEFC sought an appraisal of the economic gap between hydrogen supply and capacity to pay for
each of the nominated demand sectors, both now and out to 2050.
To understand the potential use cases for low carbon hydrogen in the Australian context between
2020 and 2050, this study looked at:
• Hydrogen supply (technical and commercial);
• Hydrogen distribution and dispensing (technical and commercial);
• Hydrogen end-use technology limitations / efficiencies; and
• Costs of hydrogen technologies relative to incumbent technology pathways.
The considerations with greatest uncertainty are the supply side costs and end user dynamics.
Consequently, this study directed the majority of focus towards these areas. As illustrated in Figure 1-1,
this study explored hydrogen use in 25 sectors.
Due to the very low volumetric density of hydrogen, distribution of
hydrogen is significantly more expensive than natural gas and other
energy carriers. Recognising that the lowest cost renewable energy sites
are often greater than 100 kilometres from hydrogen demand centres, it
was appropriate for this study to differentiate between farm gate and
delivered hydrogen cost. Farm gate is used to determine the cost of
hydrogen at the output of the production process, that is electrolyser or
gas reformer, and does not consider delivery costs. The two key delivery
approaches that were reviewed were termed movement of molecules and
movement of electrons.
It is common practice to assign colours to different hydrogen production
pathways recognising they have different carbon intensity levels – refer to
the box at left and Section 2. This study addresses the potential for uptake
of low carbon hydrogen pathways in the Australian marketplace. Both
“green” and “blue” hydrogen are considered to yield low carbon intensity
hydrogen. The primary focus of this study is the cost dynamics for “green”
hydrogen relative to end-user “capacity to pay”. Where carbon
sequestration is possible, “blue” hydrogen can currently be produced more
cheaply than green hydrogen and can be treated as a transition fuel.
CONTEXT Low carbon hydrogen is emerging as a potential key vector for the
future of the Australian energy transition and the industrial
economy. To provide some insight on the potential competitiveness
and key hurdles associated with advancing the low carbon
hydrogen economy, this study explores the costs of production and
the competitiveness of low carbon hydrogen in 25 Australian end-
use sectors, relative to the incumbent technology.
▪ Produced by steam methane reforming (SMR) of natural gas or coal
▪ 8.5 -10 kg of CO2 / kg of H2
Grey hydrogen
▪ Produced by coupling SMR with carbon capture and storage
▪ 0.8 -4.4 kg of CO2 / kg of H2
Blue hydrogen
▪ Produced by electrolysis of water
▪ Minimal GHG footprint
Green hydrogen

Advisian 8
:
Our analysis reflects the “best industrial” practice that is near lowest practical costs. The base
production cost, that is farm gate cost, reflects the cost of production associated with hydrogen
production adjacent to a mixed wind and solar renewable energy farm. If the hydrogen production is
remote from the renewable energy source, then electricity delivery costs, such as Transmission Use of
System (TUoS) and Distribution Use of System (DUoS) charges should be added to the production
cost.
If the hydrogen is injected into a natural gas grid, then some compression maybe required, but storage
would not be required. If the produced hydrogen is to be consumed at a remote location,
transportation costs, such as trucking or a pipeline, are incurred. Most industrial users will require
some hydrogen transport. If hydrogen is to be transferred into a vehicle for use as fuel, then loading /
filling costs are also incurred.
The demand – supply cost framework that is used in this study is summarised below.
Figure 1-2 – Demand – supply cost framework used for this study
Transport
Production
Loading
/ Filling
station
Farm gate cost
Compression
and storage
Delivered cost
Dispensed cost
Supply price
Thermal fuel with minimal transport
Nat. gas
blending
Co-located
demand
Grid balancing
CHP
Remote power
Industrial
offtakers
Thermal fuel with some transport / storage
Fuel cell value with transport and loading
Industry
with H2 as
feedstock
Transport
end-uses
Export
paths
Chemical value with some transport / storage
Economic
gap
Capacity to pay
Hydrogen is today enjoying unprecedented
momentum. The world should not miss this
unique chance to make hydrogen an important
part of our clean and secure energy future.
Dr Fatih Birol Executive Director, International Energy Agency
“
“

Advisian 9
Based on the forecast trend in the price of “industrial scale” natural gas supply and the cost of a steam
methane reformer plant to convert this gas to hydrogen, we characterised the cost of grey hydrogen
production on both East and West coasts of Australia. The incremental cost of carbon capture and
storage was added to derive a farm gate production cost forecast for blue hydrogen. The production
costs for grey hydrogen do not vary significantly out to 2050, commencing at A$1.70 per kg on the
West coast, and A$2.20 per kg on the East coast.
Turning to green hydrogen, the key factors impacting the production cost are:
• Cost of renewable power;
• Electrolyser costs; and
• Intermittency of power supply.
The costs of electrolysis plants are forecast to decline rapidly as production scale escalates and
technology is refined. The cost decline curve is subject to many assumptions and speculation. We
have bounded the expected cost range using “base” and “accelerated” cost decline curves.
A key challenge for production of green hydrogen is the management of power supply variability.
Systems with more variability and / or intermittency require larger electrolysis plants relative to those
with continuous power availability to produce the same amount of hydrogen. The ratio of average
production relative to electrolyser size is termed ‘load factor’. This study has shown that in the near-
term, higher load factor system designs provide the most cost-efficient balance between current
market prices for renewable power and electrolyser capacity. In the longer-term - towards 2050 - lower
renewable energy generation costs and the wider international uptake of green hydrogen production
is likely to lower electrolyser costs with improved energy efficiency. This will likely enable cost effective
green hydrogen production with lower load factor; solar only hydrogen generation may become cost
effective.
The rapidly declining cost of solar power is one of the key triggers for interest in hydrogen production,
however the “sunshine only” electricity supply results in very large electrolysis plants to achieve a given
amount of hydrogen production relative to a hydrogen production facility with continuous power
supply. Using solar to supply a continuous demand for hydrogen is therefore heavily penalised
through the additional capital cost of electrolysis plant and hydrogen storage to provide continuous
supply.
The development of delivered hydrogen costs considers the comparison of transport and storage
requirements of three different options over a typical distance of 150 km from the point of renewable
generation or farm gate, to a coastal end user – refer to Figure 1-3 . At industrial scale, pipelines are
generally cost effective for “moving molecules”, however if existing power infrastructure can be
PRODUCTION COST
In this study we forecast that green hydrogen can be produced for less
than A$3.90/kg but when delivery costs for moving electrons and ~20
km of pipeline is added, the delivered cost are around A$5.82/kg. Out to
2050, large scale production costs could drop materially, and the
decision to move electrons or move molecules will be case dependent.

Advisian 10
:
leveraged, it may be preferable to transport
energy as electricity i.e. “moving electrons”. In
the “move molecules” case, the electrolyser is
co-located with the renewable energy facility.
In the “move electrons” case, the electrolyser is
co-located with the end user/s. A third option -
“behind the meter”, considers co-location of a
solar generation, electrolyser and the end user.
The move electrons approach has
comparatively low cost per kilometre of
infrastructure. However, the interfaces with the
National Electricity Market and uncertainties
regarding TUoS fees must be managed.
Project TUoS fees associated with low load
factor / utilisation are currently unclear and
timelines for upgrades may not match project
requirements.
The move molecules approach generally incurs
higher initial capital costs, but the resulting
pipeline infrastructure can provide storage
functions through linepack and it may be
possible to realise additional revenue from
third party agreements to move hydrogen. The
move molecules approach must also overcome
challenges associated with sourcing water and
disposing of wastewater associated with
hydrogen production processes in remote
locations.
In the near term, the scale of hydrogen
production is unlikely to be able to justify the cost of a pipeline and trucking of hydrogen is very
expensive, hence the move electrons approach is preferred for the “sub-industrial scale” (around 20
MW capacity) supply of hydrogen to industrial and transportation end-users. If a natural gas pipeline is
adjacent to a renewable energy farm, then a behind the meter solution could be attractive. Our
assessment of the industry best practice farm gate cost for green hydrogen production adjacent to a
renewable energy farm is A$3.88/kg. If hydrogen is to be consumed at >100 km from the renewable
energy farm, then a move electrons approach with a 20 km pipeline to the final end user is likely to
yield hydrogen at a price of A$5.82/kg refer to “nominal” case in Table 1-1.
It should be noted that the farm gate and delivered costs defined in this report for the near term (i.e.
2020) will likely be considerably lower cost than currently proposed projects which are generally
smaller than the 20 MW baseline and will require more first of a kind engineering for production
facilities and supporting infrastructure.
Towards 2050, the best in class projects are likely to be approaching / in excess of 1 GW, with forecast
farm gate costs dropping materially to below $2.00/kg. For these larger scale developments, the
preferred approach of linking optimal renewable energy generation sites to end-user demand is a key
consideration with many uncertainties. Our analysis considered scenarios where the optimal renewable
energy resources were over 150 kilometres from the end user. This analysis suggests that at industrial
scale, moving molecules and moving electrons approaches are cost comparable, but with very
Figure 1-3 – Schematic of delivery pathways
(Full size image is provided in Figure 2-11)

Advisian 11
different non-economic considerations. These considerations include: national grid operations
dependence, water logistics, expansion capacity and social license to operate.
A summary of the forecast cost ranges for “best in class” projects is provided below.
Figure 1-4 – Forecast hydrogen cost ranges (Real 2020, AUD/kg)
Table 1-1 – Forecast hydrogen cost summary
Metric 2020 2030 2050
“Grey” hydrogen farm gate cost ($/kg) 2.20 2.29 2.29
“Blue” hydrogen farm gate cost ($/kg) 3.02 2.80 2.80
“Base” Green H2 farm gate cost ($/kg) 3.88 2.81 2.09
“Accelerated” Green H2 farm gate cost ($/kg) 3.46 2.29 1.64
“Nominal” Green H2 farm gate cost ($/kg) 3.88 2.76 1.98
“Base” Green H2 delivered cost ($/kg) 5.82 3.48 2.72
“Accelerated” Green H2 delivered cost ($/kg) 5.43 2.96 2.23
“Nominal” Green H2 delivered cost ($/kg) 5.82 3.42 2.60
0 1 2 3 4 5 6 7 8 9 10
Grey hydrogen (Farm gate)
Blue hydrogen (Farm gate)
Green hydrogen (Farm gate)
Green hydrogen to NG network
Green H2 to "large" user (Delivered)
Green H2 to "small" user (Delivered)
Grey hydrogen (Farm gate)
Blue hydrogen (Farm gate)
Green hydrogen (Farm gate)
Green hydrogen to NG network
Green H2 to "large" user (Delivered)
Green H2 to "small" user (Delivered)
Grey hydrogen (Farm gate)
Blue hydrogen (Farm gate)
Green hydrogen (Farm gate)
Green hydrogen to NG network
Green H2 to "large" user (Delivered)
Green H2 to "small" user (Delivered)
Grey hydrogen (Farm gate)
Blue hydrogen (Farm gate)
Green hydrogen (Farm gate)
Green hydrogen to NG network
Green H2 to "large" user (Delivered)
Green H2 to "small" user (Delivered)
2020
2030
2040
2050
Forecast hydrogen production cost ranges(Real 2020, AUD/kg)
Production cost ($/kg)

Advisian 12
:
The economic gap between likely delivery price and capacity to pay, based on incumbent technology,
has been estimated for 20 industry end-use applications in 25 end use sectors. A positive economic
gap indicates that hydrogen-based technology could be economically competitive with the incumbent
technology for the given application. A negative economic gap indicates that the incumbent
technology remains competitive.
Competing technology directions such as electrification and battery electric vehicles are not
considered in the economic gap assessment, but dependence on hydrogen pathway for
decarbonisation has been scored. For example, industries that would have significant challenges in
electrifying are more dependent on hydrogen to decarbonise.
The transition in economic competitiveness of the reviewed end-use sectors for 2020, 2030 and 2050 is
summarised in Figure 1-5 below. The extent that the industry end-use sectors are likely to be
dependent on hydrogen in order to decarbonise is captured as a colour scale in the figures below.
Figure 1-5 – Transition in sector economic competitiveness over time
2.0
2.0
0.9
0.7
-1.5
-1.8
-2.0
-2.5
-2.9
-3.3
-3.5
-3.6
-4.1
-4.3
-4.7
-4.8
-5.0
-5.0
-5.3
-5.7
-31.6
-10 -8 -6 -4 -2 0 2 4 6 8 10
Remote power
Line haul vehicles
Material handling
Return to base vehicles (incl buses)
NG network (comm + resid)
Ammonia
Mining vehicles
Oil refining
Grid-balancing
Methanol
Heavy haul rail
Ferries
Steel mills
CHP - Residential
CHP - Industrial
Other med-high grade applications
Aviation - Regional
Alumina calcining
Aviation - International
Marine shipping
Light (passenger & comm) vehicles
Economic gap (2020) by industry ($/kg)
Very high (>9)
High (8 - 9)
Moderate (7 - 8)
Competitive (5-7)
Alternative likely (<5)
Dependence on H2 pathway for decarbonisation
Commercial for niche /best case projects
Non-commercial barriersstill to be addressed.
END-USE ECONOMIC GAP
In the near term, remote power and a few transport sectors are close
to achieving commercial parity with incumbent fuels. By 2030, nearly
all transport sectors achieve cost competitiveness with the incumbent
technology. Competitiveness is expected to improve in all sectors
through to 2050 due to declining hydrogen production and
distribution costs and end-use technology improvements.

Advisian 13
7.9
7.5
6.0
3.2
0.3
-0.1
-0.6
-0.6
-0.6
-1.0
-1.3
-1.3
-1.4
-1.4
-1.4
-1.6
-2.2
-2.2
-2.4
-2.8
-15.6
-10 -8 -6 -4 -2 0 2 4 6 8 10
Remote power
Return to base vehicles (incl buses)
Line haul vehicles
Material handling
Mining vehicles
NG network (comm + resid)
Aviation - Regional
Ferries
Ammonia
Oil refining
Heavy haul rail
Aviation - International
Steel mills
Grid-balancing
Methanol
CHP - Residential
CHP - Industrial
Other med-high grade applications
Alumina calcining
Marine shipping
Light (passenger & comm) vehicles
Economic gap (2030) by industry ($/kg)
Very high (>9)
High (8 - 9)
Moderate (7 - 8)
Competitive (5-7)
Alternative likely (<5)
Dependence on H2 pathway for decarbonisation
32.3
25.5
20.0
17.9
10.0
7.0
5.4
1.8
1.3
0.9
0.4
0.2
-0.1
-0.1
-0.2
-0.2
-1.1
-1.2
-1.4
-1.4
-1.9
-4 0 4 8 12 16 20 24 28 32
Light (passenger & comm) vehicles
Remote power
Return to base vehicles (incl buses)
Line haul vehicles
Material handling
Mining vehicles
Heavy haul rail
Aviation - Regional
Ferries
NG network (comm + resid)
Aviation - International
Ammonia
Methanol
Oil refining
Steel mills
Grid-balancing
CHP - Industrial
Other med-high grade applications
CHP - Residential
Alumina calcining
Marine shipping
Economic gap (2050) by industry ($/kg)
Very high (>9)
High (8 - 9)
Moderate (7 - 8)
Competitive (5-7)
Alternative likely (<5)
Dependence on H2 pathway for decarbonisation
Advisian 14
:
In all sectors, low carbon hydrogen is expected to become more competitive towards 2050, due to
parallel advances in production & distribution cost efficiency and end-use technology evolution.
In the near term, the sectors which are approaching commercial attractiveness are: line haul vehicles,
remote power, material handling and return to base vehicles (including buses).
Towards 2030, the range of sectors where hydrogen is becoming commercially viable for adoption
increases to include: mining vehicles.
As farm gate hydrogen costs approach grey hydrogen prices, around $2.30/kg, green hydrogen is
expected to displace grey hydrogen production.
Out to 2050, the range of sectors where hydrogen may be commercially viable extends to include: light
vehicles, heavy haul rail, aviation regional, ferries, natural gas network (commercial and residential),
aviation international and ammonia.
This study found that the forecast costs for low carbon hydrogen will not achieve thermal cost parity
with natural gas, of approximately $1.1/kg, before 2050. Hence the displacement of natural gas in
industrial heating applications will not occur in this timeframe without either substantial regulatory or
policy support or significantly more aggressive electrolyser and renewable energy cost declines than
were assumed by this study.
Bloomberg estimates that
approximately US$150
billion of financial support
globally would be required
before hydrogen can achieve
cost parity with natural gas.

Advisian 15
The export of hydrogen is forecast to be a key enabler of the development of a global low carbon
economy. However, the inherent very low density of hydrogen makes international export challenging.
In this report, we compare the performance of three key export pathways for delivery of hydrogen to
Japan. We evaluate both the expected delivered cost as well as the expected production cost of the
carrier. The results of this analysis are illustrated in Figure 1-6 below.
Figure 1-6 – Forecast cost of delivered green hydrogen in Japan
Although the liquefaction pathway has comparatively higher energy demand for the liquefaction step,
the biggest challenge for this pathway is the immense capital costs associated with load-out and
receiving terminals.
The pathways involving chemical bonding, such as ammonia and methanol, appear to offer lower
delivered hydrogen prices than the liquefaction pathway. In the near term, the “green” carrier cost is
significantly more expensive than the conventional, high emissions product. But by 2050, the green
product is forecast to be cheaper than the incumbent. The key challenges associated with the
ammonia pathway relate to decomposition losses when liberating pure hydrogen and management of
a toxic compound. The key challenges associated with the methanol pathway relate to securing carbon
neutral carbon dioxide (refer to Section 6.1.6) and management of a toxic compound.
0
100
200
300
400
500
600
700
800
900
0
2
4
6
8
10
12
14
Near term Long term -2050
Near term Long term -2050
Near term Long term -2050
Near term Long term -2050
Domestic hydrogen Liquefied hydrogenpathway
Ammonia pathway Methanol pathway
Co
st o
f ca
rrie
r , $
.to
n
Co
ntr
ibu
tio
n to
del
iver
ed h
ydro
gen
co
st, $
/kg-
H2
_
Green hydrogen delivered to Japan
H2 production Carrier production Load-out facilities
Transport Receiving Recovery
Carrier production cost (RHS) Carrier market price (RHS)
EXPORT PATHWAYS
‘Hydrogen can be exported in a number of carrier forms. It is not
clear whether a single carrier will dominate

Advisian 16
:
The realisation of a vibrant hydrogen economy will require early intervention and significant
government investment. Australia’s opportunity to gain comparative advantage of our local industry
requires progressive development of domestic end-use rather than waiting for industry and exports to
drive the development of the industry.
Adopting an export only approach to the early advancement of the hydrogen economy is likely to
yield less favourable commercial outcomes. Without global growth of hydrogen consumption, the cost
of hydrogen electrolysers, fuel cells and storage systems are unlikely to decline rapidly and therefore
the prospective end-use markets will remain uneconomic. The development of domestic markets will
support the social licence for hydrogen manufacturing and add to decarbonisation efforts. If hydrogen
is not accelerated, decarbonisation efforts will be more limited in scope and large-scale energy storage
and distribution may be more challenging.
Some sectors may realise an earlier adoption of hydrogen than forecast by the economic gap
assessment because they are willing to pay a green premium, receive grants / concessional finance or
use is mandated by regulation / industry targets etc. The sectors most likely to be impacted in this
way, are those with a very high dependence on hydrogen for decarbonisation, namely: marine
shipping, aviation, ammonia, and methanol.
Some short-term actions could accelerate hydrogen uptake.
This study identified several areas which could accelerate the development of the Australian hydrogen
market. The focus is on activities that will advance near commercial sectors toward economic viability
and confirmation / definition of industry standards. Notable suggestions include:
• Confirmation of requirements relating to “out of phase” generation, renewable energy certificates
and consumption of renewable electricity and their contributions to “origin certification” and
“green” classifications;
• Clarification of “Origin certification” expectations - This was a priority action under Australia's
National Hydrogen Strategy and should be progressed as soon as possible;
• Undertaking studies regarding the capacity of key sectors to accept intermittent / multi-day
supply of excess hydrogen will enable hydrogen export projects to plan where to direct
production in the event of export facility outage and builds knowledge around end-use sector
readiness;
• Assess / define the value of common user infrastructure, such as pipeline and ports, to diversify
opportunities towards decentralised solutions, and enables multiple producers and users to
participate in the hydrogen economy without first mover disadvantage / cost burden;
ACCELERATING MARKET DEVELOPMENT
Support is needed for the domestic and export hydrogen industry to
realise their potential. Sectors such as marine shipping, aviation,
ammonia and methanol have a high dependence on hydrogen for
decarbonisation and could benefit from early support to avoid the
most severe impacts of future carbon constraints
Advisian 17
• Developing development guidelines in anticipation of social licence to operate requirements such
as grid loading / pricing and water supply competition;
• Support the demonstration of hydrogen recovery from blended natural gas network projects
which stabilise the H2 concentration in a feed to a “gas peaker” power plant and yield locations
with a capacity for high quality H2 distribution / dispensing; and
• Support the reduction / removal of barriers for near economic opportunities.

Advisian 18
:

Advisian 19
1
Study context

Advisian 20
:
1 Study context
The foundations for a global low carbon economy are emerging. For the first time in history there is a
sustained interest from both political and commercial sectors. The coupling of policy development and
industry initiative has led to numerous forecasts of significant upward projections in hydrogen
demand. For instance, the Hydrogen Council suggests that low carbon hydrogen demand could reach
80,000 PJ by 2050 with associated revenue potential of more than US$2.5 trillion per annum
(Hydrogen Council, 2020).
In 2020, there were clear indications that societal forces are driving change in major corporations.
Examples include major investor, BlackRock, now requiring all companies it invests in to adopt climate
related reporting practices and Apple committing to carbon neutrality across its entire supply chain by
2030. As shareholders become less willing to accept the risks associated with market loss and
stranded assets, major corporations are seeking to protect against such economic risks by future
proofing their businesses through more sustainable investment practices and ambitious emissions
reduction targets.
A number of countries have identified the economic and reputational opportunity of using hydrogen
to complement and catalyse decarbonisation activity. Japan, Korea, China and the European Union
have all announced ambitious decarbonisation policies which target the development of “green”
hydrogen production and import as a key element of emissions reductions strategies (Future Fuels
CRC, 2019).
At this stage few hydrogen market applications have reached commercial readiness, but the continued
decline in the cost of renewable energy is expected to contribute significantly to the reduction in cost
and increased commerciality of hydrogen production in the near term (Krukowska, 2020). This, coupled
with huge investment and supportive government policies, provides the foundation for hydrogen
production and distribution to scale-up to levels where it can become competitive with the incumbent
fossil fuel industry. Bloomberg estimates that approximately US$150 billion of international financial
support is required before hydrogen can achieve cost parity (Bloomberg NEF, 2020).
The cost of renewable energy ultimately defines the cost of green hydrogen. For those countries with
abundant renewable energy resources, there is competition to become an early adopter and
commence the development of export pathways. (Collins, 2020). If early investment fails to flow then
the maturation of a hydrogen economy will progress much more slowly than forecast.
1.1 Current hydrogen use in Australia
Hydrogen plays a small but important role in Australia’s industrial processes. The merchant market for
hydrogen in Australia is negligible, with virtually all hydrogen production closely coupled with end-use
consumption. Australia’s current hydrogen consumption can be broken into three categories:
1. Feedstock to ammonia plants;
2. Feedstock to crude oil refineries processes; and
3. Other minor applications (negligible).
Australia’s current hydrogen production is around 650 ktpa and virtually all of this hydrogen is made
using Natural Gas Steam Methane Reforming (NG SMR) and is immediately consumed by the
associated ammonia synthesis (≈65%) and crude oil refining (≈35%) plant.

Advisian 21
Based on the age of the current hydrogen producing assets, it is unlikely that these assets could be re-
purposed for merchant hydrogen production – see Figure 1-1.
Figure 1-1 – Existing hydrogen production / use centres
1.1.1 Australian hydrogen regulations and policies
The National Hydrogen Strategy and Low Emission Technology statements, released in 2019 and 2020
respectively, are the clearest indication that the Federal government is committed to advancing
hydrogen based economic growth. In support of the Federal government strategy, all Australian states
and territories have released green hydrogen strategies which signal support for hydrogen
developments.
The sector would benefit from further legislation and regulatory development and
alignment
A recent review of the existing State and Commonwealth legislation and regulations identified 1,255
pieces of Australian law potentially relevant to the development of the hydrogen industry (Clayton Utz,
2019). 15F Currently, over 70 Australian Standards relevant to the hydrogen industry already exist to
enable the safe and streamlined introduction of hydrogen technologies. Additionally, around 50
international standards were identified as relevant, although no international standards relevant to
hydrogen production have been adopted as an Australian Standard (Standards Australia, 2018).
Markets demand clarification / certification of low emission credentials
Developing a common classification system e.g. CertiHy or origin labelling system is recognised a key
enabler of international / multilateral trade (COAG Energy Council, 2019).
Gibson Island (1969)Incitec Pivot Fertilisers
53 ktpa H2
Moura Ammonium Nitrate (1996)QNP
18.5 ktpa H2
Kooragang Island (1969)Orica
79.5 ktpa H2
Dyno Ammonium (2012)Dyno Nobel
37 ktpa H2
Phosphate Hill (1999)Incitec Pivot Fertilisers
33.5 ktpa H2
Yara Pilbara Nitrates (2006)Yara
141 ktpa H2
CSBP Kwinana (1968)CSBP
56.5 ktpa H2
Lytton Refinery (1965)Caltex - 40 million barrels /year
42 ktpa H2
Geelong Refinery (1954)Viva - 44 million barrels /year
52 ktpa H2
Altona Refinery (1949)ExxonMobil
33 million barrels /year30 ktpa H2
11
CoreGasMerchant hydrogen: 1.2 ktpaH2
BOC (2020)220 kW Electrolyser;’ 0.35 ktpa H2
Toyota hydrogen centreMerchant hydrogen: 0.03 ktpaH2
BOCMerchant hydrogen: 20 ktpa H2

Advisian 22
:
2 Hydrogen production
In an effort to socialise and improve communication regarding the carbon intensity of hydrogen, a
colour spectrum is used to indicate the indicative carbon intensity. The IEA (IEA, 2019) descriptions are
characterised below and summarised in Figure 2-1.
Figure 2-1 – Hydrogen carbon intensity spectrum
The colour spectrum is intended to characterise relative carbon intensity.
Black HR2 R: Hydrogen formed through coal gasification, where there is an unmanaged by-product of
carbon dioxide.
Brown HR2 R: Hydrogen formed through lignite gasification, where there is an unmanaged by-product of
carbon dioxide.
Grey HR2 R: Hydrogen formed through processing of hydrocarbons, such as via SMR, where there is an
unmanaged by-product of carbon dioxide.
Blue HR2 R: Hydrogen formed through the same processes as grey, black and brown hydrogen but where
the carbon dioxide by-product is captured and secured via an appropriate Carbon Capture Utilisation
and Storage (CCUS) technology.
Green HR2 R: Hydrogen formed via electrolysis of water using renewable electricity source(s) having no
process-related carbon emissions.
Hydrogen can be produced via a number of technological pathways. The primary focus of this report
relates to the potential for electrolytic hydrogen production based on low cost renewable energy
generation - green hydrogen production. In the nearer term only Alkaline Electrolysis (AE) and Proton
Exchange Membrane (PEM) technologies are considered to be mature.
1. Alkaline electrolysis (AE) – is an electrochemical cell and a well-established technology that
benefits from lower capital costs and process improvements than Proton exchange membrane
▪ Produced by steam methane reforming of natural gas or coal
▪ 95% of all current H2
production▪ 8.5 -10 kg of CO2 / kg of H2
▪ Produced by coupling SMR with carbon capture and storage
▪ Not yet practiced, but significant attention lately
▪ 0.8 -4.4 kg of CO2 / kg of H2
▪ Produced by electrolysis of water
▪ Solid oxide technology has significant efficiency advantage
▪ Direct solar variants in development
▪ Minimal GHG footprint
Grey hydrogen Blue hydrogen Green hydrogen

Advisian 23
(PEM) technology. However, is often associated with poor current density, less dynamic
operational capabilities and oxygen impurities in the hydrogen product.
2. Proton exchange membrane (PEM) – splits water catalytically into protons to eventually bond with
hydrogen atoms to create hydrogen gas. This technology currently suffers from higher capital
costs however offers greater flexibility and dynamic response, higher current density and purity of
hydrogen.
2.1 Grey hydrogen
Currently, 95% of the world’s hydrogen production is derived from the reforming of natural gas or
other hydrocarbons, gasified coal or gasified heavy oil residues. The most widely applied technology is
steam methane reforming (SMR), although auto-thermal reforming (ATR) is increasingly being applied
for large-scale hydrogen production. SMR can be considered a mature technology and widely used
across the refining and petrochemical industries. Improvements in recent years have included higher
performing materials, improved heat recovery, lower pressure drop and higher conversion catalysts.
Integration of SMR technology into the Haber-Bosch process for ammonia synthesis is mature
technology with huge commercial competition driving continuous technology evolution. In
comparison, numerous ATRs are in operation worldwide, but most operate as secondary reformers in
ammonia plants in collaboration with SMR technology. Cost effectiveness and energy consumption of
these reforming technologies varies considerably with scale. Capacities less than 50 ktpa HR2R are
increasingly considered to be small / marginally cost effective in the world marketplace1P. The carbon
intensity resulting from modern SMR plants with natural gas feed, ranges from 8.5 to 10 kg CO R2R-e / kg
HR2R.
SMR is more correctly described as the combination of two separate reactions; methane reforming and
water-gas shift. Steam methane reforming is a multi-step chemical process, requiring:
• a series of pre-reformers to desulphurise the gas and remove longer hydrocarbons such as
ethane;
• the methane reformer where methane and water are converted into hydrogen and carbon
monoxide;
• ‘Water Gas Shift’ reactors downstream of the main reformer, to maximise the quantity of
hydrogen in the syngas produced by the reformer;
• A complex furnace design to supply heat to the main reformer and ensure adequate gas
conversion; and
• Expensive gas separation equipment, typically a Pressure Swing Adsorption (PSA) unit.
The first reaction takes methane and water (steam) and produces hydrogen (H R2R) and carbon monoxide
(CO) in the presence of a nickel catalyst. This reaction is endothermic and requires external heat input.
The reactor operates a pressure between 14 and 40 bar. The water-gas shift reaction takes the newly
formed CO and reacts with more water to form additional HR2R and COR2R. The net effect of the reactions
is moderately endothermic.
1 This scale is aligned with 300 ktpa ammonia scale plants. Chemea [Chinese] reference.

Advisian 24
:
2.2 Blue hydrogen
In the early 2000’s, it was often forecast that the development of the hydrogen economy would
transition through blue hydrogen i.e. fossil fuel sourced with carbon capture. Many industry
participants are promoting blue hydrogen, although there is potential that green hydrogen will
achieve price parity with blue hydrogen within the next 10 to 15 years – see Figure 2-14 in Section
2.3.2.
The application of carbon capture and storage (CCS) to reduce the carbon intensity of the hydrogen
product has been pursued in principle for nearly two decades. Carbon dioxide produced by the natural
gas SMR process is captured via well-established technologies, including amine adsorption, drying and
compression for pipeline transportation. Pipeline transportation and injection of COR2R-rich waste gases
are also well-established technologies, as used in enhanced oil recovery activity.
The key hurdles to broad application of this technology include:
• Weak utilisation market outside of enhanced oil recovery (EOR), hence Carbon Capture, Utilisation
and Storage (CCUS) is often only CCS;
• Requirement to demonstrate that sequestered emissions remain in-place over geological time;
• Water / corrosion management in compression systems;
• Additional capital cost for capture, transport and storage infrastructure; and
• Additional operating costs for infrastructure and parasitic electricity demand.
With limited offtaker interest and a weak carbon market in Australia and globally, there has until now
been limited motive to pursue this avenue of decarbonisation. The older natural gas SMR process
schemes yield both dilute and rich carbon dioxide waste streams. The later stream is targeted by early
carbon storage project developers and synthetic fuel proponents but is already often used to convert
ammonia to urea.
A 99.8% stream purity specification from the CO2 rich stream can often be achieved for blue hydrogen
facilities without significant impact on the capital and operating cost of the reformer plants. Figure 2-2
summarises the range of costs between West coast and East coast with 60 to 90% CO2 emissions
avoidance.
Figure 2-2 – Forecast farm gate cost of grey and blue hydrogen (Real 2020, AUD/kg)
0
1
2
3
4
5
6
7
8
9
10
0
1
2
3
4
5
6
2020 2025 2030 2035 2040 2045 2050
NG
pri
ce (
$/G
J)
Leve
lised
cos
t of
hyd
roge
n (
$/kg
)
Year
Forecast farm gate cost of hydrogen production(Real 2020, AUD/kg)
'Grey' cost range 'Blue' cost range Bulk NG price (East coast) Bulk NG price (West coast)

Advisian 25
2.3 Green hydrogen
The current optimism regarding green hydrogen as a future fuel and fossil fuel sector disruptor is
based on the forecast that the supply costs of renewable energy and the capital costs of water splitting
electrolysis units will follow steep cost decline curves, similar to those witnessed in the computer and
solar photovoltaic (PV) industries.
2.3.1 “Farm gate” production cost
The term farm gate production cost refers to the cost required to produce hydrogen at a
manufacturing facility. It does not include the cost of transport or storage.
In our assessment of the farm gate cost of green hydrogen, we considered the impact of four key
drivers which are further discussed below:
3. Capital cost of the electrolyser and cost reduction rate over time;
4. Scale of development;
5. Efficiency of electrolysis units; and
6. Price and load factor of electricity supply.
Significant reductions in farm gate cost for green hydrogen production prior to 2050 will require the
favourable alignment of the following key elements:
• Continuing rapid decline in the cost of renewable energy supply;
• Growing global demand for green hydrogen resulting in declining electrolyser costs;
• Technical evolution that improves electrolyser efficiency and results in lower operating costs;
• Contracting arrangements with renewable energy generators developed to share the risk of the
intermittent wind / solar resource with the hydrogen generators;
• End user off-taker contracts are established to allow for flexibility in hydrogen production rate;
• Cost effective water supply and wastewater treatment;
• Social licence to operate and hydrogen policy context to be advanced; and
• Access to low cost finance.
Capital cost of the electrolyser
The impact of manufacturing scale and continued research and development are expected to support
a rapid cost reduction curve for electrolysers, and in particular, the electrolyser stack. It is noted that
more than half of the costs associated with the electrolyser unit are associated with mature
technology, such as water coolers, separation vessels, transformers and instrumentation. These
systems have many more elements and imbedded bulk costs than computer chips and solar PV
systems, where micro-sizing provided significant cost leverage. As such, it should not be expected that
continuous cost declines comparable to these industries can be achieved for the overall system.
In the longer term, it is expected that price reductions will occur in all categories identified, rather than
occurring in a specific area. The least mature components, that is electrolyser stack, diaphragms /
membranes and purification systems, will have the fastest learning curve in response to a growth in
industrial demand.

Advisian 26
:
The various electrolyser vendors provide different scopes of supply, from the core base components of
stacks, control and purification, to the delivery of the full project including construction and
installation. The capital costs reported for electrolysis units and power generation are on a Total Direct
Cost (TDC) basis (often termed “delivered cost”), but calculations used to determine the levelised cost
of hydrogen are based on Total Installed Cost (TIC). See Section 6.1.7 for the definition of TDC and
TIC.
A summary of benchmark total direct costs from international research bodies is shown in Table 2-1.
Table 2-1 – Estimated 2020 total direct costs for electrolyser units
Source Details Reference
(millions/MW)
Implied
Australian cost²
(millions/MW)
IEA 2019 price for generic alkaline electrolyser installed in
US Gulf Coast
US$0.9 A$1.435
IRENAP
1 Alkaline electrolyser; balance of plant inclusions are
not specified for 20 MW package
2017 - €0.75
2025 - €0.48
A$1.15
IRENAP
1 PEM electrolyser; balance of plant inclusions are not
specified for 20 MW package
2017 - €1.2
2025 - €0.7
A$1.8
BNEF 2019 price for generic electrolyser produced by a
European vendor
US$1.2 A$1.9
BNEF 2019 price for generic electrolyser produced by a
Chinese vendor
US$0.2 A$0.32
P
1 PIRENA data is linearly interpolated between data from 2017 and 2025.
² 10% cost increase to account for Australian installation costs.
Advisian benchmarking for the cost of alkaline electrolysers in East Coast Australia is summarised in
Figure 2-3, and is based on the following observations.
• Electrolysers at small scales, <50MW, were higher cost and not considered representative of the
electrolyser market.
• Advisian does not have any evidence that Chinese electrolysers are an order of magnitude
cheaper than European vendors.
• Although some Chinese electrolysers appear very cheap in the 0 to 50 MW range, the efficiency is
not comparable to other electrolysers. The cost base for our modelling is aligned with the higher
capital cost and higher efficiency electrolysers.
• Several key electrolyser vendors indicate a near-term cost reduction between 10% and 15% for
electrolyser units, inclusive of balance of plant. These cost reductions are expected to result from
design and footprint optimisation, hence, the equipment cost savings will likely translate to
installed cost savings of a similar magnitude.
• The price of the electrolyser units is mildly dependent on scale. This is consistent with market
expectations; although the cost of additional electrolyser cells is linear and therefore independent
of scale, the balance of plant - compression, purification and cooling, is responsive to economies
of scale.

Advisian 27
Optimising for lowest lifecycle cost
The concept that lowest capital costs does not translate to lowest lifecycle cost is especially true
for electrolysis plants.
Note the figure above only incudes electrolyser capital and power prices; it excludes membrane replacement, other O&M, storage and
transport.
-
0.5
1.0
1.5
2.0
2.5
3.0
Advisian 'base' Low CAPEX Chinese
LCO
H (
AU
D/k
g)
CAPEX Power Cost
• Based on our knowledge of pricing at different scales, a scale factor of 0.95 has been applied. This
means that doubling the capacity of the electrolyser reduces the cost per MW by 5%.
• Many manufacturers have assessed complementary low-cost manufacturing, and this is part of
the near-term cost reduction potential.
• Our “base” interpretation of electrolysis plant cost response to scale is represented by a best fit
through current data with a step-change 10% cost reduction in the near-term - the solid gold line
in Figure 2-3.
• Our “accelerated” interpretation of electrolysis plant cost response to scale is represented by a
lower specification electrolyser resulting in a 30% near-term reduction on Capex, operating with a
comparable energy efficiency as the base case. This is represented by the dashed gold line.
Figure 2-3 - Advisian alkaline electrolyser cost (2020) benchmarking
The proposed total direct electrolyser price ranges between A$0.8 and A$1.2 million per MW, which are
comparable to the estimates of the IRENA and International Energy Agency.
Figure 2-3 identifies two data points with ~30% lower
capital cost than our baseline.
The efficiency of these units is at least 5 kWh/kg worse than
the best available technology. On a levelised cost basis this
increases the electricity price per kilogram of hydrogen by
approximately 10%.
Using an optimistic electricity price for renewables of
$40/MWh with an 80% load factor, the lower efficiency
translates to higher levelized cost of production of
$2.74/kg, compared to $2.68 using the higher capital cost
and improved efficiency.

Advisian 28
:
Scale of development
The price of the electrolyser is mildly dependent on scale. This is consistent with market expectations;
although the cost of additional electrolyser stacks are linear and therefore independent of scale, the
balance of plant - compression, purification and cooling, is responsive to economies of scale.
Alkaline electrolyser units are typically modular at 10 MW or 20 MW scale, hence underlying costs are
almost linear with scale. There are scale advantages for the balance of plant, transport infrastructure
and installation efficiency up to ≈300 MW capacity, hence our forecasts of the capital cost for
electrolyser units over time are based on this industrial scale – see Figure 2-4.
To blend the cost behaviour with scale and electrolyser cost learning curves, Advisian interpreted the
likely scale-up in Australian project size over time: demonstration scale projects between 2025 and
2027 to beyond 36.5 ktpa (100 tpd), approximately 290 MW at a 75% load factor, and then larger than
200 ktpa (~1.8 GW) around 2030. The combined outcome of project scale and technical development
on the project capital cost is defined below in Figure 2-4.
Figure 2-4 - Forecast electrolyser cost per MW as technology develops and project scale increases
Efficiency of electrolysis units
The effort to reduce capital costs may impact
adversely on electrolyser unit efficiency, but this
would be counter-productive. Most
international literature forecasts a slow
improvement in efficiency; hence this basis has
been adopted. We have assumed that
electrolyser efficiency will follow the base case,
IEA forecast. The resulting learning curves are
summarised in Figure 2-5.
0.0
0.2
0.4
0.6
0.8
1.0
1.2
2020 2025 2030 2035 2040 2045 2050
CA
PEX
/MW
(M
illi
on
s A
UD
)
Year
Forecast CAPEX/MW
Base cost curve Accelerated cost curve
Industrial sale i.e. >200 ktpaScaling to >200 MW / train and200 ktpa plant capacity
Figure 2-5 - Electrolyser efficiency forecast
44
45
46
47
48
49
50
51
52
53
2020 2025 2030 2035 2040 2045 2050
Sta
rt o
f li
fe e
ffic
ien
cy (k
Wh
/kg)
Year
Alkaline electrolyser efficiency forecast
Industrial sale i.e. >200 ktpaScaling to >200 MW / train and200 ktpa plant capacity

Advisian 29
Price and load factor of electricity supply
Renewable energy projects can often secure access to low cost capital, enabling low cost power
generation. The levelised cost of electricity (LCOE) for solar and wind projects were assessed based on
projects based in the Fitzroy REZ (Queensland) based on the AEMO ISP V1.4.P1 The weighted average
cost of capital of 5% was used for assessing these projects, as agreed with CEFC, based on 10% equity
return, 70% gearing and 4% cost of debt. The LCOE forecasts are shown in Figure 2-6. In practice, PPA
pricing is often CPI indexed, up to 2.5% is typical, hence lower short-term pricing than is characterised
below is often quoted.
Figure 2-6 - Forecast LCOE renewable energy prices (real without CPI, 2020) - Fitzroy, Queensland
If solar power is the only source of power to an electrolyser, then hydrogen generation is limited to
sunshine hours, and asset utilisation is poor, representing a low load factor. While the capital cost of
electrolysers remains significant, solar only based hydrogen production is expensive due to the low
asset utilisation. Access to renewable power sources with more consistent power flow, even at a higher
price, provide significantly better economic outcomes. In the near-term, developments are targeting
very high load factors of around 75%, utilising an overbuild of mostly wind generation capacity, with
surplus generation being sold on the spot electricity market. Our analysis assumes that the renewable
energy farms can export excess production to the grid and will provide coarse network balancing
services, refer Figure 2-7. This means generation will be diverted to the grid when the electricity spot
market price is greater than $150/MWh.
Figure 2-7 – Characterisation of the changing nature of hydrogen production facilities
0
100
200
300
400
500
600
700
800
0 2 4 6 8 10 12 14 16 18 20 22
Po
wer
sup
ply
(M
W)
Hour of day
Typical power profile for ~50% load factor design
Solar contribution Wind contribution Exported
Peak export to the
grid
800 MW solar
200 MW wind
585 MW electrolyser
0
100
200
300
400
500
600
700
800
0 2 4 6 8 10 12 14 16 18 20 22
Po
wer
sup
ply
(M
W)
Hour of day
Typical power profile for >90% load factor design
Solar contribution Wind contribution Exported
Significant export
to the grid
200 MW solar
800 MW wind
300 MW electrolyser

Advisian 30
:
It is evident that the relative cost decline curves for renewable power and electrolysis plants will impact
the optimised load factor that is adopted over time. In the near term, electrolyser costs are
comparatively higher than the cost penalties associated with higher capacity factor renewable power
generation, hence higher load factor (e.g. >80%) developments are anticipated. If the cost of
electrolysis plants decline rapidly it is possible to envisage green hydrogen production facilities based
on lower load factor renewable power supply options. A summary of the potential changes that may
result over time is captured below.
Figure 2-8 – Characterisation of the changing nature of hydrogen production facilities
Near term approach Longer term approachMixed renewables with grid export @ 75% LF Behind the meter @ 50% LF
-500
-300
-100
100
300
500
700
900
1,100
1,300
1,500
Solar Wind Electrolyser unit Water
Pre
sen
t va
lue
(A$
mil
lio
ns)
Present value costs
CAPEX OPEX NPV Revenue NPV
-500
0
500
1,000
1,500
Solar Wind Electrolyser unit Water
Pre
sen
t va
lue
(A$
mil
lio
ns)
Present value costs
CAPEX OPEX NPV
440 MW
440 MW
440 MW
36.1 ktpa H2
45.1 kWh/kg + 8.5 MW BoP
$31.1/MWh
1.2 ML/d
290 MW
270 MW
480 MW
Market balancing &spill export
31.4 ktpa H2
52.1 kWh/kg + 8.8 MW BoP
$42.5/MWh
1.2 ML/d
Capital cost is nearly half long term despite larger electrolysis plant
Capital cost is lower long term despite more MW power installed
Considerable decline in average electricity supply price

Advisian 31
Based on a simplified hydrogen production cost model, the basic relationship between electrolyser
load factor and levelised cost was characterised as shown in Figure 2-9. The model indicated that a
75% load factor in the near-term and a 50%, or lower, load factor in the longer term are likely optima
for industrial scale green hydrogen facilities. This change is driven by falling solar power cost and
electrolyser capital costs.
Figure 2-9 – Relationship between electrolyser load factor and LCOH (farm gate)
Forecast farm gate production cost
The results of our hydrogen production cost analysis are summarised in Figure 2-10 and Table 2-2
below. We note that the cost trends assume huge growth in the global and domestic demand for
green hydrogen to drive industrial scale plants and equipment manufacturing volume, along with
sustained declines in the price of renewable energy generation and electrolysers.
Our modelling suggests that with 2020 nominal case values, hydrogen can be produced for around
$3.90 per kg at industrial scale, falling to just less than $2 per kg in the long term, driven by falling
electrolyser costs and renewable energy costs. It is noted that the 2020 case includes credit for export
of electricity to the market during high price periods and the long-term case assumes no export of
electricity.
The farm gate and delivered costs defined in this report for the near term (i.e. 2020) will likely be
considerably lower cost than currently proposed projects which are generally smaller than the 20 MW
baseline and require more first of a kind engineering for production facilities and supporting
infrastructure. Further our cost forecasts represent "industry best practice" with idealised access to
capital and high quality, low cost renewable resources.
0
1
2
3
4
5
6
7
25 35 45 55 65 75 85 95
Leve
lise
d c
ost
of
hyd
roge
n (
$/k
g)
Electrolyser load factor (%)
LCOH reponse to electrolyser load factor
Accelerated case - 2020 Accelerated case - 2050 Base case - 2020 Base case - 2050
Relatively flat profile from 50% to 25% load factor suggests an optimium near
50% when accounting for storage costs.
Profile has enough gradient to trade-off between generation costs and storage
costs. Lower LF maybe optimal.
.
Pronounced minimum near 75% load factor suggests an optimium near 75- 80% when
accounting for storage costs.

Advisian 32
:
Figure 2-10 – Forecast farm gate cost of hydrogen (Real 2020, AUD/kg)
Table 2-2 – Key farm gate hydrogen production cost metrics
* - Net renewable energy cost after accounting for export of spilled production and power
diversion when spot market prices are >$150/MWh.
0
1
2
3
4
5
6
2020 2025 2030 2035 2040 2045 2050
Leve
lise
d c
ost
of
hyd
roge
n (
$/k
g)
Year
Forecast farm gate cost of hydrogen production(Real 2020, AUD/kg)
'Grey' cost range 'Green' cost range Base electrolyser cost curve Accelerated electrolyser cost curve
Smaller scale developments with higher cost renewables and support infrastructure.
Industrial scaleElectrolyser cost improvementRenewable generation cost improvement & increased proportion of solar
Scaling to 200 ktpaElectrolysercost improvementRenewable generation cost improvement
COST DRIVERS
Green cost zone covers both base and accelerated electrolyser cost
decline forecasts
Cross-over zone
(Central estimates)
Significant scale with lower cost electrolyser and
renewable power.
Metric 2020 2025 2030 2040 2050
Grey hydrogen farm gate cost ($/kg) 2.20 2.26 2.29 2.29 2.29
Blue hydrogen farm gate cost ($/kg) 3.02 2.76 2.80 2.80 2.80
Base electrolyser unit TDC (A$/kW) 1,125 932 783 644 504
Accelerated electrolyser unit TDC (A$/kW) 787 571 392 308 224
Renewable electricity cost* ($/MWh) 42.2 38.3 35.1 31.3 27.1
Load factor (%) 75 71 66 58 50
Base Green H2 farm gate cost ($/kg) 3.88 3.22 2.81 2.47 2.09
Accelerated Green H2 farm gate cost ($/kg) 3.46 2.76 2.29 1.98 1.64

Advisian 33
2.3.2 Delivered hydrogen supply cost
Figure 2-11 – Schematic of delivery pathways
Renewable electricity
Hydrogen production facility (HPF)
Raw water
End user
Option 1 - Move molecules from wind and solar farm (Variable load factor)
BTM solar generation
Raw water
Option 2 - Move electrons (Variable load factor)
Option 3 - Move molecules from solar farm
Sale of spilled
production
75 - 50% load
factor
Other end-users
Other end-users
Renewable electricity
Hydrogen production facility (HPF)
Raw water
End user
Sale of spilled
production
75 - 50% load factor
Hydrogen storage
20 km
Hydrogen production facility (HPF)
End user
25% load
factor
Hydrogen storage
20 km

Advisian 34
:
In Australia, the distance between optimal renewable resources and end-use locations is often
considerable. Typically, inland areas adjacent to mountain ranges provide more reliable wind and solar
resources, whereas hydrogen demand by industry or export is typically at the coast. Electrolysers also
require water, which is often progressively more constrained moving inland, with increased
competition from settlements, agriculture and industry.
Our delivered hydrogen analysis considers the cost of transport or storage over a typical distance of
150 km from the point of generation, or farm gate, to a coastal end user. In the “move molecules”
case, the electrolyser is co-located with the renewable energy facility. In the “move electrons” case, the
electrolyser is co-located with the end user. A third option “behind the meter” considers co-location of
a solar farm, electrolyser and the end user.
Our analysis of three “delivered” hydrogen supply pathways indicates that pipeline-based transport
and storage, that is the “move molecules” option, has numerous non-economic advantages, but is not
always economically advantageous. In the near term, the scale of hydrogen production is unlikely to be
able justify the cost of a pipeline and trucking of hydrogen is very expensive, hence the move electrons
approach is preferred for the “sub-industrial scale” (around 20 MW capacity) supply of hydrogen to
industrial and transportation end-users. If a natural gas pipeline is adjacent to a renewable energy
farm, then a behind the meter solution could be attractive.
The “move the electrons” option can be competitive if existing power infrastructure can be utilised,
and “behind the meter” becomes competitive longer term.
Currently, most hydrogen cost forecasts are heavily caveated to represent the theoretical costs of
production based on the electricity cost and the engineering, procurement and construction costs to
determine the Total Delivered Cost2 of the electrolyser plant.
The cost forecasts often exclude the costs for: storage, transport to the end user, additional
compression, electricity transmission and indirect capital costs and profit margin. Through the
pragmatic characterisation of different development options, we have developed some guidance
regarding the impact of including this additional infrastructure within the scope of delivered hydrogen
supply costs.
Figure 2-11 provides a summary schematic of the following the hydrogen supply options investigated:
1. Option 1: Move molecules from mixed renewables farm
2. Option 2: Move electrons from mixed renewables farm
3. Option 3: Move molecules from solar farm
2 All costs that can be directly attributed to the design, procurement and installation of an asset, refer Section
6.1.7.
Advisian 35
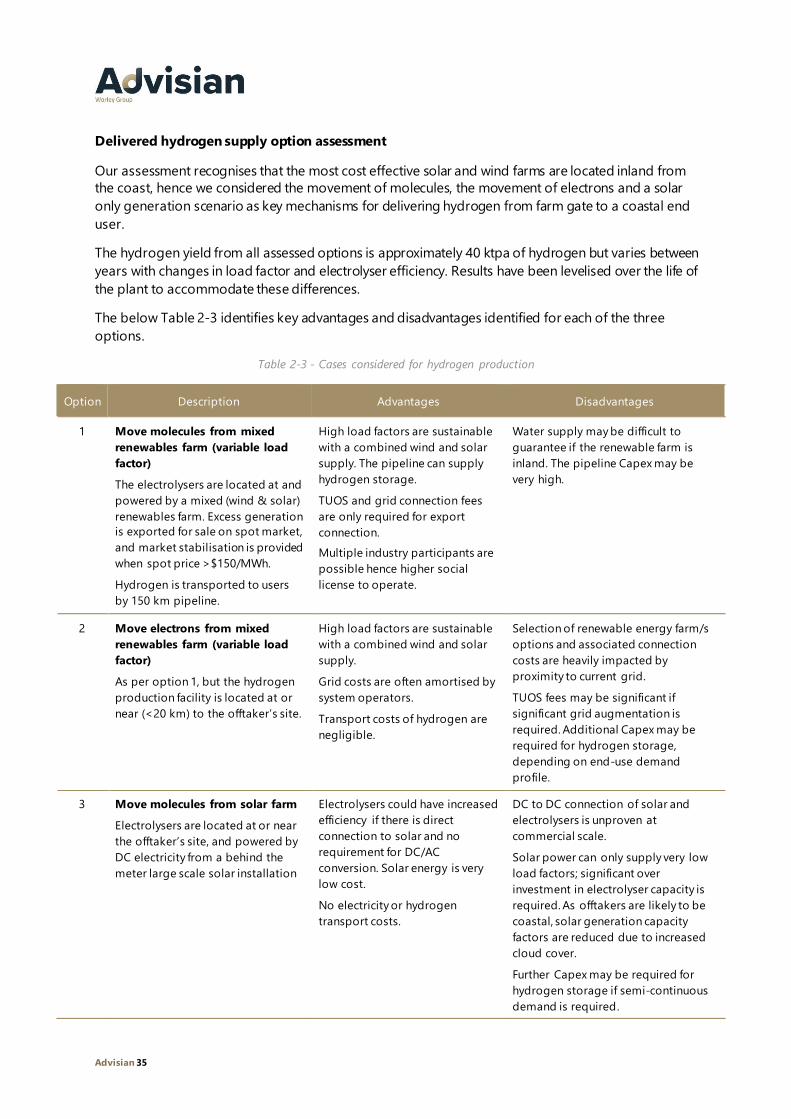
Delivered hydrogen supply option assessment
Our assessment recognises that the most cost effective solar and wind farms are located inland from
the coast, hence we considered the movement of molecules, the movement of electrons and a solar
only generation scenario as key mechanisms for delivering hydrogen from farm gate to a coastal end
user.
The hydrogen yield from all assessed options is approximately 40 ktpa of hydrogen but varies between
years with changes in load factor and electrolyser efficiency. Results have been levelised over the life of
the plant to accommodate these differences.
The below Table 2-3 identifies key advantages and disadvantages identified for each of the three
options.
Table 2-3 - Cases considered for hydrogen production
Option Description Advantages Disadvantages
1 Move molecules from mixed
renewables farm (variable load
factor)
The electrolysers are located at and
powered by a mixed (wind & solar)
renewables farm. Excess generation
is exported for sale on spot market,
and market stabilisation is provided
when spot price >$150/MWh.
Hydrogen is transported to users
by 150 km pipeline.
High load factors are sustainable
with a combined wind and solar
supply. The pipeline can supply
hydrogen storage.
TUOS and grid connection fees
are only required for export
connection.
Multiple industry participants are
possible hence higher social
license to operate.
Water supply may be difficult to
guarantee if the renewable farm is
inland. The pipeline Capex may be
very high.
2 Move electrons from mixed
renewables farm (variable load
factor)
As per option 1, but the hydrogen
production facility is located at or
near (<20 km) to the offtaker’s site.
High load factors are sustainable
with a combined wind and solar
supply.
Grid costs are often amortised by
system operators.
Transport costs of hydrogen are
negligible.
Selection of renewable energy farm/s
options and associated connection
costs are heavily impacted by
proximity to current grid.
TUOS fees may be significant if
significant grid augmentation is
required. Additional Capex may be
required for hydrogen storage,
depending on end-use demand
profile.
3 Move molecules from solar farm
Electrolysers are located at or near
the offtaker’s site, and powered by
DC electricity from a behind the
meter large scale solar installation
Electrolysers could have increased
efficiency if there is direct
connection to solar and no
requirement for DC/AC
conversion. Solar energy is very
low cost.
No electricity or hydrogen
transport costs.
DC to DC connection of solar and
electrolysers is unproven at
commercial scale.
Solar power can only supply very low
load factors; significant over
investment in electrolyser capacity is
required. As offtakers are likely to be
coastal, solar generation capacity
factors are reduced due to increased
cloud cover.
Further Capex may be required for
hydrogen storage if semi-continuous
demand is required.

Advisian 36
:
Delivered cost of hydrogen option assessment findings
The results of our modelling are captured in Figure 2-12. For industrial scale facilities, there is little
commercial difference between moving the molecules (Option 1) and moving the electrons (Option 2)
approaches. The decision regarding which option to adopt would depend on project specific elements
such as:
• Required level of electricity or pipeline network augmentation;
• End user offtake flexibility;
• Overall availability and proximity of water resources; and
• Delivery schedules.
In the near-term, when traded hydrogen volumes are not sufficient to justify the installation of
hydrogen pipelines, and a “move the electrons” approach with a 20 km pipeline to the final end user is
the most commercially attractive. The delivered costs include farm gate costs plus power transmission
fees (i.e. TUoS/DUoS) and hydrogen pipeline and storage costs. For the near term cases, a “sub-
industrial scale uplift” adder is also included to account for the cost differential between truck based
transport and pipeline based transport shown as on Figure 2-12.
Figure 2-12 – Levelised cost of hydrogen for different delivery cases
$4
2/M
Wh
$5
5/M
Wh
$4
5/M
Wh
$3
5/M
Wh
$4
9/M
Wh $
27
/MW
h
$3
1/M
Wh
$4
8/M
Wh
$2
3/M
Wh
$2
7/M
Wh
$4
6/M
Wh
$1
9/M
Wh
0
1
2
3
4
5
6
7
8
Optio
n 1
Optio
n 2
Optio
n 3
Optio
n 1
Optio
n 2
Optio
n 3
Optio
n 1
Optio
n 2
Optio
n 3
Optio
n 1
Optio
n 2
Optio
n 3
2020 - 2030 - 2040 - 2050
Del
iver
ed h
ydro
gen
pri
ce (A
$/k
g)
Delivered LCOH under three production scenarios - Industrial scale (Base electrolyser costs)
Electrolyser CAPEX Electrolyser OPEX TUOS/DUOS cost H2 transport & storage cost Sub-industrial scale uplift
Effective electricity cost
Behind the meter based solutions become cost effective longer term
"Move electrons"ispreferred in the near
term
Higher TUoS costswith lower load factor
Components of "farm gate" costs
Option 1 - Move molecules (75 → 50% load factor) with grid export capacity. Hydrogen storage via. linepack in 100 km pipeline.
Option 2 - Move electrons (75 → 50% load factor) with grid export capacity. Fixed hydrogen storage.
Option 3 - Solar only with fixed hydrogen storage.
All options source raw water local to the hydrogen production facility.

Advisian 37
Non-economic advantages of the move molecules approach include:
a. Reducing entry barriers for other remote hydrogen producers / offtakers through establishment
of common user pipelines – this is likely to increase the social licence to operate;
b. Hydrogen production facilities can play an electricity market support role;
c. Creates potential for a broader supply and demand market with multiple suppliers and offtakers
from a given pipeline system;
d. Progressive hydrogen market expansion is possible through management of intermittent supply
and demand through pipeline linepack; and
e. Pipeline Opex is lower than powerline Opex providing lower costs with extended asset life.
The analysis established that, towards 2050, behind the meter production (Option 3) becomes cost
competitive. However, higher load factor options such as Option 1, can deliver near continuous
production rates required for many downstream facilities, which includes liquefaction and ammonia
synthesis.
Based on 2020 Base case electrolyser costs, the results suggest that in the near “move electrons” is the
preferred approach with a “best industrial” practice costs of $5.82/kg. Mid-term and towards 2050, the
“move molecules” approach is adopted with a “best industrial” practice costs of $3.48 and $2.72/kg.
The “accelerated” electrolyser cost analysis suggests “best industrial” practice costs of $5.43/kg (2020).
$2.96/kg (2030) and $2.23/kg (2050).
The “nominal” costs for “large volume” delivered hydrogen adopts base electrolyser costs in the near
term and transitions towards the accelerated electrolyser cost curve, with 75% base / 25% accelerated
by 2050. These delver hydrogen costs are summarised in Table 2-4 and Figure 2-13 below.
Table 2-4 – Forecast delivered hydrogen cost summary
Metric 2020 2030 2050
“Base” Green H2 delivered cost ($/kg) 5.82 3.48 2.72
“Accelerated” Green H2 delivered cost ($/kg) 5.43 2.96 2.23
“Nominal” Green H2 delivered cost ($/kg) 5.82 3.42 2.60
Figure 2-13 – Forecast delivered cost of hydrogen
0
1
2
3
4
5
6
7
2020 2025 2030 2035 2040 2045 2050
Leve
lise
d c
ost
of
hyd
roge
n (
$/k
g)
Year
Forecast "delivered" cost of "green" hydrogen production(Real 2020, AUD/kg)
Farm gate cost 'Delivered' cost range Base electrolyser cost curve Accelerated electrolyser cost curve
Distrirbuted generationbased on curtailed power
Trucking ~100km~$3/kg delivery
Delivery via. pipeline with linepack for storage / capacity growthDelivery via truck
COST DRIVERS
Pipelines @ scale~$0.7/kg delivery

Advisian 38
:
The forecast range of hydrogen production costs are provided in Figure 2-14.
Figure 2-14 – Forecast cost of hydrogen
0 1 2 3 4 5 6 7 8 9 10
Grey hydrogen (Farm gate)
Blue hydrogen (Farm gate)
Green hydrogen (Farm gate)
Green hydrogen to NG network
Green H2 to "large" user (Delivered)
Green H2 to "small" user (Delivered)
Grey hydrogen (Farm gate)
Blue hydrogen (Farm gate)
Green hydrogen (Farm gate)
Green hydrogen to NG network
Green H2 to "large" user (Delivered)
Green H2 to "small" user (Delivered)
Grey hydrogen (Farm gate)
Blue hydrogen (Farm gate)
Green hydrogen (Farm gate)
Green hydrogen to NG network
Green H2 to "large" user (Delivered)
Green H2 to "small" user (Delivered)
Grey hydrogen (Farm gate)
Blue hydrogen (Farm gate)
Green hydrogen (Farm gate)
Green hydrogen to NG network
Green H2 to "large" user (Delivered)
Green H2 to "small" user (Delivered)
2020
2030
2040
2050
Forecast hydrogen production cost ranges(Real 2020, AUD/kg)
Production cost ($/kg)

Advisian 39
2 End-use economic
gap assessment

Advisian 40
:
3 End-use economic gap assessment
This section explores five classes of end-uses and 25 end-use cases. A high level summary of the end-
use classes is provided below. These end-uses are discussed in greater detail below.
Table 3-1 – End-use classes addressed in this report
Class Possible role of hydrogen cases
Transport
Hydrogen can be used in fuel cells to
efficiently generate electricity for an electric
vehicle or converted into a denser form, such
as ammonia, methanol and synthetic fuel, for
use in combustions engines.
• Material handling
• Light vehicles
• Heavy vehicles – Line haul
• Heavy vehicles – Return to source
• Heavy vehicle – Mining
• Rail
• Ferries
• Marine shipping – Methanol
• Marine shipping – Ammonia
• Aviation
Fuel for industry Displacing natural gas as fuel source for
industry.
• Synthetic natural gas
• Gas network (i.e. Blending)
• Gas network with hydrogen
recovery
• Hydrogen gas network
• Combined heat and power
Power and grid
balancing
Generation and storage of hydrogen when
renewable power exceeds demand and then
converting back to power when there is a
power shortfall.
• Grid balancing
• Remote power
Feedstock for industry Taking advantage of the specific thermo-
chemical properties of hydrogen rather than
just heating value.
• Alumina calcining
• Steel mills
• Other high grade heat
• Ammonia
• Methanol
• Oil refining
Export Providing a carrier for exporting Australia’s
renewable energy.
• Liquid hydrogen
• Ammonia
The capacity to pay metrics were not determined for the two export cases and three gas network
based options, namely: SNG manufacture, blended gas network & H2 recovery, 100% H2 gas network,
since these are not ultimate end-users.

Advisian 41
3.1 Economic gap assessment key findings
The economic gap assessment of hydrogen end-use cases assessed the price of hydrogen that would
be competitive with the incumbent technology and likely supply price for “best industry practice”
applications. This was undertaken for twenty industry sectors; for each sector the “economic gap” is
determined by comparing lifecycle costs of incumbent technology relative to the equivalent hydrogen
based service.
A positive economic gap indicates that the sector is commercially favourable for the use of hydrogen
as an energy carrier, whilst a negative economic gap suggests a need for increased end user efficiency,
reduced transport and dispensing costs or lower hydrogen supply costs. Refer to Section 6.1.2 for
more detail.
The transition in economic competitiveness of the reviewed end-use sectors across the: near, mid and
long term is summarised in Figure 3-1 below.
This study indicates that of the 20 industry end-use applications reviewed, five appear to be
commercially viable or approaching commercially viability by 2030. In all sectors, low carbon hydrogen
is expected to become more competitive towards 2050, due to parallel advances in production and
distribution cost efficiency and end-use technology evolution. More detailed analysis of each sector is
contained in the following subsections.
Figure 3-1 – Transition in sector economic competitiveness over time
2.0
2.0
0.9
0.7
-1.5
-1.8
-2.0
-2.5
-2.9
-3.3
-3.5
-3.6
-4.1
-4.3
-4.7
-4.8
-5.0
-5.0
-5.3
-5.7
-31.6
-10 -8 -6 -4 -2 0 2 4 6 8 10
Remote power
Line haul vehicles
Material handling
Return to base vehicles (incl buses)
NG network (comm + resid)
Ammonia
Mining vehicles
Oil refining
Grid-balancing
Methanol
Heavy haul rail
Ferries
Steel mills
CHP - Residential
CHP - Industrial
Other med-high grade applications
Aviation - Regional
Alumina calcining
Aviation - International
Marine shipping
Light (passenger & comm) vehicles
Economic gap (2020) by industry ($/kg)
Very high (>9)
High (8 - 9)
Moderate (7 - 8)
Competitive (5-7)
Alternative likely (<5)
Dependence on H2 pathway for decarbonisation
Commercial for niche /best case projects
Non-commercial barriersstill to be addressed.
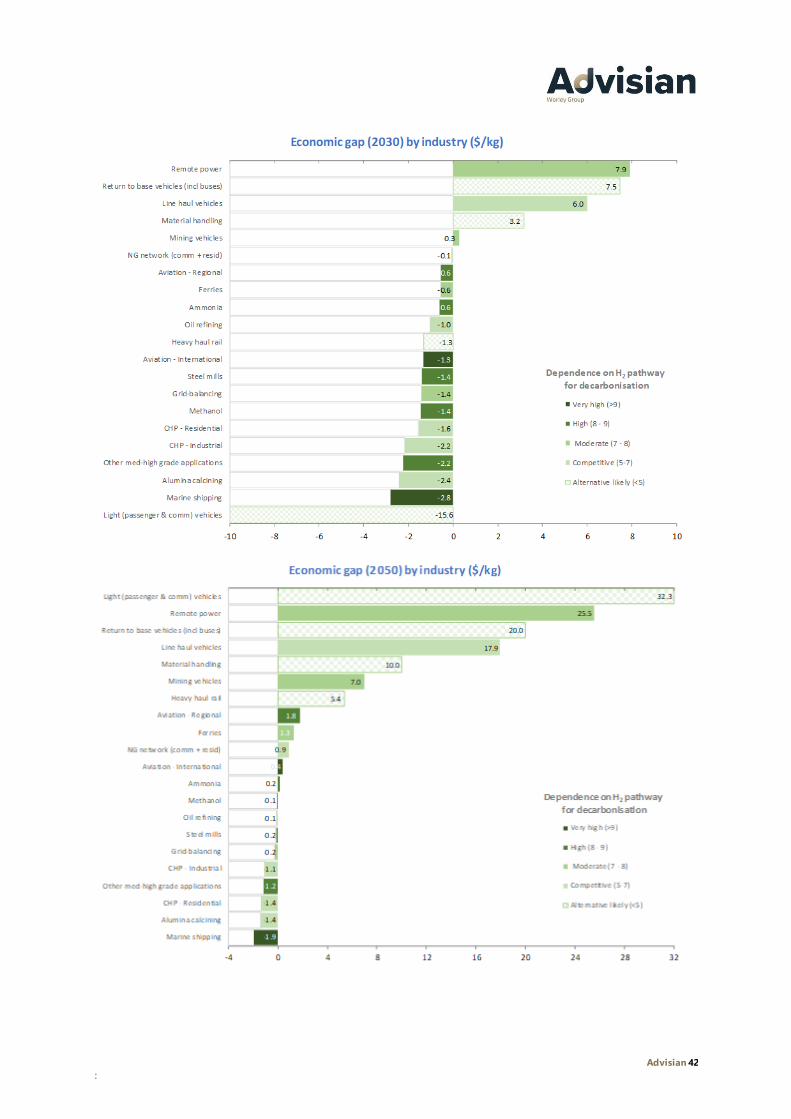
Advisian 42
:

Advisian 43
Sectors approaching competitiveness in the near term
Figure 3-1 shows those sectors which are approaching commercial attractiveness in the near term
include: line haul vehicles, remote power, material handling and return to base vehicles (including
buses) sectors.
The sectors which have a very high dependence on the green hydrogen pathway for decarbonisation
but currently unfavourable economics are: ammonia, methanol, aviation regional, aviation
international, marine shipping, steel and other med-high grade heat applications where electrification
is difficult. The sectors which have a moderate dependence on the green hydrogen pathway that are
also currently unfavourable economics are: mining vehicles, grid balancing and ferries. Except for
aviation, which receives significant international attention, all the other sectors have unique
“Australian” considerations that could be explored in order to reduce the economic gap in these
sectors.
The comparatively high cost of liquid fuels supporting the transportation sectors, yields a high relative
competitiveness. The distribution and dispensing costs for these sectors significantly erodes the gap
between end user affordability and farm gate cost of hydrogen. However, hydrogen use in the line
haul and return to source (including buses) trucking sectors are advantaged by much lower O&M
costs, no fuel excise exposure, fleet-based hydrogen dispensing and high mileage that favours fuel
efficiency. These differences explain why these sectors appear to be commercially favourable for
hydrogen now, whilst light passenger vehicle sector is the least commercially viable.
Sectors showing promise in the medium term
Towards 2030, the range of sectors where hydrogen is becoming commercially viable for adoption has
increased to include: mining vehicles.
The hydrogen production, storage and power generation cycle approaches parity with battery / diesel
hybrid systems in remote power service.
The mining sector could also benefit from coupling hydrogen based remote power with hydrogen
powered trucking.
Sectors which could become commercial long term
Towards 2050, the range of sectors where hydrogen may be commercially viable extends to include:
light vehicles, heavy haul rail, aviation (regional), ferries, natural gas network (commercial and
residential), aviation (international) and ammonia production. Of the sectors that have very high or
high dependence on the hydrogen pathway for decarbonisation, methanol production, steel, other
med-high grade applications and marine shipping remain economically not competitive while
ammonia production and aviation (regional and international) become economically competitive.
When green hydrogen achieves cost parity with natural gas a huge range of industrial sectors, will be
able to cost effectively switch to green hydrogen. The concept of thermal cost parity is further
described in Section 6.1.3. This thermal energy price parity is achieved when the delivered cost of
hydrogen is $1.10/kg, assuming a $9/GJ natural gas price. Steel manufacturing using hydrogen is
expected to achieve commercial attractiveness at a price point above this, around A$2 per kg.
Advisian 44
:
Sector dependence on hydrogen for decarbonisation
We rated how important hydrogen is likely to be for the decarbonisation of each sector using a scale
from 1 to 10. A rating of 1 translates to no real dependence and other, more competitive alternatives
being widely available. A rating of 10 means that hydrogen is essential for decarbonisation of the
sector. Our estimates are qualitative, and base on interpretation only.
From our assessment, the sectors with the highest dependence on hydrogen for decarbonisation are
aviation (international) and marine transport where alternatives such as carbon capture and battery
electric systems are likely to be difficult. Steel, ammonia, methanol, aviation (regional) and high grade
heat are also considered high dependence. The sectors with the lowest dependence are land transport
and rail applications, where battery electric and overhead electrification are likely to be effective
alternatives.
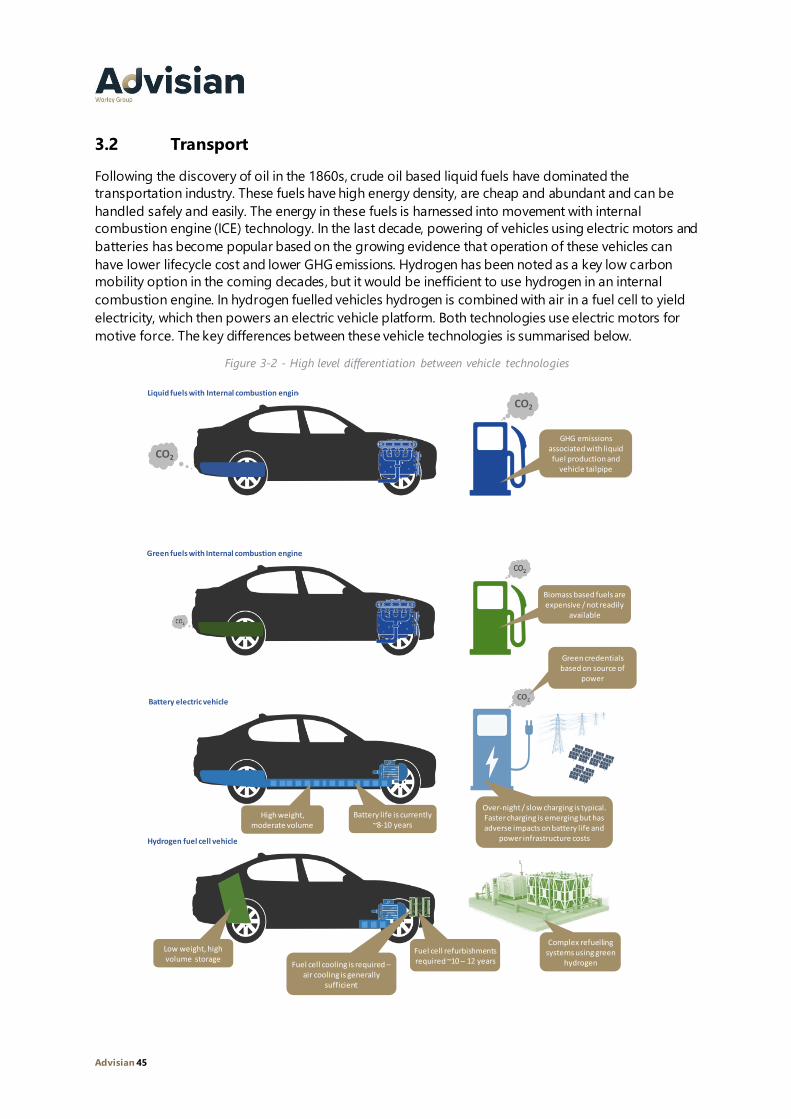
Advisian 45
3.2 Transport
Following the discovery of oil in the 1860s, crude oil based liquid fuels have dominated the
transportation industry. These fuels have high energy density, are cheap and abundant and can be
handled safely and easily. The energy in these fuels is harnessed into movement with internal
combustion engine (ICE) technology. In the last decade, powering of vehicles using electric motors and
batteries has become popular based on the growing evidence that operation of these vehicles can
have lower lifecycle cost and lower GHG emissions. Hydrogen has been noted as a key low carbon
mobility option in the coming decades, but it would be inefficient to use hydrogen in an internal
combustion engine. In hydrogen fuelled vehicles hydrogen is combined with air in a fuel cell to yield
electricity, which then powers an electric vehicle platform. Both technologies use electric motors for
motive force. The key differences between these vehicle technologies is summarised below.
Figure 3-2 - High level differentiation between vehicle technologies
CO2
Liquid fuels with Internal combustion engine
Green fuels with Internal combustion engine
Battery electric vehicle
Hydrogen fuel cell vehicle
CO2
Biomass based fuels are expensive / not readily
available
Fuel cell cooling is required –air cooling is generally
sufficient
Complex refuelling systems using green
hydrogen
Fuel cell refurbishments required ~10 – 12 years
Battery life is currently ~8-10 years
High weight, moderate volume
Low weight, high volume storage
Green credentials based on source of
power
Over-night / slow charging is typical. Faster charging is emerging but has adverse impacts on battery life and
power infrastructure costs
GHG emissionsassociated with liquid fuel production and
vehicle tailpipe

Advisian 46
:
Electrified vehicles are already competing with their ICE counterparts in some markets. The key reasons
for this are:
• Higher torque and acceleration;
• Lower fuel costs;
• Reduced emissions and heat within enclosed environments, and
• Easier automation.
The key negatives associated with battery electric systems relative to ICE systems are:
• Longer recharge times;
• Uncertainty regarding the life of batteries, and
• Higher initial cost for long range capacity.
3.2.1 Light vehicles
Battery Electric Vehicles (BEVs) currently have advantage over Fuel Cell Electric Vehicles (FCEVs), but
hydrogen will become progressively more competitive in the long-range portion of this market
segment when a higher penetration of BEVs could impact on electricity network augmentation and
create overnight charging congestion. Without a carbon price or low carbon vehicle mandate, hybrid
vehicles will likely have the lowest cost of ownership in the short term.
In order to provide insight into the likely appetite for hydrogen fuelled vehicles between now and
2050, a high level comparison of light passenger ownership was undertaken using the IEA Hydrogen
Futures framework, with tweaks to match Australian conditions. The analysis is based on the following
assumptions.
• The Australian vehicle fleet efficiency and cost market for vehicles imported to both countries is
comparable to that of the US market which is characterised by the IEA analysis ;
• Vehicle ownership costs will be assessed over an 8 year life – In line with extended warranties and
only 20% decline in BEV battery life;
• Driving behaviours will remain comparable to current i.e. expected driving range of 400 km and
13,400 km travelled per vehicle per year;
• Hydrogen supply prices are based on industrial scale production taking advantage of low
electricity prices and flexibility of demand. Delivered cost of hydrogen calculated is $15.04 per kg
short term and $3.72 per kg long term;
• Petrol prices are based on $1.40 (short term) / $2.32 (long term) per litre retail price and hydrogen
prices are based on forecasts from this report;
• BEVs will predominantly be charged with home charging systems using grid power. Network
upgrades for public chargers have been estimated at $1,000 per kW based on information from
Powercor - $330/kW for transformer upgrades and allowance of $770/kW for lines upgrades of
250m, between $600 and $1,400 for above ground and below ground respectively (PowerCor,
2015). Electricity prices are retail rates of $250/MWh;
• Excise revenue (on fossil fuels) will only be applied to ICE based vehicles, and will be progressively
ramped upward from $0.42/L to $0.63/L to drive uptake of low carbon technology;
• Hydrogen refuelling stations will only be installed when there is sufficient collective demand. It is
expected that a single station will serve at least 70 vehicles in the near-term based on 10%

Advisian 47
utilisation, and 1,188 cars in the longer term at 50% utilisation. Station asset life is expected to be
greater than 25 years;
• Capex of Hydrogen Refuelling stations are based on Hydrogen Refuelling Scenario Analysis
Model, Gaseous refuelling; 600 kg/day dispensing; 350 bar cascade; 20 bar H2 dispenser
(Argonne, n.d.);
• Carbon cost follows IEA expectation for “advanced economies” trending towards A$230/tCO2 by
2050;
• Operations and maintenance costs include: Insurance, registration, tyres replacement and
servicing. Battery replacement and fuel cell refurbishment costs are not included within the 8 year
assessment period but are factored into the salvage value;
• Salvage value calculated as follows:
− ICE vehicles and non-drivetrain portions of BEV and FCEVs halve in value every 3 years;
− Electric motors and hydrogen fuel cells halve in value every 6 years;
− Batteries halve in value every 3 years.
The resulting cost of ownership profile, see Figure 3-3, is consistent with the international literature.
Figure 3-3 - Light vehicle cost of ownership
Currently, a typical Australian car uses 10.8 L/100 km (353 MJ/100 km) of petrol with a total dispensed
fuel cost of $2,030 per year ($1.40/L). If this was replaced by an equivalent hydrogen fuel cell vehicle
using 0.8 kg/100 km (107 MJ/100 km), the dispensed fuel cost would be $1,608 per year ($15/kg). Even
if the hydrogen could be secured at $0/kg, the total cost of ownership of the hydrogen FCEV exceeds
that of an ICE vehicle. The result is the relative competitiveness is negative $16.54/kg which, based on
a fuel cost of $15 per kg, is a negative economic gap of $31.6/kg. The conclusion is that this sector is
currently not commercially viable for the adoption of hydrogen.

Advisian 48
:
The light vehicle sector is forecast to migrate from a negative economic gap to a positive economic
gap across the time horizon as the cost of delivered petrol increases and the cost of FCEV vehicles and
delivered hydrogen cost decreases. The hydrogen fuel cell electric vehicle (FCEV) can achieve a much
higher fuel efficiency that the incumbent internal combustion engine (ICE) technology.
Towards 2050, the cost of petrol to supply an internal combustion engine is forecast to rise to $2.32/L
(Graham & Smart (ACIL Tasman), 2011), and engine efficiency will improve to <3.2 MJ / 100 km. The
FCEV total cost of ownership is now approaching parity with ICE vehicles showing fuel costs are the
primary differences. The dispensed cost of hydrogen is forecast to be $3.72/kg. The net result is a
positive economic gap of $32.3/kg showing this sector is commercially viable relative to ICE
technology in 2050.
The sector snapshot for light vehicle sector, with descriptive commentary is provided below.
Figure 3-4 – Light (passenger & commercial) vehicle sector economic gap snapshot (TCO basis)
To potentially achieve competitiveness with ICE, ICE hybrids and BEVs in the future, light FCEVs will
need:
• Lowering of delivered hydrogen costs through reticulated hydrogen supplies or other delivery
technologies;
• Significant uptake of FCEVs, at least in concentrated areas, to justify the expense of hydrogen
refuelling stations;
• To drive uptake, a variety of model options to suit Australian consumer choices, with much lower
costs; and
• Proven operational cost benefits versus ICE and comparable with BEV.
The light vehicle sector is considered to have low dependence on hydrogen for decarbonisation, with a
rating of 2 out of 10. Other alternatives, such as battery electric, are likely to be more important.
Light (passenger & comm) vehicles
-31
.6
-15
.6 32
.304812162024283236404448525660
-20-16-12
-8-4048
1216202428323640
De
live
red
/D
isp
en
sed
Ga
p
Incu
mb
en
t
De
live
red
/D
isp
en
sed
Ga
p
Incu
mb
en
t
De
live
red
/D
isp
en
sed
Ga
p
Incu
mb
en
t
Near term Mid-term Long term
Hyd
roge
n t
ran
sfe
r p
rice
&
eco
no
mic
ga
p (
$/k
g)
Incumbent cost Distribution cost Farmgate cost
The total cost of ownership for ICE is much lower than FCEV (i.e. not
competitive) and hence has a negative
"capacity to pay".
Where not explicitly calculated, mid-term results are interpolated
from near & long term results.
Hydrogen is competitive relative to incumbent
technology.

Advisian 49
3.2.2 Materials handling
The materials handling sector is forecast to have a positive economic gap across the time horizon.
FCEV based material handling units compete directly with Battery Electric Vehicles (BEVs) as a low
noise and low pollution solution. The faster refuelling times of FCEVs are already leading to uptake of
FCEVs in this application.
Figure 3-5 – Material handling sector economic gap snapshots (TCO basis)
To achieve this competitive position for material handling vehicles, the following conditions will need
to be met:
• Low cost delivery of small quantities of hydrogen, likely less than 100 kg per day;
• Continued development of fuel cell technology in this application including models to suit a
variety of applications;
• Achievement of BEV and ICE levels of reliability and operational costs; and
• Demonstrated superiority versus BEV as both technologies continue to develop.
The materials handling sector is considered to have low dependence on hydrogen for decarbonisation,
with a rating of 3 out of 10. Hydrogen may become the dominant technology, however other
alternatives, such as battery electric, are likely to be able to substitute if this does not occur.
Material handling
0.9
3.2
10
.0
0
4
8
12
16
20
24
-8
-4
0
4
8
12
16
De
live
red
/D
isp
ense
d
Gap
Incu
mb
en
t
Del
ive
red
/D
isp
ense
d
Gap
Incu
mb
en
t
De
live
red
/D
isp
ense
d
Gap
Incu
mb
en
t
Near term Mid-term Long term
Hyd
roge
n t
ran
sfe
r p
rice
&
eco
no
mic
ga
p (
$/k
g)
Incumbent cost Distribution cost Farmgate cost

Advisian 50
:
3.2.3 Heavy-duty vehicles – Line haul
The heavy vehicle sector in Australia is subject to subtly
different influences compared to other countries around
the world. The key differences that might influence our
selection and rate of uptake of low emission vehicles are:
• Relatively long vehicle life;
• Less rail competition;
• Exposure to hot, low humidity environments for
sustained periods;
• Minimal exposure to freezing / salt laden conditions;
and
• Long stringy power grid with limited capacity to
accommodate heavy electrical demand variation.
In order to provide insight into the likely appetite for hydrogen fuelled line haul vehicles between now
and 2050, a high level comparison of the total cost of ownership was undertaken using the IEA
Hydrogen Futures framework, with adjustments to match Australian conditions. The analysis is based
on the following assumptions:
• The Australian cost market is comparable to that of the US market which is characterised by the
IEA analysis;
• Fleet efficiency is taken as 36L / 100 km as is appropriate for this application but is considerably
lower than the Australian average consumption (55L / 100 km) for articulated trucks;
• Vehicle ownership costs were assessed over a 12 year life – requiring replacement of ICE and FCEV
systems. BEVs require a battery replacement at 8 years, which has been included in the costs as a
50% increase in battery cost;
• Fuel consumption and operational costs for BEVs and FCEVs are taken from projected
manufacturer data, Tesla and Nikola, for vehicles that are not yet released to the market. These
metrics are comparable with IEA metrics;
• The subset of articulated vehicles that are involved in line haul are likely to be travelling at least
200,000 km per year;
• The delivered diesel price of $1.33 per litre, increasing to $2.21 per litre in the long run. Electricity
of $130 per MWh, based on industrial scale site, and hydrogen delivered prices of $6.25 per kg
current and $2.78 per kg long term, based on the green hydrogen prices forecast by this report;
• Carbon cost follows IEA expectation for “advanced economies” trending towards A$230/tCO2 by
2050;
• BEVs would be charged using dedicated or public stations using grid power. The cost of network
upgrades to support these charging stations (1650 kW) is expected to be around $100,000 per
vehicle in the short term and falling to half that figure in the future as utilisation is improved.
Network upgrade costs have been estimated at $600 per kW based on lessons Learnt from the
National Ultrafast EV charging infrastructure Network (EVIE Networks, 2019);
• Heavy ICE vehicles have a 16.5% exemption from standard excise costs;
• Salvage value has been calculated as 20% after 12 years for ICE and for the glider without
powertrain for FCEV and BEV. Electric motors have 50% salvage after 12 years;

Advisian 51
• Hydrogen refuelling stations will only be installed when there is enough collective demand. It is
expected that a single station will serve at least 20 vehicles in the near-term, and 40 in the longer
term, equating to around 20% and 40% utilisation rates. Station asset life is expected to be
greater than 25 years;
• Capex of Hydrogen Refuelling stations are based on Hydrogen Refuelling Scenario Analysis
Model, Gaseous refuelling; 600 kg/day dispensing; 350 bar cascade; 20 bar dispenser (Argonne,
n.d.);
• Storage sizes have been updated relative to IEA refence statements in this report; and
• Operations and maintenance costs include: Insurance, registration, tyres replacement and
servicing.
Figure 3-6 – Heavy-duty (Line haul) cost of ownership A$/km
In the near-term, hydrogen can be competitive with ICE vehicles on a total cost of ownership basis in
the line-haul heavy vehicle sector. In this sector, hydrogen has lower fuel and O&M costs which offset
the higher initial cost for the truck, fuel cells and storage systems. Nikola, Hyzon and others have
announced development of hydrogen trucks. Hydrogen truck applications could be challenged by
BEVs. The costs will likely favour FCEVs if long range operations with short recharging times or high
operational flexibility are required.
The heavy-duty (line haul) sector is forecast to have a positive economic gap across the time horizon.
This positive economic gap is dependent on enough demand being developed to allow for
optimisation of the supply chain.
0
0.2
0.4
0.6
0.8
1
1.2
1.4
1.6
1.8
2
FCEV-1000 BEV-1000 ICE FCEV-1000 BEV-1000 ICE
Today (200000 km/y) Long Term (200000 km/y)
Cos
t of
owne
rshi
p (A
UD
/km
)
Line haul vehicle ownership costs
Base vehicle (less salvage) Battery, fuel cell & storage O&M Underlying fuel cost
Distribution costs Excise costs Potential network upgrades Carbon cost

Advisian 52
:
Figure 3-7 – Heavy-duty (Line haul) sector economic gap snapshots (TCO basis)
For line haul trucks to be competitive versus ICE and BEV there are a number of key aspects that will
have to be realised:
• Supply from manufacturers of a variety of large trucks to suit Australia’s freight needs and in
quantities that can create Fleet sizes that justify the hydrogen distribution and refuelling
infrastructure;
• Development of FCEV trucks need to meet industry standards for reliability and range;
• Proof of fuel consumption and operational cost benefits;
• Low cost hydrogen distribution; and
• Appropriate vehicle applications that provide operational benefits versus BEV alternatives.
The line haul vehicle sector is considered to have moderate dependence on hydrogen for
decarbonisation, with a rating of 6 out of 10. Battery electric alternatives are likely to be lower cost but
may not offer the flexibility of operating with hydrogen.
Line haul vehicles
2.0
6.0
17.9
0
4
8
12
16
20
24
28
32
-8
-4
0
4
8
12
16
20
24
Del
iver
ed /
Dis
pen
sed
Gap
Incu
mb
ent
Del
iver
ed /
Dis
pen
sed
Gap
Incu
mb
ent
Del
iver
ed /
Dis
pen
sed
Gap
Incu
mb
ent
Near term Mid-term Long term
Hyd
roge
n t
ran
sfe
r p
rice
&
eco
nom
ic g
ap ($
/kg)
Incumbent cost Distribution cost Farmgate cost

Advisian 53
3.2.4 Heavy-duty vehicles – Return to base
Return to base trucks were assumed to be the rigid
truck class identified in ABS data (Australian Bureau of
Statistics, 2019).
As with articulated trucks, the hydrogen refuelling
infrastructure costs are a significant contributor to the
cost of ownership. The low utilisation of the refuelling
infrastructure further exacerbates the higher cost. Our
analysis has assumed that early movers to hydrogen
will need to provide dedicated refuelling systems as
public hydrogen refuelling networks will not be
developed enough to support a commercial business.
Figure 3-8 outlines the rigid truck cost of ownership ($/km). The assumptions are similar to those for
the line-haul case except as described below:
• All vehicles would travel 50,000 km per year;
• BEVs would be charged overnight using a dedicated charger for each vehicle, 50 kW now and 100
kW long term;
• The cost of network upgrades to support these charging stations is expected to be around
$30,000 per vehicle;
• Hydrogen delivered prices of $9.30/kg current and $4.07/kg long term are based on the green
hydrogen prices forecast by this report;
• 20 trucks per hydrogen refuelling station short term, refuelling at the end of each day over an
hour. 40 trucks per station long term, assuming greater utilisation of public refuelling.
Figure 3-8 Rigid truck (Return to base) cost of ownership ($/km)
-
0.2
0.4
0.6
0.8
1.0
1.2
1.4
1.6
1.8
FCEV-500 BEV-500 ICE FCEV-500 BEV-500 ICE
Today Long term
Co
st o
f o
wn
ers
hip
(A
UD
/km
)
Rigid truck cost of ownership
Base vehicle (less salvage) Battery, fuel cell & storage O&M
Underlying fuel cost Distribution costs Excise costs
Potential network upgrades Carbon cost
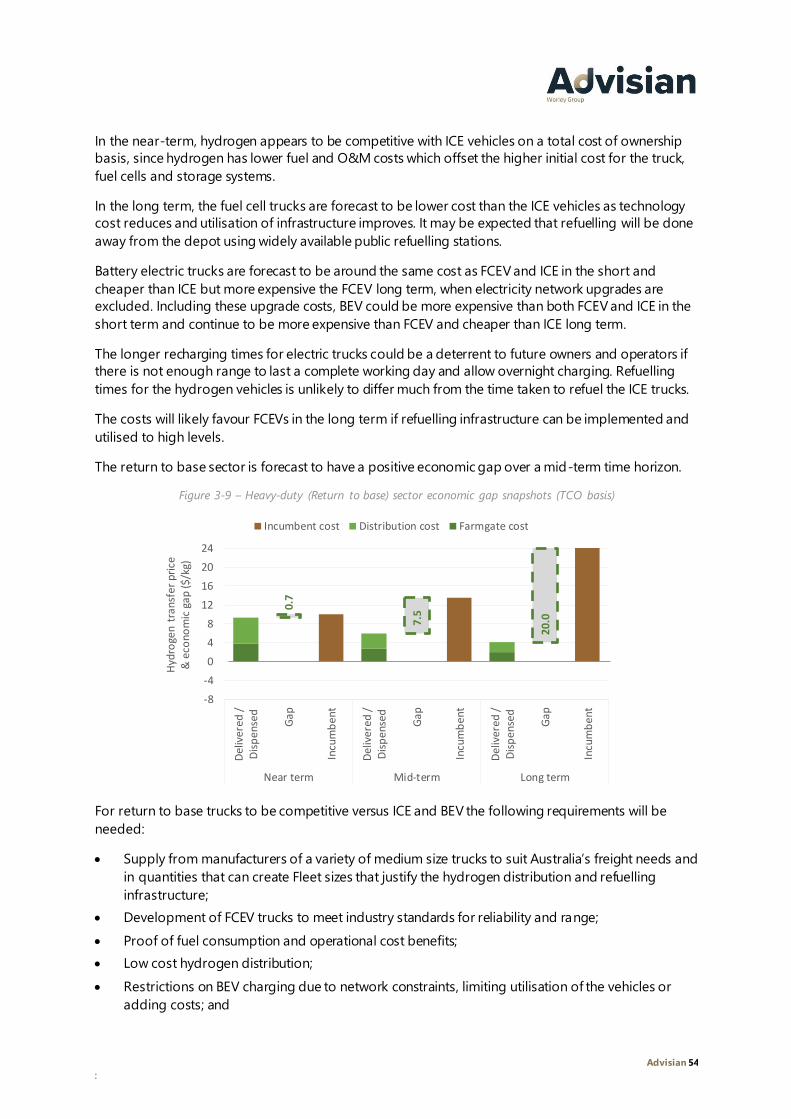
Advisian 54
:
In the near-term, hydrogen appears to be competitive with ICE vehicles on a total cost of ownership
basis, since hydrogen has lower fuel and O&M costs which offset the higher initial cost for the truck,
fuel cells and storage systems.
In the long term, the fuel cell trucks are forecast to be lower cost than the ICE vehicles as technology
cost reduces and utilisation of infrastructure improves. It may be expected that refuelling will be done
away from the depot using widely available public refuelling stations.
Battery electric trucks are forecast to be around the same cost as FCEV and ICE in the short and
cheaper than ICE but more expensive the FCEV long term, when electricity network upgrades are
excluded. Including these upgrade costs, BEV could be more expensive than both FCEV and ICE in the
short term and continue to be more expensive than FCEV and cheaper than ICE long term.
The longer recharging times for electric trucks could be a deterrent to future owners and operators if
there is not enough range to last a complete working day and allow overnight charging. Refuelling
times for the hydrogen vehicles is unlikely to differ much from the time taken to refuel the ICE trucks.
The costs will likely favour FCEVs in the long term if refuelling infrastructure can be implemented and
utilised to high levels.
The return to base sector is forecast to have a positive economic gap over a mid-term time horizon.
Figure 3-9 – Heavy-duty (Return to base) sector economic gap snapshots (TCO basis)
For return to base trucks to be competitive versus ICE and BEV the following requirements will be
needed:
• Supply from manufacturers of a variety of medium size trucks to suit Australia’s freight needs and
in quantities that can create Fleet sizes that justify the hydrogen distribution and refuelling
infrastructure;
• Development of FCEV trucks to meet industry standards for reliability and range;
• Proof of fuel consumption and operational cost benefits;
• Low cost hydrogen distribution;
• Restrictions on BEV charging due to network constraints, limiting utilisation of the vehicles or
adding costs; and
Return to base vehicles (incl buses)
0.7
7.5
20.0
0
4
8
12
16
20
24
28
32
-8
-4
0
4
8
12
16
20
24
Del
iver
ed /
Dis
pen
sed
Gap
Incu
mb
ent
Del
iver
ed /
Dis
pen
sed
Gap
Incu
mb
ent
Del
iver
ed /
Dis
pen
sed
Gap
Incu
mb
ent
Near term Mid-term Long term
Hyd
roge
n t
ran
sfer
pri
ce
& e
cono
mic
gap
($/k
g)
Incumbent cost Distribution cost Farmgate cost

Advisian 55
• Appropriate vehicle applications that provide operational benefits versus BEV alternatives.
The return to base vehicle sector is considered to have low dependence on hydrogen for
decarbonisation, with a rating of 4 out of 10. Other alternatives, such as battery electric, are likely to
be more important and could have a cost advantage for shorter routes.
3.2.5 Heavy-duty vehicles – Mining
Mining vehicles, in particular, mining haul trucks, provide a potentially attractive end-use for hydrogen.
Mining companies with operations in Australia that have made commitments to lower emissions
including zero emissions goals include: FMG (2030) BHP (mid-century), Rio Tinto (2050) and Anglo
The value of flexibility in mine planning
The trade-off between flexibility and cost efficiency of overhead cable systems.
Many sectors of the mining industry place a high value on the mine planning flexibility provided by the current diesel
haul truck fleet and mobile excavators. This flexibility can allow changes to the grade of material being extracted or
the location of overburden disposal at short notice, responding rapidly to market and operational requirements.
Alternatives to diesel vehicles can introduce constraints on the ability to quickly adapt; conveyor dominated systems
require years of forward planning to be operated optimally, and similarly, overhead trolley assist systems cannot be
moved to new mining areas at short notice and will incur significant cost. Although trolley assist with battery electric
trucks appears to offer the lowest operational cost per hour of operation, there may be a significa nt difference in the
value that can be extracted from the mine if mining methods are not flexible enough to realise these opportunities.
Hydrogen haul trucks offer the potential for fast refueling and flexible operations, comparable with current diesel
trucks, with low emissions and noise. In the future it is likely that hydrogen will be operationally cost competitive with
both diesel and BEV alternatives.

Advisian 56
:
American (2040) (S&P Global Platts, 2020) and diesel consumption is a major source of emissions in
the mining industry.
Conversely, the introduction of highly flammable hydrogen, particularly into underground mining
fleets, is likely to face some safety and regulatory challenges.
An emerging challenge to the incumbent technology is battery electric vehicles, most likely
incorporating a trolley assist section to power the haul and recharge the batteries to reduce battery
size. This technology is still under development for full scale implementation.
An analysis was conducted comparing a hydrogen haul truck to the ICE equivalent and a battery
electric truck with trolley assist. The key assumptions are:
• Utilisation is 22 hours per day;
• Diesel price rises from $0.98/L to $1.68/L delivered to the truck (Graham & Smart (ACIL Tasman),
2011). No excise is applied;
• Electricity price for BEV/trolley assist $120 per MWh;
• Lifespan is 7 years for all truck types;
• Salvage value at the end of 7 years slightly favours BEV and ICE vs FCEV;
• The trolley assist system cost of $10 million per km / 10 km total required;
• BEV only requires one charger per 25 trucks as most charging is done on the trolley section;
• FCEV 14 trucks per refueller, two trucks per hour refuelled;
• If electrical network upgrades are needed for the BEV case, it will add $80 million for 100 km
including transmission for a notional remote site (Advisian estimates);
• The salvage value of the trolley assist system and network upgrades is 80% at the end of 7 years;
and
• Green hydrogen costs and emissions are used short term and long term.
The results of the analysis are shown in Figure 3-10.
Figure 3-10 - Mining truck cost of ownership ($/h)
-
50
100
150
200
250
300
350
400
450
FCEV BEV +TA ICE FCEV BEV + TA ICE
Today (8030 hrs/y) Long Term (8030 hrs/y)
Co
st o
f ow
ner
ship
(AU
D/h
r)
Mine truck cost of ownership
Base vehicle (incl. motor) less salvage Battery, fuel cell & storage O&M
Underlying fuel cost Distribution costs Trolley assist CAPEX
Carbon cost

Advisian 57
Hydrogen fuel cell trucks may not be competitive with respect to ICE vehicles in the short term,
potentially offering a lower emissions option but at higher cost. Battery electric trucks are expected to
be the most cost competitive in the short term but could provide less flexible mining operations.
In the long term, hydrogen fuel cell trucks are expected to be lower cost than ICE, despite higher
capital costs, through lower fuel and operation and maintenance (O&M) costs. BEV trucks with trolley
assist are expected to be as low cost as hydrogen, although this could be challenged if significant
network costs are incurred for the BEV option.
The economic gap associated with the heavy-duty (mining) vehicle sector is forecast to improve
progressively across the time horizon.
Figure 3-11 – Heavy-duty (Mining) sector economic gap snapshots (TCO basis)
For mining trucks to be competitive versus ICE and BEV a number of key requirements will have to be
met:
• Supply from manufacturers of mining trucks to suit the Australian mining industry in quantities
that can create fleet sizes that justify the hydrogen distribution and refuelling infrastructure;
• Development of FCEV trucks to provide miners with comparable utilisation and reliability to ICE;
• Proof of fuel consumption and operational cost benefits;
• Low cost hydrogen distribution or local production; and
• Trolley assist systems for BEVs restrict the flexibility of mining operations and require significant
network augmentations.
The mining vehicle sector is considered to have a moderate to high dependence on hydrogen for
decarbonisation, with a rating of 7 out of 10. Battery electric trucks with trolley assist could be lower cost
but may restrict mine operations significantly.
Mining vehicles
-2.0 0.
3
7.00
4
8
12
16
20
24
-8
-4
0
4
8
12
16
Del
iver
ed /
Dis
pen
sed
Gap
Incu
mb
en
t
Del
iver
ed /
Dis
pen
sed
Gap
Incu
mb
ent
Del
ive
red
/D
isp
ense
d
Gap
Incu
mb
ent
Near term Mid-term Long term
Hyd
roge
n tr
ansf
er p
rice
&
eco
nom
ic g
ap ($
/kg)
Incumbent cost Distribution cost Farmgate cost

Advisian 58
:
3.2.6 Heavy haul rail
Heavy haul rail is a significant user of diesel fuel in
Australia, in applications that include dedicated iron ore
and coal haulage routes and general freight.
Hydrogen fuel cell locomotives are under development,
building on the demonstration projects in passenger rail
systems such as the Alstom iLint units, in service in
Germany since 2018 (Alstom, 2018).
The Argonne Laboratory has undertaken a comprehensive
study of fuel cell hydrogen versus diesel locomotives and some key metrics from this study have been
used in our analysis (Argonne National Laboratory, 2019). Packaging of fuel cells and compressed
hydrogen on a locomotive chassis is a challenge and this analysis has assumed inclusion of a fuel
tender behind the locomotive to carry the hydrogen tanks.
A key aspect of the application of fuel cells to heavy haul rail is the decreasing efficiency as the level of
power demand is increased. This contrasts with a diesel engine, where efficiency increases through
most of the power output range. The power curves for both types of power unit are shown in Figure
3-12 (Argonne National Laboratory, 2019). Heavy haul rail locomotives operate near full power output
for most of the haul route. At this condition, there is little efficiency differential between fuel cells and
diesel engine locomotives.
Figure 3-12 - Efficiency comparison
In our analysis we compare hydrogen locomotives, current ICE locomotives, battery electric
locomotives that are recharged at the destination and electric locomotives using overhead wires.
The battery electric locomotive will require very large batteries, some 25 MWh, to complete the 1,000
km route and is also likely to need a tender to contain the batteries. GE has announced the
development of a 2.4 MWh battery locomotive and forecasts a 6 MWh version (GE, 2018). Overhead
electrification will need supporting infrastructure for power supplies along the length of the route,

Advisian 59
including connecting lines to the electricity grid and transformer systems. Overhead line electrification
(OHLE) could also be used to address large battery sizes and long recharging time through
intermediate recharging sections of the track.
The key assumptions used are:
• 15 year service life, 150,000 km per year. BEV requires battery replacement after 8 years;
• No excise applied to diesel fuel – delivered price $0.98 per litre, increasing to $1.68 per litre in the
long term;
• BEV utilisation reduced by 20% to allow for recharging time;
• FCEV only 10% more efficient than ICE due to high average power requirements;
• 2 locomotives per train, 16 trains over the 1,000 km route;
• Overhead line infrastructure capital $2 million per km, O&M 0.5% of capital per year, salvage
value 80% at end of 15 years;
• Carbon cost follows IEA expectation for “advanced economies” trending towards A$230/tCO2 by
2050;
• 3 locomotives per BEV charger and 2 locomotives per hydrogen refueller short term. Greater
utilisation long term to 6 and 10 for BEV and FCEV respectively; and
• No network upgrades are required to charge BEV locomotives due to terminating at industrial
facilities.
Figure 3-13 - Heavy haul rail cost comparison ($/km)
The results of the analysis are very sensitive to the assumptions regarding the number of locomotives
on the route and the salvage value for the overhead electrification.
In the near-term, ICE locomotives are the lowest cost per kilometre, followed by overhead
electrification. Battery electric are more expensive due to the huge cost for batteries to achieve the
nominated 1,000 km range. The battery size and cost could potentially be reduced if charging is
-
2
4
6
8
10
12
14
16
18
FC Loco BEV Loco OHLE ICE FC Loco BEV Loco OHLE ICE
Today (150000 km/y) Long Term (150000 km/y)
Co
st o
f ow
ner
ship
(AU
D/k
m)
Heavy Haul Rail cost of ownership
Base vehicle (incl. motor) Battery, fuel cell & storage O&M Underlying fuel cost Distribution costs Carbon cost

Advisian 60
:
available at intermediate points of the route. Hydrogen fuel cell is the most expensive, driven by
underlying fuel costs for a system without a significant efficiency advantage over ICE.
In the long term, hydrogen fuel cell locomotives look to be the cheapest and set to achieve a positive
economic gap long term. Battery electric locomotives look to be marginally lower cost than overhead
electrified. In this projection, it is the falling capital cost of the fuel cells and storage, and lower long-
term hydrogen cost that makes hydrogen fuel cell locomotives the lowest cost.
Figure 3-14 – Heavy haul (Rail) sector economic gap snapshots (TCO basis)
For hydrogen heavy haul rail to be competitive, versus OHLE, ICE and BEV there are some requirements
that need to be met:
• Hydrogen locomotives developed at appropriate size to suit Australia’s heavy haul requirements;
• Manufacturers can supply enough locomotives to allow operators to implement a fleet, increasing
utilisation of fuel supply and refuelling assets;
• Development of FCEV locos to provide operators with comparable utilisation and reliability to ICE;
• Proof of fuel consumption and operational cost benefits;
• Low cost hydrogen distribution or local production;
• Utilisation levels that don’t justify OHLE infrastructure; and
• Low technical feasibility of BEV locos.
The heavy rail sector is considered to have low dependence on hydrogen for decarbonisation, with a
rating of 3 out of 10. Other alternatives, such as overhead electrification and battery electric, are likely
to be lower cost in the short to medium term where high continuous power rating impacts fuel cell
efficiency.
Heavy haul rail-3
.5 -1.3
5.4
0
4
8
12
16
20
24
-8
-4
0
4
8
12
16
Del
iver
ed /
Dis
pen
sed
Gap
Incu
mb
en
t
Del
iver
ed /
Dis
pen
sed
Gap
Incu
mb
ent
Del
ive
red
/D
isp
ense
d
Gap
Incu
mb
ent
Near term Mid-term Long term
Hyd
roge
n tr
ansf
er p
rice
&
eco
nom
ic g
ap ($
/kg)
Incumbent cost Distribution cost Farmgate cost

Advisian 61
3.2.7 Ferries
Ferries are a marine shipping case where the
requirements for fuel storage are significantly
less than for coastal or international shipping.
Ferry journeys are often only a few hours in
duration, or in the case of commuter ferries,
daily operation, providing opportunities for at
least daily refuelling. The consequence of
lower fuel storage is the likely preference for
lower cost and higher efficiency fuels as
opposed to those that offer the highest
energy density. Gaseous and liquid hydrogen
have much lower volumetric energy density than Marine Gasoil (MGO) but are significantly more
energy dense than batteries.
Use of hydrogen derived fuels, such as ammonia and methanol, will require reciprocating engine
technology until such time as direct ammonia and methanol fuel cells are commercialised – for more
comment on this topic, please refer to marine shipping, Section 3.2.8. On the negative side, the fuel
supply and fuel cell-based powertrains are expected to be considerably more expensive than the
incumbent ICE technology. Our economic gap assessment was based on utilisation of gaseous
hydrogen utilisation.
In the short term, hydrogen is unable to compete with ICE, but over time, the gap narrows, and in the
long term it is expected to be competitive. Increasingly stringent emissions regulations are likely to
apply to marine shipping, to drive operators towards lower pollution, lower GHG emissions fuels.
Figure 3-15 – Ferries sector economic gap snapshots (Fuel cost basis)
The commercial application of hydrogen and hydrogen-based fuels to ferries will be dependent on:
• Proof of application of hydrogen fuel cells, ammonia and methanol engines and, potentially,
ammonia and methanol fuel cells in marine applications;
• Development of suitable fuel bunkering at the applicable ports;
Ferries
-3.6 -0.6 1.3
0
4
8
12
16
20
24
-8
-4
0
4
8
12
16
Del
iver
ed /
Dis
pen
sed
Gap
Incu
mb
ent
Del
iver
ed /
Dis
pen
sed
Gap
Incu
mb
ent
Del
iver
ed /
Dis
pe
nse
d
Gap
Incu
mb
ent
Near term Mid-term Long term
Hyd
roge
n t
rans
fer p
rice
&
eco
no
mic
gap
($/k
g)
Incumbent cost Distribution cost Farmgate cost

Advisian 62
:
• Fuel storage solutions that do not excessively impact freight and passenger carrying capability;
and
• Continuation of current pollution and GHG emissions reduction regulations in the marine
shipping sector.
The ferries sector is considered to have moderate to high dependence on hydrogen for
decarbonisation, with a rating of 7 out of 10. Other alternatives, such as battery electric and biofuels,
are likely to be important but not useful for long range and large-scale uptake respectively.
3.2.8 Marine shipping
The marine shipping industry consume 300 million
tonnes per year of oil fuel - around 10% of global
transportation fuel demand (Agarwal, 2019) and is a
significant contributor to global GHG emissions. Heavy
fuel oil (HFO) is the most widely used fuel today (Allied
Market Research) followed by Marine Gasoil (MGO),
while natural gas is only used by around 2% of the
global fleet. In the near-term it is expected that MGO
and very-low sulphur fuel oil (VLSO) will be the
predominant marine fuels (Repsol, 2019) provided that
they are able to comply with IMO sulphur emissions
restrictions.
The use of alternative fuels such as green methanol and green ammonia offer some of the most cost-
effective mechanisms for complying with GHG emissions reduction regulations.
The forecast cost trend of marine bunker fuels relative to green fuels under the IEA stated policies
scenario is provided in Figure 3-16 below.
Figure 3-16 – Forecast of conventional and green marine bunker prices
0
10
20
30
40
50
60
70
2020 2022 2024 2026 2028 2030 2032 2034 2036 2038 2040 2042 2044 2046 2048 2050
Co
mo
dit
y p
rice
(A$
/GJ)
Forecast of conventional and green marine bunker prices
MGO 0.1% VLSO 180 Ammonia Green Ammonia Methanol Green MeOH

Advisian 63
Green methanol
When used as a marine engine fuel, conventional methanol has 90-95% lower SOx, 30-50% lower NOx,
5% lower CO2 and 90% lower PM than a Tier II compliant HFO engine (Man Energy Solutions.). When
running with green methanol the SOx and PM emissions would be negligible, and CO2 emissions
would have been offset by the CO2 capture required during production.
The cost of green methanol is forecast to decline rapidly and achieve cost parity with conventional
methanol before 2040 – see Figure 3-16. Beyond 2040 there is potential for green methanol to be cost
competitive with the incumbent bunker fuels. Even if methanol were to be cost competitive with
conventional bunker fuels, the fuel density (being nearly half that of HFO) would represent a
conversion hurdle. In the interim, it is expected that the predominant use of methanol will be as a low
carbon blend component.
Green ammonia
Ammonia has the key qualities of a low carbon economy fuel – higher energy density than hydrogen
and zero carbon and sulphur free emissions when combusted.
There are no commercial ships running on ammonia. However, it is expected that bunkering limitations
will be easily overcome. The ammonia storage and transport infrastructure is well developed globally
with significant international trade. Ammonia’s shipping routes are well established and there is a
comprehensive network of ports globally able to handle ammonia shipments at a large scale.
The forecast prices of potential marine bunker fuels – see Figure 3-16, suggests that the cost of
conventional ammonia as a bunker fuel is significantly more expensive than the incumbent HFO and
MGO whilst the crude oil price remains below US$100 per barrel. An approach to price parity would be
achieved by 2040 under the IEA sustainable development scenario, in which crude oil prices rise to
US$130 per barrel. Even if ammonia were to be cost competitive with conventional bunker fuels, the
fuel density (being ~35% that of HFO) and high costs of ammonia storage would represent a
conversion hurdle for long range shipping options.
The forecast gap profile for marine shipping is similar to ferries with uptake of hydrogen and hydrogen
fuels will require significant development. In the short term, per Figure 3-17 the higher costs of fuel
outweigh the increase in efficiency
from potential fuel cell powertrains.
However, over time, hydrogen and
hydrogen derived fuels are expected
to become competitive versus MGO
and other low sulphur fuels designed
to meet pollution requirements but
not address GHG emissions. The
economic gap assessment considered
switching from MGO to green
ammonia using combustion engines.
The marine sector is considered to
have high dependence on hydrogen
for decarbonisation, with a rating of 9
out of 10. Other alternatives, such as
battery electric and biofuels are
unlikely to be able to provide the
required range and scale respectively.
Figure 3-17 – Marine sector economic gap snapshots (Fuel cost basis)
Marine shipping
-5.7
-2.8 -1.9
0
4
8
12
16
20
24
-8
-4
0
4
8
12
16
Del
iver
ed /
Dis
pen
sed
Gap
Incu
mb
ent
Del
iver
ed /
Dis
pen
sed
Gap
Incu
mb
ent
Del
iver
ed /
Dis
pen
sed
Gap
Incu
mb
ent
Near term Mid-term Long term
Hyd
roge
n t
ran
sfe
r p
rice
&
eco
nom
ic g
ap ($
/kg)
Incumbent cost Distribution cost Farmgate cost

Advisian 64
:
3.2.9 Aviation
The Aviation sector has experienced huge growth in passenger demand and (prior to COVID-19) that
was not expected to stabilise until the year 2075 (International Civil Aviation Organization, Civil
Aviation Statistics of the World and ICAO staff, 2020). Despite some fuel efficiency improvements, this
sector has experienced some of the highest growth in fuel demand and struggles to reduce its carbon
intensity. There is significant pressure on the airline sector to decarbonise in order to retain social
license to operate, and the industry is actively seeking commercially viable carbon intensity reduction
solutions.
Our assessment of the potential to use liquid hydrogen and synthetic aviation fuel is based on
adaption of CleanSky2 analysis (CleanSky2, 2020). The study concludes that the high mass but low
volumetric energy density of liquid hydrogen means that it is only viable for regional aviation – using
electrically driven turbo props. Longer haul flights are likely to still use jet engines fuelled by
sustainable aviation fuels.
An illustration of the changes in cost and greenhouse gas impact of hydrogen based regional and
international aircraft is provided below.
Figure 3-18 – Forecast cost and GHG impact of hydrogen based aviation
Our analysis modified the underlying hydrogen price assumptions associated with the CleanSky2
study, to provide an Australianised interpretation over time. Our fuel price trend (see Figure 3-19)
indicates LH2 pricing becoming competitive with refinery derived Jet-A near 2040. Although fuel price
is the biggest contributor to the cost of aviation, the impacts of changed plane design and change-out
/ modification costs must also be considered.
ServiceRegional
20 - 80 PAX, 1000 km range
Medium range
166 - 250 PAX, 7000 km
Share of global fleet (%) 13% 18%
Share of GHG emissions (%) 0.0 0.4
Energy demand index (%) 92% 122%
Jet fuel load (tons) 1.8 32.8
Hydrogen fuel load (tons) 0.6 14.3
Jet fuel demand (MJ/y) 9,603,000 137,643,000
Hydrogen demand (MJ/y) 8,834,760 167,924,460
Climate impact index (%) 10 -20% 40 -50%
Additional cost - CASK (%) 5 - 15% 30 - 40%
Entry into service year 2030 -2035 2040
Minimum take-off weight index 110% 112%

Advisian 65
The cost of Jet-A derived from low carbon hydrogen and carbon neutral carbon dioxide is not forecast
to become competitive with refinery derived Jet-A. Indeed, sustainable aviation fuels derived from
biofuels and municipal waste are likely to be more competitive than hydrogen based synthetic Jet-A.
Figure 3-19 – Forecast of conventional and green aviation fuel prices
The above fuel price forecasts suggest that aviation industry will remain highly dependent upon the
underlying cost of crude oil and refinery margins, unless pricing structures change. If the airline
industry self-regulates on GHG emissions intensity, then higher cost fuels may be viable means of
decreasing GHG emissions.
The economic gap assessment of the regional aviation sector, considers displacing Jet-A fuel use in jet
engines with liquid hydrogen via fuel cells and turbo props. This analysis indicates that the sector
transitions to being competitive with conventional Jet-A prior to 2050.
Figure 3-20 – Regional aviation sector economic gap snapshots (TCO basis)
0
20
40
60
80
100
120
2020 2025 2030 2035 2040 2050
Jet-
A p
rod
uci
on
co
st (A
$/G
J)
Year
Forecast of Jet-A pricing
Refinery based Jet-A price (A$/GJ) Green Jet-A cost (A$/GJ) Liquid hydrogen price ($/GJ)
Aviation - Regional
-5.0 -0
.6
1.8
0
4
8
12
16
20
24
-8
-4
0
4
8
12
16
Del
iver
ed /
Dis
pens
ed Gap
Incu
mb
ent
Del
iver
ed /
Dis
pens
ed Gap
Incu
mb
ent
Del
iver
ed /
Dis
pen
sed
Gap
Incu
mb
ent
Near term Mid-term Long term
Hyd
roge
n t
ran
sfer
pri
ce
& e
con
om
ic g
ap ($
/kg)
Incumbent cost Distribution cost Farmgate cost

Advisian 66
:
The regional aviation sector is considered to have high dependence on hydrogen for decarbonisation,
with a rating of 8 out of 10, since battery based technology and alternative fuel cells systems may
become competitive.
The economic gap assessment of the international aviation sector considers displacing Jet-A fuel with
liquid hydrogen in jet engines. The analysis indicates that the sector approaches competitiveness with
conventional Jet-A prior to 2050. This sector is considered to have a high dependence on hydrogen for
decarbonisation, with a rating of 9 out of 10 due to battery technology not being technically viable
and volume of biofuels derived fuel being limited.
Figure 3-21 – International aviation sector economic gap snapshots (TCO basis)
The development of hydrogen and hydrogen derived fuels in the aviation sector face many technical
and commercial challenges. Some of the key areas that will need to be addressed are:
• Aircraft designs that accommodate the lower volumetric density of gaseous and liquid hydrogen;
• Proof of application of hydrogen fuel cells and hydrogen turbines in aviation applications;
• Development of hydrogen production, storage and refuelling facilities at airports;
• Considerable weight reduction for LH2 storage and fuel cells (including cooling);
• For synthetic jet fuel, significant reductions are required in the cost of direct air CO2 capture and
production; and
• Aggressive aviation decarbonisation targets including international or regional regulations.
Aviation - International-5
.3 -1.3 0.4
0
4
8
12
16
20
24
-8
-4
0
4
8
12
16
Del
iver
ed /
Dis
pens
ed Gap
Incu
mb
ent
Del
iver
ed /
Dis
pens
ed Gap
Incu
mb
ent
Del
iver
ed /
Dis
pen
sed
Gap
Incu
mb
ent
Near term Mid-term Long term
Hyd
roge
n t
ran
sfer
pri
ce
& e
con
om
ic g
ap ($
/kg)
Incumbent cost Distribution cost Farmgate cost

Advisian 67
3.3 Fuel for industry
3.3.1 Synthetic natural gas (SNG)
If green SNG could be produced commercially, the decarbonisation movement would be greatly
simplified by just use green SNG in place of natural gas. However, this pathway is unlikely to become
commercial before 2050. The creation of SNG is also challenged by the fundamental requirements for
hydrogen and energy inputs, providing a higher cost but able to be fully blended with natural gas.
The commercial development of synthetic natural gas will require:
• Low cost hydrogen as a feedstock;
• Access to low cost CO2 from GHG neutral sources;
• Prohibitive costs for replacement of natural gas infrastructure and appliances to take high
percentage blends or pure hydrogen; and
• Accelerated transition from fossil natural gas driven by gas pricing.
The creation of synthetic natural gas is considered to have moderate dependence on hydrogen for
decarbonisation, with a rating of 5 out of 10. Other alternatives, such as electrification and hydrogen
blends / 100 % hydrogen, offer less complicated and costly decarbonisation opportunities.
3.3.2 Gas network – H2 blends
Australia has extensive natural gas networks to transmit gas from the source and distribute to
customers. This section explores the opportunity to utilise these existing assets to cost effectively
deliver hydrogen and stimulate early hydrogen demand.
Hydrogen blending concentrations above 50% are not currently considered feasible in existing
distribution networks due to increased impact on safety, leakage and material integrity. Adding more
than 50% hydrogen to a distribution pipeline yields a significant increase in overall risk due to increase
in probability and severity of ignition and explosion scenarios. The only feasible alternative to reach
blending concentrations above 50% is to construct a dedicated hydrogen network or revamp the
existing national infrastructure. A 100% hydrogen network could provide a low-cost source of
feedstock for industry and mobility applications.
Blending hydrogen into the existing natural gas distribution network at low concentrations, less than
10% hydrogen by volume, is generally considered viable without significantly increasing risks
associated with utilisation, overall public safety, or the durability and integrity of the existing natural
gas pipeline network. Blending up to 20% is feasible and doesn’t affect Wobbe index but may require
some modifications of the supporting pipeline gas specification.
For blended hydrogen in natural gas networks beyond levels compatible with existing appliances and
infrastructure to be viable:
• Conversion costs of infrastructure and appliances must not be prohibitive;
• Electrification options are not able to supply similar services; and
• The gas network provides significant and valuable energy storage to support renewable electricity
deployment.
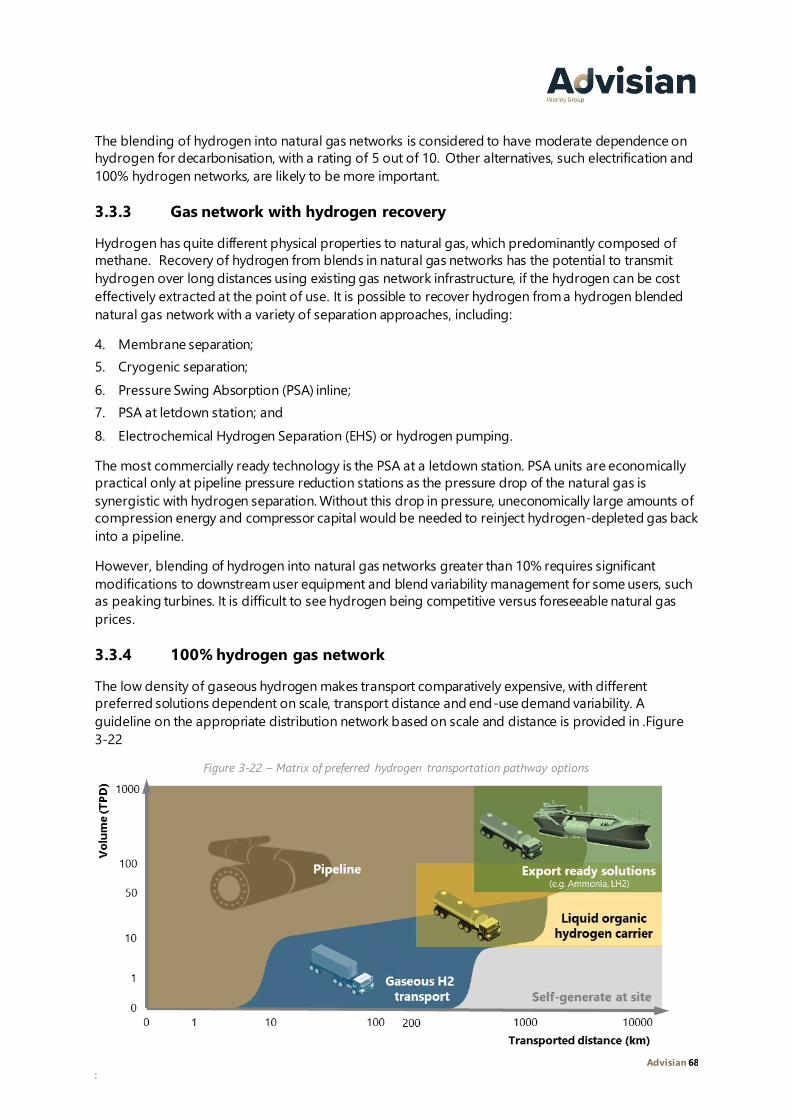
Advisian 68
:
The blending of hydrogen into natural gas networks is considered to have moderate dependence on
hydrogen for decarbonisation, with a rating of 5 out of 10. Other alternatives, such electrification and
100% hydrogen networks, are likely to be more important.
3.3.3 Gas network with hydrogen recovery
Hydrogen has quite different physical properties to natural gas, which predominantly composed of
methane. Recovery of hydrogen from blends in natural gas networks has the potential to transmit
hydrogen over long distances using existing gas network infrastructure, if the hydrogen can be cost
effectively extracted at the point of use. It is possible to recover hydrogen from a hydrogen blended
natural gas network with a variety of separation approaches, including:
4. Membrane separation;
5. Cryogenic separation;
6. Pressure Swing Absorption (PSA) inline;
7. PSA at letdown station; and
8. Electrochemical Hydrogen Separation (EHS) or hydrogen pumping.
The most commercially ready technology is the PSA at a letdown station. PSA units are economically
practical only at pipeline pressure reduction stations as the pressure drop of the natural gas is
synergistic with hydrogen separation. Without this drop in pressure, uneconomically large amounts of
compression energy and compressor capital would be needed to reinject hydrogen-depleted gas back
into a pipeline.
However, blending of hydrogen into natural gas networks greater than 10% requires significant
modifications to downstream user equipment and blend variability management for some users, such
as peaking turbines. It is difficult to see hydrogen being competitive versus foreseeable natural gas
prices.
3.3.4 100% hydrogen gas network
The low density of gaseous hydrogen makes transport comparatively expensive, with different
preferred solutions dependent on scale, transport distance and end-use demand variability. A
guideline on the appropriate distribution network based on scale and distance is provided in .Figure
3-22
Figure 3-22 – Matrix of preferred hydrogen transportation pathway options

Advisian 69
When production volumes exceed 10 tpd, pipelines are generally cost effective. A secondary benefit of
pipeline transportation is the storage capacity that is can be achieved by varying the pipeline
operating pressure. The high initial capital costs of new pipeline construction is the most significant
barrier to this delivery approach. This approach does however have the benefit of enabling a multitude
of smaller hydrogen producers and consumers to utilise common user infrastructure on an incremental
basis.
Considerations associated with re-purposing natural gas distribution pipelines for 100% hydrogen
service include:
• Development of a regulatory framework for 100% hydrogen pipelines;
• The potential for hydrogen to embrittle higher grade steel pipelines and welds;
• Replacement of seals where hydrogen permeation may occur; and
• Management of contaminants leaching out from the walls of the pipelines, in particular sulphur
based odorants from natural gas transmission.
3.3.5 Combined heat and power
Combined heat and power (CHP) is the simultaneous
production of electricity and useful thermal energy
(heating and/or cooling) from a single source of energy,
commonly CHP is based on natural gas.
Recognising that hydrogen is a more expensive fuel than
natural gas, and that Opex cost is the dominant cost in
CHP operation, the selection of hydrogen rather than
natural gas as the CHP fuel source is predicated on either:
i. Hydrogen based CHP achieves higher efficiency than NG counterpart; or
ii. Fuel price parity is achieved.
Hydrogen based CHP would likely be based on fuel cell technology with an efficiency approaching
70% electricity yield. This would offer substantial advantages over the equivalent natural gas engine
based technology which has approximately 30% efficiency, due to:
• Higher efficiency has higher commercial return i.e. higher electricity yield;
• A fuel cell has fewer moving parts and hence greater reliability and less maintenance;
• Minimal waste heat reduces system cost, size and complexity; and
• Broader range of applications since economics can be favourable at lower heat demand levels.
CHP based on hydrogen fuel cells could also provide a longer-term opportunity where the increased
efficiency of fuel cells gives a cost advantage over natural gas based CHP systems and independent
heating and power supplies. This opportunity is generally more attractive in cooler climates where the
heating load is significant. Supplies of pure hydrogen are required.
The economic gap associated with the CHP sector is forecast to progressively improve, with breakeven
expected towards the end of the time horizon.

Advisian 70
:
Figure 3-23 – CHP (Residential) sector economic gap snapshot (Fuel cost only)
Figure 3-24 – CHP (Industrial) sector economic gap snapshot (Fuel cost only)
For hydrogen CHP to be a viable technology:
• A significant heat demand coupled with the electricity demand is required;
• Hydrogen fuel cells must provide higher efficiency than comparative natural gas based systems;
and
• CHP is able to create a niche where the distributed heat and power generation provides value
versus high efficiency electric heat pumps.
Residential CHP is considered to have moderate dependence on hydrogen for decarbonisation, with a
rating of 5 out of 10. Other alternatives, such as electrification of all heating and cooling, are likely to
be more important. Industrial CHP is rated 6 out of 10 and could provide an advantage over
electrification where high temperatures and power are required.
CHP - Residential
-4.3
-1.6
-1.4
0
4
8
12
16
20
24
-8
-4
0
4
8
12
16
Del
iver
ed /
Dis
pens
ed Gap
Incu
mb
ent
Del
iver
ed /
Dis
pens
ed Gap
Incu
mb
ent
Del
iver
ed /
Dis
pen
sed
Gap
Incu
mb
ent
Near term Mid-term Long term
Hyd
roge
n t
ran
sfer
pri
ce
& e
con
om
ic g
ap ($
/kg)
Incumbent cost Distribution cost Farmgate cost
CHP - Industrial
-4.7
-2.2
-1.1
0
4
8
12
16
20
24
-8
-4
0
4
8
12
16
Del
iver
ed /
Dis
pens
ed Gap
Incu
mb
ent
Del
iver
ed /
Dis
pens
ed Gap
Incu
mb
ent
Del
iver
ed /
Dis
pen
sed
Gap
Incu
mb
ent
Near term Mid-term Long term
Hyd
roge
n t
ran
sfer
pri
ce
& e
con
om
ic g
ap ($
/kg)
Incumbent cost Distribution cost Farmgate cost
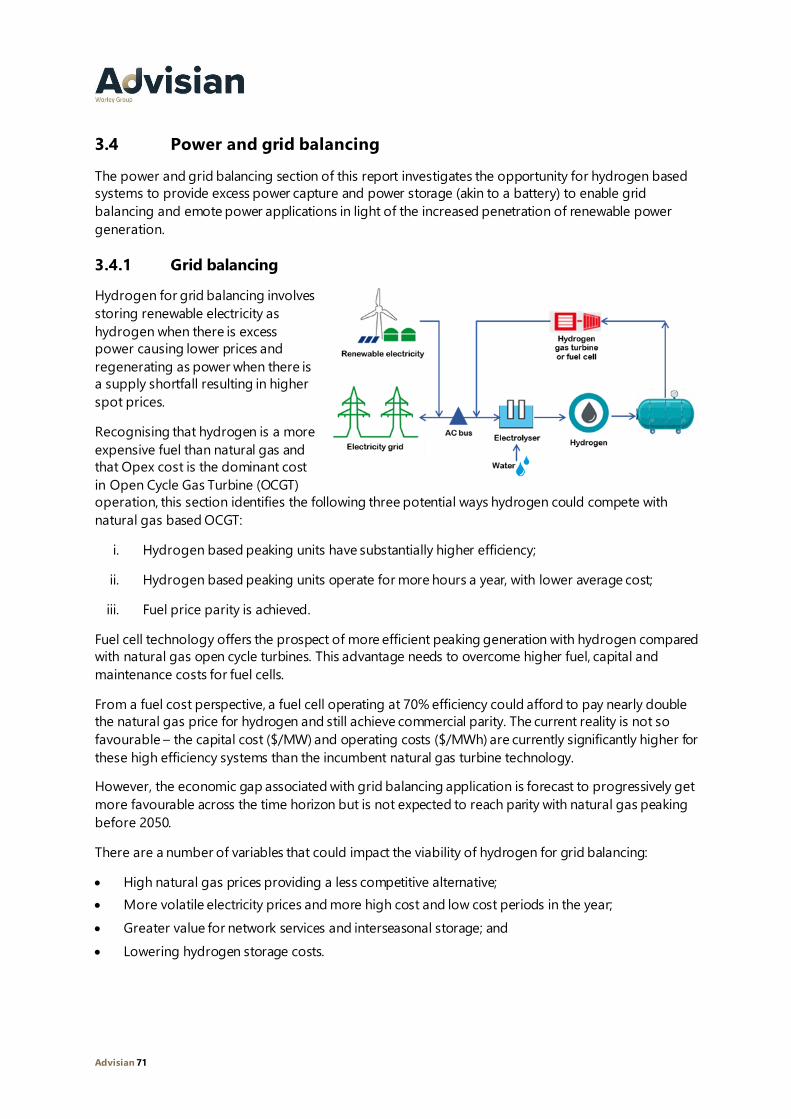
Advisian 71
3.4 Power and grid balancing
The power and grid balancing section of this report investigates the opportunity for hydrogen based
systems to provide excess power capture and power storage (akin to a battery) to enable grid
balancing and emote power applications in light of the increased penetration of renewable power
generation.
3.4.1 Grid balancing
Hydrogen for grid balancing involves
storing renewable electricity as
hydrogen when there is excess
power causing lower prices and
regenerating as power when there is
a supply shortfall resulting in higher
spot prices.
Recognising that hydrogen is a more
expensive fuel than natural gas and
that Opex cost is the dominant cost
in Open Cycle Gas Turbine (OCGT)
operation, this section identifies the following three potential ways hydrogen could compete with
natural gas based OCGT:
i. Hydrogen based peaking units have substantially higher efficiency;
ii. Hydrogen based peaking units operate for more hours a year, with lower average cost;
iii. Fuel price parity is achieved.
Fuel cell technology offers the prospect of more efficient peaking generation with hydrogen compared
with natural gas open cycle turbines. This advantage needs to overcome higher fuel, capital and
maintenance costs for fuel cells.
From a fuel cost perspective, a fuel cell operating at 70% efficiency could afford to pay nearly double
the natural gas price for hydrogen and still achieve commercial parity. The current reality is not so
favourable – the capital cost ($/MW) and operating costs ($/MWh) are currently significantly higher for
these high efficiency systems than the incumbent natural gas turbine technology.
However, the economic gap associated with grid balancing application is forecast to progressively get
more favourable across the time horizon but is not expected to reach parity with natural gas peaking
before 2050.
There are a number of variables that could impact the viability of hydrogen for grid balancing:
• High natural gas prices providing a less competitive alternative;
• More volatile electricity prices and more high cost and low cost periods in the year;
• Greater value for network services and interseasonal storage; and
• Lowering hydrogen storage costs.

Advisian 72
:
Figure 3-25 – Grid balancing sector (with H2 turbine) economic gap snapshots (TCO basis)
Grid balancing is considered to have moderate to high dependence on hydrogen for decarbonisation,
with a rating of 7 out of 10. Other electricity storage alternatives, such as batteries for short term and
pumped hydro for longer term, will be competitors. In Australia where opportunites for utility scale
pump hydro are limited, hydrogen could be an important energy storage medium.
3.4.2 Remote power
Hydrogen production, storage and return to electricity
has the potential to provide a more cost-effective remote
power solution for towns or industrial sites, than more
conventional diesel and solar with battery solutions.
To illustrate this potential, we modelled a remote power
system of a small town with a peak population of around
6,000 people and a peak summer demand of 6.2 MW
using current technology and fuel costs. In our estimates,
the electricity consumption is just over 24,000 MWh per
year.
Remote power systems offered an attractive opportunity for hydrogen production and storage to
lower the costs and GHG emissions of diesel or natural gas based remote power systems.
To achieve 100% renewable energy on these sites is possible with hydrogen, potentially at lower
levelised cost than diesel only systems. Hydrogen storage could also offer a lower cost option to
batteries for longer duration storage. It is noted that the capital cost for a hydrogen system is higher
than for competing diesel and solar, battery and diesel hybrid systems.
Fuel cell technology offers the prospect of more efficient peaking generation with hydrogen compared
with natural gas open cycle turbines. This advantage needs to overcome higher fuel, capital and
maintenance costs for fuel cells.
In our analysis using Xendee software, we established that a hydrogen-based system with very small
diesel plant to manage <6% of the power generation provided the lowest cost of power – see Table
3-2.
Grid-balancing
-2.9
-1.4
-0.2
0
4
8
12
16
20
24
-8
-4
0
4
8
12
16
De
live
red
/D
isp
ense
d
Gap
Incu
mb
en
t
De
live
red
/D
isp
ense
d
Gap
Incu
mb
en
t
Del
ive
red
/D
isp
ense
d
Gap
Incu
mb
en
t
Near term Mid-term Long term
Hyd
roge
n tr
ansf
er p
rice
&
eco
no
mic
gap
($
/kg)
Incumbent cost Distribution cost Farmgate cost
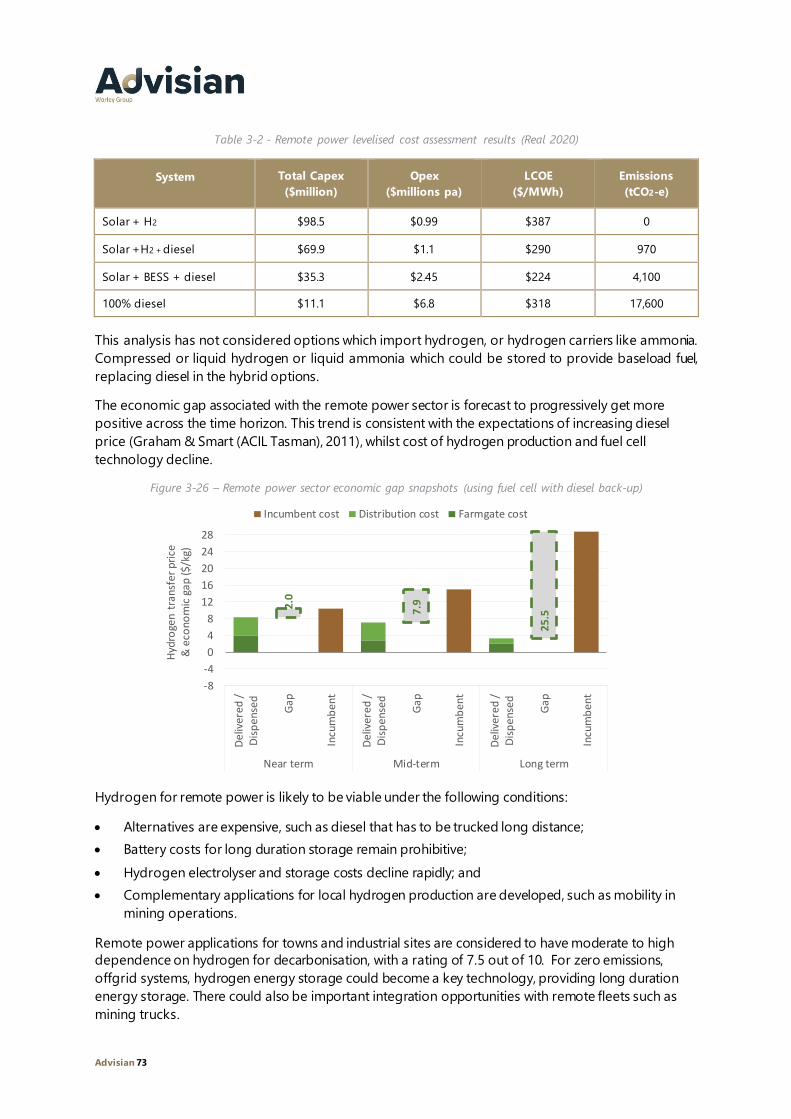
Advisian 73
Table 3-2 - Remote power levelised cost assessment results (Real 2020)
System Total Capex
($million)
Opex
($millions pa)
LCOE
($/MWh)
Emissions
(tCO2-e)
Solar + H2 $98.5 $0.99 $387 0
Solar +H2 + diesel $69.9 $1.1 $290 970
Solar + BESS + diesel $35.3 $2.45 $224 4,100
100% diesel $11.1 $6.8 $318 17,600
This analysis has not considered options which import hydrogen, or hydrogen carriers like ammonia.
Compressed or liquid hydrogen or liquid ammonia which could be stored to provide baseload fuel,
replacing diesel in the hybrid options.
The economic gap associated with the remote power sector is forecast to progressively get more
positive across the time horizon. This trend is consistent with the expectations of increasing diesel
price (Graham & Smart (ACIL Tasman), 2011), whilst cost of hydrogen production and fuel cell
technology decline.
Figure 3-26 – Remote power sector economic gap snapshots (using fuel cell with diesel back-up)
Hydrogen for remote power is likely to be viable under the following conditions:
• Alternatives are expensive, such as diesel that has to be trucked long distance;
• Battery costs for long duration storage remain prohibitive;
• Hydrogen electrolyser and storage costs decline rapidly; and
• Complementary applications for local hydrogen production are developed, such as mobility in
mining operations.
Remote power applications for towns and industrial sites are considered to have moderate to high
dependence on hydrogen for decarbonisation, with a rating of 7.5 out of 10. For zero emissions,
offgrid systems, hydrogen energy storage could become a key technology, providing long duration
energy storage. There could also be important integration opportunities with remote fleets such as
mining trucks.
Remote power
2.0
7.9
25
.5
0
4
8
12
16
20
24
28
32
36
-8
-4
0
4
8
12
16
20
24
28
Del
iver
ed /
Dis
pen
sed
Gap
Incu
mb
ent
Del
iver
ed /
Dis
pen
sed
Gap
Incu
mb
ent
Del
iver
ed /
Dis
pen
sed
Gap
Incu
mb
ent
Near term Mid-term Long term
Hyd
roge
n t
rans
fer
pric
e &
eco
no
mic
gap
($/k
g)
Incumbent cost Distribution cost Farmgate cost

Advisian 74
:
3.5 Feedstock for industry
3.5.1 Alumina calcining
Australia is a major global producer of alumina (Al R2ROR3R), which it refines from plentiful local reserves of
bauxite, a mineral containing primarily alumina and iron oxides. The majority of Australian alumina is
exported to aluminium smelters globally. A small fraction of Australian alumina is smelted
domestically.
Alumina does not require the chemical properties of hydrogen, rather the heat source to drive
digestion and drying processes. There is no chemical or efficiency advantage associated with using
hydrogen instead of natural gas as a heat source in the Bayer or calcination process. As such it is
expected that in the absence of carbon pricing, the uptake of hydrogen will depend on the thermal
value of hydrogen approaching price parity with natural gas.
Although the economic cost of displacing natural gas with hydrogen can be significant, there are
potential benefits:
• Blending hydrogen into natural gas up to a 10% by volume mixture could provide small carbon
reductions in the short term without any capital investment;
• Because of their very large energy consumption, alumina consumers could provide demand for
demonstration and larger scale domestic hydrogen consumption;
• Decarbonisation in the alumina sector is a complex task; producers in Australia may be willing to
pay a premium for hydrogen if it is the only path to decarbonisation; and
• Parity with natural gas for alumina production requires a hydrogen price of around $1 per kg,
assuming a $9/GJ natural gas price.
Incentives are required to overcome the energy cost gap that exists between natural gas and
hydrogen, with the economic gap associated with alumina calcining not expected to be attractive
during the period to 2050 per Figure 3-27.
Figure 3-27 – Alumina calcining sector economic gap snapshots
Alumina calcining
-5.0
-2.4
-1.4
0
4
8
12
16
20
24
-8
-4
0
4
8
12
16
Del
iver
ed /
Dis
pens
ed Gap
Incu
mb
ent
Del
iver
ed /
Dis
pens
ed Gap
Incu
mb
ent
Del
iver
ed /
Dis
pen
sed
Gap
Incu
mb
ent
Near term Mid-term Long term
Hyd
roge
n t
ran
sfer
pri
ce
& e
con
om
ic g
ap ($
/kg)
Incumbent cost Distribution cost Farmgate cost

Advisian 75
The alumina sector is considered to have moderate dependence on hydrogen for decarbonisation,
with a rating of 6 out of 10, with alternatives being renewable heating from solar thermal or
electrification. Hydrogen could become the key decarbonisation technology if the cost of production
can reach parity with natural gas.
3.5.2 Steel mills
Australia is a major exporter of iron ore and metallurgical grade coal. Australian manufacturers of raw
steel utilise the Blast Furnace / Basic Oxygen Furnace (BF/BOF) to make iron and steel.
Blast furnaces require periodic major upgrades to maintain operational efficiency. At the conclusion of
each campaign the furnace will require relining and refurbishment. A campaign can last up to 20 years.
The costs involved in the reline are significant and create a potential technology breakpoint where
investment in a different technology such as the Direct Reduced Iron / Electric Arc Furnace (DRI/EAF)
process can be more easily justified.
The hydrogen DRI/EAF route offers significant reductions in CO2 emissions using natural gas as a fuel.
This route also offers the potential for later conversion to a hydrogen process once hydrogen
production costs have reduced to a level where natural gas can be displaced, noting that the value of
hydrogen in this application is higher than just the heating value; hydrogen acts as a reductant and
replaces reformed natural gas in the DRI process. This holds true of other processes where hydrogen
has a value beyond heating, such as production of other metals including nickel and zinc.
The economic gap associated with the steel manufacturing sector is forecast to progressively get more
attractive across the time horizon but is not expected to reach parity with natural gas supplied DRI
processes before 2050.
Figure 3-28 – Steel mills sector economic gap snapshots
The application of hydrogen to steel manufacturing is dependent on:
• The development and widespread uptake of lower emissions steel manufacturing, including DRI
and hydrogen, to replace current coal based blast furnace operations;
• Green metals market premiums support higher energy input costs; and
• High natural gas prices reduce the competitiveness of natural gas.
Steel mills
-4.1
-1.4
-0.2
0
4
8
12
16
20
24
-8
-4
0
4
8
12
16
Del
iver
ed /
Dis
pen
sed
Gap
Incu
mb
ent
Del
iver
ed /
Dis
pen
sed
Gap
Incu
mb
ent
Del
iver
ed /
Dis
pen
sed
Gap
Incu
mb
ent
Near term Mid-term Long term
Hyd
roge
n t
ran
sfe
r p
rice
&
eco
nom
ic g
ap ($
/kg)
Incumbent cost Distribution cost Farmgate cost

Advisian 76
:
The steel sector is considered to have high dependence on hydrogen for decarbonisation, with a rating
of 8.5 out of 10. Other alternatives, such as CCS, are likely to be location specific and add cost to steel
production.
3.5.3 Other high grade heat applications
Process heat demand in the medium temperature, that is 250-800°C, and high temperature, >800⁰C,
ranges represent around 10% of total Australian energy consumption (ITP, Pitt and Sherry, Institute for
Sustainable Futures, 2019). . P The key sectors that use these grades of heat are summarised below.
Figure 3-29 - Breakdown of process heat consumption (PJ/y) in Australia
Source: ITP, Pitt and Sherry, Institute for Sustainable Futures
Low carbon hydrogen may be an attractive decarbonisation option for these industries, as its direct
combustion can provide the required temperatures on a continuous basis, without the GHG
implications.
In purely heating duties, even at high temperature, the efficiency of electrification is likely to be more
cost effective. This will be particularly true where heat can be focused directly on the material, such as
through induction heating or microwaves.
Figure 3-30 – Other high grade heat applications sector economic gap snapshots (Fuel cost basis)
Other med-high grade applications
-4.8
-2.2
-1.2
0
4
8
12
16
20
24
-8
-4
0
4
8
12
16
Del
iver
ed /
Dis
pen
sed
Gap
Incu
mb
ent
Del
iver
ed /
Dis
pen
sed
Gap
Incu
mb
ent
Del
iver
ed /
Dis
pen
sed
Gap
Incu
mb
ent
Near term Mid-term Long term
Hyd
roge
n t
ran
sfe
r p
rice
&
eco
nom
ic g
ap ($
/kg)
Incumbent cost Distribution cost Farmgate cost

Advisian 77
Although the economic gap for using hydrogen for high grade heat applications improves over the
long term, it is not expected to be positive before 2050.
The application of hydrogen to high grade heat could be attractive if the following conditions were to
occur:
• Electrification options prove not to be technically viable or are too expensive;
• Green markets emerge and these premiums support higher energy costs; and
• High natural gas prices reduce the competitiveness of natural gas.
The high-grade heat sector is considered to have high dependence on hydrogen for decarbonisation,
with a rating of 8 out of 10. Electrification will also be important. However, once the production cost
of hydrogen approaches cost parity with natural gas, hydrogen is likely to become a key technology.
3.5.4 Ammonia
Historically, ammonia production has been a key
consumer of hydrogen. Ammonia is a compound
of nitrogen and hydrogen and therefore does not
generate CO2 emissions when combusted.
Industry is used to storing and transporting
ammonia, including in oceangoing tankers.
Ammonia can, in principle, be used as a fuel in
various energy applications, for example for co-
firing in coal power plants. None of these
applications is being used commercially today.
A large portion of Australia’s ammonia manufacturing capacity is beyond the initial design life of the
facility and survives through judicious asset management and favourable domestic gas pricing.
However, as the price of natural gas increases alongside the ageing of existing manufacturing plants,
the viability of utilising renewable technologies to support the growth of the ammonia manufacturing
industry will increase.
Figure 3-31 – Ammonia sector economic gap snapshots (TCO basis)
Ammonia
-1.8
-0.6
0.2
0
4
8
12
16
20
24
-8
-4
0
4
8
12
16
Del
iver
ed /
Dis
pen
sed
Gap
Incu
mb
ent
Del
iver
ed /
Dis
pen
sed
Gap
Incu
mb
ent
Del
iver
ed /
Dis
pe
nse
d
Gap
Incu
mb
ent
Near term Mid-term Long term
Hyd
roge
n t
rans
fer p
rice
&
eco
no
mic
gap
($/k
g)
Incumbent cost Distribution cost Farmgate cost

Advisian 78
:
Under the base scenario Ammonia production using green hydrogen is not expected to be
competitive against natural gas until around 2050, however the attractiveness improves over time
where prior to 2050, niche applications may become commercially attractive.
The application of green hydrogen to ammonia production could become viable if:
• Ammonia becomes an energy vector for export of green hydrogen to South East Asia and other
regions, attracting a premium price;
• The general ammonia market recognises a premium for green ammonia to produce fertilisers and
chemicals;
• Technology advances more quickly than anticipated to create new pathways for green ammonia
production, for example, high temperature electrolysis and improvements to the Haber-Bosch
synthesis process;
• Long distance transport of ammonia feedstock or lack of natural gas infrastructure creates a niche
production opportunity; and
• High natural gas prices reduce the competitiveness of natural gas.
The ammonia sector is considered to have high dependence on hydrogen for decarbonisation, with a
rating of 8 out of 10. Other alternatives, such as CCS, may be used but are likely to add cost compared
with hydrogen at gas parity prices.
N2OCO2
CH4
Agriculture accounts for an estimated
11-15% of greenhouse gases (GHGs),
approximately a third of which
comprises nitrous oxide (N2O)
International Fertilizer Association, 2018

Advisian 79
3.5.5 Methanol
Methanol is produced from natural gas by reforming with steam and then converting and distilling the
synthesis gas mixture, carbon monoxide and hydrogen, to pure methanol. Methanol is used as a
feedstock to industrial and consumer products market (~55% demand), and as an energy and fuel
substitute (~45% demand). Today, the main application of methanol is feedstock for producing
formaldehyde. There has been an increase in the consumption of methanol for the production of
dimethyl ether (DME) and Methyl tertiary-butyl ether (MTBE), which are a diesel alternative and
gasoline additive respectively.
Green methanol can be produced by replacing the reformer unit with electrolytic hydrogen production
and carbon neutral carbon feed. To achieve low carbon emission status, the electrolyser plants must be
supplied with renewable electricity.
Based on the IEA’s ’the Future of Hydrogen’ modelling basis, the forecast cost of conventional and
Australian green methanol have been quantified in Figure 3-32. It suggests that green methanol is not
expected to be cost competitive with conventional methods in the near-term and is not expected to
meet price parity per Figure 3-32.
Figure 3-32 – Forecast green and conventional methanol production costs in Australia
Green methanol could become viable if the following conditions are met:
• A green market develops for methanol
and methanol derived products, such as
plastics;
• Methanol becomes a hydrogen vector,
gaining premium value as a low
emissions energy carrier and fuel;
• Niche supply opportunities emerge that
are stranded from natural gas supplies;
and
• High natural gas prices reduce the
competitiveness of natural gas.
The methanol sector is considered to have
high dependence on hydrogen for
decarbonisation, with a rating of 8 out of 10.
0
200
400
600
800
1000
1200
2020 2025 2030 2035 2040 2050
Me
than
ol p
rod
uci
on
co
st (A
$/to
n)
Year
Forecast of methanol pricing
NG based methanol cost Green methanol cost
Figure 3-33 Methanol sector economic gap snapshots
Methanol
-3.3 -1
.4
-0.1
0
4
8
12
16
20
24
-8
-4
0
4
8
12
16
De
live
red
/D
isp
en
sed
Ga
p
Incu
mb
en
t
De
live
red
/D
isp
en
sed
Ga
p
Incu
mb
en
t
De
live
red
/D
isp
en
sed
Ga
p
Incu
mb
en
t
Near term Mid-term Long term
Hyd
roge
n t
ran
sfe
r p
rice
&
eco
no
mic
ga
p (
$/k
g)
Incumbent cost Distribution cost Farmgate cost

Advisian 80
:
Other alternatives, such as CCS, may be used but will only treat the portion of emissions associated
with methanol production.
3.5.6 Oil refining
The majority of hydrogen consumed within a crude oil refinery typically occurs during the fractionation
of the crude oil feed, naphtha reforming and heavy distillate cracking. Refineries that process light /
sweet crudes, such as Lytton in Australia, often have no need for additional hydrogen production and
utilise excess hydrogen from the process as heating fuel. Refineries that process heavy / sour crudes
consume hydrogen in hydrotreating and sulphur removal steps.
When hydrogen demand exceeds internal production, additional hydrogen is typically produced using
steam methane reforming of imported natural gas or excess fuel gas. The trend towards increased
hydrogen consumption in refineries is related to tightening supplies and price premiums associated
with sweet / light crudes, and progressive tightening of sulphur specifications on consumer fuels and
marine bunkers.
Increased hydrogen consumption may also be required to produce low sulphur fuels for marine
applications in the short term, and for land transport in the medium term. Additionally, schemes such
as RED II in Europe allow green hydrogen feedstock to be counted towards renewable energy
requirements in fuels (European Union, 2018), and this appears to be potentially cost effective
compared to biofuel alternatives.
The oil refining sector is forecast to maintain a negative economic gap across the period shown in
Figure 3-34, although the size of the gap decreases over time.
Figure 3-34 – Oil refining sector economic gap snapshots (Fuel cost basis)
The application of green hydrogen to oil refining could become viable if:
• Low emissions fuel standards are introduced in Australia along the lines of the European RED II
scheme, creating a high value market for green hydrogen; and
• Future fuel sulphur level reduction regulations are predicated on the use of renewable hydrogen
in the hydrotreating processes.
The oil refining sector is considered to have moderate dependence on hydrogen for decarbonisation,
with a rating of 6 out of 10. Other alternatives, such as CCS, may be used but are likely to add cost
compared with hydrogen at gas parity prices.
Oil refining
-2.5
-1.0
-0.1
0
4
8
12
16
20
24
-8
-4
0
4
8
12
16
Del
iver
ed /
Dis
pens
ed Gap
Incu
mb
ent
Del
iver
ed /
Dis
pens
ed Gap
Incu
mb
ent
Del
iver
ed /
Dis
pen
sed
Gap
Incu
mb
ent
Near term Mid-term Long term
Hyd
roge
n t
ran
sfer
pri
ce
& e
con
om
ic g
ap ($
/kg)
Incumbent cost Distribution cost Farmgate cost

Advisian 81
4
Export pathways

Advisian 82
:
4 Export pathways
The export of hydrogen is forecast to be a key enabler of a global low carbon economy. The Australian
National Hydrogen Strategy has set high expectations for the development of a hydrogen export
economy by 2030. The key challenge to this ambition is the inherent very low density of hydrogen.
In this section of the report, we analyse liquid hydrogen and ammonia export pathways to compare
current and future expected delivered hydrogen costs in Japan. In this analysis we evaluate both the
expected delivered cost as well as the expected production cost of the carrier fluid. The results of this
analysis are illustrated in Figure 4-1 below.
Figure 4-1 – Forecast cost of delivered green hydrogen in Japan
4.1.1 Export of liquid hydrogen
The liquid hydrogen export pathway is considered to have analogues with the liquefaction of natural
gas. Commercial export of liquefied natural gas (LNG) commenced circa 1980, with only slow growth
until early 2000s, when the volume of trade escalated dramatically. Liquefaction of hydrogen will likely
require the development of a demand market before significant export scales are achieved.
The key advantages of liquefaction relates to the increased hydrogen density of 71 kg/m³ and the
ability to use the hydrogen directly at the point of delivery through simple gasification. Producing
liquid hydrogen from gaseous hydrogen, export facilities, shipping and import facilities is currently
expected to add more than $9/kg to the cost of hydrogen for a delivered cost of nearly $13 per
kilogram as shown in Figure 4-2.

Advisian 83
Figure 4-2 – Levelised cost profile for liquid hydrogen export to Japan
Although the liquefaction pathway has comparatively higher energy demand for carrier conversion, the
biggest challenge for this pathway is the immense capital costs associated with load-out and receiving
terminals and the early development status of liquid hydrogen shipping. In order to be cost effective,
liquefaction projects need industrial scales and considerable capital expenditure. In the near-term, the
anticipated minimum viable size is 400 tpd or 140 ktpa Technology for hydrogen liquefaction, storage,
shipping and regasification are all in the process of being scaled to match export hydrogen
requirements.
4.1.2 Export of ammonia
The key advantages of ammonia as an export fuel relate to the effective hydrogen carrying density of
158 kg/m³, making up 18% of ammonia, and the ability to utilise of existing transport infrastructure
and technology. The effective hydrogen density is more than double that which is achieved by
liquefied hydrogen. If pure hydrogen is required by the end user, rather than direct ammonia use, then
a portion of the hydrogen will be lost or consumed as fuel in the conversion process.
The manufacture of ammonia does not require dehydration and inert contaminants are acceptable,
hence manufacture of ammonia from blue and green hydrogen has similar costs. In order to be cost
effective, ammonia facilities larger than 500 ktpa are expected.
Ammonia generally raises more health and safety considerations than hydrogen, and its use would
probably need to continue to be restricted to professionally trained operators. It is highly toxic,
flammable, corrosive, and escapes from leaks in gaseous form. However, unlike hydrogen, it has a
pungent smell, making leaks easier to detect.
The delivery costs associated with hydrogen delivery via ammonia pathway are significantly lower than
via the liquefaction pathway, as is shown in Figure 4-3, at just under $8/kg for extracted hydrogen.
However, the technology to extract high purity hydrogen from the ammonia feed is still in an early
stage of development and costs are uncertain.
0
2
4
6
8
10
12
14
Current Future
Leve
lised
co
st (
$/kg
-H2)
Delivered cost of hydrogen via liquefaction pathway
Electrolysis plant Liquefaction plant Load-out facilities Transport vessel Receiving facilities
Current LCOH$13.22 /kg
Future LCOH$9.12/kg

Advisian 84
:
Figure 4-3 – Levelised cost profile of hydrogen export (via. ammonia) to Japan
The pathways involving chemical bonding, such as ammonia and methanol, appear to offer lower
delivered hydrogen prices than the liquefaction pathway. In the near term, the “green” carrier cost is
significantly more expensive than the conventional product, but by 2050 the green product is forecast
to be cheaper than the incumbent. The key challenges associated with the ammonia pathway relate to
decomposition losses and management of a toxic compound. The key challenges associated with the
methanol pathway relate to securing carbon neutral carbon dioxide (refer to Section 6.1.6) and
management of a toxic compound.
0
1
2
3
4
5
6
7
8
Current Future
Leve
lised
co
st (
$/kg
-H2)
Delivered cost of hydrogen via ammonia pathway
Electrolysis plant Ammonia plant Refrigeration & storage
Transport Receiving facilities Decomposition
Current LCOH $7.48/kg
Current Ammonia$779/ton
Future Ammonia$429/ton
Future LCOH $4.53/kg

Advisian 85
5
Accelerating market development and
sector competiveness

Advisian 86
:
5 Accelerating market development and sector
competitiveness
5.1 Market development
The development of prospective and flexible domestic hydrogen consumption de-risks
and facilitates export led pathways.
Given that there are several domestic end-use applications that approach commerciality before export
markets do, adopting an export only mentality to the early advancement of the hydrogen economy is
likely to yield less favourable commercial outcomes than a combined domestic and export approach.
Without global growth of a hydrogen consumption market, the cost of hydrogen fuel cells and storage
systems is unlikely to decline rapidly and therefore the prospective end-use markets will remain
uneconomic. The development of domestic markets will support the social licence for hydrogen
manufacturing, which might otherwise be perceived as inflating electricity prices for other users by
consuming low cost renewable electricity from the market.
Hydrogen export facilities have downtime and may experience demand fluctuation. If Australia had
some hydrogen swing consumers, for example ammonia synthesis or alumina calcining, then excess
hydrogen could be used rather than idling facilities. The ability to spill excess hydrogen to a domestic
end-use enables GHG reduction in Australia as well as providing a secondary revenue stream to
industrial-scale hydrogen manufacturers.
Developing a flexible hydrogen market is unlikely to be readily advanced through corporate to
corporate contracts. A market led approach using common infrastructure, akin to the electricity
market, is likely to achieve faster update and greater diversity of outcomes.
As demonstrated in this study, heavy-duty line haul trucking and remote power and vehicles in the
mining industry should be targeted as prospective end users for early development.
5.2 Complimentary business models
Stretching beyond just hydrogen production is likely to be a key differentiator and cost
reduction lever.
Australia is a global leader in research supporting photovoltaic hydrogen production as well as direct
ammonia synthesis and ammonia decomposition technology. These technologies align well with our
solar and onshore wind resources competitive advantage. Linking resource competitiveness with
“industrial” competitiveness could provide greater avenues for Australia’s manufacturing sector.
Ensuring Australian content in manufacture and maintenance of electrolysers would also have strong
secondary advantages.
The countries which develop a value stream for the oxygen by-product will have competitive
advantage, so Australia should explore this prospect as well.

Australian hydrogen market study Advisian 87
5.3 Sector competitiveness summary
A summary of the economic gap analysis and key considerations for each sector are captured in Figure 5-1.
Figure 5-1 – Key sector competitiveness parameters
Sector Incumbent Hydrogen Alternative/s Economic gapAttractiveness 2030
(Relative to incumbent)
Dependance on H2
for decarbonisationComment
2020 -5 -3
2030 -3 2
2050 5 4
2020 0.4 1.3
2030 1.3 2
2050 2.5 4
2020 0.9 1.9
2030 1.9 3
2050 3 5
2020 0.3 2.1
2030 2.1 3
2050 3.2 5
2020 -0.9 0.1
2030 0.1 3
2050 2.4 5
2020 -1.5 -0.6
2030 -0.6 2
2050 1.8 5
2020 -1.5 -0.24
2030 -0.24 1
2050 0.6 5
2020 -1.8 -1.2
2030 -1.2 1
2050 -0.8 5
2020 -1.85 -1.2
2030 -1.2 -2
2050 -0.83 5
2020 -1.7 -0.25
2030 -0.25 -2
2050 0.8 3.5
2020 -1.8 -0.6
2030 -0.6 0.5
2050 0.2 2.5
2020 -5 -4.5
2030 -4.5 0.3
2050 -4 5
2020 -1.6 -1.2
2030 -1.2 -0.5
2050 -0.9 1.5
2020
2030 3
2050 5
2020 -0.7 -1
2030 0.1 3.5
2050 0.55 5
2020 -1.7 -1.5
2030 -0.9 3
2050 -0.45 5
2020 -1.25 -0.6
2030 -0.6 0.5
2050 -0.1 5
2020 0.4 0.2
2030 1.6 4
2050 2.5 4.5
2020 -1.7 -1
2030 -1 2
2050 -0.6 5
2020 -1.6 -0.6
2030 -0.6 3
2050 0 5
2020 -1.7 -1
2030 -1 3
2050 -0.5 5
2020 -0.8 -0.2
2030 -0.2 3
2050 0.05 5
2020 -1.4 -0.6
2030 -0.6 3
2050 0 5
2020 -1.1 -0.45
2030 -0.45 1.5
2050 0 5
2020
2030 4
2050 5
2020
2030 42050 5
Liquid hydrogen
export
None Liquefaction of green hydrogen Inernational power transmission &
batteries Liquid hydrogen is a carrier and not an
end-use.
"Green" ammonia
export
Reforming of natural gas or
gasified coal to feed Haber-Bosch
process
Haber-Bosch process with "green"
hydrogen
Blue ammonia
Green ammonia is a carrier and not an
end-use.
Methanol
Reforming of natural gas or
gasified coal to feed Haber-Bosch
process
Direct use of hydrogen in Haber-Bosch
process 8
(High dependence.; No
easy alternatives)
Shifts to positive economic gap by 2050
Provides hydrogen export potential and
broad market
Clear GHG advantage
Oil refining
Reforming of light ends NG SMR with CCS; Lighter crude slate6
(Hydrogen can be
competitive)
Shifts to positive economic gap by 2050
Supports directions for "green" shipping
and aviation
Clear GHG advantage
Negative economic gap
Significant changes to infrastructure and
speed expectations
GHG impact reduced by 80%
Marine shipping -
Ammonia
MGO fired Internal combustion
engine
Modified iternal combustion engine
(Pressurised or refrigerated storage
@ 35% fuel density of MGO)
Fuel cell driven vessel
(Comparable power demand) 9
(Very high dependence.;
No easy alternatives)
Comparable / positive economic gap
Ammonia toxic management challenges
are well known and managed
Particularly attractive if carrying GNH3 for
export
Aviation - Regional
Jet-A fired turbines Fuel cell based turbo props
(Liquid hydrogen storage density is
~25% volumetric density of Jet-A,
hence aircraft design and speeds are
heavily modified)
Synfuel fired turbines
(Minimal change to existing
infrastructure)
8
(Moderate
dependence.; Other
options are possible)
Shifts to positive economic gap by 2050
Carbon dioxide must be carbon neutral
Liquid hydrogen or GNH3 based approaches
may be attractive
Ferries
MGO fired Internal combustion
engine
Fuel cell vehicle
(Fuel storage volume may be 10×
greater than MGO based approach)
Battery electric approach
(Significant battery storage volume and
weight)
7
(Moderate
dependence.; Other
options are possible)
Shifts to positive economic gap by 2050
Battery based solutions have weight
impediment
Liquid hydrogen or GNH3 based approaches
may be attractive
Marine shipping –
Methanol
MGO fired Internal combustion
engine
Modified iternal combustion engine
(Fuel density is 50% that of MGO)
Use of captured CO2 (not carbon
neutral) in methanol production 9
(Very high dependence.;
No easy alternatives)
Shifts to positive economic gap by 2050
More attractive for passanger and variable
power demand applications
Electrification is a clear alternative
Positive economic gap (Most prospective)
More attractive for long range applications
Liquid hydrogen fueling could be simpler
Low emissions can be certified
Heavy vehicle –
Mining
Internal combustion engine
(160 L/h)
Fuel cell vehicle
(90% of ICE energy demand)
Battery electric vehicle
(with and without trolley assist)7
(Moderate
dependence.; Other
options are possible)
Positive economic gap (Attractive)
Flexible operation and short charge times
give advantage over BEV in many
applications
Possible liquid hydrogen fueling
Rail
Internal combustion engine
(150,000 km/y)
Consistent high power demand
reduces efficiency advantage
Battery electric locomotive
(with and without overhead line
charging)
- Charge time reduces travel distance
3
(Alternatives are likely
to be competitive)
Heavy vehicles –
Return to base
Internal combustion engine
(28.5 L/100 km)
50,000 km/y
Fuel cell vehicle
(4.1 kg /100 km)
3
(Alternatives are likely
to be competitive)
Material handling
Internal combustion engine
(1 refill per shift)
Fuel cell vehicle
(Comparable refueling rates; Rapid
electric motor based acceleration)
Battery electric vehicle
(Batteries provide weigh to
counterbalance loads; Rapid electric
motor based acceleration)
Comparable / positive economic gap
No emissions / spark risk in confined spaces
Low emissions can be certified.
Faster charge times than BEV
Battery electric vehicle
(106 kWh/100 km) 4
(Alternatives are likely
to be competitive)
Comparable to positive economic gap
More attractive for long range applications
Possible liquid hydrogen fueling
advantages
Low emissions can be certified
Light vehicles
Internal combustion engine
(10.8 L/100 km)
Fuel cell vehicle
(0.77 kg /100 km)
Battery electric vehicle
(15 kWh/100 km)
Transitions from highly negative to
moderately positive economic gap
More attractive for long range applications
Home based charging is possible long term
Low emissions can be certified
2
(Alternatives are likely
to be competitive)
6
(Hydrogen can be
competitive)
Heavy vehicles –
Line haul
Internal combustion engine
(35 L/100 km)
200,000 km/y
Fuel cell vehicle
(8.28 kg /100 km)
Battery electric vehicle
(124 kWh/100 km)
Negative economic gap
Significant changes to infrastructure
GHG impact reduced by 60%
Synthetic natural gas
Natural gas systems using natural
gas
Natural gas systems using "green"
synthetic natural gas
Use of captured CO2 (not carbon
neutral) in SNG production 5
(Hydrogen can be
competitive)
Consistently negative economic gap
Carbon dioxide must be carbon neutral
Could be a direct replacement for natural
gas
Aviation -
International
Jet-A fired turbines Hydrogen fired turbines
(Liquid hydrogen storage density is
~25% volumetric density of Jet-A,
hence aircraft design and speeds are
heavily modified)
Synfuel fired turbines
(Minimal change to existing
infrastructure)
9
(Very high dependence.;
No easy alternatives)
Hydrogen transport is challenging due to
very low density. Transmission of
electricity with storage or hydrogen
generation at terminus are competing
options.
100% hydrogen gas
network
CHP using natural gas CHP using H2 fuel cell Transmission of renewable electricity
and solar based heat 5
(Hydrogen can be
competitive)
Negative to comparable economic gap
Economic with lower heat demand
Water delivery could be a benefit
Clear GHG advantage
Combined heat and
power - Residential
Gas network (i.e.
Blending)
100% hydrogen gas network Distribution with hydrogen carrier
N/A
Natural gas systems using natural
gas
Natural gas systems using up to 20%
blend of hydrogen
Natural gas systems using up to 20%
blend of hydrogen and hydrogen
recovery at key points
5
(Hydrogen can be
competitive)
Negative economic gap
Can provide transmission vector for
hydrogen & ideal for intermittent "spill" of
hydrogen production. Temporal variability
can disrupt end-users.
Negative economic gap
Economic with lower heat demand. High
temperature applications need a hybrid
combustion / FC solution.
Water delivery could be a benefit
Open cycle gas turbine using
natural gas
H2 fuel cell Battery 7
(Moderate
dependence.; Other
options are possible)
Negative economic gap
Pipeline based delivery could support
market development
Water delivery could be a benefit
Clear GHG advantage
Combined heat and
power - Industrial
CHP using natural gas CHP using H2 fuel cell Transmission of renewable electricity
and solar based heat 6
(Hydrogen can be
competitive)
Comparable to positive economic gap
Supports self resilience and reduces
handling of diesel
Clear GHG advantage
Remote power
Direct combustion of natural gas Direct combustion of hydrogen Electrification6
(Hydrogen can be
competitive)
Negative economic gap until approaching
natural gas parity
Clear GHG advantage
Alumina calcining
Grid balancing
Diesel genset "Green" hydrogen generation, storage
and H2 fuel cell + diesel support
Solar generation with battery storage 7.5
(Moderate
dependence.; Other
options are possible)
Negative economic gap until approaching
natural gas parity
Clear GHG advantage
Other high grade
heat
Reforming of natural gas or
gasified coal to feed Haber-Bosch
process
Direct use of hydrogen in Haber-Bosch
process 8
(High dependence.; No
easy alternatives)
Shifts to positive economic gap by 2050
Provides hydrogen export potential and
broad market
Clear GHG advantage
Ammonia
Steel mills
Direct combustion of natural gas Direct combustion of hydrogen Electrification8
(High dependence.; No
easy alternatives)
Direct combustion and reforming
of natural gas / coking coal
Direct combustion of hydrogen8.5
(High dependence.; No
easy alternatives)
Negative economic gap until approaching
natural gas parity (with reduction value)
Clear GHG advantage
Economic gap score
Non-economic attractiveness
GHG emission reduction
KEY

Advisian 88
:

Australian hydrogen market study Advisian
5.4 Activities to accelerate hydrogen market development
Based on the analysis conducted during this study, the areas where pro-active and pre-emptive action
are likely to accelerate and support the development of an Australian hydrogen economy were
identified. We summarise our observations and rationale in Table 5-1 below.
Table 5-1 Summary of hydrogen economy enabling activities
Activity title Description of suggested activity Likely impact and reason for action Relative
importance
(0-10)
TUoS and grid
stabilisation service
fee interpretation
Develop market guidance regarding
forecast TUoS and grid stabilisation
service fees as they relate to systems
with more renewables / greater
intermittency.
Provides certainty regarding costs /
service revenues that are needed to
underwrite business cases.
9
Enable common user
pipeline
infrastructure
Consider the potential for central
investment in pipelines with commercial
returns once assets fully utilised.
Enables multiple producers and users
without first mover cost burden.
9
Definition of “Origin
certification”
Clarify proposed “certification” method
and target ranges
Provides definition of products for
cost and GHG benchmarking.
9
Hydrogen recovery
from blended
networks
Demonstration of H2 product quality
after mingling with natural gas and
odorants such as mercaptans.
H2 recovery can be used to stabilse
the H2 concentration in a feed to a
“gas peaker” plant and would yield
locations for high quality H2
distribution / dispensing for vehicles.
8
Demonstration of
remote power
systems
Demonstration of H2 based remote
power systems. Support for investment
in a few larger scale (5 – 25 MW)
systems.
Reduce anxiety about the high
upfront costs and demonstrate the
benefits.
8
Use of green energy
certificates for green
hydrogen
Confirm how much time-based
alignment between generation and
consumption of renewable electricity is
required in order to be classified as
green. This could be managed by the
Clean Energy Regulator in a similar way
to the LRET scheme.
Provides confidence that green
energy certificates will remain as a
regulatory provision post 2030.
Provides clarity regarding approach to
“origin certification”.
8
Standardisation of
electrolyser unit
capacity definition
Standardised on basis of costing metrics
– Start of Life (SOL), End of Life (EOL),
Average or power demands at stack or
unit level or flowrate (Nm³/h / kg/h).
Improves reporting consistency and
industry confidence.
8
Gaseous hydrogen
(GH2) and liquid
hydrogen (LH2)
dispensing stations
regulations
Confirm regulatory framework for
design of GH2 and LH2 dispensing
stations
Provides certainty regarding a key
portion of near-term infrastructure.
7
Ammonia steel and
alumina sector
readiness
Undertake studies regarding the
capacity of key sectors to accept
intermittent / multi-day supply of excess
hydrogen production.
Enable hydrogen export projects to
plan where to direct production in the
event of export facility outage and
builds knowledge around end-use
7

Advisian 90
:
sector readiness. / management of
excess renewable energy generation
Establishment of
hydrogen refuelling
hubs
Use a baseline demand from a back to
base, heavy vehicle fleet to establish
refuelling facilities at strategic locations
with costs shared in a way that supports
demand development.
Enable investment in hydrogen fleets
and support uptake by smaller
operators of hydrogen vehicles
7
Establishment of
hydrogen distribution
networks for
transport
Create the initial hydrogen distribution
system to enable hydrogen refuelling
for heavy transport back to base
applications. Charge users on a volume
delivered basis as demand is
established.
Avoid first mover cost disadvantage
for hydrogen based trucking and
installation of truck filling stations.
7
Crude oil refinery
diversification
Assess mechanisms for crude oil
refineries to reduce dependence on
aviation fuel margins and natural gas
imports. Diversification into biofuel and
hydrogen production.
Enable refineries to transition rather
than scale back / shutdown. Unlocks
the great potential of tankage and
port access. Keeps vital infrastructure
alive.
7
End user sensitivity to
H2 variability
including gas peaker
power generators
Assess the impact of changing H2
concentration in blended networks of
end users, in particular gas peakers.
Determines the practicality of high
concentration H2 / gas blends, and
practicality of lowering emissions in
the natural gas network
7
GH2 and LH2
transport regulations
Confirm regulatory framework for
transport of GH2 and LH2.
Provides certainty regarding a key
portion of near-term infrastructure.
6
Develop a value for
oxygen
Demonstrate the role of electrolytic
oxygen for wastewater treatment and
sulphuric acid production.
Reduces hydrogen production costs
by valuing by-product
6
Greening marine fuel
infrastructure.
Conduct studies to determine what is
needed to transition marine fuel system
to low carbon green export centres.
Keeps vital infrastructure alive and
validates public good interests.
6
Define green
hydrogen
Define maximum GHG emissions
associated with green pathway.
Enables standardisation and provides
sector confidence.
6
Direct and
photovoltaic
hydrogen production
Support research behind direct solar (i.e.
Heliostat) and photovoltaic hydrogen /
carbon monoxide production.
Australia is a world leader and could
gain IP / early adopter advantages.
5
Water offtaker social
licence to operate
obligations
Develop guidelines regarding when
water must be sustainably sourced.
Reduces anxiety regarding
competition for town water and
agriculture.
5
AEMO ISP to include
H2 industry
provisions
Support AEMO modelling to include H2
generation and H2 peaker generator
plant provisions.
Greater visibility to industry
participants yields greater investment
confidence.
4
Direct ammonia
production and
decomposition
Support research behind direct
ammonia production and
decomposition.
Australia is a world leader and could
gain IP / early adopter advantages.
4
H2 based aviation Enable H2 based aviation using
turboprop engines and fuel cells.
Hasten the arrival of low emissions
aviation.
4

Australian hydrogen market study Advisian
6
Key concepts explained

Advisian 92
:
6 Key concepts explained
The below explanation of key concepts provides a framework for the above analysis
touching on key assumptions and definitions used to form the basis of the hydrogen
production and economic gap assessments.
6.1.1 “Water splitting” electrolysis
Using electrolysers for water splitting is a technology that uses an electrical charge to split water (H2O)
into hydrogen (H2) and oxygen (O2). This is often termed green hydrogen, since the key inputs to this
process - renewable electricity and demineralized water, can be produced sustainably.
Fundamentally, the electrolysis process converts electrical energy into chemical energy stored in
hydrogen, according to the reversible reaction:
2 HR2ROR(l)R → 2 HR2(g)R + OR2(g)
Theoretically, the minimum energy required to drive this reaction is equivalent to hydrogen’s higher
heating value (HHV) when combusted in air, which is 39 kWh/kg of hydrogen.
Figure 6-1 shows a simplified typical schematic of a typical water splitting electrolysis unit.
Figure 6-1 – Schematic of typical “water splitting” electrolysis unit
Electrolyser
-+
Water separation
Vent
Electrical supply
Water separation
Oxygen
Hydrogen
Raw water
196 kg/h
1764 kg/h
Initial compressor
BoP power
30 barg
Purification & dehydration
0.86 MW
SOL - 9.18 MWEOL - 10.10 MW
Average - 9.64 MW

Australian hydrogen market study Advisian
6.1.2 Demand – Supply framework
A key purpose of this study is to define the economic gap for different industry sectors. We define this
as the difference between the rational price the users for key applications within a sector would be
willing to pay and the potential supply price. The supply price is dependent upon where in the delivery
pathway an end user sits.
In this assessment, the relative competitiveness is characterised by the equivalent cost of fuel using the
incumbent technology.
The demand – supply cost framework that is used in this study is summarised in Figure 6-2.
Figure 6-2 – “Demand – supply” cost framework used for this study
6.1.3 Thermal price parity
The thermal value of a fuel characterises the
cost to yield a quantum of energy via
combustion. The prevailing thermal fuel
source is natural gas. For large consumers, the
cost of natural gas on the East coast of
Australia currently ranges between $8 and
$10/GJ. The price is expected to trend
upwards towards $14/GJ by 2030 and remain
at around this price up to 2050.
When hydrogen is combusted, it can yield
120 MJ/kg. Using this metric, it is possible to
compare the thermal value of hydrogen for
different supply prices – see insert.
The green hydrogen production cost that
achieves cost parity with large scale natural
gas on the East coast of Australia is ≈$1.1/kg.
Transport
Production
Loading
/ Filling
station
Farm gate cost
Compression
and storage
Delivered cost
Dispensed cost
Supply price
Thermal fuel with minimal transport
Nat. gas
blending
Co-located
demand
Grid balancing
CHP
Remote power
Industrial
offtakers
Thermal fuel with some transport / storage
Fuel cell value with transport and loading
Industry
with H2 as
feedstock
Transport
end-uses
Export
paths
Chemical value with some transport / storage
Economic
gap
Capacity to pay
Combustion value of fuels
If hydrogen is combusted for heat value it competes with coal
and natural gas as heat providers. The relationship between
hydrogen cost (on mass basis) as compared with other fuels is
provided below.

Advisian 94
:
If hydrogen is used to yield electricity through a fuel cell with 65% efficiency, the energy yield is
218 MJ/kg. The fuel cost for such as
system - with hydrogen at $2/kg, is
comparable to large scale combined
cycle gas turbine based electricity costs
– see insert.
When comparing the time frame that
fuel price parity is achieved against
different fuels, the non-economic values
such as: GHG emissions, safety,
convenience, reliability and operability
must be considered and will have a significant influence on user uptake.
6.1.4 Centralised Vs decentralised production
There are two potential pathways for the development of green hydrogen production facilities. A
schematic illustrating the key differences between these approaches is provided in Figure 6-3.
The centralised approach
transfers power from
renewable farms as
electrons to a single
hydrogen production facility
– termed “move the
electrons”. This approach is
likely to be cost effective
when the existing
transmission network is
strong enough to support
the additional demand
without significant
augmentation. A
development of this type
will target higher load
factors in order to minimise
network impacts and
minimise the hydrogen
storage requirements. It will,
however, require more
continuous, and therefore
more expensive, power
supply, when demand is out
of sync with available
renewable generation sources.
The decentralised approach develops either one or multiple remote hydrogen production facilities
adjacent to renewable energy farms. The hydrogen production facilities can be connected behind the
meter. The resulting hydrogen is transported by pipeline to the end user or offtaker – termed “move the
molecules”. In the short term, this approach is likely to be most cost effective when network constraints
do not impede the monetisation of excess electricity through the sale into the market of generated
power above the capacity of the electrolyser.
Electricity cost comparison
Reference units Energy units
Electricity - Renewable farm 40 $/MWh 11.1 $/GJ
Electricity - Large user 100 $/MWh 27.8 $/GJ
Electricity - Residential 240 $/MWh 66.7 $/GJ
Fuel cell (ŋ = 65%) with $2/kg H2 92 $/MWh 25.6 $/GJ
Figure 6-3 – Comparison of centralised and decentralised approaches
Renewable electricity
Hydrogen production facility (HPF)
Raw water
NEM
Centralised approach
End user/s
Pip
elin
e
Hydrogen production facility (HPF A)
Renewable electricity
Raw water
Renewable electricity
Raw water
Other hydrogen
production Hydrogen production
facility (HPF B)
Decentralised approach

Australian hydrogen market study Advisian
6.1.5 Capacity factor and load factor
Renewable energy generation is subject to variability and intermittency. Solar PV is comparatively
predictable with generation constrained to daylight hours and subject to seasonal and cloud variations.
Wind generation is responsive to wind speed with large inter-day variability. The amount of energy that
renewable generators can produce is set by intermittency and variability.
Capacity factor is defined as the ratio of actual energy output over a given period to the rated capacity
possible over that period. Usually this is over a one-year period encompassing all 8760 hours of the
year. This factor is generally applied to renewable generation facilities to indicate how much power is
generated relative to the rated capacity.
Load factor is essentially the same calculation as capacity factor however it is applied to the production
output of the electrolysis plant. This is the ratio of the amount of hydrogen produced over a given time
period over the maximum possible hydrogen that can be produced within that period – typically a year.
Note that the capacity factor of renewable generation and the load factor of the electrolysis plant are
not always the same. For further explanation, refer to Section 2.3.1 and Figure 2-7.
6.1.6 Carbon neutral carbon dioxide
The concept of carbon neutral
carbon dioxide sounds perverse
but is a relatively simple concept
where carbon dioxide is captured
from the atmosphere, directly
offsetting carbon dioxide emitted
from combustion of the resulting
fuel. Biomass is a good example of
a fuel which uses carbon neutral
carbon dioxide to create the fuel.
The carbon content in the biomass
has been sourced from the
atmosphere by the growing plants.
Direct Air Capture (DAC) is an
industrial mechanism for capturing
carbon dioxide from the
atmosphere. If the carbon capture
process uses renewable energy to
drive the process, then the
captured CO2 is considered carbon
neutral.
The biomass and direct air capture
pathways are characterised in
Figure 6-4.
DAC is an emerging technology, with capture costs between US$94 - $232/ton CO2 near-term, and
predicted to drop below to drop below US$60 by 2040 (Hydrogen Council, 2020).
Figure 6-4 – Comparison of carbon neutral fuel pathways
MethanationCO2
Direct air
capture
“Green” fuel
H2
H2O
Biomass growth
“Green” fuel
DAC pathway
Biomass pathway

Advisian 96
:
6.1.7 Total direct costs Vs total installed costs
Total direct costs (TDC) associated with an
engineering project are all costs that can be directly
attributed to the design, procurement and
installation of an asset. Other synonyms for this
metric are: Total delivered costs and “delivered”
cost. The costs can generally be attributed based on
capacity and activity count. Examples of direct cost
elements include:
• Purchased equipment;
• Bulk materials;
• Scrapped and reworked product;
• Engineering contractor labour;
• Direct human labour – Civil work and
equipment installation;
• Direct supervision of personnel.
The capital costs reported for electrolysis units and power generation are on a Total Direct Cost (TDC)
basis (often termed “delivered cost”), but calculations used to determine the levelised cost of hydrogen
are based on Total Installed Cost (TIC).
Total installed costs (TIC) consist of the total
direct costs plus all other costs which can be
attributed to the project.
Examples of the indirect cost elements include
the following:
• Utilities;
• IT systems and networks;
• Procurement and management services;
• Common distributables e.g.
accommodation for contract labour;
• Taxes;
• Legal functions;
• Warranty and guarantees;
• Owners team and quality assurance costs;
• Accounting functions;
• Marketing and publicity;
• Contingency.

Australian hydrogen market study Advisian
Acronyms and abbreviations References

Advisian 98
:
Acronyms and abbreviations
Acronym / abbreviation Definition
€ Euro = AUD / 0.621
A$ Australia dollar
ABS Australia bureau of statistics
AC alternating current
ACCC Australian Competition and Consumer Commission
ACT Australian Capital Territory
AE Alkaline Electrolysis
AEM Anionic exchange membrane
AEMO Australian Energy Market Operator
ARENA Australian Renewable Energy Agency
AS Australian Standard
ASTM American Society for Testing Materials
barg Unit of pressure
BAT Best available technology
BEV Battery electric vehicle
BF Blast Furnace
Black (or grey) hydrogen Hydrogen production pathway which yield hydrogen without
managing the resulting GHG emissions
Blue hydrogen Hydrogen production pathway which implies a reduction in GHG
intensity though carbon dioxide capture and use / storage
BNEF Bloomberg New Energy Finance
BOF Basic Oxygen Furnace
BTM Behind the meter
C Celsius
CEFC Clean Energy Finance Corporation
CO Carbon monoxide
CO2 Carbon dioxide
CO2-e Carbon dioxide equivalent
COAG Council of Australian Governments
COPVs Composite Overwound Pressure Vessels
CSIRO Commonwealth Scientific and Industrial Research Organisation

Australian hydrogen market study Advisian
Capex Capital expenditure
CCS Carbon Capture and Storage
CCUS Carbon Capture Utilisation and Storage
CHP Combined heat and power
CNG Compressed natural gas
DC Direct current
DME Dimethyl Ether
DoE Department of Energy
DRI Direct Reduced Iron
DUoS Distribution use of system
EAF Electric Arc Furnace
EEDI Energy Efficiency Design Index
EHS Electrochemical Hydrogen Separation
EOL End of Life
EPC Engineer Procure Construct
EU European Union
FCEV Fuel cell electric vehicle
GHG Greenhouse gas
GJ gigajoule (1,000,000,000 Joules)
Green hydrogen Hydrogen production pathway which implies a high threshold based
on renewable based power to yield electrolytic hydrogen.
GW Gigawatt
HBI Hot Briquetted Iron
HFO Heavy Fuel Oil
HHV higher heating value
HRS Hydrogen refueling station
H2 Hydrogen
IATA International Air transport Association
ICE Internal Combustion Engine
IEA International Energy Agency
IMO International Maritime Organization
IP Intellectual Property
IRENA International Renewable Energy Agency
ISO International Organisation for Standardization

Advisian 100
:
ISP Integrated System Plan (AEMO document)
kgmol kilogram-mole
km kilometre
kV kilo-Volt
ktpa kilotonnes per annum
kW kilo-watt (1,000 watts of electrical power)
kW h kilo-watt hour (a kilowatt of power used in an hour (3.6MJ)
L Litre
LCOE Levelized cost of energy
LCOH levelized cost of hydrogen
LNG Liquefied Natural Gas
LPG Liquified Petroleum Gas
LOHC liquid organic hydrogen carrier
m metre
mCHP Micro Combined heat and power
MCPs Multi-Cylinder Packages
MEPC Marine Environment Protection Committee
MGO Marine Gas Oil
MHFs Major Hazard Facilities
MJ megajoule (1,000,000 Joules)
ML Mega litre
MLF Marginal loss factor
MMBtu Metric Million British Thermal Unit
Mtonnes megatonnes
Mt Millions of tonnes
Mtpa Million tonnes per annum
MW megawatt (1,000,000 watts of electrical power)
MWh megawatt hour
NG Natural gas
NOx Nitrogen oxides
NPV Net present value
NT Northern Territory
NSW New South Wales

Australian hydrogen market study Advisian
OEM Original equipment manufacturer
OHLE Overhead line electrification
Opex Operational expenditure
O&M Operation and maintenance
O2 Oxygen
PCEC Protonic ceramic electrochemical cell
PEM Proton Exchange Membrane
PEFC Polymer electrolyte fuel cell
PJ petajoule (1,000,000,000,000,000 Joules)
PHEV Plug in hybrid electric vehicle
PM Particulate matter
PPA Power purchase agreement
PSA Pressure Swing Absorption
psi pound per square inch
PV Photovoltaic
QLD Queensland
RED II Renewable Energy Directive II
SA South Australia
SAF Sustainable Aviation Fuels
SCR Selective Catalytic Reactor
SEEMP Ship Energy Efficiency Management Plan
SMR Steam methane reformer/ reforming
SNG Synthetic natural gas
SOEC Solid oxide electrolyser cell
SOL Start of Life
SOx Sulphur oxides
TDC Total delivered cost
TES Thermal energy storage
TIC Total installed costs
tpa tonnes per annum
tpd tonnes per day
TRL Technology Readiness Level
TUoS Transmission Use of System charges

Advisian 102
:
TWh terawatt hour
US United States
US$ US dollar where USD = AUD / 0.695
USD US dollars
VLSO Very-Low Sulphur Fuel Oil
WA Western Australia
v/v Volume per volume percentage

Australian hydrogen market study Advisian
References
Agarwal, R. A. (2019). Pollutants from Energy Sources: Characterization and Control. Singapore: Springer
Nature Singapore Pte Ltd.
Allied Market Research. (n.d.). Global Bunker Fuel Market Forecasted to Reach $273,050.4 Million by 2025.
Retrieved October 05, 2020, from Allied Market Research:
https://www.alliedmarketresearch.com/press-release/bunker-fuel-market.html
Alstom. (2018). Cordia iLint - the world's 1st Hydrogen powered train. Retrieved August 31, 2020, from
Alstom: https://www.alstom.com/our-solutions/rolling-stock/coradia-ilint-worlds-1st-hydrogen-
powered-train
Argonne. (n.d.). Energy Systems. Retrieved September 2020, from Argonne:
https://hdsam.es.anl.gov/index.php?content=hdsam
Argonne National Laboratory. (2019, March). Total Cost of Ownership for Line Haul, Yard Switchers and
Regional Passenger Locomotives - Preliminary Results. Retrieved August 2020, from Energy
Department, USA: https://www.energy.gov/sites/prod/files/2019/04/f62/fcto-h2-at-rail-
workshop-2019-ahluwalia.pdf
Australian Bureau of Statistics. (2019). Survey of Motor Vehicle Use, Australia, 12 months ended 30 June
2018.
Bloomberg NEF. (2020). Hydrogen Economy Outlook: Key Messages. Bloomberg NEF.
Clayton Utz. (2019). Hydrogen Industry Legislation. COAG Energy Council.
CleanSky2. (2020). Hydrogen-powered aviation. Retrieved from https://www.cleansky.eu/news/hydrogen-
powered-aviation-preparing-for-take-off
COAG Energy Council. (2019). Issue Paper Series - Gaurantees of Origin. COAG Energy Council.
Collins, L. (2020, March 19). A wake-up call on green hydrogen: the amount of wind and solar needed is
immense. Retrieved July 14, 2020, from Recharge - Energy Transition.
European Commission . (2020). A hydrogen strategy for a climate-neutral Europe. European Commission.
European Union. (2018, December 24). DIRECTIVE 98/70/EC OF THE EUROPEAN PARLIAMENT AND OF
THE COUNCIL of 13 October 1998 relating to the quality of petrol and diesel fuels and amending
Council Directive 93/12/EEC. Retrieved September 17, 2020, from https://eur-
lex.europa.eu/legal-content/EN/TXT/?uri=CELEX:01998L0070-20151005
EVIE Networks. (2019, December). Lesson Learnt Report - December 2019. Retrieved November 10, 2020,
from Australian Renewable Energy Agency: https://arena.gov.au/assets/2019/05/evie-networks-
lessons-learnt-report-december-2019.pdf
Future Fuels CRC. (2019). RP1.1-03 Learning from 19 plans to advance hydrogen from across the globe -
Report summary. Retrieved March 2021, from https://www.futurefuelscrc.com/wp-
content/uploads/RP1.1-03-two-pager_DIIS.pdf
GE. (2018, October 24). Leading The Charge: Battery-Electric Locomotives Will Be Pushing US Freight
Trains Further. Retrieved September 21, 2020, from GE:
https://www.ge.com/news/reports/leading-charge-battery-electric-locomotives-pushing-us-
freight-trains

Advisian 104
:
Graham , P. W., & Smart (ACIL Tasman), A. (2011, November). Possible Futures: Scenario Modelling of
Australian Alternative Transport Fuels to 2050. Retrieved from
https://publications.csiro.au/rpr/download?pid=csiro:EP116462&dsid=DS4
Graham, P. e. (2018). GenCost 2018 – updated projections of electricity generation technology costs.
Canberra: CSIRO.
Hamish Andrew Miller, K. B.-H. (2019). Green hydrogen from anion exchange membrane water
electrolysis: a review of recent developments in critical materials and operating conditions. 4.
Hydrogen Council. (2017). Hydrogen Scaling up: A sustainable pathway for the global energy transition.
Hydrogen Council.
Hydrogen Council. (2020). A cost perspective. Path to hydrogen competitiveness.
Hydrogen Council. (2020). Pathway to Hydrogen Competitiveness: A cost perspective. Hydrogen Council.
IEA. (2019). The Future of Hydrogen. Paris: International Energy Agency.
International Civil Aviation Organization, Civil Aviation Statistics of the World and ICAO staff. (2020). The
World Bank. Retrieved from World Bank Open Data: https://data.worldbank.org/
ITP, Pitt and Sherry, Institute for Sustainable Futures. (2019, November). Renewable Energy Options for
Industrial Process Heat. Retrieved September 17, 2020, from Australian Renewable Energy
Agency: https://arena.gov.au/assets/2019/11/renewable-energy-options-for-industrial-process-
heat.pdf
Krukowska, E. (2020, July 10). BNEF – Hydrogen’s Role in Europes Future Becomes a Little Clearer .
Retrieved July 14, 2020, from Bloomberg Qunit:
https://www.bloombergquint.com/markets/hydrogen-s-role-in-europe-s-future-becomes-a-
little-clearer
Man Energy Solutions. (n.d.). Engineering the future two-stroke green-ammonia engine, .
PowerCor. (2015, January). Customer Selection Guide - Indicative Powerline Construction Costs. Retrieved
November 10, 2020, from PowerCor: https://media.powercor.com.au/wp-
content/uploads/2018/11/26095348/customer-s-selection-guide-indicative-powerline-
construction-costs.pdf
Repsol. (2019). IMO 2020. Retrieved October 05, 2020, from Repsol.com:
https://www.repsol.com/imagenes/global/es/HR08052019_IMO_CNMV_tcm13-155237.PDF
S&P Global Platts. (2020, July 27). NET ZERO: Mining faces pressure for net-zero targets as demand rises
for clean energy raw materials. Retrieved from S&P Global Platts:
https://www.spglobal.com/platts/en/market-insights/latest-news/coal/072720-mining-faces-
pressure-for-net-zero-targets-as-demand-rises-for-clean-energy-raw-materials
Standards Australia. (2018). Hydrogen Technologies Standards: Discussion Paper. Standards Australia.
V.Esposito, D. (2017). Membraneless Electrolyzers for Low-Cost Hydrogen Production in a Renewable
Energy Future. 1(4).