understanding the hydrogen market and its opportunities
TRANSCRIPT

Understanding the Hydrogen Market and its
opportunities for Cogeneration
JUNE 2021

Co
nte
nt 01. Current context for hydrogen in Spain
02. Potential uses of hydrogen adapted to
cogeneration
03. Hydrogen production and logistics models to
supply cogeneration plants
04. Analysis of currently available technologies
05. Main barriers and benefits in the hydrogen market for cogeneration
07. Conclusions
06.Business opportunities for cogeneration with Hydrogen

01.
Current context for hydrogen in Spain
H2 Value chain
Spanish H2 market
Hydrogen opportunities in Spain
Hydrogen Roadmap
Fundable hydrogen projects
Context of hydrogen in Cogeneration
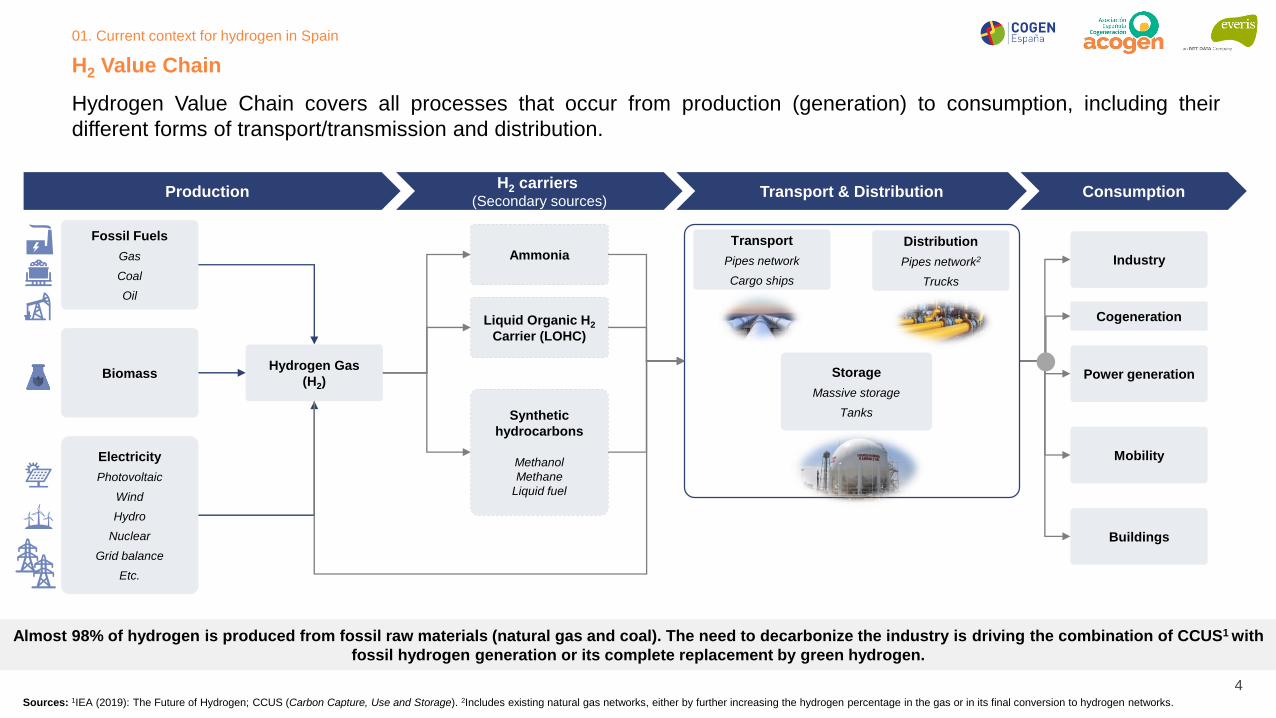
Almost 98% of hydrogen is produced from fossil raw materials (natural gas and coal). The need to decarbonize the industry is driving the combination of CCUS1 with
fossil hydrogen generation or its complete replacement by green hydrogen.
Hydrogen Value Chain covers all processes that occur from production (generation) to consumption, including their
different forms of transport/transmission and distribution.
Sources: 1IEA (2019): The Future of Hydrogen; CCUS (Carbon Capture, Use and Storage). 2Includes existing natural gas networks, either by further increasing the hydrogen percentage in the gas or in its final conversion to hydrogen networks.
ProductionH2 carriers
(Secondary sources)Consumption
Industry
Power generation
Mobility
Buildings
Hydrogen Gas
(H2)
Fossil Fuels
Gas
Coal
Oil
Electricity
Photovoltaic
Wind
Hydro
Nuclear
Grid balance
Etc.
Biomass
Ammonia
Liquid Organic H2
Carrier (LOHC)
Synthetic
hydrocarbons
Methanol
Methane
Liquid fuel
Cogeneration
Transport & Distribution
Transport
Pipes network
Cargo ships
Distribution
Pipes network2
Trucks
Storage
Massive storage
Tanks
H2 Value Chain
01. Current context for hydrogen in Spain
4

Nationally, some 500,000 tons of hydrogen are consumed today (5th Country in the EU), of which 81% are destined for the
oil refining industry, and 95% are fossil in origin (grey hydrogen)
H2 market in Spain – General overview
Sources: 1Hydrogen Europe: Clean energy – Monitor 2020; 2Fuel Cells and Hydrogen Observatory; 3HyLaw: Informe de Recomendaciones Legislativas para el Sector del Hidrógeno en España
79.154
505.520
411.563
14.591
Ammonia Refining Methanol
108 56
Other chemicals
H2O2
48
Energy Total T/Year
Hydrogen Production Plants1
There are currently 31 plants operating throughout the national territory
Hydrogen Consumption2
Annual hydrogen consumption is around 500,000 Tons per year, with the refining sector
demanding the most.
Hydrogen Production2
• About 95%3 of the hydrogen consumed in
Spain is within the environmental category of
hydrogen "grey".
• More than 50% of hydrogen is produced and
consumed at the facility.
• The current turnover of hydrogen
technologies in Spain is approximately 594
M€3 per year.
54%
40%
6%
Merchant
By-product
On-site
01. Current context for hydrogen in Spain
5
Merchant: Direct sale to market
By-product: Indirect production
On-site: Consumption at same location as production

During next decade, demand for green hydrogen in Spain is expected to be 13% higher than current demand for
Hydrogen.
Sources: 1(2019-Endesa): El papel del almacenamiento en la transición energética hacia un sistema descarbonizado. Jornada sobre almacenamiento con energías renovables. 2Fuel Cells and Hydrogen Joint Undertaking (FCH) 2020:
Opportunities for Hydrogen Energy Technologies Considering the National Energy & Climate Plans.
Notes: 1 kg of H2 equals 33.3 kWh of energy; 58 kWh of electricity is needed to produce 1 kg of H2. 3The EUCO3232.5 scenario is part of a group of EUCO scenarios used in the development of EU energy and climate policy.
2,1
6,4
0,2
1,8
1,7
5,6
0,1
3,2
0 1 2 3 4 5 6 7 8 9 10 11 12 13 14 15 16 17
Low demand scenario
High demand scenario
Industry Mobility and Transport
Residential & service sector Electricity generation
Estimated demand for renewable H2 in Spain by 2030 (TWh/year)2
o By volume, the main uses to which the H2 produced would be the
industry (oil refining and production of ammonia) and
mobility/transport.
o Cogeneration could be added to the consumption of this
hydrogen by providing heat and surplus electricity to the
industrial, residential and tertiary sector.
H2 market in Spain – Renewable H2 demand evolution in Spain for 2030
4,1 TWh/y ~ 136.000 tH2
17 TWh/y ~ 566.000 tH2
8 TWh/year of
electricity would
be needed33 TWh/year of
electricity would
be needed
To produce the current demand Spain (500,000 t/year), about 29 TWh/year of
electricity is required
Fuel Cells and Hydrogen Joint Undertaking2 estimates two renewable
hydrogen demand scenarios by 2030:
• Low scenario: Renewable hydrogen accounts for 0.5% of final total
energy demand (i.e., 4.1 TWh/y of 868 TWh/y) or 3.4% of final gas
demand (120 TWh/y), according to EUCO3232.53.
• High scenario: Renewable hydrogen accounts for 1.9% of final total
energy demand (i.e., 16.9 out of 868 TWh/y) or 14.0% of final gas demand
(120 TWh/y) according to EUCO3232.53.
Both scenarios assume that renewable hydrogen would partially replace
current conventional production and additional demand (e.g., in the transport
sector) by 2030. Specifically:
Currently, in Spain conventional hydrogen used mainly in the industry is produced from
fossil fuels (e.g., by steamed methane reform) or is a by-product of other chemical
processes.
To produce the hydrogen indicated in the high-demand scenario (566,000 t/year),
about 33 TWh/year of electricity is required
01. Current context for hydrogen in Spain
6

Based on the increase in installed RES capacity established in the PNIEC by 2030, both the use of discharges into the
grid from the seasonal surplus of electricity production, and the development of off-grid plants dedicated to its
production, will ensure the production of green hydrogen in Spain.
Sources: 1(2019-Endesa): El papel del almacenamiento en la transición energética hacia un sistema descarbonizado. Jornada sobre almacenamiento con energías renovables. 2Fuel Cells and Hydrogen Joint Undertaking (FCH) 2020: Opportunities for Hydrogen Energy
Technologies Considering the National Energy & Climate Plans.
Notes: 1 kg of H2 equals 33.3 kWh of energy; 58 kWh of electricity is needed to produce 1 kg of H2.
NEW RENEWABLE POWER PNIEC 2030
• If the target set in the PNIEC for renewable boost (RES) is met, the installed capacity
and electricity generation planned for 2030 will triple in the system.
• From 120 TWh (68% RES-E) the system will have a risk of saturation, increasing
spills. This surplus can be used for H2 production.
• In addition, part of this new renewable project portfolio, which is expected to be
installed in Spain, will be dedicated exclusively to the production of green hydrogen.
• There will be a need for flexibility and manageability in the system, something to
which cogeneration will contribute.
23
49
36
7
1
0
10
20
30
40
50
60
70
80
90
100 94 GW
24
2015
2
PNIEC 2030
30 GW
PHOther RES CSP Wind
GW
65 TWh 0
10
20
30
40
50
60
70
80
0 2008020 6040 140100 120 160 180
Dis
ch
arg
es
(T
Wh
)
New renewable production (TWh)
Target
scenario 2025
Target
scenario 2030
207 TWh
x 3
H2 market in Spain – Renewable surplus impact in the growth predictions
18 TWh of
surplus for
2030
ESTIMATED SURPLUS DISCHARGES TO THE NETWORK1
01. Current context for hydrogen in Spain
7

OPPORTUNITI
ES FOR SPAINDevelopment of value chains in the
economy
Position Spain as a technological reference through
the creation of industrial value chains associated
with H2. Competitive renewable energy resources could
allow the export not only of green hydrogen, but also the
development of low carbon footprint production
processes based on green hydrogen.
Becoming a European renewable energy
reference
Due to advantageous weather conditions and large open
grounds for the installation of renewable energy production
plants, Spain has a competitive advantage to deploy solar
and wind technologies, both on land and at sea.
Renewable H2 can play an important role in making Spain a
major exporter of renewable energy.
Decarbonization of isolated energy systems
Due to physical restrictions and access to energy in these
territories, renewable hydrogen will play a relevant role as a source
of seasonal storage of electricity.
Processes and sectors that are hard to
decarbonize
To reach the milestones of a climate-neutral
economy by 2050, H2 is a cornerstone for
reducing greenhouse gas emissions in sectors or
processes where electrification is not a viable
option.
Allow greater penetration of renewable
energy
Intermittent sources of renewable energy pose a
challenge to the management of a system with an
increasing proportion of renewable electricity.
Renewable hydrogen is positioned as a solution
for large-scale seasonal energy storage.
Reducing international energy dependence
Local renewable hydrogen production reduces dependence
on imports of fossil energy products, thus improving energy
balance.
Spain’s large capacity to produce renewable energy makes it a leading European potential in the production and export
of green hydrogen.
Hydrogen opportunities in Spain
01. Current context for hydrogen in Spain
8
Broad opportunities for use
Given the versatility of H2 use, it is highly aligned with the objectives of the European Green
Deal, the decarbonisation of the gas sector and therefore of all sectors associated with
gas infrastructure (domestic, commercial, mobility, industries, generation, etc.).

Hydrogen
Strategy
Production
Key milestones
4
GW
25%
28%
2030 VISION 2050 VISION
Industry
Transport
Minimum renewable hydrogen contribution to total hydrogen consumption
Share of renewable energy in final energy consumption of transport
6 GW installed
1 Mton production capacity
40 GW installed
10 Mton production capacity
Installed Capacity 0,3 – 0,6 GW in 2025 Installed Capacity in 2030
150 - 200
5.000 – 7.500
100 - 150
2 Lines
5 Ports/Airports
Fleet of fuel cell buses
Light and heavy vehicles
Deployment of hydrogen charging stations
Non-electrified business lines
Hydrogen-based handling equipment
2020 2025 2030 2050
Establishment of Hydrogen
economy…
• Spain positions itself as a
large producer and
exporter of renewable
hydrogen for Europe...
• Technological improvement
and economies of scale as
key levers to decarbonize
and electrify the industrial
and transport sectors...
• The use of renewable
hydrogen as a solution for
seasonal energy storage is
key to unlocking the
penetration of a higher
proportion of renewable
energy...
Hydrogen
Roadmap
2030
Sources: “Hoja de ruta del hidrógeno: un compromiso con el hidrógeno renovable” - Note: The Roadmap also expects commercial hydrogen projects to be operational by 2030 for electricity storage and/or the use of surplus renewable energy according to the
guidelines set out in the Storage Strategy.
Spain proposes the Hydrogen Roadmap which will mobilize 8.900 million euros in investments to meet the 2030
objectives.
Hydrogen Roadmap
01. Current context for hydrogen in Spain
9

Hydrogen Projects that will be financed in Spain:
1. Innovative value chain and knowledge, including R&D activities and early deployments
• Improvement of productive capacities, prototyping, application deployment, distribution and refueling infrastructure, etc..
2. Cluster projects with the collaboration of different actors in development and execution
• Large-scale production, processing and consumption of renewable hydrogen in a unique place. (It should be located in areas that absorb more than
10k tons per year).
3. Pioneering sectoral integration projects
• Hydrogen production and use, allowing a first-of-a-kind demonstration in the final phase of a first industrial/commercial deployment in an enterprise
environment (You must consume approx. 1k tons per year).
Production Logistics (T&D) Use (Offtaker)
R&D and Innovative Knowledge
A consortium covering the entire hydrogen value chain will have greater potential to be a tractor project
• Industry, Residential
• Mobility
• Re-electrification, storage
The Government will allocate more than 1.5 billion to boost renewable hydrogen by 2023 through the European
Recovery Fund.(1)
Fundable hydrogen projects
(1) The government launched in December 2020 a "Manifesto of Interest" to know tractor projects and relevant actors in renewable hydrogen, obtaining the knowledge associated with the entire renewable hydrogen value chain.
01. Current context for hydrogen in Spain
10

In this context, while Spain's energy transition situation does not support the development of cogeneration, renewable
hydrogen could boost the renewal of cogeneration plants and boost the sector.
Context of hydrogen in Cogeneration
Evolution of instal led cogeneration power by
fuel type(MW) (1)
6.143
5.239
4.373
3.670
2015 20302020 2025
- 40%
(1) Based on data published by PNIEC 2021 – 2030 (Plan Nacional Integrado de Energía y Clima)
At the nat ional leve l , the cogenerat ion fac i l i ty park should adapt
its technology and eff iciency , wi th a clear short - term renovat ion
f ramework .
The regulations must provide legal certainty and stabil i ty , in
order to undertake the necessary investments to adapt the
cogenerat ion park and mainta in compet i t iveness .
There is sti l l no clear commitment of the PNIEC to
cogenerat ion, despi te being more eff ic ient than gas thermal
groups, for which the PNIEC has mainta ined the insta l led
generat ing capaci ty .
I t creates some uncertainty around the future of
cogeneration
Opportunities for
Cogeneration with
the boost of
renewable hydrogen
Situation of Cogeneration within the PNIEC
Regulatory changes , such as the inc lus ion of programs for equipment to admit a certa in % of H2,
cert i f icates of or ig in, ad hoc auct ions, etc. , would help to address the investment needed to adapt
technology and renew plants for hydrogen consumption , just as European and nat ional subsid ies can
play a key role in th is .
The use of renewable hydrogen as a natural gas substitute fuel helps reduce the carbon footpr int and
al lows cogenerat ion to play i ts part in decarbonizat ion targets .
The use of renewable hydrogen not consumed in the cogenerat ion plant can be used as a long-term
renewable energy storage system (Power- to-power) , providing flexibi l i ty to the grid in the face of the
forecast of increased seasonal renewable energ ies.
01. Current context for hydrogen in Spain
11

Considering the scenario of national heat demand and the difficulty of electrifying certain segments of it (high heat
consuming industries), the use of H2 for technologies such as cogeneration, are presented as a solution to reduce
emissions in these segments.1
Cogeneration using renewable hydrogen could cover an important part of the national energy demand from the thermal point of view, as its
technical potential currently amounts to 10,137 GWh, contributing to the decarbonisation of the system.
Sources: 1Ministerio de Industria, Energía y Turismo (2016): Evaluación completa del potencial de uso de la cogeneración de alta eficiencia y de los sistemas urbanos de calefacción y refrigeración eficientes. Figures to be updated as soon as a new
version of the study is published throughout this year 2021. 2AGORA (feb-2021): STUDY | No-regret hydrogen: Charting early steps for H₂ infrastructure in Europe. 3 ACOGEN Y COGEN.
• Total national thermal demand is estimated to be 460,000 GWh1,
including the Residential, Tertiary and Industrial sectors.
• This demand can be covered by high efficiency cogeneration
providing added value compared to other technologies such as
combined cycles:
Flexibility for high, medium and low temperature heat input,
supported with heat storage systems.
Very high efficiency, providing significant savings in
primary energy.
• By replacing its current energy sources with green hydrogen, the
role of cogeneration will be strengthened, being able to add to the
process of decarbonization of its activity and therefore to that of
the national system. <100 ºC (low)100-500 ºC
(medium)>500 ºC (high) Total
32
(36%)
23
(26%)
33
(38%)
88
(100%)
NG consumption in 2017 in the industry sector by applied heat
temperature range (TWh/year)2
Context of hydrogen in Cogeneration – Alternative for decarbonization
01. Current context for hydrogen in Spain
12

Co
nte
nid
o
02.
Potential uses of hydrogen adapted to cogeneration
Potential uses of H2
Cogeneration by industry and synergies with
H2
Cogeneration value levers in the energy
transition

Hydrogen can play an important role as a renewable energy storage vector, allowing its distribution in different sectors
and regions, benefiting from existing infrastructures and technologies.
Hydrogen uses with great potential – H2-to-X
H2-to-Power
Hydrogen can be used in different power generation
applications acting as a renewable energy storage
solution for long-term seasonal storage.
• Hydrogen can be re-electrified directly through fuel
cells and gas turbines (CCGT).
• Hydrogen-derived ammonia can be burned at existing
(developing) coal-fired power plants.
It is estimated that H2-to-Power applications
will gain importance in 2030
H2-to-Gas
Green hydrogen has the potential to link electricity
and natural gas networks allowing the reduction of the
CO2 intensity of the gas network with small
modifications to existing infrastructure.
• Hydrogen can be injected directly into existing natural
gas networks (mixing limitations) or distributed through
dedicated hydrogen networks.
• Synthetic methane can be produced from hydrogen
and CO2 by methanization and injected without any
restrictions into gas networks. Energy efficiencies lead
to very high costs, preventing large-scale deployment.
H2-to-Gas applications could play a relevant
role in the 2030 horizon
H2-to-Liquid
Hydrogen can be converted to low-carbon synthetic
liquid fuels that are easy to handle and with higher
energy densities than gaseous hydrogen. These fuels
take advantage of the infrastructures and uses of
fossil fuels that exist today.
Models as H2-to-Fuel could compete with
biofuels from 2035
Sources: 1Hydrogen Council (2017): Hydrogen scaling up; 2IEA (2019): The Future of Hydrogen.
In addition, technological advancement is enabling the
development of new forms of low-emission transport –
ground vehicles, ships and aircraft – powered by
hydrogen fuel cells, which can be a paradigm shift in
the transport sector.
02. Potential uses of hydrogen adapted to cogeneration
14

Of the three main uses described, H2 to Power is the one that would correspond to turbines and cogeneration engines,
in addition to other technologies such as those described below:
Fuentes: : 1Hydrogen Council (2017): Hydrogen scaling up; 2IEA (2019): The Future of Hydrogen. 3Hydrogen Council (2020): Path to hydrogen competitiveness. A cost perspective.
TE
CH
NO
LO
GY
DE
SC
RIP
TIO
N A
ND
HIG
HL
IGH
TS
PR
OS
AN
D C
ON
S
Stationary Fuel CellsPower Gas Turbines, engines and CCGTs
FCs are typically used for distributed generation, back-up and off-grid power
substituting diesel generation.
Fuel cells (FCs) oxidize hydrogen without combustion producing power and heat
with 50%-60% (LHV) electric efficiency. FCs are classified based on the electrolyte and
operation temperature:
• Low temperature FCs: PEM FCs is the most used low temperature FC and runs
on pure hydrogen or carbon fuels (if coupled with a reformer).
• High temperature FCs: molten carbonate FCs or Solid Oxide FCs (SOFC) are the
main high temperature FCs. They run with hydrogen and unreformed carbon fuels.
High temperature FCs generate high temperature heat which can be used for CHP
and drive overall energy efficiency up to 80% in the case of SOFC.
FCs typically exist in Low-Mid power scales (<50MW).
High CAPEX (3.000-6.000 €/kW)
High operational flexibility
Allows distributed generation
Limited life-cycle (~40.000 h)
Hydrogen can be used as fuel in gas turbines and CCGTs.
• Existing turbines can handle a H2 share between 2%-5% without relevant
modifications although most restrictive guidelines set a 1% limit. Some state of
the art gas turbines can handle variable shares of hydrogen reaching up to 90%. The
industry estimates to supply turbines capable of running 100% H2 by 2030.
• In micro-gas turbines the direct use of ammonia as fuel has been successfully
demonstrated (>2MW). Larger turbines are facing several technical issues regarding
NOx emissions and flame stability. In this cases previous cracking of ammonia into
hydrogen and nitrogen would be needed slightly lowering the total efficiency.
• Green hydrogen in power generation has very low efficiencies. Hydrogen produced
from electricity at 25 €/MWh would generate power between 84 €/MWh (CCGT at 60%
utilization) or 168 €/MWh (simple cycle 25% utilization)3.
Low H2 feed possible in existing gas turbines
Synergies with gas T&D infrastructure
A combination of low H2 prices (~1,5 €/kgH2) and high CO2
costs are required to compete with natural gas
Hydrogen uses with great potential – H2-to-Power
02. Potential uses of hydrogen adapted to cogeneration
15

The cogeneration park in Spain is spread across different industrial sectors. However, the food industry, paper and
chemical industry have a great weight in this mix, as they account for approximately 50% of the total installed power.
Current cogeneration park by industry
18%
17%
15%10%
9%
9%
5%
11%
Paper Industry
Food Industry
Textile, dressing and leather
Tiles and ceramics
Chemical IndustryCommercial and Residential
Refineries
Others
Cogeneration
by sectors
Installed power1
Sources: 1 Institutional presentation ACOGEN 2020.
02. Potential uses of hydrogen adapted to cogeneration
16

Traditional cogenerating sectors that currently consume H2 can take advantage of synergies between cogeneration and
intensive H2 use, allowing for more aggressive transformation scenarios for their plants.
H2 synergies in industries that currently cogenerate
Food Industry Chemical Ind.
Me
tal In
d.
Ch
em
ica
lsR
efin
ing
Paper Industry
Oth
ers
Commercial RefineriesTiles OthersTextile
CURRENT COGENERATION PARK BY INDUSTRY
CU
RR
EN
T H
2 U
SE
S
Chemical industries that have both
ammonia and methanol among their
productions.
The agri-food industry can benefit from the production of H2, if they
are large consumers of fertilizers from ammonia, and that H2 can be
used as a tool to efficient acquisition costs.
Refineries are intensive in
H2 consumption due to their
production processes.
Cogeneration can be an
additional H2 production line.
Steel industries requiring H2 for steel
manufacturing and cogeneration plants.
H2 is used in the manufacture
of glass and semiconductors
(electronics).
H2 is used in oil hydrogenation
processes for processing into
solid fats.
02. Potential uses of hydrogen adapted to cogeneration
17

In those industrial areas where cogeneration exists, the incorporation of hydrogen as a primary source of energy will
provide an advantage that adds to those it already has over other technologies.
Cogeneration value levers – The role of cogeneration in energy transition
Self-consumption Flexibility High efficiency
Hydrogen
Natural gas
Electricity
Heat
Market/Self-consumption
Industrial Processes
Hydrogen can be used as a substitute fuel for natural gas for heat and electricity production, completely
eliminating emissions associated with current cogeneration
• Remaining the main axis in the
philosophy of operation and
application of cogeneration in the
sectors in which it brings value such
as industrial and tertiary.
• Covering the energy demand needed
in those production processes in
which it is involved and others that
will have its application in the future.
• Targeting both heat and electricity to
meet the needs of one or more
upcoming customers.
• Taking full advantage of distributed
generation.
• Satisfying as much as possible the
flexibility needs demanded by the
System Operator, having support
elements such as heat storage,
retributing the services provided.
• Providing savings of at least 10%
primary energy compared to other
technologies such as combined
cycles and boilers.
• Generating 20% of EU electricity in a
highly efficient manner with a number
of increasingly renewable fuels,
including hydrogen.
Incorporating H2 as a renewable competitive advantage
02. Potential uses of hydrogen adapted to cogeneration
18
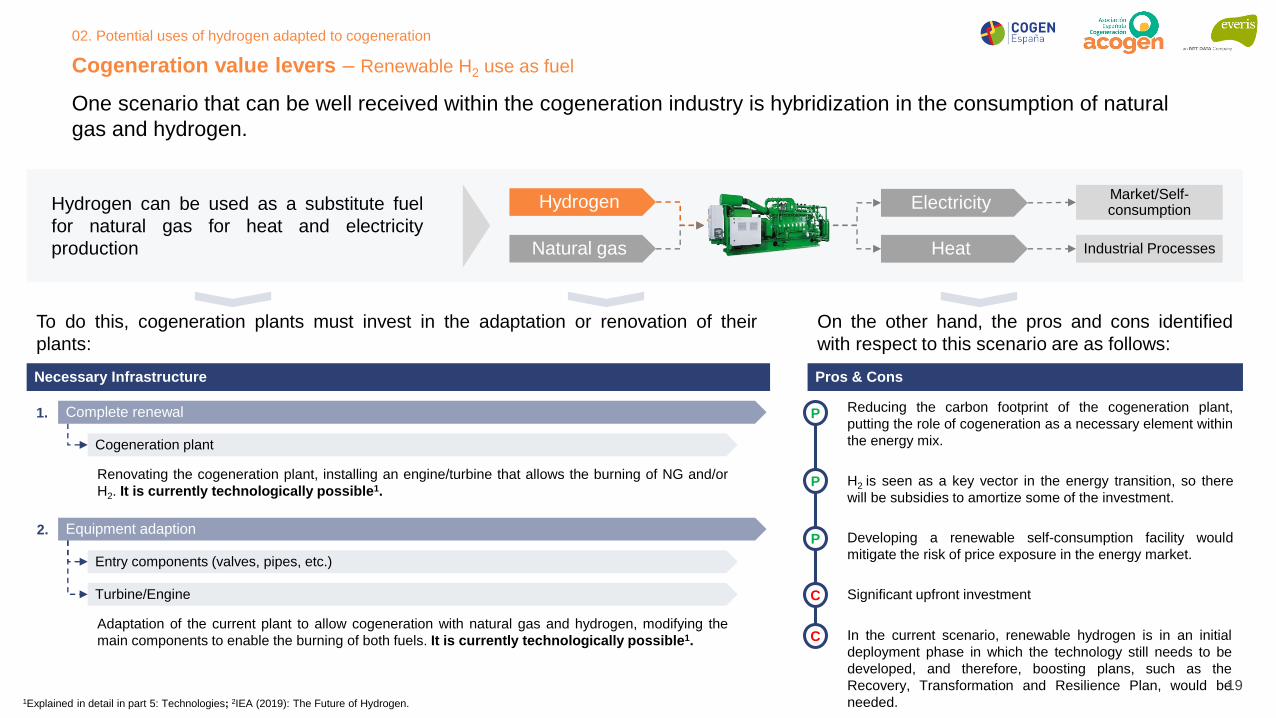
One scenario that can be well received within the cogeneration industry is hybridization in the consumption of natural
gas and hydrogen.
Cogeneration value levers – Renewable H2 use as fuel
Hydrogen can be used as a substitute fuel
for natural gas for heat and electricity
production
To do this, cogeneration plants must invest in the adaptation or renovation of their
plants:
Necessary Infrastructure
Complete renewal
Equipment adaption
Cogeneration plant
Entry components (valves, pipes, etc.)
Turbine/Engine
On the other hand, the pros and cons identified
with respect to this scenario are as follows:
Pros & Cons
P
P
P
C
C
Significant upfront investment
In the current scenario, renewable hydrogen is in an initial
deployment phase in which the technology still needs to be
developed, and therefore, boosting plans, such as the
Recovery, Transformation and Resilience Plan, would be
needed.
Renovating the cogeneration plant, installing an engine/turbine that allows the burning of NG and/or
H2. It is currently technologically possible1.
1Explained in detail in part 5: Technologies; 2IEA (2019): The Future of Hydrogen.
Adaptation of the current plant to allow cogeneration with natural gas and hydrogen, modifying the
main components to enable the burning of both fuels. It is currently technologically possible1.
1.
2.
Reducing the carbon footprint of the cogeneration plant,
putting the role of cogeneration as a necessary element within
the energy mix.
H2 is seen as a key vector in the energy transition, so there
will be subsidies to amortize some of the investment.
Developing a renewable self-consumption facility would
mitigate the risk of price exposure in the energy market.
Hydrogen
Natural gas
Electricity
Heat
Market/Self-consumption
Industrial Processes
02. Potential uses of hydrogen adapted to cogeneration
19

Main conclusions of the section – H2 use in the cogeneration setting
H2 MAY PLAY A RELEVANT ROLE IN THE
ENERGY TRANSITION
SYNERGIES OF THE H2 INDUSTRY
WITH THE COGENERATIVE PARK
Industries that currently co-generate and are
additionally H2-intensive (refineries, chemical,
food, etc.) can be the key to the
development, in the short and medium term,
of cogeneration business models that view H2
as a real alternative.
The success or failure of these business
models will determine the feasibility of using
H2 as fuel for cogeneration, thereby enabling
the development of high-efficiency renewable
cogeneration.
SCENARIO FOR RENEWABLE
COGENERATION TAKING ADVANTAGE OF
ITS COMPETITIVE LEVERS
The development of renewable H2 can be the
definitive boost to make the leap to renewable
cogeneration, and thus take advantage of all
the benefits that this technology brings to the
energy system:
• Energy self-consumption for heat generation.
• Providing flexibility at the point of
consumption, as well as to the electricity grid.
• High-efficiency technology, helping to meet
European energy efficiency targets.
The different applications of H2 – industry,
mobility, electricity and heat generation, etc. –
make this raw material an energy vector that
can play a relevant role in the energy
transition, because it can be a substitute for
both oil and natural gas..
Therefore, the co-generating industry should
consider this energy source within its plans for
the future, as it would allow it to adapt the
design of its plants to the objectives set out in
the PNIEC.
H2 can play a key role in the energy transition, and cogeneration can take advantage of it, thus bringing its competitive
advantages to the energy system: self-consumption, flexibility and high efficiency
02. Potential uses of hydrogen adapted to cogeneration
20

Co
nte
nid
o
03.
Hydrogen production and logistics models to supply cogeneration plants
Future perspectives for H2 logistics
Future impact of H2 logistics on cogeneration

• Expansion of the hydrogen transport network to
meet the demand for new typologies of hydrogen
service points (cogenerations, local industries,
etc.)
• New generation of road transport with liquid H2.
• Improvements in the capacity of tubular trailers
(1,500 kg) and pressure (700 bar) with CAPEX
optimization.
• First large-scale storage caverns in operation for
cost-cutting energy storage applications (about
one-third).
• First commercial liquid hydrogen projects
(shipping).
• Improvements in carrier
conversion/reconversion efficiency (>90%), and
cost reduction (0,82 €/kgH2)
• R&D projects for the development of mixed
hydrogen transport in the current network of NG2.
• Technological improvement of liquefaction and
exhaust losses.
• Improving compressor efficiency (>88%).
• Feasible conversion of low-pressure natural
gas pipelines to run on hydrogen (H2).
• Research projects to couple large-scale storage
with energy applications such as seasonal
storage.
• Liquefaction improvements that allow the transport
of cryogenic containers.
• Technical-economic research on different
hydrogen carriers and how they affect distance
scales.
In the short and medium term, new development and technological improvement fronts are opening up around hydrogen
logistics and distribution(1)(2).
H2 logistics – Future perspectives
2025
Transmission/Transport
Distribution
Storage
Hydrogen
carriers
2030
Hydrogen management and logistics technologies are not yet mature enough in terms of efficiency and costs. Large-scale storage, shipping or long-distance pipeline
transmission are expected to reach commercial viability by 2030.
Sources: 1IEA (2019): The Future of Hydrogen; 2Hydrogen Europe (2018): Enabling a zero emission Europe. 2Gas for Climate & Guidehouse (2020): Gas Decarbonisation Pathways 2020 - 2050
03. Hydrogen production and logistics models to supply cogeneration plants
22

Sources: 1Gas for Climate & Guidehouse (2020): Gas Decarbonisation Pathways 2020 – 2050. *Includes pipes and trucks as main means of distribution and transportation.
H2 logistics – H2 logistics impact on cogeneration
The roadmap established at European level for the transformation of current gas logistics into new alternative fuels such
as H2 or biomethane, allows the presence and activity of cogeneration.
H2 infrastructure*Renewable production
Gas infrastructure Gas consumer industry
H2 producer and
consumer industry
Building heating
Isolated industry connected to
green H2 generation CogenerationMethane
infrastructure
Impact on cogeneration in the short/medium term
(2020-2030)
Impact on cogeneration in the long term
(2030-2050)
03. Hydrogen production and logistics models to supply cogeneration plants
23

Sources: 1Gas for Climate & Guidehouse (2020): Gas Decarbonisation Pathways 2020 – 2050. * Includes pipes and trucks as main means of distribution and transportation. 2COGEN EUROPE: Energy Efficiency Directive Revision (Position Paper).
H2 logistics – H2 logistics impact on cogeneration
A short-term scenario proposes a hybrid model with a predominant presence of natural gas, albeit with an increasing
presence of renewable hydrogen
A fledgling green hydrogen scenario in which local point industries consume
H2 in place of Gas, including those linked to cogeneration. Need to
connect industrial cores with new hydrogen production points (wind farms and
photovoltaic farms).
Predominant natural gas distribution network but with local developments
dedicated to H2.
By 2030 hydrogen infrastructure is expected to begin to develop at
regional and/or national levels, possibly first in north-western Europe and
then elsewhere in Europe (central and southern). Planning for these
infrastructures should begin during the early years of the decade (2020-2030).
Production of cogeneration and hydrogen projects (mixed with natural gas)
using existing, and some (local) dedicated networks that could have been
developed.
By 2030, cogeneration will be able to cost-effectively generate 20% of EU
electricity with renewable fuels such as H2, resulting in additional savings of
78 million tons of primary energy and an additional reduction of 350 million
tons of CO22.
Impact on cogeneration in the short/medium term
(2020-2030)1
2
3
03. Hydrogen production and logistics models to supply cogeneration plants
24
Sources: 1Gas for Climate & Guidehouse (2020): Gas Decarbonisation Pathways 2020 – 2050. * Includes pipes and trucks as main means of distribution and transportation. 2COGEN EUROPE: Energy Efficiency Directive Revision (Position Paper).
H2 logistics – H2 logistics impact on cogeneration
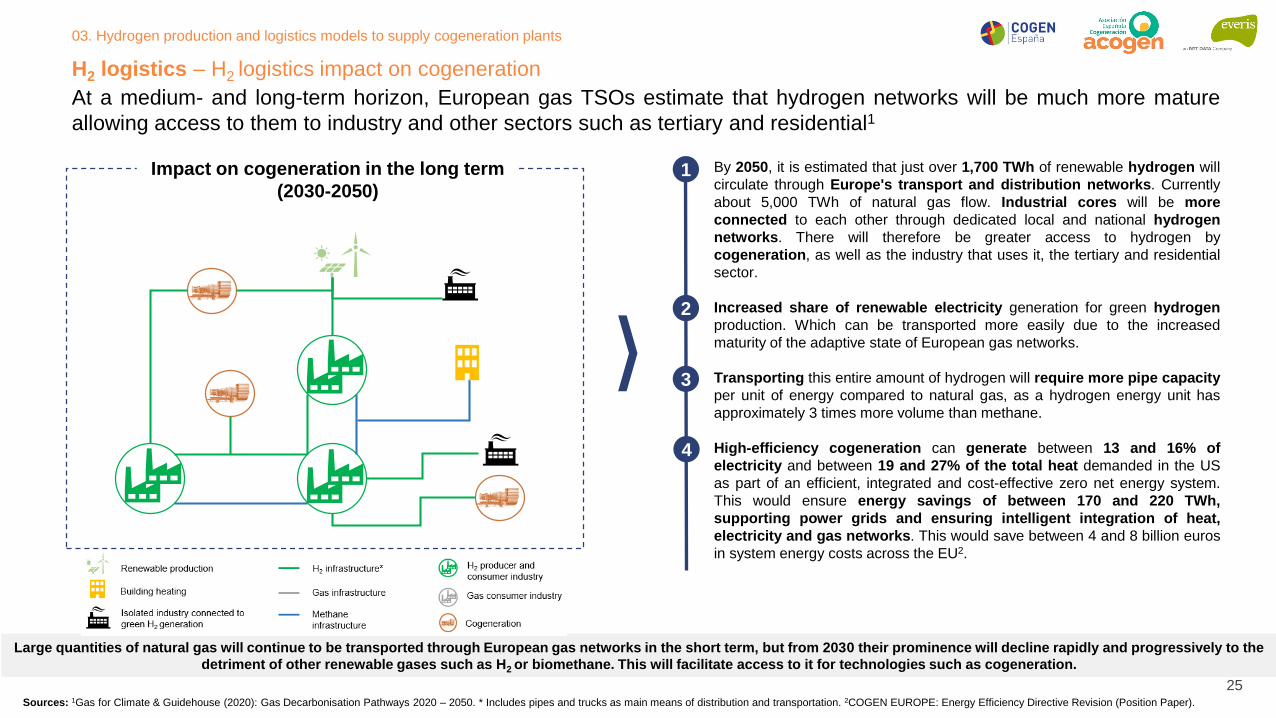
At a medium- and long-term horizon, European gas TSOs estimate that hydrogen networks will be much more mature
allowing access to them to industry and other sectors such as tertiary and residential1
By 2050, it is estimated that just over 1,700 TWh of renewable hydrogen will
circulate through Europe's transport and distribution networks. Currently
about 5,000 TWh of natural gas flow. Industrial cores will be more
connected to each other through dedicated local and national hydrogen
networks. There will therefore be greater access to hydrogen by
cogeneration, as well as the industry that uses it, the tertiary and residential
sector.
Increased share of renewable electricity generation for green hydrogen
production. Which can be transported more easily due to the increased
maturity of the adaptive state of European gas networks.
Transporting this entire amount of hydrogen will require more pipe capacity
per unit of energy compared to natural gas, as a hydrogen energy unit has
approximately 3 times more volume than methane.
High-efficiency cogeneration can generate between 13 and 16% of
electricity and between 19 and 27% of the total heat demanded in the US
as part of an efficient, integrated and cost-effective zero net energy system.
This would ensure energy savings of between 170 and 220 TWh,
supporting power grids and ensuring intelligent integration of heat,
electricity and gas networks. This would save between 4 and 8 billion euros
in system energy costs across the EU2.
1
2
3
Impact on cogeneration in the long term
(2030-2050)
4
Large quantities of natural gas will continue to be transported through European gas networks in the short term, but from 2030 their prominence will decline rapidly and progressively to the
detriment of other renewable gases such as H2 or biomethane. This will facilitate access to it for technologies such as cogeneration.
03. Hydrogen production and logistics models to supply cogeneration plants
25

Main conclusions of the section – H2 Production and logistics for cogeneration
SCENARIOS FOR RENEWABLE COGENERATION FUELLED BY A CHANGING LOGISTICS MODEL
In the short term, the proposed European logistics model will allow certain volumes of renewable hydrogen to be injected
and transported through existing natural gas networks. This will allow cogeneration to progressively replace its current
main fuel (natural gas), thereby contributing to the EU's objective of decarbonizing industry.
In the long term, it is expected that European and national development policies will allow developments and reforms to
be undertaken that will enable an increasingly exclusive network of H2 and other renewable gases (biomethane) to be
established.
H2 can play a key role in the energy transition, and cogeneration can take advantage of this by contributing its
competitive levers to the energy mix: self-consumption, flexibility and high efficiency.
03. Hydrogen production and logistics models to supply cogeneration plants
26

Co
nte
nid
o
04.
Analysis of currently available technologies
Major European H2 projects in cogeneration and other parts of the value chain
Technologies available for cogeneration with H2

At European level, there is significant momentum on the part of most countries to develop new renewable hydrogen
production initiatives. Spain is among the most committed.
European hydrogen projects for the 2020 - 2040 horizon1
839991
218 141 143
314
143102
333
209 14
26
34
98
19
3
7
3
10
4
0
2
4
6
8
10
12
14
16
18
20
22
24
26
28
30
32
34
0
500
1.000
1.500
2.000
2.500
3.000
ESNL
2.596
1.3421.405
NOFR
1.352
DE DK
10
PT
20
GB BG BE
Number of Projects <= 2030Beginning N/A
Nu
mb
er o
f Pro
jectsC
apa
city (
MW
)
"Power to Hydrogen" projects planned for 10 countries in Europe on the
horizon 2020-2030
Six countries plan to install more than 1 GW of hydrogen production by 2030, among them Spain
Sources: 1Hydrogen Europe (oct 2020): Clean Hydrogen Monitor 2020.
Map of new projects to produce green hydrogen by country (MW) (2020-
2040)
3
1.454
155
20
19 20
2
103
10
1.1723
1.548
12.909
143
2.252
1.001
229
9
04. Analysis of currently available technologies
28

Regarding the use of hydrogen in cogeneration, the most relevant projects at European level are in Germany, France
and Spain
European cogeneration projects with H2
Plant in Apex Energy Teterow in
Rostock-Laage (Germany)
Plant in Hassfurt by 2G Energy,
Stadtwerk Hassfurt GmbH and the
Institute for Energy Technology (IfE)
(Germany)
Plant in Hamburg by INNIO and
HansWerk AG (Germany)
Plant in Saillat-sur-Vienne by
Engie (France)
Plant in Bárboles - Sobradiel,
Redexis (Spain)
Germany has the
highest number of
hydrogen-associated
cogeneration
projects, mainly
facilitated by the
country's high
production and
demand, as well as
intensive promotion
and development
policies
04. Analysis of currently available technologies
29

Today there are numerous hydrogen cogeneration projects and for the rest of the value chain. Here are some examples
of the highlights.
European cogeneration projects with H2 – Germany (1/3)
• Electricity and heat production plant from renewable hydrogen. It consists of a 2 MW fuel cell, a storage
tank, a combined heat and electricity production plant and a stabilizing battery.
• 2G Energy supplies innovative hydrogen cogeneration unit to Apex Energy Teterow in Rostock-Laage,
Germany.
• The highlight of this hydrogen cogeneration plant is that it can run on pure hydrogen without any fossil
fuel. However, 2G Energy states that it can also work with a mixture of hydrogen and natural gas, as
well as pure natural gas. This increases the operational flexibility of cogeneration.
• Project cost of €2 million.
Project Description
Financing sources
Technology
Hydrogen cogeneration
Project
Plant in Rostock-Laage,
Germany
Partner entities
Project Location
Other relevant information
• Production:
o 115 kWh of electricity
o 129 kWh of thermal energyOwn financing on behalf of both companies
Sources: 1REUTERS.
04. Analysis of currently available technologies
30

Today there are numerous hydrogen cogeneration projects and for the rest of the value chain. Here are some examples
of the highlights. (Cont.)
European cogeneration projects with H2 – Germany (2/3)
Project Description
Financing sources
Technology
Hydrogen cogeneration
Project
Plant in Hassfurt, Germany
Partner entities
Project Location
Bavarian Ministry of
Economic Affairs,
Regional Development
and Energy
• Stadtwerk Hassfurt GmbH project with funding from the Bavarian Ministry of Economic Affairs, Regional
Development and Energy (StMWi).
• The existing gas energy conversion plant in Hassfurt was expanded to include a highly innovative
block-type hydrogen thermal power plant (H2-BHKW). The module has already been successfully
launched.
• The new cogeneration plant allows to operate with pure hydrogen without fossil fuel components,
in contrast to the previous practice of adding hydrogen to the natural gas network with reverse power
generation through conventional cogeneration units.
Other relevant information
• Production: 200 kWe
Sources: 1FUELCELLSWORKS.
04. Analysis of currently available technologies
31

Today there are numerous hydrogen cogeneration projects and for the rest of the value chain. Here are some examples
of the highlights. (Cont.)
European cogeneration projects with H2 – Germany (3/3)
Project Description
Financing sources
Technology
Hydrogen and gas cogeneration
(can work at 100% with both)
Project
Plant in Hamburg, Germany
Partner entities
Project Location
Own financing on behalf of both companies
• INNIO, an Austrian-based energy solutions provider, has partnered with HanseWerk AG, a German
energy service provider, to deliver a 1 MW hydrogen-powered electricity and heat cogeneration
pilot plant in central Hamburg, Germany.
• The pilot began operating with natural gas during the spring of 2020 and then, throughout the summer,
switch to using a green gas network operating the cogeneration plant with increasing hydrogen levels
up to 100%, thus testing its operational flexibility.
• The converted cogeneration plant provides 30 residential buildings, a sports center, a nursery and a
leisure complex (Othmarschen Park) with a reliable supply of heating equivalent to 13,000 MWh each
year. Some of the electricity generated is supplied to the electric vehicle charging points in the leisure
complex car park, as well as to the local electricity grid.
Other relevant information
• Installed power: 1 MW
Sources: 1INNIO
04. Analysis of currently available technologies
32

Today there are numerous hydrogen cogeneration projects and for the rest of the value chain. Here are some examples
of the highlights. (Cont.)
European cogeneration projects with H2 – France
Project Description
Financing sources
Technology
Hydrogen and Gas
Cogeneration
Project
Plant in Saillat-sur-Vienne,
France
Partner entities
Project Location
The total budget of the project is
around EUR 15.2 million, of which
EUR 10.5 million will be contributed
entirely by the European Union under
the Horizon 2020 programme:
• European HYFLEXPOWER project. Consortium consisting of ENGIE Solutions, Siemens Gas and
Power, Centrax, Arttic, the German Aerospace Centre (DLR) and four European universities. Siemens
is the entity responsible for coordinating the project.
• It aims to demonstrate that hydrogen can be produced and stored from renewable electricity, and then
added up to 100% to the natural gas currently used with combined heat and energy (CHP) plants. This
also saves 65,000 t of CO2 per year emitted into the atmosphere.
• The installed demonstrator will be used to store excess renewable electricity in the form of green
hydrogen. To do this, an existing Siemens SGT-400 industrial gas turbine will be upgraded to convert
stored hydrogen into electricity and thermal energy.
Other relevant information
• Installed power: 12 MWe
Sources: 1SIEMENS.
04. Analysis of currently available technologies
33

Today there are numerous hydrogen cogeneration projects and for the rest of the value chain. Here are some examples
of the highlights. (Cont.)
European cogeneration projects with H2 – Spain
Project Description
Financing sources
Technology
Hydrogen cogeneration at small
scale
Project
Plant in Bárboles-Sobradiel,
Spain
Partner entities
Project Location
Research & Development Project
(PID in Spanish) financed by:
• Pioneering project installing a hydrogen fuel cell, supplied by Viessmann, for the generation of
electricity and heat in a Regulation and Measurement Station (ERM) of the pipeline network, in this
case in the Bárboles-Sobradiel pipeline (Zaragoza).
• The objective of the project is to analyze the feasibility of a technology based on the use of hydrogen
for the generation of electricity and thermal energy, as a step prior to its overall implementation in
Theexis gas transport and distribution facilities, with the ultimate aim of reducing the environmental
impact of the company's activities and its carbon footprint.
• In addition, it also seeks to test this technology under variable conditions of use, simulating its operation
under the energy conditions and needs that could be given in domestic and tertiary uses.
Other relevant information
• Installed power: n/d
Sources 1REDEXIS GAS
04. Analysis of currently available technologies
34
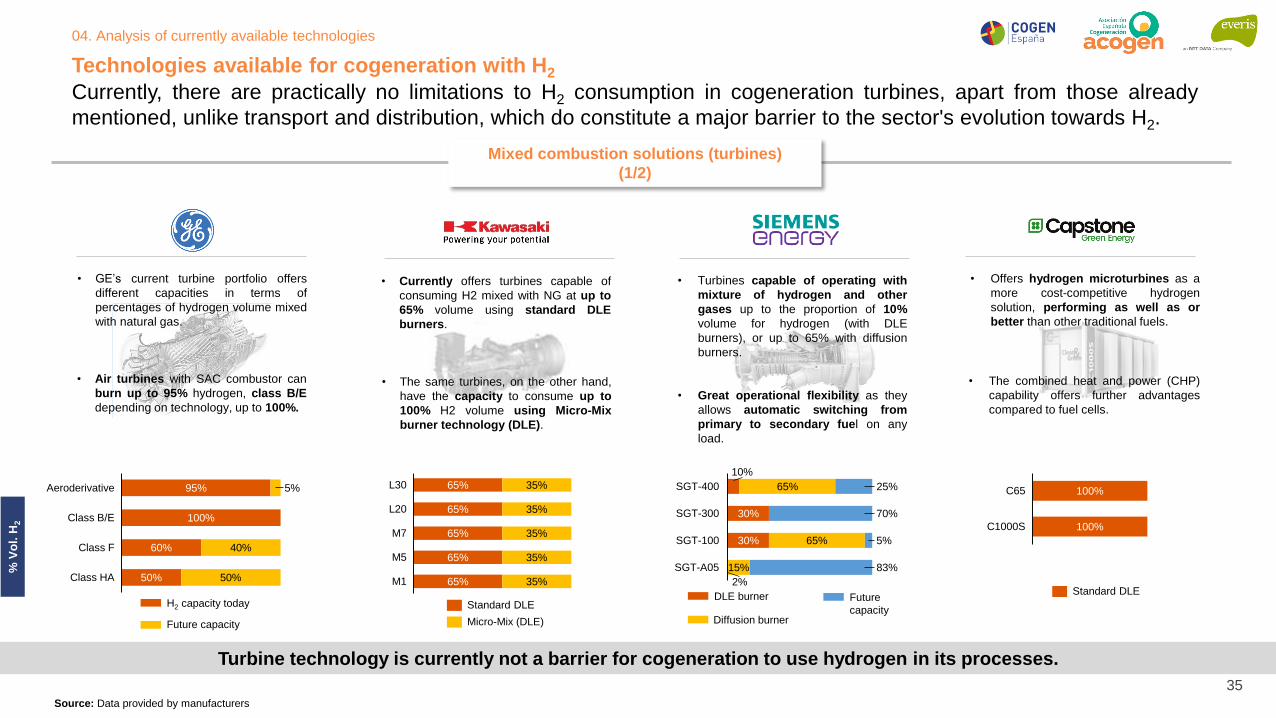
Technologies available for cogeneration with H2
Turbine technology is currently not a barrier for cogeneration to use hydrogen in its processes.
Currently, there are practically no limitations to H2 consumption in cogeneration turbines, apart from those already
mentioned, unlike transport and distribution, which do constitute a major barrier to the sector's evolution towards H2.
Source: Data provided by manufacturers
Mixed combustion solutions (turbines)
(1/2)
95%
100%
60%
50%
5%
40%
50%
Aeroderivative
Class B/E
Class F
Class HA
65%
65%
65%
65%
65%
35%
35%
35%
35%
35%
M5
L20
L30
M7
M1
Standard DLE
Micro-Mix (DLE)
10%
30%
30%
65%
65%
15%
25%
70%
5%
83%
SGT-400
SGT-300
SGT-100
2%
SGT-A05
100%
100%C1000S
C65
Standard DLE
% V
ol.
H2
DLE burner
Diffusion burner
Future
capacityH2 capacity today
Future capacity
• The combined heat and power (CHP)
capability offers further advantages
compared to fuel cells.
• Offers hydrogen microturbines as a
more cost-competitive hydrogen
solution, performing as well as or
better than other traditional fuels.
• GE’s current turbine portfolio offers
different capacities in terms of
percentages of hydrogen volume mixed
with natural gas.
• Air turbines with SAC combustor can
burn up to 95% hydrogen, class B/E
depending on technology, up to 100%.
• The same turbines, on the other hand,
have the capacity to consume up to
100% H2 volume using Micro-Mix
burner technology (DLE).
• Currently offers turbines capable of
consuming H2 mixed with NG at up to
65% volume using standard DLE
burners.
• Turbines capable of operating with
mixture of hydrogen and other
gases up to the proportion of 10%
volume for hydrogen (with DLE
burners), or up to 65% with diffusion
burners.
• Great operational flexibility as they
allows automatic switching from
primary to secondary fuel on any
load.
04. Analysis of currently available technologies
35

% V
ol.
H2
Centaur 50
100%
100%
20%Centaur 40
20%
Tital 130
4%
20%
Mercury 50
100%20%Taurus 60
4%
20%
Taurus 65
100%Taurus 70
100%
Tital 250
Mars 100
100%20%
100%20%
Conventional burner
SoLoNOxburner
100%
H-25
30%
H-100
30%
100%
100%
Diffusion
Pre-mix (DLN)Multi-Cluster (DLN)
Multi-Cluster (DLN) target
• Feature turbines tested for 20% H2
mix for low-emission equipment (DLE
or SoLoNOx).
• For projects requiring 100% H2, this
would be covered by conventional
combustion equipment (Diffusion
combustion).
• Mitsubishi Power's gas turbines can
now accept different ratios of H2 as
fuel.
• Depending on the type of combustion
chamber, the mixing volumes of H2
and NG vary between 30% and 100%.
• Features turbines ready to run at 20%
H2 by volume without modifications,
maintaining power, efficiency and
ultra-low emissions (NOx < 9 ppm /
CO2 < 16 ppm). Higher hydrogen
percentages are possible with minor
modifications.
• In the near future it is expected to
achieve 100% H2 by volume without
modifying the turbine body.
100%
100%
100%20%
20%MGT6000
20%
THM1304
MGT8000
H2 actual (DLE)
H2 Future (DLE)
Technologies available for cogeneration with H2
Currently, there are practically no limitations to H2 consumption in cogeneration turbines, apart from those already
mentioned, unlike transport and distribution, which do constitute a major barrier to the sector's evolution towards H2.
Mixed combustion solutions (turbines)
(2/2)
Turbine technology is currently not a barrier for cogeneration to use hydrogen in its processes.
Source: Data provided by manufacturers
04. Analysis of currently available technologies
36

Engine technology today does not constitute a barrier to cogeneration being able to use hydrogen in its processes.
Cogeneration engines also currently have no limitations on H2 consumption in different volumes. The status and
availability of the technology associated with the main national suppliers is shown below:
Mixed combustion solutions (motors)
Pure H2 H2 and NG mix
< 10% < 25% < 40% < 60%
Available
In Development
Manufacturer
Source: Data provided by manufacturers
Technologies available for cogeneration with H2
04. Analysis of currently available technologies
37

Main conclusions of the section – Projects and current state of the cogeneration with H2
HYDROGEN PROJECTS' DRIVING
HORIZON
CURRENT TECHNOLOGY AVAILABLE
TO COGENERATION IS NOT A BARRIER
TO H2
A wide variety of suppliers of technology
associated with cogeneration, engines and
turbines mainly present today technological
solutions that are compatible to a greater or
lesser extent with hydrogen.
In this sense there is also a significant room
for improvement that will undoubtedly further
facilitate access to and widespread use of
this renewable gas by cogeneration in the
future.
Motivated by the development of various
strategic plans established at European and
national level, over the next three decades it
is intended to carry out a significant number of
projects related to renewable H2, spread
across all links in its value chain.
In the field of cogeneration, its planning is
more discreet, although there are also
projects to this day, especially in Central
Europe (Germany), which will motivate the
design and implementation of new initiatives
across the continent (including Spain) for the
future.
At European level and at national level through each of its member countries, a significant number of hydrogen projects
are being promoted, also applied to cogeneration and its possibilities for future use
04. Analysis of currently available technologies
38

Co
nte
nid
o
05.
Main barriers and benefits in the hydrogen market for cogeneration
Identification of potential barriers to the development of cogeneration in the hydrogen context (economic, technological and regulatory).
Main benefits of cogeneration using renewable hydrogen

Integrating H2, within cogeneration currently presents a number of barriers and opportunities, which we can classify into
three large groups:
Existing barriers in the H2 market for cogeneration
• Production Cost of H2 (LCOH).
Current state and prospects for
evolving production costs of
renewable hydrogen and its
competitiveness with the other
types of hydrogen (grey and
blue).
• Levelled cost of energy (LCOE).
Competitiveness of energy cost
compared to that produced by
different technologies of cycle
turbines and cogeneration, using
natural gas and hydrogen.
• Blending or Hydrogen Injection
in the current gas grid. Current
situation of the technical feasibility
of transporting hydrogen mixed
with natural gas in European
networks to supply cogeneration,
among others.
• Transport & Distribution. Other
barriers and conditions
associated with the transport and
distribution of hydrogen and its
challenges for the future.
• Market creation politics.
Different facilitating mechanisms
for hydrogen penetration in
European energy markets.
• Infrastructure regulations.
Regulation initiatives that are
lacking to be developed at
European and above all national
level.
• Norms and Certifications that
allow to boost renewable
hydrogen by promoting its
contribution towards
decarbonization in the national
energy sector (green certificates).
REGULATORYTECHNICALECONOMIC
Opportunities and
Competitiveness levers
05. Main barriers and benefits in the hydrogen market for cogeneration
40

1,500,80
1,90
1,49
3,60
24,75
86,35
0
10
20
30
40
50
60
70
80
90
0
1
2
3
4
5
6
7
Hydrogen production cost varies significantly between different regions, as it depends to a large extent on the prices
and availability of energy inputs needed for the process.
Economic barriers to the development of H2 – H2 production cost
H2 Production Cost (LCOH)
Comparison of the Level Cost of Production of Renewable Hydrogen
(electrolysis) from FV generation in Spain with respect to hydrogen of fossil
origin, and price of CO22, 10-year estimation (2020)1
€/k
gH
2
Sources: 1HYDROGEN EUROPE (oct-2020): Clean Hydrogen Monitor 2020. Hydrogen Council (Jun-2020): Path to hydrogen competitiveness: A cost perspective. Note: Average H2 production costs with and without average CCUS for Europe.
Michel Noussan , Pier Paolo Raimondi , Rossana Scita and Manfred Hafner (2021). The Role of Green and Blue Hydrogen in the Energy Transition—A Technological and Geopolitical Perspective. Average H2 production costs at European level
without considering storage, transport and distribution.2BNP PARIBAS ASSET MANAGEMENT (Oct-2020): Green Hydrogen, Net Zero, and the Future of the EU-ETS. Factor CO2.
• The entry of renewable energies (mainly wind and solar photovoltaic) are playing
today and will continue to do so over the next 10 years, an essential role in
lowering the production costs of green H2, with the estimated that by 2030 its cost
is around 1.5 – 2 €/kg, matching that of blue and grey H2.
• Electrolysis is an increasingly technologically evolving process and also its
costs, which will be progressively and continuously reduced thanks to the larger-
scale production of electrolytes and the increase in generation capacity (greater
systems).
• In Europe, it is estimated that the cost of producing low-carbon hydrogen and
CCUS, which today (2020) is 1.9 €/kg, will decrease over the decade to around
1.5€/kg by 2030, due to the lower cost of carbon capture and storage options.
• Forecasting upward developments in CO2 prices will facilitate the use of green
hydrogen for decarbonization in many industries and sectors that currently use
fossil sources such as natural gas or other more competitive types of hydrogen today
(grey and blue).
Green hydrogen has great potential for improvement to reach and even improve
future cost levels where other non-renewable hydrogen production technologies are
located
2020 2030
1,50-2
EUAs prices Gas with CCUS (Blue H2)
Gas without CCUS(Grey H2)
Electrolysis with FV (green H2)
€/tC
O2
05. Main barriers and benefits in the hydrogen market for cogeneration
41
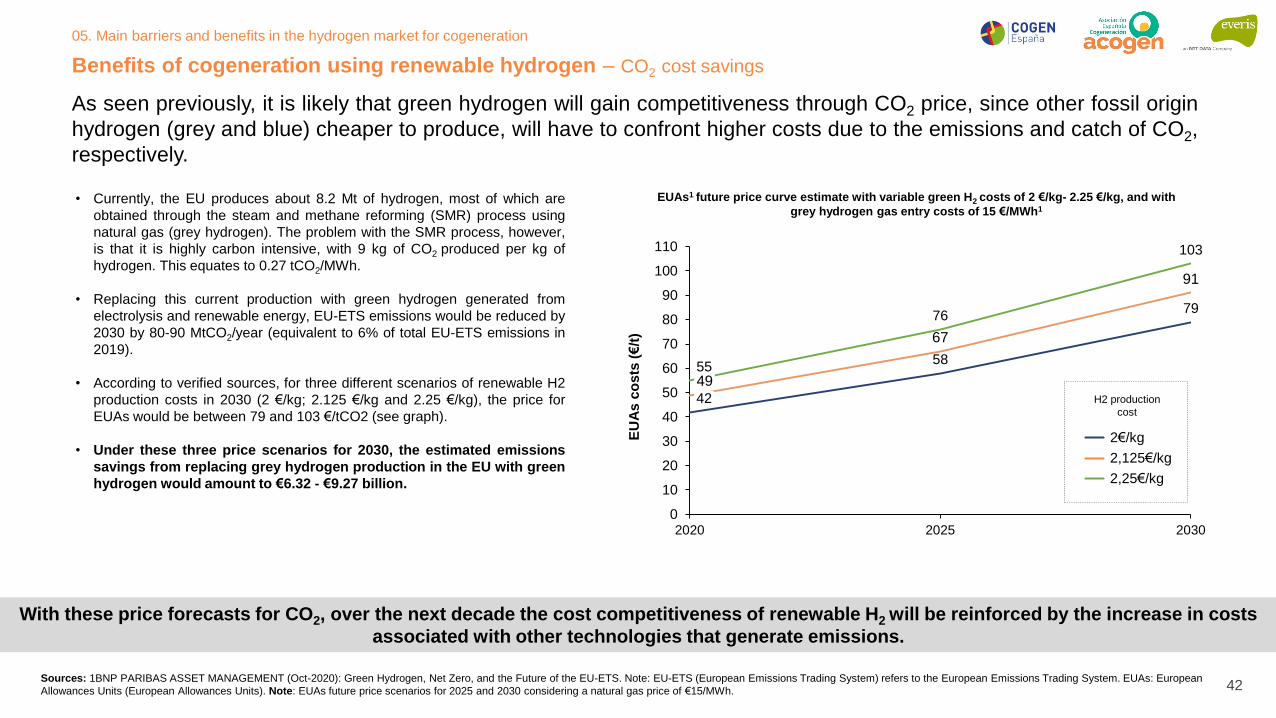
As seen previously, it is likely that green hydrogen will gain competitiveness through CO2 price, since other fossil origin
hydrogen (grey and blue) cheaper to produce, will have to confront higher costs due to the emissions and catch of CO2,
respectively.
Sources: 1BNP PARIBAS ASSET MANAGEMENT (Oct-2020): Green Hydrogen, Net Zero, and the Future of the EU-ETS. Note: EU-ETS (European Emissions Trading System) refers to the European Emissions Trading System. EUAs: European
Allowances Units (European Allowances Units). Note: EUAs future price scenarios for 2025 and 2030 considering a natural gas price of €15/MWh.
58
79
67
91
55
76
103
0
10
20
30
40
50
60
70
80
90
100
110
2020 2025 2030
42
49
EU
As
co
sts
(€
/t)
EUAs1 future price curve estimate with variable green H2 costs of 2 €/kg- 2.25 €/kg, and with
grey hydrogen gas entry costs of 15 €/MWh1• Currently, the EU produces about 8.2 Mt of hydrogen, most of which are
obtained through the steam and methane reforming (SMR) process using
natural gas (grey hydrogen). The problem with the SMR process, however,
is that it is highly carbon intensive, with 9 kg of CO2 produced per kg of
hydrogen. This equates to 0.27 tCO2/MWh.
• Replacing this current production with green hydrogen generated from
electrolysis and renewable energy, EU-ETS emissions would be reduced by
2030 by 80-90 MtCO2/year (equivalent to 6% of total EU-ETS emissions in
2019).
• According to verified sources, for three different scenarios of renewable H2
production costs in 2030 (2 €/kg; 2.125 €/kg and 2.25 €/kg), the price for
EUAs would be between 79 and 103 €/tCO2 (see graph).
• Under these three price scenarios for 2030, the estimated emissions
savings from replacing grey hydrogen production in the EU with green
hydrogen would amount to €6.32 - €9.27 billion.
With these price forecasts for CO2, over the next decade the cost competitiveness of renewable H2 will be reinforced by the increase in costs
associated with other technologies that generate emissions.
Benefits of cogeneration using renewable hydrogen – CO2 cost savings
2,125€/kg
2€/kg
2,25€/kg
H2 production
cost
05. Main barriers and benefits in the hydrogen market for cogeneration
42
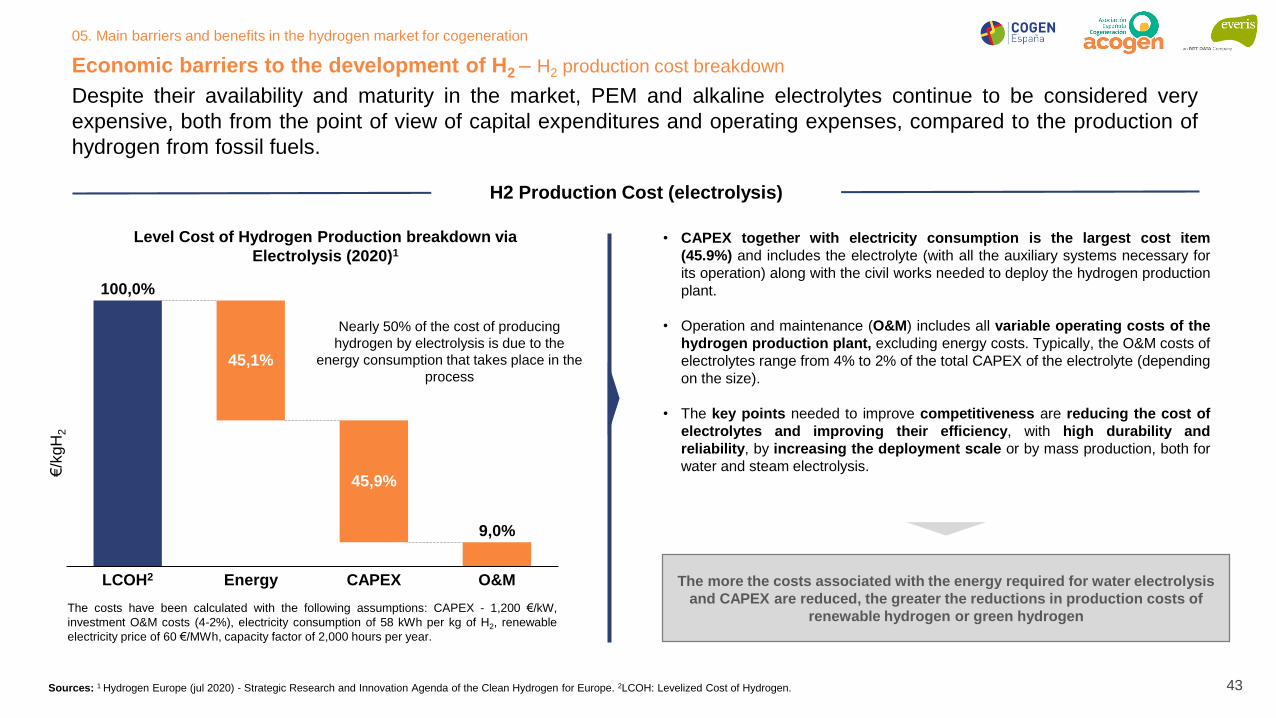
Despite their availability and maturity in the market, PEM and alkaline electrolytes continue to be considered very
expensive, both from the point of view of capital expenditures and operating expenses, compared to the production of
hydrogen from fossil fuels.
Economic barriers to the development of H2 – H2 production cost breakdown
H2 Production Cost (electrolysis)
Level Cost of Hydrogen Production breakdown via
Electrolysis (2020)1
Sources: 1 Hydrogen Europe (jul 2020) - Strategic Research and Innovation Agenda of the Clean Hydrogen for Europe. 2LCOH: Levelized Cost of Hydrogen.
• CAPEX together with electricity consumption is the largest cost item
(45.9%) and includes the electrolyte (with all the auxiliary systems necessary for
its operation) along with the civil works needed to deploy the hydrogen production
plant.
• Operation and maintenance (O&M) includes all variable operating costs of the
hydrogen production plant, excluding energy costs. Typically, the O&M costs of
electrolytes range from 4% to 2% of the total CAPEX of the electrolyte (depending
on the size).
• The key points needed to improve competitiveness are reducing the cost of
electrolytes and improving their efficiency, with high durability and
reliability, by increasing the deployment scale or by mass production, both for
water and steam electrolysis.
The more the costs associated with the energy required for water electrolysis
and CAPEX are reduced, the greater the reductions in production costs of
renewable hydrogen or green hydrogen
Energy CAPEXLCOH2
45,9%
45,1%
O&M
100,0%
9,0%
€/k
gH
2
Nearly 50% of the cost of producing
hydrogen by electrolysis is due to the
energy consumption that takes place in the
process
The costs have been calculated with the following assumptions: CAPEX - 1,200 €/kW,
investment O&M costs (4-2%), electricity consumption of 58 kWh per kg of H2, renewable
electricity price of 60 €/MWh, capacity factor of 2,000 hours per year.
05. Main barriers and benefits in the hydrogen market for cogeneration
43
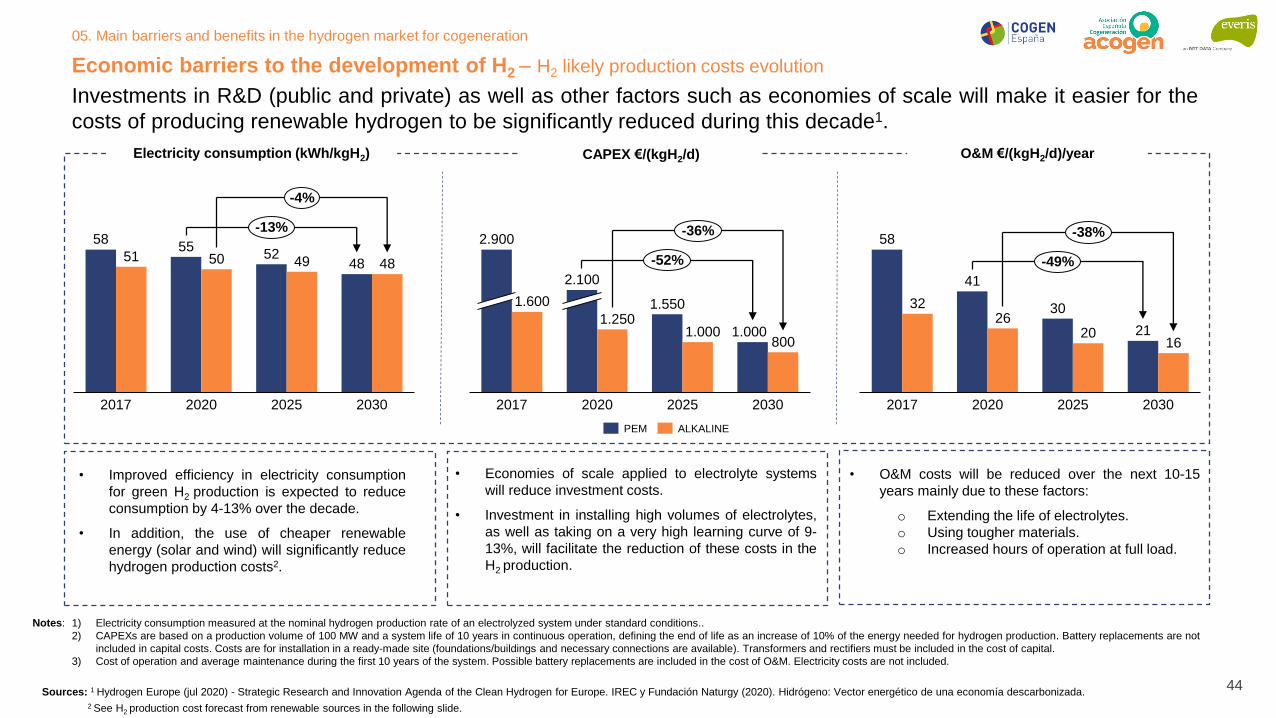
Investments in R&D (public and private) as well as other factors such as economies of scale will make it easier for the
costs of producing renewable hydrogen to be significantly reduced during this decade1.
Economic barriers to the development of H2 – H2 likely production costs evolution
Sources: 1 Hydrogen Europe (jul 2020) - Strategic Research and Innovation Agenda of the Clean Hydrogen for Europe. IREC y Fundación Naturgy (2020). Hidrógeno: Vector energético de una economía descarbonizada.
1) Electricity consumption measured at the nominal hydrogen production rate of an electrolyzed system under standard conditions..
2) CAPEXs are based on a production volume of 100 MW and a system life of 10 years in continuous operation, defining the end of life as an increase of 10% of the energy needed for hydrogen production. Battery replacements are not
included in capital costs. Costs are for installation in a ready-made site (foundations/buildings and necessary connections are available). Transformers and rectifiers must be included in the cost of capital.
3) Cost of operation and average maintenance during the first 10 years of the system. Possible battery replacements are included in the cost of O&M. Electricity costs are not included.
5855
5248
51 50 49 48
20202017 20302025
-13%
-4%
PEM ALKALINE
1.550
1.0001.250
1.000800
2017 20302020 2025
2.900
1.600
2.100
-52%
-36%58
41
30
21
3226
2016
2017 2020 2025 2030
-49%
-38%
Notes:
• Improved efficiency in electricity consumption
for green H2 production is expected to reduce
consumption by 4-13% over the decade.
• In addition, the use of cheaper renewable
energy (solar and wind) will significantly reduce
hydrogen production costs2.
Electricity consumption (kWh/kgH2) CAPEX €/(kgH2/d) O&M €/(kgH2/d)/year
• Economies of scale applied to electrolyte systems
will reduce investment costs.
• Investment in installing high volumes of electrolytes,
as well as taking on a very high learning curve of 9-
13%, will facilitate the reduction of these costs in the
H2 production.
• O&M costs will be reduced over the next 10-15
years mainly due to these factors:
o Extending the life of electrolytes.
o Using tougher materials.
o Increased hours of operation at full load.
2 See H2 production cost forecast from renewable sources in the following slide.
05. Main barriers and benefits in the hydrogen market for cogeneration
44
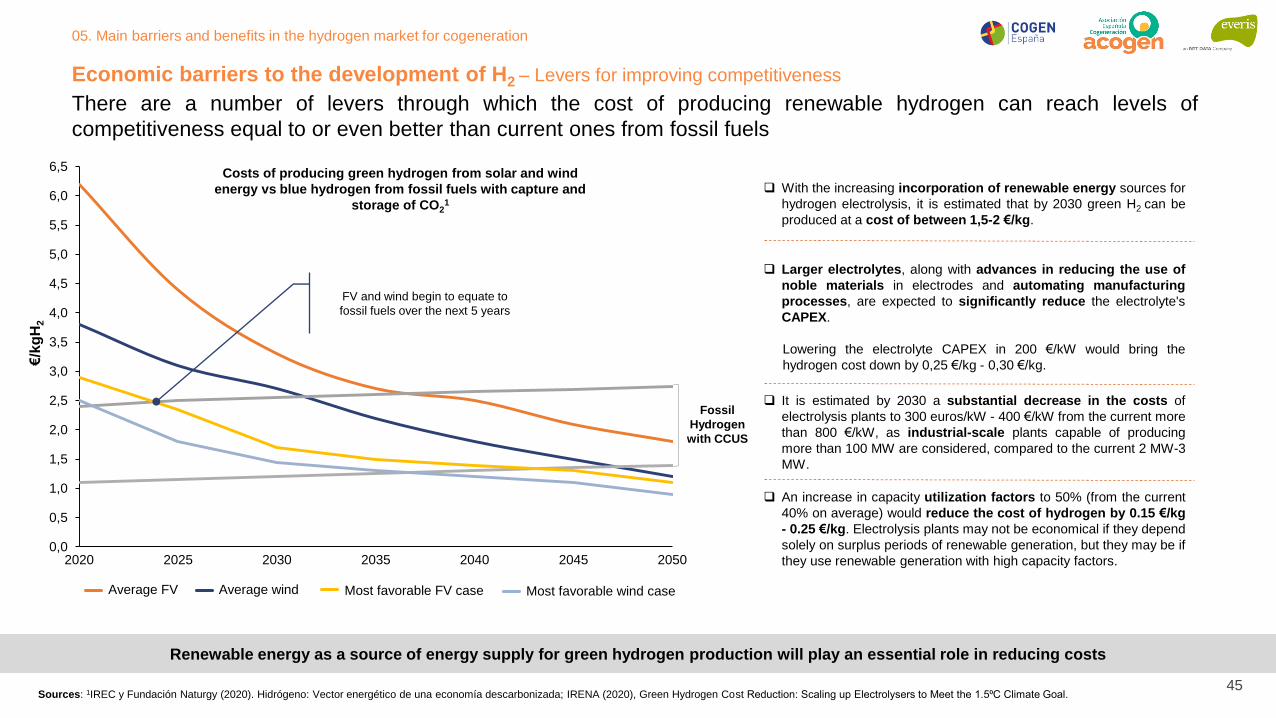
Economic barriers to the development of H2 – Levers for improving competitiveness
Larger electrolytes, along with advances in reducing the use of
noble materials in electrodes and automating manufacturing
processes, are expected to significantly reduce the electrolyte's
CAPEX.
Lowering the electrolyte CAPEX in 200 €/kW would bring the
hydrogen cost down by 0,25 €/kg - 0,30 €/kg.
There are a number of levers through which the cost of producing renewable hydrogen can reach levels of
competitiveness equal to or even better than current ones from fossil fuels
With the increasing incorporation of renewable energy sources for
hydrogen electrolysis, it is estimated that by 2030 green H2 can be
produced at a cost of between 1,5-2 €/kg.
It is estimated by 2030 a substantial decrease in the costs of
electrolysis plants to 300 euros/kW - 400 €/kW from the current more
than 800 €/kW, as industrial-scale plants capable of producing
more than 100 MW are considered, compared to the current 2 MW-3
MW.
An increase in capacity utilization factors to 50% (from the current
40% on average) would reduce the cost of hydrogen by 0.15 €/kg
- 0.25 €/kg. Electrolysis plants may not be economical if they depend
solely on surplus periods of renewable generation, but they may be if
they use renewable generation with high capacity factors.
Renewable energy as a source of energy supply for green hydrogen production will play an essential role in reducing costs
0,0
0,5
1,0
1,5
2,0
2,5
3,0
3,5
4,0
4,5
5,0
5,5
6,0
6,5
20302020 20402025 2035 2045 2050
Average FV Average wind Most favorable FV case Most favorable wind case
€/k
gH
2
Fossil
Hydrogen
with CCUS
Costs of producing green hydrogen from solar and wind
energy vs blue hydrogen from fossil fuels with capture and
storage of CO21
Sources: 1IREC y Fundación Naturgy (2020). Hidrógeno: Vector energético de una economía descarbonizada; IRENA (2020), Green Hydrogen Cost Reduction: Scaling up Electrolysers to Meet the 1.5⁰C Climate Goal.
FV and wind begin to equate to
fossil fuels over the next 5 years
05. Main barriers and benefits in the hydrogen market for cogeneration
45

Technically both engines and turbines will be able to use renewable H2 as an alternative primary energy source to
natural gas, with a predictable evolution of favorable costs in the medium and long term
Economic barriers to the development of H2 – Levelized cost of energy (LCOE)
Levelized Cost of Energy (LCOE)
A reduction in the cost of hydrogen by between 0.33 €/kg - 0.41 €/kg reduces LCOE by ≈ 8 €/MWh1, implying that LCOE from H2 has a large real margin for
improvement for the next 30 years.
If the gas turbines were 100% prepared for hydrogen
use, a carbon price of 26 €/tCO2 would be enough
to drive the change from natural gas to hydrogen,
and generate clean, manageable energy at a
competitive price.
Through economies of scale and the deployment
of renewable energy, green hydrogen production
will tend to approach cost levels of current forms of
fossil fuel production.
Sources: 1Bloomberg NEF, 2020: Hydrogen Economy Outlook. Los costes asociados al gas natural no incluyen el precio de las emisiones de CO2. 2Victor Niana, Qie Sunb, Zhanyu Mac y Hailong Lid - A comparative cost assessment of
energy production from central heating plant or combined heat and power plant. Data obtained for a 500 MW power plant, load factor of 0.85; efficiency in 90% heat production and 5% applied discount rate. LCOE: Levelized Cost Of Energy.
226196
150
80126
9866
29 36
374
292
194153
239
169
98 84103
0 €
50 €
100 €
150 €
200 €
250 €
300 €
350 €
400 €
2019 2030 2050 2019 2019 2030 2050 2019 2019
1 2 3 4 5 6 7 8 9
Hydrogen N. Gas Hydrogen N. Gas N. Gas
Peaking (OCGT) Load following (CCGT) Cog. turbines
€/MWh
Levelized Cost of electricity of power plants with hydrogen-powered turbines vs Natural Gas
2
05. Main barriers and benefits in the hydrogen market for cogeneration
46
1
2

Technical barriers to the development of H2 – H2 injection limits in NG networks (1/2)
Mixing hydrogen in the existing natural gas network would reduce significant investment costs associated with the
development of new transmission and distribution infrastructures. However, the current limits of hydrogen mixing in
natural gas networks respond to several restrictions.
1 In Germany it is reduced to 2% if a CNG charging station is connected on the line. 2Ameal parameter when you want to mix combustible gases and air (in a combustion reaction). This index is controlled to ensure satisfactory combustion in
a burner. Recommendations based on the conclusions issued by the German Gas Association (DVGW), NREL (2019) and NaturalHy Project
Sources: UNE-EN 16723-1: Gas natural y biometano para uso en transporte y biometano para inyección en la red de gas natural. Especificaciones para la inyección de biometano en la red de gas natural.
PD-01 "Medición, Calidad y Odorización de Gas" de las normas de gestión técnica del sistema gasista.
• Natural gas transport networks can withstand up to 50% mixing.
• Distribution networks can withstand a mix of up to 15% without the
need for significant reforms.
• Due to the lower energy density of hydrogen (1/3 natural gas), the
mixture reduces the energy content of the supplied gas. Therefore, the
tolerance of equipment connected to the gas network should be
assessed on a case-by-case basis to establish the upper limit of the
hydrogen mixture.
• Gas consumers, such as boilers and gas engines, must be modified
to support higher mixing levels, as the Wobbe index2 of the inlet gas is
changed.
;𝑊𝑠 =𝐻𝐶𝑉𝑠
𝐺𝐸
Ws: is the superior Wobbe index
HCVs: is the higher calorific value
GE: is the gas relative density 11%
0,1%
6%
10%
0,5%
4%
10% 12%
0,1%
4%
05. Main barriers and benefits in the hydrogen market for cogeneration
47
The Wobbe index is an important parameter when mixing fuel gases and air (in a combustion
reaction), this index is controlled to ensure satisfactory combustion in a burner. When H2 is
mixed with NG, the resulting gas has different physical properties that modify this index and
must be considered to ensure the integrity and correct functioning of the equipment (engines,
turbines, boilers, etc.).

Technical barriers to the development of H2 – H2 injection limits in NG networks (2/2)
In the case of Spain, the hydrogen mixture in the current natural gas network is technically feasible up to a volume of
11%1.
1Sources: Enagás. XVI Congreso Anual de Cogeneración (dic 2020). Nota: 1 kWh = 3,6 MJ. Note: Technical analysis performed based on pure methane.
42
44
46
48
50
52
54
56
58
60
0
10
20
30
40
50
60
0% 1% 2% 3% 4% 5% 6% 7% 8% 9% 10%11%12%13%14%15%16%17%18%19%20%
MJ/m
3
% H2
Wobbe Index and PCS variation with % H2
PCS Variation PCS limits Wobbe Variation Wobbe limits
• Natural gas circulating through the Spanish gas infrastructure
belongs, according to UNE-EN 437 to the Second Family, Group H.
The upper Wobbe Index is between 45.7 MJ/m3 and 54.7 MJ/m3.
And in terms of HCV, it's between 36.94 MJ/m3 and 47.74 MJ/m3.
• Mixture of natural gas with H2 results in another gas, whose main
properties (WI and HCV) vary depending on the volume ratio of
both.
• Addition of H2 decreases the calorific power of the mixture faster
than the Wobbe index.
• Permissible technical limit for the mixture of natural gas and
H2 is reached for a percentage of H2 volume of 11%, so
adaptation would be required.
05. Main barriers and benefits in the hydrogen market for cogeneration
48

Technical barriers: H2 injection limits in NG networks
In addition to the variation in the Wobbe index, another technical limitation to consider in the hydrogen mixture in the
natural gas network to power cogeneration engines and turbines, is the Methane Number (MN)1
1Sources: JENBACHER INNIO.
• The methane number is the measure of fuel gas resistance to
engine pounding (detonation) and is assigned to a performance-
based test fuel in a tap test unit with the same standard strike
intensity. Pure methane is assigned as a pounding-resistant
reference fuel with a methane number of 100.
• A low methane number involves knocking also called crank
chopping, which can lead to power reductions and/or
breakdowns.
• As in Spain the methane index is low, in the environment of 70,
(Russian gas has a methane number >80) by incorporating H2, it
will reduce it below 70, so the risk of power reductions will be
high.
• If the reference methane quantity is not reached and the chopping
regulation is activated, the ignition point is adjusted to full power
along with the engine management system; only then is the power
reduced.
0
10
20
30
40
50
60
70
80
90
100
50 15 2010
GN_Base NM_92 GN_Base NM_82 GN_Base NM_72
Effect of the variation in the number of methane (NM) of the H2 mixture on
Natural Gas1
% of H2 volume in the mix with the Natural Gas
Meth
ane N
um
ber
(NM
)
Mixtures of H2 to 3-5 vol.% in the natural gas network are
generally not considered serious. The highest rates of addition
of H2 to the natural gas network should be assessed on a
project-by-project1.
05. Main barriers and benefits in the hydrogen market for cogeneration
49
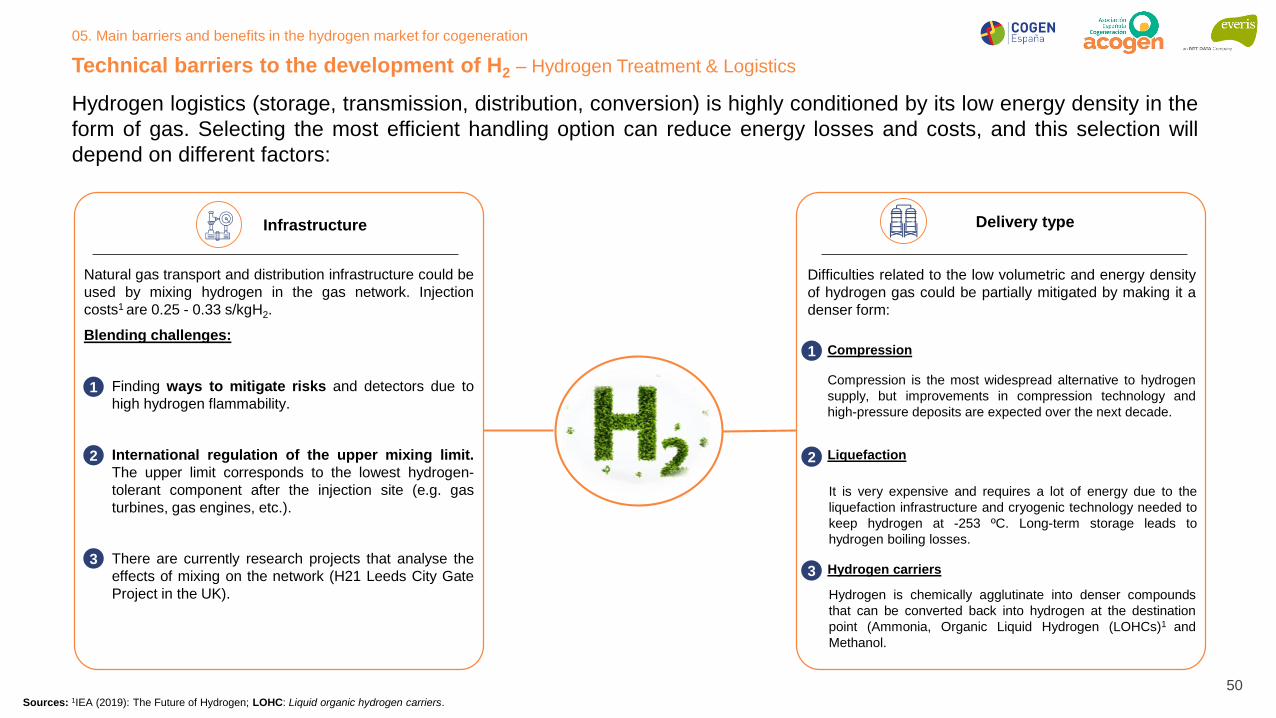
Hydrogen logistics (storage, transmission, distribution, conversion) is highly conditioned by its low energy density in the
form of gas. Selecting the most efficient handling option can reduce energy losses and costs, and this selection will
depend on different factors:
Technical barriers to the development of H2 – Hydrogen Treatment & Logistics
Sources: 1IEA (2019): The Future of Hydrogen; LOHC: Liquid organic hydrogen carriers.
Difficulties related to the low volumetric and energy density
of hydrogen gas could be partially mitigated by making it a
denser form:
Compression
Compression is the most widespread alternative to hydrogen
supply, but improvements in compression technology and
high-pressure deposits are expected over the next decade.
Liquefaction
Hydrogen carriers
It is very expensive and requires a lot of energy due to the
liquefaction infrastructure and cryogenic technology needed to
keep hydrogen at -253 ºC. Long-term storage leads to
hydrogen boiling losses.
Hydrogen is chemically agglutinate into denser compounds
that can be converted back into hydrogen at the destination
point (Ammonia, Organic Liquid Hydrogen (LOHCs)1 and
Methanol.
Natural gas transport and distribution infrastructure could be
used by mixing hydrogen in the gas network. Injection
costs1 are 0.25 - 0.33 s/kgH2.
Blending challenges:
Finding ways to mitigate risks and detectors due to
high hydrogen flammability.
International regulation of the upper mixing limit.
The upper limit corresponds to the lowest hydrogen-
tolerant component after the injection site (e.g. gas
turbines, gas engines, etc.).
There are currently research projects that analyse the
effects of mixing on the network (H21 Leeds City Gate
Project in the UK).
Infrastructure Delivery type
1
2
3
1
2
3
05. Main barriers and benefits in the hydrogen market for cogeneration
50

In the absence of specific regulation, there are a number of key regulatory recommendations for the development of H2
in Spain
Regulatory barriers for Hydrogen development in Spain
Sources: IRENA (2020), Green Hydrogen Cost Reduction: Scaling up Electrolysers to Meet the 1.5⁰C Climate Goal; ACER (2021): When and How to Regulate Hydrogen Networks?; Ministerio de Industria, Comercio y Turismo (2019):
Informe sobre la reglamentación actual y necesidades de desarrollo legislativo del hidrógeno. Directiva Europea 2018/2001 (REDII).
• Adaptation of existing regulations regulating
the transport of existing natural gas networks,
to include H2.
• Regulatory and ad hoc standardization
development for transport through exclusive
hydrogen distribution networks.
• Regulation of the minimum safety conditions to
be required of hydrogen storage facilities for
supply to residential buildings or tertiary
sector, whether supplied from packaging or
produced "on site" by renewable energy
sources (e.g., photovoltaic electrical production,
cogeneration).
INFRASTRUCTURE REGULATION
This will boost demand for green hydrogen.
Examples in this regard are:
• Government procurement (e.g., a percentage of
green steel for public infrastructure).
• Mixing mandates or quotas are also an
attractive alternative. Examples include
demanding a percentage or share of industrial
hydrogen to turn green, as already envisaged in
French and Portuguese strategies.
• Require that a percentage of gas demand be
covered by green hydrogen, or that a
percentage of navigation or aviation fuel be
sustainable.
MARKET CREATION POLITICS
Applicable from both a production and consumption
perspective.
• Technical Standards and Certifications that allow
to differentiate what is the hydrogen source that
is produced/consumed, and to be able to link it
to an additional premium or quota, while the
producer can validate lower CO2 emissions and
be remunerated accordingly. Under European
Directive 2018/2001 (REDII), on the promotion of
the use of energy from renewable sources,
Member States should have these certificates
available by 30 June 2021.
• Need for these systems to be internationally
accepted, compatible with other analogues
(electricity and gas) and with an adaptable
framework that can be adjusted based on the
experience gained once it has been
implemented.
NORMS & CERTIFICATIONS
05. Main barriers and benefits in the hydrogen market for cogeneration
51

Cogeneration in Spain can take a very important advantage of the process of transformation that is coming over the
energy paradigm with the emergence of green hydrogen
Benefits of cogeneration using renewable hydrogen– General benefits
Renewable hydrogen will enable the
cogeneration sector to become a 100%
greenhouse gas-free source of thermal and
electricity production.
Zero emissions
Under an umbrella of hydrogen boost incentive
policies, cogeneration may benefit from
financing instruments that will facilitate the
renewal and transformation of the sector.
Sector renewal
It will position the cogeneration sector in Spain
in its firm commitment to contribute to the
creation of an efficient, carbon-neutral, resilient
and decentralized European energy system by
2050. Helping to meet the objectives of the
PNIEC1.
Commitment to the system
It will strengthen the prominence of
cogeneration when it comes to being part of
distributed energy systems that allow the
integration of isolated energy communities.
Energy protagonism
Sources: 1Ministerio para la Transición Ecológica y el Reto Demográfico: Plan Nacional Integrado de Energía y Clima (2021-2030).
05. Main barriers and benefits in the hydrogen market for cogeneration
52

Main conclusions of the section – H2 Barriers & Opportunities for cogeneration
PRODUCTION COSTS OF RENEWABLE
H2 WITH DOWNWARD TREND
BLENDING AS THE MAIN TECHNICAL
CHALLENGE FOR H2 LOGISTICS
Hydrogen injection into today's gas network is
technically feasible up to a certain volume
that varies depending on the region being
considered. In Spain for example this limit is
around 11%.
Going forward, it is hoped that the necessary
investments will provide a more H2-adapted
infrastructure, which will facilitate its
permeability in order to achieve the objectives
of decarbonization of the energy system at
European and global level.
VECTOR OF OPPORTUNITIES AND
BENEFITS FOR COGENERATION OF THE
PRESENT AND THE FUTURE
Renewable hydrogen is an opportunity for
cogeneration to transform and adapt to a
decarbonized energy model that will allow it to
continue operating without relying on fossil-
based primary energy sources.
Factors such as the price of CO2, in clear trend
and bullish forecasting, together with the
opening of other expanding market niches such
as residential heat and in the tertiary sector, will
be able to allow cogeneration by the hand of
H2, to become a technology to be taken into
account in the energy mix of the coming
decades in Spain and Europe.
As of today, the costs of producing renewable
hydrogen place it at a clear competitive
disadvantage compared to the other two most
widely used types of hydrogen, such as grey
hydrogen and blue.
However, it is estimated that these costs will
end up being equated with the help of the
increasing penetration of renewable energies,
the commitment to their production on a larger
scale, the technological improvement in
electrolysis processes and the increase in the
CO2 cost.
Currently the application and use of renewable hydrogen by cogeneration presents a number of barriers of different
nature, which for the most part have views of being able to be overcome in the medium/long term
05. Main barriers and benefits in the hydrogen market for cogeneration
53

Co
nte
nid
o
06.
Business opportunities for cogeneration with Hydrogen
Renewable hydrogen supply models
Hydrogen deployment schemes within the cogeneration industry

06. Business opportunities for Hydrogen in cogeneration
In order to have a broad vision about the market opportunities that may exist in cogeneration, it becomes vital to
understand the different procurement models that may exist for obtaining renewable hydrogen
Renewable hydrogen supply models
WIND
SOLAR
ELECTROLYZER COGENERATION
Local hydrogen productionThe co-generator has infrastructure for the generation of
renewable electricity, as well as for its subsequent
transformation to H2
3. COGENERATOR
RENEWABLE ELECTRICAL ENERGY HYDROGEN
Merchant modelHydrogen is supplied by a third party, with a supply
contract similar to that which may exist with natural gas1. THIRD PARTY COGENERATOR
Provisioning contract
100% renewable energy purchaseA third party supplies renewable electricity so that it in
turn is transformed into H2 by the co-generator.2. COGENERATORTHIRD PARTY
PPA
Market purchase
(with certificates)
Provisioning models
55
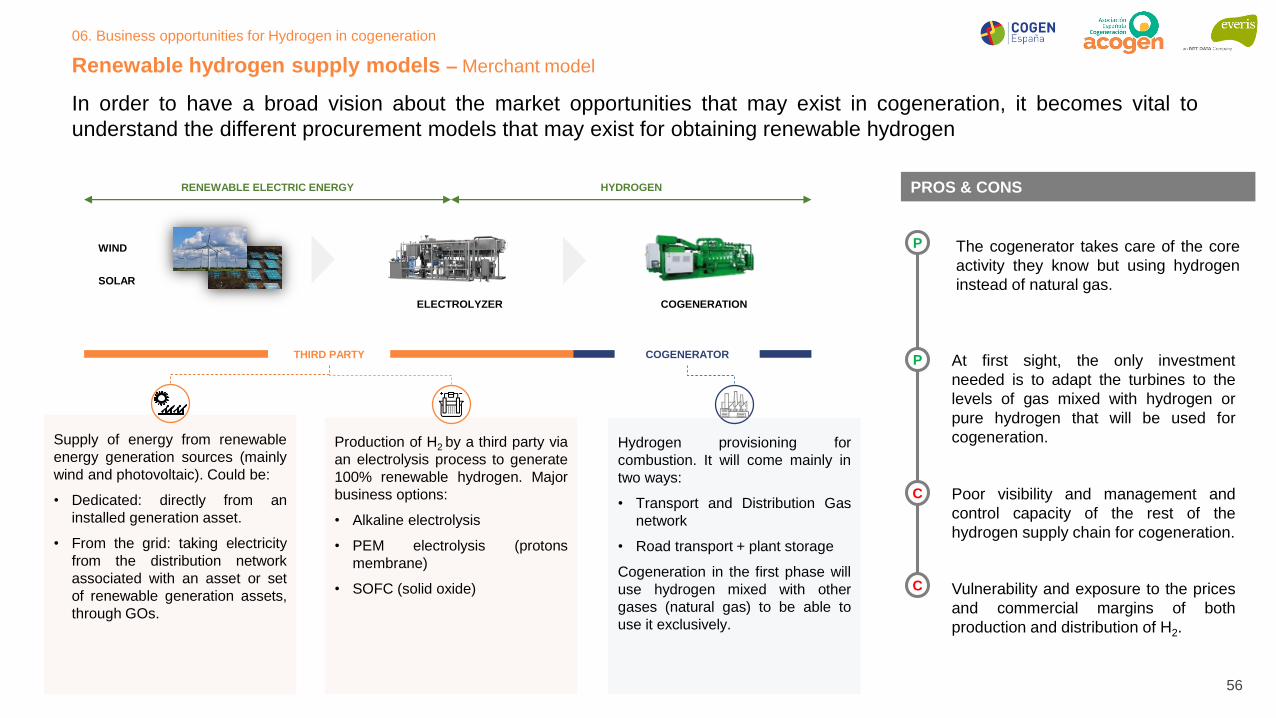
In order to have a broad vision about the market opportunities that may exist in cogeneration, it becomes vital to
understand the different procurement models that may exist for obtaining renewable hydrogen
Renewable hydrogen supply models – Merchant model
Supply of energy from renewable
energy generation sources (mainly
wind and photovoltaic). Could be:
• Dedicated: directly from an
installed generation asset.
• From the grid: taking electricity
from the distribution network
associated with an asset or set
of renewable generation assets,
through GOs.
Production of H2 by a third party via
an electrolysis process to generate
100% renewable hydrogen. Major
business options:
• Alkaline electrolysis
• PEM electrolysis (protons
membrane)
• SOFC (solid oxide)
WIND
SOLAR
ELECTROLYZER COGENERATION
RENEWABLE ELECTRIC ENERGY HYDROGEN
THIRD PARTY COGENERATOR
PROS & CONS
P
P
C
C
The cogenerator takes care of the core
activity they know but using hydrogen
instead of natural gas.
At first sight, the only investment
needed is to adapt the turbines to the
levels of gas mixed with hydrogen or
pure hydrogen that will be used for
cogeneration.
Poor visibility and management and
control capacity of the rest of the
hydrogen supply chain for cogeneration.
Vulnerability and exposure to the prices
and commercial margins of both
production and distribution of H2.
Hydrogen provisioning for
combustion. It will come mainly in
two ways:
• Transport and Distribution Gas
network
• Road transport + plant storage
Cogeneration in the first phase will
use hydrogen mixed with other
gases (natural gas) to be able to
use it exclusively.
06. Business opportunities for Hydrogen in cogeneration
56

In order to have a broad vision about the market opportunities that may exist in cogeneration, it becomes vital to
understand the different procurement models that may exist for obtaining renewable hydrogen
Renewable hydrogen supply models – 100% renewable electricity purchase
Energy supply from renewable
energy generation sources (wind
and photovoltaic mainly).
The provisioning of this electricity
could be through:
• Traditional power supply, with
GoOs.
• Bilateral contracts for the
purchase and sale of electricity
on time (PPA).
• Direct physical sale of the
renewable plant to the co-
generator.
Cogeneration invests in providing
an electrolyzer for the production of
green hydrogen, free of CO2
emissions.
Certification of both the renewable
electricity source used in the
process and the hydrogen
produced through it.
Hydrogen self-provisioning for its
combustion, and subsequent
generation of heat and electricity.
The development of logistics
infrastructure to supply H2 to the
cogeneration plant will depend on
where (distance) the electrolyzers
are located from the plant, thus
being able to be provisioned by:
• Pipes
• Road
WIND
SOLAR
ELECTROLYZER COGENERATION
RENEWABLE ELECTRIC ENERGY HYDROGEN PROS & CONS
P
P
P
C
The cogenerator is able to manage the
part of the production chain comprising
the electrolyzer and its distribution to
cogeneration.
The cogenerator improves the visibility
and management and control capability
of part of the hydrogen supply chain for
cogeneration, but still has no complete
independence.
Active supply control and management
options arise such as PPAs or
traditional supply contracts.
The necessary investment increases
since in addition to having to adapt the
cogeneration technology itself to
hydrogen, the electrolyzer must be
acquired, exploited and maintained.
COGENERATORTHIRD PARTY
06. Business opportunities for Hydrogen in cogeneration
57

In order to have a broad vision about the market opportunities that may exist in cogeneration, it becomes vital to
understand the different procurement models that may exist for obtaining renewable hydrogen
Renewable hydrogen supply models – Local hydrogen production
Provision of the complete hydrogen
supply cycle.
Investment/disposition of renewable
electricity generation assets.
Cogeneration invests in providing
an electrolyzer for the production of
green hydrogen, free of CO2
emissions.
Hydrogen self-provisioning for its
combustion, and subsequent
generation of heat and electricity.
The development of logistics
infrastructure to supply H2 to the
cogeneration plant will depend on
where (distance) the electrolyzers
are located from the plant, thus
being able to be provisioned by:
• Pipes
• Road
WIND
SOLAR
ELECTROLYZER COGENERATION
RENEWABLE ELECTRIC ENERGY HYDROGEN PROS & CONS
P
P
C
C
The cogenerator is able to manage the
entire hydrogen supply chain they need
for cogeneration.
Virtually total energy independence is
available so exposure to certain risks is
significantly mitigated (margins and
prices of third parties).
Business complexity increases and the
learning curve takes a set of time for
efficient operational running in.
The investment required for the model
is undoubtedly the largest of those
raised by covering the entire hydrogen
supply chain.
COGENERATOR
06. Business opportunities for Hydrogen in cogeneration
58

Based on H2 implementation scenarios as well as procurement models, two major business opportunities have been
identified that can break into the co-generating industry to become 100% renewable.
Hydrogen deployment schemes within the cogeneration industry
H2 PRODUCTION H2 CONSUMPTION
Wind
Photovoltaic
HydrogenElectricity
Heat
Cogeneration
Energy
markets
End
consumption
Electricity
Potential hydrogen deployment schemes in cogeneration
AConsumption of renewable hydrogen
BHydrogen Producer and Consumer
Substitution of current fuels for cogeneration by renewable
hydrogen, in such a way that all the benefits that this technology
brings to the system can be exploited, guaranteeing the energy
transition.
Installation of all the necessary infrastructure for the production of
renewable hydrogen to enable its subsequent use for heat
generation in non-electrifiable processes, as well as in hydrogen-
and heat-intensive industries.
06. Business opportunities for Hydrogen in cogeneration
59
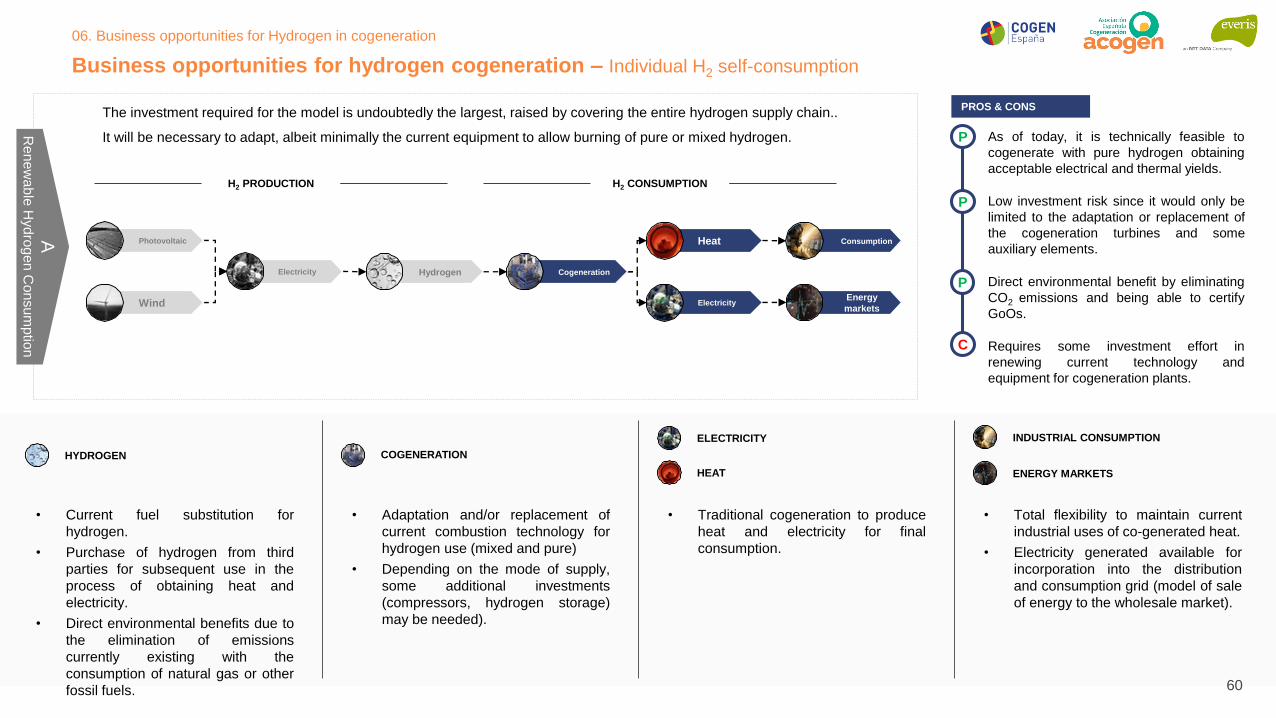
Business opportunities for hydrogen cogeneration – Individual H2 self-consumption
H2 PRODUCTION H2 CONSUMPTION
HYDROGEN
• Current fuel substitution for
hydrogen.
• Purchase of hydrogen from third
parties for subsequent use in the
process of obtaining heat and
electricity.
• Direct environmental benefits due to
the elimination of emissions
currently existing with the
consumption of natural gas or other
fossil fuels.
COGENERATION
• Adaptation and/or replacement of
current combustion technology for
hydrogen use (mixed and pure)
• Depending on the mode of supply,
some additional investments
(compressors, hydrogen storage)
may be needed).
ELECTRICITY
HEAT
• Traditional cogeneration to produce
heat and electricity for final
consumption.
INDUSTRIAL CONSUMPTION
ENERGY MARKETS
• Total flexibility to maintain current
industrial uses of co-generated heat.
• Electricity generated available for
incorporation into the distribution
and consumption grid (model of sale
of energy to the wholesale market).
P
P
P
C
As of today, it is technically feasible to
cogenerate with pure hydrogen obtaining
acceptable electrical and thermal yields.
Low investment risk since it would only be
limited to the adaptation or replacement of
the cogeneration turbines and some
auxiliary elements.
Requires some investment effort in
renewing current technology and
equipment for cogeneration plants.
Direct environmental benefit by eliminating
CO2 emissions and being able to certify
GoOs.
PROS & CONSThe investment required for the model is undoubtedly the largest, raised by covering the entire hydrogen supply chain..
It will be necessary to adapt, albeit minimally the current equipment to allow burning of pure or mixed hydrogen.
AR
en
ew
ab
le H
yd
rog
en
Co
nsu
mp
tion
Wind
Photovoltaic Heat
Hydrogen Cogeneration
Energy
markets
Consumption
Electricity
Electricity
06. Business opportunities for Hydrogen in cogeneration
60

Business opportunities for hydrogen cogeneration – H2 producer and consumer
H2 PRODUCTION H2 CONSUMPTION
HYDROGEN
• Sourcing models based on electrical
self-consumption or the purchase of
renewable electricity (GoOs and
PPAs market)) .
• If a renewable installation is opted
for, there is complete independence
in renewable energy production for
heat generation.
• Replacing current fuel with
hydrogen.
• Control and management of the rate
of hydrogen production (adaptation
to consumption)
• Direct environmental benefits due to
the elimination of current emissions
from natural gas consumption.
• Traditional but CO2 emission-free
cogeneration processes.
• Use of co-generated electricity to:
• Self-consumption.
• Market selling.
INDUSTRIAL CONSUMPTION
ENERGY MARKETS
• Total flexibility to maintain current
industrial uses of co-generated heat.
• Electricity generated available for
incorporation into the distribution
and consumption network (model of
sale of energy to the wholesale
market).
P
C
Total control of the hydrogen value chain,
managing the electricity supply source, the
production of H2 and its consumption through
the cogeneration process. This enables
comprehensive management and planning of H2
production and consumption by the
cogeneration plant, as well as absolute
adaptability to variations in consumption needs.
Requires extra investment in renewable power
generation technology (for PEM electrolysis
between 55-70 kWh/kgH2)1. For photovoltaic
energy, current costs are around 24.47
euros/MWh and for wind power the 25.31
euros/MWh2.
PROS & CONSIn heat-intensive and hydrogen-intensive industries, investment in electrolysers for renewable hydrogen generation needed for both
heat generation and H2-intensive production processes would make a greater sense.
There is also the possibility of marketing potential hydrogen surplus from production or third-party contracts.
BH
2 p
rod
uce
r an
d c
on
su
me
r
RENEWABLE ELECTRICITY
WIND
PHOTOVOLTAIC
HEAT
ELECTRICITY
COGENERATION
Wind
Photovoltaic Heat
Hydrogen Cogeneration
Energy
markets
Consumption
Electricity
Electricity
06. Business opportunities for Hydrogen in cogeneration
61

Main conclusions of the section – H2 business models in cogeneration
DIFFERENT PROVISIONING SCENARIOS
FOR COGENERATION
BUSINESS MODELS WITH THE SAME
ESSENCE BUT AIMED AT
TRANSFORMATION
With renewable hydrogen, cogeneration in
Spain is opened up to a number of business
opportunities to consider:
- Renewable hydrogen consumption: in heat
and hydrogen intensive industries.
- H2 producer and consumer: in heat-
intensive and hydrogen-intensive
industries.
Three different models of renewable hydrogen
supply are proposed, each with greater
decision-making capacity by the co-generator
throughout the H2 value chain:
- Merchant: hydrogen is supplied by a third
party, similar to what might exist with
natural gas.
- 100% renewable electricity purchase: only
the supply of electricity for renewable H2
production is negotiated.
- Local hydrogen production: the role of
producer of electricity and hydrogen are
assumed to obtain a final scheme similar to
self-consumption.
Business models adapted to the next energy transformation scenario with renewable hydrogen appear under different
forms of supply of both energy and fuel
06. Business opportunities for Hydrogen in cogeneration
62

Co
nte
nid
o
07.
ConclusionsMain conclusions drawn from the analysis

07. Conclusions
Main conclusions - General
• Spain is currently the 5th country in Europe in annual consumption of H2 with 500 kt. It is anticipated that with the commitment to hydrogen as a vector for the
decarbonization of industry, transport, tertiary sector, etc. it will increase.
• With renewable energy surpluses planned for 2030, hydrogen is running as a firm candidate for use under the Power-2-Gas formula.
1 H2: A GROWING MARKET
• Spain is strongly committed to the development of hydrogen with planned investments of 8.9 billion euros up to 2030.
• The set target is to reach 4 GW of installed electrolyze capacity, which is the target set by the H2 roadmap for 2030 and 10% of the target set by the EU for
the same time horizon.
• In this sense, Spain, thanks to its wind and solar resources, its geographical location and current natural gas network infrastructure, has the opportunity to
become a hub for renewable H2, not only for domestic consumption but also for export to other EU countries.
2 SPAIN AND THE UE BET ON H2 AS THE DECARBONIZATION VECTOR
• Taking into consideration the objectives of climate neutrality or the projection of CO2 prices, use of H2 or other renewable gases in technologies such as
cogeneration, can substitute other more polluting fuels, when it comes to decarbonizing industry intensive in domestic heat demand.
3 DECARBONIZATION OF NON-ELECTRIFIABLE INDUSTRY
By way of summary and compilation, the main conclusions of this study are shown below:
64

• Hydrogen production technologies are constantly evolving. Thanks to public and private research efforts, systems are expected to become more economical,
robust and durable. This will make green H2 more competitive in the future.
4 RENEWABLE HYDROGEN PRODUCTION TECHNOLOGY IS IN CONSTANT EVOLUTION
• A favorable policy and regulatory framework will be key for the development of H2 at the national level. In this sense, it is key to establish market creation
policies (such as, for example, minimum blending quotas), the use and capacity of infrastructures, in terms of blending and safety, the development of
regulations that do not block any business model or the operating structure of certificates of origin for renewable H2.
5 REGULATION
• Over the decade ahead, production costs for renewable H2 are expected to fall to 1.5-2 €/kg compared to 3.5-5 €/kg at present.
• Its main levers of competitiveness will revolve around improved technology, operational efficiencies, economies of scale and the price of CO2.
6 HIGH BUT DECREASING COSTS
Notes: 1 kg H2 is equivalent to 33.3 kWh of energy; 58 kWh of electricity is needed to produce 1 kg H2.
07. Conclusions
Main conclusions - General
By way of summary and compilation, the main conclusions of this study are shown below:
65

Main conclusions – Use of H2 for cogeneration
• Hydrogen is one of the most promising alternatives for the renewal of current cogeneration plants, which are reaching the end of their useful life, and which
will be necessary, according to the PNIEC, to maintain the management of the electricity system.
• The technological adaptation of cogeneration to hydrogen consumption is a reality, with a wide variety of suppliers able to provide engines and turbines
suitable for H2 consumption.
• Limitations to its consumption come from the adaptability of existing natural gas transport and distribution networks (blending of up to 11% by volume).
7 H2 AND COGENERATION, TECHNICALLY VIABLE
• Based on emission-free heat and power generation, to meet the future demands of industry and the tertiary sector, while maintaining its values of self-
consumption, high efficiency and flexibility.
• Cogeneration will be key to the efficient integration of the energy system at a local level, complementing the electrification and decarbonization of industrial
and residential heating/cooling.
8 THERE ARE EXISTING BUSINESS MODELS FOR COGENERATION AND HYDROGEN
• Cogeneration provides competitive advantages that have already been demonstrated and are in line with the objectives of European directives, such as high
efficiency (providing savings of at least 10% of primary energy compared to other technologies), industrial self-consumption and distributed generation.
• This is particularly relevant in a scenario of high renewable penetration, where conventional generation technologies such as cogeneration will be needed to
maintain grid stability.
• Cogeneration will in turn provide capacity to serve as a balance to the electricity system under a distributed generation scheme, satisfying as much as
possible the flexibility needs demanded by the System Operator.
9 COMPETITIVENESS, FLEXIBILITY AND NETWORK STABILITY
07. Conclusions
By way of summary and compilation, the main conclusions of this study are shown below:
66

Co
nte
nid
o
ANEXESH2 global market
H2 value chain
Current uses for H2
H2 production
H2 Logistics

The demand for hydrogen has increased since 1975 due to the rise in the global market for its main applications: refining
and production of ammonia (Pure Hydrogen) and methanol (Blended Hydrogen).
Global H2 market – Historical consumption
ANEXESG
LO
BA
L P
UR
E H
YD
RO
GE
N
DE
MA
ND
1
GL
OB
AL
BL
EN
DE
D
HY
DR
OG
EN
DE
MA
ND
1
• The main reasons that have contributed to the increase of
the global pure hydrogen demand are:
o Stricter oil quality standards, aiming at a progressive
reduction of sulphide content in refinery products,
resulting in an increased demand for hydrogen for
impurity removal processes.
o The demand for hydrogen for ammonia production is
related to the growth of the fertilizer industry
(where the main uses of ammonia occur), which has
increased by an average of 1.4% per year over the last
decade (2006-2016)2.
• Global demand for blended hydrogen has also increased due
to the growth of the methanol production industry (CAGR
14-19=5.4%)3 and the high use of hydrogen as a mixed gas in
industrial processes.
TO
TA
L h
yd
rog
en
de
ma
nd
in
20
18
~ 1
16
MtH
2
+32%
in t
he p
eriod 2
010
-2018
MtH
2
18,224,5
30,435,3
39,8
52,5 54,1
62,4
71,7 73,9
0,0
10,0
20,0
30,0
40,0
50,0
60,0
70,0
80,0
90,0
100,0
1975 1980 1985 1990 1995 2000 2005 2010 2015 2018
Oil Refining Ammonia Other Total
~ 73.9 MtH2 in 2018+18%
MtH
2
8,3 9,8 11,114,1 15,9 17,1
20,925,1
32,2
42,0
0,0
10,0
20,0
30,0
40,0
50,0
60,0
70,0
80,0
90,0
100,0
1975 1980 1985 1990 1995 2000 2005 2010 2015 2018
Methanol DRI Other Total
~ 42.0 MtH2 in 2018
+67%
WHY HAS THE HYDROGEN DEMAND INCREASED?
Sources: 1IEA (2019): The Future of Hydrogen; 2YARA (2018): Yara Fertilizer Industry Handbook; 3Methanol Institute (2019): Methanol World Supply & Demand Summary.
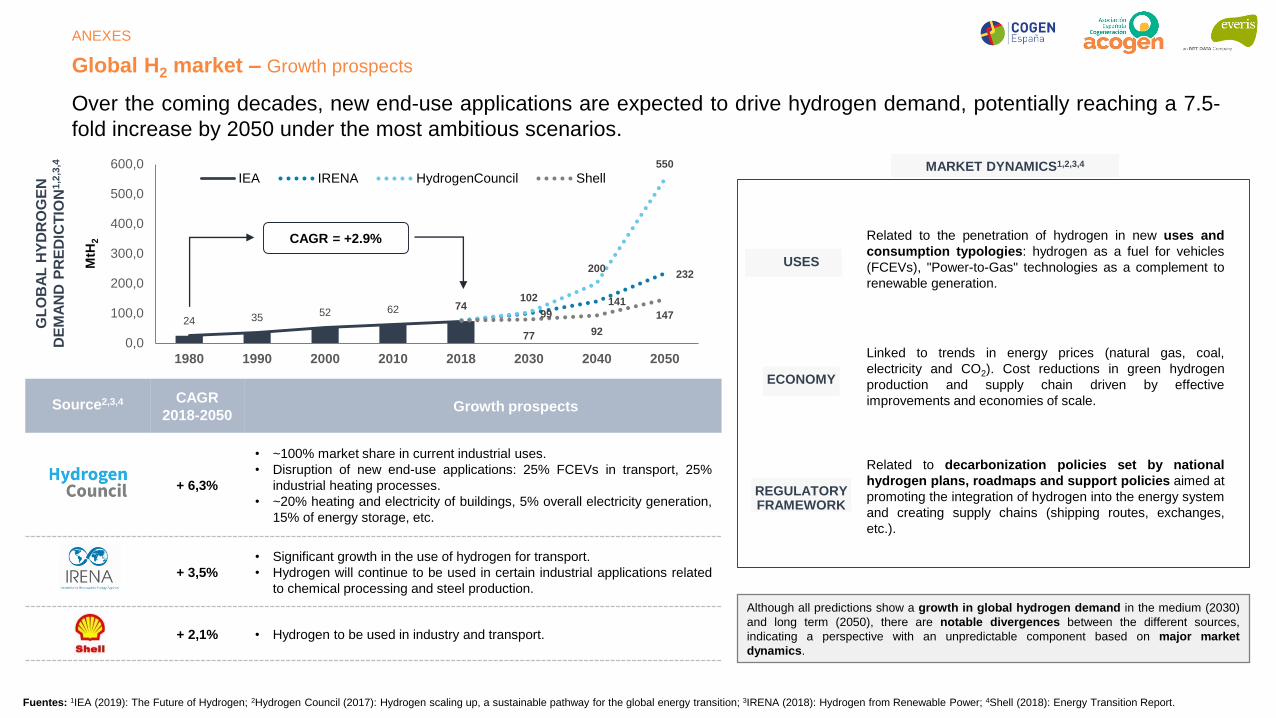
Over the coming decades, new end-use applications are expected to drive hydrogen demand, potentially reaching a 7.5-
fold increase by 2050 under the most ambitious scenarios.
Global H2 market – Growth prospects
ANEXESG
LO
BA
L H
YD
RO
GE
N
DE
MA
ND
PR
ED
ICT
ION
1,2
,3,4
24 3552 62 99
141
232
74102
200
550
77 92
147
0,0
100,0
200,0
300,0
400,0
500,0
600,0
1980 1990 2000 2010 2018 2030 2040 2050
IEA IRENA HydrogenCouncil Shell
MtH
2 CAGR = +2.9%
Source2,3,4 CAGR
2018-2050Growth prospects
+ 6,3%
• ~100% market share in current industrial uses.
• Disruption of new end-use applications: 25% FCEVs in transport, 25%
industrial heating processes.
• ~20% heating and electricity of buildings, 5% overall electricity generation,
15% of energy storage, etc.
+ 3,5%
• Significant growth in the use of hydrogen for transport.
• Hydrogen will continue to be used in certain industrial applications related
to chemical processing and steel production.
+ 2,1% • Hydrogen to be used in industry and transport.
Although all predictions show a growth in global hydrogen demand in the medium (2030)
and long term (2050), there are notable divergences between the different sources,
indicating a perspective with an unpredictable component based on major market
dynamics.
Fuentes: 1IEA (2019): The Future of Hydrogen; 2Hydrogen Council (2017): Hydrogen scaling up, a sustainable pathway for the global energy transition; 3IRENA (2018): Hydrogen from Renewable Power; 4Shell (2018): Energy Transition Report.
MARKET DYNAMICS1,2,3,4
Related to the penetration of hydrogen in new uses and
consumption typologies: hydrogen as a fuel for vehicles
(FCEVs), "Power-to-Gas" technologies as a complement to
renewable generation.
Linked to trends in energy prices (natural gas, coal,
electricity and CO2). Cost reductions in green hydrogen
production and supply chain driven by effective
improvements and economies of scale.
Related to decarbonization policies set by national
hydrogen plans, roadmaps and support policies aimed at
promoting the integration of hydrogen into the energy system
and creating supply chains (shipping routes, exchanges,
etc.).
USES
ECONOMY
REGULATORY FRAMEWORK

The export/import trend shows that Asia Pacific has been the leading region in the hydrogen market, aligning with the high
demand rate for today's industrial applications.
H2 Global Market – Exports and Imports
GLOBAL HYDROGEN EXPORTS IN 20171 GLOBAL HYDROGEN IMPORTS IN 20171
• Asia Pacific is the largest hydrogen exporting/importing region due to its high traffic in ammonia production and oil refining2. It is expected to continue like this in the coming years
• The Asia Pacific market (especially China, Japan and South Korea) is expected to grow in the short term due to the development of national policies that seek to stimulate hydrogen penetration
into the transport and heating and electricity sectors of buildings3.
• Australia, due to its generation mix, geographic positioning and LNG shipping routes, is well positioned to meet the demand for Asia Pacific hydrogen by developing its productive capacity.
• The hydrogen market in Europe has been led by Germany, which has had hydrogen support policies since 20103.
• North America is a net exporter of hydrogen due to its competitive production costs driven by low natural gas prices4.
15% 11%
4.8%
1.1%
11%
4.9%
3.3%
19%
3%
2.7%
24%
15%
6.7%
1.7%
2.6%2.1%
5.7%
7.8%
3.1%
2.7%
FU
TU
RE
TR
EN
DS
Sources: 1Observatory of Economic Complexity; 2MarketsandMarkets; 3ACIL ALLEN (2018): Opportunities for Australia from Hydrogen Exports; 4IEA (2019): The Future of Hydrogen.
Global market value in 2017
11.7 B$
RegionAsia and
Middle EastEurope North America
South
AmericaOceania Africa
Exports 45.6% 28.7% 20.5% 3.1% 1.1% 1.0%
RegionAsia and
Middle EastEurope North America
South
AmericaOceania Africa
Imports 65% 26% 7.5% 0.83% 0.47% 0.46%
ANEXES

Europe is now a net hydrogen exporter. Its hydrogen generation capacity is largely the so-called "grey H2", with Germany
and the Netherlands being the largest producers of H2
H2 Value Chain – European context - Production
ProductionH2 carriers
(Secondary sources)ConsumptionTransport and Distribution
Technology suppliers Engineering and construction Energy companies & tradersIndustrial gases
91%
7%
By-product
2%
Fossil
Renewable
MA
IN
PL
AY
ER
S(3
)
Hydrogen generation and demand capacity by country(1)
Sources: 1Fuel Cells and Hydrogen Observatory; 2Hydrogen europe: Clean energy – Monitor 2020; 3Selfmade
H2 generation capacity by technology %, 2020(2)
0
250
500
750
1.000
1.250
1.500
1.750
2.000
2.250
2.500
Germ
any
Ne
therl
and
s
Pola
nd
Ita
ly
Fra
nce
Spain
Belg
ium
UK
Ro
man
ia
Czech R
ep.
Lithu
ania
Bulg
aria
Austr
ia
Hu
nga
ry
Slo
vakia
No
rwa
y
Fin
land
Sw
ede
n
Cro
atia
Gre
ece
Port
ug
al
Esto
nia
Sw
itzerl
and
De
nm
ark
Icela
nd
Slo
ven
ia
Irela
nd
Lu
xe
mbu
rg
Lie
chte
nste
in
Le
ton
ia
Cypru
s
Ma
lta
Metric tons per year (in thousands), 2020
By-product
On-site
Merchant
Demand
ANEXES

Much of the H2 consumption is done in the production of ammonia and methanol, which in turn can be used to port H2 to
destination, which has generated international projects to increase transport infrastructure.
H2 Value Chain – European context– Secondary sources; Transport & Distribution
ProductionH2 carriers
(Secondary sources)ConsumptionTransport & Distribution
MA
IN
PL
AY
ER
S(3
)
H2 generation capacity for chemical applications Metric tons per day, 2020(1)
Sources: 1Fuel Cells and Hydrogen Observatory; 2Gas for climate – European Hydrogen Backbone; 3Selfmade
European project backboneInfrastructure development prospects for transport and distribution(2)
1.000
2.000
0
500
1.500
2.500
Ire
land
Ne
the
rla
nd
s
Slo
va
kia
Sw
itze
rla
nd
Ro
ma
nia
Fin
land
Fra
nce
Be
lgiu
m
Ge
rma
ny
No
rwa
y
Lith
ua
nia
Esto
nia
Bu
lga
ria.
Hu
ng
ary
Po
land
Ita
ly
Au
str
ia
Sp
ain
Cro
atia
Cze
ch R
ep.
Sw
ede
n
Gre
ece
Po
rtu
ga
l
Ice
land
De
nm
ark
UK
+549%
Methanol
Ammonia
Other chemicals
2030 2040
Ammonia Producers Methanol Producers Distribution companiesTransportation companies
ANEXES

Industries with a high H2 consumption are refining and chemical industry, with the most consuming countries being those
with the largest generation capacity, which reaffirms that there is currently no widespread international market for H2.
H2 Value Chain – European context - Consumption
ProductionH2 carriers
(Secondary sources)ConsumptionTransport and Distribution
500.000
1.500.000
2.000.000
0
1.000.000
Po
lan
d
Be
lgiu
m
Gre
ece
Sp
ain
Fra
nce
Ita
ly
UK
Hu
ng
ary
Lith
ua
nia
Au
str
ia
Cze
ch R
ep.
Luxe
mb
urg
Cro
atia
Slo
va
kia
Fin
land
Ro
ma
nia
Bu
lga
ria
No
rwa
y
Ire
land
Po
rtu
ga
l
Sw
itze
rlan
d
Ge
rma
ny
De
nm
ark
Ice
land
Esto
nia
Slo
ve
nia
Sw
ede
n
Leto
nia
Cyp
rus
Ma
lta
Ne
the
rla
nd
s
Lie
chte
nste
in
+266%
Others
Ammonia
Methanol
Refining
H2O2
Other chemicals
Energy
Estimated hydrogen consumption by sectorMetric tons per year, 2020(1)
Sources: 1Fuel Cells and Hydrogen Observatory; 2Hydrogen europe: Clean energy – Monitor
Estimated hydrogen consumption by sectorMetric tons per year, Europe, 2020(2)
34%
45%
5%
7%
8%
Others
Ammonia
Other chemicals
Refining
Methanol
Energy
1%
ANEXES
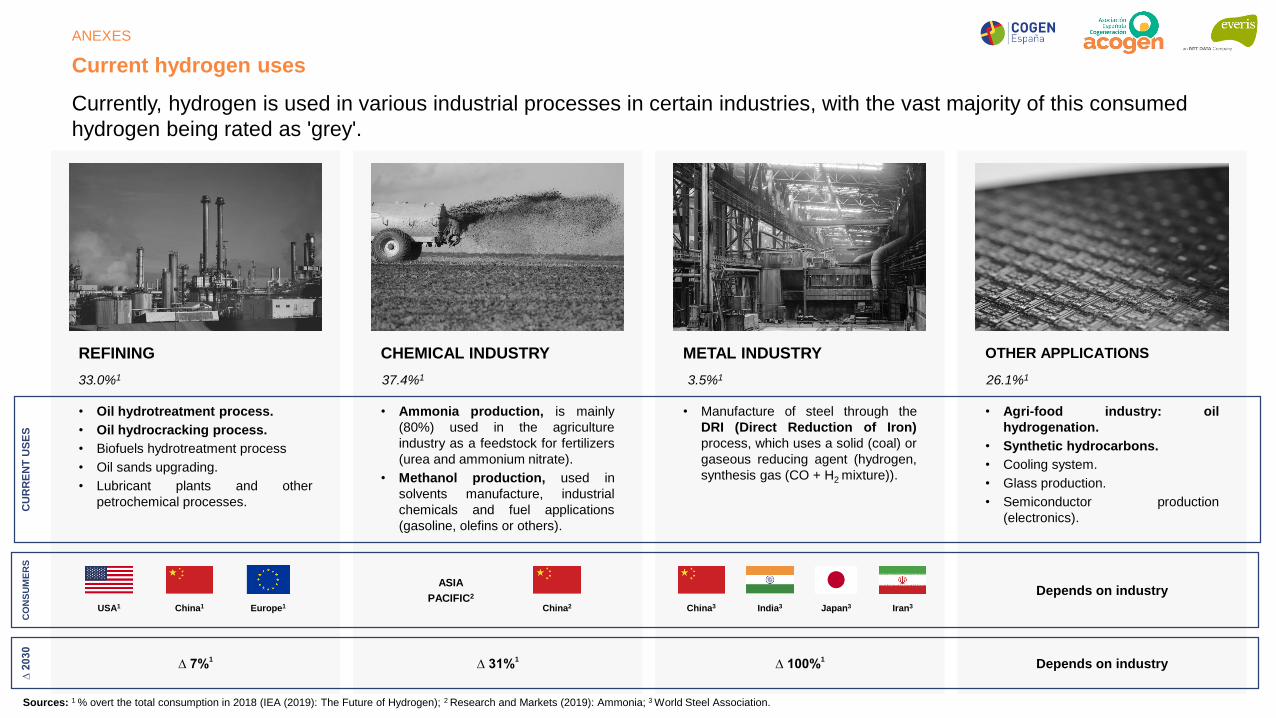
Current hydrogen uses
OTHER APPLICATIONSREFINING CHEMICAL INDUSTRY METAL INDUSTRY
• Oil hydrotreatment process.
• Oil hydrocracking process.
• Biofuels hydrotreatment process
• Oil sands upgrading.
• Lubricant plants and other
petrochemical processes.
• Ammonia production, is mainly
(80%) used in the agriculture
industry as a feedstock for fertilizers
(urea and ammonium nitrate).
• Methanol production, used in
solvents manufacture, industrial
chemicals and fuel applications
(gasoline, olefins or others).
• Manufacture of steel through the
DRI (Direct Reduction of Iron)
process, which uses a solid (coal) or
gaseous reducing agent (hydrogen,
synthesis gas (CO + H2 mixture)).
• Agri-food industry: oil
hydrogenation.
• Synthetic hydrocarbons.
• Cooling system.
• Glass production.
• Semiconductor production
(electronics).
33.0%1 37.4%1 3.5%1 26.1%1
CU
RR
EN
T U
SE
SC
ON
SU
ME
RS
∆ 2
030
∆ 7%1
∆ 31%1
∆ 100%1
Depends on industry
Depends on industryASIA
PACIFIC2
USA1 China1 Europe1 China2 China3 India3 Japan3 Iran3
Sources: 1 % overt the total consumption in 2018 (IEA (2019): The Future of Hydrogen); 2 Research and Markets (2019): Ammonia; 3 World Steel Association.
Currently, hydrogen is used in various industrial processes in certain industries, with the vast majority of this consumed
hydrogen being rated as 'grey'.
ANEXES

Current hydrogen uses – Oil refining
HYDROGEN USES DESCRIPTION1: GLOBAL MARKET VISION2: PERSPECTIVES:
• In 2018, 38 MtH2, 33% of global hydrogen demand,
were used for oil refining processes dedicated to the
production of fuels such as gasoline, diesel, aircraft
fuel, etc.
• Among others, the greatest hydrogen use was in two
refining processes:
o Hydrotreatment: dedicated to improving the
quality of petroleum fractions from desulfury
processes, removal of impurities, conversion of
olefins to paraffins, and other.
o Hydrocracking: dedicated to breaking down long-
chain hydrocarbons to form shorter chains in the
gasoline range.
• The hydrogen demand of refineries depends on the
configuration of their processes and the quality of their
raw materials, relative to their sulfide content. On
average, hydrogen supply to refineries in 2018 came
from:
o On-site hydrogen production (~40%).
o Hydrogen derived from the refining process
(~33%).
o Hydrogen supplied by marketers (Merchant)
(~27%)
Oil refining capacity (thousands of barrels/day)
Total globally:
100,049
thousand
barrels/day
• Current environmental fuel requirements
are facilitating the growth of demand for
hydrogen as a raw material in refineries.
These requirements, among others, are
forcing the reduction of sulphur content
levels in fuels (e.g., China), increasing the
demand for hydrogen in Hydrotreatment
and Hydrocracking.
• Environmental restrictions and high CO2
prices could increase investments in the
association of hydrogen production from
the reform/gasification of fossil fuels with
CCUS and the reduction of costs in CO2
refining. Obtaining green hydrogen from
water electrolysis is being analyzed and
Shell is developing a pilot project with a
10MW unit.
RegionRefining
Capacity 2018Market share
CAGR
07-17
CAGR
17-18
Asia-Pacific 34,752 34.7% +2.4% +2.8%
North
America22,333 22.3% +0.5% +1.1%
Europe 15,681 15.7% -1.3% +1.7%
Middle East 9,704 9.7% +2.3% +2.5%
Eurasia 8,166 8.2% 1.6% -0.3%
South
America5,979 6.0% -0.5% -3.9%
Africa 3,434 3.4% 1.3% -0.1%
15,655 thousand barrels/day (15.6%)
18,762 thousand barrels/day (18.8%)
3,343 thousand barrels/day (3.3%)
6,596 thousand barrels/day (6.6%)
4,972 thousand barrels/day (5.0%)
3,346 thousand barrels/day (3.3%)
2,835 thousand barrels/day (2.8%)
Sources: 1IEA (2019): The Future of Hydrogen; 2BP (2019): BP Statistical Review of World Energy 2019.
CO
UN
TR
IES
BY
RE
FIN
ING
CA
PA
CIT
Y
ANEXES

Current hydrogen uses – Chemical Industry - Ammonia
HYDROGEN USES DESCRIPTION: GLOBAL MARKET VISION: PERSPECTIVES:
Sources: 1IEA (2019): The Future of Hydrogen; 2Research and Markets (2019): Ammonia Market; 3YARA (2018): Yara Fertilizer Industry Handbook; 4U.S. Geological Survey (2019): Mineral Commodity Summaries 2019. 4Ammonia Energy Association
(2019). 5 Hydrogen Council (2020):Path to hydrogen competitiveness A cost perspective
• Global ammonia production is
estimated to increase by 6% over the
next 3 years4.
• The IEA considers that global hydrogen
demand for ammonia production will
increase from 31 MtH2 in 2018 to 38
MtH2 in 2030 (+22% or CAGR 18-30 x
1.7%) due to growth in the fertilizer
market, industrial ammonia
applications and the use of ammonia
as a hydrogen carrier. This assumption
by the EEA corresponds to the growth in
ammonia demand by +1.9% per annum
between 2006 and 20163.
• The production of ammonia from green
hydrogen is expected to increase costs
by 60% (480 s/ton NH3)5.
• In 2018, 31 MtH2 were used for ammonia
production, forming 27% of global hydrogen
demand and 67% of demand in the chemical
industry1.
• Most of the production of ammonia (~80%)2 was
subsequently used as a raw material for the
manufacture of nitrogen-based fertilizers, which
in turn accounts for around 57% of the global
fertilizer industry3:
o Urea (~53%).
o Ammonium nitrate (~27%).
o DAP/MAP, NPK, other nitrogen-based
products. (~20%)
• Remaining production of ammonia (~20%) is used
for industrial applications:
o In heat exchange processes such as
refrigerant gas.
o Manufacture: plastics, synthetic fibers,
explosives, resins and other materials.
• Hydrogen is the main cost in ammonia production.
Most ammonia exporters are located in natural gas-
rich countries with cheap access to these resources.
44 M tons (31%)
12.5 M tons (9%)
6.0 M tons (4%)
14 M tons (10%)
11 M tons (8%)
4.1 M tons (3%)
10%
4%
12%
4%
9%
11%
50%
North America
Middle East
South America
Africa
Europe
Eurasia
Asia
In 2016, 11% of the world's ammonia production was earmarked for
commercialization (18.5M tons).
25%20%
8% 7% 7%
Trinidad &Tobago
Russia Saudi Arabia Algeria Canada
26%
15% 6% 5% 5%
USA India Morocco Korea Belgium
5 B
IGG
ES
T
EX
PO
RT
ER
S5 B
IGG
ES
T
IMP
OR
TE
RS
.
MA
IN A
MM
ON
IA
PR
OD
UC
ER
S I
N 2
01
84
Total globally =
140 M tons
AM
MO
NIA
MA
RK
ET
ER
S3
HY
DR
OG
EN
DE
MA
ND
FO
R
AM
MO
NIA
PR
OD
UC
TIO
N I
N
20
18
1
ANEXES
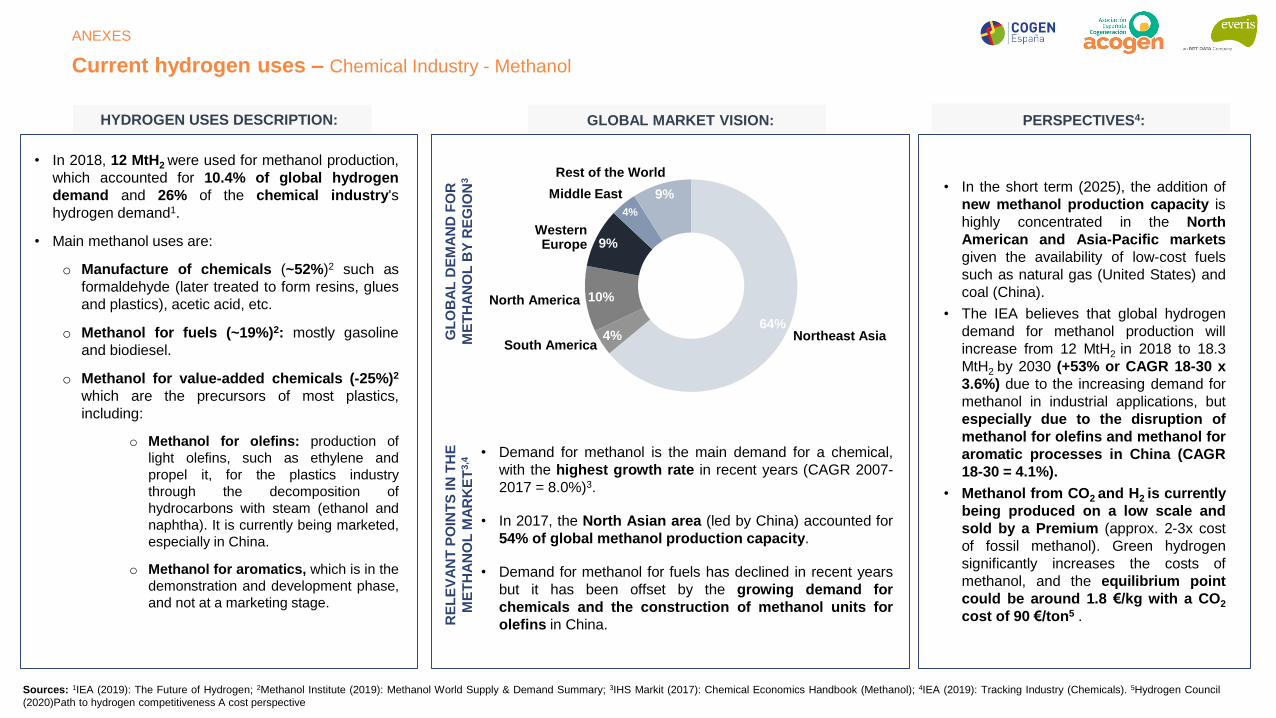
GLOBAL MARKET VISION: PERSPECTIVES4:
• In 2018, 12 MtH2 were used for methanol production,
which accounted for 10.4% of global hydrogen
demand and 26% of the chemical industry's
hydrogen demand1.
• Main methanol uses are:
o Manufacture of chemicals (~52%)2 such as
formaldehyde (later treated to form resins, glues
and plastics), acetic acid, etc.
o Methanol for fuels (~19%)2: mostly gasoline
and biodiesel.
o Methanol for value-added chemicals (-25%)2
which are the precursors of most plastics,
including:
o Methanol for olefins: production of
light olefins, such as ethylene and
propel it, for the plastics industry
through the decomposition of
hydrocarbons with steam (ethanol and
naphtha). It is currently being marketed,
especially in China.
o Methanol for aromatics, which is in the
demonstration and development phase,
and not at a marketing stage.
• In the short term (2025), the addition of
new methanol production capacity is
highly concentrated in the North
American and Asia-Pacific markets
given the availability of low-cost fuels
such as natural gas (United States) and
coal (China).
• The IEA believes that global hydrogen
demand for methanol production will
increase from 12 MtH2 in 2018 to 18.3
MtH2 by 2030 (+53% or CAGR 18-30 x
3.6%) due to the increasing demand for
methanol in industrial applications, but
especially due to the disruption of
methanol for olefins and methanol for
aromatic processes in China (CAGR
18-30 = 4.1%).
• Methanol from CO2 and H2 is currently
being produced on a low scale and
sold by a Premium (approx. 2-3x cost
of fossil methanol). Green hydrogen
significantly increases the costs of
methanol, and the equilibrium point
could be around 1.8 €/kg with a CO2
cost of 90 €/ton5 .
• Demand for methanol is the main demand for a chemical,
with the highest growth rate in recent years (CAGR 2007-
2017 = 8.0%)3.
• In 2017, the North Asian area (led by China) accounted for
54% of global methanol production capacity.
• Demand for methanol for fuels has declined in recent years
but it has been offset by the growing demand for
chemicals and the construction of methanol units for
olefins in China.
GL
OB
AL
DE
MA
ND
FO
R
ME
TH
AN
OL
BY
RE
GIO
N3
RE
LE
VA
NT
PO
INT
S IN
TH
E
ME
TH
AN
OL
MA
RK
ET
3,4
64%4%
10%
9%
4%
9%
Northeast Asia
Middle East
South America
North America
Western Europe
Rest of the World
Current hydrogen uses – Chemical Industry - Methanol
Sources: 1IEA (2019): The Future of Hydrogen; 2Methanol Institute (2019): Methanol World Supply & Demand Summary; 3IHS Markit (2017): Chemical Economics Handbook (Methanol); 4IEA (2019): Tracking Industry (Chemicals). 5Hydrogen Council
(2020)Path to hydrogen competitiveness A cost perspective
HYDROGEN USES DESCRIPTION:
ANEXES
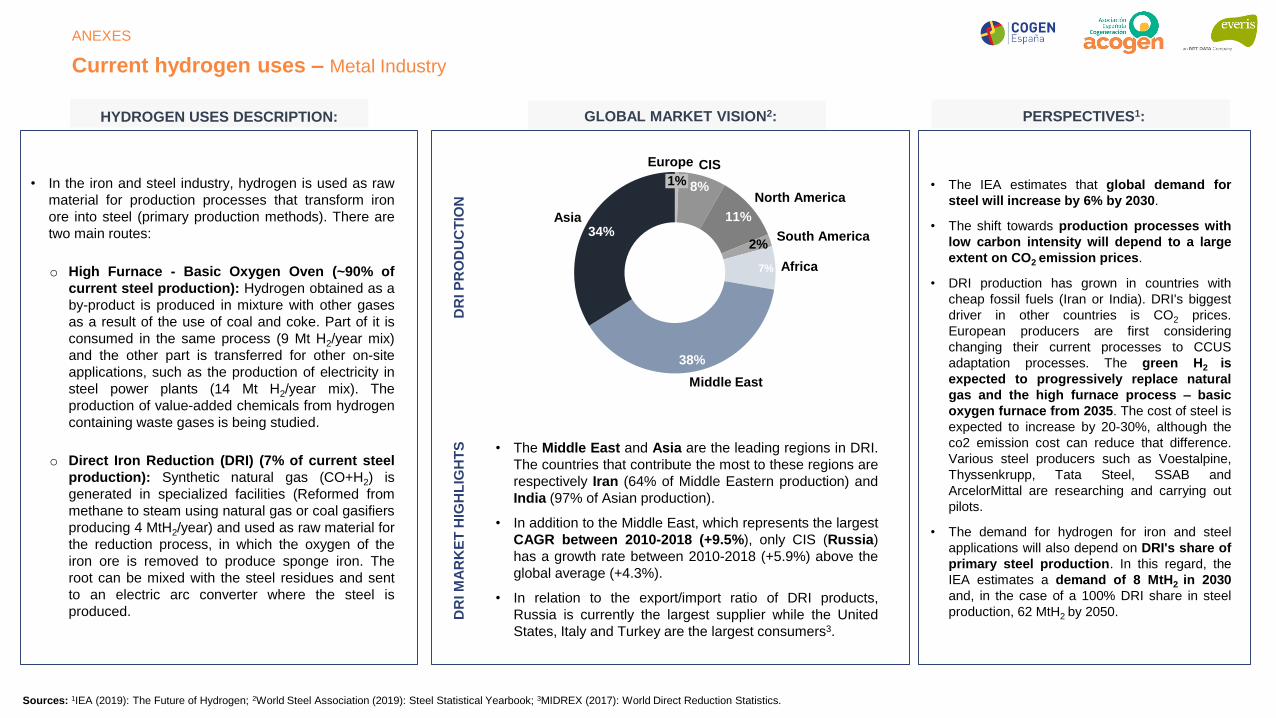
GLOBAL MARKET VISION2: PERSPECTIVES1:
Sources: 1IEA (2019): The Future of Hydrogen; 2World Steel Association (2019): Steel Statistical Yearbook; 3MIDREX (2017): World Direct Reduction Statistics.
DR
I P
RO
DU
CT
ION
DR
I M
AR
KE
T H
IGH
LIG
HT
S
• In the iron and steel industry, hydrogen is used as raw
material for production processes that transform iron
ore into steel (primary production methods). There are
two main routes:
o High Furnace - Basic Oxygen Oven (~90% of
current steel production): Hydrogen obtained as a
by-product is produced in mixture with other gases
as a result of the use of coal and coke. Part of it is
consumed in the same process (9 Mt H2/year mix)
and the other part is transferred for other on-site
applications, such as the production of electricity in
steel power plants (14 Mt H2/year mix). The
production of value-added chemicals from hydrogen
containing waste gases is being studied.
o Direct Iron Reduction (DRI) (7% of current steel
production): Synthetic natural gas (CO+H2) is
generated in specialized facilities (Reformed from
methane to steam using natural gas or coal gasifiers
producing 4 MtH2/year) and used as raw material for
the reduction process, in which the oxygen of the
iron ore is removed to produce sponge iron. The
root can be mixed with the steel residues and sent
to an electric arc converter where the steel is
produced.
• The IEA estimates that global demand for
steel will increase by 6% by 2030.
• The shift towards production processes with
low carbon intensity will depend to a large
extent on CO2 emission prices.
• DRI production has grown in countries with
cheap fossil fuels (Iran or India). DRI's biggest
driver in other countries is CO2 prices.
European producers are first considering
changing their current processes to CCUS
adaptation processes. The green H2 is
expected to progressively replace natural
gas and the high furnace process – basic
oxygen furnace from 2035. The cost of steel is
expected to increase by 20-30%, although the
co2 emission cost can reduce that difference.
Various steel producers such as Voestalpine,
Thyssenkrupp, Tata Steel, SSAB and
ArcelorMittal are researching and carrying out
pilots.
• The demand for hydrogen for iron and steel
applications will also depend on DRI's share of
primary steel production. In this regard, the
IEA estimates a demand of 8 MtH2 in 2030
and, in the case of a 100% DRI share in steel
production, 62 MtH2 by 2050.
• The Middle East and Asia are the leading regions in DRI.
The countries that contribute the most to these regions are
respectively Iran (64% of Middle Eastern production) and
India (97% of Asian production).
• In addition to the Middle East, which represents the largest
CAGR between 2010-2018 (+9.5%), only CIS (Russia)
has a growth rate between 2010-2018 (+5.9%) above the
global average (+4.3%).
• In relation to the export/import ratio of DRI products,
Russia is currently the largest supplier while the United
States, Italy and Turkey are the largest consumers3.
8%
11%
7%
38%
34%
Middle East
Europe
1%
CIS
North America
2%South America
Asia
Africa
Current hydrogen uses – Metal Industry
HYDROGEN USES DESCRIPTION:
ANEXES

Thermal Industry
HYDROGEN USES DESCRIPTION1,2: PERSPECTIVES1,2:
Sources: 1IEA (2019): The Future of Hydrogen; 2BP (2019): BP Statistical Review of World Energy 2019.
Hydrogen uses in other applications are
expected to grow in the short/medium
term thanks to the disruption of new and
future applications:
Electricity generation
Mobility
Heating and electricity in
buildings
In 2018, 30 MtH2 were used for various applications and consumed as hydrogen by-product in a gas mixture (87%) or as pure
hydrogen (13%):
Sector DescriptionPlant
production
H2
consumption
H2
flow
Electrolytic
capacity
Silicon
production
As a reducing agent for the production of silicon from SiO2 in
the Siemens process and its variants. A small demand could
make the use of water electrolytes attractive.
5,000-
40,000 ton
Si/year
100-300
kgH2/ton Si
600-
6,000
Nm3/h
2 MW
Plain glass
production
Molten glass is cooled into an N2-H2, where H2 is used to
prevent oxidation.
300-700 ton
glass/day
0.07 mil M
Nm3/year
100
Nm3/h0.5 MW
Food IndustryHydrogen is used for the hydrogenation of fats for margarine,
vegetable fats and animal fats.
1,000-
100,000 ton
oil/year
4-6 kgH2/ton
oil
10-50
Nm3/h1.6 MW
Electronics
Hydrogen is used in the manufacture of semiconductor
materials, especially in wafer manufacturing processes, which
last about 60 days. Other applications include the manufacture
of screens, LEDs and photovoltaic plates.
80-120,000
wafers per
month
1,200
kgH2/month
500
Nm3/h2 MW
MetallurgyHydrogen is used to prevent oxidation and reduce oxides
during heat treatments.- - - -
RefrigerationCooling alternators in power plants such as BWR nuclear
plants.
150-1,200
MW
0.007
Nm3/MW
1-10
Nm3/h-
Current hydrogen uses – Other uses
ANEXES

Hydrogen is able to connect power generation and energy transport using the natural gas grid and reducing the need for greater
investment by being able to use existing infrastructure.
Hydrogen uses with great potential – H2-to-Gas
Sources: IEA (2019): The Future of Hydrogen. 2Renewable Power-to-Gas(Jan – 2016): A technological and economic review (similar assumptions to Alkaline/PEM) 3Naturgy (2020) Hidrógeno: Vector energético de una economía descarbonizada
HYDROGEN INJECTION INTO THE GAS NETWORK ELECTRICITY AND GAS GRID INTERCONNECTION3
• It is estimated that with minor adaptations, equipment such as boilers,
cookers, engines and turbines could accept 20% blends. The 2030 target (4
GW) could be met if 5% of the gas grid were hydrogen (which is possible
today according to PD01).
• A 3% hydrogen blend in natural gas grids would require around 100
gigawatts (GW) of electrolysis capacity.
• Incentives should be in place for renewable gases such in the case of
biomethane in certain countries to make it competitive with much cheaper
natural gas
H2 Blending
Natural gas will play a key role in helping to meet environmental
targets for which the use of hydrogen in two different ways could
accelerate the transition to a decarbonized future.
Synthetic methane (SNG) can be directly produced from
CO2 and hydrogen in a methanation process:
Although at low shares, blending H2 into the existing gas
grid could become a great option for renewable energy
transmission and storage in the near-term.
The injection of renewable hydrogen into the natural gas network has
special relevance in a context of high penetration of wind and
photovoltaic energies, as is the case in Spain. Power-to-Gas allows
electricity to be stored massively through the interconnection of the
electricity grid and the gas network, with technologies such as
electrolysis, which converts electricity into hydrogen.
Methanation
• SNG key advantage is its compatibility with natural gas infrastructure
for transport, distribution and generation.
• Estimated SNG costs of 135 €/kWh (~6x fossil natural gas). It is
unrealistic that SNG can be massively deployed unless its is heavily
subsidized.
Electricity grid
Natural gas network
Combined
cycleElectrolysisMethanation
H2
H2
CO2
CH4CH4
ANEXES

Hydrogen can be mixed with other compounds, such as carbon dioxide, to produce renewable fuel, which can replace other traditional
raw materials, such as petroleum derivatives.
Hydrogen uses with great potential – H2-to-Liquid
Sources: IEA (2019): The Future of Hydrogen.
MAIN PATHWAYS
The production of synthetic diesel or kerosene requires hydrogen
and carbon monoxide (CO) as inputs.
Hydrogen and CO2 are transformed into CO through Reverse
Water Gas Shift reaction. CO plus additional H2 (syngas) is then
converted via Fischer-Tropsch synthesis to raw liquid fuels and
later into synthetic diesel or kerosene.
H20 and CO2 co-electrolysis in SOEC electrolyzers followed by FT
reaction can substantially reduce fuel production costs.
Synthetic
Diesel or
Kerosene
Synthetic
Methanol
Other
alternatives
Methanol is the simplest alcohol, with a 80% higher energy
density than liquid hydrogen.
• CO2 can be directly hydrogenated into methanol.
• Around 40% of global methanol production today is used for
fuel use (directly blended with gasoline, in the synthesis of
MTBE fuel additive, in biodiesel production or as DME
substituting GLP or blended with diesel fuel).
Other less developed e-Fuels are possible:
• Ammonia is a carbon-free e-fuel. The synthesis process is well
known although its deployment in power generation and
transport is still very limited
• Ethanol production from CO and H2 using biological pathways
is being developed although its economics are much worse
than 1st generation bioethanol
E-fuels are seen as a long-term alternative (beyond 2030) for transport decarbonization (mainly air and marine shipping) in combination with biofuels. Commercial scale e-fuels production
plants would require hydrogen production at GW scale.
CONVERTING HYDROGEN INTO LIQUIDS
MAIN PRODUCTION COST DRIVERS
Synthetic fuels are produced by combining CO and Hydrogen. Hydrogen can
be produced from any source such as water electrolysis, electricity, biomass or
fossil fuels:
• Synthetic fuels are compatible with fossil fuel engines, turbines and
transport and distribution infrastructure.
• If electricity is used for hydrogen production, synfuels are also called e-fuels
or electro fuels.
• E-fuels are an alternative to biofuels as they do not compete with food (1st
gen) and have no production constraint as waste-based biofuels (Advanced
biofuels)
Significant amounts of electricity and generation capacity are required for the
production of synthetic hydrocarbons because of the low overall efficiency of
production processes.
• Between 45–60% of the electricity used for the production of synthetic
hydrocarbons is lost during the process.
• Hydrogen-based fuels production costs is 2-3 times over todays fossil fuel
cost. They can vary significantly, depending on the availability of low-cost
renewable energy.
ANEXES
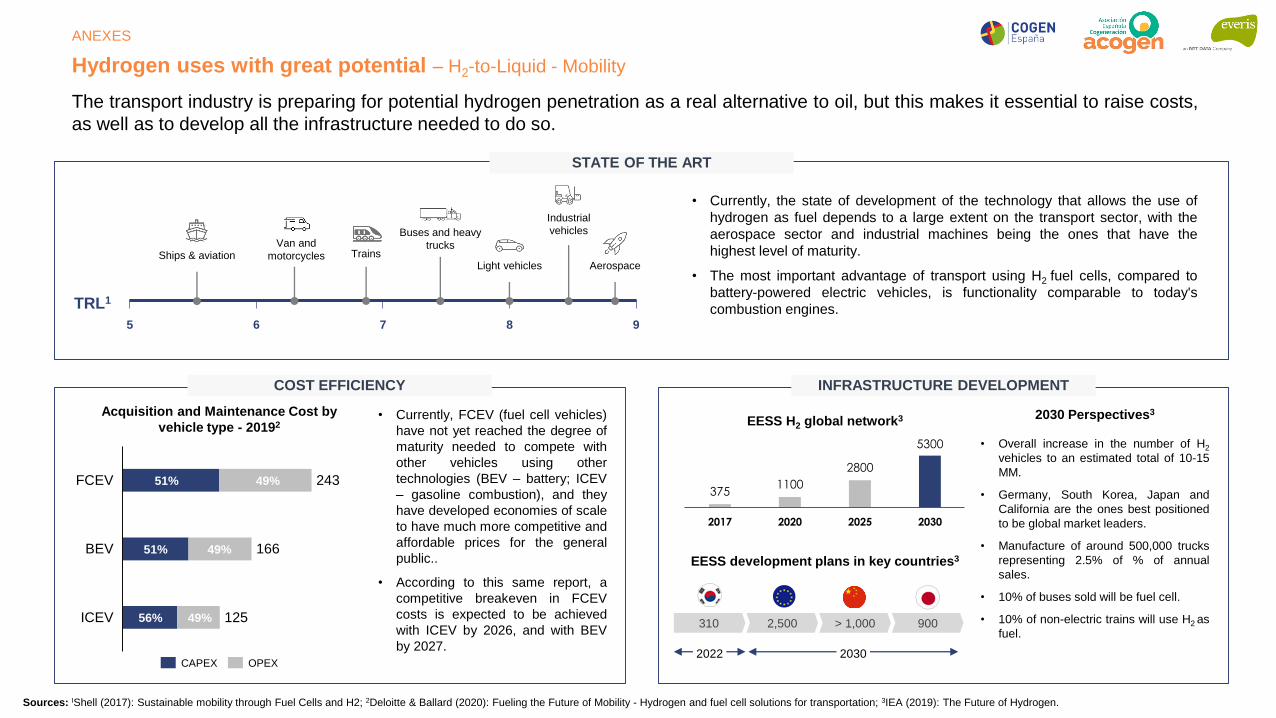
The transport industry is preparing for potential hydrogen penetration as a real alternative to oil, but this makes it essential to raise costs,
as well as to develop all the infrastructure needed to do so.
Hydrogen uses with great potential – H2-to-Liquid - Mobility
COST EFFICIENCY INFRASTRUCTURE DEVELOPMENT
STATE OF THE ART
• Currently, the state of development of the technology that allows the use of
hydrogen as fuel depends to a large extent on the transport sector, with the
aerospace sector and industrial machines being the ones that have the
highest level of maturity.
• The most important advantage of transport using H2 fuel cells, compared to
battery-powered electric vehicles, is functionality comparable to today's
combustion engines.
2,500 > 1,000 900310
3751100
2800
5300
2017 2020 2025 2030
EESS H2 global network3
2022 2030
EESS development plans in key countries3
Acquisition and Maintenance Cost by
vehicle type - 20192
5 6 7 8 9
TRL1
Light vehicles
Industrial
vehicles
Van and
motorcycles
Buses and heavy
trucksTrainsShips & aviation
Aerospace
125
FCEV
BEV
ICEV
243
166
CAPEX OPEX
51%
51%
56%
49%
49%
49%
• Currently, FCEV (fuel cell vehicles)
have not yet reached the degree of
maturity needed to compete with
other vehicles using other
technologies (BEV – battery; ICEV
– gasoline combustion), and they
have developed economies of scale
to have much more competitive and
affordable prices for the general
public..
• According to this same report, a
competitive breakeven in FCEV
costs is expected to be achieved
with ICEV by 2026, and with BEV
by 2027.
• Overall increase in the number of H2
vehicles to an estimated total of 10-15
MM.
• Germany, South Korea, Japan and
California are the ones best positioned
to be global market leaders.
• Manufacture of around 500,000 trucks
representing 2.5% of % of annual
sales.
• 10% of buses sold will be fuel cell.
• 10% of non-electric trains will use H2 as
fuel.
2030 Perspectives3
Sources: IShell (2017): Sustainable mobility through Fuel Cells and H2; 2Deloitte & Ballard (2020): Fueling the Future of Mobility - Hydrogen and fuel cell solutions for transportation; 3IEA (2019): The Future of Hydrogen.
ANEXES

Almost 98% of hydrogen is produced from fossil raw materials (natural gas and coal). The need to decarbonize the industry is driving the combination of CCUS1 with
fossil hydrogen generation or its complete replacement by green hydrogen.
In the hydrogen value chain, there are different sources of production depending on the nature and origin of the energy
from which it is generated.
H2 production
Sources: 1IEA (2019): The Future of Hydrogen; CCUS (Carbon Capture, Use and Storage).
ProductionH2 carriers
(Secondary sources)Consumption
Industry
Power generation
Mobility
Buildings
Hydrogen Gas
(H2)
Fossil Fuels
Gas
Coal
Oil
Electricity
Photovoltaic
Wind
Hydro
Nuclear
Grid balance
Etc.
Biomass
Ammonia
Liquid Organic H2
Carrier (LOHC)
Synthetic
hydrocarbons
Methanol
Methane
Liquid fuel
Cogeneration
Transport & Distribution
Transport
Pipes network
Cargo ships
Distribution
Pipes network
Trucks
Storage
Massive storage
Tanks
ANEXES

There are currently two main pathways for hydrogen production (H2), depending on the raw material and technology
used.
H2 production – Production technologies
Sources: 1IEA (2019): The Future of Hydrogen.
Hydrogen can be extracted from fossil fuels, biomass and
water through thermochemical and electrolytic processes.
The main technologies are described below:Main raw material Technology
Oil or Gas
SMR (Steam Methane Reformed)
ATR (Auto Thermal Reformed)
Partial Oxidation
Coal Coal Gasification
Biomass Biomass Gasification
Electricity
Alkaline electrolysis
Method
Thermochemical
Electrolytic
PEM (Proton Exchange Membrane)
Key technologies
H2 PRODUCTION ALTERNATIVES
• SMR technology is the most widespread method for
extracting hydrogen from natural gas for the ammonia
and methanol refineries and industries (where large volumes
of hydrogen are required). Represents 75% of the world's
dedicated hydrogen production.
• Coal gasification accounts for 23% of the world's
dedicated hydrogen production. This technology is mainly
used in China due to the supply of cheap coal.
• Electrolysis options represent the rest of the world's
production, about 2%. Electrolysis plays a minor role in
total hydrogen production today, especially in the chlorine-
alkaline industry where hydrogen is a by-product.
• Other options for H2 production such as carbon cracking are
currently being studied.
Fossil fuel-based production pathways cover virtually all hydrogen demand. Natural gas is the main source of hydrogen produced mainly through SMR technology
ANEXES

Sources: 1IEA (2019): The Future of Hydrogen. 2IREC y Fundación Naturgy (2020). Hidrógeno: Vector energético de una economía descarbonizada; Hoja de Ruta del Hidrógeno: una apuesta por el hidrógeno renovable.
SM R (Steam M ethane
Reformed)Coal Gasi f icat ion Alkal ine e lect ro lysis
PEM (Proton Exchange
M embrane) e lect ro lysis
High-temperature catalytic reaction
(nickel catalyst) of a mixed inlet current of
methane (natural gas) and steam, resulting
in a hydrogen (H2) output, carbon monoxide
(CO) and carbon dioxide (CO2). High purity
hydrogen requires PSA separation and
purification stages. SMR technology
produces 9-10 Tm of CO2 per Tm of
hydrogen1. Optimal technology for the big
scale.
Major H2 Production Technologies at commercial scale
Big H2 Volumes (>5000 m3/h) Low H2 Volumes (<500 m3/h)
High-temperature thermochemical reaction
(oxidation) of a mixed stream of oxygen, steam
and carbon resulting in an outlet current of
carbon monoxide (CO), hydrogen (H2), carbon
dioxide (CO2), methane (CH4) and water.
Separation by PSA is necessary for the
purification of H2. Coal gasification has the
highest CO2 production intensity (19 Tm of
H2 CO2/Tm). Coal gasification plants are mainly
used for electricity generation by burning
synthesis gas or for the production of raw
materials for the chemical industry.
Low-temperature electrolytic reaction
(alkaline aqueous electrolyte) of a water and
electricity inlet resulting in a hydrogen (H2)
and oxygen (O2) outlet. The water is divided
into the cathode into H2 and hydroxide ions
that pass through a membrane to the anode
where they oxidize to oxygen (O2) and water
(H2O). Purification is necessary to obtain
high purity hydrogen (traces of the
electrolyte in the H2 stream).
Low-temperature electrolytic reaction
(polymeric membrane acting as a solid
electrolyte) of a water and electricity inlet
resulting in a pure hydrogen (H2) and oxygen
(O2) outlet. Water is divided into oxygen,
hydrogen ions and two electrons in the
anode. Hydrogen ions travel through the
membrane (only permeable for hydrogen
ions) along with electrons, forming hydrogen
in the cathode. In turn, it allows a highly
flexible mode of operation, along with a quick
start, which makes it ideal for producing H2
non-continuously and transforming it into
electricity for network balance2.
Today, fossil hydrogen conversion technologies play a dominant role when large volumes of hydrogen are demanded,
while applications based on electrolysis are primarily intended to meet on-site demand for hydrogen in low volumes.
H2 production – Most commercially widespread production technologies
ANEXES

In addition to the previous ones, solid oxide cell-based electrolysis (SOFC) technology is the most promising technology,
with relevant development potential due to its high efficiency and inverse mode operating capacity.
H2 production – Emerging renewable H2 production technologies
SO electrolytes can operate in reverse mode as a fuel
cell, turning the H2 into electricity, meaning they could
provide equilibrium services to the grid in
combination with H2 storage facilities
SOEC Process Outline
Source – Nano Energy
High temperature steam electrolysis for the production of H2 and O2 by dividing water
molecules. SO electrolytes use a solid oxide electrolyte, a ceramic membrane that is onlypermeable to oxygen ions (O2-), so only water and electricity are needed to produce H2.
What does it consist in?
H2 Production Process
Steam is divided into H2 and O2 in the cathode. Oxygen ions (O2-) pass through the solid
oxide membrane and form O2 in the anode. The process requires an operating temperature
of between 500 and 750 ºC. SOFC can also be used to produce syngas (CO+H2 raw
material for synthetic fuels) through coelectrolysis.
Key Points
• The technology is in the R&D phase and the first trading units are entering the market
through different suppliers.
• High efficiency (>70%) due to the low voltage of the cell (since steam facilitates the
process of dividing).
• Limited solid membrane life due to thermal stress, but with a large margin of
improvement both at this point and in the cost of the unit.
• Low operational flexibility due to high temperature operating requirements.
Sources: 1IEA (2019): The Future of Hydrogen; IREC & Fundación Naturgy (2020): Hidrógeno: Vector energético de una economía descarbonizada.
ANEXES

Sources: 1IEA (2019): The Future of Hydrogen;
Notes: (1 USD = 0,89 Euro); *For SOFC, electrical efficiency does not include steam-generated energy; **CAPEX represents system costs, including power generation, gas conditioning and plant stabilization. CAPEX ranges reflect the
different sizes and uncertainties of the systems.
Efficiency% of LHV
Service lifeBattery working
hours
CAPEX1
€/kWe
Alkal ine
PEM
SOFC 1
Today
2030
Long
term
Today
2030
Long
term
Today
2030
Long
term
63 - 70
65 - 71
70 - 80
60.000 – 90.000
90.000 – 100.000
100.000 – 150.000
445 – 1190
360 – 760
180 – 625
56 - 60
63 – 68
67 – 74
30.000 – 90.000
60.000 – 90.000
100.000 – 150.000
980 – 1.600
580 – 1.335
180 – 800
74 – 81
77 – 84
77 – 90
10.000 – 30.000
40.000 – 60.000
75.000 – 100.000
2.500 – 5.000
710 – 2.500
445 – 890
Relevant aspects to consider
• Alkaline technology shows limited room for improvement. Being
the least CAPEX alternative and mayor lifespan, along with its good
efficiency levels, it makes it very suitable for large and continuous
(stable) renewable hydrogen demands.
• PEM electrolytes are expected to be the technology that
experiences the highest improvement in terms of medium- and long-
term efficiency. Its potential to capture additional revenue streams
from grid equilibrium services would push PEM electrolytes to play an
important role.
• Solid Oxide Electrolytes (SOFCs) are estimated to reduce their
CAPEX by half over the next decade, experiencing the biggest cost
reduction for all technologies. The solid oxide electrolyte requires
continuous operation to reduce performance losses associated with
start and stop cycles. A very low flexibility prevents the adaptation of
the SOFC to price variations from neglecting some of its higher
efficiency advantage.
In the long term, a dominant technology is not expected to lead the H2's production horizon, but a mix of different
technologies depending on specific applications1.
H2 production– Evolving technologies prospects for renewable H2
ANEXES

Within the supply value chain to cogeneration, hydrogen logistics would encompass transmission or transport, distribution
and storage.
H2 logistics
Sources: 1IEA (2019): The Future of Hydrogen;
ProductionH2 carriers (Secondary
sources)Consumption
Industry
Power
generat ion
M obi l i ty
Bui ld ings
Hydrogen
Gas (H 2)
Fossi l fuels
Natu ra l Gas
Coa l
O i l
Elect r ic i ty
Pho tovo l t a i c
W ind
Hyd ro
Nuc lea r
Gr i d ba lance
E tc .
Biomass
Ammonia
Liquid
Organic H 2
(LOHC)
Synthet ic
hydrocarbons
Methano l
Me thane
L iqu id f ue l
Cogenerat ion
Transport & Distribution
Transport
Pipes Grid
Cargo ships
Distribution
Pipes Grid
Trucks
Storage
Massive storage
Tanks
15% of the total volume of H2 currently produced worldwide is transported and distributed by pipes and trucks1
ANEXES
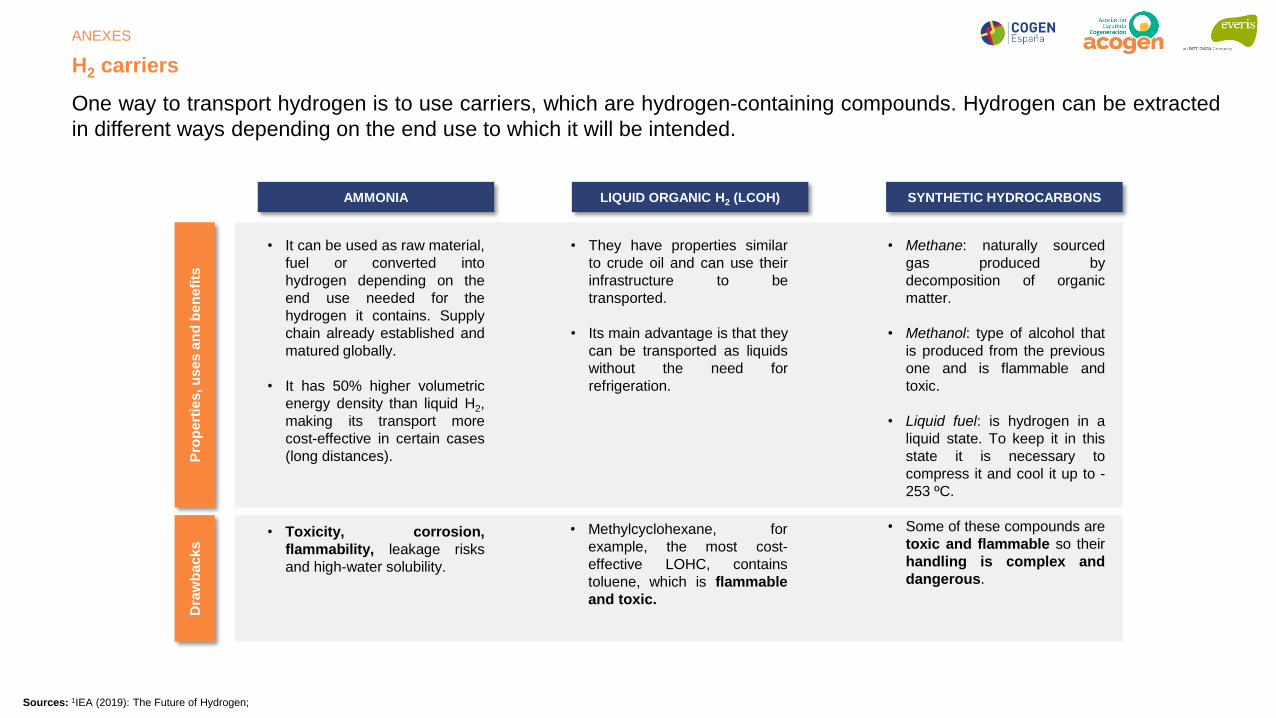
One way to transport hydrogen is to use carriers, which are hydrogen-containing compounds. Hydrogen can be extracted
in different ways depending on the end use to which it will be intended.
H2 carriers
Sources: 1IEA (2019): The Future of Hydrogen;
AMMONIA LIQUID ORGANIC H2 (LCOH) SYNTHETIC HYDROCARBONS
• It can be used as raw material,
fuel or converted into
hydrogen depending on the
end use needed for the
hydrogen it contains. Supply
chain already established and
matured globally.
• It has 50% higher volumetric
energy density than liquid H2,
making its transport more
cost-effective in certain cases
(long distances).
• They have properties similar
to crude oil and can use their
infrastructure to be
transported.
• Its main advantage is that they
can be transported as liquids
without the need for
refrigeration.
• Methane: naturally sourced
gas produced by
decomposition of organic
matter.
• Methanol: type of alcohol that
is produced from the previous
one and is flammable and
toxic.
• Liquid fuel: is hydrogen in a
liquid state. To keep it in this
state it is necessary to
compress it and cool it up to -
253 ºC.
• Some of these compounds are
toxic and flammable so their
handling is complex and
dangerous.
Pro
pe
rtie
s, u
se
s a
nd
be
ne
fits
Dra
wb
ac
ks
• Toxicity, corrosion,
flammability, leakage risks
and high-water solubility.
• Methylcyclohexane, for
example, the most cost-
effective LOHC, contains
toluene, which is flammable
and toxic.
ANEXES
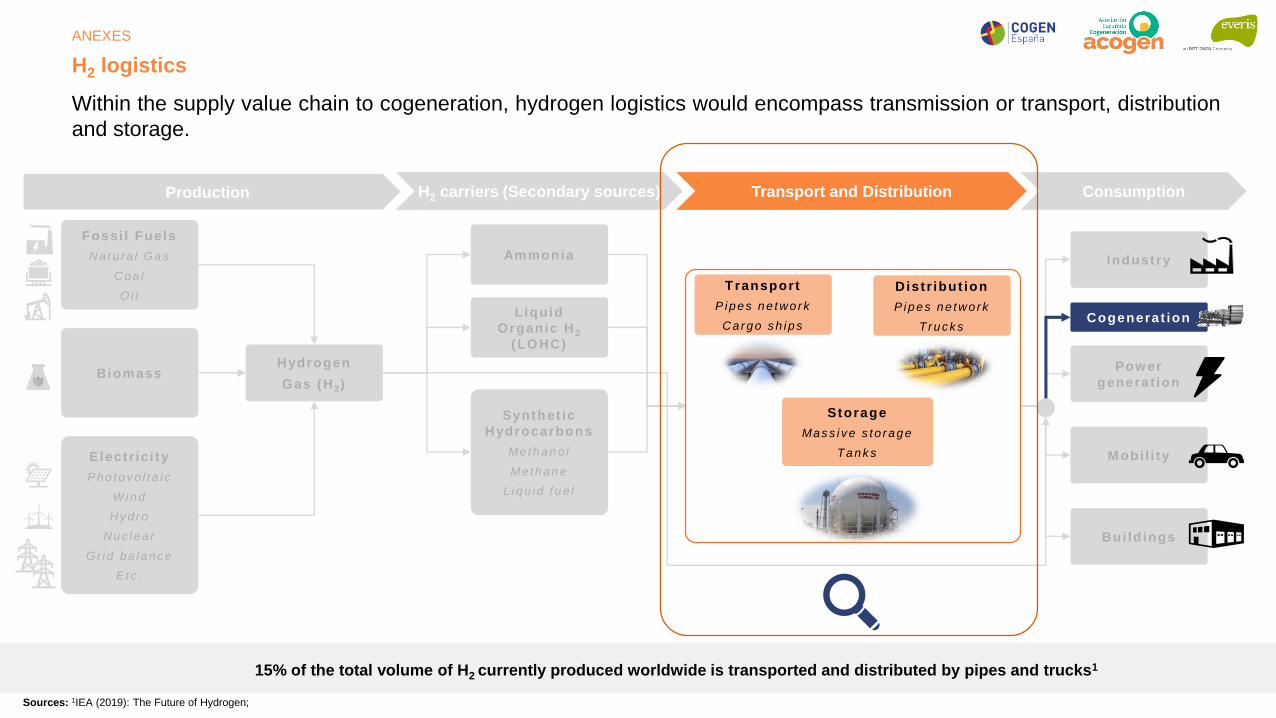
Within the supply value chain to cogeneration, hydrogen logistics would encompass transmission or transport, distribution
and storage.
H2 logistics
Sources: 1IEA (2019): The Future of Hydrogen;
Production H2 carriers (Secondary sources) Consumption
Industry
Power
generat ion
M obi l i ty
Bui ld ings
Hydrogen
Gas (H 2)
Fossi l Fuels
Natu ra l Gas
Coa l
O i l
Elect r ic i ty
Pho tovo l t a i c
W ind
Hyd ro
Nuc lea r
Gr i d ba lance
E tc .
Biomass
Ammonia
Liquid
Organic H 2
(LOHC)
Synthet ic
Hydrocarbons
Methano l
Me thane
L iqu id f ue l
Cogenerat ion
Transport and Distribution
Transport
Pipes ne two rk
Cargo sh ips
Dist r ibut ion
Pipes ne two rk
Trucks
Storage
Mass i ve s to rage
Tanks
15% of the total volume of H2 currently produced worldwide is transported and distributed by pipes and trucks1
ANEXES

The low density of hydrogen makes its transport expensive and inefficient. Developing cost-efficient and cost-competitive
technology is one of the main challenges of the hydrogen value chain to bridge the gap between generation (supply) and
demand.
H2 logistics – Transport
Transport Technology
• Today, refineries and chemical industries operate dedicated pipelines and pipelines
to meet their own demand.
• There are different options related to the hydrogen transport by pipes:
Development of a new transport infrastructure (high CAPEX).
Taking advantage of high-pressure pipelines that are no longer in use (asset
renewal)).
Hydrogen mixing in the NG network (additional costs related to hydrogen
injection, separation, NG recompression, etc.)
• Ammonia and LOHC can also be transported by pipeline, but their economy
depends on the conversion costs, delivery distance and reverse logistics of LOHC.
Pipes network
Pros and Cons
Low OPEX and lifespan of more than
40 years
Use alternatives for infrastructure.
High CAPEX that may be the biggest
disincentive for investors (new
infrastructure)
Description
• The transport of liquid hydrogen is based on keeping tanks below -253 ºC using
cryogenic technologies and special insulating materials.
• Hydrogen transport value chain requires additional infrastructure in
exporting/importing countries: storage tanks, liquefaction and regasification plants,
conversion and conversion plants, etc.
• Ammonia transport is currently possible and transported in semi-cooled LPG tanks
along existing ammonia trade routes.
Exploitation of existing LNG trade
routes
The return could be used to transport
other high-value liquids
Technological maturity is at the
demonstration level
Energy losses due to boiling of the
liquid
Cargo ships
Sources: 1IEA (2019): The Future of Hydrogen, LOHC: Liquid organic hydrogen carriers.
ANEXES

Currently, hydrogen distribution is done by road transport (trucks) for short distances and reduced volumes. If hydrogen
demand increases due to new end applications, distribution technologies will need to be improved.
H2 logistics – Distribution
Distribution technology
• The natural gas distribution network can be used, on a limited basis, for local
hydrogen distribution (H2) mixed.
• Modern pipe materials, such as polyethylene or fiber-reinforced polymer (e.g., the
UK gas distribution network), are suitable for hydrogen with small improvements.
• New network infrastructures motivated by the demand for heat and electricity from
hydrogen buildings could increase the price of the product for end users.
• The distribution of ammonia and LOHC1 by pipe is not attractive from the point of
view of conversion, conversion and purification costs.
Pros and Cons
The natural gas distribution network is
viable for the distribution of H2
CAPEX investments are needed to
build new infrastructure and improve
existing infrastructure.
High distribution costs for hydrogen
carriers due to conversion costs.
Description
• Hydrogen is compressed and loaded into tubular trailers. Other hydrogen-carrying
products (ammonia and LOHC) can also be distributed by truck.
• Low-compression hydrogen (200 bar) distributed per truck is currently the most
widespread solution for deliveries of less than 300 km and small volumes(< 300
kgH2)1.
• Higher-pressure transport trailers (1,100 kg of hydrogen compressed in cylinders at
500 bar) are expected to reduce road distribution costs by 2025 (Projected CAPEX
from 590 euros/kg H2 versus 470 euros/kg H2 for transport trucks from H2 to 200
bar)2.
Market maturity for small volumes of H2
at low pressure.
Cost reduction by 2025 thanks to high-
pressure composite deposits.
High costs, especially for long
distances
Distribution of liquid hydrogen to be
transformed into gas (added cost)
Trucks
Sources: 1Hydrogen Europe (2018): Hydrogen enabling a zero emission Europe; 2the-linde-group.com; LOHC: Liquid organic hydrogen carriers.
Pipes network
ANEXES

Optimal integration of the hydrogen sector depends on the feasibility of storing large volumes at low cost. Although
storage technologies depend on volume, duration, download speed, and end-use, bulk and tank storage are the solutions
currently used.
H2 logistics – Storage
Storage technology
• Hydrogen (gas) is stored long-term (seasonally) for large-scale applications:
• Salt caverns: efficiency of 98%1 and low risk of H2 contamination. They are
currently in operation for industrial applications (e.g., a 10-20 ktH2 salt cavern in
the United States)1
• Reserves of natural gas and depleted oil: higher capacity but higher costs
than salt caverns due to the presence of pollutants to be removed from
hydrogen.
• Water aquifers: their suitability has not yet been demonstrated due to the
presence of reactive microorganisms.
Massive storage
Pros y Cons
High efficiency
Low cost
High discharge rates
Description
• Hydrogen is compressed or liquefied to increase its energy density. There are currently
two main solutions for short-term storage and small-scale applications2:
• Stationary steel storage(P<400 bar):
• Welded steel tanks: low pressure (50 bar) and 50 m3 capacity.
• Steel cylinder packages: P>200 bar.
• Compound storage (P>400 bar): used when high pressure is needed.
High efficiency (99%)1
High discharge rates
Low energy density even when
hydrogen is compressed.
Need for high-volume tanks
Tanks
Sources: 1IEA (2019): The Future of Hydrogen; 2FCH (2017): Study on early business cases for H2 in energy storage and more broadly power to H2 applications.
Geographic availability
Low maturity technologies
ANEXES

Ammonia is a promising hydrogen carrier for long-distance hydrogen transport due to its established supply chain and preventing reverse logistics, as in the case of LOHC
The balance point is defined by the adequacy of hydrogen carriers' technologies and transmission and distribution costs,
including their conversion and conversion costs.
H2 logistics – Transport & Distribution costs
Technology
Pipes network
Balance point
Pipes network
Tra
ns
po
rtD
istr
ibu
tio
n
Cargo ships
Trucks
Hydrogen (gas) transport costs increase rapidly with delivery distance due to compression
station costs.
The increase in shipping costs with distance is lower than in the case of the pipe network,
which is linear.
Pipeline distribution is more cost-competitive than truck distribution for long-distance, high-
volume deliveries.
Despite high costs, compressed hydrogen trailers and liquid tankers are the most widely
used distribution methods.
Hydrogen
Tra
ns
po
rt + C
on
ve
rsio
n c
os
t
(1.5
00
km
)
0.82 €/kgH2
(gas)
Ammonia LOHC1
1.24 €/kgH2 -
1.65 €/kgH2
(liquid)0.99 €/kgH2 0.49 €/kgH2
Depending
on volume- -
1.48 €/kgH2(gas)
0.33 €/kgH2(liquid)
1.24 €/kgH20.33 €/kg H2 for
direct use in
ammonia
industry
2.39 €/kgH2
Dis
tribu
tion
+ re
co
nve
rsio
n
co
sts
(50
0 k
m)
Sources: 1IEA (2019): The Future of Hydrogen. LOHC: Liquid organic hydrogen carriers.
ANEXES

Although total handling costs increase with the number of value chain stages required prior to supply, hydrogen carriers
are more competitive than hydrogen (gas) at certain delivery distances.
H2 logistics – Management & Logistics total costs
Sources: 1IEA (2019): The Future of Hydrogen. LOHC: Liquid organic hydrogen carriers;2 BloombergNEF (2020): Figures include the cost of moving, compression (reconversion) and associated storage (20% assumed for pipes in a salt cavern). Ammonia is supposed to be inadequate on a small scale due to its toxicity.
Although the LOHC is cheaper than THE LH2 for long-distance transport, its transport is less likely than the LH2 (more commercially developed).1 USD = 0,83 €.
=
Total costs of hydrogen transport and distribution based on distance and volume
(€/kgH2)2:
Total Logistics
costs (€/kgH2)Transformation
(compressing)Transmission Distribution Storage Reconversion+ + + +
Conclusions:
Depending on the mode of transport and the
hydrogen carrier used, total handling costs could
currently triple hydrogen generation costs.
1
2
3
Nevertheless, handling and logistics costs are
expected to be reduced by 2030 through technological
improvements and research projects.
Reducing management/logistics costs can make
hydrogen exports/imports profitable:
• Exports: countries with low-cost renewable
generation costs.
• Imports: countries with end-use ammonia
applications (conversion cost savings) and
large volumes of H2 consumption with
insufficient production capacity.
Volume
(Tm/day)
Large
Medium
Small
Very small
0,041
Distance (km)
Local City Between cities Intercontinental
0,041-0,083 0,083-0,48 0,48-2,48
0,041-0,05 0,05-0,18 0,18-1,50 < 2,48
> 2,48
Not
feasible
10.0001.000100101
> 2,48
1.000
100
10
1
0
0,54-0,63
0,54-0,63
0,56-1,43
0,56-1,43
0,79-3,20
0,79-3,20
3,20-5,54
3,20-5,54
Transmission pipes
Distribution pipes
Trucks
Ships
Compressed H2 H2 Liquid Ammonia Liquid Organic H2 (LOHC)
Not
feasible
ANEXES

JUNE 2021