authority: new york city transit 2014-s-56 august 2015 train on-time performance metropolitan...
TRANSCRIPT

New York State Office of the State ComptrollerThomas P. DiNapoli
Division of State Government Accountability
Report 2014-S-56 August 2015
Train On-Time Performance
Metropolitan Transportation Authority: New York City Transit

2014-S-56
Division of State Government Accountability 1
Executive SummaryPurpose To determine whether the Metropolitan Transportation Authority’s New York City Transit trains run on time, and whether actions are taken to address recurring problems that reduce on-time performance. The audit covers the period March 1, 2013 to January 23, 2015.
Background The Metropolitan Transportation Authority’s (MTA) New York City Transit (Transit) provides rapid transit services in New York City, 24 hours a day, 7 days a week. The MTA’s website lists schedules for each of the subways’ 20 interconnected lines and three shuttles.
Sometimes, a subway train is canceled (i.e., does not depart from the terminal, or departs later than half the headway time), or is abandoned en route (i.e., skips any scheduled station stops or fails to operate on its scheduled route in accordance with the timetable). Transit’s Department of Subways (Subways) considers a train on time when it is not canceled or abandoned en route, and it arrives at the end terminal not more than five minutes after its scheduled arrival time.
Subways’ Department of Rapid Transit Operations uses its Rail Control Center’s Performance Reporting and Operations Analysis Group to report train delay percentages for each line, delays by categories, and on-time performance (OTP) statistics to management and the MTA Board’s Transit and Bus Committee (Committee). The information is provided on a two-month delay.
Subways collects information of its daily operations pertaining to delays and distributes it the next day, via the Statistical Transportation Analysis and Reporting System (STARS), to its district managers and Transit support units, such as Maintenance of Way, Division of Car Equipment, and Operations Planning. OTP statistics are reported separately for weekdays and weekends. For calendar years 2013 and 2014, Subways OTP goal was 91.9 percent.
Key Findings • For calendar years 2013 and 2014, Subways’ reports show actual OTP was well below the goal
of 91.9 percent. For 2013, weekday OTP averaged 80.5 percent and weekend OTP averaged 85.4 percent. For 2014, weekday OTP averaged 74.0 percent and weekend OTP averaged 81.2 percent. On balance, there has been a persistent decline in OTP during the period.
• For the period March 2013 through March 2014, Subways reported 498,889 total delays. We reviewed four categories of delays (Right of Way, Employee, Track Gangs, and Car Equipment) that resulted in 269,008 (or 53.9 percent) of the delays to determine the actions Subways took to address their causes and reduce their occurrence. In most cases, Subways took appropriate actions to address individual incidents as they occurred. However, Subways lacked a formal process to assess the underlying causes of the delays and develop comprehensive corrective action plans to help minimize them.
• According to Subways officials, there are multiple workgroups and committees (including a Delay Management Workgroup) dedicated to improving service and reducing delays. In addition, there are monthly reviews of operational performance performed by the Office of the Senior

2014-S-56
Division of State Government Accountability 2
Vice President. Yet, there was no evidence that any workgroup, committee, or office developed formal plans or programs to communicate initiatives to address the root causes of delays and improve OTP.
Key Recommendations • Identify the underlying causes of recurring train delays and develop corrective action plans to
proactively address those causes. Such plans should address the effectiveness of workgroup efforts, identify responsible parties, and require written feedback and measurable solutions.
• Require monthly feedback from Subways managers on the action taken to address recurring categories of train delays.

2014-S-56
Division of State Government Accountability 3
State of New York Office of the State Comptroller
Division of State Government Accountability
August 12, 2015
Mr. Thomas F. Prendergast Chairman and Chief Executive Officer Metropolitan Transportation Authority 347 Madison Avenue New York, NY 10017
Dear Mr. Prendergast:
The Office of the State Comptroller is committed to helping State agencies, public authorities, and local government agencies manage their resources efficiently and effectively. By so doing, it provides accountability for tax dollars spent to support government operations. The Comptroller oversees the fiscal affairs of State agencies, public authorities, and local government agencies, as well as their compliance with relevant statutes and their observance of good business practices. This fiscal oversight is accomplished, in part, through our audits, which identify opportunities for improving operations. Audits can also identify strategies for reducing costs and strengthening controls that are intended to safeguard assets.
Following is a report of our audit of New York City Transit, entitled Train On-Time Performance. This audit was performed pursuant to the State Comptroller’s authority under Article X, Section 5 of the State Constitution and Section 2803 of the Public Authorities Law.
This audit’s results and recommendations are resources for you to use in effectively managing your operations and in meeting the expectations of taxpayers. If you have any questions about this report, please feel free to contact us.
Respectfully submitted,
Office of the State Comptroller Division of State Government Accountability

2014-S-56
Division of State Government Accountability 4
State Government Accountability Contact Information:Audit Director: Carmen MaldonadoPhone: (212) 417-5200 Email: [email protected]:
Office of the State Comptroller Division of State Government Accountability 110 State Street, 11th Floor Albany, NY 12236
This report is also available on our website at: www.osc.state.ny.us
Table of ContentsBackground 5
Audit Findings and Recommendations 6
Nature of Delays 7
Preventing Future Delays 8
Recommendations 10
Audit Scope and Methodology 10
Authority 11
Reporting Requirements 11
Contributors to This Report 12
Exhibit A-1 13
Exhibit A-2 14
Exhibit B 15
Exhibit C 16
Exhibit D 17
Agency Comments 18
State Comptroller’s Comments 31

2014-S-56
Division of State Government Accountability 5
Background The Metropolitan Transportation Authority’s (MTA) New York City Transit (Transit) provides rapid transit services. Transit’s Department of Subways (Subways) operates New York City’s (City) subway lines, 24 hours a day, seven days a week. The MTA’s website lists schedules for each of Subways’ 20 interconnected lines and three shuttles.
Sometimes, a subway train is canceled (i.e., does not depart from the terminal, or departs later than half the headway time), or is abandoned en route (i.e., skips any scheduled station stops or fails to operate on its scheduled route in accordance with the timetable). Subways considers a train on time when it is not canceled or abandoned en route, and it arrives at the end terminal not more than five minutes after its scheduled arrival time.
Subways’ Department of Rapid Transit Operations (RTO), the unit responsible for the day-to-day train operations, divides the system into the #7 train and five districts, each comprising several train lines. RTO uses its Rail Control Center’s (RCC) Performance Reporting and Operations Analysis Group to report train delay percentages for each line, delays by categories, and on-time performance (OTP) statistics to management and the MTA Board’s Transit and Bus Committee (Committee). The information is provided on a two-month delay.
Subways collects information of its daily operations pertaining to delays and distributes it the next day, via the Statistical Transportation Analysis and Reporting System (STARS), to its district managers and Transit support units, such as Maintenance of Way (MOW), Division of Car Equipment (DCE), and Operations Planning (OP). Subways’ OTP for a month is calculated as the number of on-time trains divided by the total number of scheduled trains. Statistics are reported separately for weekdays and weekends. For calendar years 2013 and 2014, Subways OTP goal was 91.9 percent. Subways practice is to set the goal based on a three-year average with a 5 percent improvement, but no lower than the previous year’s goal.
MTA constituent agencies have established Key Performance Indicators (KPI), which are important metrics for determining whether overall service meets the agencies’ performance goals. Terminal On-Time Performance accounts for 30 percent of Subways’ KPI for its rail service (known as Service – KPI), which also includes Wait Assessment (60 percent) and Mean Distance Between Failures (10 percent).

2014-S-56
Division of State Government Accountability 6
Audit Findings and RecommendationsSubways did not meet its OTP goals during calendar years 2013 and 2014. For 2013, average OTP was 80.5 percent for weekdays and 85.4 percent for weekends. For 2014, weekday OTP averaged 74.0 percent, and weekend OTP averaged 81.2 percent. Graph 1 shows Subways’ actual OTP from January 2013 to December 2014. In late March 2015, we noted that statistical reports on MTA’s website indicate the OTP goal was lowered to 75.0 percent, despite Subways’ goal-setting policy. We reviewed the OTP goals for other major transportation agencies in the U.S., and none had an OTP goal below 90 percent. Further, on balance, there has been a persistent decline in OTP rates during this two-year period.
We found that Subways reports late or canceled trains and tracks the reasons for the delays. In addition, Subways staff makes substantive efforts to address delays as they occur and keep the trains moving. However, these efforts did not improve OTP over the two years of our review. Subways’ senior management advised us that a Delay Management Workgroup has been meeting since September 2013. Yet, there was no evidence that Transit has developed formal plans or comprehensive programs to address the root causes of train delays and improve OTP.
Given the importance of OTP in its performance metrics, Subways should conduct a root cause analysis to identify the underlying reasons for delays, then reassess its practices and processes to proactively address the root causes and substantially improve OTP.
Graph 1 – Monthly Percentages of On-Time Performance
*Data Source: MTA’s Transit and Bus Committee Minutes from March 2013 to February 2015
2014-S-56
Division of State Government Accountability 7
Nature of Delays
From March 1, 2013 through March 31, 2014, Subways reported a total of 498,889 train delays. Of these, 406,797 took place on a weekday, and about 24.9 percent of those occurred during the morning rush hour (from 6:00 a.m. to 9:59 a.m.). (See Exhibits A-1 and A-2 for summaries of delays by hour for the A and B Divisions from March 2013 through March 2014).
In addition, Subways reports train delays in 15 categories. (See Exhibit B for a summary of delays by category from March 2013 through March 2014). We placed each of the 15 categories under one of two classifications - controllable and uncontrollable. A category was considered controllable if Subways management could influence the frequency of such delays and take steps to minimize their occurrence. The controllable categories of delays include: Car Equipment, Collision/Derailment, Employee, Infrastructure, Operational Divisions, Right Of Way (ROW), Track Gangs, and Work Equipment/General Order. These categories accounted for almost 316,000 delays (or about 63.3 percent of total system delays). Uncontrollable delays are those that Subways management cannot directly influence and include External, Fire, Inclement Weather, Over Crowding, Police, Sick Customer, and Unruly Customer.
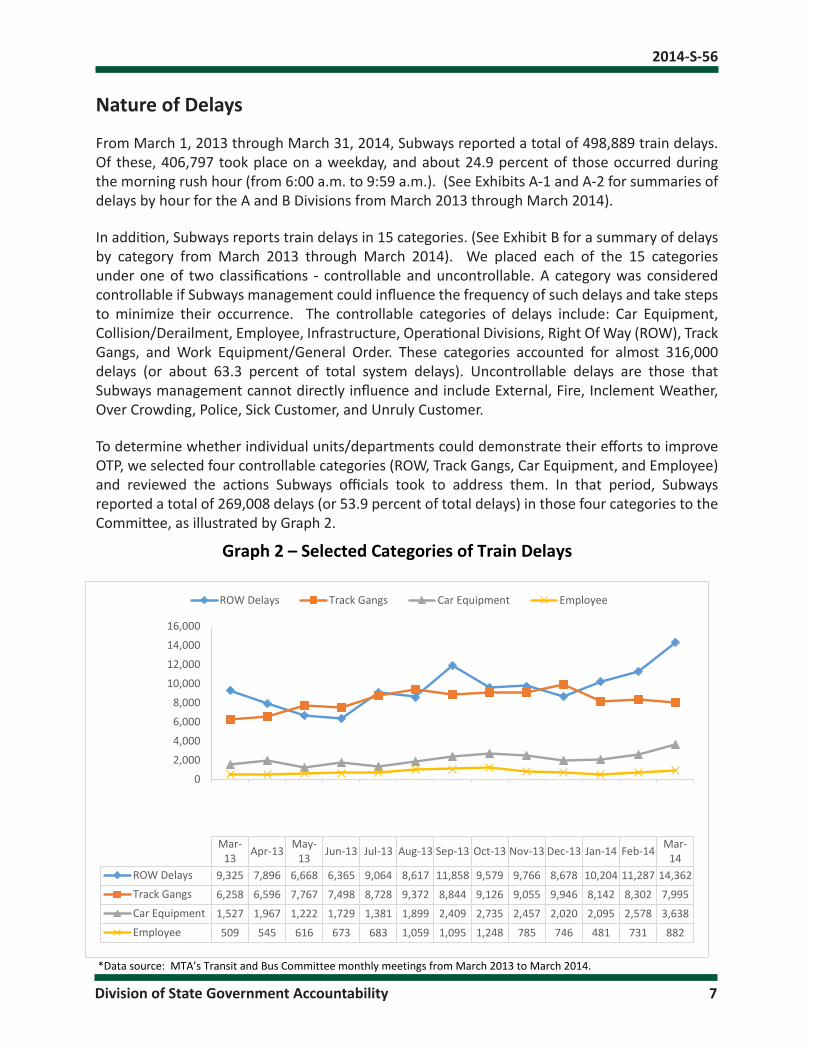
To determine whether individual units/departments could demonstrate their efforts to improve OTP, we selected four controllable categories (ROW, Track Gangs, Car Equipment, and Employee) and reviewed the actions Subways officials took to address them. In that period, Subways reported a total of 269,008 delays (or 53.9 percent of total delays) in those four categories to the Committee, as illustrated by Graph 2.
Graph 2 – Selected Categories of Train Delays
*Data source: MTA’s Transit and Bus Committee monthly meetings from March 2013 to March 2014.
0
2,000
4,000
6,000
8,000
10,000
12,000
14,000
16,000
Mar-13 Apr-13 May-
13 Jun-13 Jul-13 Aug-13 Sep-13 Oct-13 Nov-13 Dec-13 Jan-14 Feb-14 Mar-14
ROW Delays 9,325 7,896 6,668 6,365 9,064 8,617 11,858 9,579 9,766 8,678 10,204 11,287 14,362Track Gangs 6,258 6,596 7,767 7,498 8,728 9,372 8,844 9,126 9,055 9,946 8,142 8,302 7,995Car Equipment 1,527 1,967 1,222 1,729 1,381 1,899 2,409 2,735 2,457 2,020 2,095 2,578 3,638Employee 509 545 616 673 683 1,059 1,095 1,248 785 746 481 731 882
ROW Delays Track Gangs Car Equipment Employee

2014-S-56
Division of State Government Accountability 8
We interviewed officials in each of the four areas, the five district managers, and the #7 line manager, and we reviewed prescribed procedures and relevant reports to determine how staff responded to delays. In addition, we reviewed a sample of 60 incident reports (15 for each of the four delay categories). Since one delay can cause many trains to be late, canceled, or abandoned en route, our sampled reports corresponded to thousands of individual delays. Officials explained how they addressed individual delays, and they provided documentation supporting the actions taken to remediate the delays corresponding to our 60 sampled incident reports. Generally, Transit employees responded timely to the specific incidents that led to the delays. However, Transit officials had no formal corrective action plans or programs to minimize the chronic underlying problems that caused delays.
Additionally, we heard many different opinions from the Subways officials we interviewed as to the cause of delays, but they did not produce any evidence or formal analysis to support those opinions. It was, therefore, unclear if the root cause(s) of the problem had been identified. Examples of what we found are summarized as follows for certain categories of delays:
• Car Equipment: Three district managers said Car Equipment problems (which accounted for 6 percent of the delays from March 2013 to March 2014) can be attributed to older trains and a lack of repair parts for them. We requested evidence of this purported problem; however, none was provided. Therefore, we reviewed the “rolling stock” of trains assigned to 20 lines (excluding the three shuttles) and analyzed the relationship between the age of the train cars and the OTP of the lines. As shown in Exhibit C, a comparatively high OTP was achieved with the oldest car class on the C line, and comparatively low OTP occurred on lines with some of the newer cars, such as the F line. Consequently, it was not clear that car age and/or parts shortages increased risk of delays.
• Track Gangs: One district official said delays attributed to Track Gangs are the result of changes in the flagging procedures introduced around 2009 that have impeded timely service because trains are required to run at a slower speed for an extended distance of track. We were provided documentation to support changes in the flagging procedures, but nothing pertaining to their impact on train delays.
• Employee: Other officials attributed delays to new employees’ inexperience with maintaining scheduled operations. Subways officials provided a report, “RTO Train Operator and Conductor Headcount Projections,” which showed there were 1,173 new hires from January 2013 to November 2014. However, officials could not provide us with evidence of any analysis of delay categories by employee or employee type (e.g., probationary, less than five years of service, more than five years of service). We determined that 8 of the 15 Employee train incident reports we sampled involved a probationary train operator and/or train conductor, so further analysis in this area may be productive.
Preventing Future Delays
Throughout our audit, we sought to determine what, if anything, was being done to address the underlying root causes of train delays. On March 2, 2015, Subways’ senior management told us that many workgroups and committees were formed in recent years to address OTP. Subways officials added that the district managers and other officials we met with might not be aware of the projects, campaigns, etc., that those groups have worked on.

2014-S-56
Division of State Government Accountability 9
At the MTA’s request, we met with senior management of Subways also on March 13, 2015. The officials provided a package of materials related to the Delay Management Workgroup (Workgroup) that has been meeting since September 2013. The package included lists of the attendees of the Workgroup meetings, as well as e-mail communication related to delay management from the initial meeting (on September 3, 2013) to April 18, 2014. The package also included agendas for other meetings and some handwritten notes. The agenda from the April 18, 2014 meeting (see Exhibit D) lists various issues, such as the “flagging data base” and “maintenance general orders.” However, we found no documentation of campaign trends mentioned by Subways’ officials at our meeting on March 2, 2015.
During the course of our audit, we met with 12 of the Workgroup’s 17 members. Although we asked each of the 12 members about efforts to reduce delays, none of them mentioned the Workgroup or any projects discussed at the meetings.
In Subways officials’ response to our preliminary findings, they reiterated that a number of workgroups and committees are dedicated to improving service and reducing delays across the system. These include the RTO Performance Reporting and Operations Analysis Group and DCE Communications Based Train Control Incident Review, as well as monthly reviews of operational performance at the Senior Vice President level. Subways officials also stated they have adjusted scheduled running times on some lines to more closely reflect actual operating performance and to allow for the impact of various maintenance activities.
At the audit’s closing conference, Subways officials indicated that OTP is just one aspect of service, and officials continue to face challenges in improving the OTP rates given increases in ridership and the volume of maintenance and capital work necessary to maintain the system. We acknowledge that Subways has many issues to address to keep trains operating on time every day. However, their efforts have not reversed the continual decline in OTP, which was 72.2 percent for weekdays in the December 2014 monthly report.
Thus, Subways needs to reassess its practices and processes to identify what needs to be done to substantially improve OTP. Because OTP is impacted by many different units/divisions of Transit, senior management needs to conduct a root cause analysis to identify the underlying reasons for recurring train delays and develop corrective action plans to proactively address those causes. Such an analysis will enable officials to identify which delay categories and/or subway lines they should address in order to have the greatest impact on OTP and improve operations. Responsible Transit operating units should be required to report not only the immediate corrective actions taken, but also plans to reduce future recurrences of the same problems. To that end, Transit needs to develop formal guidance (such as bulletins, policies, instructions, etc.) that will help middle managers improve their area of responsibility for OTP.
Providing formal written plans, programs, or other related documents is critical to ensure the efforts of the MTA management to improve on-time performance are successful. Further, a formal document facilitates a periodic assessment of the activities, including methods to evaluate what was successful or not, the costs of proposed actions, and how long they will take to implement.

2014-S-56
Division of State Government Accountability 10
Recommendations
1. Identify the underlying causes of recurring train delays and develop corrective action plans to proactively address those causes. Such plans should address the effectiveness of workgroup efforts, identify responsible parties, and require written feedback and measurable solutions.
2. Require monthly feedback from Subways managers on the actions taken to address recurring categories of train delays.
Audit Scope and Methodology We audited on-time performance by Transit to determine whether trains run on time and actions are taken to address recurring problems that reduce on-time performance. The audit covers the period March 1, 2013 to January 23, 2015.
To accomplish our objective, we reviewed policies, procedures, and guidelines related to OTP. We also reviewed documents and reports supplied to support Transit’s efforts to manage delays. We performed analyses of data and conducted observations of train operations at the RCC and line terminals. We obtained reports listing the counts of delays by category for the period March 1, 2013 to March 31, 2014. We selected a judgmental sample of 60 incident reports in four specific categories from 9,683 incidents in three sampled months (March 2013, September 2013, and March 2014). We interviewed the #7 line manager and the five district managers covering all of the subway lines to obtain information about the actions they had taken to monitor train delays and to improve OTP. In addition, we interviewed Transit officials to obtain an understanding of the internal controls related to OTP. We also reviewed their compliance with their internal control program at the operation planning level.
We conducted our performance audit in accordance with generally accepted government auditing standards. Those standards require that we plan and perform the audit to obtain sufficient, appropriate evidence to provide a reasonable basis for our findings and conclusions based on our audit objective. We believe that the evidence obtained provides a reasonable basis for our findings and conclusions based on our audit objective.
In addition to being the State Auditor, the Comptroller performs certain other constitutionally and statutorily mandated duties as the chief fiscal officer of New York State. These include operating the State’s accounting system; preparing the State’s financial statements; and approving State contracts, refunds, and other payments. In addition, the Comptroller appoints members to certain boards, commissions, and public authorities, some of whom have minority voting rights. These duties may be considered management functions for purposes of evaluating organizational independence under generally accepted government auditing standards. In our opinion, these functions do not affect our ability to conduct independent audits of program performance.

2014-S-56
Division of State Government Accountability 11
Authority The audit was performed pursuant to the State Comptroller’s authority as set forth in Article X, Section 5 of the State Constitution and Section 2803 of the Public Authorities Law.
Reporting Requirements We provided a draft copy of this report to MTA officials for their review and comments. Their comments were considered in preparing this final report and are attached in their entirety at the end of the report. MTA officials did not agree with our findings and conclusions, yet they could not provide any concrete examples where the actions they claim to have taken resulted in a measurable improvement in on-time performance. It is encouraging that the closing statement in the response is “We have carefully reviewed the findings and recommendations in the Draft Audit Report and continue to aim for improvement in processes and Procedures that will make the most effective and efficient use of our resources.” Our rejoinders to comments in the MTA’s response are included in the report’s State Comptroller’s Comments.
Within 90 days after final release of this report, as required by Section 170 of the Executive Law, the Chairman and Chief Executive Officer of the Metropolitan Transportation Authority shall report to the Governor, the State Comptroller, and the leaders of the Legislature and fiscal committees, advising them what steps were taken to implement the recommendations contained herein, and where recommendations were not implemented, the reasons why.

2014-S-56
Division of State Government Accountability 12
Division of State Government Accountability
Andrew A. SanFilippo, Executive Deputy Comptroller518-474-4593, [email protected]
Tina Kim, Deputy Comptroller518-473-3596, [email protected]
Brian Mason, Assistant Comptroller518-473-0334, [email protected]
Vision
A team of accountability experts respected for providing information that decision makers value.
Mission
To improve government operations by conducting independent audits, reviews and evaluations of New York State and New York City taxpayer financed programs.
Contributors to This ReportCarmen Maldonado, Audit Director
Robert Mehrhoff, Audit ManagerMyron Goldmeer, Audit SupervisorJoseph Smith, Examiner-in-Charge
Katie Brent, Senior ExaminerLidice Cortez, Senior ExaminerKatrina Lau, Senior ExaminerKenneth Liu, Senior ExaminerNoreen Perrotta, Senior Editor

2014-S-56
Division of State Government Accountability 13
Exhibit A-1Weekday Delays by Line March 2013–March 2014
A Division (IRT)
Time Line From To 1 2 3 4 5 6 7 GCT-TSQ
Shuttle 0:00 0:59 665 874 165 1,249 442 1,225 209 68 1:00 1:59 471 843 175 1,016 384 1,301 218 59 2:00 2:59 372 724 184 896 343 1,016 167 48 3:00 3:59 225 506 146 691 265 641 151 37 4:00 4:59 165 575 111 736 279 398 230 42 5:00 5:59 211 891 389 1,095 777 524 278 70 6:00 6:59 325 1,720 575 1,532 1,602 954 898 91 7:00 7:59 1,009 2,761 1,573 4,136 3,250 2,012 2,892 170 8:00 8:59 1,749 3,759 2,529 5,055 4,038 4,340 3,761 276 9:00 9:59 1,921 2,397 1,765 3,157 2,779 4,161 2,192 250 10:00 10:59 1,547 1,791 695 1,929 1,973 2,430 949 125 11:00 11:59 1,122 1,604 495 1,380 1,625 2,311 578 102 12:00 12:59 602 1,138 412 966 1,115 1,996 363 66 13:00 13:59 480 1,173 384 1,035 1,120 1,667 236 75 14:00 14:59 762 1,775 987 1,695 1,742 1,740 217 109 15:00 15:59 1,386 2,989 1,646 3,352 4,311 2,526 444 196 16:00 16:59 1,572 4,079 2,784 4,911 4,792 4,506 779 280 17:00 17:59 1,810 3,487 3,170 4,256 4,120 5,283 1,564 263 18:00 18:59 1,440 2,501 1,967 2,764 2,646 3,165 988 206 19:00 19:59 999 2,109 1,676 2,329 1,959 2,430 728 200 20:00 20:59 983 1,526 1,763 2,053 1,075 1,903 411 142 21:00 21:59 920 1,361 1,089 1,592 1,084 1,406 332 120 22:00 22:59 1,112 989 1,008 1,426 790 1,089 545 111 23:00 23:59 529 774 352 1,061 467 920 94 66 Time Not Noted 4 13 2 14 12 15 1 2
Totals 22,381 42,360 26,042 50,328 42,988 49,959 19,226 3,175 Note: Totals may vary due to rounding.

2014-S-56
Division of State Government Accountability 14
Exhibit A-2W
eekd
ay D
elay
s by L
ine
Mar
ch 2
013–
Mar
ch 2
014
B Di
visio
n
Tim
e Lin
e Lin
e To
tal A
ll Su
b-w
ay
Lines
Fr
om
To
A B
C D
E F
G Ro
ck-
away
Sh
uttle
J L
M
N Q
R Fr
ank-
lin A
v Sh
uttle
0:
00
0:59
85
5 34
29
95
0 1,
397
956
273
27
74
267
34
643
263
86
2 10
,786
1:
00
1:59
90
4 27
25
90
8 1,
297
1,08
2 32
0 23
72
29
5 24
70
1 27
8 66
5
10,4
96
2:00
2:
59
576
24
17
787
1,12
6 81
6 31
0 24
64
23
6 21
61
4 30
8 79
2
8,75
5 3:
00
3:59
43
0 18
12
39
6 58
3 52
1 22
4 23
51
21
1 20
33
9 16
9 60
1
5,71
8 4:
00
4:59
35
1 21
14
31
3 23
5 50
3 18
5 21
58
94
33
21
9 12
9 35
1
4,75
0 5:
00
5:59
34
7 13
3 76
32
8 26
6 48
0 21
5 41
50
17
3 18
5 36
0 19
6 22
9 2
7,31
6 6:
00
6:59
71
2 38
8 21
4 47
1 38
6 80
5 19
2 43
13
6 24
5 31
8 45
4 42
5 39
7 7
12,8
88
7:00
7:
59
1,65
6 68
0 32
7 82
0 76
9 1,
714
394
30
431
394
767
616
409
704
14
27,5
31
8:00
8:
59
1,84
4 1,
033
506
981
1,49
0 2,
281
721
83
624
927
1,31
1 71
1 59
8 85
7 14
39
,488
9:
00
9:59
98
8 84
3 43
4 55
0 1,
190
2,20
2 88
4 75
40
5 65
5 67
2 71
6 76
0 76
6 11
29
,774
10
:00
10:5
9 1,
037
1,08
4 37
2 53
9 1,
349
2,39
0 1,
252
155
531
375
991
1,18
1 1,
404
942
10
25,0
50
11:0
0 11
:59
639
1,10
3 37
6 52
6 1,
308
1,82
8 1,
353
235
614
391
1,17
2 93
3 1,
252
969
8 21
,923
12
:00
12:5
9 51
4 79
9 26
9 43
7 63
8 1,
031
953
198
399
327
674
537
817
598
5 14
,854
13
:00
13:5
9 55
1 43
5 27
8 28
9 30
9 61
1 46
1 98
15
3 22
0 32
9 37
1 45
1 40
8 5
11,1
39
14:0
0 14
:59
825
400
287
455
447
969
253
49
116
243
308
331
359
341
9 14
,418
15
:00
15:5
9 96
4 42
5 37
9 61
1 71
6 1,
058
210
56
155
212
356
450
349
431
19
23,2
41
16:0
0 16
:59
1,30
0 69
5 44
0 97
1 1,
324
2,06
0 20
5 71
28
7 21
4 47
0 47
8 33
4 58
8 17
33
,157
17
:00
17:5
9 1,
211
573
439
797
1,29
0 2,
174
275
83
361
265
591
790
455
610
9 33
,875
18
:00
18:5
9 82
6 45
1 34
6 47
9 1,
083
2,25
5 33
7 74
19
4 30
0 66
7 45
9 43
9 56
9 7
24,1
64
19:0
0 19
:59
878
402
292
411
1,24
2 2,
778
335
136
189
296
604
497
389
769
6 21
,654
20
:00
20:5
9 78
6 51
1 28
8 48
3 1,
394
2,10
0 56
8 82
21
7 28
1 89
3 87
3 44
9 1,
115
4 19
,899
21
:00
21:5
9 67
3 42
4 19
6 58
3 87
7 95
3 34
8 36
15
1 26
9 70
3 1,
082
435
1,17
4 3
15,8
12
22:0
0 22
:59
1,47
9 68
68
1,
009
1,78
3 2,
013
392
61
160
303
745
1,70
3 56
6 92
4 6
18,3
50
23:0
0 23
:59
110
33
22
234
194
223
14
6 29
21
49
22
1 12
9 12
2 2
5,67
3 Ti
me
Not
Note
d 4
1 1
2 3
4 0
0 0
0 4
4 1
1 0
89
Tota
ls 20
,462
10
,603
5,
705
14,3
29
22,6
97
33,8
08
10,6
76
1,72
9 5,
522
7,21
5 11
,941
15
,281
11
,363
12
,842
16
8 44
0,80
0 No
te:
Tota
ls m
ay va
ry d
ue to
roun
ding
.

2014-S-56
Division of State Government Accountability 15
Exhibit BDe
lays b
y Cat
egor
y (W
eekd
ay an
d Wee
kend
)
Cate
gorie
s M
ar-1
3 Ap
r-13
May
-13
Jun-
13
Jul-1
3 Au
g-13
Sep-
13
Oct-1
3 No
v-13
Dec-1
3 Ja
n-14
Fe
b-14
M
ar-1
4 To
tal
Car
Equip
men
t 1,5
27
1,967
1,2
22
1,729
1,3
81
1,899
2,4
09
2,735
2,4
57
2,020
2,0
95
2,578
3,6
38
27,65
7
Collis
ion/
Dera
ilmen
t 0
0 0
41
263
0 0
5 3
0 0
0 0
312
Empl
oyee
50
9 54
5 61
6 67
3 68
3 1,0
59
1,095
1,2
48
785
746
481
731
882
10,05
3 Ex
tern
al
5 18
9
117
37
472
274
338
297
323
266
316
190
2,662
Fir
e 33
4 81
7 76
3 56
4 1,0
34
453
986
299
927
585
1,224
93
6 86
4 9,7
86
Incle
men
t W
eath
er
537
1,759
50
0 87
27
4 49
4 63
63
36
68
32
0 2,1
56
7,020
13
,377
Infra
struc
ture
40
8 1,1
20
792
212
295
537
313
1,115
26
3 39
7 85
59
0 1,2
35
7,362
Op
erat
ional
Divis
ions
269
240
267
299
406
306
304
262
363
443
630
757
905
5,451
Over
Cr
owdi
ng
5,050
5,7
59
5,023
5,0
29
5,090
5,3
84
5,892
5,8
23
6,374
7,2
25
7,419
7,8
83
8,665
80
,616
Polic
e 2,1
87
2,046
2,3
43
2,430
1,8
73
1,668
1,7
38
1,514
1,5
95
3,571
1,9
98
2,247
2,3
81
27,59
1 RO
W D
elays
9,3
25
7,896
6,6
68
6,365
9,0
64
8,617
11
,857
9,580
9,7
66
8,678
10
,204
11,28
7 14
,362
123,6
69
Sick
Custo
mer
2,5
48
2,196
2,6
17
2,374
2,6
95
2,373
2,2
83
2,041
2,5
00
2,455
2,7
85
3,066
2,9
35
32,86
8
Trac
k Gan
gs
6,258
6,5
96
7,767
7,4
98
8,728
9,3
72
8,844
9,1
26
9,055
9,9
46
8,142
8,3
02
7,995
10
7,629
Un
ruly
Custo
mer
1,0
90
1,035
1,2
09
1,104
1,1
22
905
1,036
1,1
84
1,499
1,2
75
1,694
1,5
57
1,289
15
,999
Wor
k Eq
uipm
ent/
G.O.
1,423
1,6
64
1,797
1,7
39
1,878
2,9
68
2,954
3,7
30
3,083
3,7
93
3,631
1,8
45
3,352
33
,857
Tota
l 31
,470
33,65
8 31
,593
30,26
1 34
,823
36,50
7 40
,048
39,06
3 39
,003
41,52
5 40
,974
44,25
1 55
,713
498,8
89

2014-S-56
Division of State Government Accountability 16
Exhibit COTP Performance, Car Class, and Fleet Age, by Line
N/A = Not Applicable (rankings exclude shuttles)
Data source: OTP - May 2014 Transit and Bus Committee meeting; Fleet Age – March 2014 (fleet age report); and Car Class and Total Cars for Division A and B are from June16, 2014 and September 28, 2014, respectively.
Line OTP OTP Rank
Car Class Total Cars
Fleet Age Age Rank Division A
1 81.5% 9 R62-GE 10 28.69 4 R62A 310 27.69 5 2 51.2% 18 R142 340 11.76 9 3 68.2% 15 R62-GE 250 28.69 4 4 49.2% 20 R142 220 11.76 9 R142A 130 12.51 8 5 51.1% 19 R142 340 11.76 9 6 66.9% 16 R62A 90 27.69 5 R142A 300 12.51 8 7 88.2% 5 R62A 240 27.69 5 R62A 35 27.69 5 R188 77 0.15 14 S (42nd St) 97.9% N/A R62A 3 27.69 5 R62A 7 27.69 5
Division B A 79.1% 13 R46-GE 304 37.69 3 B 79.5% 11 R68-WH 48 26.69 6 R68A-WH 152 24.68 7 C 88.9% 3 R32-GE 144 48.7 1 D 80.4% 10 R68-WH 240 26.69 6 E 77.9% 14 R160A 240 5.23 11 R160B1 20 5.23 12 F 66.1% 17 R46-GE 32 37.69 3 R160A 290 5.23 11 R160B1 110 5.23 12 S (Franklin) 98.9% N/A R68-WH 4 26.69 6 G 85.4% 6 R68-WH 52 26.69 6 S (Rockaway) 95.9% N/A R46-GE 12 37.69 3 J, Z 92.1% 2 R32-GE 8 48.7 1 R42-GE 40 44.7 2 R160A 112 5.23 11 L 93.7% 1 R143 160 11.51 10 R160A 32 5.23 11 M 82.5% 8 R160A 184 5.23 11 N 79.2% 12 R160B1 10 5.23 12 R160B2 230 5.23 13 Q 83.9% 7 R160A 20 5.23 11 R160B1 210 5.23 12 R 88.7% 4 R46-GE 232 37.69 3

2014-S-56
Division of State Government Accountability 17
Exhibit DDelay Management Workgroup
Meeting Agenda

2014-S-56
Division of State Government Accountability 18
Agency Comments

2014-S-56
Division of State Government Accountability 19
*Comment
1
*Comment
2
*See State Comptroller’s Comments, page 31.

2014-S-56
Division of State Government Accountability 20
*Comment
3
*Comments
4, 5

2014-S-56
Division of State Government Accountability 21
*Comment
6
*Comment
7

2014-S-56
Division of State Government Accountability 22
*Comment
8
2014-S-56
Division of State Government Accountability 23
*Comment
9
*Comment
10

2014-S-56
Division of State Government Accountability 24
*Comment
1

2014-S-56
Division of State Government Accountability 25

2014-S-56
Division of State Government Accountability 26
*Comment
11
*Comment
1

2014-S-56
Division of State Government Accountability 27

2014-S-56
Division of State Government Accountability 28
*Comment
12

2014-S-56
Division of State Government Accountability 29
*Comment
8

2014-S-56
Division of State Government Accountability 30
Enclosure

2014-S-56
Division of State Government Accountability 31
State Comptroller’s Comments1. Many of the “causes” for delays identified by MTA are not new. For example, in 2012
the MTA in its Supplementary Information for Public Authorities Law §1269(d) stated: “Subway Weekday Terminal On-Time Performance (OTP) evaluates the level of service provided to our customers based on the schedule or service plan in effect at the time and includes all delays. Actual OTP in 2011 was 6.5 percentage points below goal due to a continuing initiative to allow increased access to the right-of-way in order to affect the need for critical maintenance and capital improvements. The tradeoff for the enhanced program however, has been incremental increases in delays and a corresponding decrease in OTP.” Similarly in 2007, the MTA reported that there was little room to accommodate more riders. At that time the MTA provided a chart (similar to the one in its May 18, 2015 Power Point presentation) that showed that many lines were at peak track capacity. In view of the fact that the identified conditions have existed for a number of years, it is not unreasonable to expect that the MTA would have more to show for its “full analysis” and planning efforts than a 17-slide Power Point that was done after the audit’s field work was completed. At a minimum, we would expect a business action plan would have documented: the goal(s) for the plan, the steps to be taken to achieve the specific goal(s), a clear statement of what resources are required to reach the goal(s), a formal timeline for when tasks need to be implemented and completed, and a statement of when the customers will benefit from the expected outcome. The Power Point lacked many of these key elements.
2. Based on a study published by MTA staff in 2013 for the Transportation Research Board, the MTA developed the components and weightings of its Operations Key Performance Indicator from customer survey data. Based on these surveys, customers ranked both reasonable wait times (reflected by wait assessment) and minimal delays during trips (reflected by OTP) at the highest levels of importance. While wait times were ranked higher in concern, minimal delays were only slightly less important to customers. The MTA states that customer experience is now best reflected by wait times. However, it has presented no analysis or additional customer survey data to establish that customers no longer place an importance on minimal delays during trips (i.e., OTP). Further, customer experience is based on the customer’s perception, not the MTA’s.
3. MTA indicates that wait assessment is its critical indicator, yet wait assessment has also been on the decline. Actual wait assessment was 80.3 percent for 2013 and 78.8 percent for 2014. For 2014, wait assessment was as low as 67.4 percent on the number 5 and 69.6 percent on the A train.
4. The audit recommends a root cause analysis and a corrective action plan to proactively address those causes. Transit has not performed such an analysis. According to the American Quality Center, “A root cause is a factor that caused a nonconformance and should be permanently eliminated through process improvement.” The MTA in its analysis has identified the visible problems (e.g., overcrowding and heavy ridership) and has tried to eliminate some of the associated symptoms, but has not identified the root cause.

2014-S-56
Division of State Government Accountability 32
For example, although additional platform controllers, step aside boxes, and revised door announcements can help alleviate the symptoms of overcrowding and heavy ridership, they do not eliminate either.
5. We were aware of this meeting and on January 7, 2015, the auditors met with one of Subway’s key officials to obtain information about such plans, but no information was provided. We note that no information was provided on March 5, 2015 and March 13, 2015 when we met with several key Subway officials.
6. Supplemental schedules are prepared to address this work. If done correctly, it should not impact on-time performance.
7. The use of additional platform controllers is not a new approach. It was used several years ago for a similar purpose. The step aside boxes are used at subway stations such as 42nd Street – Grand Central and announcements on many of the trains in the A Division (numbered lines) tell riders to step aside.
8. This list of work groups was previously provided, but there was no information about actual actions taken and any improvements made. In addition, five of the work groups focused on car equipment which, according to MTA’s response, is not a major factor.
9. MTA officials are correct that many of the “efforts” were discussed with the auditors. However, outside of these discussions, officials provided very little in terms of documentation of the results of the “efforts.”
10. We did not ask MTA officials to limit their response to any period of time. In fact, we asked MTA officials to provide all information they have to support the efforts made to improve OTP. MTA officials had ample opportunity to provide the information, but did not. Instead, it provided a Power Point presentation made to the Board in May 2015 after the audit was completed.
11. This is a false statement. MTA officials did not share any information about decreasing the OTP goal from 91.9 percent to 75 percent.
12. It is unclear why the MTA finds it appropriate to refer to a 2009 change in flagging procedures as a reason for late trains. It has been six years, and MTA should have determined how to build this into schedules, so that there is less impact on OTP.