authors namburete, cedrik edson dabo, fernando...
TRANSCRIPT

0
SURFACING OPTIONS FOR LOW VOLUME ROADS IN MOZAMBIQUE
Authors Namburete, Cedrik Edson
Administração Nacional de Estradas, Inhambane-Moçambique
Dabo, Fernando
Administração Nacional de Estradas, Maputo-Moçambique
Calisto, Zacarias
Administração Nacional de Estradas, Zambézia-Moçambique
1
Abstract
Mozambique has a classified road network of about 30 000
km, of which only 20% is paved. Most of the unpaved roads
are rural with low volumes of traffic and cannot justify the
conventional pavement design and material usage standards.
The scarcity of conventional road construction materials in
some areas of the country is also a major challenge.
Two low volume roads in Inhambane and Zambezia provinces
have been constructed using locally available materials not
complying with traditional standards as base course. Four
different surfacing options were used on these roads: gravel,
penetration macadam, Otta seal and sand seal (armoured
base). The roads were built between 2009 and 2013.
Monitoring sections have been established on these roads and
are being regularly assessed in terms of the Mozambique
standard Monitoring Protocols. After up to 7 years the sections
are generally performing well. Localized defects are attributed
to poor construction quality and inadequate supervision on
site.
The performance of the three surfacing solutions was analyzed
and compared with the performance of the gravel section.
The paper summarizes the findings of the investigations and
concludes that all the surfacing options are technically viable.
However, each situation needs to be assessed in terms of its
economic viability, particularly on roads carrying low traffic
(less than 100 vpd) or where the necessary construction
materials must be hauled over long distances.
Keywords— gravel, penetration macadam, Otta seal and sand
seal (armoured base)
I. INTRODUCTION
Mozambique has a classified road network of about 30 000
km, of which only 20% is paved. Most of the unpaved roads
are rural with low volumes of traffic and cannot justify the
conventional pavement design and material usage standards.
The scarcity of conventional road construction materials in
some areas of the country is also a challenge.
Numerous experimental sections were constructed in
Mozambique (in all provinces) between 2009 and 2013 as part
of a broader programme of Targeted Interventions for Low
Volume Roads. Two of these low volume roads were
constructed in Inhambane and Zambezia provinces.
The Inhambane road (R903) links Cumbana to Chacane,
which is on the N1 highway about 30 km south of Maxixe
City. The Zambezia road (R650) links the village of Zero on
the N1 highway about 140km south of Quelimane with the
town of Mopeia. In both cases the design traffic load was
almost 86 500 E80s: roads lightly trafficked, carrying mainly
cars and 4x4s. The current cumulative traffic count is almost
10 200 E80s.
On the Inhambane experimental section, three different
surfacing options were constructed: i) gravel wearing course,
ii) penetration macadam and iii) sand seal on an armoured
sand base.
The Zambezia experimental section has an Otta seal
surfacing. In all cases the road base and sub base pavement
was constructed with locally available materials not
complying with conventional standards. The research project
is being carried out by the Road Research Centre (RRC) of the
Mozambique National Road Administration (ANE). Technical
assistance is being provided to the RRC under the Africa
Community Access Partnership (AfCAP), funded by UK Aid.
The main purpose of the investigation is to evaluate the
performance of different surfacing solutions (gravel,
penetration macadam, Otta seal and sand seal) on pavements
that do not comply with traditional standards for base and sub
base courses, in low volume roads.
An assessment of the economic feasibility of each surfacing
solution is also carried out for a period of 20 years, being an
element of evaluation complementary to the technical
evaluation.
According to the results, all of the surfacing options are
technically viable. In order to choose the best solution other
aspects must be considered, in particular the life cycle costs.
The cost of construction of the paved road sections is higher
than the gravel road but the annual routine maintenance costs
are much higher for the gravel road.
II. METHODOLOGY
A monitoring programme was established on each
surfacing solution to evaluate the performance over time.
Routine measurements and tests were carried out in
accordance with the standard protocol for monitoring of
experimental road sites developed for Mozambique [1]
following the strategy below.
• Review of the existing data;
• Selection of the representative monitoring sections
• Marking of the sections; and
• Evaluation of the pavement condition (Test Pits for
laboratory and field analysis, density and moisture
content of the pavement layers, visual condition
assessment, rut depth measurements, roughness
measurements, etc)
The performance of the three surfacing solutions was analyzed and compared with the performance of the gravel section.
2
Monitoring visits were carried out in October 2017 (end of dry season) and March 2018 (end of rain season).
A. Review of existing data
The existing information used for the analysis included the
project specifications, laboratory results, bills of quantities,
and the as built report from the construction of the
experimental sections. A preliminary site visit was carried out
to assess the overall condition of the roads and to identify the
sections to be used for the monitoring purposes.
B. Selection of representative monitoring
The sections of 250m length were identified and marked as indicated in Figure 1. for long term monitoring. The panels A, B and C were reserved for destructive tests including test pits, density measurements, moisture content measurements, Dynamic Cone Penetrometer (DCP) tests, etc. The panels in between were reserved for non-destructive tests including roughness measurements, rut depth measurements and visual condition assessments.
The following factors were taken into account for the
identification of the monitoring sections:
• Goals and aims of the study: it was necessary to
choose sections that included each of the surfacing
solutions under investigation;
• Representativeness of the section: it should reflect the
characteristics of each surfacing option to the
maximum extent;
• Safety: avoiding locations with poor visibility for
motorists; and
• Section condition: avoiding sections with significant
damage.
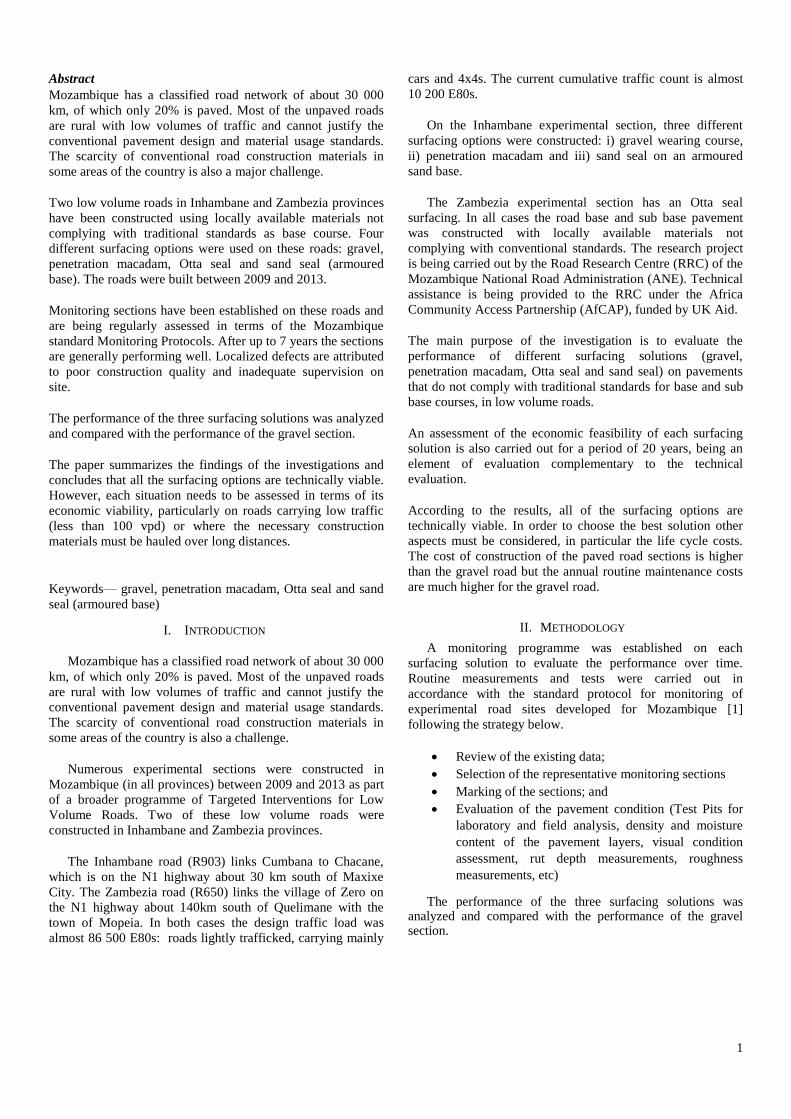
The paved road monitoring sections were 250 meters long and
6 meters wide. The sections include the full width of the road
and are divided into 13 panels as shown in Figure 1. Panels A
and C are 20m long and Panel B is 10m long. Panels 1 to 10
are each 20m long.
Destructive tests were performed in panels A, B and C and
non-destructive tests in panels 1 to 10.
Fig. 1 Layout of the paved road monitoring sections
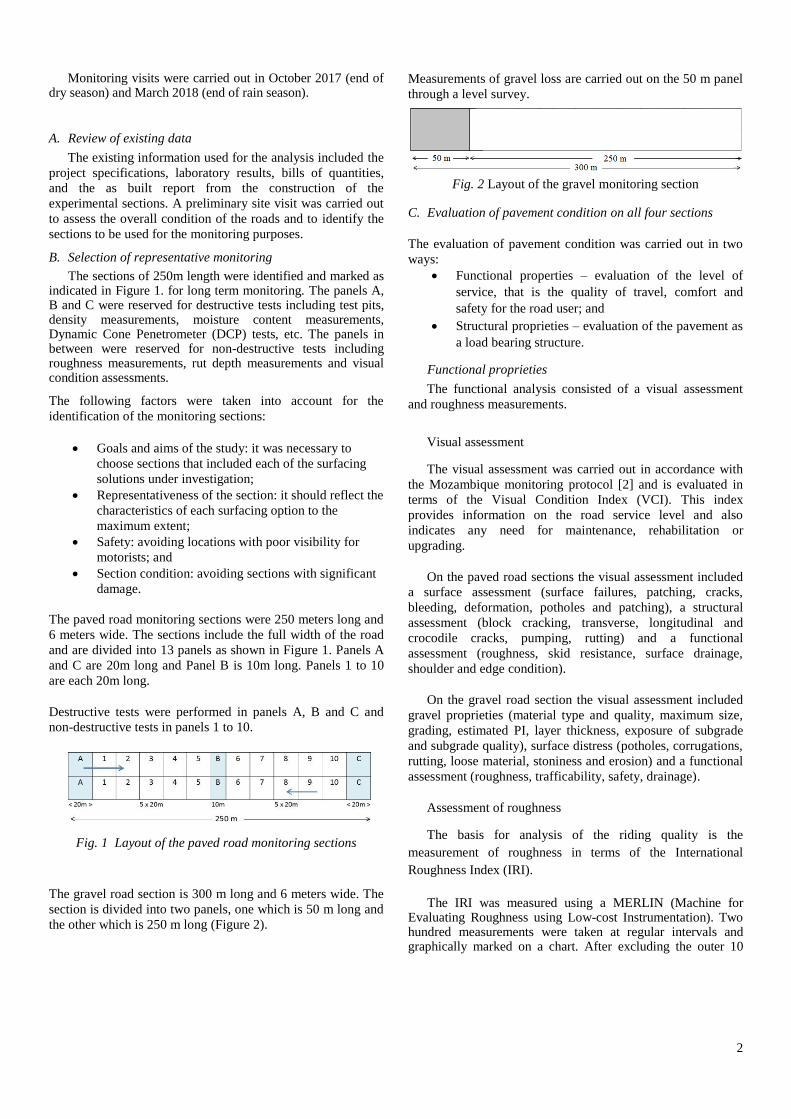
The gravel road section is 300 m long and 6 meters wide. The
section is divided into two panels, one which is 50 m long and
the other which is 250 m long (Figure 2).
Measurements of gravel loss are carried out on the 50 m panel
through a level survey.
Fig. 2 Layout of the gravel monitoring section
C. Evaluation of pavement condition on all four sections
The evaluation of pavement condition was carried out in two
ways:
• Functional properties – evaluation of the level of
service, that is the quality of travel, comfort and
safety for the road user; and
• Structural proprieties – evaluation of the pavement as
a load bearing structure.
Functional proprieties
The functional analysis consisted of a visual assessment
and roughness measurements.
Visual assessment
The visual assessment was carried out in accordance with
the Mozambique monitoring protocol [2] and is evaluated in
terms of the Visual Condition Index (VCI). This index
provides information on the road service level and also
indicates any need for maintenance, rehabilitation or
upgrading.
On the paved road sections the visual assessment included
a surface assessment (surface failures, patching, cracks,
bleeding, deformation, potholes and patching), a structural
assessment (block cracking, transverse, longitudinal and
crocodile cracks, pumping, rutting) and a functional
assessment (roughness, skid resistance, surface drainage,
shoulder and edge condition).
On the gravel road section the visual assessment included
gravel proprieties (material type and quality, maximum size,
grading, estimated PI, layer thickness, exposure of subgrade
and subgrade quality), surface distress (potholes, corrugations,
rutting, loose material, stoniness and erosion) and a functional
assessment (roughness, trafficability, safety, drainage).
Assessment of roughness
The basis for analysis of the riding quality is the
measurement of roughness in terms of the International
Roughness Index (IRI).
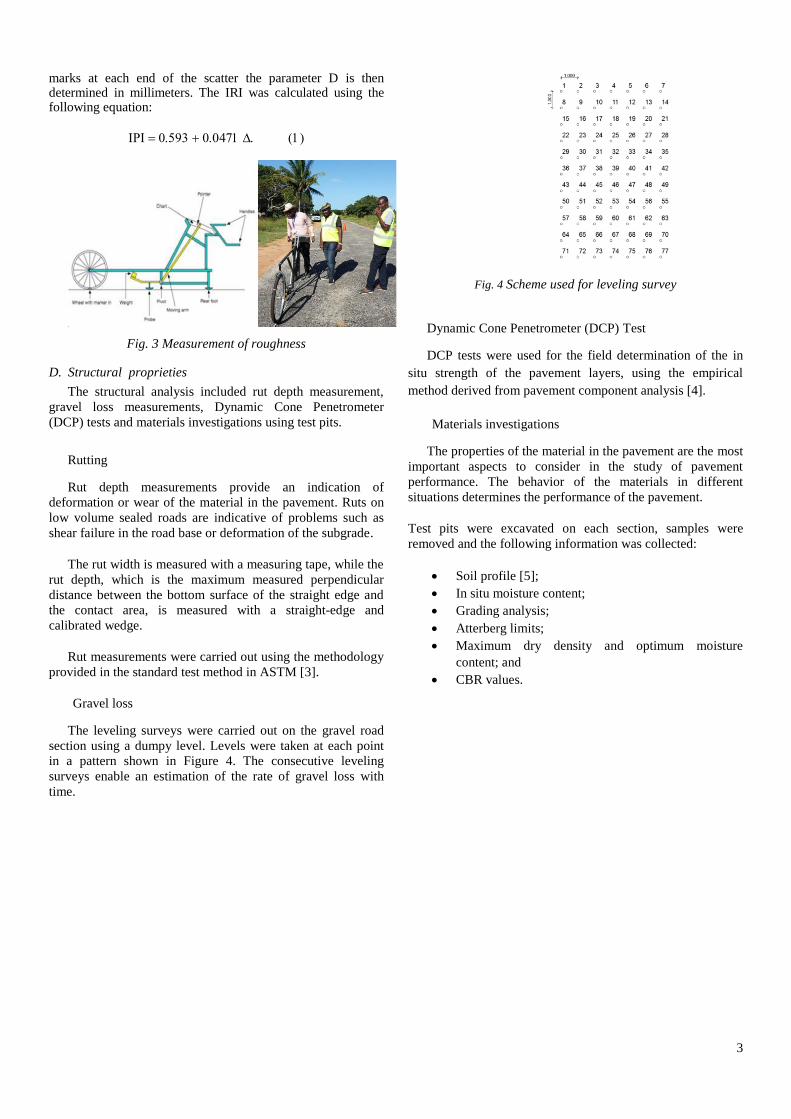
The IRI was measured using a MERLIN (Machine for Evaluating Roughness using Low-cost Instrumentation). Two hundred measurements were taken at regular intervals and graphically marked on a chart. After excluding the outer 10
3
marks at each end of the scatter the parameter D is then determined in millimeters. The IRI was calculated using the following equation:
= + ()
Fig. 3 Measurement of roughness
D. Structural proprieties
The structural analysis included rut depth measurement,
gravel loss measurements, Dynamic Cone Penetrometer
(DCP) tests and materials investigations using test pits.
Rutting
Rut depth measurements provide an indication of
deformation or wear of the material in the pavement. Ruts on
low volume sealed roads are indicative of problems such as
shear failure in the road base or deformation of the subgrade.
The rut width is measured with a measuring tape, while the
rut depth, which is the maximum measured perpendicular
distance between the bottom surface of the straight edge and
the contact area, is measured with a straight-edge and
calibrated wedge.
Rut measurements were carried out using the methodology
provided in the standard test method in ASTM [3].
Gravel loss
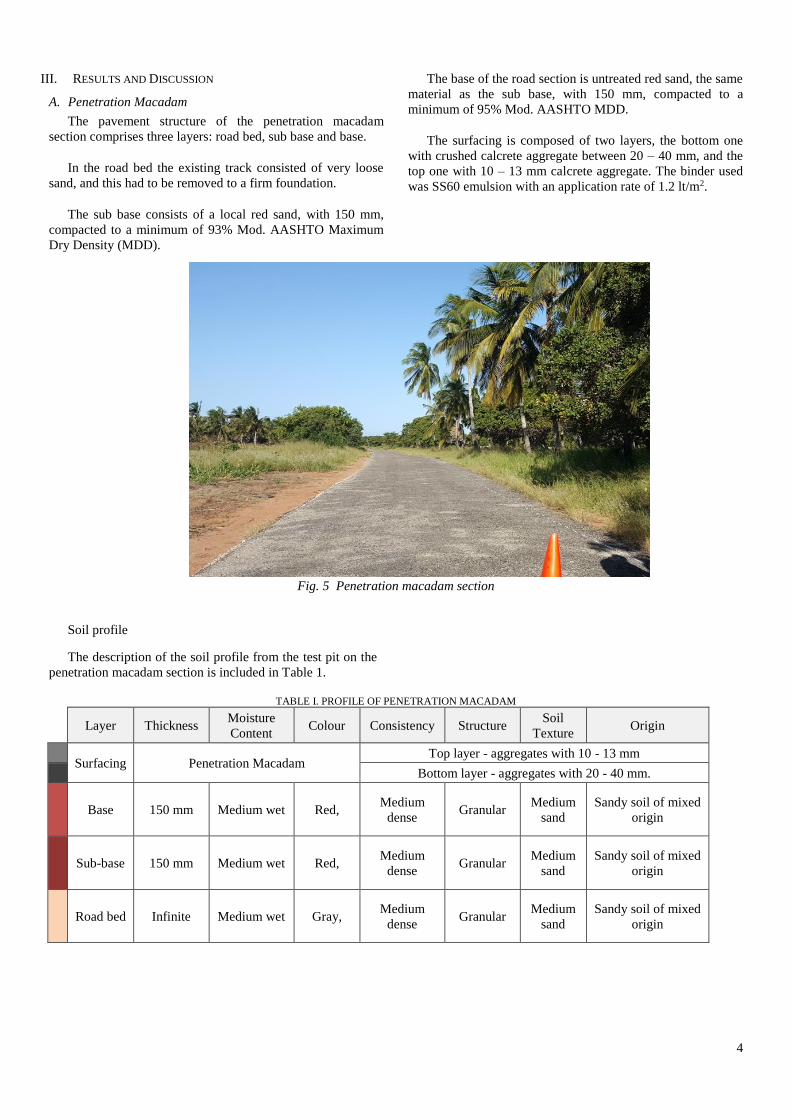
The leveling surveys were carried out on the gravel road
section using a dumpy level. Levels were taken at each point
in a pattern shown in Figure 4. The consecutive leveling
surveys enable an estimation of the rate of gravel loss with
time.
Fig. 4 Scheme used for leveling survey
Dynamic Cone Penetrometer (DCP) Test
DCP tests were used for the field determination of the in
situ strength of the pavement layers, using the empirical
method derived from pavement component analysis [4].
Materials investigations
The properties of the material in the pavement are the most
important aspects to consider in the study of pavement
performance. The behavior of the materials in different
situations determines the performance of the pavement.
Test pits were excavated on each section, samples were
removed and the following information was collected:
• Soil profile [5];
• In situ moisture content;
• Grading analysis;
• Atterberg limits;
• Maximum dry density and optimum moisture
content; and
• CBR values.
4
III. RESULTS AND DISCUSSION
A. Penetration Macadam
The pavement structure of the penetration macadam
section comprises three layers: road bed, sub base and base.
In the road bed the existing track consisted of very loose
sand, and this had to be removed to a firm foundation.
The sub base consists of a local red sand, with 150 mm,
compacted to a minimum of 93% Mod. AASHTO Maximum
Dry Density (MDD).
The base of the road section is untreated red sand, the same
material as the sub base, with 150 mm, compacted to a
minimum of 95% Mod. AASHTO MDD.
The surfacing is composed of two layers, the bottom one
with crushed calcrete aggregate between 20 – 40 mm, and the
top one with 10 – 13 mm calcrete aggregate. The binder used
was SS60 emulsion with an application rate of 1.2 lt/m2.
Fig. 5 Penetration macadam section
Soil profile
The description of the soil profile from the test pit on the
penetration macadam section is included in Table 1.
TABLE I. PROFILE OF PENETRATION MACADAM
Layer Thickness Moisture
Content Colour Consistency Structure
Soil
Texture Origin
Surfacing Penetration Macadam
Top layer - aggregates with 10 - 13 mm
Bottom layer - aggregates with 20 - 40 mm.
Base 150 mm Medium wet Red, Medium
dense Granular
Medium
sand
Sandy soil of mixed
origin
Sub-base 150 mm Medium wet Red, Medium
dense Granular
Medium
sand
Sandy soil of mixed
origin
Road bed Infinite Medium wet Gray, Medium
dense Granular
Medium
sand
Sandy soil of mixed
origin
5
According to the profile, the materials are medium wet,
probably influenced by voids of the coating, and the test
was done after rainy season.
Visual assessment
Based on the visual condition survey, the VCI was
calculated and the results are shown in Table 2.
TABLE II. VCI SUMMARY RESULTS IN PENETRATION MACADAM SECTION
Item Season VCI VCI
(Variation)
1 October, 2017 91,3 0,2
2 March, 2018 91,1
The VCI results on this section are 85% - 100% range,
which means the road is in the very good condition according
to this category description.
The variation of the section condition between the rainy
and dry season is small. However, there is a slight reduction in
the VCI value due to the appearance of potholes in the dry
season, which were not repaired and increased in size in the
rainy season.
The surface is slightly uneven, but there are no signs of
cracks (crocodile, transverse and longitudinal) and
settlements, just a few potholes, which mean that surface
irregularities are due to construction defects.
Roughness
The results of IRI roughness done on each 250m long
section in the outer wheel path in each lane are presented in
Table 3.
TABLE III. IRI SUMMARY RESULTS IN PENETRATION MACADAM
SECTION
Item Season IRI VARIATION
1 October, 2017 7.8 -0.9
2 March, 2018 6.9
The IRI value is high compared to the visual assessment of
the condition of the road. The high roughness value is
probably related to construction defects because visually, there
are no cracks and settlements, only irregularities of the
surface.
The negative variation after the rainy season is probably
due to the accuracy of MERLIN (Machine to evaluate
roughness using low cost instrumentation), as it does not allow
the test to be carried out exactly in the same way.
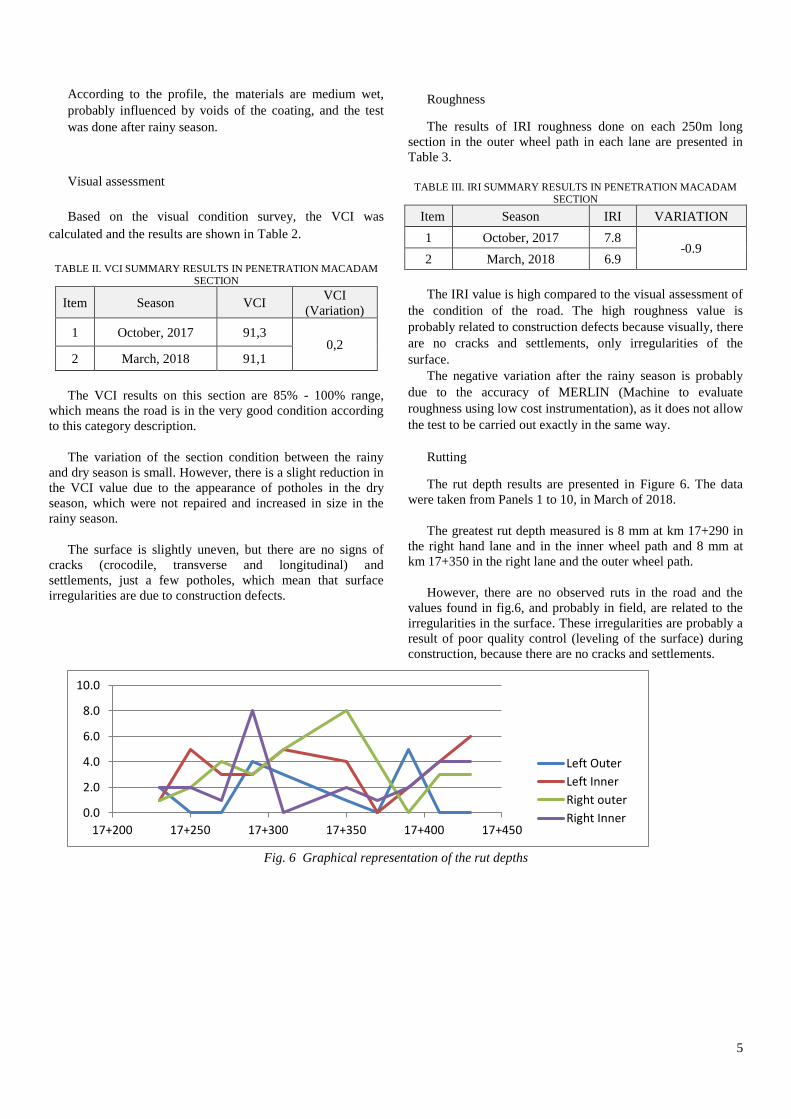
Rutting
The rut depth results are presented in Figure 6. The data
were taken from Panels 1 to 10, in March of 2018.
The greatest rut depth measured is 8 mm at km 17+290 in
the right hand lane and in the inner wheel path and 8 mm at
km 17+350 in the right lane and the outer wheel path.
However, there are no observed ruts in the road and the
values found in fig.6, and probably in field, are related to the
irregularities in the surface. These irregularities are probably a
result of poor quality control (leveling of the surface) during
construction, because there are no cracks and settlements.
Fig. 6 Graphical representation of the rut depths
0.0
2.0
4.0
6.0
8.0
10.0
17+200 17+250 17+300 17+350 17+400 17+450
Left Outer
Left Inner
Right outer
Right Inner
6
DCP Test
The in situ strength measured by the DCP was carried out
at 3 points in panels A, B and C. The DCP tests were
carried out in the wet season to understand the behavior of
the material in its worst condition. The results are as
shown in Table 4.
TABLE IV. DCP RESULTS PENETRATION MACADAM SECTION
Depth
(mm)
Panel A Panel B Panel C
DN
(mm/Blow)
CBR
(%)
DN
(mm/Blow)
CBR
(%)
DN
(mm/Blow)
CBR
(%)
Test1 Test1 Test1 Test1 Test1 Test1
0 – 150 6,58 39 6,29 40 9,23 24
151 –
300 4,23 59 6,62 37 10,25 21
301 – 800
8,25 45 3,19 94 5,6 46
The DCP results were analyzed using the AfCAP DCP
computer program developed by the Council for Scientific and
Industrial Research (CSIR) in South Africa. According to the
analysis, the pavement in each panel is categorized as follows:
- Panel A – Category VI – Poorly Balanced Deep
Structure (PBD);
- Panel B – Category VIII – Averagely Balanced
Inverted Structure (ABI); and
- Panel C – Category IX – Poorly Balanced
Inverted Structure (PBI).
In nearly all cases, the in situ strength of the base and
subbase material shows that it does not meet the conventional
standards for road pavement layers in high volume roads.
In panels B and C the DCP results indicates that the
pavement has an inverted structure, which means that the
compaction of the base layer was probably deficient.
In panel C, the field CBR is very low, that means that the
compactions was probably deficient and the drainage is
inadequated, because there is no side drain and the level of the
road are down than the shoulders.
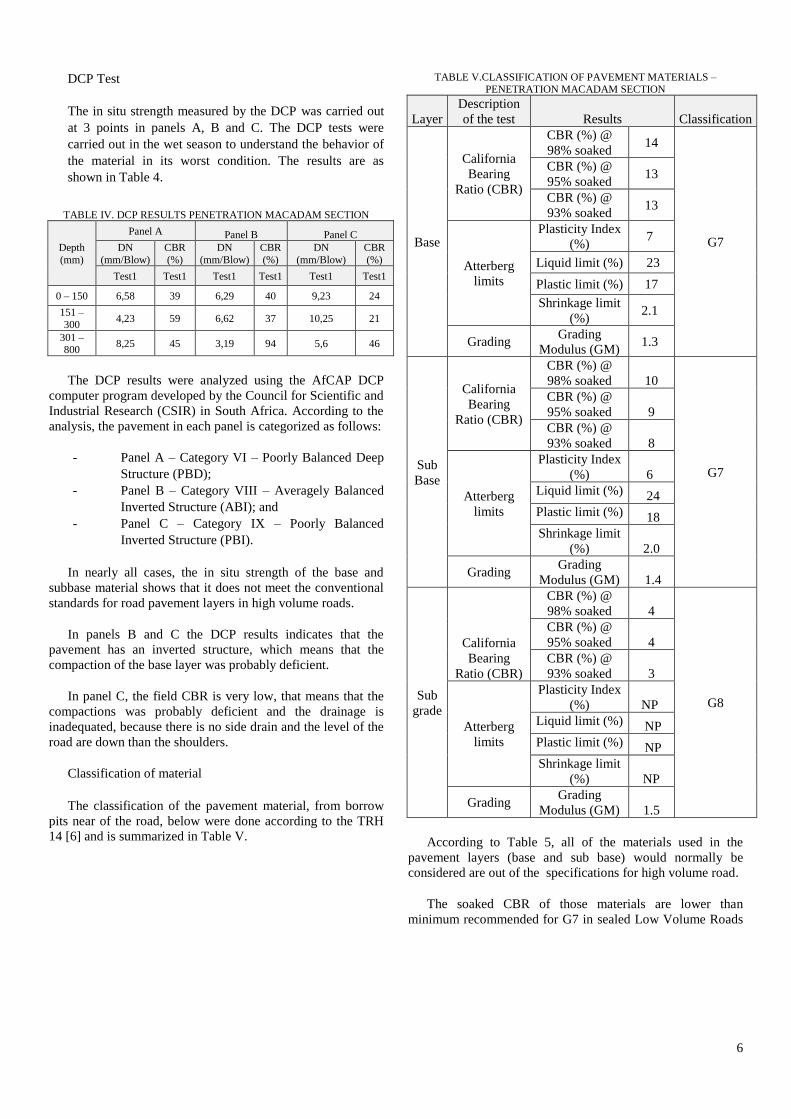
Classification of material
The classification of the pavement material, from borrow
pits near of the road, below were done according to the TRH
14 [6] and is summarized in Table V.
TABLE V.CLASSIFICATION OF PAVEMENT MATERIALS – PENETRATION MACADAM SECTION
Layer
Description
of the test Results Classification
Base
California
Bearing
Ratio (CBR)
CBR (%) @
98% soaked 14
G7
CBR (%) @
95% soaked 13
CBR (%) @
93% soaked 13
Atterberg
limits
Plasticity Index
(%) 7
Liquid limit (%) 23
Plastic limit (%) 17
Shrinkage limit
(%) 2.1
Grading Grading
Modulus (GM) 1.3
Sub
Base
California
Bearing
Ratio (CBR)
CBR (%) @
98% soaked 10
G7
CBR (%) @
95% soaked 9
CBR (%) @
93% soaked 8
Atterberg
limits
Plasticity Index
(%) 6
Liquid limit (%) 24
Plastic limit (%) 18
Shrinkage limit
(%) 2.0
Grading Grading
Modulus (GM) 1.4
Sub
grade
California
Bearing
Ratio (CBR)
CBR (%) @
98% soaked 4
G8
CBR (%) @
95% soaked 4
CBR (%) @
93% soaked 3
Atterberg
limits
Plasticity Index
(%) NP
Liquid limit (%) NP
Plastic limit (%) NP
Shrinkage limit
(%) NP
Grading Grading
Modulus (GM) 1.5
According to Table 5, all of the materials used in the
pavement layers (base and sub base) would normally be
considered are out of the specifications for high volume road.
The soaked CBR of those materials are lower than
minimum recommended for G7 in sealed Low Volume Roads
7
(LVR), and the approximate field CBR is only adequate in
panel A.
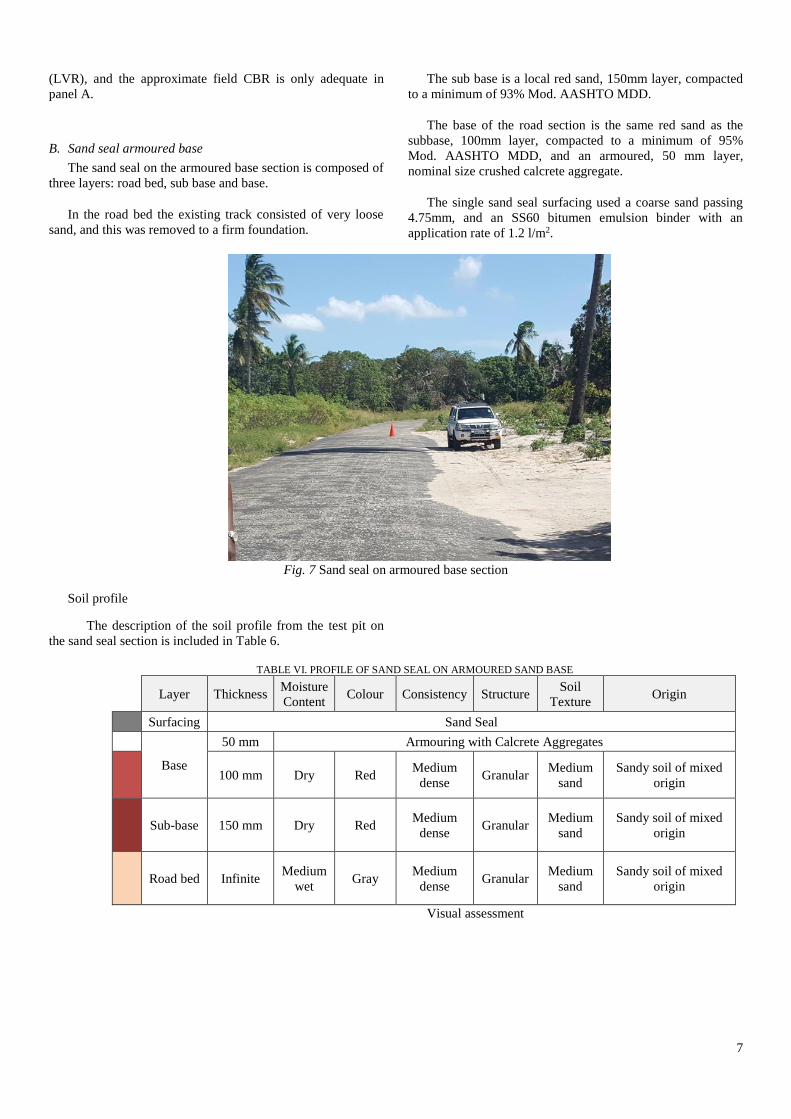
B. Sand seal armoured base
The sand seal on the armoured base section is composed of
three layers: road bed, sub base and base.
In the road bed the existing track consisted of very loose
sand, and this was removed to a firm foundation.
The sub base is a local red sand, 150mm layer, compacted
to a minimum of 93% Mod. AASHTO MDD.
The base of the road section is the same red sand as the
subbase, 100mm layer, compacted to a minimum of 95%
Mod. AASHTO MDD, and an armoured, 50 mm layer,
nominal size crushed calcrete aggregate.
The single sand seal surfacing used a coarse sand passing
4.75mm, and an SS60 bitumen emulsion binder with an
application rate of 1.2 l/m2.
Fig. 7 Sand seal on armoured base section
Soil profile
The description of the soil profile from the test pit on
the sand seal section is included in Table 6.
TABLE VI. PROFILE OF SAND SEAL ON ARMOURED SAND BASE
Layer Thickness Moisture
Content Colour Consistency Structure
Soil
Texture Origin
Surfacing Sand Seal
Base
50 mm Armouring with Calcrete Aggregates
100 mm Dry Red Medium
dense Granular
Medium
sand
Sandy soil of mixed
origin
Sub-base 150 mm Dry Red Medium
dense Granular
Medium
sand
Sandy soil of mixed
origin
Road bed Infinite Medium
wet Gray
Medium
dense Granular
Medium
sand
Sandy soil of mixed
origin
Visual assessment
8
Based on the visual condition survey, the VCI was
calculated and the results are shown in Table 7.
TABLE VII. VCI SUMMARY RESULTS IN SAND SEAL ON ARMOURED SAND BASE
Item Season VCI VCI (Variation)
1 October, 2017 92.0 0.6
2 March, 2018 91.4
The VCI results on this section are 85% - 100% range,
which means the road is in the very good condition according
to this category description.
The variation of the road condition does not vary
significantly between the wet and dry seasons. However, there
is a slight reduction in the VCI value due to the appearance of
potholes, which were not repaired and have increased in size.
There are some isolated cracks (crocodile and
longitudinal), settlement and potholes, all generally in slight
degree. Most of these defects are in panel C, including edge
breaks.
Roughness
The results of IRI roughness done on each 250m long
section in the outer wheel path in each lane are presented in
Table 8.
TABLE VIII. IRI SUMMARY RESULTS IN SAND SEAL ON
ARMOURED SAND BASE
Item Season IRI (mm/km) VARIATION
1 October, 2017 6.5 -1.3
2 March, 2018 5.2
The sand seal on the armoured base is smoother than the
penetration macadam section but the IRI values are still high
for a sealed road.
The negative variation after the rainy season is probably
due to the accuracy of MERLIN (Machine to evaluate
roughness using low cost instrumentation), as it does not allow
the test to be carried out exactly in the same way.
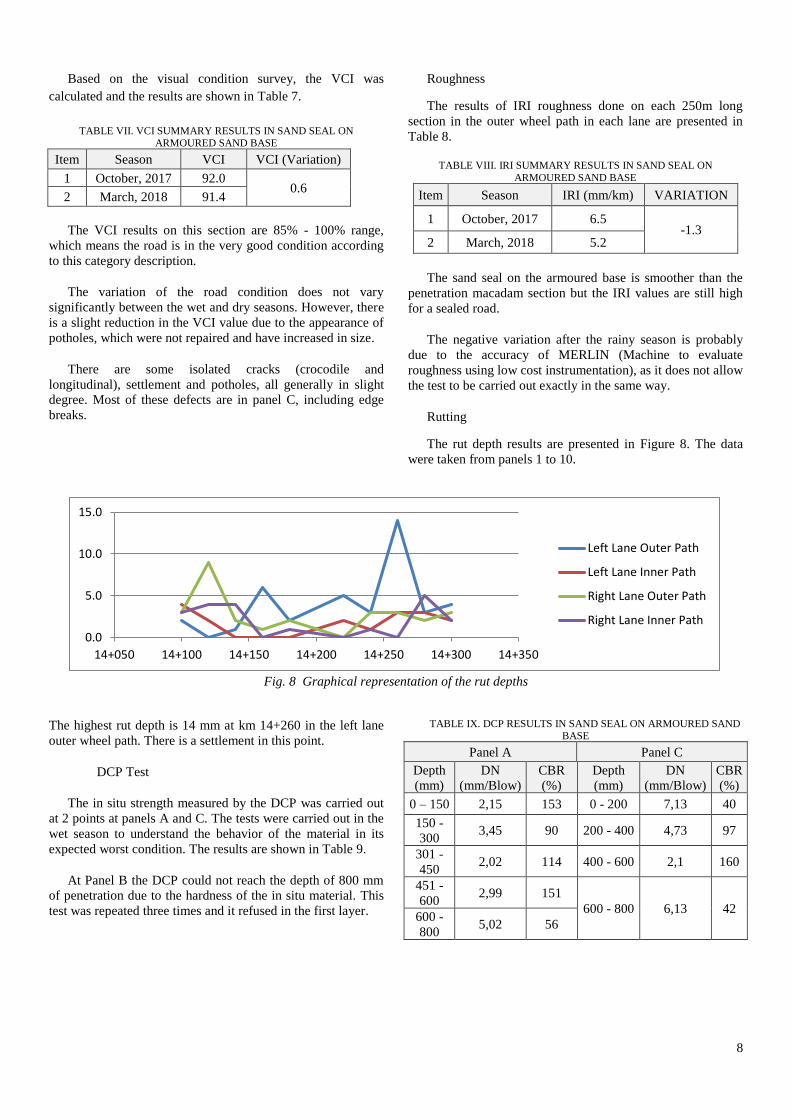
Rutting
The rut depth results are presented in Figure 8. The data
were taken from panels 1 to 10.
Fig. 8 Graphical representation of the rut depths
The highest rut depth is 14 mm at km 14+260 in the left lane
outer wheel path. There is a settlement in this point.
DCP Test
The in situ strength measured by the DCP was carried out
at 2 points at panels A and C. The tests were carried out in the
wet season to understand the behavior of the material in its
expected worst condition. The results are shown in Table 9.
At Panel B the DCP could not reach the depth of 800 mm
of penetration due to the hardness of the in situ material. This
test was repeated three times and it refused in the first layer.
TABLE IX. DCP RESULTS IN SAND SEAL ON ARMOURED SAND BASE
Panel A Panel C
Depth
(mm)
DN
(mm/Blow)
CBR
(%)
Depth
(mm)
DN
(mm/Blow)
CBR
(%)
0 – 150 2,15 153 0 - 200 7,13 40
150 -
300 3,45 90 200 - 400 4,73 97
301 -
450 2,02 114 400 - 600 2,1 160
451 -
600 2,99 151
600 - 800 6,13 42 600 -
800 5,02 56
0.0
5.0
10.0
15.0
14+050 14+100 14+150 14+200 14+250 14+300 14+350
Left Lane Outer Path
Left Lane Inner Path
Right Lane Outer Path
Right Lane Inner Path
9
The depths in panel C are different because in the test pit
was found pavement profile with 200 mm layers.
The DCP results were analyzed using the AfCAP DCP
computer program. According to the analysis, the pavement in
each panel is categorized as follows:
− Panel A – Category V – Averagely Balanced Deep
Structure (ABD);
− Panel C – Category IX – Poorly Balanced Inverted
Structure (PBI).
The DCP results indicates that in panel C the pavement has an
inverted structure, which means that the compaction of the
base layer was probably deficient.
There is a large difference in strength of the base course
between the two panels, probably indicative of impeded
drainage in the area of Panel C. In this panel, there are some
edge breaks, longitudinal and transverse cracks.
Classification of material
The classification of the material was done according to
the TRH 14.
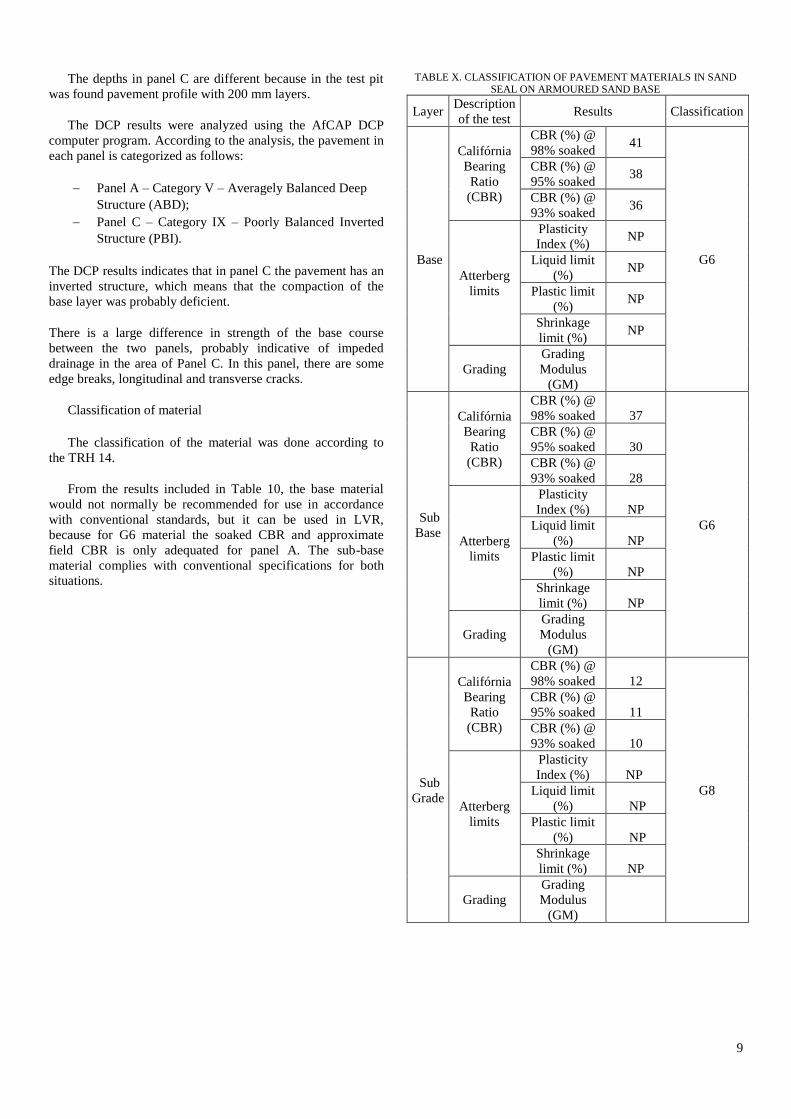
From the results included in Table 10, the base material
would not normally be recommended for use in accordance
with conventional standards, but it can be used in LVR,
because for G6 material the soaked CBR and approximate
field CBR is only adequated for panel A. The sub-base
material complies with conventional specifications for both
situations.
TABLE X. CLASSIFICATION OF PAVEMENT MATERIALS IN SAND SEAL ON ARMOURED SAND BASE
Layer Description
of the test Results Classification
Base
Califórnia
Bearing
Ratio
(CBR)
CBR (%) @
98% soaked 41
G6
CBR (%) @
95% soaked 38
CBR (%) @
93% soaked 36
Atterberg
limits
Plasticity
Index (%) NP
Liquid limit
(%) NP
Plastic limit
(%) NP
Shrinkage
limit (%) NP
Grading
Grading
Modulus
(GM)
Sub
Base
Califórnia
Bearing
Ratio
(CBR)
CBR (%) @
98% soaked 37
G6
CBR (%) @
95% soaked 30
CBR (%) @
93% soaked 28
Atterberg
limits
Plasticity
Index (%) NP
Liquid limit
(%) NP
Plastic limit
(%) NP
Shrinkage
limit (%) NP
Grading
Grading
Modulus
(GM)
Sub
Grade
Califórnia
Bearing
Ratio
(CBR)
CBR (%) @
98% soaked 12
G8
CBR (%) @
95% soaked 11
CBR (%) @
93% soaked 10
Atterberg
limits
Plasticity
Index (%) NP
Liquid limit
(%) NP
Plastic limit
(%) NP
Shrinkage
limit (%) NP
Grading
Grading
Modulus
(GM)
10
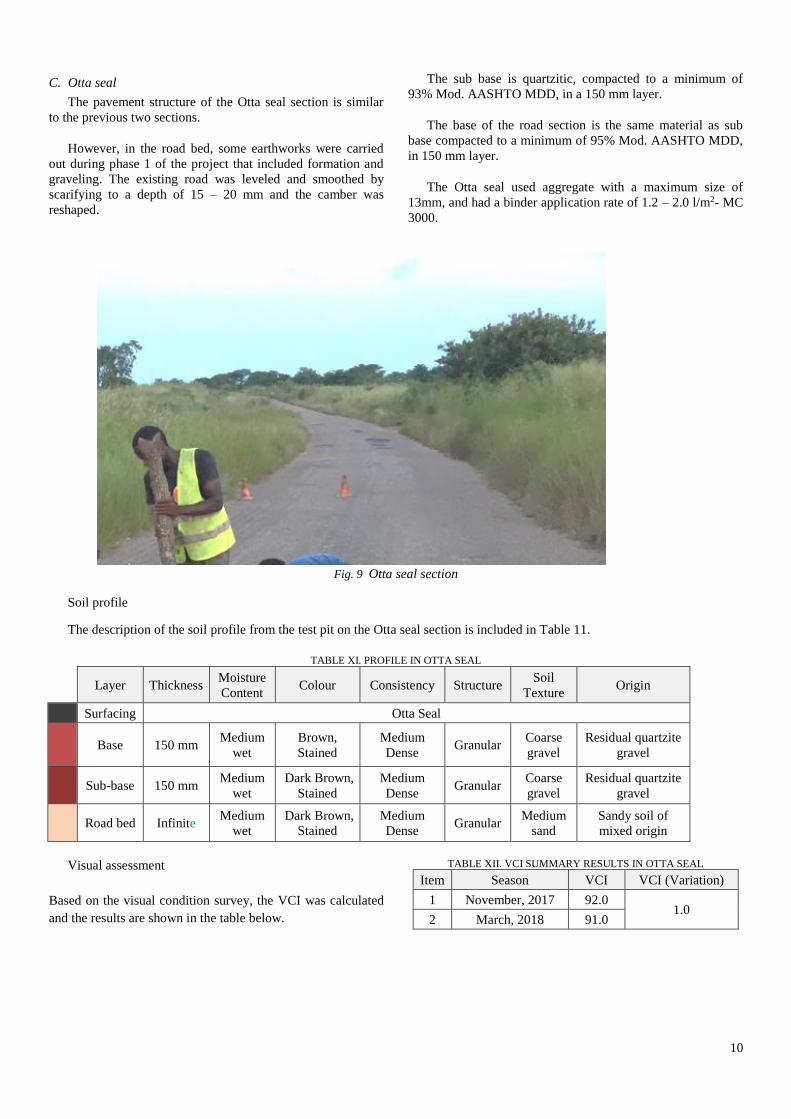
C. Otta seal
The pavement structure of the Otta seal section is similar
to the previous two sections.
However, in the road bed, some earthworks were carried
out during phase 1 of the project that included formation and
graveling. The existing road was leveled and smoothed by
scarifying to a depth of 15 – 20 mm and the camber was
reshaped.
The sub base is quartzitic, compacted to a minimum of
93% Mod. AASHTO MDD, in a 150 mm layer.
The base of the road section is the same material as sub
base compacted to a minimum of 95% Mod. AASHTO MDD,
in 150 mm layer.
The Otta seal used aggregate with a maximum size of
13mm, and had a binder application rate of 1.2 – 2.0 l/m2- MC
3000.
Fig. 9 Otta seal section
Soil profile
The description of the soil profile from the test pit on the Otta seal section is included in Table 11.
TABLE XI. PROFILE IN OTTA SEAL
Layer Thickness Moisture
Content Colour Consistency Structure
Soil
Texture Origin
Surfacing Otta Seal
Base 150 mm Medium
wet
Brown,
Stained
Medium
Dense Granular
Coarse
gravel
Residual quartzite
gravel
Sub-base 150 mm Medium
wet
Dark Brown,
Stained
Medium
Dense Granular
Coarse
gravel
Residual quartzite
gravel
Road bed Infinite Medium
wet
Dark Brown,
Stained
Medium
Dense Granular
Medium
sand
Sandy soil of
mixed origin
Visual assessment
Based on the visual condition survey, the VCI was calculated
and the results are shown in the table below.
TABLE XII. VCI SUMMARY RESULTS IN OTTA SEAL
Item Season VCI VCI (Variation)
1 November, 2017 92.0 1.0
2 March, 2018 91.0
11
The VCI results on this section are 85% - 100% range,
which means the road is in the very good condition according
to this category description.
The road condition does not vary significantly between the
wet and dry seasons. However, there is a reduction in the VCI
value due to the appearance of isolated potholes in slight
degree, which were not repaired and have increased in size.
The road has some isolated longitudinal cracks in slight
degree.
Roughness
The results of IRI roughness measured on each 250m long
section in the outer wheel path in each lane are presented in a
table below.
TABLE XIII. IRI SUMMARY RESULTS IN OTTA SEAL
Item Season IRI VARIATION
1 November, 2017 4,1
-0,6 2 March, 2018 3,5
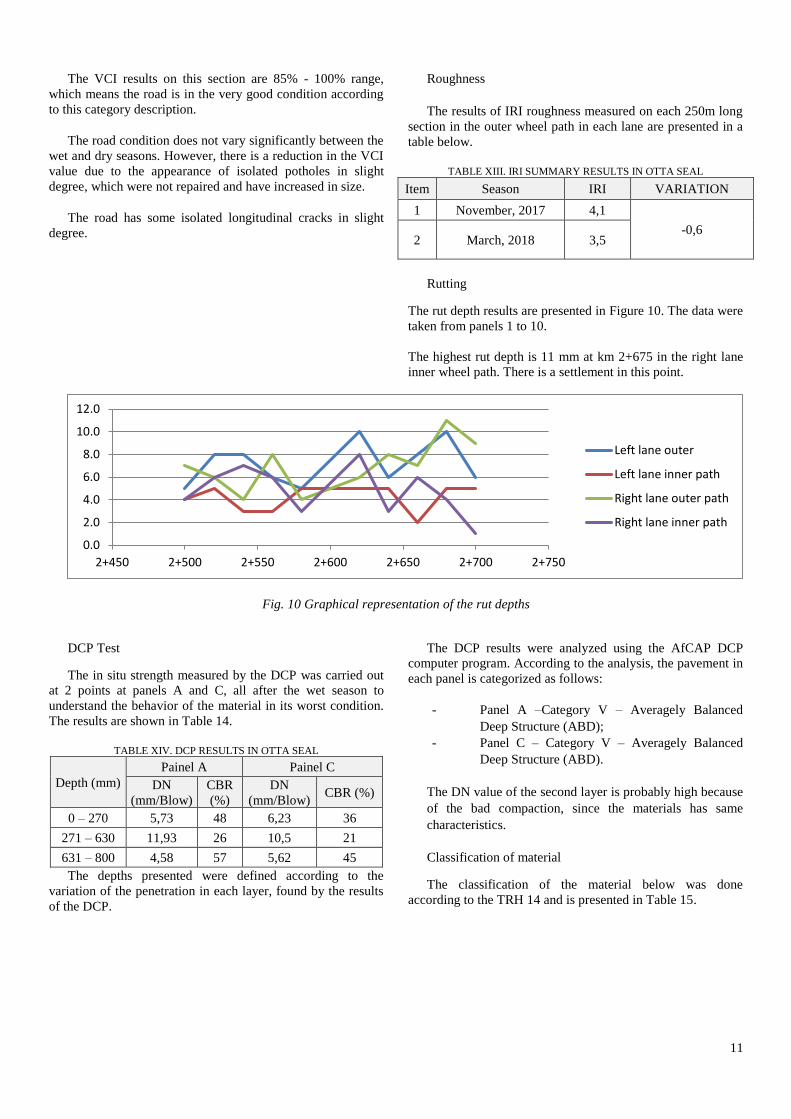
Rutting
The rut depth results are presented in Figure 10. The data were
taken from panels 1 to 10.
The highest rut depth is 11 mm at km 2+675 in the right lane
inner wheel path. There is a settlement in this point.
Fig. 10 Graphical representation of the rut depths
DCP Test
The in situ strength measured by the DCP was carried out
at 2 points at panels A and C, all after the wet season to
understand the behavior of the material in its worst condition.
The results are shown in Table 14.
TABLE XIV. DCP RESULTS IN OTTA SEAL
Depth (mm)
Painel A Painel C
DN
(mm/Blow)
CBR
(%)
DN
(mm/Blow) CBR (%)
0 – 270 5,73 48 6,23 36
271 – 630 11,93 26 10,5 21
631 – 800 4,58 57 5,62 45
The depths presented were defined according to the
variation of the penetration in each layer, found by the results
of the DCP.
The DCP results were analyzed using the AfCAP DCP
computer program. According to the analysis, the pavement in
each panel is categorized as follows:
- Panel A –Category V – Averagely Balanced
Deep Structure (ABD);
- Panel C – Category V – Averagely Balanced
Deep Structure (ABD).
The DN value of the second layer is probably high because
of the bad compaction, since the materials has same
characteristics.
Classification of material
The classification of the material below was done
according to the TRH 14 and is presented in Table 15.
0.0
2.0
4.0
6.0
8.0
10.0
12.0
2+450 2+500 2+550 2+600 2+650 2+700 2+750
Left lane outer
Left lane inner path
Right lane outer path
Right lane inner path
12
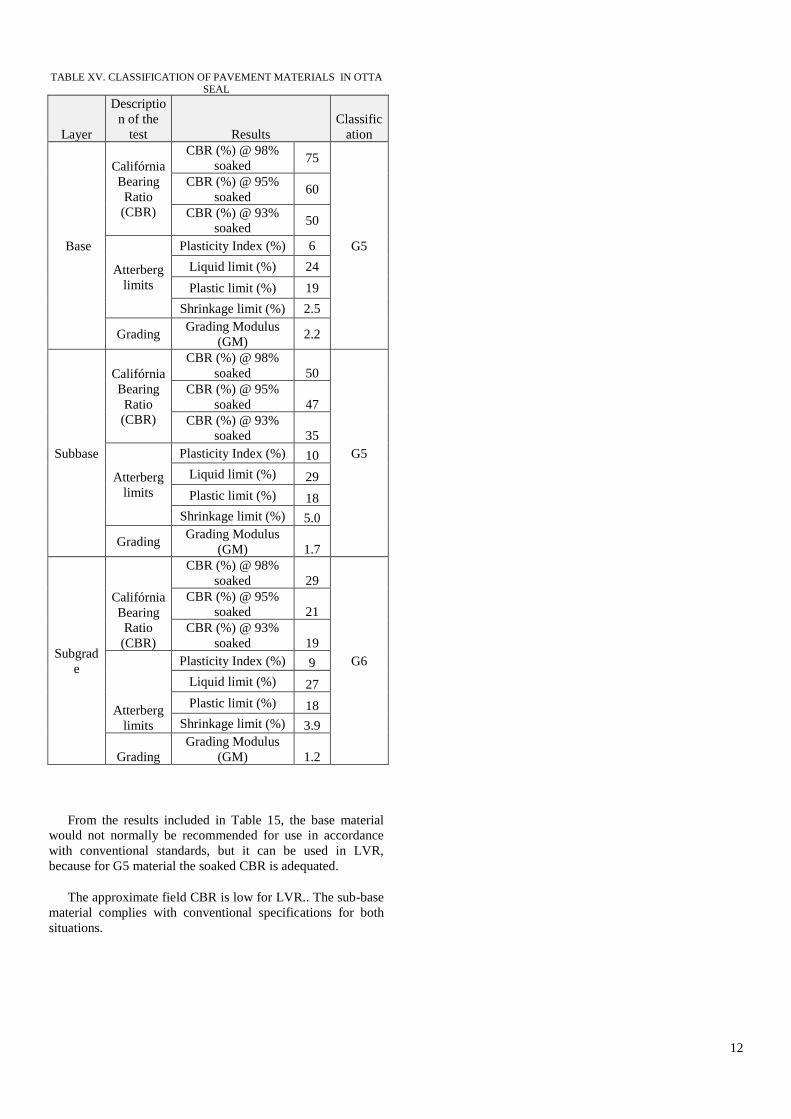
TABLE XV. CLASSIFICATION OF PAVEMENT MATERIALS IN OTTA SEAL
Layer
Descriptio
n of the
test Results
Classific
ation
Base
Califórnia
Bearing
Ratio
(CBR)
CBR (%) @ 98%
soaked 75
G5
CBR (%) @ 95%
soaked 60
CBR (%) @ 93%
soaked 50
Atterberg
limits
Plasticity Index (%) 6
Liquid limit (%) 24
Plastic limit (%) 19
Shrinkage limit (%) 2.5
Grading Grading Modulus
(GM) 2.2
Subbase
Califórnia
Bearing
Ratio
(CBR)
CBR (%) @ 98%
soaked 50
G5
CBR (%) @ 95%
soaked 47
CBR (%) @ 93%
soaked 35
Atterberg
limits
Plasticity Index (%) 10
Liquid limit (%) 29
Plastic limit (%) 18
Shrinkage limit (%) 5.0
Grading Grading Modulus
(GM) 1.7
Subgrad
e
Califórnia
Bearing
Ratio
(CBR)
CBR (%) @ 98%
soaked 29
G6
CBR (%) @ 95%
soaked 21
CBR (%) @ 93%
soaked 19
Atterberg
limits
Plasticity Index (%) 9
Liquid limit (%) 27
Plastic limit (%) 18
Shrinkage limit (%) 3.9
Grading
Grading Modulus
(GM) 1.2
From the results included in Table 15, the base material
would not normally be recommended for use in accordance
with conventional standards, but it can be used in LVR,
because for G5 material the soaked CBR is adequated.
The approximate field CBR is low for LVR.. The sub-base
material complies with conventional specifications for both
situations.

13
D. Gravel Road
The Gravel section is composed of three layers: road bed,
base and wearing course.
In the road bed the existing track consisted of very loose
sand, and this had to be removed to a firm foundation.
The sub base is local red sand, compacted to a minimum of
95% Mod. AASHTO MDD in 150 mm layer.
The base of the road section is a red sand blended 1:1 with
calcrete in a 150 mm layer compacted to a minimum of 95%
Mod. AASHTO MDD. This layer is same as wearing course.
Fig. 11 Gravel Section
Soil profile
The description of the soil profile from the test pit on the
gravel road sections is included in Table 16. TABLE XVI. PROFILE IN GRAVEL ROAD
Layer Thickness Moisture
Content Colour Consistency Structure Soil Texture Origin
Wearing
course 150 mm Dry
Light gray,
Blotched Dense Compacted
Coarse
gravelly sand
Calcrete and
sand of mixed
origin
Sub-base 150 mm Medium
wet Red, Speckled Medium dense Pinholed
Medium
sand
Sandy soil of
mixed origin
Road bed Infinite Medium
wet
Very dark brown,
Stained Medium dense Pinholed
Medium
sand
Sandy soil of
mixed origin
Visual assessment
Based on the visual condition survey, the VCI was calculated
and the results are shown in Table 17.
TABLE XVII. VCI SUMMARY RESULTS IN GRAVEL ROAD
GRAVEL SECTION
Season VCI VCI (Variation)
October, 2017 83 -21
March, 2018 62
14
According to the VCI values the condition of the road
during the rainy season is fair, and in the dry season it is good.
Roughness
Because of the varying surface condition of the unpaved
road and the effect of individual storms, traffic and
maintenance, the one-off roughness at any specific time is
essentially meaningless and was therefore not taken.
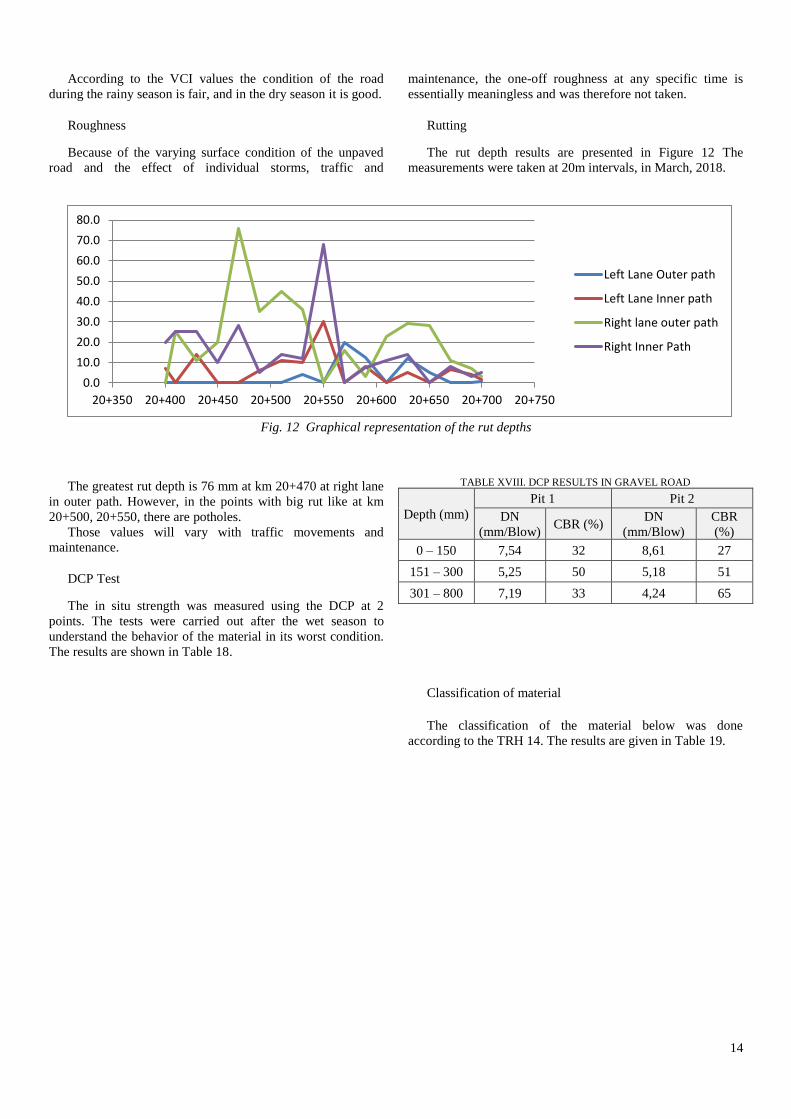
Rutting
The rut depth results are presented in Figure 12 The
measurements were taken at 20m intervals, in March, 2018.
Fig. 12 Graphical representation of the rut depths
The greatest rut depth is 76 mm at km 20+470 at right lane
in outer path. However, in the points with big rut like at km
20+500, 20+550, there are potholes.
Those values will vary with traffic movements and
maintenance.
DCP Test
The in situ strength was measured using the DCP at 2
points. The tests were carried out after the wet season to
understand the behavior of the material in its worst condition.
The results are shown in Table 18.
TABLE XVIII. DCP RESULTS IN GRAVEL ROAD
Depth (mm)
Pit 1 Pit 2
DN
(mm/Blow) CBR (%)
DN
(mm/Blow)
CBR
(%)
0 – 150 7,54 32 8,61 27
151 – 300 5,25 50 5,18 51
301 – 800 7,19 33 4,24 65
Classification of material
The classification of the material below was done
according to the TRH 14. The results are given in Table 19.
0.0
10.0
20.0
30.0
40.0
50.0
60.0
70.0
80.0
20+350 20+400 20+450 20+500 20+550 20+600 20+650 20+700 20+750
Left Lane Outer path
Left Lane Inner path
Right lane outer path
Right Inner Path
15
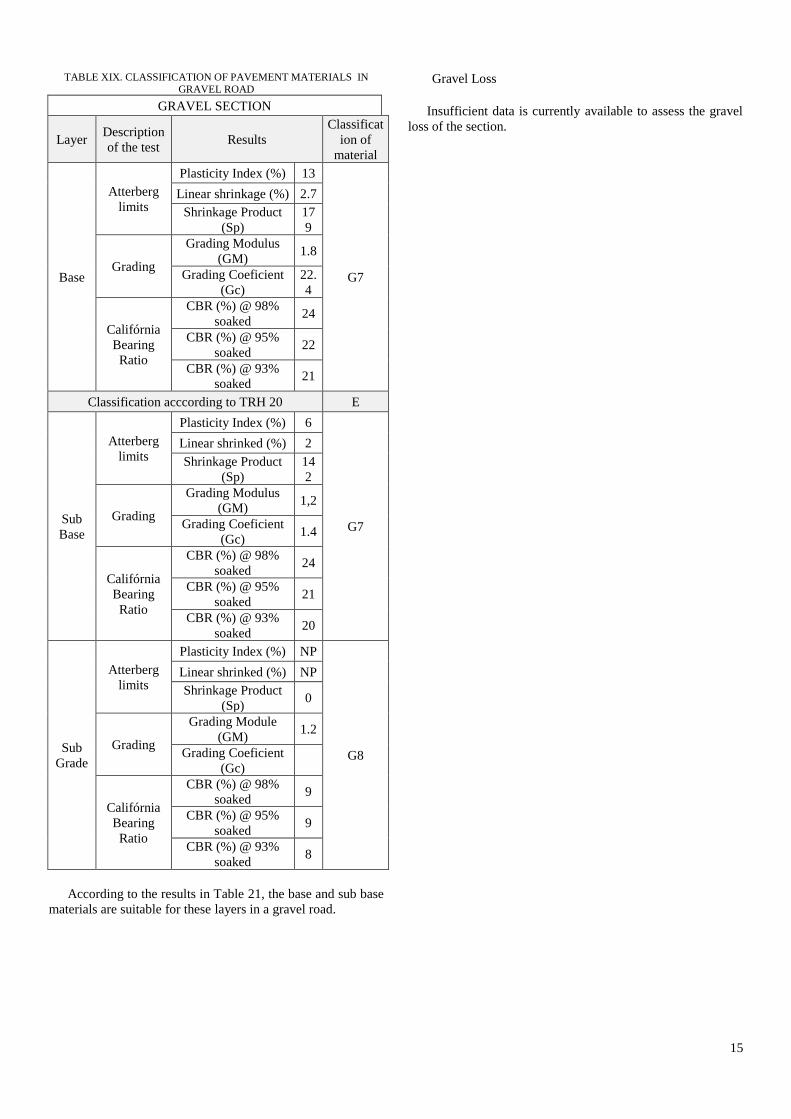
TABLE XIX. CLASSIFICATION OF PAVEMENT MATERIALS IN GRAVEL ROAD
GRAVEL SECTION
Layer Description
of the test Results
Classificat
ion of
material
Base
Atterberg
limits
Plasticity Index (%) 13
G7
Linear shrinkage (%) 2.7
Shrinkage Product
(Sp)
17
9
Grading
Grading Modulus
(GM) 1.8
Grading Coeficient
(Gc)
22.
4
Califórnia
Bearing
Ratio
CBR (%) @ 98%
soaked 24
CBR (%) @ 95%
soaked 22
CBR (%) @ 93%
soaked 21
Classification acccording to TRH 20 E
Sub
Base
Atterberg
limits
Plasticity Index (%) 6
G7
Linear shrinked (%) 2
Shrinkage Product
(Sp)
14
2
Grading
Grading Modulus
(GM) 1,2
Grading Coeficient
(Gc) 1.4
Califórnia
Bearing
Ratio
CBR (%) @ 98%
soaked 24
CBR (%) @ 95%
soaked 21
CBR (%) @ 93%
soaked 20
Sub
Grade
Atterberg
limits
Plasticity Index (%) NP
G8
Linear shrinked (%) NP
Shrinkage Product
(Sp) 0
Grading
Grading Module
(GM) 1.2
Grading Coeficient
(Gc)
Califórnia
Bearing
Ratio
CBR (%) @ 98%
soaked 9
CBR (%) @ 95%
soaked 9
CBR (%) @ 93%
soaked 8
According to the results in Table 21, the base and sub base
materials are suitable for these layers in a gravel road.
Gravel Loss
Insufficient data is currently available to assess the gravel
loss of the section.
16
IV. COST ANALYSES
For the analysis of costs, the following aspects were
considered:
• The cost of construction of the experimental sections;
• The approximate maintenance costs for the road
sections under consideration (it was not possible to
obtain accurate maintenance costs);
• The analysis was done in US dollars, at the prevailing
exchange rates, in order to minimize the effect of
local currency oscillations;
• The analysis is based on total costs for a 1 km section
of road, with a width of 6 meters.
• Drainage works were not considered.
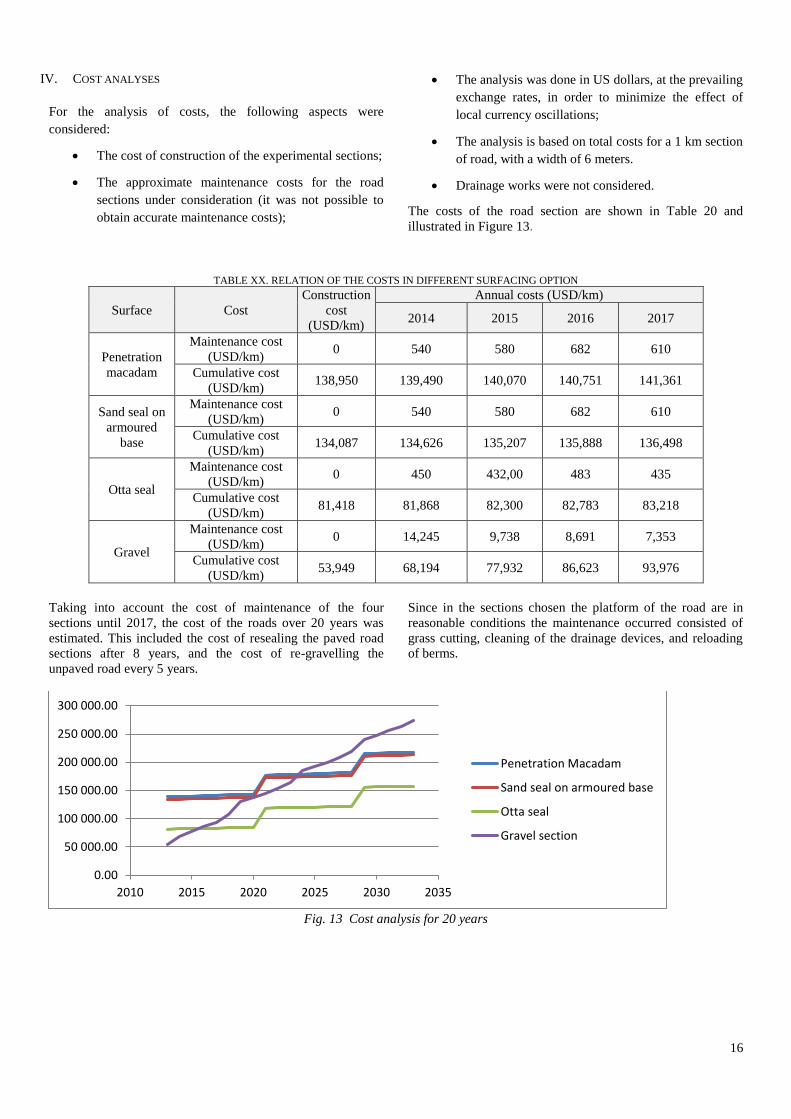
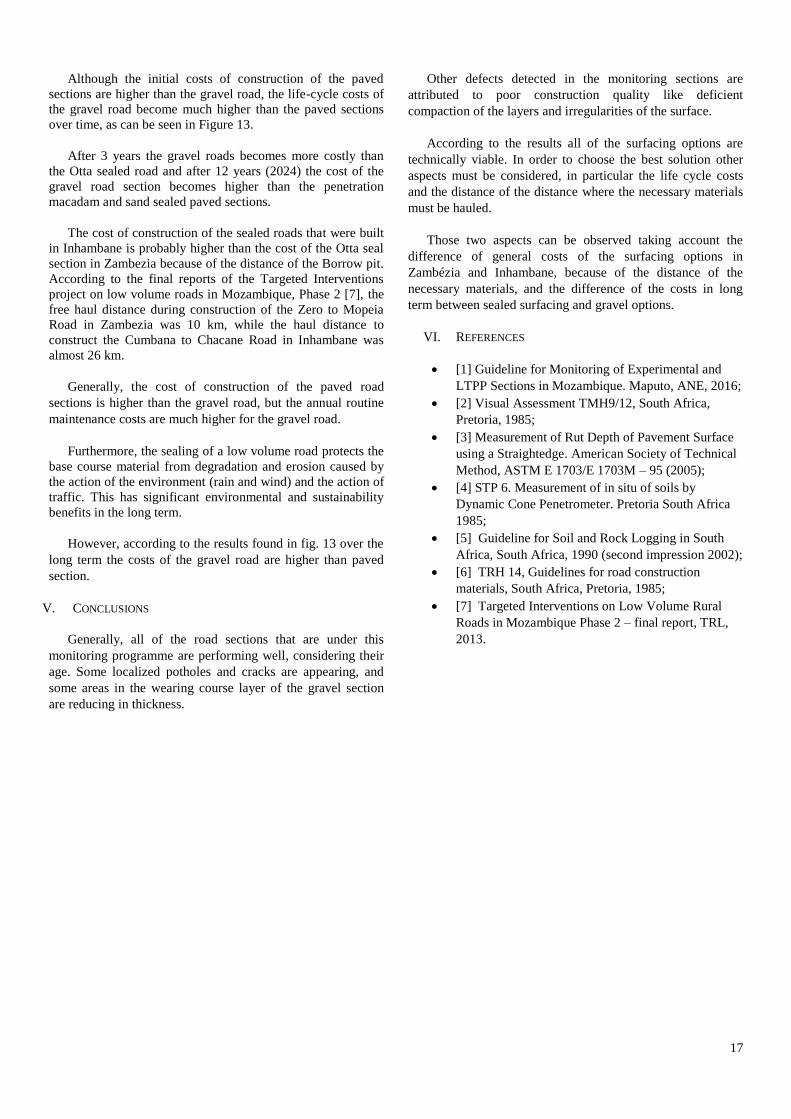
The costs of the road section are shown in Table 20 and
illustrated in Figure 13.
TABLE XX. RELATION OF THE COSTS IN DIFFERENT SURFACING OPTION
Surface Cost
Construction
cost
(USD/km)
Annual costs (USD/km)
2014 2015 2016 2017
Penetration
macadam
Maintenance cost
(USD/km) 0 540 580 682 610
Cumulative cost
(USD/km) 138,950 139,490 140,070 140,751 141,361
Sand seal on
armoured
base
Maintenance cost
(USD/km) 0 540 580 682 610
Cumulative cost
(USD/km) 134,087 134,626 135,207 135,888 136,498
Otta seal
Maintenance cost
(USD/km) 0 450 432,00 483 435
Cumulative cost
(USD/km) 81,418 81,868 82,300 82,783 83,218
Gravel
Maintenance cost
(USD/km) 0 14,245 9,738 8,691 7,353
Cumulative cost
(USD/km) 53,949 68,194 77,932 86,623 93,976
Taking into account the cost of maintenance of the four
sections until 2017, the cost of the roads over 20 years was
estimated. This included the cost of resealing the paved road
sections after 8 years, and the cost of re-gravelling the
unpaved road every 5 years.
Since in the sections chosen the platform of the road are in
reasonable conditions the maintenance occurred consisted of
grass cutting, cleaning of the drainage devices, and reloading
of berms.
Fig. 13 Cost analysis for 20 years
0.00
50 000.00
100 000.00
150 000.00
200 000.00
250 000.00
300 000.00
2010 2015 2020 2025 2030 2035
Penetration Macadam
Sand seal on armoured base
Otta seal
Gravel section
17
Although the initial costs of construction of the paved
sections are higher than the gravel road, the life-cycle costs of
the gravel road become much higher than the paved sections
over time, as can be seen in Figure 13.
After 3 years the gravel roads becomes more costly than
the Otta sealed road and after 12 years (2024) the cost of the
gravel road section becomes higher than the penetration
macadam and sand sealed paved sections.
The cost of construction of the sealed roads that were built
in Inhambane is probably higher than the cost of the Otta seal
section in Zambezia because of the distance of the Borrow pit.
According to the final reports of the Targeted Interventions
project on low volume roads in Mozambique, Phase 2 [7], the
free haul distance during construction of the Zero to Mopeia
Road in Zambezia was 10 km, while the haul distance to
construct the Cumbana to Chacane Road in Inhambane was
almost 26 km.
Generally, the cost of construction of the paved road
sections is higher than the gravel road, but the annual routine
maintenance costs are much higher for the gravel road.
Furthermore, the sealing of a low volume road protects the
base course material from degradation and erosion caused by
the action of the environment (rain and wind) and the action of
traffic. This has significant environmental and sustainability
benefits in the long term.
However, according to the results found in fig. 13 over the
long term the costs of the gravel road are higher than paved
section.
V. CONCLUSIONS
Generally, all of the road sections that are under this
monitoring programme are performing well, considering their
age. Some localized potholes and cracks are appearing, and
some areas in the wearing course layer of the gravel section
are reducing in thickness.
Other defects detected in the monitoring sections are
attributed to poor construction quality like deficient
compaction of the layers and irregularities of the surface.
According to the results all of the surfacing options are
technically viable. In order to choose the best solution other
aspects must be considered, in particular the life cycle costs
and the distance of the distance where the necessary materials
must be hauled.
Those two aspects can be observed taking account the
difference of general costs of the surfacing options in
Zambézia and Inhambane, because of the distance of the
necessary materials, and the difference of the costs in long
term between sealed surfacing and gravel options.
VI. REFERENCES
• [1] Guideline for Monitoring of Experimental and
LTPP Sections in Mozambique. Maputo, ANE, 2016;
• [2] Visual Assessment TMH9/12, South Africa,
Pretoria, 1985;
• [3] Measurement of Rut Depth of Pavement Surface
using a Straightedge. American Society of Technical
Method, ASTM E 1703/E 1703M – 95 (2005);
• [4] STP 6. Measurement of in situ of soils by
Dynamic Cone Penetrometer. Pretoria South Africa
1985;
• [5] Guideline for Soil and Rock Logging in South
Africa, South Africa, 1990 (second impression 2002);
• [6] TRH 14, Guidelines for road construction
materials, South Africa, Pretoria, 1985;
• [7] Targeted Interventions on Low Volume Rural
Roads in Mozambique Phase 2 – final report, TRL,
2013.