author's personal copy - ferdowsi university of...
TRANSCRIPT

This article appeared in a journal published by Elsevier. The attachedcopy is furnished to the author for internal non-commercial researchand education use, including for instruction at the authors institution
and sharing with colleagues.
Other uses, including reproduction and distribution, or selling orlicensing copies, or posting to personal, institutional or third party
websites are prohibited.
In most cases authors are permitted to post their version of thearticle (e.g. in Word or Tex form) to their personal website orinstitutional repository. Authors requiring further information
regarding Elsevier’s archiving and manuscript policies areencouraged to visit:
http://www.elsevier.com/copyright

Author's personal copy
Application of eddy current nondestructive method for determinationof surface carbon content in carburized steels
Meisam Sheikh Amiri �, Mehrdad Kashefi
Department of Materials Science and Metallurgical Engineering, Engineering Faculty, Ferdowsi University of Mashhad, Mashhad, Iran
a r t i c l e i n f o
Article history:
Received 9 February 2009
Received in revised form
15 April 2009
Accepted 26 April 2009Available online 10 May 2009
Keywords:
Carburization
Eddy current
Surface carbon content
a b s t r a c t
Apart from traditional application of nondestructive eddy current technique for detection of
discontinuities, the method has been recently used to determine physical and metallurgical properties
of steel parts. In the present research the application of eddy current method for determination of
surface carbon of steel parts in gas carburizing process has been studied. The relation between the
surface carbon content and various parameters such as impedance, phase angle and voltage has been
established. Besides the effect of carbon content of the impedance plain has been investigated. The
study shows that the best relation (R2¼ 0.91) can be achieved using phase angle.
& 2009 Elsevier Ltd. All rights reserved.
1. Introduction
In the recent years, a number of researches have beenconducted using EC method. These researches have been mainlyfocused on two major fields: detection of defects and prediction ofphysical and metallurgical properties of materials.
Restivo [1] and Hagemair [2] have published a paper on thegeneral aspects of eddy current and its application for defectsdetection. In an extensive research, Kogon et al. [3] have inspectedthe effect of the carbon content on the magnetic and electricalproperties of thermally treated carbon steels. Recently, Konoplyket al. [4] have demonstrated a good relationship betweenhardness of ductile cast iron and the induced voltage using eddycurrent method. Cech [5] and Uchimoto et al. [6] in two separateresearches have examined this relation in gray cast iron as well aslift-off effect on the responses. Establishing a relation betweenharmonic analysis of induced current with the depth of decarbur-ization, Mercier et al. [7] concluded the EC method can be usedto detect decarburization depth during heat treatment of steels.More recently, the percent of pearlite in microstructure [8],precipitation hardening process [9] and estimating of wearresistance [10], have been studied using EC method.
With the growing demands for nondestructive measuring ofphysical and mechanical properties of materials in mass produc-tion lines, there is a strong potential for research on the newapplications for the nondestructive eddy current method.
Carburizing has long been used in industry to improve surfacehardness and fatigue resistance of steel parts while maintainingthe toughness of the core.
In modern carburizing processes, low-carbon steel is exposedto a carbon-enriched atmosphere at temperatures between875–925 1C for a proper time which increases the carbon contentof the surface while the core of the sample maintains its primarychemical composition [11]. The part, eventually, quench in amedium to insure phase transformation to martensite takesplace. Proper control of surface carbon content is a key factor inperforming a successful carburizing process and providingessential mechanical properties for the part.
2. Experimental procedure
A standard carburizing low-carbon low-alloy steel (AISI 4118)has been used in this study. The chemical composition of the steelis given in Table 1.
Sixteen rod specimens of 15 cm length and 2.2 cm diameterwere prepared for the carburizing process. The process wascarried on for 8 h in 900 1C for all samples in a gas carburizingfurnace (SIB 210). An endothermic atmosphere was producedusing natural gas. Controlled carbon potentials in the furnacewere different for each sample but maintained in the range of0.4–0.9 %C. As a result, samples with various surface carboncontents ranging from 0.4 to 0.9 %C were produced. This range isclose to the range been normally used in industrial gas heattreatments such as carburizing and normalizing in controlledatmosphere. To insure uniform microstructure, before testing, allthe samples were normalized using an induction heating furnace.
ARTICLE IN PRESS
Contents lists available at ScienceDirect
journal homepage: www.elsevier.com/locate/ndteint
NDT&E International
0963-8695/$ - see front matter & 2009 Elsevier Ltd. All rights reserved.
doi:10.1016/j.ndteint.2009.04.008
� Corresponding author. Tel.: +98 9153158253; fax: +98 5118763305.
E-mail address: [email protected] (M. Sheikh Amiri).
NDT&E International 42 (2009) 618–621
Author's personal copy
Speed, power and frequency for induction heating were fixed forall samples. The parameters are listed in Table 2.
Surface carbon contents of all samples were determinedusing quantometry method. The results for carbon content atthe surface of each sample are given in Table 3. Subsequentlysamples for metallographical examination were prepared fromeach specimen.
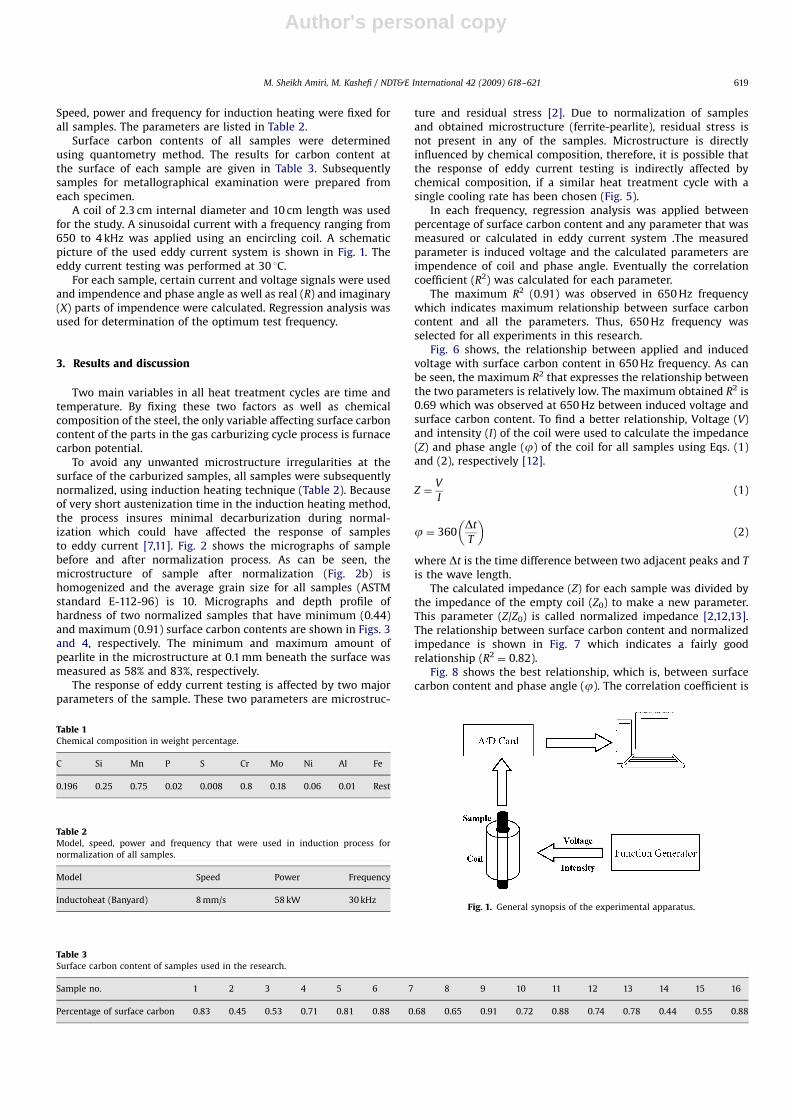
A coil of 2.3 cm internal diameter and 10 cm length was usedfor the study. A sinusoidal current with a frequency ranging from650 to 4 kHz was applied using an encircling coil. A schematicpicture of the used eddy current system is shown in Fig. 1. Theeddy current testing was performed at 30 1C.
For each sample, certain current and voltage signals were usedand impendence and phase angle as well as real (R) and imaginary(X) parts of impendence were calculated. Regression analysis wasused for determination of the optimum test frequency.
3. Results and discussion
Two main variables in all heat treatment cycles are time andtemperature. By fixing these two factors as well as chemicalcomposition of the steel, the only variable affecting surface carboncontent of the parts in the gas carburizing cycle process is furnacecarbon potential.
To avoid any unwanted microstructure irregularities at thesurface of the carburized samples, all samples were subsequentlynormalized, using induction heating technique (Table 2). Becauseof very short austenization time in the induction heating method,the process insures minimal decarburization during normal-ization which could have affected the response of samplesto eddy current [7,11]. Fig. 2 shows the micrographs of samplebefore and after normalization process. As can be seen, themicrostructure of sample after normalization (Fig. 2b) ishomogenized and the average grain size for all samples (ASTMstandard E-112-96) is 10. Micrographs and depth profile ofhardness of two normalized samples that have minimum (0.44)and maximum (0.91) surface carbon contents are shown in Figs. 3and 4, respectively. The minimum and maximum amount ofpearlite in the microstructure at 0.1 mm beneath the surface wasmeasured as 58% and 83%, respectively.
The response of eddy current testing is affected by two majorparameters of the sample. These two parameters are microstruc-
ture and residual stress [2]. Due to normalization of samplesand obtained microstructure (ferrite-pearlite), residual stress isnot present in any of the samples. Microstructure is directlyinfluenced by chemical composition, therefore, it is possible thatthe response of eddy current testing is indirectly affected bychemical composition, if a similar heat treatment cycle with asingle cooling rate has been chosen (Fig. 5).
In each frequency, regression analysis was applied betweenpercentage of surface carbon content and any parameter that wasmeasured or calculated in eddy current system .The measuredparameter is induced voltage and the calculated parameters areimpendence of coil and phase angle. Eventually the correlationcoefficient (R2) was calculated for each parameter.
The maximum R2 (0.91) was observed in 650 Hz frequencywhich indicates maximum relationship between surface carboncontent and all the parameters. Thus, 650 Hz frequency wasselected for all experiments in this research.
Fig. 6 shows, the relationship between applied and inducedvoltage with surface carbon content in 650 Hz frequency. As canbe seen, the maximum R2 that expresses the relationship betweenthe two parameters is relatively low. The maximum obtained R2 is0.69 which was observed at 650 Hz between induced voltage andsurface carbon content. To find a better relationship, Voltage (V)and intensity (I) of the coil were used to calculate the impedance(Z) and phase angle (j) of the coil for all samples using Eqs. (1)and (2), respectively [12].
Z ¼V
I(1)
j ¼ 360Dt
T
� �(2)
where Dt is the time difference between two adjacent peaks and T
is the wave length.The calculated impedance (Z) for each sample was divided by
the impedance of the empty coil (Z0) to make a new parameter.This parameter (Z/Z0) is called normalized impedance [2,12,13].The relationship between surface carbon content and normalizedimpedance is shown in Fig. 7 which indicates a fairly goodrelationship (R2
¼ 0.82).Fig. 8 shows the best relationship, which is, between surface
carbon content and phase angle (j). The correlation coefficient is
ARTICLE IN PRESS
Table 1Chemical composition in weight percentage.
C Si Mn P S Cr Mo Ni Al Fe
0.196 0.25 0.75 0.02 0.008 0.8 0.18 0.06 0.01 Rest
Table 2Model, speed, power and frequency that were used in induction process for
normalization of all samples.
Model Speed Power Frequency
Inductoheat (Banyard) 8 mm/s 58 kW 30 kHz
Table 3Surface carbon content of samples used in the research.
Sample no. 1 2 3 4 5 6 7 8 9 10 11 12 13 14 15 16
Percentage of surface carbon 0.83 0.45 0.53 0.71 0.81 0.88 0.68 0.65 0.91 0.72 0.88 0.74 0.78 0.44 0.55 0.88
Fig. 1. General synopsis of the experimental apparatus.
M. Sheikh Amiri, M. Kashefi / NDT&E International 42 (2009) 618–621 619

Author's personal copy
0.91 at 650 Hz frequency. As can be seen, in Figs. 3–5 Z, j and V
decrease with increase in surface carbon content. This could bedue to the increase in pearlite percentage with increasing carboncontent. Increasing in percentage of pearlite, in turn, results inincreasing the resistance (R) and decreasing in the permeability(m) [3]. Having the relation between l and X in mind, thereduction of X with m can be established. In ferromagnetic alloyssuch as steel, the effect of permeability or reactance is strongerthan the effect of resistance [3,12,13], as a result, the impedance
decreases with increasing the percentage of carbon. It is knownthat V has a direct relation with Z, therefore, V also decreases.
To have a better understanding of carbon content effect on ECresponse, especially phase angle (j), of the steel, the impedanceplane (normalized X vs. normalized R) can be drawn for allsamples.
To calculate the normalized X and R, at first, resistance (R) andreactance (X) of the coil (real and imaginary parts of Z,respectively) were calculated for each sample
~Z ¼ ~Rþ i~X ðjRj ¼ jZj cosðjÞ jXj ¼ jZj sinðjÞÞ (3)
Eventually, Eqs (4) and (5) were used to calculate the normal-ized X and the normalized R, respectively [2,12,13].
Normalized R ¼ ðR� R0Þ=X0 (4)
Normalized X ¼ X=X0 (5)
ARTICLE IN PRESS
Fig. 2. Micrographs of surface of samples (a) before and (b) after normalization.
Fig. 3. Micrographs of surface of samples with (a) minimum and (b) maximum percentages of carbon.
Fig. 4. Depth profile of hardness of samples with (a) minimum (b) maximum
percentages of carbon.
Fig. 5. Schematic diagram of effect of chemical composition and microstructure on
response of eddy current testing.
M. Sheikh Amiri, M. Kashefi / NDT&E International 42 (2009) 618–621620

Author's personal copy
The result of the calculation is presented in Fig. 9. Fig. 9demonstrates the effect of surface carbon content on the locationof impedance point which in turn can be used to calculate j aswell. Fig. 9, again, shows that the amount of j decreases withincreasing carbon content of the samples.
Finally, to improve the accuracy of the results and make thepresented method more applicable to industrial applications, oneshould bear in mind that fine adjustment of the readings couldbe made regarding the general factors affecting accuracy of ECresponds of the materials. The most important parameters
affecting EC responds are temperature of the samples, edge effectand fill factor [2,12,13].
4. Conclusion
In this study, eddy current method was used to determine thesurface carbon content in AISI 4118 steel in gas carburizingprocess. It was shown, any measured (Vx, Vy) or calculated (Z, j)parameter have good relationship with surface carbon content.For all samples, the measured and calculated parametersdecreased with increasing carbon content at the surface. The bestrelation between carbon content at the surface of the carburizedsamples and EC response of the samples (R2
¼ 0.91) can beestablished using phase angle.
References
[1] Restivo MT. A case study of induced eddy currents. Sensors and Actuators A:Physical 1996;51:203.
[2] Hagemair Donald J. Fundamentals of eddy current testing. American Societyfor Nondestructive Testing; 1990.
[3] Kogan LKh, Nichipuruk AP, Gavrilova LD. Effect of the carbon content on themagnetic and electric properties of thermally treated carbon steels and thepossibilities of testing the quality of tempering of articles produced fromthem via the eddy-current method. Russian Journal of Nondestructive Testing2006;42(9):616–29.
[4] Konoplyuk S, Abe T, Uchimoto T, Takagi T, Kurosawa M. Characterization ofductile cast iron by eddy current method. NDT&E International 2005;38:623–6.
[5] Uchimoto T, Takagi T, Konoplyuk S, Abe T, Huang H, Kurosawa M. Eddy currentevaluation of cast irons for material characterization. Journal of Magnetismand Magnetic Materials 2003;258–259:493–6.
[6] Cech J. Measuring the mechanical properties of cast irons by NDT methods.NDT International 1990;23(2):93–102.
[7] Mercier D, Lesage J, Decoopman X, Chicot D. Eddy currents and hardnesstesting for evaluation of steel decarburizing. NDT&E International2006;39:652–60.
[8] Khan SH, Ali Farhad, Nusair Khan A, Iqbal MA. Pearlite determination in plaincarbon steel by eddy current method. Journal of Materials ProcessingTechnology 2008;200:316–8.
[9] Rajkumar KV, Rao BPC, Sasi B, Kumara Anish, Jayakumar T, Raj Baldev, et al.Characterization of aging behaviour in M250 grade maraging steel using eddycurrent nondestructive methodology. Materials Science and Engineering A2007;264:233–40.
[10] Gorkunov ES, Kharlamov VV, Kogan LKh, Zadvorkin SM. Evaluating the wearin steel–steel and iron–iron friction pairs by the eddy-current method.Russian Journal of Nondestructive Testing 2005;41(4):218–23.
[11] Davis Joseph R. Surface hardening of steels: understanding of basics. ASMInternational; 2002.
[12] Bray Don E, Stanley Roderic K. Nondestructive evaluation: a tool design,manufacturing and service. Boca Raton, FL: CRC Press; 1997.
[13] Shull Peter J. Nondestructive evaluation: theory, techniques and applications.New York: Marcel Dekker, Inc; 2002.
ARTICLE IN PRESS
Fig. 6. Relationship between surface percentage of carbon and applied (Vx) and
induced (Vy) voltages at 650 Hz.
Fig. 7. Relationship between normalized impedance and percentage of surface
carbon at 650 Hz.
Fig. 8. Relationship between phase angle and percentage of surface carbon at
650 Hz.
Fig. 9. Impedance plane and effect of carbon on location of impedance point.
M. Sheikh Amiri, M. Kashefi / NDT&E International 42 (2009) 618–621 621