author's personal copy - mygeologypagemygeologypage.ucdavis.edu/montanez/osteretal2009...
TRANSCRIPT

This article appeared in a journal published by Elsevier. The attachedcopy is furnished to the author for internal non-commercial researchand education use, including for instruction at the authors institution
and sharing with colleagues.
Other uses, including reproduction and distribution, or selling orlicensing copies, or posting to personal, institutional or third party
websites are prohibited.
In most cases authors are permitted to post their version of thearticle (e.g. in Word or Tex form) to their personal website orinstitutional repository. Authors requiring further information
regarding Elsevier’s archiving and manuscript policies areencouraged to visit:
http://www.elsevier.com/copyright

Author's personal copy
Late Pleistocene California droughts during deglaciation and Arctic warming
Jessica L. Oster a,⁎, Isabel P. Montañez a, Warren D. Sharp b, Kari M. Cooper a
a Geology Department, University of California, Davis, California, United Statesb Berkeley Geochronology Center, Berkeley, California, United States
a b s t r a c ta r t i c l e i n f o
Article history:Received 4 February 2009Received in revised form 4 August 2009Accepted 7 October 2009Available online 5 November 2009
Editor: P. DeMenocal
Keywords:speleothemSierra Nevada paleoclimatedeglacialstable and radiogenic isotopestrace elementsU-series
Recent studies document the synchronous nature of shifts in North Atlantic regional climate, the intensity ofthe East Asian monsoon, and productivity and precipitation in the Cariaco Basin during the last glacial anddeglacial period. Yet questions remain as to what climate mechanisms influenced continental regions farremoved from the North Atlantic and beyond the direct influence of the inter-tropical convergence zone.Here, we present U-series calibrated stable isotopic and trace element time series for a speleothem fromMoaning Cave on the western slope of the central Sierra Nevada, California that documents changes inprecipitation that are approximately coeval with Greenland temperature changes for the period 16.5 to8.8 ka.From 16.5 to 10.6 ka, the Moaning Cave stalagmite proxies record drier and possibly warmer conditions,signified by elevated δ18O, δ13C, [Mg], [Sr], and [Ba] and more radiogenic 87Sr/86Sr, during NorthernHemisphere warm periods (Bølling, early and late Allerød) and wetter and possibly colder conditions duringNorthern Hemisphere cool periods (Older Dryas, Inter-Allerød Cold Period, and Younger Dryas). MoaningCave stable isotope records indicate that wet conditions persisted in this area well beyond 11.5 ka,suggesting the effects of the Younger Dryas event may have been longer lived in the western Sierra Nevadathan in Greenland. However, a shifting drip center and corresponding change in seepage water routing mayhave influenced the trace element records between 10.6 and 9.6 ka. Linkages between northern high-latitudeclimate and precipitation in the Sierra Nevada suggested here could indicate that, under conditions ofcontinued global warming, this drought-prone region may experience a reduction in Pacific-sourcedmoisture.
© 2009 Elsevier B.V. All rights reserved.
1. Introduction
Abrupt changes in temperature of up to 20 °C over Greenland thatpersisted for centuries to millennia during the last glacial and ensuingdeglacial periods (Alley et al., 1993; Stuiver and Grootes, 2000)coincided with widespread perturbation of North Atlantic regionalclimate (Labeyrie, 2000; Bond et al., 2001; Broecker, 2003; Hemming,2004; Kienast et al., 2006). Recent studies document the interhemi-spheric nature of these climate events with coincident changes in theintensity of the southeast Asianmonsoon, surfacewater temperature inthe Santa Barbara Basin (eastern Pacific), productivity and precipitationin the Cariaco Basin (Caribbean), and continental climates throughoutthe Northern and Southern Hemisphere tropics and subtropics (e.g.,Peterson et al., 2000; Wang et al., 2001; Hendy et al., 2002; Lea et al.,2003; Yuan et al., 2004; Polyak et al., 2004; Wang et al., 2004, 2005;Denniston et al., 2007). Although model simulations indicate that suchwidespread, abrupt climate shifts likely occurred via atmosphericteleconnections between these areas and the northern high-latitudes
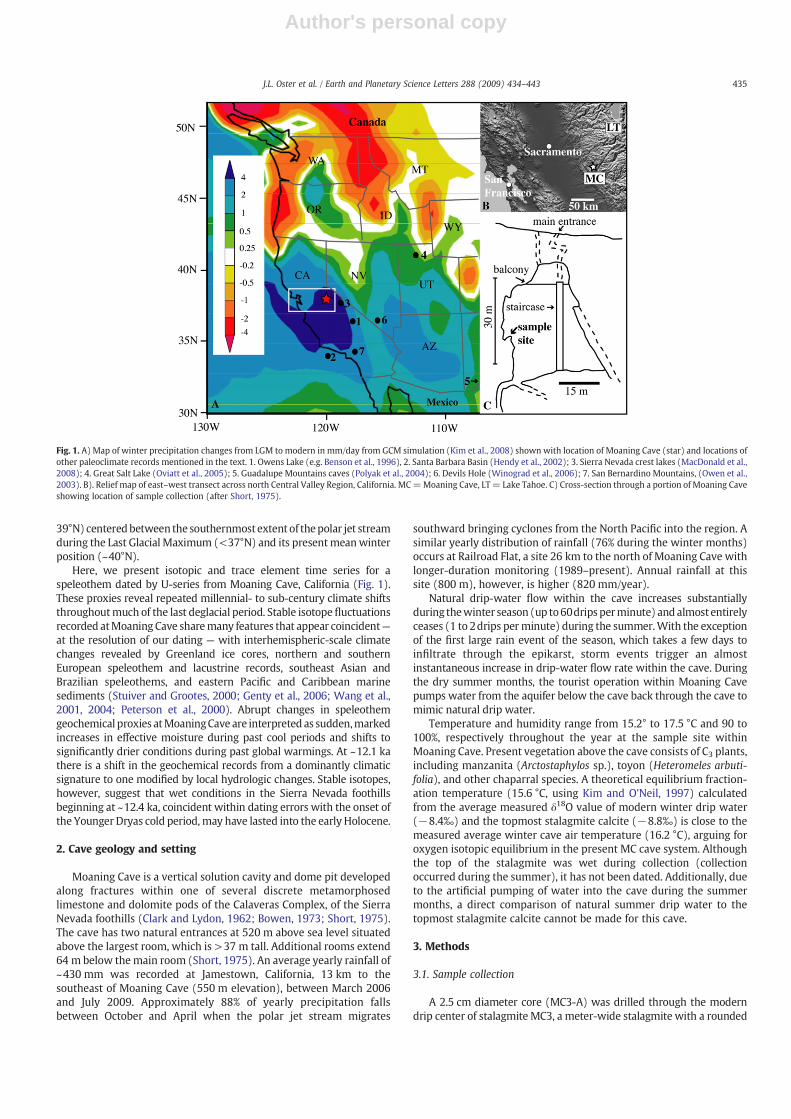
(Manabe and Stouffer, 1988; Mikolajewicz et al., 1997; Vellinga andWood, 2002), questions remain as to what climate mechanismsinfluenced continental regions far removed from the North Atlantic(e.g. western North America) and beyond the direct influence of theinter-tropical convergence zone (ITCZ). Speleothem-bearing caves inthe western slope of the Sierra Nevada in California (Fig. 1) offer anopportunity to evaluate the hydroclimate response in western NorthAmerica to northern high-latitude climate shifts.
The Sierra Nevada are sensitive to changes in atmosphericcirculation over the North Pacific given that they are the first majororographic barrier to winter storms brought eastward from the Pacificby the polar jet stream. Model simulations highlight the sensitivity ofthe average latitude of the polar jet stream andwinter storm tracks overwestern North America to changes in the extent of late PleistoceneNorth American continental ice sheets (Kutzbach and Wright, 1985;Bromwich et al., 2004, 2005; Kim et al., 2008, Fig. 1), and, more recently,to the extent of Arctic sea ice cover (Sewall and Sloan, 2004; Sewall,2005) and globalwarming (Allen and Ingram, 2002; Seager et al., 2007).Stalagmites from caves developed in marble terranes on the westernslope of the central Sierra in particular have the potential to provideproxy records of past motions of the polar jet stream and associatedprecipitation changes (Fig. 1) given their latitudinal position (38 to
Earth and Planetary Science Letters 288 (2009) 434–443
⁎ Corresponding author.E-mail address: [email protected] (J.L. Oster).
0012-821X/$ – see front matter © 2009 Elsevier B.V. All rights reserved.doi:10.1016/j.epsl.2009.10.003
Contents lists available at ScienceDirect
Earth and Planetary Science Letters
j ourna l homepage: www.e lsev ie r.com/ locate /eps l
Author's personal copy
39°N) centeredbetween the southernmostextent of thepolar jet streamduring the Last Glacial Maximum (<37°N) and its presentmeanwinterposition (~40°N).
Here, we present isotopic and trace element time series for aspeleothem dated by U-series from Moaning Cave, California (Fig. 1).These proxies reveal repeated millennial- to sub-century climate shiftsthroughoutmuch of the last deglacial period. Stable isotopefluctuationsrecorded atMoaning Cave sharemany features that appear coincident—at the resolution of our dating — with interhemispheric-scale climatechanges revealed by Greenland ice cores, northern and southernEuropean speleothem and lacustrine records, southeast Asian andBrazilian speleothems, and eastern Pacific and Caribbean marinesediments (Stuiver and Grootes, 2000; Genty et al., 2006; Wang et al.,2001, 2004; Peterson et al., 2000). Abrupt changes in speleothemgeochemical proxies atMoaningCave are interpreted as sudden,markedincreases in effective moisture during past cool periods and shifts tosignificantly drier conditions during past global warmings. At ~12.1 kathere is a shift in the geochemical records from a dominantly climaticsignature to one modified by local hydrologic changes. Stable isotopes,however, suggest that wet conditions in the Sierra Nevada foothillsbeginning at ~12.4 ka, coincident within dating errors with the onset ofthe Younger Dryas cold period, may have lasted into the early Holocene.
2. Cave geology and setting
Moaning Cave is a vertical solution cavity and dome pit developedalong fractures within one of several discrete metamorphosedlimestone and dolomite pods of the Calaveras Complex, of the SierraNevada foothills (Clark and Lydon, 1962; Bowen, 1973; Short, 1975).The cave has two natural entrances at 520 m above sea level situatedabove the largest room, which is >37 m tall. Additional rooms extend64 m below themain room (Short, 1975). An average yearly rainfall of~430 mm was recorded at Jamestown, California, 13 km to thesoutheast of Moaning Cave (550 m elevation), between March 2006and July 2009. Approximately 88% of yearly precipitation fallsbetween October and April when the polar jet stream migrates
southward bringing cyclones from the North Pacific into the region. Asimilar yearly distribution of rainfall (76% during the winter months)occurs at Railroad Flat, a site 26 km to the north of Moaning Cave withlonger-duration monitoring (1989–present). Annual rainfall at thissite (800 m), however, is higher (820 mm/year).
Natural drip-water flow within the cave increases substantiallyduring thewinter season (up to60drips perminute) andalmost entirelyceases (1 to 2drips perminute) during the summer.With the exceptionof the first large rain event of the season, which takes a few days toinfiltrate through the epikarst, storm events trigger an almostinstantaneous increase in drip-water flow rate within the cave. Duringthe dry summer months, the tourist operation within Moaning Cavepumps water from the aquifer below the cave back through the cave tomimic natural drip water.
Temperature and humidity range from 15.2° to 17.5 °C and 90 to100%, respectively throughout the year at the sample site withinMoaning Cave. Present vegetation above the cave consists of C3 plants,including manzanita (Arctostaphylos sp.), toyon (Heteromeles arbuti-folia), and other chaparral species. A theoretical equilibrium fraction-ation temperature (15.6 °C, using Kim and O'Neil, 1997) calculatedfrom the average measured δ18O value of modern winter drip water(−8.4‰) and the topmost stalagmite calcite (−8.8‰) is close to themeasured average winter cave air temperature (16.2 °C), arguing foroxygen isotopic equilibrium in the present MC cave system. Althoughthe top of the stalagmite was wet during collection (collectionoccurred during the summer), it has not been dated. Additionally, dueto the artificial pumping of water into the cave during the summermonths, a direct comparison of natural summer drip water to thetopmost stalagmite calcite cannot be made for this cave.
3. Methods
3.1. Sample collection
A 2.5 cm diameter core (MC3-A) was drilled through the moderndrip center of stalagmite MC3, a meter-wide stalagmite with a rounded
Fig. 1. A) Map of winter precipitation changes from LGM to modern in mm/day from GCM simulation (Kim et al., 2008) shown with location of Moaning Cave (star) and locations ofother paleoclimate records mentioned in the text. 1. Owens Lake (e.g. Benson et al., 1996), 2. Santa Barbara Basin (Hendy et al., 2002); 3. Sierra Nevada crest lakes (MacDonald et al.,2008); 4. Great Salt Lake (Oviatt et al., 2005); 5. Guadalupe Mountains caves (Polyak et al., 2004); 6. Devils Hole (Winograd et al., 2006); 7. San Bernardino Mountains, (Owen et al.,2003). B). Relief map of east–west transect across north Central Valley Region, California. MC=Moaning Cave, LT= Lake Tahoe. C) Cross-section through a portion of Moaning Caveshowing location of sample collection (after Short, 1975).
435J.L. Oster et al. / Earth and Planetary Science Letters 288 (2009) 434–443

Author's personal copy
top that grew30mvertically below the caveentrance, usingahand-heldelectric drill modified by Pomeroy Industries to fit a 30.5 cm longdiamond coring bit. At the sample location, the rock thickness above thecave is ~15 m. Although the stalagmite was collected during the drysummer season, the top was wet, and the location of the single dripcenter was obvious. The stalagmite, which sits on a slope and is ~1.5 mtall along the central axis, is fed by a fracture in the cave ceiling. Fouradditional cores (MC3-B–MC3-E) (Fig. 2) were drilled around the firstcore to capture movement of the drip center through time. Coresamples, rather than the entire stalagmite, were taken in the interest of
cave preservation. Thick (~200 µm) sections were made continuouslythroughout the top 7 cm of MC3-A where banding is horizontal. Thicksections were also made of the top portions of MC3-B and C (Fig. 2)which each displays sub-horizontal to horizontal banding.
3.2. U-series dating
Four samples for U–Th dating were drilled from MC3-A followingvisible growth bands. Four additional samples were sawed fromMC3-B and C. The locations of samples from these cores were correlated to
Fig. 2. Comparison of Moaning Cave cores. A) Photograph of sampled stalagmite with core samples MCA-E shown. B) Slide scan image of core MC3-A with δ13C profile and locations(laminae) of samples for dating indicated by arrows. Dates in italics are taken from cores MC3-B and C. C) Core MC3-B with δ13Cprofile and dating samples. D) Core MC3-C with δ13Cprofile and dating samples. All profiles are given in mm. Note laminae in MC3-B (C) are overprinted by sub-horizontal fractures that occurred during sample preparation.
436 J.L. Oster et al. / Earth and Planetary Science Letters 288 (2009) 434–443

Author's personal copy
MC3-A by visually matching growth bands and δ18O and δ13C seriesamong the cores (Fig. 2).
U-series analytical methods are as follows. Samples were dissolvedcompletely in HNO3–HF–HClO4 and equilibrated with a mixed spikecontaining 229Th, 233U, and 236U. U and Th were separated using Fe-hydroxide precipitation, followed by two stages of HNO3–HCl anionexchange chemistry. Th fractions were reacted with HClO4 to removeany residual organic material from ion exchange resins. Purified U andTh fractions were loaded with colloidal graphite onto separate,outgassed rhenium filaments (Edwards et al., 1987). Isotopic analyseswere done on a Micromass Sector-54 TIMS equipped with a wide-angle, retarding-potential energy filter and Daly-type ion counter.Mass discrimination for U was corrected using the known 233U/236Uratio of the spike, whereas thorium ratios were uncorrected. The U–Thspike was calibrated against solutions of HU-1 (Harwell uraninite)standard and solutions of 69 Ma uranium ore from the Schwartz-walder Mine that have been demonstrated to yield concordant U/Pbages (Ludwig et al., 1985) and sample-to-sample agreement of 234U/238U and 230Th/238U ratios. Instrumental performance was monitoredby frequent analyses of the Schwartzwalder Mine secular equilibriumstandard. Procedural backgrounds for m/e=230 averaged <0.6 fg230Th equivalent, and were negligible for 238U and 232Th. Ages weredetermined using the decay constants of Cheng et al. (2000). Ages anderrors were calculated using Isoplot (Ludwig, 2003).
Relatively high concentrations of 232Th in the speleothem (~1 to15 ppb, median 4.2 ppb) indicate the presence of silicate detritus,likely derived from windblown dust or soil above the cave. Asdiscussed by Hellstrom (2006), limiting values for initial isotopes of Uand Th consistent with preservation of stratigraphic order may bederived from a sequence of speleothem samples with varying 230Th/232Th ratios. We have corrected for U and Th isotopes contributed bydetritus assuming activity ratios of (232Th/238U)=1.45±0.35, (230Th/238U)=1.0±0.25, and (234U/238U)=1.0±0.25. Uncertainties associ-ated with the detritus correction were propagated through to the age.
3.3. Stable isotope analyses
Stable isotope samples (25 to 75 µg) were microdrilled from thicksections along the growth axis of MC3-A using a fully automatedMerchantek microdrilling system with ~50 µm spatial resolution.Stable isotope samples were roasted at 375 °F in vacuo to removeorganic volatiles. δ18O and δ13C values were determined using a
Fisons Optima IRMS with a 90 °C Isocarb common acid bathautocarbonate system in the Stan Margolis Stable Isotope Lab, UCDavis. Values are reported relative to Pee Dee Belemnite (PDB) usingstandard delta notation; analytical precision for both δ18O and δ13C is<±0.1‰ (1σ). δ18O and δ13C profiles were also completed for datedintervals of MC3-B and C in order to facilitate the correlation of U-series samples between cores.
3.4. Trace element and Sr isotope analyses
Trace element analyses were carried out by laser ablation ICPMSusing an Agilent 7500 series quadrupole ICPMS coupled to a NewWave Research UP-213 ablation system at the Interdisciplinary Centerfor Plasma Mass Spectrometry, UC Davis. Measurements were madeon thick (~400 µm) polished sections using a 20 µm spot size and80 µm spacing.
Additionally, speleothem, microsampled at a 1 mm intervals, andhost calcites were processed for Sr isotope analysis using chemical pre-treatments to remove Sr associated with absorbed or includednoncarbonate phases (Montañez et al., 2000). Samples of soils aboveMoaning Cave were leached with progressively stronger solutions (1 Mammonium acetate, 4% acetic acid, concentrated (48 M) hydrofluoricacid) in order to characterize the 87Sr/86Sr ratio of leachable Sr in soilcomponents (carbonate, volcanic grains, and phyllosilicates). 87Sr/86Srratiosweremeasured in solutionmodeonaNuMC-ICPMS in theGeologyDepartment at UC Davis and values were normalized to a nominal valuefor SRM987 of 0.710248.
4. Results
U-series ages preserve stratigraphic order, and ages for twosamples (MC8A) from the same speleothem layer in core MC3-Bshow excellent reproducibility (Table 1; Fig. 2), consistent with aclosed 238U/234U/230Th system in the speleothem since precipitation.MC8B, taken from the correlative position in core MC3-C, yields thesame age as MC8A (10.37±0.25 ka and 10.30±0.18 ka, respectively),supporting the correlations among cores. U-series ages for MC3 rangefrom 16.5 to 8.8 ka, indicating that the isotopic and trace element timeseries span the latest glacial period through early Holocene. In MC3-A,the average growth rate is relatively rapid (16.4 µm/year) between16.5 and 14.9 ka, slows to 6.0 µm/year between 14.9 and 12.3 kaduring the Bølling–Allerød (B–A), and at 12.3 ka, increases again to
Table 1230Th/U analytical data and ages for MC3 speleothem.
Sample Depth Wt U 232Th 230Th/232Th Measured230Th/238U
Measured234U/238U
Uncorrected 230Th age Corrected 230Th age Initial234U/238U
(mm) (mg) (ppm) (ppm) (ka) (ka)
MC1 9 274.5 0.302 0.00281 28.2 0.08672±0.0011 1.097±0.0034 8.98±0.12 8.77±0.14 1.099±0.003MC9 18 515.2 0.465 0.00473 26.1 0.08753±0.0009 1.091±0.0065 9.12±0.11 8.89±0.14 1.094±0.007MC8A(1) 21.3 401.5 0.473 0.00418 34.5 0.1004±0.0016 1.093±0.0026 10.51±0.18 10.31±0.19 1.095±0.003MC8A(2) 21.3 450.7 0.458 0.00402 34.4 0.09958±0.0014 1.086±0.0048 10.49±0.16 10.29±0.18 1.089±0.005MC8B 21.3 413.5 0.456 0.00424 33.0 0.1011±0.0022 1.093±0.0052 10.58±0.24 10.37±0.25 1.096±0.005MC 4-1 436.3 0.463 0.01300 11.7 0.1081±0.0021 1.093±0.0087 11.36±0.25 10.72±0.34 1.096±0.009MC 4-2 532.8 0.461 0.00664 22.3 0.1059±0.0023 1.092±0.0044 11.12±0.26 10.79±0.28 1.095±0.005MC5B 22.5 356.5 0.457 0.00733 19.7 0.1042±0.0037 1.069±0.0044 11.19±0.42 10.82±0.44 1.071±0.005MC3 23 391.8 0.493 0.0108 16.6 0.1198±0.0026 1.094±0.0016 12.64±0.30 12.14±0.35 1.098±0.002MC5 25 401.9 0.443 0.0158 10.3 0.1208±0.0029 1.068±0.0037 13.09±0.34 12.26±0.45 1.071±0.004MC10 41 803.5 0.168 0.00164 44.4 0.1425±0.0017 1.098±0.0036 15.14±0.21 14.92±0.22 1.103±0.004MC 4-4 663.0 0.127 0.00090 65.9 0.1547±0.0016 1.102±0.0064 16.48±0.21 16.32±0.22 1.107±0.007MC2 67 330.5 0.174 0.00093 88.3 0.1564±0.0030 1.105±0.0025 16.63±0.35 16.51±0.35 1.110±0.003MC 4-5 473.9 0.146 0.00527 13.6 0.1626±0.0036 1.084±0.0063 17.71±0.44 16.88±0.53 1.089±0.007
All isotope ratios are given asactivity ratios; errors are 2σ. Activity ratiosused fordetritus correction are (232Th/238U)=1.45±0.35, (230Th/238U)=1.0±0.25, and (234U/238U)=1.0±0.25.Decay constants used are fromCheng et al., 2000. Initial 234U/238U calculated frompresent day, detritus-corrected 234U/238U and corrected 230Th age. SamplesMC8A(1),MC8A(2), andMC9were taken from Core MC3-B. Samples MC5B, MC8B, and MC10were taken from Core MC3-C. Corresponding depths in Core MC3-A are given. Weighted mean age of samples MC8A(1),MC8A(2), and MC8B used for age model is 10.32±0.21 ka. Samples MC 4-1 throughMC 4-5, taken from Core MC3-D, are not included in the age model, but were used to determine the(232Th/238U) for detritus correction.
437J.L. Oster et al. / Earth and Planetary Science Letters 288 (2009) 434–443

Author's personal copy
16.7 µm/year following the onset of the Younger Dryas (YD) (Fig. 3).For the interval of rapid growth rate between 16.5 and 14.9 ka, thestalagmite exhibits fibrous and elongate columnar fabrics indicative ofcontinuous precipitation under relatively high and consistent driprates, low CaCO3 supersaturation, and near fluid–carbonate equilib-rium conditions (Frisia et al., 2000). Similar fabric is observed for theinterval 12.3 to 12.1 ka, suggesting a possible second brief period ofincreased growth rates during the initial YD. For the interval 14.9to12.3 ka where average growth rate slowed by >50%, the elongatecolumnar fabric is intercalated with mm-scale intervals of microcrys-talline calcite, which are characteristic of intermittent growth undervariable flow conditions and elevated influx of detrital and/orcolloidal particles (Frisia et al., 2000). Following an inferred increasein average growth rate between 12.3 and 12.1 ka, growth rate in MC3-A decreases dramatically to 0.4 µm/year between 12.1 and 10.8 ka.The stalagmite continues to display elongate columnar fabric during
this interval, however breaks in the crystal growth pattern and apossible dissolution surface suggest the calculated average growthrate has large uncertainty. Growth rates in MC3-B and C are estimatedto be 100 to 200% greater (0.8 to 1.1 µm/year) than for MC3-A duringthis interval. For the interval 10.8 to 8.9 ka, the average growth rate inMC3-A increases to 2.4 µm/year before rising dramatically to 75 µm/year between 8.9 and 8.8 ka. During this interval, the stalagmite againexhibits an elongate columnar fabric intercalated with mm-scaleintervals of microcrystalline calcite.
The Moaning Cave stalagmite δ18O time series exhibits systematicfluctuations between −7.0‰ and −9.7‰, while δ13C fluctuates over alarger range (−5.9‰ and−11.2‰) and records several large shifts thatgenerally coincide with δ18O fluctuations (Fig. 3). Mickler et al. (2004,2006) showed that non-equilibrium fractionation of stable isotopes canoccur during speleothem growth due to rapid and extended degassingof CO2 driven by decreased seepage water flow rates, increasedevaporation, and/or changing cave air–water CO2 ratios. Such kineticeffects lead to 13C- and 18O-enrichment in the speleothem and elevatedconcentrations of trace elements such as Mg, Sr, and Ba (Lorens, 1981).
Moaning Cave δ18O and δ13C values exhibit significant down-axiscorrelation (r2=0.81) that could be interpreted to record non-equilib-rium isotope precipitation (e.g., Mickler et al., 2006). However, the valuesand patterns in δ18O and δ13C between 12.3 and 9.6 ka in MC3-A arereproducible in two other cores (MC3-B and C) taken off the growth axisthrough the same stalagmite. If kinetic effects were dominating theMoaning Cave record, δ18O values, in particular, would be expected tovary substantially perpendicular to the growth axis (Hendy, 1971); ratherthan the good agreement observed in δ18O values for on- and off-axissamples from the same layer. Furthermore, similar down-axis correlationbetween δ18O and δ13C has been observed in other speleothem recordsand interpreted to reflect climatic processes rather than non-equilibriumcalcite precipitation (e.g. Genty et al., 2003; Frappier et al., 2007), Similarlong-term trends in MC3 87Sr/86Sr and trace element concentrations (seebelow), in particular through the late glacial and B–A, also argue against asignificant influence of kinetic effects given the negligible environmentalfractionation of 87Sr/86Sr values (Banner et al., 1996).
MC3 [Mg] varies between 1800 and 9000 ppm, [Sr] between 25and 85 ppm, and [Ba] between 3 and 7 ppm. 87Sr/86Sr values varybetween 0.70577 and 0.70689. Overall, changes in [Mg], [Sr], and [Ba]and 87Sr/86Sr values through the late glacial and the first half of the YD(~12.4 to ~12.2 ka) define general trends similar to those delineatedby the stable isotope time series, with intervals of low trace elementconcentrations and less radiogenic 87Sr/86Sr values generally coinci-dent with the most negative δ18O and δ13C values (Fig. 4). This trendof positively covarying stable isotope and geochemical proxies isinterrupted between 10.6 and 9.4 ka by a shift to a generally inverserelationship between trace elements and δ13C (Table 2). From 9.4 tothe end of the record (8.8 ka), there is a return to positive correlationbetween proxies, though the correlations are less pronounced.
5. Evaluation of paleoclimate and paleohydrology time series
In the following section, we first evaluate the processes that affectspeleothem δ18O, δ13C, [Mg], [Sr], [Ba], and 87Sr/86Sr in the context ofthe MC3 time series. Subsequently, we discuss the climatic andhydrologic interpretations for the Moaning Cave record in three timeintervals, 16.5–10.6 ka, 10.6–9.4 ka, and 9.4–8.8 ka. These intervalsare defined by distinct changes in the correlations among isotopic andtrace element proxies in the speleothem.
5.1. δ18O
MC3 δ18O variations, which have been corrected for changes inseawater δ18O (cf., Vacco et al., 2005) using the record of deglacial sea-level rise (Fleming et al., 1998), can be interpreted as changes in surfaceair temperature and/or rainfall amount. Present day air temperature
Fig. 3. Comparison of Moaning Cave δ18O (top) and δ13C with GISP2 δ18O (Stuiver andGrootes, 2000). Red line is 5 pt running mean of GISP2 data. Bølling–Allerød andYounger Dryas intervals in GISP2 record are shaded, respectively, green and purple.Widths of gray bars indicate uncertainties in the GISP2 age model. Black boxes show U-series ages and errors (2σ) of Moaning Cave samples. Black dashed lines tie the onset ofthe Bølling, the Older Dryas, and the Inter-Allerød Cold Period intervals in both records.MC δ18O values have been corrected for changes in seawater δ18O with sea level usingFleming et al., 1998.
438 J.L. Oster et al. / Earth and Planetary Science Letters 288 (2009) 434–443

Author's personal copy
within Moaning Cave varies by 2.3 °C during the year, a variation thatcould account for only a 0.5‰ change in the δ18O of speleothem calcite(using theequilibriumfractionation relationshipofKimandO'Neil, 1997).
Furthermore, more stable cave air temperature variations would beexpected prior to artificial ventilation of the cave (1922). Thus, weinterpret the oxygen isotope values in Moaning Cave speleothems toprimarily record the δ18O value of drip water and thus the δ18O ofprecipitation falling above the cave (Dorale et al., 1998; McDermott,2004). Precipitation δ18O is related to changes in continental ice volume,surface air temperature, moisture source, rainfall amount, and evapora-tion (Dansgaard, 1964; Vaks et al., 2003). Although we discount changesin cave air temperature as the source of variation in MC3 δ18O, theobserved shifts (up to 2‰) could suggest surface air temperature changesof 1 to 4 °C, using the range of 0.5–0.7‰/°C for δ18O in precipitationproposed by Rozanski et al. (1993), if no other effects were influencingprecipitation δ18O. Furthermore, there is no reason to believe that thesource of moisture to the Sierra Nevada foothills changed on thesetimescales, as it is unlikely that the North American Monsoon, whichcurrently affects the southwestern United States, extended this far to thenorth and west during the last glacial period (Adams and Comrie, 1997).Additionally, precipitation amount effects on δ18O would lead to morenegative δ18O when rainfall amounts are higher (Dansgaard, 1964).
5.2. δ13C and trace element concentrations
Variations in MC3 δ13C are most likely due to shifts in the amountof soil-derived CO2 contributed to seepage waters and/or changes incalcite precipitation up-flow from the stalagmite drip site. Soilrespiration rates above Moaning Cave likely decreased during dryperiods, leading to decreased contribution of soil CO2 to seepagewater DIC andmore positive speleothem δ13C values (e.g. Quade et al.,1989; Genty et al., 2003; Cruz et al., 2006). Conversely, soil respirationcould have been at its maximum during wet periods, leading tominimum values of seepage water DIC δ13C. Furthermore, the lack ofpollen or packrat midden evidence for C4 flora in the greater studyregion over the past 20+ky (Cole, 1983; Thompson et al., 1993; Davis,1999) argues against changes in the C3:C4 plant ratios leading tochanges in soil-derived δ13C aboveMoaning Cave (Dorale et al., 1998).
Variations in δ13C, aswell as [Mg], [Sr], and [Ba] inMC3are also likelycontrolled through most of the record by variations in the amount ofcalcite precipitated in the aquifer up-flow from the speleothemdrip site(prior calcite precipitation). As CO2 is degassed from drip water, thelighter 12CO2 molecule is preferentially released, leading to morepositive δ13C in the remaining drip water. Likewise, as calcite isprecipitated from drip water, the remaining water possesses higher[Mg], [Sr], and [Ba], as the distribution coefficients for these elements incalcite are much less than 1 (Lorens, 1981; Fairchild et al., 2000). Priorcalcite precipitation in a cavewill increase due to increased evaporationor degassing or slower seepage rates that allow saturation to be reached
Fig. 4. Comparison of Moaning Cave 87Sr/86Sr, [Sr], [Mg], [Ba], and δ13C. Onset of the B–A(15 ka) and YD (12.5 ka) in the Moaning Cave δ13C record are indicated by solid lines.Blue bar indicates the extent of wet conditions above Moaning Cave as shown by theδ13C record. The end of YD conditions at Moaning Cave at 9.6 ka is shown with a dashedline. Thin gray bars highlight the Older Dryas, and the Inter-Allerød Cold Periodintervals. Dash–dotted lines demarcate the interval of potential hydrologic variabilitybetween 10.6 and 9.6 ka as indicated by the trace element records. Increases in δ13Csuggest either decreased soil respiration or increased prior calcite precipitation.Increases in [Mg], [Sr], and [Ba] also suggest increased prior calcite precipitation.Increased 87Sr/86Sr suggests elevated water rock interactions.
Table 2Correlation coefficients for proxies by time period.
Proxies 8.8–9.4 9.4–10.6 10.6–16.5
(ka) (ka) (ka)
δ13C vs δ18O 0.85 0.82 0.88δ13C vs [Mg] 0.11 −0.36 0.66δ13C vs [Sr] 0.30 0.11 0.80δ13C vs [Ba] 0.26 −0.19 0.76δ18O vs [Mg] 0.14 0.00 0.55δ18O vs [Sr] 0.03 0.16 0.60δ18O vs [Ba] 0.04 0.05 0.64[Mg] vs [Sr] 0.37 −0.13 0.57[Mg] vs [Ba] 0.36 0.41 0.79[Sr] vs [Ba] 0.94 0.72 0.87
Proxy r2 values were calculated by interpolating proxy records onto one age modelusing the ARAND software package (Howell et al., 2006). Correlation coefficients werenot calculated for 87Sr/86Sr with the other proxies given that the resolution of the 87Sr/86Sr record is much lower.
439J.L. Oster et al. / Earth and Planetary Science Letters 288 (2009) 434–443

Author's personal copy
earlier in the water travel path (Fairchild et al., 2000). Slower seepagerates, and therefore increased groundwater residence times, wouldoccur during periods of increased aridity resulting in decreased watersupply to the cave. In addition, increased evaporation and degassing ofdrip waters may arise during periods of increased cave air ventilation.When surface air temperatures are relatively low, cold, dense outside airwill sink into the cave, displacing warmer, high pCO2 cave air andleading to an overall decrease in cave air pCO2 (Banner et al., 2007). Inthis scenario, increased degassing and prior calcite precipitation drivenby decreased cave air pCO2 would have occurred in Moaning Caveduring colder periods. This relationship, however, is not consistent withthe observed positive correlation between δ18O and δ13C (Table 2;Fig. 3). Rather, the strong covariation between δ18O, δ13C, [Mg], [Sr], and[Ba] during periods of increased warming over Greenland favors anincrease in prior calcite precipitation, probably due to decreasedseepage rates and increased groundwater residence time during dryperiods in the central Sierra Nevada.
Variation in [Mg] in theMoaning Cave speleothemmight also resultfrom differential dissolution of limestone and dolomite in the dolomite-bearing marble host-rock (Hellstrom and McCulloch, 2000; Fairchildet al., 2000). Dolomite dissolution in the aquifer, however, is not likelythe dominant control on [Mg] concentrations given the positivecorrelation between [Mg], [Sr] and [Ba], as dolomite typically haslower concentrations of Sr and Ba than calcite (Hellstrom andMcCulloch, 2000). Additionally, dolomite dissolution would not leadto concurrent variations in δ13C, as dolomite δ13C is typically rock-buffered to host limestone δ13C values (Machel et al., 1996). Lastly,given that Moaning Cave is located ~200 km from the coast and there isno evidence of major shifts in wind direction over the region since thelast glacial period, the contribution of [Sr] and [Ba] from sea spray anddust to the Moaning Cave record should be relatively constant (Ayalonet al., 1999). Thus, we conclude that variations in prior calciteprecipitation due to changes in groundwater residence time are mostlikely the dominant control on Moaning Cave trace element concentra-tions throughout much of the record.
5.3. 87Sr/86Sr
We interpret MC3 87Sr/86Sr ratios to reflect varying contributionsfrom two end-members characterized in this study: a less radiogenicsoil source with a value of 0.70459±16 derived from theweathering of
metamorphic and altered volcanic rocks above Moaning Cave and amore radiogenic host-marble sourcewith a valueof 0.70745±9 (Fig. 5).Previous studies of Sr isotopes in speleothems have interpretedincreases in host-rock derived Sr as representing periods of increasedresidence time and drier climates (e.g. Banner et al., 1996), and weinterpret the Moaning Cave Sr isotopic record similarly. During periodsof increased precipitation, rapidly infiltrating water would haveproduced drip waters with less radiogenic Sr reflecting increasedcontribution of soil-dominated Sr. During drier periods increasedseepage water residence time in the carbonate aquifer and increasedmeteoric water–marble interactionswould have led tomore radiogenicspeleothem Sr.
5.4. The Moaning Cave record from 16.5 to 10.6 ka
From 16.5 to 10.6 ka stable isotope and geochemical proxies arepositively correlated (r2=0.55 to 0.88; Table 2). δ18O and δ13C values riseabruptly at 15 ka, coincident (withindating errors of about±220 years intheMC3 record)with the onset of theBølling–Allerød (B–A)warmperiodin the GISP2 ice core (14.7±0.29 ka) (Meese et al., 1997; Stuiver andGrootes, 2000).When temperatures in Greenlandwere warm during theBølling and early and late Allerød periods, δ18O, δ13C, [Mg], [Sr], and [Ba]increased in the speleothem coincident with shifts to more radiogenic87Sr/86Sr values. Less negative δ18O values suggest potentially warmersurface air temperatures above Moaning Cave, increased evaporation,and/or an overall decrease in precipitation occurred at these times.Increased δ13C values suggest either a decrease in vegetation leading toless contribution of soil CO2 to cave water, increased prior calciteprecipitation, or the interaction of both processes. Increases in traceelement concentration further support increased prior carbonateprecipitation during warm periods. This, coupled with more radiogenic87Sr/86Sr, suggests increased contribution of solution metals frominteraction with the host-rock relative to soil water. All of theseparameters are consistent with a drier and possibly warmer climateabove Moaning Cave during Greenland warm periods between 16.5 and12.2 ka.
Conversely, abrupt shifts to lower δ18O, δ13C, and [Mg], [Sr], and[Ba] and less radiogenic 87Sr/86Sr values at ~14.2 ka and ~13.4 ka,which may be coincident with the Older Dryas (~14 ka), and theInter-Allerød Cold period (13.1 ka) as defined in GISP2, are consistentwith shifts to wetter and possibly colder conditions above MoaningCave. An abrupt shift to the lowest δ18O, δ13C, [Mg], [Sr], and [Ba]values in MC3 occurs at 12.4 ka, coincident within dating error(±450 years) with the onset of the YD. These shifts, as well as asynchronous increase in average growth rate from 6.0 to 16.7 µm/yearat this time, are consistent with wetter climatic conditions on thewestern slope of the central Sierra Nevada at the onset of the YD.
Following the initial decrease into the YD, δ18O and δ13C and traceelement values increase slightly at ~12.2 ka. 87Sr/86Sr values alsoincrease slightly at this time. These changes suggest a decrease in thecontribution of soil-respired CO2 to seepage waters and an increase inprior calcite precipitation coupled with increased water–host-rockinteractions, consistent with a slight mid-YD increase in aridity andpossibly temperature in this region.
5.5. Evidence for a shift in drip center at 12.1 ka
Following the slight increase in all of the proxy records at 12.2 ka,the average growth rate between 12.1 and 10.8 ka in MC3-A fallsdramatically to 0.4 µm/year, while slightly to significantly greateraverage growth rates occur in synchronous intervals of MC3-B(3.9 µm/year between 12.3 and 10.3 ka) and MC3-C (1.1 µm/yearbetween 12.1 and 10.8 ka) (Table S1). δ18O, δ13C, and [Mg], [Sr], and[Ba] become stable at this time, with [Mg], [Sr], and [Ba] at minimumvalues, and δ18O and δ13C at slightly more positive values.
Fig. 5. 87Sr/86Sr vs. 1/[Sr] for host limestone (triangles), speleothems (circles), springwater (x) and soil prewash (open squares), acetic acid (half-filled squares), and HF(black squares) leachates. Error bar for 87Sr/86Sr is shown. Errors for [Sr] are smallerthan the symbols.
440 J.L. Oster et al. / Earth and Planetary Science Letters 288 (2009) 434–443

Author's personal copy
The large decrease in growth rate in MC3-A between 12.1 and10.8 ka could be interpreted to suggest decreased drip rate due toincreased aridity above the cave or changes in ventilation and cave airpCO2 (e.g. Musgrove et al., 2001; Banner et al., 2007). Speleothemgrowth rates are typically inversely correlated with cave air pCO2,which varies with seasonal differences between cave and surface airtemperatures (Banner et al., 2007). Thus, the dramatic decrease inMC3-A growth rate at 12.1 ka could indicate decreased ventilationdue to increased surface air temperatures between 12.1 and 10.8 ka.The relatively light δ18O values during this interval, however, suggestsurface air temperatures did not significantly increase. Furthermore,textural evidence of a discontinuity in MC3-A and migration of thehighest growth rates observed in this interval (12.1 and 10.8 ka) toMC3-B indicates that, rather than an overall decrease in drip rate, thedrip center of the Moaning Cave stalagmite shifted at ~12.1 ka. Abreak in the crystal growth pattern with a possible dissolution surfaceand numerous fluid inclusions during this interval in MC3-A furthersupports this hypothesis. This surface is present to a lesser degree inMC3-C and is not discernable in MC3-B. Lastly, the continued lowδ13C, [Mg], [Sr], and [Ba] indicate that a wet climate persisted aboveMoaning Cave between 12.1 and 10.8 ka. Thus, a shift in drip centeraway from the part of the speleothem sampled in MC3-A bestaccounts for the observed growth rate changes in this interval.
5.6. The Moaning Cave record from 10.6 to 9.4 ka
At 10.6 ka, δ18O values fall slightly and δ13C reach their minimumin the Moaning Cave record, coincident with an abrupt increase in[Mg]. These shifts are accompanied by slight increases in [Ba] and [Sr]and a slight shift in 87Sr/86Sr to more radiogenic values.
The [Mg] increase could represent a shift to a more Mg-rich sourcewithin the aquifer. The Moaning Cave host carbonate consists ofmetamorphosed limestones and dolomites (Clark and Lydon, 1962;Bowen, 1973). Thus, a change in groundwater routing could have led toincreased fluid interactionwith amore dolomite-rich (Mg-rich) portionof the host-rock. If, however, this very large increase in [Mg] wasproduced through the increased residence time/prior calcite precipita-tion mechanism suggested for the earlier part of the MC3 record, acoincident large increase in δ13Cwould be expected, but is not observed.Furthermore, the lack of a change in the crystal structure or in inclusiondensity during this interval indicates that the abrupt increase in traceelement concentrations is not related to the presence of contaminatingphases in the speleothem. [Sr] and [Ba] also increase at this time, but notto the same degree as the shift in [Mg]. These changes are consistentwith a shift to a dolomitic source, as dolomite contains less Sr and Bathan calcite (Hellstrom and McCulloch, 2000). Thus, we argue that thelarge increase in [Mg], coupled with the smaller increases in [Sr] and[Ba], and the near-minimum δ13C values are best explained by a changein groundwater flow path that does not necessitate a climatic shift todrier conditions above Moaning Cave.
At 9.6 ka, δ13C values increase abruptly fromapproximately−11‰ to−7.5‰, suggesting a rapid shift to a drier, and possibly warmer climateaboveMoaning Cave. At this time, δ18O values continue to gradually rise,suggesting that either air temperature increases above Moaning Cavewere more gradual than precipitation changes or that vegetation abovethe cave reached a soil moisture threshold that led to a rapid decrease invegetation density at 9.6 ka (e.g. deMenocal et al., 2000).
5.7. The Moaning Cave record from 9.4 to 8.8 ka
At ~9.4 ka, [Mg] and [Ba] decrease abruptly, while [Sr] falls moregradually. Following this, δ13C, [Mg], [Sr], and [Ba] are again positivelycorrelated though the correlations are less strong thanduring the earlierpart of the MC3 record. Stalagmite growth rate in MC3-A increasesdramatically from2.3 µm/year to 75 µm/year at 8.9 ka; the timingof thisgrowth rate shift, however, is constrained solely by the location of dated
samples. This average growth rate increase and the return to positivelycorrelated δ13C, [Mg], [Sr], and [Ba]may suggest that another shift in theflow path supplying the speleothem occurred given the fracture-flowdominatedhydrologyof the host aquifer. Variations in theproxy recordsin this portion of MC3 can therefore be interpreted as recording similarvariations in rainfall in the region and residence time as occurred duringthe B–A and early YD. The return to correlated proxies further supportsour hypothesis that the lack of correlation between the trace elementsand stable isotopes during the interval 10.6 to 9.4 ka records a local shiftin hydrology with a shift in drip center.
6. Discussion and summary
The speleothemMC3 records variations in regional climate and localhydrology between 16.5 and 8.8 ka. We interpret elevated δ18O, δ13C,[Mg], [Sr], and [Ba] and more radiogenic 87Sr/86Sr to indicate periods ofdecreased soil-respired CO2, increased prior calcite precipitation, andincreased groundwater–rock interaction above Moaning Cave. In turn,we attribute these proxy behaviors to relatively dry and possibly warmconditions at Moaning Cave during the Bølling, and early and lateAllerød warm periods noted in the Greenland ice core records.Conversely, lower δ18O, δ13C, [Mg], [Sr], and [Ba] and less radiogenic87Sr/86Sr record elevated soil-respired CO2, decreased prior calciteprecipitation, and more limited water–rock interaction presumably inresponse to increased precipitation above Moaning Cave during thecolder Older Dryas, Inter-Allerød Cold Period, and YD.
Studies of lacustrine, glacial, and speleothem records in westernNorth America have documented sub-centennial to millennial shiftsin mid-latitude western North American continental climate since thelate Pleistocene, similar to those seen in the early part of the MoaningCave record (e.g., Gosse et al., 1995; Clark and Bartlein, 1995; Bensonet al., 1996, 1997, 1998; Lin et al., 1998; Benson et al., 2003; Polyaket al., 2004; Brook et al., 2006; Ellwood and Gose, 2006). Theserecords, however, present an inconsistent picture of how regionalclimate changes in western North America with distal warmings andcoolings in the North Atlantic during the late Pleistocene, and the YDin particular. In some studies late Pleistocene cooling events in theNorth Atlantic region (e.g., stades of D–O and, B–A, YD) have beencorrelated to cool but dry climates in the Sierra Nevada and westernGreat Basin regions (e.g., Benson et al., 1997, 1998, 2003; Clark, 2003).For example, there is no evidence for a YD glacial advance on the eastside of the Sierra Nevada (Clark and Gillespie, 1997; Phillips et al.,2009). In contrast, other studies indicate possible increases ineffective moisture during the YD in parts of the Great Basin attributedto a southward displacement of the polar jet stream (Mensing, 2001;Polyak et al., 2004; Oviatt et al., 2005; MacDonald et al., 2008). Otherrecords lack sufficient temporal resolution to definitively establish (orrefute) the synchrony of regional climate oscillations with the near-global YD event (Mensing, 2001 and references within; Owen et al.,2003; Winograd et al., 2006) (Fig. 1). These disparities confound theissue of whether actual differences in regional climatic response todistal climate events noted in the northern high-latitudes occurred.
Notably, MC3 provides a high-resolution continuous record throughthis interval that is consistent with increased effective moisture in thecentral Sierra Nevada during past cool periods (Older Dryas, Inter-Allerød Cold Period, onset of the Younger Dryas) and significantly drierconditionsduringpastwarmings (Bølling, early and late Allerød). Such apattern is consistent with recent models of the impact of greenhouse-gas forcing on regional climates (Sewall and Sloan, 2004; Sewall, 2005;Seager et al., 2007). Western North American-focused simulationshighlight the sensitivity of Pacific-sourced winter storm tracks andprecipitation levels in mid-latitude western North America to changesin Arctic sea ice extent and atmospheric cell stability expected withglobalwarming. DecreasedArctic sea ice leads to anorthwarddeflectionof the polar jet stream and with it the present path of winter storms. Inregions such as northern California that are already characterized by
441J.L. Oster et al. / Earth and Planetary Science Letters 288 (2009) 434–443

Author's personal copy
marginally sufficient water resources, this effect could translate tosignificant (up to 30%) reductions in mean annual precipitation relativeto current levels (Sewall and Sloan, 2004; Sewall, 2005).
The MC3 time series document a shift to slightly drier conditions at12.2 ka followed by a potential change in the local hydrology includingmovement of the stalagmite drip center at 12.1 ka. A shift to drierconditions in themiddle of the YD interval hasbeennoted in anumber ofpaleoclimate records in western North America, including diatom andstable isotope records from lakes just east of the Sierra Nevada crest(MacDonald et al., 2008), and sedimentological, stable isotope andpollen records from Owens Lake in the eastern Sierra Nevada (Bensonet al., 1997; Mensing, 2001; Benson et al., 2002; Bacon et al., 2006).Additionally, a short-lived increase (0.4‰) in the δ18O values of theforaminifera N. Pachyderma is noted in Santa Barbara Basin (Fig. 1)sediments at ~12.3 ka, indicating a small increase in surface watertemperatures off theCalifornia coast (Hendyet al., 2002) coincidentwiththe climatic shift on thewestern slope of the central Sierra Nevada. Mid-YD shifts to warmer conditions have also been noted in other NorthernHemisphere locations, including the GRIP ice core δ18O record (2‰increase in at 12.2 ka) (Dansgaard et al., 1993), speleothems fromsouthern France andnorthern Tunisia (12.2 ka; Genty et al., 2006), and aGerman lacustrine ostracod record (von Grafenstein et al., 1999).Moreover, while the drip center shift seen in MC3 was most likelycaused by a very localized hydrologic change, it is possible that it wasinitiated by the slight drying noted in the Moaning Cave record at12.2 ka, which in turn might be linked with the mid-YD warmingobserved throughout the Northern Hemisphere. It is also worthemphasizing that these hydrologic shifts above Moaning Cave haddramatic effects on trace element records, and this may have importantimplications for the interpretation of such records from other caves.
Despite the influence of a change in seepage water routing on theMC3 trace element records, the stable isotope records remain lowthroughout the period 10.6 to 9.6 ka, with δ13C at its most negativevalues, arguing for dense vegetation and a relative increase inprecipitation until 9.6 ka. Therefore, the Moaning Cave record suggeststhat wet and possibly colder conditions persisted on the western slopeof the central Sierra Nevada well beyond the end of the YD in GISP2(~11.5 ka). This is an intriguing observation and warrants furtherevaluation in other continental records fromwesternNorth America. By9.0 ka, stable isotopes and trace elements suggest that conditions aboveMoaning Cave were as dry as those at the onset of the Bølling period.
Our interpretation of the MC3 record indicates that, since the lastglacial maximum, warmer episodes in the Sierra Nevada region ofcentral California were associated with decreased levels of effectivemoisture. Dating of the MC3 time series shows that marked climatefluctuations in the Sierra Nevada region occurred in as little as a fewdecades, and that one such shift at ~12.4 ka coincided, within thelimits of dating, with abrupt climate shifts that occurred globally at theonset of the Younger Dryas climatic event. Past climate shifts in theSierra Nevada, as elsewhere, occurred in response to modifiedatmospheric circulation patterns likely driven by northern high-latitude climate anomalies. Such climate shifts persisted throughoutthe deglaciation despite evolving boundary conditions (e.g. ice sheetextent and volume). The clear expression of the onset of the YoungerDryas, the short-lived drying during the mid-YD and the expression ofthe Older Dryas and Inter-Allerød Cold Period in the MC record istherefore consistent with recent climate models that highlight thepossible importance of such atmospheric teleconnections for Califor-nia's future climate under conditions of continued global warming andloss of Arctic ice. If this hypothesis is correct, such linkages indicatethat in response to global warming, effective moisture levels in theSierra Nevada region may be reduced not only by enhancedevaporation due to warmer local temperatures, but also by reductionsin Pacific moisture delivered to the region, thus strongly impactingwater resources in a region already characterized by marginallysufficient water resources.
Acknowledgements
We thank Neil Kelley, and NaomiMarks for field assistance. StevenFairchild, President of the Sierra Nevada Recreation Corporation,provided access to caves and materials. This paper benefited fromdiscussions with Howie Spero and Jay Banner as well as threeanonymous Earth and Planetary Science Letters reviewers. This workwas supported by a Cave Research Foundation student grant to JessicaOster and NSF grants NSF-ATM0823656 to Isabel P. Montañez and KariM. Cooper, and NSF-ATM0823541 to Warren D. Sharp.
Appendix A. Supplementary data
Supplementary data associated with this article can be found, inthe online version, at doi:10.1016/j.epsl.2009.10.003.
References
Adams, D.K., Comrie, A.C., 1997. The North American Monsoon. Bull. Am. Meteorol. Soc.78, 2197–2213.
Allen, M.R., Ingram, W.J., 2002. Constraints on future changes in climate and thehydrologic cycle. Nature 419, 224–232.
Alley, R.B., Meese, D.A., Shuman, C.A., Gow, A.J., Taylor, K.C., Grootes, P.M., White, J.W.C.,Ram, M., Waddington, E.D., Mayewski, P.A., Zielinski, G.A., 1993. Abrupt increase inGreenland snow accumulation at the end of the Younger Dryas event. Nature 362,527–529.
Ayalon, A., Bar-Matthews, M., Kaufman, A., 1999. Petrography, strontium, barium, anduranium concentrations, and strontium and uranium isotope ratios in speleothemsas palaeoclimatic proxies: Soreq Cave, Israel. The Holocene 9, doi:10.1191/095968399673664163.
Bacon, S.N., Burke, R.M., Pezzopane, S.K., Jayko, A.S., 2006. Last glacial maximum andHolocene lake levels of Owens Lake, eastern California, USA. Quat. Sci. Rev. 25,1264–1282.
Banner, J.L., Musgrove, M., Asmerom, Y., Edwards, R.L., Hoff, J.A., 1996. High-resolutiontemporal record of Holocene ground-water chemistry: tracing links betweenclimate and hydrology. Geology 24, 1049–1053.
Banner, J.L., Guilfoyle, A., James, E.W., Stern, L.A., Musgrove, M., 2007. Seasonalvariations in modern speleothem calcite growth in central Texas, U.S.A. J. Sed. Res.77, 615–622.
Benson, L., Burdett, J.W., Kashgarian, M., Lund, S.P., Phillips, F.M., Rye, R.O., 1996.Climatic and hydrologic oscillations in the Owens Lake Basin and adjacent SierraNevada, California. Science 274, 746–749.
Benson, L., Burdett, J., Lund, S., Kashgarian, M., Mensing, S., 1997. Nearly synchronousclimate change in the Northern Hemisphere during the last glacial termination.Nature 388, 263–265.
Benson, L.V., Lund, S.P., Burdett, J.W., Kashgarian, M., Rose, T.P., Smoot, J.P., Schwartz, M.,1998. Correlation of Late-Pleistocene lake-level oscillations in Mono Lake,California, with North Atlantic climate events. Quat. Res. 49, 1–10.
Benson, L., Kashgarian, M., Rye, R., Lund, S., Paillet, F., Smoot, J., Kester, C., Mensing, S.,Medo, D., Linström, S., 2002. Holocene multidecadal and multicentennial droughtsaffecting northern California and Nevada. Quat. Sci. Rev. 21, 659–682.
Benson, L., Lund, S., Negrini, R., Linsley, B., Zic, M., 2003. Response of North AmericanGreat Lakes to Dansgaard-Oeschger oscillations. Quat. Sci. Rev. 22, 2239–2251.
Bond, G., Kromer, B., Beer, J., Muscheler, R., Evans, M.N., Showers, W., Hoffman, S., Lotti-Bond, R., Hajdas, I., Bonani, G., 2001. Persistent solar influence on north Atlanticclimate during the Holocene. Science 294, 2130–2136.
Bowen,O.E., 1973. TheMineral Economics of the Carbonate Rocks: Limestone andDolomiteResources of California. California Division of Mines and Geology, Sacramento.
Broecker, W., 2003. Does the trigger for abrupt climate change reside in the ocean or inthe atmosphere. Science 300, 1519–1522.
Bromwich, D.H., Toracinta, E.R., Wei, H.L., Oglesby, R.J., Fastook, J.L., Hughes, T.J., 2004.PolarMM5 simulations of thewinter climate of the Laurentide Ice Sheet at the LGM.J. Climate 17, 3415–3433.
Bromwich, D.H., Toracinta, E.R., Oglesby, R.J., Fastook, J.L., Hughes, T.J., 2005. LGMsummer climate on the southern margin of the Laurentide Ice Sheet: wet or dry?J. Climate 18, 3317–3338.
Brook, G.A., Ellwood, B.B., Railsback, L.B., Cowart, J.B., 2006. A 164 ka record ofenvironmental change in the American Southwest from a Carlsbad Cavernspeleothem. Palaeogeogr. Palaeoclimatol. Palaeoecol. 237, 483–507.
Cheng, H., Edwards, R.L., Hoff, J., Gallup, C.D., Richards, D.A., Asmerom, Y., 2000. Thehalf-lives of uranium-234 and Thorium-230. Chem. Geol. 169, 17–33.
Clark, D.H., 2003. Complex timing and patterns of glaciation in the American Cordilleraduring Termination I. XVI INQUA Congress Programwith Abstracts. Paper 88-4, 231.
Clark, P.U., Bartlein, P.J., 1995. Correlation of late Pleistocene glaciation in the westernUnited States with North Atlantic Heinrich events. Geology 23, 483–486.
Clark, D.H., Gillespie, A.R., 1997. Timing and significance of Late-Glacial and Holocenecirque glaciation in the Sierra Nevada, California. Quat. Int. 38/39, 21–38.
Clark, W.B., Lydon, P.A., 1962. Mines and Mineral Resources of Calaveras County,California. California Division of Mines and Geology, San Francisco.
Cole, K., 1983. Late Pleistocene vegetation of Kings Canyon, Sierra Nevada, California.Quat. Res. 19, 117–129.
442 J.L. Oster et al. / Earth and Planetary Science Letters 288 (2009) 434–443

Author's personal copy
Cruz Jr., F.W., Burns, S.J., Karmann, I., Sharp, W.D., Vuille, M., Ferrari, J.A., 2006. Astalagmite record of changes in atmospheric circulation and soil processes in theBrazilian subtropics during the Late Pleistocene. Quat. Sci. Rev. 25, 2749–2761.
Dansgaard, W., 1964. Stable isotopes in precipitation. Telus 16, 436–468.Dansgaard, W., Johnsen, S.J., Clausen, H.B., Dahl-Jensen, D., Gundestrup, N.S., Hammer,
C.U., Hvidberg, C.S., Steffensen, J.P., Sveinbjörnsdottir, A.E., Jouzel, J., Bond, G., 1993.Evidence for general instability of past climate from a 250-year ice core record.Nature 364, 218–220.
Davis, O.K., 1999. Pollen analysis of Tulare Lake, California: Great Basin-like vegetation inCentral California during the full-glacial and early Holocene. Rev. Palaeobot. Palynol.107, 249–257.
deMenocal, P., Ortiz, J., Guilderson, T., Adkins, J., Sarnthein, M., Baker, L., Yarusinksy, M.,2000. Abrupt onset and termination of the African Humid Period: rapid responsesto gradual insolation forcing. Quat. Sci. Rev. 19, 347–361.
Denniston, R.F., Asmerom, Y., Polyak, V., Dorale, J.A., Carpenter, S.J., Trodick, C., Hoye, B.,Gonzálex, L.A., 2007. Synchronous millennial-scale climatic changes in the GreatBasin and the North Atlantic during the last interglacial. Geology 35, 619–622.
Dorale, J.A., Edwards, R.L., Ito, E., Gonzalez, L.A., 1998. Climate and vegetation history ofthe midcontinent from 75 to 25 ka: a speleothem record from Crevice Cave,Missouri, USA. Science 282, 1871–1874.
Edwards, R.L., Chen, J.H., Wasserburg, G.J., 1987. 238U–234U–230Th–232Th systemat-ics and the precise measurement of time over the past 500, 000 years. Earth Planet.Sci. Lett. 81, 175–192.
Ellwood, B.B., Gose, W.A., 2006. Heinrich H1 and 8200 yr BP climate events recorded inHall's Cave, Texas. Geology 34, 753–756.
Fairchild, I.J., Borsato, A.F., Frisia, S., Hawkesworth, C.J., Huang, Y., McDermott, F., Spiro, B.,2000. Controls on trace element (Sr–Mg) compositions of carbonate cave waters:implications for speleothem climatic records. Chemical Geology 166, 255–269.
Fleming, K., Johnston, P., Zwartz, D., Yokoyama, Y., Lambeck, K., Chappell, J., 1998.Refining the eustatic sea-level curve since the last glacial maximum using far- andintermediate-field sites. Earth Planet. Sci. Lett. 163, 327–342.
Frappier, A.B., Sahagian, D., Carpenter, S.J., González, L.A., Frappier, B.R., 2007. Stalagmitestable isotope record of recent tropical cyclone events. Geology 35, 111–114.
Frisia, S., Borsato, A., Fairchild, I.J., McDermott, F., 2000. Calcite fabrics, growthmechanisms, and environments of formation in speleothems from the Italian Alpsand Southwestern Ireland. J. Sed. Res. 70, 1183–1196.
Genty, D., Blamart, D., Ouahdi, R., Gilmour, M., Baker, A., Jouzel, J., Van-Exter, S., 2003.Precise dating of Dansgaard-Oeschger climate oscillations in Western Europe fromstalagmite data. Nature 421, 833–837.
Genty,D., Blamart, D.,Ghaleb, B., Plagnes, V., Causse, Ch., Bakalowicz,M., Zouari, K., Chkir,N.,Hellstrom, J.,Wainer, K., Bourges, F., 2006. Timing anddynamics of the last deglaciationfrom European and North African δ13C stalagmite profiles— comparison with Chineseand South Hemisphere stalagmites. Quat. Sci. Rev. 25, 2118–2142.
Gosse, J.C., Evenson, E.B., Klein, J., Lawn, B., Middleton, R., 1995. Precise cosmogenic Be-10 measurements in western North America — support for a global Younger Dryascooling. Geology 23, 877–880.
Hellstrom, J., 2006. U–Th dating of speleothems with high initial 230Th usingstratigraphical constraint. Quat. Geochronol. 1, 289–295.
Hellstrom, J.C., McCulloch,M.T., 2000. Multi-proxy constraints on the climatic significanceof trace element records from a New Zealand speleothem. Earth Planet. Sci. Lett. 179,287–297.
Hemming, S.R., 2004. Heinrich events:massive late Pleistocenedetritus layers of theNorthAtlantic and their global climate imprint. Rev. Geophys. 42, RG1005. doi:10:1029/2003RG000128.
Hendy, C.H., 1971. The isotopic geochemistry of speleothems — I. The calculation of theeffects of different modes of formation on the isotopic composition of speleothems andtheir applicability as palaeoclimatic indicators. Geochim. Cosmochim.Acta 35, 801–824.
Hendy, I.L., Kennett, J.P., Roark, E.B., Ingram, B.L., 2002. Apparent synchroneity ofsubmillennial scale climate events between Greenland and Santa Barbara Basin,California from 30–10 ka. Quat. Sci. Rev. 21, 1167–1184.
Howell, P., Pisias, N., Ballance, J., Baughman, J., Ochs, L., 2006. ARAND Time-SeriesAnalysis Software. Brown University, Providence, R.I.
Kienast, M., Kienast, S.S., Calvert, S.E., Eglinton, T.I., Mollenhauer, G., Francois, R., Mix, A.C.,2006. Eastern Pacific cooling and Atlantic overturning circulation during the lastdeglaciation. Nature 443, 846–849.
Kim, S.-T., O'Neil, J.R., 1997. Equilibrium and nonequilibrium oxygen isotope effects insynthetic carbonates. Science 61, 3461–3475.
Kim, S.-J., Crowley, T.J., Erickson, D.J., Govindasamy, B., Duffy, P.B., Lee, B.Y., 2008. High-resolution climate simulation of the last glacial maximum. Clim. Dyn. 31, 1–6.
Kutzbach, J.E., Wright Jr., H.E., 1985. Simulation of the climate of 18,000 years BP.Results for the North America/North Atlantic/European sector and comparisonwith the geologic record of North America. Quat. Sci. Rev. 4, 147–187.
Labeyrie, L., 2000. Glacial climate instability. Science 290, 1905–1907.Lea, D.W., Pak, D.K., Peterson, L.C., Hughen, K.A., 2003. Synchroneity of tropical and high-
latitudeAtlantic temperatures over the last glacial termination. Science 301, 1361–1364.Lin, J.C., Broecker, W.S., Hemming, S.R., Hajdas, I., Anderson, R.F., Smith, G.I., Kelley, M.,
Bonani, G., 1998. A reassessment of U–Th and 14C ages for late-glacial high-frequency hydrological events at Searles Lake, California. Quat. Res. 49, 11–23.
Lorens, R.B., 1981. Sr, Cd, Mn, and Co distribution coefficients in calcite as a function ofcalcite precipitation rate. Geochim. Cosmochim. Acta 45, 553–561.
Ludwig, K.R., 2003. Using Isoplot/Ex, Version 2.01: a geochronological toolkit forMicrosoft Excel. Berkeley Geochronology Center Special Publication, vol. 1a.Berkeley Geochronology Center, Berkeley, California. 47 pp.
Ludwig, K.R., Wallace, A.R., Simmons, K.R., 1985. The Schwartzwalder uranium deposit,II: age of uraniummineralization and Pb-isotope constraints on genesis. Econ. Geol.80, 1858–1871.
MacDonald, G.M., Moser, K.A., Bloom, A.M., Porinchu, D.F., Potito, A.P., Wolfe, B.B.,Edwards, T.W.D., Petel, A., Orme, A.R., Orme, A.J., 2008. Evidence of temperaturedepression and hydrological variations in the eastern Sierra Nevada during theYounger Dryas stade. Quat. Res. 70, 131–140.
Machel, H.G., Cavell, P.A., Patey, K.S., 1996. Isotopic evidence for carbonate cementationand recrystallization, and for tectonic expulsion of fluids into the Western CanadaSedimentary Basin. Geol. Soc. Am. Bull. 108, 1108–1119.
Manabe, S., Stouffer, R.J., 1988. Two stable equilibria of a coupled ocean-atmospheremodel. J. Climate 1, 841–866.
McDermott, F., 2004. Palaeo-climate reconstruction from stable isotope variation inspeleothems: a review. Quat. Sci. Rev. 23, 901–918.
Meese, D.A., Gow, A.J., Alley, R.B., Zielinski, G.A., Grootes, P.M., Ram, M., Taylor, K.C.,Mayewski, P.A., Bolzan, J.F., 1997. The Greenland ice sheet project 2 depth-agescale: methods and results. J. Geophys. Res. 102, 26,411–26,423.
Mensing, S.A., 2001. Late-Glacial and early Holocene vegetation and climate changenear Owens Lake, Eastern California. Quat. Res. 55, 57–65.
Mickler, P.J., Banner, J.L., Stern, L., Asmerom, Y., Edwards, R.L., Ito, E., 2004. Stableisotope variations in modern tropical speleothems: evaluating equilibrium vs.kinetic isotope effects. Geochim. Cosmochim. Acta 68, 4381–4393.
Mickler, P.J., Stern, L.A., Banner, J.L., 2006. Large kinetic isotope effects in modernspeleothems. Geol. Soc. Am. Bull. 118, 65–81.
Mikolajewicz,U., Crowley,T.J., Schiller,A.,Voss, R., 1997.Modelling teleconnectionsbetweenthe North Atlantic and North Pacific during the Younger Dryas. Nature 387, 384–387.
Montañez, I.P., Osleger, D.A., Banner, J.L., Mack, L., Musgrove, M.L., 2000. Evolution ofthe Sr and C isotope composition of Cambrian oceans. GSA Today 10, 1–5.
Musgrove, M., Banner, J.L., Mack, L.E., Combs, D.M., James, E.W., Cheng, H., Edwards, R.L.,2001. Geochronology of late Pleistocene to Holocene speleothems from centralTexas: Implications for regional paleoclimate. Geol. Soc. Am. Bull. 113, 113–1543.
Oviatt, C.G., Miller, D.M., McGeehin, J.P., Zachary, C., Mahan, S., 2005. The Younger Dryasphase of the Great Salt Lake, Utah, USA. Palaeogeography, Palaeoclimatology,Palaeoecology 219, 263–284.
Owen, L.A., Finkel, R.C.,Minnich, R.A., Perez, A.E., 2003. Extreme southwesternmargin of lateQuaternary glaciation in North America: timing and controls. Geology 31, 729–732.
Peterson, L.C., Haug, G.H., Hughen, K.A., Röhl, U., 2000. Rapid changes in the hydrologiccycle of the tropical Altantic during the Last Glacial. Science 290, 1947–1951.
Phillips, L.C., Zreda, M., Plummer, M.A., Elmore, D., Clark, D.H., 2009. Glacial geology andchronology of Bishop Creek and vicinity, eastern Sierra Nevada, California. Geol.Soc. Am. Bull. 121, 1013–1033.
Polyak, V.J., Rasmussen, J.B.T., Asmerom, Y., 2004. Prolonged wet period in thesouthwestern United States through the Younger Dryas. Geology 32, 5–8.
Quade, J., Cerling, T.E., Bowman, J.R., 1989. Systematic variations in the carbon andoxygen isotopic composition of pedogenic carbonate along elevation transects inthe southern Great Basin, United States. Geol. Soc. Am. Bull. 101, 464–475.
Rozanski, K., Araguas-Araguas, L., Gonfiantini, R., 1993. Isotopic patterns in modernglobal precipitation. In: Swart, P.K., et al., (Eds.), Climate change in continentalisotope records: American Geophysical Union Monographs. p. 1–36.
Seager, R., Ting,M.,Held, I., Kushnir, Y., Lu, J., Vecchi, G.,Huang, H.-P., Harnik, N., Leetmaa, A.,Lau,N.-C., Li, C., Velez, J., Naik,N., 2007.Model projectionsof an imminent transition to amore arid climate in southwestern North America. Science 316, 1181–1184.
Sewall, J.O., 2005. Precipitation shifts over Western North America as a result ofdeclining Arctic sea ice cover: the coupled system response. Earth Interact. 9 (26).
Sewall, J.O., Sloan, L.C., 2004. Disappearing Arctic sea ice reduces available water in theAmerican west. Geophys. Res. Lett. 31. doi:10.1029/2003GL019133.
Short, H.W., 1975. The geology of Moaning Cave, Calaveras County, California. Calif.Geol. 28, 195–201.
Stuiver, M., Grootes, P.M., 2000. GISP2 oxygen isotope ratios. Quat. Res. 53, 277–284.Thompson, R.S., Whitlock, C., Bartlein, P.J., Harrison, S.P., Spaulding, W.G., 1993. Climatic
changes in the western United States since 18,000 yr B.P. In: WrightJr. Jr., H.E.,Kutzbach, J.E., WebbIII III, T., Ruddiman, W.F., Street-Perrott, F.A., Bartlein, P.J.(Eds.), Global Climates since the Last Glacial Maximum. University of MinnesotaPress, Minneapolis. 569 pp.
Vacco, D.A., Clark, P.U., Mix, A.C., Cheng, H., Edwards, R.L., 2005. A speleothem record ofYounger Dryas cooling, Klamath Mountains, Oregon, USA. Quat. Res. 64, 249–256.
Vaks, A., Bar-Matthews, M., Ayalon, A., Schilman, B., Gilmour, M., Hawkesworth, C.J.,Frumkin, A., Kaufman, A., Matthews, A., 2003. Paleoclimate reconstruction based onthe timing of speleothem growth and oxygen and carbon isotope composition in acave located in the rainshadow in Israel. Quat. Res. 59, 182–193.
Vellinga, M., Wood, R.A., 2002. Global climatic impacts of a collapse of the Atlanticthermohaline circulation. Clim. Change 54, 251–267.
vonGrafenstein, U., Erlenkeuser, H., Brauer, A., Jouzel, J., Johnsen, S.J., 1999. Amid-Europeandecadal isotope-climate record from15,500 to5000 years B.P. Science284,1654–1657.
Wang, Y.J., Cheng, H., Edwards, R.L., An, Z.S., Wu, J.Y., Shen, C.-C., Dorale, J.A., 2001. Ahigh-resolution absolute-dated Late Pleistocene monsoon record from Hulu Cave,China. Science 294, 2345–2348.
Wang, X., Auler, A.S., Edwards, R.L., Cheng, H., Cristalli, P.S., Smart, P.L., Richards, D.A.,Shen, C.-C., 2004. Wet periods in northeastern Brazil over the past 210kyr linked todistant climate anomalies. Nature 432, 740–743.
Wang, Y., Cheng, H., Edwards, R.L., He, Y., Kong, X., An, Z., Wu, J., Kelly, M.J., Dykoski, C.A.,Li, X., 2005. The Holocene Asian Monsoon: links to solar changes and North Atlanticclimate. Science 308, 854–857.
Winograd, I.J., Landwehr, J.M., Coplen, T.B., Sharp, W.D., Riggs, A.C., Ludwig, K.R.,Kolesar, P.T., 2006. Devils Hole, Nevada, δ18O record extended to the mid-Holocene.Quat. Res. 66, 202–212.
Yuan, D.X., Cheng, H., Edwards, R.L., Dykoski, C.A., Kelly, M.J., Zhang, M.L., Qing, J.M., Lin,Y.S., Wang, Y.J., Wu, J.Y., Dorale, J.A., An, Z.S., Cai, Y.J., 2004. Timing, duration, andtransitions of the Last Interglacial Asian Monsoon. Science 304, 575–578.
443J.L. Oster et al. / Earth and Planetary Science Letters 288 (2009) 434–443