auto abs index: in the auto abs drivers seat8a5e0ff6... · auto abs index: in the auto abs...
TRANSCRIPT

Index
www.fitchratings.com August 2, 2016
U.S.A.
2Q16
Auto ABS Index: In the Auto ABS Driver’s Seat
At a Glance:
Prime Auto Loan ABS
Measure (%) 2Q16 2Q15 1Q16
60+ days delinquencies 0.36 0.31 0.38
Annualized net loss 0.47 0.35 0.62
At a Glance:
Subprime Auto Loans ABS
Measure (%) 2Q16 2Q15 1Q16
60+ days delinquencies 4.07 3.66 4.15
Annualized net loss 6.32 5.44 8.58
Contacts
Hylton N. Heard
+1 212 908-0214
John Bella, Jr.
+1 212 908-0243
Related Research
Fitch Fundamentals Index — U.S. (July 2016)
Auto ABS Index — U.S.A. 2Q16 Related Ratings (July 2016)
Solid 2Q16 Auto ABS Performance: Both prime and
subprime ANL declined throughout the quarter while
delinquencies were relatively stable.
Economic Conditions Largely Positive: Low interest
rates and gas prices, continued job growth and rising
equity prices all supported asset performance in
early summer.
Used Vehicle Values Surprisingly Strong: Despite a
surge in vehicles hitting the used vehicle market thus
far in 2016, wholesale vehicle pricing is still healthy,
supporting both auto loan and lease ABS.
Positive Rating Actions Continued: Despite gradual
pressure on auto ABS and rising loss rates in 2016,
Fitch Ratings continues to issue rating upgrades on
subordinate classes of notes in 2016, on par with the
level issued in 2015.
Geopolitical Events Not Affecting U.S. Auto ABS: To date,
there has been no impact from recent global events,
including the recent terrorist attacks or Brexit. Fitch
expects auto ABS will not be affected unless the fall-out
touches U.S. economic conditions or growth directly.

Index
Auto ABS Index: In the Auto ABS Driver’s Seat 2Q16 2
August 2, 2016
U.S. Auto Loan ABS
2016 Outlooks
Prime Asset Performance: Stable
Prime Rating Performance: Positive
Subprime Asset Performance: Stable
Subprime Rating Performance: Stable
Related Criteria
Rating Criteria for Rating U.S. Auto Loan ABS (March
2016)
Stable Unemployment: Unemployment levels ended
2015 at 5.0%, down from 5.6% at YE14. More recently,
the unemployment rate reached 4.9% as of June 2016.
The stable job market is a key contributor to stable
delinquency performance despite the normalization
trends observed. Fitch expects unemployment to remain
stable for the rest of 2016.
Prime Vintages Losses Higher: 2013–2015 vintages
are tracking above the strong 2010–2012 period,
which averaged CNL of approximately 0.56%.
Currently, 2013 and 2014 losses are extrapolating to
0.81% and 0.96%, respectively.
Further Normalization for 2015: The 2015 vintage,
although only six months seasoned, is extrapolating to a
loss level of approximately 1.17%. Despite the increases
in losses, Fitch characterizes the prime sector as
undergoing a period of normalization, with losses still well
below peak levels experienced in 2007 and 2008.
Positive Rating Outlook for 2016: ABS pools
performed well in 2015 with no downgrades. This is
expected to continue as Fitch maintains a positive
outlook for ratings performance, even as loss rates are
expected to increase marginally.

Index
Auto ABS Index: In the Auto ABS Driver’s Seat 2Q16 3
August 2, 2016
U.S. Prime Auto Loan ABS
Delinquencies Slowly Rose: Prime 60+ day delinquencies
peaked at 0.47% in 1Q16 but have since stabilized at 0.36% in
2Q16. However, this represents a 16% and 24% increase from
the same period in 2015 and 2014, respectively.
ANL Continued to Climb: Similarly, ANL rose to 0.69% in 1Q16,
the highest on record since February 2011. Losses have since
slowed, ending 2Q16 at 0.47%, better but elevated from recent
prior years. Fitch expects losses to rise in 2016 closer to levels
observed in 2004–2006, driven by weaker credit metrics and
pressures for used vehicle values.
Rising Supply Pressured Used Vehicle Values: Rising used vehicle
supply in 2016 is expected to pressure used vehicle values,
translating into weaker recoveries and higher losses in prime ABS.
Cars continued to feel the most stress in terms of weaker values,
as trucks and SUVs benefit from low gas prices. Fitch has
observed greater segment diversification in a number of ABS
portfolios which will likely soften the negative impact of weaker
car performance.

Index
Auto ABS Index: In the Auto ABS Driver’s Seat 2Q16 4
August 2, 2016
U.S. Prime Auto Loan ABS (continued)
Proxies Addressed Shifting Collateral Trends: Strong new vehicle
sales promoted greater competition among lenders, resulting in
some weaker credit metrics in ABS pools. Fitch’s loss proxies have
increased over the past two years to account for potentially weaker
loss performance driven by weaker collateral attributes.
Vintage Losses Stable: ABS CNL vintage performance displayed
marginal increases but are well below peak levels. To date, 2015
showed CNL of 0.47%, trending in line with recent stronger
vintages.
Higher Enhancement: Senior hard credit enhancement has
risen slightly thus far in 2016 when compared with recent years,
nearly reaching 6% as of 2Q16. The observed increase is
partially to account for weaker collateral attributes as well as
weaker perceived performance.
No Major Concerns in Prime Sector: Despite increasing losses
and weaker collateral trends, ABS performance is still comfortably
within Fitch’s expectations. The agency maintains its positive
rating outlook with a stable outlook for asset performance
heading into 3Q16.
Index
Auto ABS Index: In the Auto ABS Driver’s Seat 2Q16 5
August 2, 2016
U.S. Subprime Auto Loan ABS
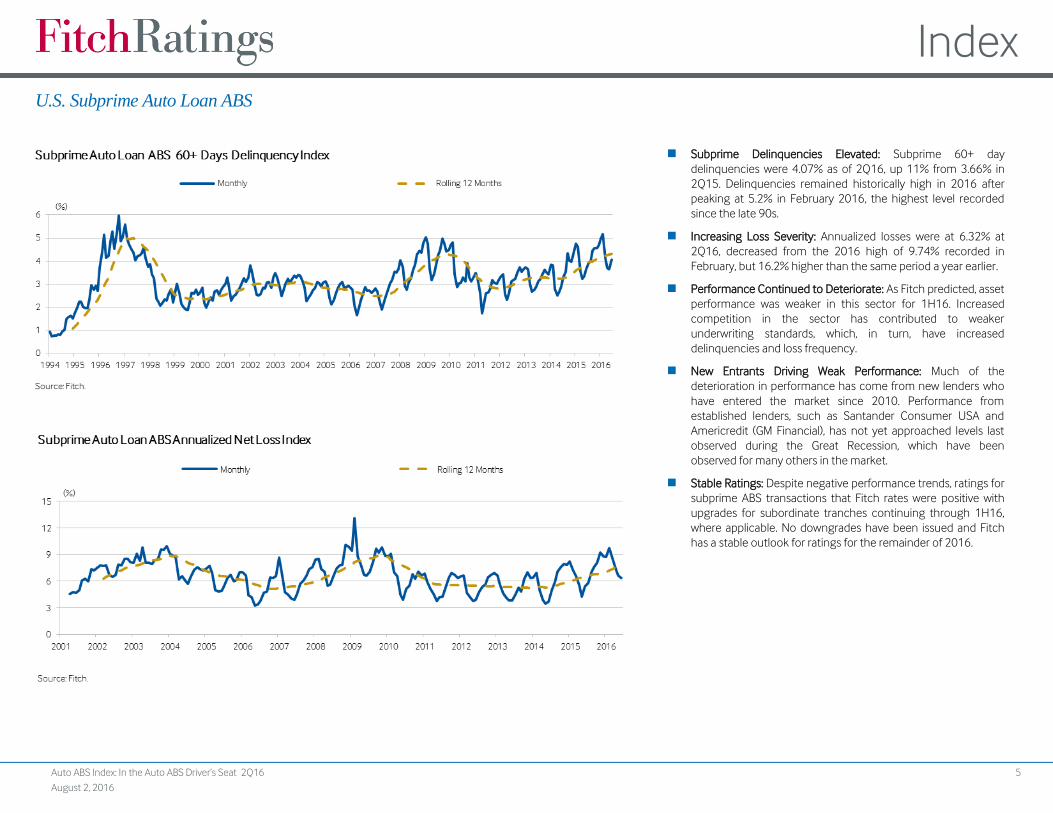
Subprime Delinquencies Elevated: Subprime 60+ day
delinquencies were 4.07% as of 2Q16, up 11% from 3.66% in
2Q15. Delinquencies remained historically high in 2016 after
peaking at 5.2% in February 2016, the highest level recorded
since the late 90s.
Increasing Loss Severity: Annualized losses were at 6.32% at
2Q16, decreased from the 2016 high of 9.74% recorded in
February, but 16.2% higher than the same period a year earlier.
Performance Continued to Deteriorate: As Fitch predicted, asset
performance was weaker in this sector for 1H16. Increased
competition in the sector has contributed to weaker
underwriting standards, which, in turn, have increased
delinquencies and loss frequency.
New Entrants Driving Weak Performance: Much of the
deterioration in performance has come from new lenders who
have entered the market since 2010. Performance from
established lenders, such as Santander Consumer USA and
Americredit (GM Financial), has not yet approached levels last
observed during the Great Recession, which have been
observed for many others in the market.
Stable Ratings: Despite negative performance trends, ratings for
subprime ABS transactions that Fitch rates were positive with
upgrades for subordinate tranches continuing through 1H16,
where applicable. No downgrades have been issued and Fitch
has a stable outlook for ratings for the remainder of 2016.

Index
Auto ABS Index: In the Auto ABS Driver’s Seat 2Q16 6
August 2, 2016
U.S. Subprime Auto Loan ABS (continued)
2012–2015 Outpace 2009–2011: 2012–2015 vintages loss
performance continues to outpace the strong 2009–2011
vintages. CNL are currently projecting between 11% and 15%,
higher compared with 2009–2011 vintages, which have
performed in the 8% and 9.5% range.
Strong Subprime ABS Issuance: The sector remained active
through 1H16, with total issuance amounting to $13.5 billion
compared with $15.3 billion at the same time last year. Fitch
expects total issuance in 2016 to be lower than 2015 as sales
levels should be strong yet slightly than the near-peak 2015
sales volumes.
Conservative Credit Approach to Sector: Fitch only rates two issuers
in the subprime sector, GMF’s AmeriCredit (AMCAR) and
Santander Consumer USA’s (SCUSA) SDART platforms. Click here
to view Fitch’s report titled “Subprime Auto Lending Exposed to
Domino Risk,” dated September 2014, for more information on
the agency’s approach and opinion on the subprime auto sector.
Index
Auto ABS Index: In the Auto ABS Driver’s Seat 2Q16 7
August 2, 2016
U.S. Auto Lease ABS
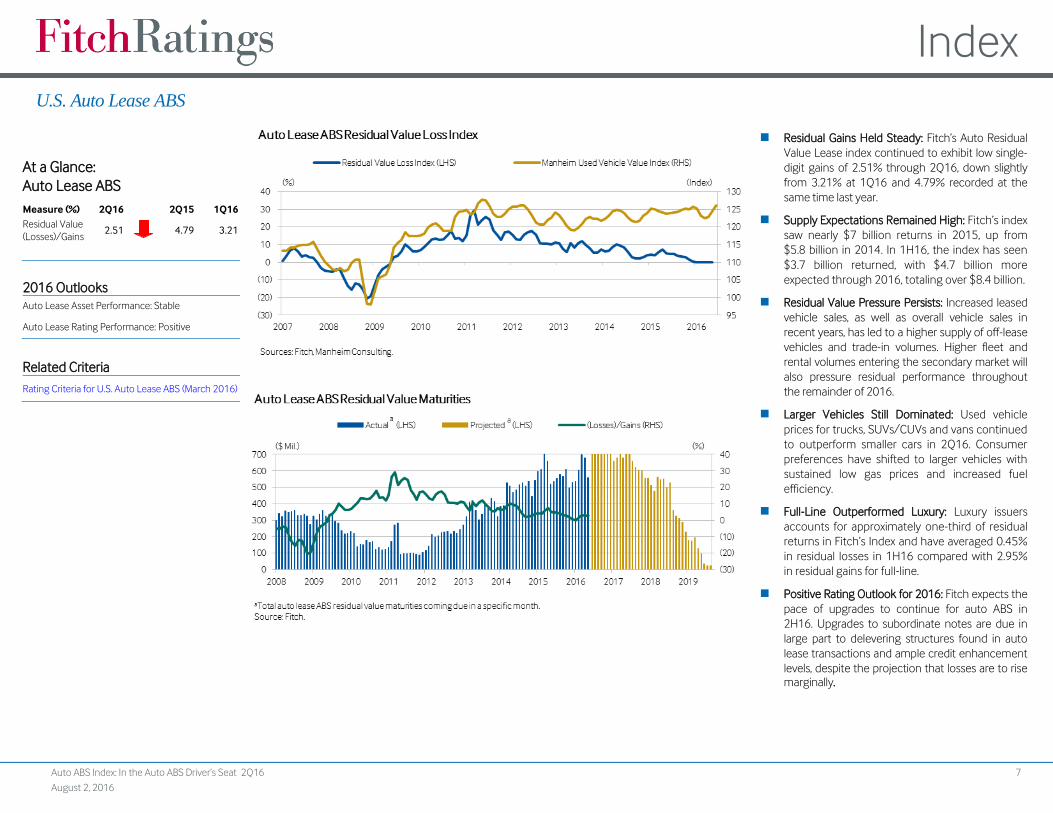
Residual Gains Held Steady: Fitch’s Auto Residual
Value Lease index continued to exhibit low single-
digit gains of 2.51% through 2Q16, down slightly
from 3.21% at 1Q16 and 4.79% recorded at the
same time last year.
Supply Expectations Remained High: Fitch’s index
saw nearly $7 billion returns in 2015, up from
$5.8 billion in 2014. In 1H16, the index has seen
$3.7 billion returned, with $4.7 billion more
expected through 2016, totaling over $8.4 billion.
Residual Value Pressure Persists: Increased leased
vehicle sales, as well as overall vehicle sales in
recent years, has led to a higher supply of off-lease
vehicles and trade-in volumes. Higher fleet and
rental volumes entering the secondary market will
also pressure residual performance throughout
the remainder of 2016.
Larger Vehicles Still Dominated: Used vehicle
prices for trucks, SUVs/CUVs and vans continued
to outperform smaller cars in 2Q16. Consumer
preferences have shifted to larger vehicles with
sustained low gas prices and increased fuel
efficiency.
Full-Line Outperformed Luxury: Luxury issuers
accounts for approximately one-third of residual
returns in Fitch’s Index and have averaged 0.45%
in residual losses in 1H16 compared with 2.95%
in residual gains for full-line.
Positive Rating Outlook for 2016: Fitch expects the
pace of upgrades to continue for auto ABS in
2H16. Upgrades to subordinate notes are due in
large part to delevering structures found in auto
lease transactions and ample credit enhancement
levels, despite the projection that losses are to rise
marginally.
At a Glance:
Auto Lease ABS
Measure (%) 2Q16 2Q15 1Q16
Residual Value
(Losses)/Gains 2.51
4.79 3.21
2016 Outlooks
Auto Lease Asset Performance: Stable
Auto Lease Rating Performance: Positive
Related Criteria
Rating Criteria for U.S. Auto Lease ABS (March 2016)

Index
Auto ABS Index: In the Auto ABS Driver’s Seat 2Q16 8
August 2, 2016
U.S. Dealer Floorplan ABS
MPRs Slowed Down: Fitch’s MPR Index stood at
37.42% as of 2Q16, down from 39.39% recorded a
year earlier. MPRs are still healthy but have slowed
due to an increase in off-lease vehicle volumes as
inventories have risen at certain brands.
Inventories in Check: Total vehicle days’ supply was
66 days (July 1, 2016), within the optimal 60-days
target, according to Automotive News. This was within
range of a year earlier although marginally higher.
Dealer Health Strong: A majority of dealers are
highly profitable in 2016 thanks to healthy new and
used sales despite slightly lower levels. Net profit as
a percentage of total sales was 2.3% in May, within
range of 2.5% a year earlier, according to NADA.
Dealer Defaults Zero: Most DFP ABS platforms rated
by Fitch have had zero dealer defaults in 2016 and
no trust losses to date this year.
Trucks/SUVs Robust, Cars Slowed: With low oil
prices, demand for trucks and SUVs was strong with
sales up while cars have suffered. Dealers typically
make more profits on these larger vehicle
segments, which helps offset slowdown in car sales
and profits.
At a Glance:
Dealer Floorplan ABS
Measure (%) 2Q16 2Q15 1Q16
Total MPR 37.42
39.39 35.41
Auto MPR 38.81
41.65 37.69
Diversified MPR 29.85
31.89 24.86
2016 Outlooks
Dealer Floorplan Asset Performance: Stable
Dealer Floorplan Rating Performance: Stable
Related Criteria
Global Rating Criteria for Dealer Floorplan ABS
(May 2016)

Index
Auto ABS Index: In the Auto ABS Driver’s Seat 2Q16 9
August 2, 2016
U.S. Used Vehicle Market
Used Vehicle Prices Stronger than Expected: After a very small
decline in March and April, the Manheim Used Vehicle Values
Index rebounded to 124.5 in May. This is in the upper range
recorded going back 20 years, and it is up YOY from 123.8 in
May 2015.
Rising Supply to Pressure Wholesale Values: While wholesale
values have outperformed expectations in early 2016, Fitch
expects that rising used vehicle supply from vehicle trade-ins
and lease returns will pressure loss severity and push auto ABS
CNL higher in the second half of 2016.
Trucks Still Strong in 2016: Despite the recent rebound in
gasoline prices, demand for trucks remains high and continues
to drive overall wholesale prices. Pricing for other segments
remains flat to down, according to Manheim.
Vehicle Inventories Low: At 66 days supply, dealer inventory
levels were low, which helped support high used vehicle prices.
Incentives Stable, for Now: Incentive spending was disciplined
in 2Q16 but may increase if sales plateau move forward, which
could dent ABS recoveries.
Index
Auto ABS Index: In the Auto ABS Driver’s Seat 2Q16 10
August 2, 2016
U.S. New Vehicle Sales
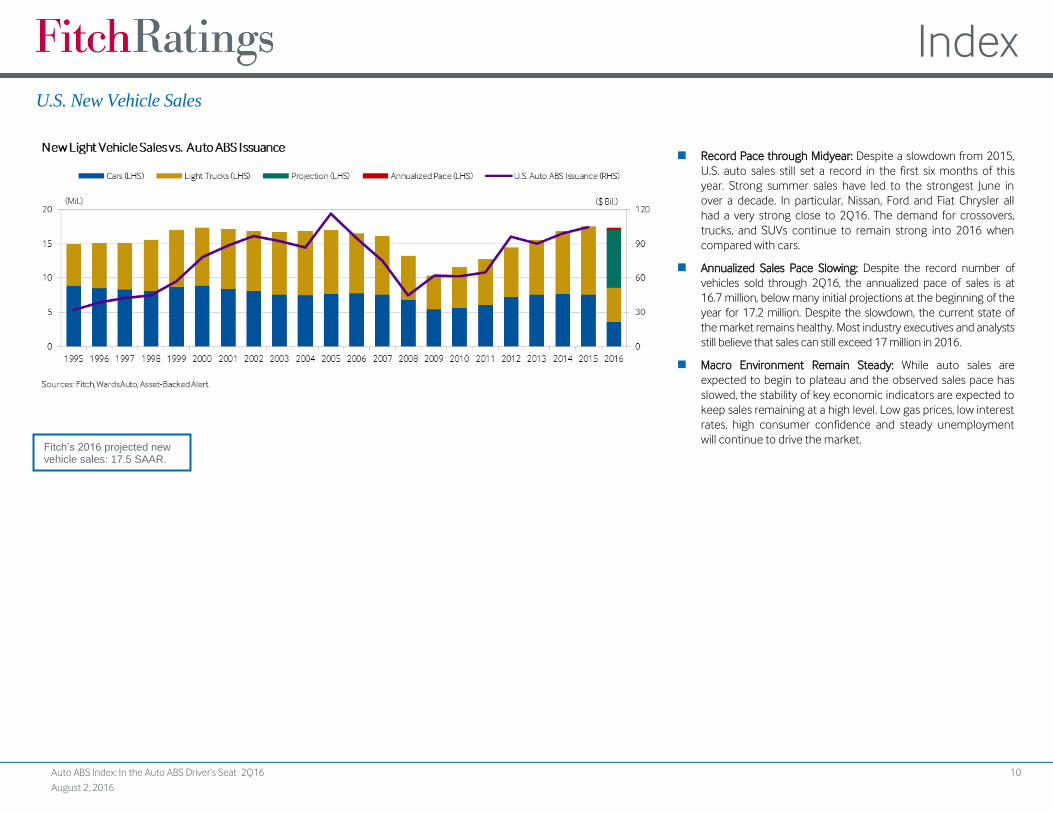
Record Pace through Midyear: Despite a slowdown from 2015,
U.S. auto sales still set a record in the first six months of this
year. Strong summer sales have led to the strongest June in
over a decade. In particular, Nissan, Ford and Fiat Chrysler all
had a very strong close to 2Q16. The demand for crossovers,
trucks, and SUVs continue to remain strong into 2016 when
compared with cars.
Annualized Sales Pace Slowing: Despite the record number of
vehicles sold through 2Q16, the annualized pace of sales is at
16.7 million, below many initial projections at the beginning of the
year for 17.2 million. Despite the slowdown, the current state of
the market remains healthy. Most industry executives and analysts
still believe that sales can still exceed 17 million in 2016.
Macro Environment Remain Steady: While auto sales are
expected to begin to plateau and the observed sales pace has
slowed, the stability of key economic indicators are expected to
keep sales remaining at a high level. Low gas prices, low interest
rates, high consumer confidence and steady unemployment
will continue to drive the market.
Fitch’s 2016 projected new vehicle sales: 17.5 SAAR.

Index
Auto ABS Index: In the Auto ABS Driver’s Seat 2Q16 11
August 2, 2016
U.S. Auto ABS Rating Actions
Transaction Class New Rating (Outlook) Previous Rating (Outlook)
AmeriCredit Automobile Receivables Trust 2012-4 D AAsf(Positive) Asf(Positive)
AmeriCredit Automobile Receivables Trust 2012-4 E Asf(Positive) BBBsf(Positive)
AmeriCredit Automobile Receivables Trust 2012-5 D AAsf(Positive) Asf(Positive)
AmeriCredit Automobile Receivables Trust 2012-5 E Asf(Positive) BBBsf(Positive)
AmeriCredit Automobile Receivables Trust 2014-4 B AAAsf(Stable) AAsf(Positive)
AmeriCredit Automobile Receivables Trust 2014-4 C AAsf(Positive) Asf(Positive)
CarMax Auto Owner Trust 2013-3 C AAAsf(Stable) AAsf(Positive)
Ford Credit Auto Owner Trust 2015-B B AAAsf(Stable) AAsf(Stable)
Ford Credit Auto Owner Trust 2015-B C AAsf(Positive) Asf(Stable)
Santander Drive Auto Receivables Trust 2014-1 C AAAsf(Stable) AAsf(Positive)
Santander Drive Auto Receivables Trust 2014-1 D AAsf(Positive) Asf(Positive)
Santander Drive Auto Receivables Trust 2014-1 E Asf.(Positive) BBBsf(Stable)
Santander Drive Auto Receivables Trust 2014-2 C AAAsf(Stable) AAsf(Positive)
Santander Drive Auto Receivables Trust 2014-2 D AAsf(Positive) Asf(Positive)
Santander Drive Auto Receivables Trust 2014-2 E Asf(Positive) BBBsf(Stable)
Susquehanna Auto Receivables Trust 2014-1 B AAsf(Positive) Asf(Positive)
World Omni Auto Receivables Trust 2013-A B AAAsf(Stable) AAsf(Positive)
Ford Credit Auto Lease Trust 2014-A B AAAsf(Stable) AAsf(Stable)
Ford Credit Auto Lease Trust 2014-A C AAsf(Positive) Asf(Stable)
Ford Credit Auto Lease Trust 2014-B B AAAsf(Stable) AAsf(Positive)
GM Financial Automobile Leasing Trust 2014-1 B AAAsf(Stable) AAsf(Stable)
GM Financial Automobile Leasing Trust 2014-1 C AAsf(Positive) Asf(Stable)
GM Financial Automobile Leasing Trust 2014-1 D Asf(Positive) BBBsf(Stable)
Hyundai Auto Lease Securitization Trust 2014-A B AAAsf(Stable) AAsf(Positive)
Hyundai Auto Lease Securitization Trust 2014-B B AAAsf(Stable) AAsf(Stable)
Asset Performance Not Slowing Positive Actions: Despite signs
of softening performance with losses rising slowly, Fitch
expects the pace of upgrades to continue for the remainder
of 2016.
Subprime Rating Upgrades: Despite deterioration in asset
performance in the subprime sector, Fitch continued to issue
upgrades on both GMF’s AMCAR and SCUSA’s SDART ABS
platforms through 2Q16. Losses for rated transactions have
been below expectations to date, and loss coverage growth has
been consistently strong.
VW AG Placed on Watch: Fitch downgraded VW’s corporate
rating in November 2015 to ‘BBB+’ from ‘A’, and placed them
on Rating Outlook Negative. Click here to view the rating
action, or click for further press releases related to the
company/auto sector.
Related Ratings: Click here for additional data on new ratings
and related corporate ratings.
Note: All data in this report are as of June 30, 2016.

Index
Auto ABS Index: In the Auto ABS Driver’s Seat 2Q16 12
August 2, 2016
Index Methodology and Definitions
Auto Loans
Index Composition: Prime index comprises an outstanding balance of $57.2 billion, totaling 124 transactions. The subprime index comprises an outstanding balance of $37.8 billion, totaling 139 transactions.
Delinquent Receivables: When the borrower fails to make a payment on its debt obligation by the specified due date, the outstanding debt obligation is considered delinquent. Delinquency rates are important
leading performance indicators for auto transactions, since a large portion of chargeoffs generally occurs through contractual delinquency. Fitch follows delinquency rates on a regular basis to assess the future
performance of the auto transactions.
60+ Day Delinquency Index: Measures the percentage of trust receivables associated with accounts that are 60 or more days delinquent, expressed as a non-annualized percentage of total receivables outstanding.
Annualized Net Losses (ANL): Monthly gross losses less any recoveries expressed as an annualized percentage of the current receivables outstanding.
ANL Index: Measures the weighted average annualized monthly net losses for a set of prime/subprime Fitch-rated and non-Fitch-rated deals.
Cumulative Net Losses (CNL): Accumulated losses net of recoveries.
Month over Month (MOM): Comparison of data from previous month to current month.
Year over Year (YOY): Comparison of data from previous year to current year.
Auto Leases
Index Composition: Comprises outstanding notional balance of $28.4 billion, totaling 39 outstanding transactions.
Residual Value: The projected value of a fixed asset at maturity that is determined at lease inception.
Residual Value Loss Index: Measures monthly residual losses and gains among U.S. auto lease ABS pools originated by various domestic and foreign captive finance companies. Periodic residual losses are
calculated as the sum of all residual losses each month, divided by the securitized value of the forecast residuals returned that same month.
Residual Value Maturities: The frequency chart shows securitized residual value of returned vehicles in the index plotted against the residual value index. It also shows projected residual lease maturities for all Fitch-
rated lease transactions adjusted by each brand’s average turn-in rate.
Dealer Floorplan (DFP)
Index Composition: Comprises outstanding notional balance of $28.6 billion from seven different floorplan master trusts.
Monthly Payment Rate (MPR): Includes monthly collections of principal paid; it is stated as a percentage of the outstanding balance as of the beginning of the month.
MPR Index: Measures the rolling three-month average MPR of a set of Fitch-rated deals.

Index
Auto ABS Index: In the Auto ABS Driver’s Seat 2Q16 13
August 2, 2016
Fitch Ratings Auto ABS Group
John Bella, Jr.
Managing Director
+1 212 908-0243
Hylton N. Heard
Senior Director
+1 212 908-0214
Du Trieu
Senior Director
+1 312 368-2091
Peter Manofsky
Director
+1 312 368-2068
Margaret Rowe
Director
+1 312 368-3167
Joyce Fargas
Director
+1 212 908-0824
Kate Manion
Director
+1 212 908-0792
John Alberici
Associate Director
+1 212 908-0370
Timothy McNally
Associate Director
+1 212 908-0870
Thomas Kaiser
Associate Director
+1 312 368-3338
Puloma Mukherjee
Associate Director
+1 212 908-0131
Yun Tian
Associate Director
+1 212 908-0307
Brian Coffey
Associate Director
+1 212 908-0399
Andrew Tinari
Associate Director
+1 312 368-3127
Eric Orenstein
Analyst
+1 212 908-0245
Cole MacKenzie
Analyst
+1 212 908-0834
Caroline Isleib
Associate Analyst
+1 212 908-0745

Index
Auto ABS Index: In the Auto ABS Driver’s Seat 2Q16 14
August 2, 2016
ALL FITCH CREDIT RATINGS ARE SUBJECT TO CERTAIN LIMITATIONS AND DISCLAIMERS PLEASE READ THESE LIMITATIONS AND DISCLAIMERS BY FOLLOWING THIS LINK: HTTPS://FITCHRATINGS.COM/UNDERSTANDINGCREDITRATINGS. IN ADDITION, RATING DEFINITIONS AND THE TERMS OF USE OF SUCH RATINGS ARE AVAILABLE ON THE AGENCY'S PUBLIC WEB SITE AT WWW.FITCHRATINGS.COM. PUBLISHED RATINGS, CRITERIA, AND METHODOLOGIES ARE AVAILABLE FROM THIS SITE AT ALL TIMES. FITCH'S CODE OF CONDUCT, CONFIDENTIALITY, CONFLICTS OF INTEREST, AFFILIATE FIREWALL, COMPLIANCE, AND OTHER RELEVANT POLICIES AND PROCEDURES ARE ALSO AVAILABLE FROM THE CODE OF CONDUCT SECTION OF THIS SITE. FITCH MAY HAVE PROVIDED ANOTHER PERMISSIBLE SERVICE TO THE RATED ENTITY OR ITS RELATED THIRD PARTIES. DETAILS OF THIS SERVICE FOR RATINGS FOR WHICH THE LEAD ANALYST IS BASED IN AN EU-REGISTERED ENTITY CAN BE FOUND ON THE ENTITY SUMMARY PAGE FOR THIS ISSUER ON THE FITCH WEBSITE.
Copyright © 2016 by Fitch Ratings, Inc., Fitch Ratings Ltd. and its subsidiaries. 33 Whitehall Street, NY, NY 10004. Telephone: 1-800-753-4824, (212) 908-0500. Fax: (212) 480-4435. Reproduction or retransmission in whole or in part is prohibited except by permission. All rights reserved. In issuing and maintaining its ratings and in making other reports (including forecast information), Fitch relies on factual information it receives from issuers and underwriters and from other sources Fitch believes to be credible. Fitch conducts a reasonable investigation of the factual information relied upon by it in accordance with its ratings methodology, and obtains reasonable verification of that information from independent sources, to the extent such sources are available for a given security or in a given jurisdiction. The manner of Fitch’s factual investigation and the scope of the third-party verification it obtains will vary depending on the nature of the rated security and its issuer, the requirements and practices in the jurisdiction in which the rated security is offered and sold and/or the issuer is located, the availability and nature of relevant public information, access to the management of the issuer and its advisers, the availability of pre-existing third-party verifications such as audit reports, agreed-upon procedures letters, appraisals, actuarial reports, engineering reports, legal opinions and other reports provided by third parties, the availability of independent and competent third-party verification sources with respect to the particular security or in the particular jurisdiction of the issuer, and a variety of other factors. Users of Fitch’s ratings and reports should understand that neither an enhanced factual investigation nor any third-party verification can ensure that all of the information Fitch relies on in connection with a rating or a report will be accurate and complete. Ultimately, the issuer and its advisers are responsible for the accuracy of the information they provide to Fitch and to the market in offering documents and other reports. In issuing its ratings and its reports, Fitch must rely on the work of experts, including independent auditors with respect to financial statements and attorneys with respect to legal and tax matters. Further, ratings and forecasts of financial and other information are inherently forward-looking and embody assumptions and predictions about future events that by their nature cannot be verified as facts. As a result, despite any verification of current facts, ratings and forecasts can be affected by future events or conditions that were not anticipated at the time a rating or forecast was issued or affirmed.
The information in this report is provided “as is” without any representation or warranty of any kind, and Fitch does not represent or warrant that the report or any of its contents will meet any of the requirements of a recipient of the report. A Fitch rating is an opinion as to the creditworthiness of a security. This opinion and reports made by Fitch are based on established criteria and methodologies that Fitch is continuously evaluating and updating. Therefore, ratings and reports are the collective work product of Fitch and no individual, or group of individuals, is solely responsible for a rating or a report. The rating does not address the risk of loss due to risks other than credit risk, unless such risk is specifically mentioned. Fitch is not engaged in the offer or sale of any security. All Fitch reports have shared authorship. Individuals identified in a Fitch report were involved in, but are not solely responsible for, the opinions stated therein. The individuals are named for contact purposes only. A report providing a Fitch rating is neither a prospectus nor a substitute for the information assembled, verified and presented to investors by the issuer and its agents in connection with the sale of the securities. Ratings may be changed or withdrawn at any time for any reason in the sole discretion of Fitch. Fitch does not provide investment advice of any sort. Ratings are not a recommendation to buy, sell, or hold any security. Ratings do not comment on the adequacy of market price, the suitability of any security for a particular investor, or the tax-exempt nature or taxability of payments made in respect to any security. Fitch receives fees from issuers, insurers, guarantors, other obligors, and underwriters for rating securities. Such fees generally vary from US$1,000 to US$750,000 (or the applicable currency equivalent) per issue. In certain cases, Fitch will rate all or a number of issues issued by a particular issuer, or insured or guaranteed by a particular insurer or guarantor, for a single annual fee. Such fees are expected to vary from US$10,000 to US$1,500,000 (or the applicable currency equivalent). The assignment, publication, or dissemination of a rating by Fitch shall not constitute a consent by Fitch to use its name as an expert in connection with any registration statement filed under the United States securities laws, the Financial Services and Markets Act of 2000 of the United Kingdom, or the securities laws of any particular jurisdiction. Due to the relative efficiency of electronic publishing and distribution, Fitch research may be available to electronic subscribers up to three days earlier than to print subscribers.
For Australia, New Zealand, Taiwan and South Korea only: Fitch Australia Pty Ltd holds an Australian financial services license (AFS license no. 337123) which authorizes it to provide credit ratings to wholesale clients only. Credit ratings information published by Fitch is not intended to be used by persons who are retail clients within the meaning of the Corporations Act 2001.