automated geospatial watershed assessment (agwa): a gis ... agwa... · automated geospatial...
TRANSCRIPT
Automated Geospatial Watershed Automated Geospatial Watershed Assessment (AGWA): A GIS-Based Assessment (AGWA): A GIS-Based
Hydrologic Modeling Tool for Watershed Hydrologic Modeling Tool for Watershed AssessmentsAssessments
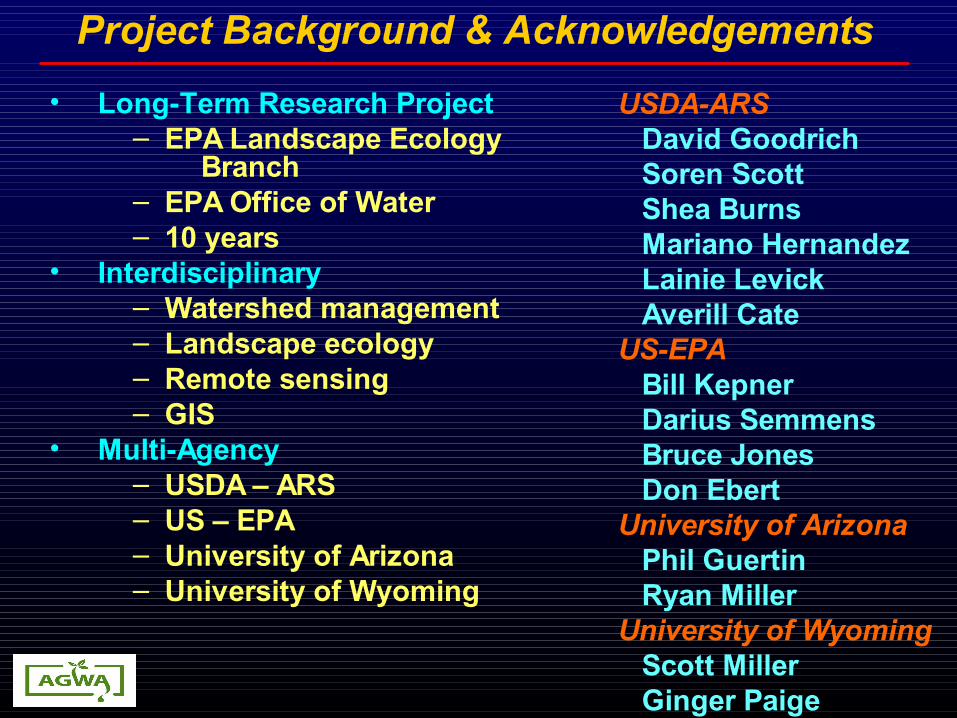
Project Background & Acknowledgements• Long-Term Research Project
– EPA Landscape Ecology Branch
– EPA Office of Water– 10 years
• Interdisciplinary– Watershed management– Landscape ecology– Remote sensing– GIS
• Multi-Agency– USDA – ARS– US – EPA– University of Arizona– University of Wyoming
USDA-ARS David Goodrich Soren Scott Shea Burns Mariano Hernandez Lainie Levick Averill CateUS-EPA Bill Kepner Darius Semmens Bruce Jones Don EbertUniversity of Arizona Phil Guertin Ryan MillerUniversity of Wyoming Scott Miller Ginger Paige

• AGWA Background
• System Features with emphasis on new functionality of the just released AGWA 1.5
• Selected case studies
• Future Directions
OVERVIEW
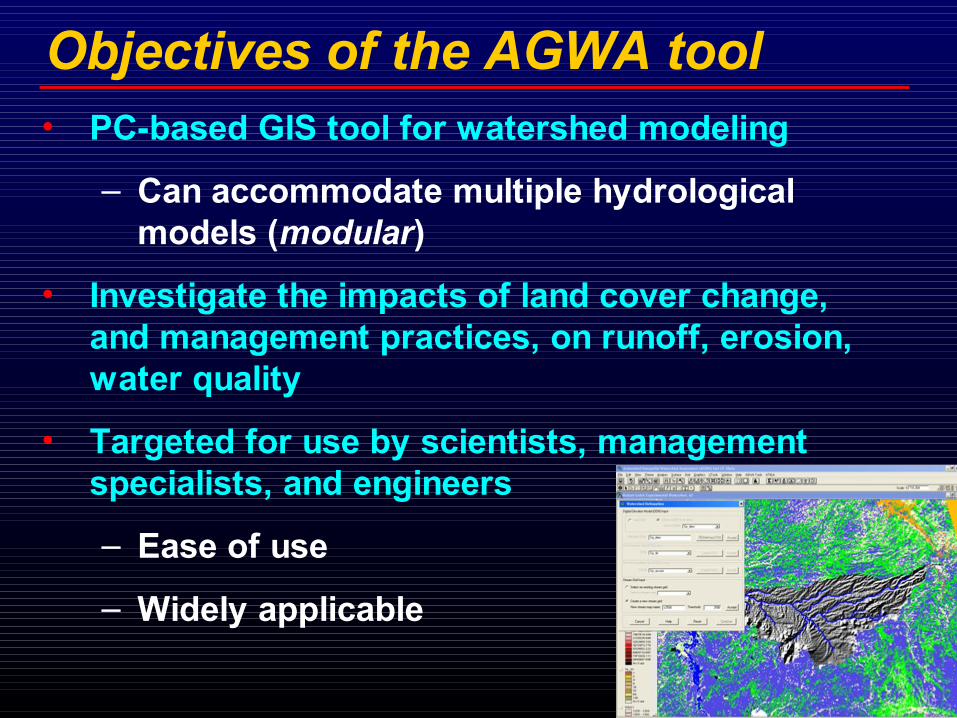
• PC-based GIS tool for watershed modeling
– Can accommodate multiple hydrological models (modular)
• Investigate the impacts of land cover change, and management practices, on runoff, erosion, water quality
• Targeted for use by scientists, management specialists, and engineers
– Ease of use
– Widely applicable
Objectives of the AGWA tool

• Simple, direct method for model parameterization
• Provide realistic, repeatable results
• Require basic, attainable GIS data– 30m USGS DEM (free, US coverage)– STATSGO, SURRGO, FAO soil data (US and global
coverage)– US-EPA NALC, MRLC, and GAP landscape data
• Useful for scenario development, alternative futures simulation work, and watershed assessments– Provide relative change when validation data is
insufficient
Objectives of the AGWA tool
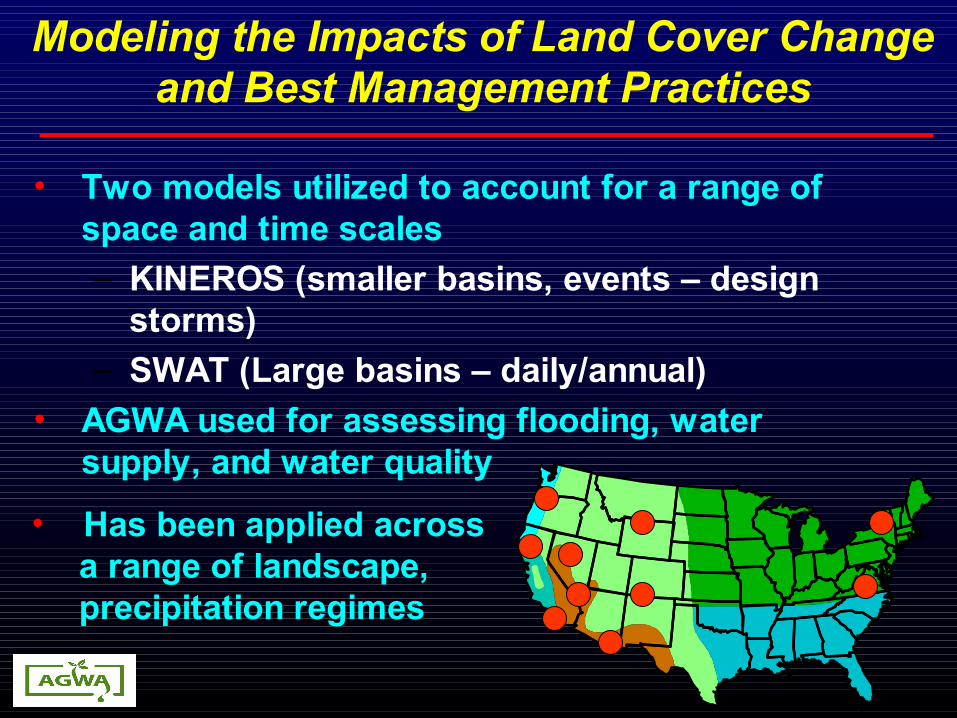
• Two models utilized to account for a range of space and time scales– KINEROS (smaller basins, events – design
storms)– SWAT (Large basins – daily/annual)
• AGWA used for assessing flooding, water supply, and water quality
Modeling the Impacts of Land Cover Changeand Best Management Practices
• Has been applied across a range of landscape, precipitation regimes
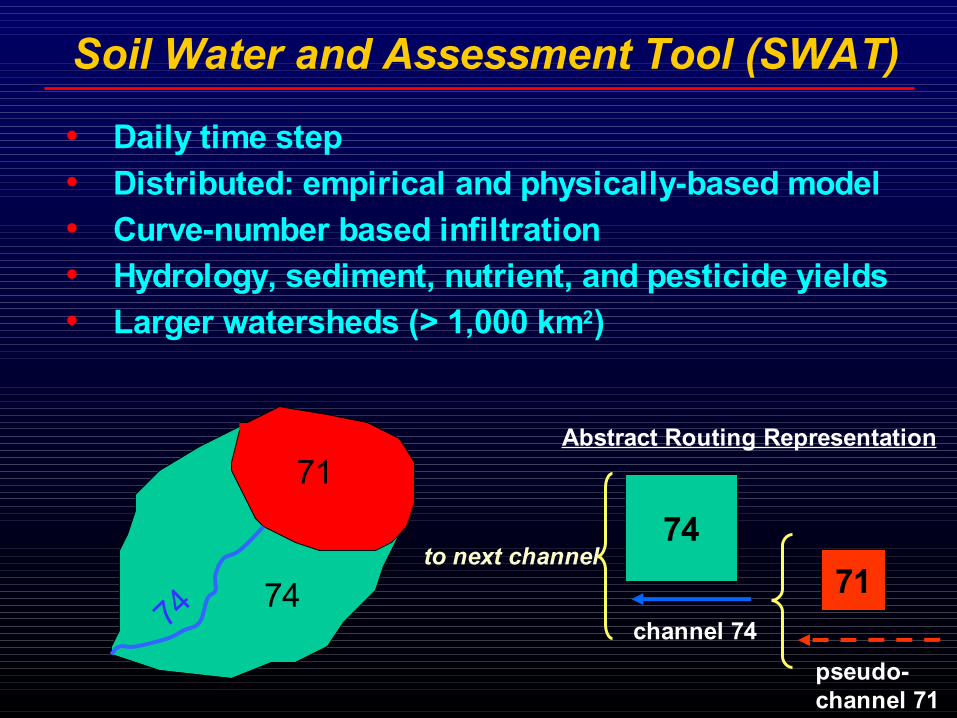
• Daily time step• Distributed: empirical and physically-based model• Curve-number based infiltration• Hydrology, sediment, nutrient, and pesticide yields• Larger watersheds (> 1,000 km2)
71
7474
Soil Water and Assessment Tool (SWAT)
7174
pseudo-channel 71
channel 74
Abstract Routing Representation
to next channel
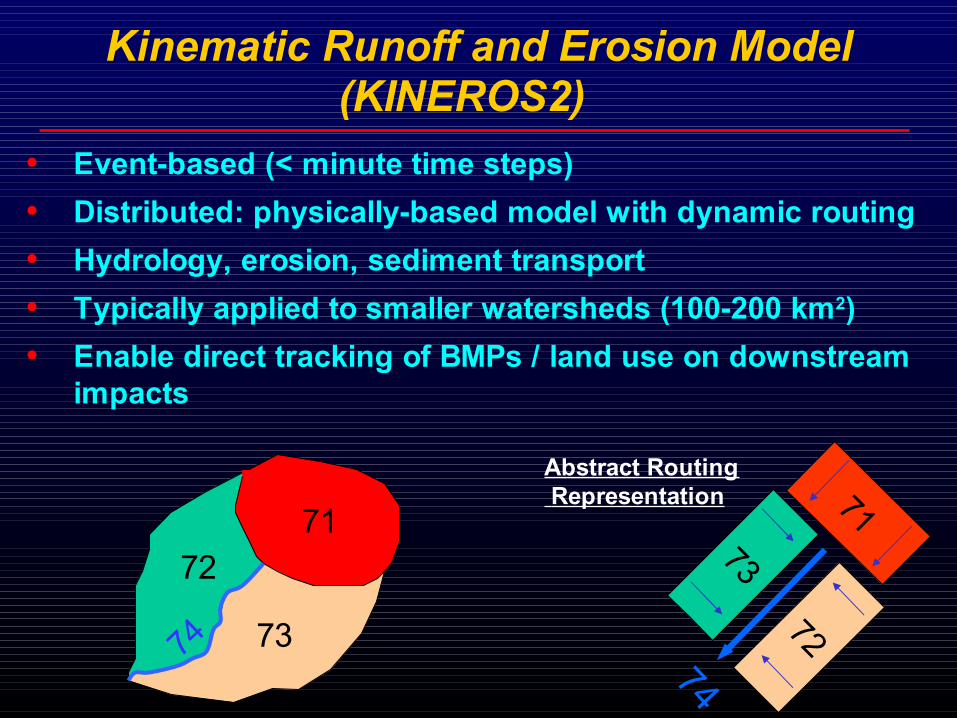
(KINEROS2)• Event-based (< minute time steps)• Distributed: physically-based model with dynamic routing • Hydrology, erosion, sediment transport• Typically applied to smaller watersheds (100-200 km2)• Enable direct tracking of BMPs / land use on downstream
impacts
Kinematic Runoff and Erosion Model
74
72
73
7171
7372
74
Abstract Routing Representation
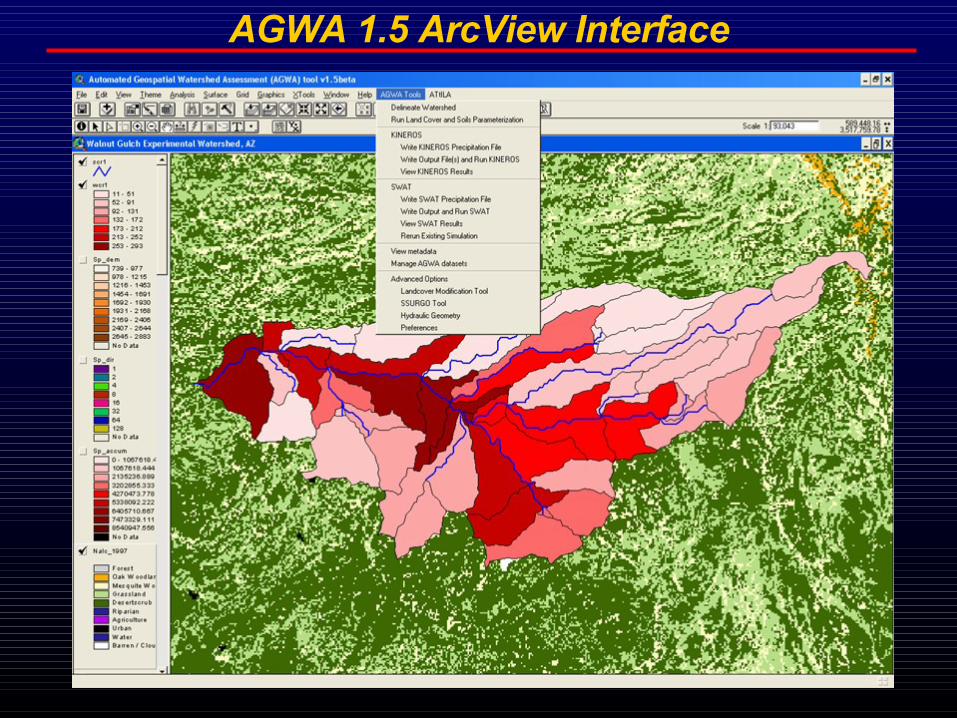
AGWA 1.5 ArcView Interface
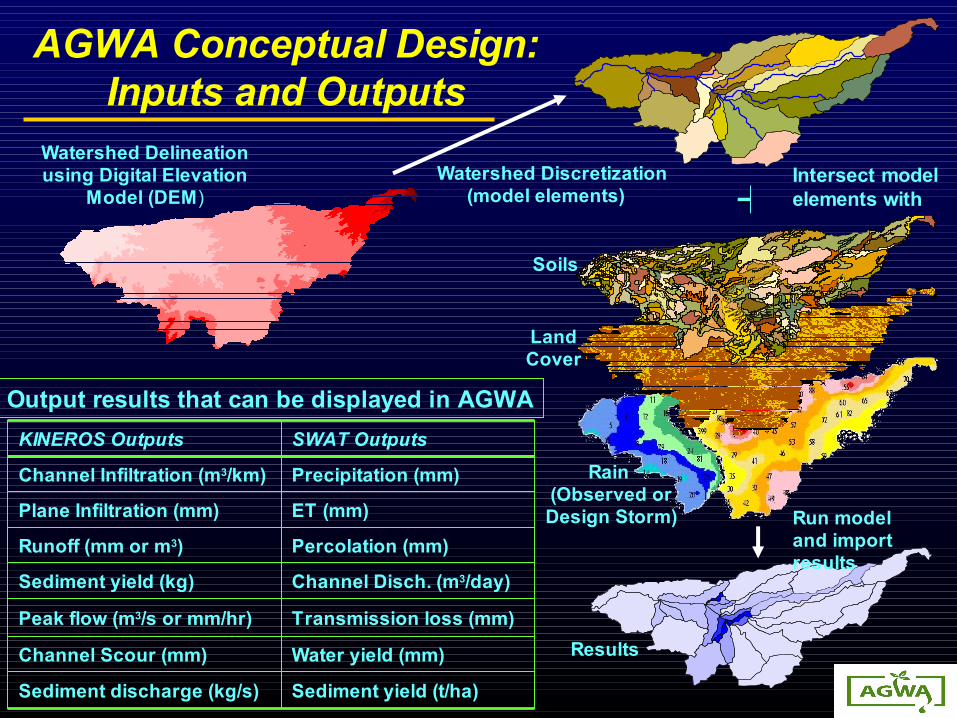
Watershed Discretization (model elements) ++
LandCover
Soils
Rain (Observed or Design Storm)
Results
Run model and import results
Intersect model elements with
Watershed Delineation using Digital Elevation
Model (DEM)
Sediment yield (t/ha)Sediment discharge (kg/s)
Water yield (mm)Channel Scour (mm)
Transmission loss (mm)Peak flow (m3/s or mm/hr)
Channel Disch. (m3/day)Sediment yield (kg)
Percolation (mm)Runoff (mm or m3)
ET (mm)Plane Infiltration (mm)
Precipitation (mm)Channel Infiltration (m3/km)
SWAT OutputsKINEROS Outputs
AGWA Conceptual Design: Inputs and Outputs
Output results that can be displayed in AGWA
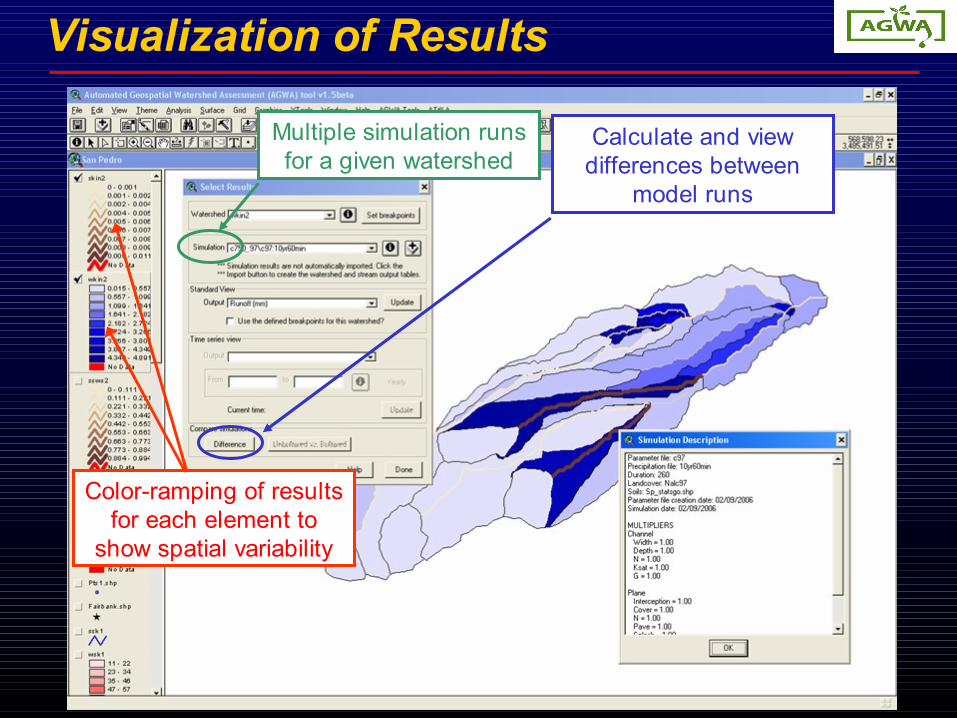
Visualization of Results
Color-ramping of results for each element to
show spatial variability
Calculate and view differences between
model runs
Multiple simulation runs for a given watershed
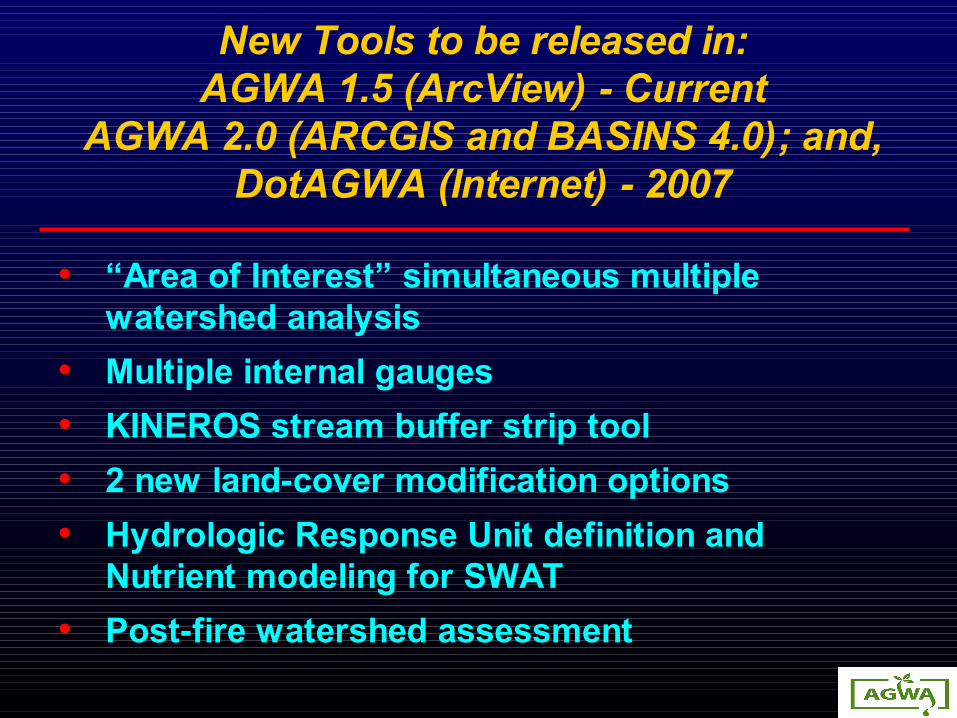
• “Area of Interest” simultaneous multiple watershed analysis
• Multiple internal gauges• KINEROS stream buffer strip tool • 2 new land-cover modification options• Hydrologic Response Unit definition and
Nutrient modeling for SWAT • Post-fire watershed assessment
New Tools to be released in:AGWA 1.5 (ArcView) - Current
AGWA 2.0 (ARCGIS and BASINS 4.0); and, DotAGWA (Internet) - 2007
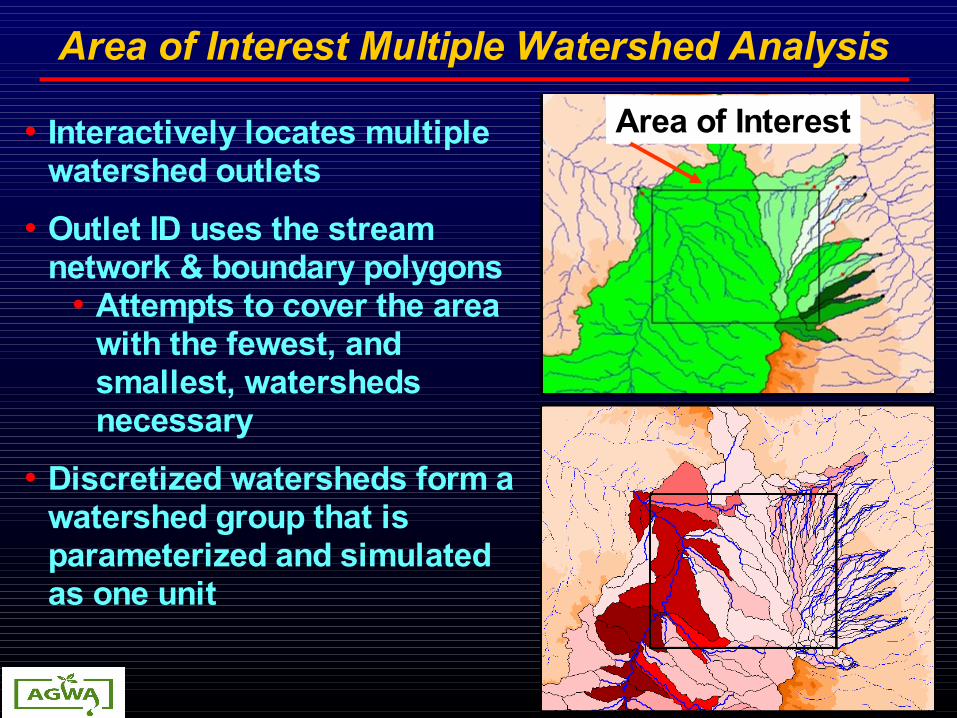
Area of Interest Multiple Watershed Analysis
• Interactively locates multiple watershed outlets
• Outlet ID uses the stream network & boundary polygons
• Attempts to cover the area with the fewest, and smallest, watersheds necessary
• Discretized watersheds form a watershed group that is parameterized and simulated as one unit
Area of Interest
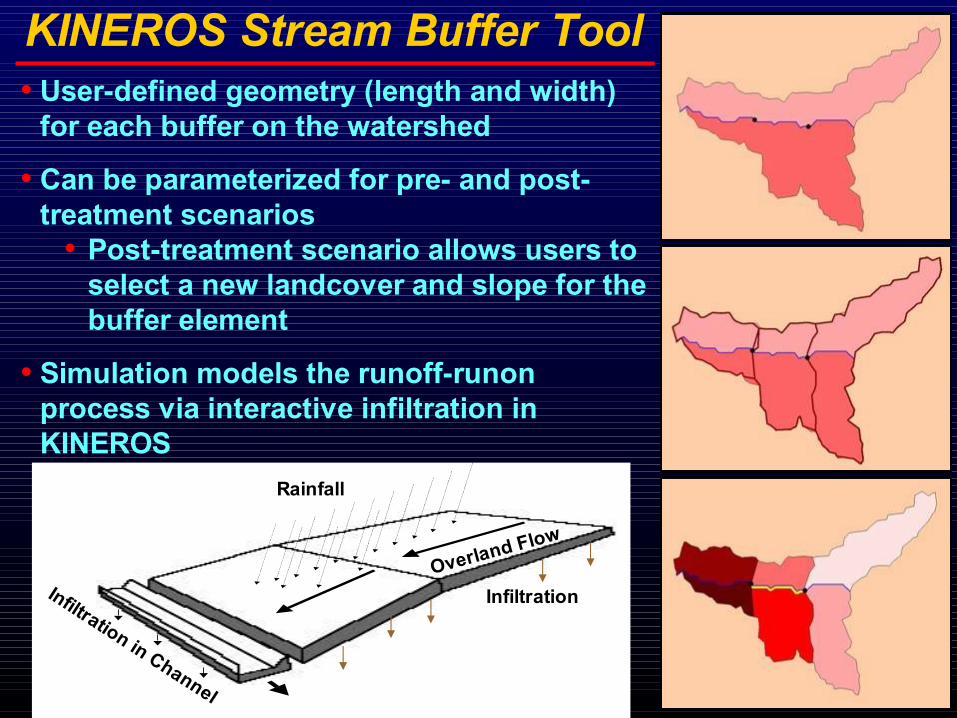
KINEROS Stream Buffer Tool• User-defined geometry (length and width)
for each buffer on the watershed
• Can be parameterized for pre- and post-treatment scenarios
• Post-treatment scenario allows users to select a new landcover and slope for the buffer element
• Simulation models the runoff-runon process via interactive infiltration in KINEROS
Rainfall
Overland Flow
InfiltrationInfiltration in Channel
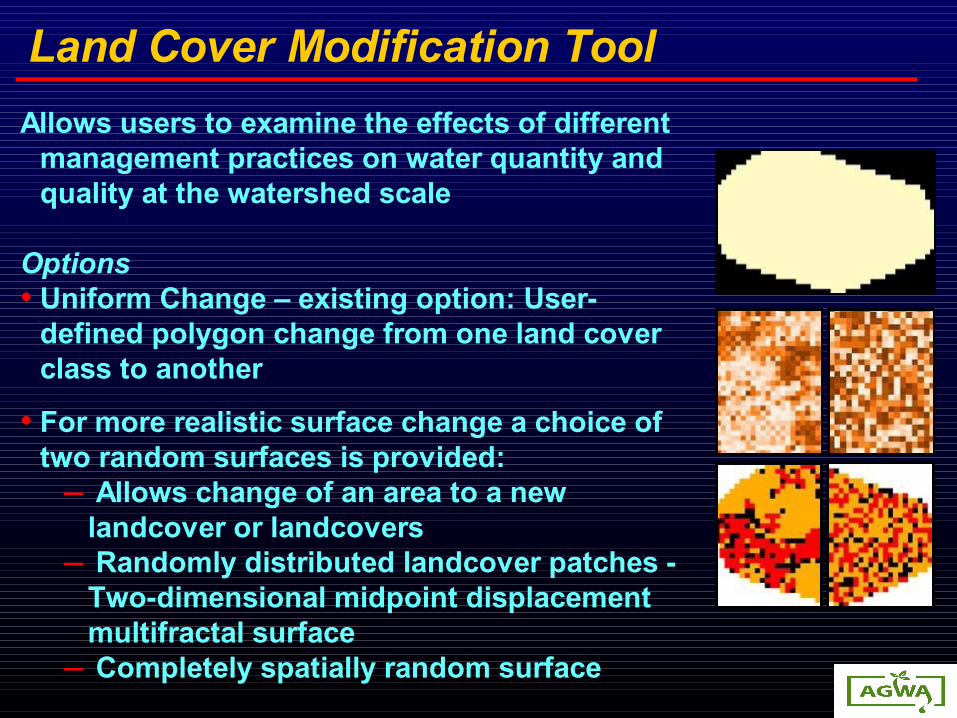
Land Cover Modification ToolAllows users to examine the effects of different
management practices on water quantity and quality at the watershed scale
Options• Uniform Change – existing option: User-
defined polygon change from one land cover class to another
• For more realistic surface change a choice of two random surfaces is provided:
– Allows change of an area to a new landcover or landcovers
– Randomly distributed landcover patches - Two-dimensional midpoint displacement multifractal surface
– Completely spatially random surface

HRUs and Nutrient Modeling (SWAT)
• Characterizes HRUs in a subwatershed based on unique land cover attributes.
• Users can define land cover and land use parameters for any land cover classification.
Nitrate/Nitrite Concentration (kg)
Mineral Phosphorus (kg)Organic Phosphorus (kg)Organic Nitrogen (kg)Sediment Yield (t/ha) Outputs• Nutrient modeling provides
estimates for nitrogen and phosphorus loading from subwatershed elements and in the channels
• Requires no additional inputs• Management scenarios can be
simulated by changing the default land cover parameters
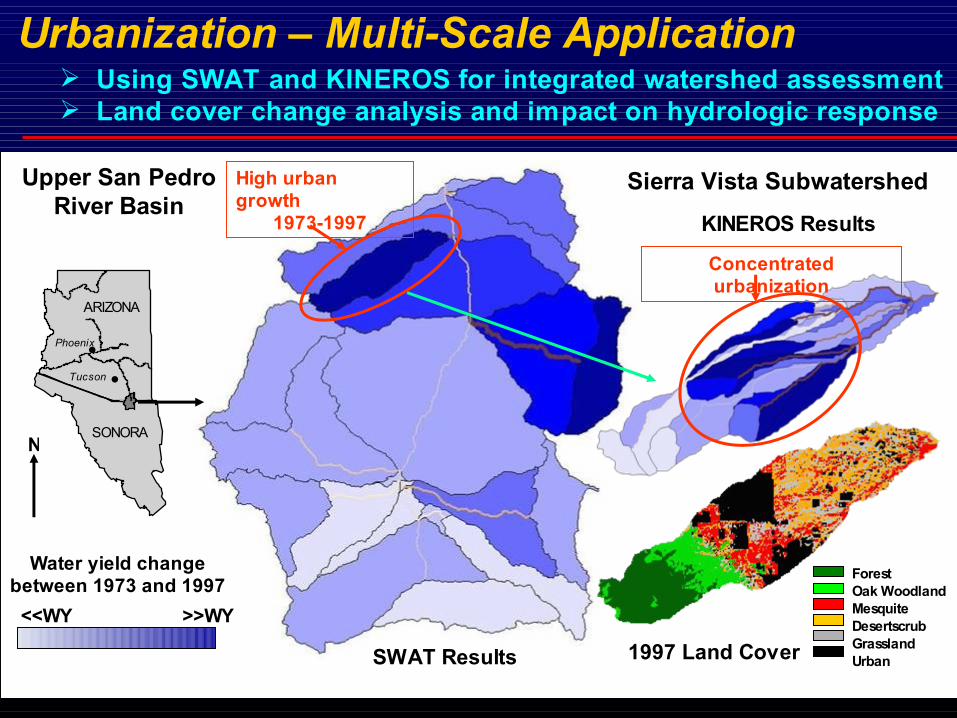
Urbanization – Multi-Scale Application
High urban growth
1973-1997
Upper San PedroRiver Basin
#
#
ARIZONA
SONORA
Phoenix
Tucson
<<WY >>WY
Water yield change between 1973 and 1997
SWAT Results
Sierra Vista Subwatershed
KINEROS Results
N
ForestOak WoodlandMesquite DesertscrubGrasslandUrban1997 Land Cover
Concentrated urbanization
Using SWAT and KINEROS for integrated watershed assessment Land cover change analysis and impact on hydrologic response
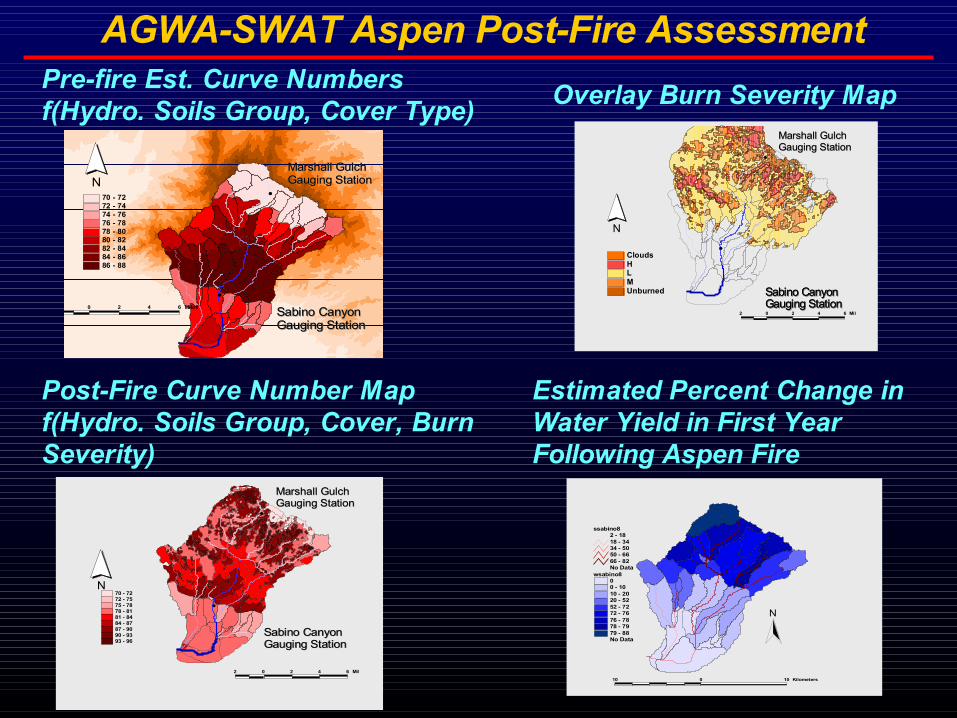
AGWA-SWAT Aspen Post-Fire Assessment
#
#
#
2 0 2 4 6 Miles
N
Sabino Canyon Gauging StationSabino Canyon Gauging Station
Marshall GulchGauging StationMarshall GulchGauging Station
70 - 7272 - 7474 - 7676 - 7878 - 8080 - 8282 - 8484 - 8686 - 88
Pre-fire Est. Curve Numbersf(Hydro. Soils Group, Cover Type)
#
#
Sabino Canyon Gauging StationSabino Canyon Gauging Station
Marshall GulchGauging StationMarshall GulchGauging Station
Sabino Canyon Gauging StationSabino Canyon Gauging Station
N
2 0 2 4 6 Miles
CloudsHLMUnburned
Overlay Burn Severity Map
#
#
Marshall GulchGauging StationMarshall GulchGauging Station
Sabino Canyon Gauging StationSabino Canyon Gauging Station
N
2 0 2 4 6 Miles
70 - 7272 - 7575 - 7878 - 8181 - 8484 - 8787 - 9090 - 9393 - 96
Post-Fire Curve Number Mapf(Hydro. Soils Group, Cover, Burn Severity)
wsabino800 - 1010 - 2020 - 5252 - 7272 - 7676 - 7878 - 7979 - 88No Data
ssabino82 - 1818 - 3434 - 5050 - 6666 - 82No Data
10 0 10 Kilometers
N
Estimated Percent Change in Water Yield in First Year Following Aspen Fire
• 1-D Dynamic geomorphic model – channel erosion / deposition • Enhanced ground-water parameterization for SWAT • Mult. hydraulic-geometry relations for channel characterization• Incorporation of WEPP erosion relations in KINEROS • KINER-OPUS Coupling underway
– OPUS simulation model for transport of non-point source pollutants
– Continuous, plant growth, nitrogen, phosphorus, carbon, snow, and management
• AGWA 2.0 (ARCGIS 9.1) incorporation into BASINS 4.0 • DotAGWA – Internet version - 2007
Future Directions

Pre- and Post-fireWatershed Assessentwith SWReGAP Data
Evaluate the post – fire hydrologic response of the Hot Lakes & Buffalo wildfires (Aug. 2001) in northern Nevada using AWGA and SWReGAP land cover and additional datasets from the Nevada Data Browser
Rock Ck .Basin
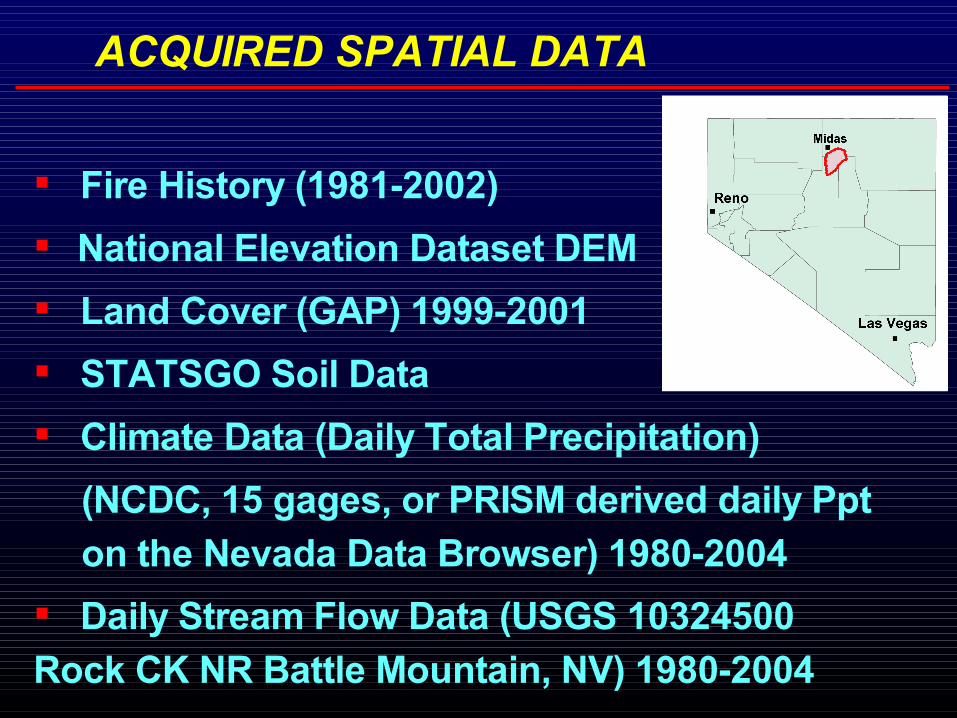
Fire History (1981-2002) National Elevation Dataset DEM Land Cover (GAP) 1999-2001 STATSGO Soil Data Climate Data (Daily Total Precipitation)
(NCDC, 15 gages, or PRISM derived daily Ppt on the Nevada Data Browser) 1980-2004
Daily Stream Flow Data (USGS 10324500 Rock CK NR Battle Mountain, NV) 1980-2004
ACQUIRED SPATIAL DATA

ROCK RIVER BASIN: LAND COVER (GAP) ’99-’01
Land cover distribution
Relief: 1863 m
Basin Area: 2,237 km2
Mean daily discharge: 1.10
m3/s
Mean annual Precip.: 320 mm
Mean air temperature: 9.4 oC
Biome: Desert
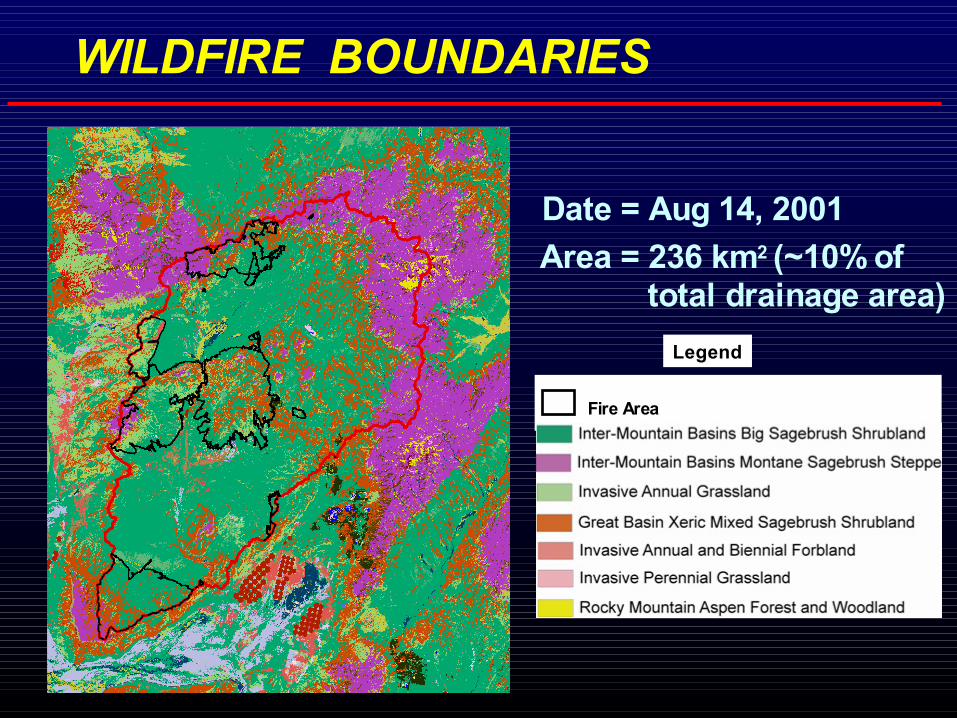
Fire Area
Legend
WILDFIRE BOUNDARIES
Area = 236 km2 (~10% of total drainage area)
Date = Aug 14, 2001

WATERSHED DISCRETIZATIONSubwatersheds = 41CSA = 45 km2
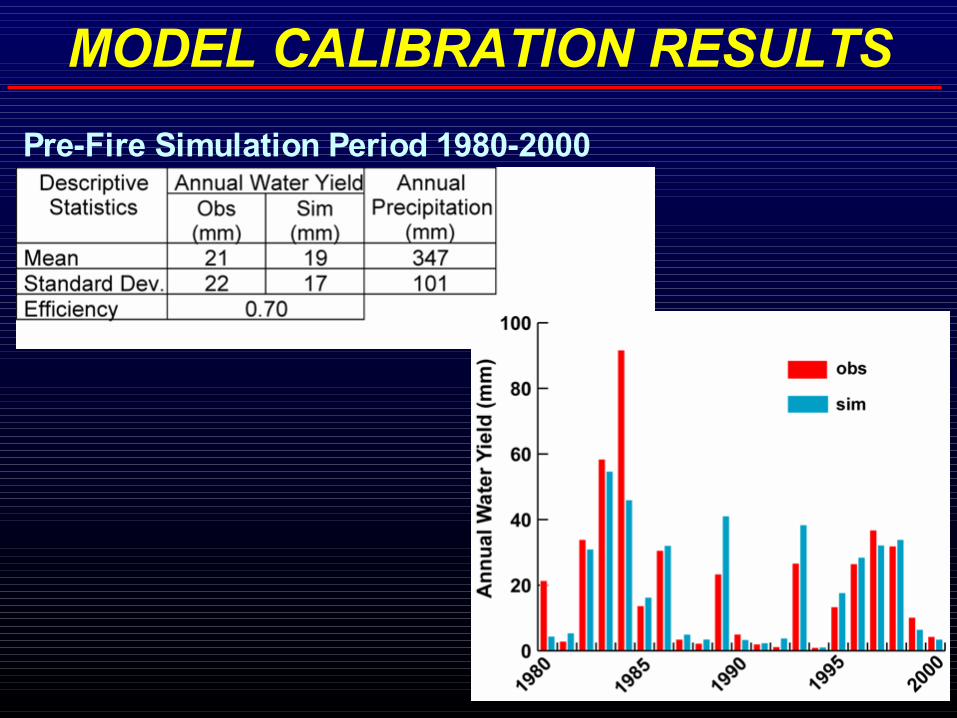
Pre-Fire Simulation Period 1980-2000
MODEL CALIBRATION RESULTS
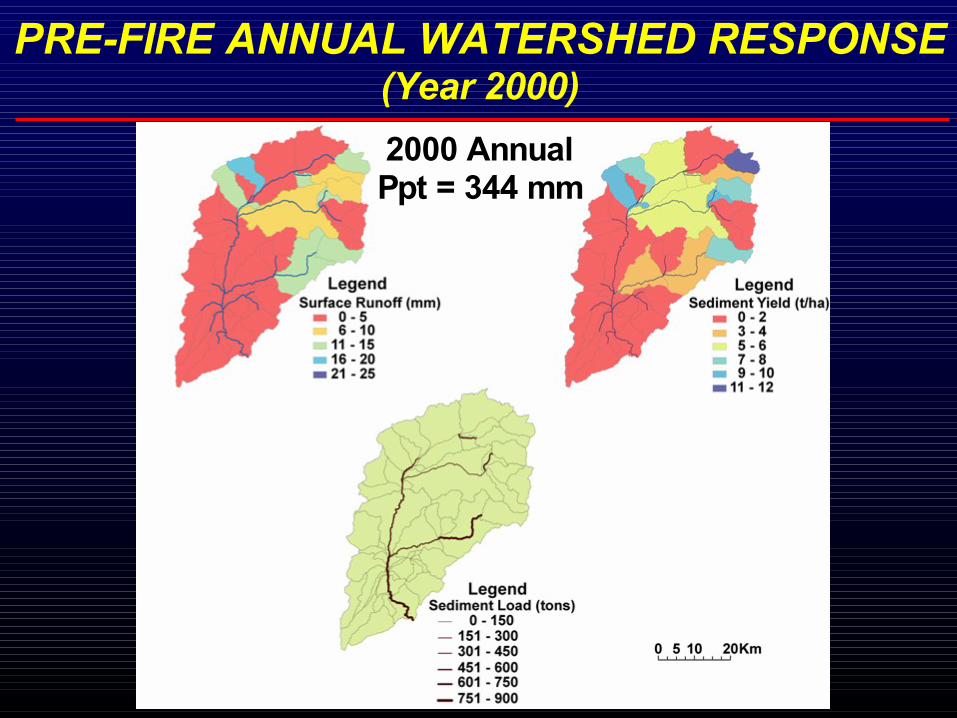
PRE-FIRE ANNUAL WATERSHED RESPONSE (Year 2000) 2000 AnnualPpt = 344 mm
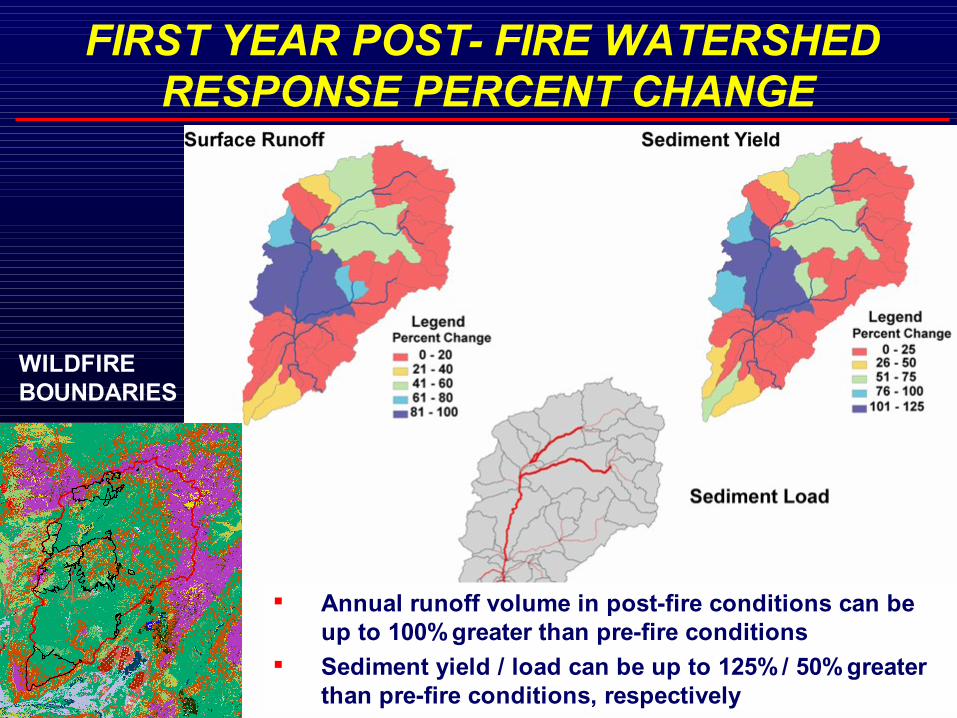
FIRST YEAR POST- FIRE WATERSHED RESPONSE PERCENT CHANGE
WILDFIREBOUNDARIES
Annual runoff volume in post-fire conditions can be up to 100% greater than pre-fire conditions
Sediment yield / load can be up to 125% / 50% greater than pre-fire conditions, respectively

Post-Fire Assessments Conclusions• AGWA and GAP Land Cover data together can be used to evaluate the impact of wildfire on the hydrologic response of sagebrush shrubland-dominated rangelands
• Pre-fire data and simulations can be done for any given watershed at any time in a non-crisis environment
• Directly import post-fire burn severity map as a shape file
• Run model with same rainfall input as pre-fire simulation
• Difference post- and pre-fire simulations and spatially display results
• Allows rapid visual ID of watershed areas most prone to post-fire impacts so mitigation and remediation can be targeted