rapid post-fire hydrologic watershed assessment using the ... · post -fire burn -severity map for...
TRANSCRIPT

Rapid Post-Fire Hydrologic Watershed Assessment using the AGWA GIS-based Hydrologic Modeling Tool
D.C. Goodrich1, H. Evan Canfield1, I. Shea Burns1, D.J. Semmens2, S.N. Miller3, M. Hernandez1, L.R. Levick1, D.P. Guertin4, W.G. Kepner2
1USDA-ARS-SWRC, 2000 E. Allen Rd., Tucson, AZ, 85719; PH (520) 670-6381 ext. 144; FAX (520) 670-5550; email: [email protected]. Environmental Protection Agency, ORD, Las Vegas, NV3University of Wyoming, Dept. of Renewable Resources, Laramie, WY4University of Arizona, School of Natural Resources, Tucson, AZ
Abstract
Rapid post-fire watershed assessment to identify potential trouble spots for erosion and flooding can potentially aid land managers and Burned Area Emergency Rehabilitation (BAER) teams in deploying mitigation and rehabilitation resources. These decisions are inherently complex and spatial in nature and require a distributed hydrological modeling approach. The extensive data requirements and the task of building input parameter files have presented obstacles to the timely and effective use of complex distributed rainfall-runoff and erosion models by BAER teams and resource managers. Geospatial tools and readily-available digital sources of pre-fire land cover, topography, and soils combined with rainfall-runoff and erosion models can expedite assessments if properly combined, provided a post-fire burn-severity map is available. The AGWA (Automated Geospatial Watershed Assessment) hydrologic modeling tool was developed to utilize nationally available spatial data sets and both empirical (SWAT) and more process-based (KINEROS2) distributed hydrologic models (see: www.tucson.ars.ag.gov/agwa). Through an intuitive interface the user selects an outlet from which AGWA delineates and discretizes the watershed using a Digital Elevation Model (DEM). The watershed model elements are then intersected with soils and land cover data layers to derive the requisite model input parameters. The chosen model is then run, and the results are imported back into AGWA for graphical display. AGWA can difference results from pre- and post-fire model simulations and display the change on the modeled watershed. This allows managers to identify potential problem areas where mitigation activities can be focused. An overview of AGWA and an application of it to the 2003 Aspen fire north of Tucson, Arizona are discussed herein.

Introduction:
Wildfires can, and have had, a profound impact on the nature of watershed response to precipitation (DeBano et al. 1998). Increases in peak runoff rate and volume, as well as sediment discharge, typically increase following fires, (Robichaud, et al. 2000; Anderson et al. 1976). Mitigating these effects is one of the primary objectives of the Burned Area Emergency Response (BAER) teams. Weather and climatic conditions often force these teams to make rapid post-fire assessments for decision-making on how and where to deploy remediation measures. Building and running distributed hydrological models to predict potential impacts of fire on runoff and erosion can be a time-consuming and tedious task. The USDA-ARS Southwest Watershed Research Center, in cooperation with the U.S. EPA Office of Research and Development, and the University of Arizona have developed the AGWA geographic information system (GIS) based tool to facilitate this process. A GIS provides the framework within which spatially-distributed data are collected and used to prepare model input files and evaluate model results in a spatially explicit context.
The AGWA (Automated Geospatial Watershed Assessment) Tool
AGWA provides the functionality to conduct pre- and post-fire watershed assessments for two widely used watershed hydrologic models using readily available standardized spatial datasets. The two models currently incorporated into AGWA are Soil & Water Assessment Tool (SWAT; Arnold et al. 1994; www.brc.tamus.edu/swat) and the KINematic Runoff and EROSion Model (KINEROS2; Smith et al., 1995; www.tucson.ars.ag.gov/kineros). SWAT is a continuous-simulation model for use in large (river-basin scale) watersheds. KINEROS2 is an event-driven model developed for small (<100 km2) arid, semi-arid, and urban watersheds. The AGWA tool combines these models in an intuitive interface for performing multi-scale watershed assessments.
AGWA is an extension for the ArcView versions 3.X (ESRI, 2001). ArcGIS 9.0 and web versions of AGWA are currently under development. AGWA is distributed freely via the Internet as a modular, open-source suite of programs (www.tucson.ars.ag.gov/agwa). Data requirements to run AGWA include elevation (USGS DEM data), land cover (EPA MLRC), soils (USDA STATSGO, USDA SURRGO, FAO) and precipitation data (observed or design storms), all of which are typically available at no cost over the Internet for the conterminous United States. A fundamental assumption of AGWA is that the user has previously gathered the necessary GIS data layers for the area of interest. All of these data layers are easily obtained for the conterminous United States. Pre-processing of the DEM to ensure hydrologic connectivity within the study area is required, and tools are provided in AGWA to aid in this task. These tasks can be done relatively rapidly within AGWA but could also be completed for forests and land areas prior to a fire. By doing so the BAER teams would only have to deal with preparing a post-fire burn-severity map for the area of interest when time is of the essence.

Once an AGWA session has been initiated, the program is designed to lead the user in a stepwise fashion through the transformation of GIS data into simulation results. A conceptualization of the steps necessary to apply AGWA is presented in Figure 1. The AGWA Tools menu is designed to reflect the order of tasks necessary to conduct a watershed assessment. This process consists of five major steps: (1) watershed outlet identification and watershed delineation; (2) watershed subdivision by topographically controlled contributing areas; (3) model parameterization based on topography, land cover, and soils; (4) preparation of parameter and rainfall input files; and, (5) model execution and visualization, and comparison of results.
Navigating Through AGWA
Generate Watershed Outline
Subdivide Watershed Into Model Elements
Display Simulation Results
Run the Hydrologic Model & Import Results to AGWA
Intersect Soils and Land Cover
Choose the model to run
Daily rainfall from…• gauge locations• Thiessen map
Storm event from…• NOAA Atlas 2• pre-defined return-period• user-defined
Generaterainfall data
Visualizationfor each
Model Element
SWAT output• evapotranspiration• percolation• runoff, water yield• transmission loss • sediment yield
KINEROS output• runoff• sediment yield• infiltration• peak runoff rate• peak sediment discharge
KINEROS2SWAT
Grid
Polygon
Look-up tables
External to AGWA
Navigating Through AGWA
Generate Watershed Outline
Subdivide Watershed Into Model Elements
Display Simulation Results
Run the Hydrologic Model & Import Results to AGWA
Intersect Soils and Land Cover
Choose the model to run
Daily rainfall from…• gauge locations• Thiessen map
Storm event from…• NOAA Atlas 2• pre-defined return-period• user-defined
Generaterainfall data
Visualizationfor each
Model Element
SWAT output• evapotranspiration• percolation• runoff, water yield• transmission loss • sediment yield
KINEROS output• runoff• sediment yield• infiltration• peak runoff rate• peak sediment discharge
KINEROS2SWAT KINEROS2SWAT
Grid
Polygon
Look-up tables
External to AGWA
Figure 1. Conceptualized and sequence of steps in the use of AGWA for hydrologic modeling
In step (2), the geometric complexity of a watershed model representation is controlled by the user-defined contributing source area (CSA). This is the drainage area required to initiate a first-order channel and represents the transition where runoff is better treated as concentrated channel flow versus overland flow. Methods to automatically select the appropriate CSA across a broad range of basin morphologies are not clearly defined in the literature, but based on prior experience a default CSA of 2.5% of the total watershed drainage area is typically sufficient for preliminary watershed analysis. The user can modify this value, with a smaller CSA resulting in a more complex representation of the watershed (e.g. a greater number of model elements).

In regards to step (3), geometric model parameters (slope, flow length, etc.) are derived directly from the topographic data. Infiltration, interception, and erosion parameters are derived from look-up table relationships between these variables and the soil and land-cover attribute information in the input data sets (e.g. soil texture, soil group, vegetation type). These look-up table relationships are based on the literature and limited model calibration from highly instrumented experimental watershed data. However, the user can modify them if local observations enable model calibration. A critical element in using AGWA for post-fire assessments is establishing relations that can be used to translate burn severity into changes in the infiltration, hydraulic roughness, and erosion model parameters. This issue is discussed in more detail in a companion paper by Canfield et al. (this issue).
After hydrologic model execution (SWAT or KINEROS2), AGWA will automatically import the model results and add them to the polygon and stream map tables for spatial, color-ramped displays (step 5). A separate module controls the visualization of model results. The user can toggle among viewing various model outputs for both upland and channel model elements, enabling the problem areas to be identified visually. If multiple land-cover scenes exist, the user can parameterize either or both of the two models and attach the results to a given watershed. Results can then be compared on either an absolute or percent change basis for each model element. Model results can also be overlaid with other digital data layers to further prioritize management activities. Examples of AGWA applications for assessments of the hydrologic impacts of past land-cover change, as well as of alternative futures land-use change, can be found in Hernandez et al. (2000), Miller et al. (2002), and Kepner et al. (2004).
Hydrologic Models
Key components of AGWA are the hydrologic models used to evaluate the effects of land cover and land use on watershed response. Both the KINEROS2 and SWAT models are able to process complex watershed representations to explicitly account for spatial variability of soils, rainfall distribution patterns, and vegetation.
KINEROS2
KINEROS2 (K2) is an event-oriented, physically based model describing the processes of interception, infiltration, surface runoff, and erosion from small agricultural and urban watersheds, and is based on Hortonian overland flow theory (Smith et al., 1995). In this model, watersheds are represented by discretizing contributing areas into a cascade of one-dimensional overland flow and channel elements using topographic information. Surface flow in both overland and channel elements is modeled using a finite difference approximation of the one-dimensional kinematic wave equations in which upslope supply, rainfall rates, and infiltration rates are considered simultaneously at each finite difference node. The infiltration component of K2 is based on the simplification of the Richard’s equation posed by Smith and Parlange (1978). It is relatively well suited to describing the hydrodynamics of runoff and erosional processes on burned southwestern

watersheds, where infiltration rates are low, and rainfall is infrequent but intense. Sediment transport is treated using unsteady, one-dimensional convective-transport equations similar to those used for runoff. Entrainment of sediment is modeled as resulting from raindrop impact or flow-induced entrainment. Sediment transport for up to five, non-interacting particle sizes is described using the Engelund and Hansen (1967) total load equation.
SWAT
SWAT is a river basin scale model developed to predict the impact of land-management practices on water, sediment, and agricultural chemical yields for large, complex watersheds with varying soils, land use, and management conditions over long periods of time (Arnold et al. 1994). The model combines empirical and physically-based equations, uses readily available inputs, and enables users to study long-term impacts. The hydrology model is based on the water balance equation:
( )∑=
−−−−+=t
iiiiiit QRPETQRSWSW
1
(1)
where SW is the soil water content minus the 15-bar water content, t is the time in days, and R, Q, ET, P, and QR are the daily amounts of precipitation, runoff, evapotranspiration, percolation, and return flow, respectively; all the units are in millimeters. Since the model maintains a continuous water balance, complex basins are subdivided to reflect differences in ET for various crops, soils, etc. Thus, runoff is predicted separately for each sub area and routed to obtain the total runoff for the basin.
Analysis and Application
Estimating Post-Fire Runoff Volume Change Using Curve Numbers
Surface runoff in SWAT is estimated with a modification of the SCS Curve Number method (U. S. Department of Agriculture, 1986). A survey of Burned Area Emergency Response (BAER) plans showed that the Curve Number (CN) approach is often used in post-fire assessment. Currently, many BAER teams select post-fire CNs based on experience, without the value of careful post-fire data analysis. Two papers in this volume calculated post-fire CNs and found a small change in post-fire runoff volume (Canfield et al, 2005; Springer and Hawkins, 2005). However, Canfield et al. (2005) found that change in post-fire peak was approximately an order of magnitude higher after the Aspen Fire in Pima County, AZ, even though there was no significant change in post-fire CN (i.e. little change in total post-fire runoff volume). McLin et al. (2001) also noted that post-fire runoff peaks can be very high, while runoff volumes are less changed. Therefore users of unit hydrographs have chosen to overestimate volume in order to accurately predict peak runoff rates.
Analysis of post-fire CNs from BAER team reports for several burn severities on fires in the Southwest (Hayman, CO; Cerro Grande, NM; and, Oracle Hill, AZ) and modeled runoff from a fifty mm storm indicate up to two orders of magnitude change in runoff volume, which is inconsistent with observations. To select a CN that more accurately reflects the calculated post-fire CNs described in other studies in this volume, (Canfield et al; Springer and Hawkins), we employed a relationship between CN and cover.
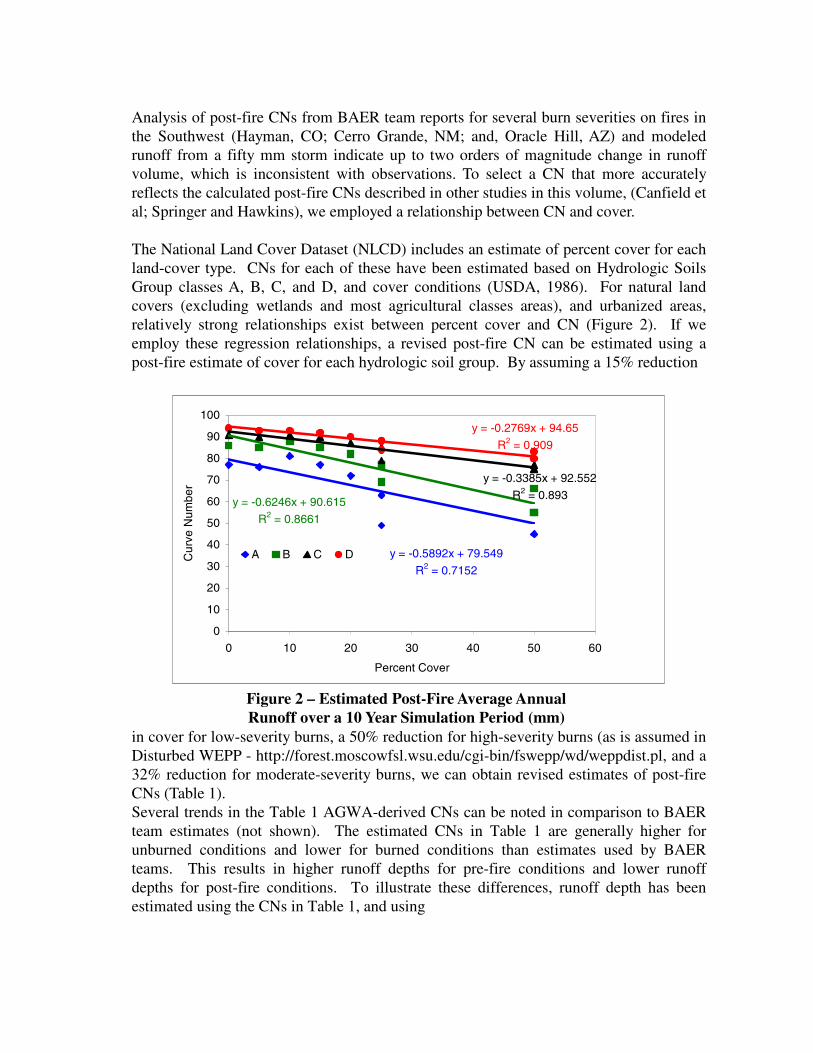
The National Land Cover Dataset (NLCD) includes an estimate of percent cover for each land-cover type. CNs for each of these have been estimated based on Hydrologic Soils Group classes A, B, C, and D, and cover conditions (USDA, 1986). For natural land covers (excluding wetlands and most agricultural classes areas), and urbanized areas, relatively strong relationships exist between percent cover and CN (Figure 2). If we employ these regression relationships, a revised post-fire CN can be estimated using a post-fire estimate of cover for each hydrologic soil group. By assuming a 15% reduction
y = -0.2769x + 94.65
R2 = 0.909
y = -0.5892x + 79.549
R2 = 0.7152
y = -0.3385x + 92.552
R2 = 0.893y = -0.6246x + 90.615
R2 = 0.8661
0
10
20
30
40
50
60
70
80
90
100
0 10 20 30 40 50 60
Percent Cover
Cur
ve N
umbe
r
A B C D
in cover for low-severity burns, a 50% reduction for high-severity burns (as is assumed in Disturbed WEPP - http://forest.moscowfsl.wsu.edu/cgi-bin/fswepp/wd/weppdist.pl, and a 32% reduction for moderate-severity burns, we can obtain revised estimates of post-fire CNs (Table 1). Several trends in the Table 1 AGWA-derived CNs can be noted in comparison to BAER team estimates (not shown). The estimated CNs in Table 1 are generally higher for unburned conditions and lower for burned conditions than estimates used by BAER teams. This results in higher runoff depths for pre-fire conditions and lower runoff depths for post-fire conditions. To illustrate these differences, runoff depth has been estimated using the CNs in Table 1, and using
Figure 2 – Estimated Post-Fire Average Annual Runoff over a 10 Year Simulation Period (mm)

Table 1: Original and revised AGWA-based Curve Number estimates as a function of hydrologic soil group, land-cover class and burn severity
(low, moderate or high)
Class Name Cover A B C D84a Bare 0 77 86 91 9484 Fallow 5 76 85 90 9322 High Intensity Residential 10 81 88 91 9321 Low Intensity Residential 15 77 85 90 9233 Transitional 20 72 82 87 9051 Shrubland 25 63 77 85 8871 Grasslands/Herbaceous 25 49 69 79 8441 Deciduous Forest 50 55 55 75 8042 Evergreen Forest 50 45 66 77 8343 Mixed Forest 50 55 55 75 8051 Shrubland 25 63 77 85 8841l Deciduous Forest 43 59 60 78 8242l Evergreen Forest 43 49 71 80 8543l Mixed Forest 43 59 60 78 8251l Shrubland 21 65 79 86 8941m Deciduous Forest 34 65 65 80 8542m Evergreen Forest 34 55 76 82 8843m Mixed Forest 34 65 65 80 8551m Shrubland 17 68 82 88 9041h Deciduous Forest 25 70 71 83 8742h Evergreen Forest 25 60 82 85 9043h Mixed Forest 25 70 71 83 8751h Shrubland 12 73 88 91 91Note: l - low severity burn
m - moderate severity burnh - high severity burn
CNs from BAER team reports on the Cerro Grande (Evergreen), and Oracle Hill Fires (Deciduous Forest and Shrubland) using a 40-mm rainfall event.

0
5
10
15
20
25
30
Evergreen, D, H
igh
Evergreen D Moderate
Evergreen D Low
Evergreen D Unburned
Deciduous Forest C High
Deciduous Forest C M
oderate
Deciduous Forest C Low
Deciduous Forest C Unburned
Shrubland C High
Shrubland C Moderate
Shrubland, C, L
ow
Shrubland C Unburned
Run
off (
mm
)BAER
AGWA
Figure 3 – Calculated Curve Number from a 40 mm storm using AGWA and BAER team estimates (cover, hydrologic soil group, burn severity)
The values in Figure 3 show that the AGWA estimates tend to produce a higher runoff volume for unburned conditions and a lower runoff volume for burned conditions. This results in a smaller estimate of runoff-volume change as a result of wildfire. This is consistent with the results described in Canfield et al. (this volume) and Springer and Hawkins (this volume), which show that observed post-fire runoff-volume change is small relative to the large change in runoff peak rates. Note that the 40-mm storm event is quite large; and the differences demonstrated in Figure 3 would be greater for smaller events because a higher fraction of the rainfall will go to the initial abstraction.
AGWA-SWAT Application to the 2003 Aspen Fire near Tucson, Arizona
The overlay of land cover and soils allows AGWA to select a parameter set appropriate for that given land cover on that soil. The addition of a burn-severity map allows further characterization of hydrologic response based on the land cover, soils classification and burn severity. A critical element in using AGWA for post-fire assessments is translating a burn severity map into relationships that can be used to alter infiltration and erosion model parameters. This issue is discussed in more detail in a companion paper by Canfield et al. (this volume). In hydrologic-model terms, different CN values, and different post-fire roughness values can be selected based on the new classification. The burn severity map for the 2003 Aspen fire (Figure 4) illustrates a complex mosaic of low, moderate, and high severity burns.

By using a GIS, this information can be used to develop a complex mosaic of CNs, which can allow users to more accurately reflect hydrologic conditions within the model representation. The traditional method of implementing the CN technique (USDA, 1986) uses a spatially-weighted average CN, which can be used to describe the hydrologic response of a watershed. Since runoff is highly sensitive to CN, small differences in CN can result in big differences in runoff (Hawkins, 1975). A revised post-fire CN map for the Sabino Canyon watershed is given in Figure 5.
To fully utilize the revised CN map, the watershed must be partitioned into model elements small enough to represent a single hydrologic soil group, land-cover and burn-severity classification. Therefore, AGWA should not be used to partition a watershed at a more coarse level than the default 2.5%, and there may be situations, where this level is too coarse.
#
#
Marshall GulchGauging StationMarshall GulchGauging Station
Sabino Canyon Gauging StationSabino Canyon Gauging Station
N
2 0 2 4 6 Miles
70 - 7272 - 7575 - 7878 - 8181 - 8484 - 8787 - 9090 - 9393 - 96
#
#
Sabino Canyon Gauging StationSabino Canyon Gauging Station
Marshall GulchGauging StationMarshall GulchGauging Station
Sabino Canyon Gauging StationSabino Canyon Gauging Station
N
2 0 2 4 6 Miles
CloudsHLMUnburned
Figure 4– Burn Severity Map of Aspen Fire on the Sabino Canyon Watershed
Figure 5 – Revised Curve Number Map of Aspen Fire on the Sabino Canyon Watershed
A second change that occurs on hillslopes is a change in hillslope roughness. Evaluation of roughness in the companion paper (Canfield et al, this volume) indicates that post-fire roughness on hillslopes can be over an order of magnitude lower in forested areas following fire. Rather than fix roughness separately for all soil/cover/complexes, the post-fire evaluation with AGWA sets roughness at a value reasonable for bare soil (n = 0.011; Engman, 1986). Selection of this value allows for more than an order of magnitude change in extremely rough environments, such as conifer forests.
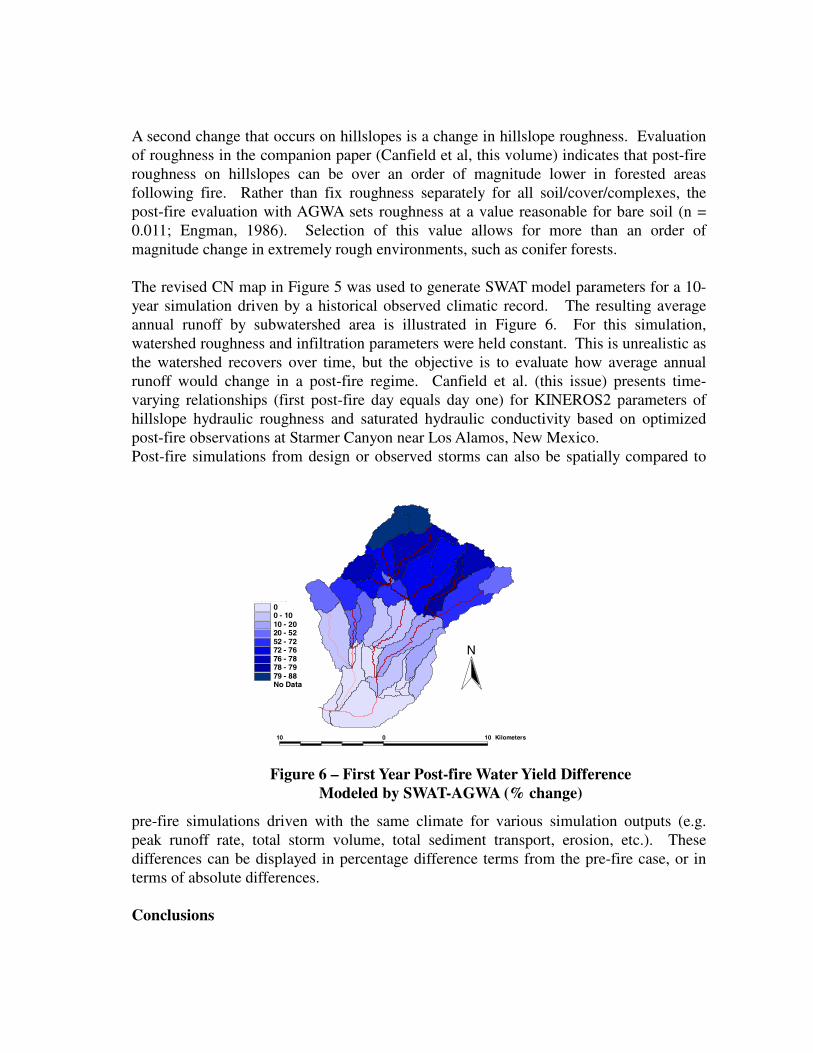
The revised CN map in Figure 5 was used to generate SWAT model parameters for a 10-year simulation driven by a historical observed climatic record. The resulting average annual runoff by subwatershed area is illustrated in Figure 6. For this simulation, watershed roughness and infiltration parameters were held constant. This is unrealistic as the watershed recovers over time, but the objective is to evaluate how average annual runoff would change in a post-fire regime. Canfield et al. (this issue) presents time-varying relationships (first post-fire day equals day one) for KINEROS2 parameters of hillslope hydraulic roughness and saturated hydraulic conductivity based on optimized post-fire observations at Starmer Canyon near Los Alamos, New Mexico.Post-fire simulations from design or observed storms can also be spatially compared to
pre-fire simulations driven with the same climate for various simulation outputs (e.g. peak runoff rate, total storm volume, total sediment transport, erosion, etc.). These differences can be displayed in percentage difference terms from the pre-fire case, or in terms of absolute differences.
Conclusions
Figure 6 – First Year Post-fire Water Yield Difference Modeled by SWAT-AGWA (% change)
wsabino800 - 1010 - 2020 - 5252 - 7272 - 7676 - 7878 - 7979 - 88No Data
ssabino82 - 1818 - 3434 - 5050 - 6666 - 82No Data
10 0 10 Kilometers
N

Estimation of post-fire hydrologic response and change analysis is an important step in developing a plan to remediate potential post-fire flooding and erosion. The GIS-based AGWA tool (www.tucson.ars.ag.gov/agwa) allows the use of readily available spatial datasets to perform pre-fire hydrologic analysis using empirical (SWAT) and process-based (KINEROS2) hydrological models. If a burn-severity map is available, estimates of runoff volume can be made by modifying post-fire CNs. An application of AGWA-SWAT is illustrated using available data sets and a burn-severity map on the 2003 ASPEN fire near Tucson, AZ. A relationship between cover and CN provides a basis for estimating post-fire changes in CNs. The estimated changes in CNs are smaller than those derived from experience and used in many post-fire BAER analyses. However, they agree more with the observed changes in post-fire runoff volume, which show that the change in runoff volume is small relative to the large change in post-fire peak runoff. Therefore, a second modification in AGWA is to drastically decrease hillslope roughness, which increases peaks without a large increase in runoff volume. An application of KINEROS to the Starmer Canyon dataset at Los Alamos (Canfield et al, this volume) shows that hillslope roughness approximates bare conditions following the fire, and rapidly recovers. In summary the AGWA tool offers the capability of rapid post-fire watershed assessments to more effectively target remediation efforts. We would welcome, and assist in, the application of AGWA by resource managers and BAER teams.
Acknowledgements: Insights from Richard Hawkins and Everett Springer were extremely valuable in understanding and applying the CN method. Support for this research was provided by the USDA-ARS Headquarters Post Doctoral Program, the US-EPA Landscape Ecology Branch, and in part by SAHRA under the STC Program of the National Science Foundation, Agreement No. EAR-9876800. This support is gratefully acknowledged
References
Anderson, H. W., Hoover, M.D., Reinhart, K.G. (1976). Forests and Water: Effects of Forest Management on Floods, Sedimentation, and Water Supply. General Technical Report PSW-18, USDA, Forest Service, Berkeley, CA.
Arnold, J.G., Williams, J.R., Srinivasan, R., King, K.W., and Griggs, R.H. (1994). SWAT: Soil Water Assessment Tool. U. S. Department of Agriculture, Agricultural Research Service, Grassland, Soil and Water Research Laboratory, Temple, TX.
Canfield, H.E., Goodrich, D.C., and Burns, I.S. (2005). “Application of Models to Predict Post-fire Runoff and Sediment Transport at the Watershed Scale in Southwestern Forests”. Amer. Society of Civil Eng. Watershed Management Conference, Williamsburg, VA, July 19-22, 2005 CD Proceedings, p, 1-12.
DeBano, L.F., Neary, D.G. and Ffolliott, P.F. (1998). Fire’s Effects on Ecosystems. John Wiley and Sons, New York. 338p.
Engelund, F., and Hansen, E. (1967). A Monograph on Sediment Transport in Alluvial Streams, Teknisk Forlag, Copenhagen, 62 pp.
Engman, E.T. (1986). “Roughness Coefficients for Routing Surface Runoff.” Journal of Irrigation and Drainage Engineering 112(1) 39-53.

ESRI, 2001. ArcView Version 3.2a Software and User Manual. Environmental Systems Research Institute, Redlands, CA.
Hawkins, R.H. (1975). “The Importance of Accurate Curve Numbers in the Estimation of Storm Runoff.” Water Resources Bulletin. 11(5).
Hernandez, M., Miller, S.N., Goodrich, D.C., Goff, B.F., Kepner, W.G., Edmonds, C.M., and Jones, K.G. (2000). “Modeling Runoff Response to Land Cover and Rainfall Spatial Variability in Semi-arid Watersheds.” J. Environmental Monitoring and Assessment, 64:285-298.
Kepner, W.G., Semmens, D.J., Bassett, S.D., Mouat, D.A., Goodrich, D.C. (2004). “Scenario Analysis for the San Pedro River, Analyzing Hydrological Consequences of a Future Environment.” J. Environmental Monitoring and Assessment, 94:115-127.
McLin, S. G., Springer, E. P., and Lane, L. J. (2001). “Predicting Floodplain Boundary Changes Following the Cerro Grande Wildfire.” Hydrological Proc., 15(15): 2967-2980.
Miller, S.N., Kepner, W.G., Hernandez, M., Miller, R.C., Goodrich, D.C., Heggem, D.L., Mehaffey, M.L., Devonald, F.K., and Miller, W.P. (2002). “Integrating Landscape Assessment and Hydrologic Modeling in Land Cover Change Analysis.” J. American Water Resources Association, 38(4):915-929.
Robichaud. P.R. Beyers, J. L., Neary, D.G. (2000). Evaluating the Effectivenessof Postfire Rehabilitation Treatments. United States Forest Service Rocky Mountain
Research Station General Technical Report RMRS-GTR- 63.Smith, R.E., Goodrich, D.C., Woolhiser, D.A., and Unkrich, C.L. (1995). KINEROS – A
kinematic Runoff and Erosion Model; Chapter 20 in V.P. Singh (editor), Computer Models of Watershed Hydrology, Water Resources Pub., Highlands Ranch, Colorado, 1130 pp.
Smith, R. E. and Parlange, J. Y, (1978). “A Parameter Efficient Hydrologic Infiltration Model.” Water Resources Research, 14(3):533-538.
Springer, E. and Hawkins, R.H. (2005). “Curve Number Peakflow Response Following the Cerro Grande Fire on a Small Watershed”. Amer. Society of Civil Eng. Watershed Management Conference, Williamsburg, VA, July 19-22, 2005 CD Proceedings, p, 1-12.
USDA. (1986) Urban Hydrology for Small Watersheds. United States Department of Agriculture Natural Resources Conservation Service Technical Release 55.
DisclaimerAny opinions, findings, and conclusions or recommendations expressed in this material are those of the
author(s) and do not necessarily reflect the views of SAHRA or of the National Science Foundation.