automatic detection of the wolff-parkinson-white · pdf fileshown, as well as the duration of...
TRANSCRIPT

Automatic Detection of the Wolff-Parkinson-White Syndrome fromElectrocardiograms
Hassan Adam MAHAMAT1, Sabir Jacquir1, Cliff Khalil2, Gabriel Laurent2,Stephane Binczak1
1Le2i UMR6306, CNRS, Arts et Metiers, Univ. Bourgogne Franche-Comte, Dijon, France2University Hospital of Dijon, France
Abstract
In this paper, a new method of automatic detection ofthe Wolff-Parkinson-White (WPW) syndrome is proposedbased on electrocardiograms (ECGs) signals. Firstly, withthe continuous wavelet transform (CWT), the P wave, theT wave and the QRS complex are identified. Then, theirdurations are also computed after determination of theboundaries (onsets and offsets of the P, T waves and theQRS complex). Secondly, the PR interval, the QRS com-plex interval and the area of the QRS complex are deter-mined in order to detect the presence or not of the deltawave. This method has been tested on ECGs signals frompatients affected by the WPW syndrome in order to eval-uate its robustness. It can provide assistance to cardiolo-gists during the interpretation of the ECG.
1. Introduction
The WPW syndrome is a cardiac conduction problemassociated with reentry tachycardia and it may even beresponsible of sudden cardiac death [1]. This congenitalabnormality corresponds to a short circuit between atriaand ventricles due to the presence of an accessory path-way (AP). In Europe, the prevalence of the WPW syn-drome is about 0.15 to 0.31%, and it is the second mostcommon cause of paroxysmal supraventricular tachycar-dia. The WPW syndrome can be diagnosed on a 12-leadstandard ECG, it is described in an ECG by three features[2]: Short PR interval, prolonged QRS duration and pres-ence of a wave so-called delta in the QRS complex. Asidefrom medical anti-arrhythmic drugs, the main treatment isbased on the physical eradication of the AP by applying ra-diofrequency energy with a dedicated lead on its precise lo-cation, using endovascular techniques. Up to now, its pre-cise location around tricuspid or mitral annulus is based onnon-practical algorithms that have been published over theyears [3]. We have developed a completely new methodbased on the whole complex QRS morphology analysis, asopposed to previous algorithms based on delta wave pat-terns only. This method allows us to detect the P wave,
the QRS complex and the T wave, and to determine theirbounderies (onset and offset of the P, T waves and the QRScomplex).
In figure 1, the different intervals in a typical ECG areshown, as well as the duration of each wave is illustratedwith a heart rate is between 60-90 bpm. This algorithm al-lows us to effectively detect intervals and durations of thewaves (P, QRS complex and T) as described on figure 1.It has been tested on real signals from the University Hos-pital of Dijon (UHD) database (see section 2) in order toconfirm its robustness. Then, one computes the area of thedelta wave to complete the detection criteria of the Wolff-Parkinson-White syndrome cited above.
Figure 1. Illustration of waves and intervals in an ECG(Source:httpintranet.tdmu.edu.uadatakafedra).
Presence of delta wave.
P QRS TQTQT
PR
A
Absence of delta wave.
PR
QRS TP
B
Figure 2. Schematic representation of the presence or ab-sence of the delta wave: In (A) the QRS complex with adelta wave and (B) without the delta wave.
In figure 2, we show the difference between a QRS com-plex with delta wave and a QRS complex without the deltawave: The segment of the QRS complex with the delta
Computing in Cardiology 2016; VOL 43 ISSN: 2325-887X DOI:10.22489/CinC.2016.120-278
wave is greater to the segment of the QRS complex with-out the delta wave. However, the interval of PR with thedelta wave is less than the interval of PR whithout the deltawave, and the QT interval is preserved.After having determined the three criteria (PR interval,QRS complex interval and delta wave) correctly, this algo-rithm should help physicians in their daily clinical practiceduring treatment of the syndrome. This study is describedas follows: In section 2, the database is described, thenthe developed algorithm is explained in section 3 thus, thecalculation of the area of the delta wave. In order to illus-trate our method, some results are illustrated in section 4.Section 5 presents the conclusion and the discussion.
2. Database
University Hospital of Dijon (UHD): This database con-tains ECGs signals with 12 channels. It contains 40 pa-tients affected by the WPW syndrome. For each patient,we have 2 records before treatment and 2 records aftertreatment of WPW syndrome. Each signal is digitized at1000 samples per second, with 16 bits resolution over arange of 5mV. Figure 3 shows the delta wave. In figure 4,the patient has been successfully treated, and thus the deltawave has disappeared.
Figure 3. A standard ECG signal before treatment (fromthe UHD database).
Figure 4. A standard ECG signal after treatment (from theUHD database).
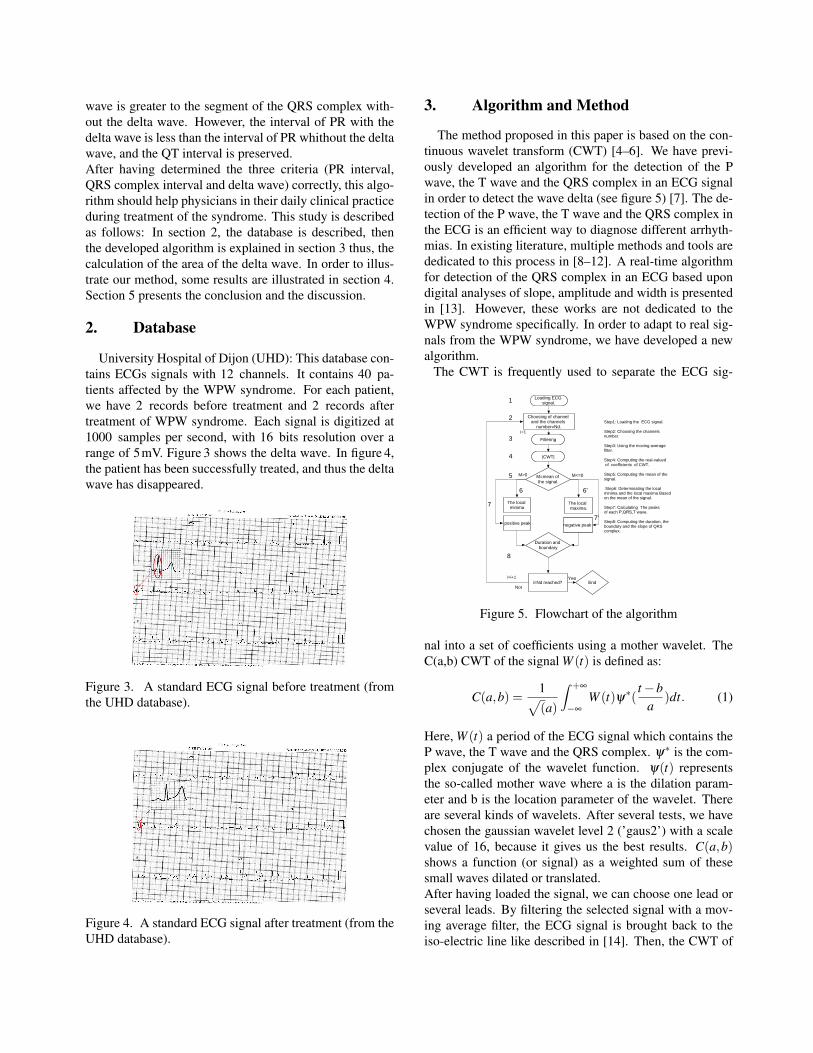
3. Algorithm and Method
The method proposed in this paper is based on the con-tinuous wavelet transform (CWT) [4–6]. We have previ-ously developed an algorithm for the detection of the Pwave, the T wave and the QRS complex in an ECG signalin order to detect the wave delta (see figure 5) [7]. The de-tection of the P wave, the T wave and the QRS complex inthe ECG is an efficient way to diagnose different arrhyth-mias. In existing literature, multiple methods and tools arededicated to this process in [8–12]. A real-time algorithmfor detection of the QRS complex in an ECG based upondigital analyses of slope, amplitude and width is presentedin [13]. However, these works are not dedicated to theWPW syndrome specifically. In order to adapt to real sig-nals from the WPW syndrome, we have developed a newalgorithm.
The CWT is frequently used to separate the ECG sig-
1
2
3
4
i=Nd reached?
Loading ECG signal.
Choosing of channel and the channels
number=Nd.
Not
YesEnd
M>0
Step1: Loading the ECG signal.
Step2: Choosing the channels number.
Step3: Using the moving average filter.
Step4: Computing the real-valued of coefficients of CWT.
Step5: Computing the mean of the signal.
Step6: Determinating the local minima and the local maxima Based on the mean of the signal.
Step7: Calculating The peaks of each P,QRS,T wave.
Step8: Computing the duration, the boundary and the slope of QRS complex.
M<=0M=mean of the signal.
Filtering
|CWT|
Duration and boundary
5
The local maxima.
The local minima
positive peak negative peak
6'6
7'
7
8
i=1
i=i+1
Figure 5. Flowchart of the algorithm
nal into a set of coefficients using a mother wavelet. TheC(a,b) CWT of the signal W (t) is defined as:
C(a,b) =1√(a)
∫ +∞
−∞
W (t)ψ∗(t −b
a)dt. (1)
Here, W (t) a period of the ECG signal which contains theP wave, the T wave and the QRS complex. ψ∗ is the com-plex conjugate of the wavelet function. ψ(t) representsthe so-called mother wave where a is the dilation param-eter and b is the location parameter of the wavelet. Thereare several kinds of wavelets. After several tests, we havechosen the gaussian wavelet level 2 (’gaus2’) with a scalevalue of 16, because it gives us the best results. C(a,b)shows a function (or signal) as a weighted sum of thesesmall waves dilated or translated.After having loaded the signal, we can choose one lead orseveral leads. By filtering the selected signal with a mov-ing average filter, the ECG signal is brought back to theiso-electric line like described in [14]. Then, the CWT of

the selected signal W (t) is calculated and noted C(a,b). Inthe first step, the local minima and maxima are computeddepending the mean M of the signal C(a,b):• if M > 0 one computes the local minima,• else one computes the local maxima.As a second step, peaks of the P wave, the T wave and theR wave are also determinated depending on the mean ofthe signal S :• if M > 0 the amplitude and the position of the peak ofeach wave are calculated,• else the amplitude and the positions of the peak of eachwave are also calculated.As a third step, the closest local maxima and local minimato the position of each postive peak of each wave (P, QRSand T) or each negative peak of each wave (P, QRS and T)are automatically measured and located in time. After that,one determines the boundary, the interval and duration ofeach wave (P, QRS, T).
Knowing that the detection of the WPW syndrome re-quires the detection of three criteria mentioned above, thePR interval and the QRS complex duration are determinedeffectively. The final criterion is the detection of the deltawave. It is often difficult to see the delta wave on an ECGsignal. To overcome this problem, one calculates the peakof the R wave noted M1 at time noted I1, then one com-putes the area A1 between the onset of QRS complex notedQ1 and I1. Then, area A2 is computed between I1 and theend of QRS complex noted Q2. Then, we calculate theratio, noted A, between these 2 areas.
A =
∫ Q2I1 W (t)dt∫ I1Q1 W (t)dt
(2)
This criterion is an additional criterion, A is computed onlyin the QRS complex, if A is close to 1, there is no deltawave, if A is close to 0 or low, there is delta wave.
4. Results
Some results of the wave detection, intervals and thedelta wave are shown here.
4.1. Waves detection
In this section, the rate of the wave detection is given fortreated patients and not treated patients.
4.1.1. Untreated patient
When a patient is not treated, one can observe the pres-ence of delta wave, because its presence disturbs the detec-tion of the P wave, the interval of PR. The P offset and theQRS onset are the same. That is why in table 1, the rate ofP wave is low, due to the existence of delta wave.
Table 1. Untreated patient: Cumulative mean of the inter-vals of PR, QT, QRS and the rate of waves detection.
UP P QRS TRWD 44.44% 80.07% 79%
PRi QRSi QTiCM 0.106s ±0.003 0.306s ±0.05 0.072s ±0.004
RWD=Rate of Wave Detection, UP=untreated patient, PRi=PR intervalQTi=QT interval, QRSi=QRS interval, CM=Cumulative Mean.
Table 1 shows a short PR interval and a prolonged QRSinterval.
4.1.2. Treated patient
One shows the rate of waves detection of a treated pa-tient.
Table 2. Treated patient: Cumulative mean of the intervalsof PR, QT, QRS and the rate of waves detection.
TP P QRS TRWD 76.19% 97.92% 86.46%
PRi QRSi QTiCM 0.168s ±0.025 0.305s ±0.025 0.072s ±0.028
RWD=Rate of Wave Detection, TP=Treated patient, PRi=PR interval,QTi=QT interval, QRSi=QRS interval, CM=Cumulative Mean.
Table 2 shows a better rate detection, because these pa-tients have beeen treated and thus the delta wave has dis-appeared. As shown in table 2 the PR interval and QRSinterval become normal in the case where the patient istreated. One can note that the PR interval is larger than theone obtained in the case of untreated patient. On the con-trary, the QRS complex is smaller than the computed valuepresented in table 1.
4.2. Delta wave detection
In this case, we can quantify the delta wave by calculat-ing the area of the QRS complex by using eq (2).
4.2.1. Rate of delta wave detection
Here, one presents the rate of delta wave detection andan illustration of the measure of the surface of wave delta.Our indicator has been tested on 80 ECGs signals frompatients affected the WPW syndrome.
Table 3. Untreated patient: The rate of detectionRD DWD(%) DWND(%)
80 ECGs Signals 64 (80%) 16(20%)RD=rate of detection, DWD = delta wave detected, DWND=delta wave no detected.
As shown on table 3, we have tested 80 ECGs signals,we have 80% of good detection and 20% of bad detection.

4.2.2. Untreated patient
When the delta wave exists, with the eq. (2), A is notclose of 1.
Time(ms)0 20 40 60 80 100 120
Am
plitu
de(u
.a)
-0.5
0
0.5
1
1.5
2
2.5
3
3.5
S2=42.6u.aS1=61.06u.a
M1
I1
Q2
Q1
Figure 6. Representative schema and calculating the areaof the QRS complex.
4.2.3. Treated patient
In the case presented in figure 7 the delta wave does notexist, the eq. (2) gives a value of A close to 1, that indicatesthe absence of the delta wave.
0 10 20 30 40 50 600
1
2
3
4
5
6
7
8
Time(ms)
amplitude(u.a)
QRS complex
S1=67.83u.S2=73.76u.a
M1
I1
Q2Q1
Figure 7. Representative schema and calculating the areaof the QRS complex
5. Discusion and conclusion
In this study, we have determined the P wave, the T waveand the QRS complex in ECGs signals from patients af-fected by the WPW syndrome. Then, we have also local-ized their limits (onset and offset). Different intervals (PRinterval, QT interval) and the QRS complex duration arecomputed. We have quantified the area where there maybe the delta wave. Using our UHD database, we obtained80% of good detection. An alternative way to quantify thedelta wave could also be reached by modeling the QRScomplex by the superposition of two gaussians waves us-ing a Gaussian mixture model [15].
References
[1] Gollob M. Identification of a gene responsible for familialwolff–parkinson–white syndrome. New England Journal ofMedicine 2001;344(24):1823–1831.
[2] Chung KY, Walsh TJ, Massie E. Wolff-parkinson-whitesyndrome. American heart journal 1965;69(1):116–133.
[3] Jezior MR, Kent SM, Atwood JE. Exercise testing in wolff-parkinson-white syndrome: case report with ecg and litera-ture review. Chest Journal 2005;127(4):1454–1457.
[4] Addison PS. Wavelet transforms and the ecg: a review.Physiological measurement 2005;26(5):R155.
[5] Addison P, Grubb N, Clegg G, Robertson C, Fox K, WatsonJ, et al. R-wave detection using continuous wavelet mod-ulus maxima. In Computers in Cardiology, 2003. IEEE,2003; 565–568.
[6] et al OM. Ventricular late potentials characterizationin time-frequency domain by means of a wavelet trans-form. IEEE transactions on biomedical engineering 1994;41(7):625–634.
[7] Mahamat HA, Jacquir S, Khalil C, Laurent G, Binczak S.Wolff-parkinson-white (wpw) syndrome: The detection ofdelta wavein an electrocardiogram (ecg). 38th Annual Inter-national Conference of the IEEE Engineering in Medicineand Biology Society 2016;.
[8] Yochum M, Renaud C, Jacquir S. Automatic detection ofp, qrs and t patterns in 12 leads ecg signal based on cwt.Biomedical Signal Processing and Control 2016;25:46–52.
[9] Li C, Zheng C, Tai C. Detection of ecg characteristic pointsusing wavelet transforms. Biomedical Engineering IEEETransactions on 1995;42(1):21–28.
[10] Pahlm O, Sörnmo L. Software qrs detection in ambulatorymonitoringâATa review. Medical and Biological Engineer-ing and Computing 1984;22(4):289–297.
[11] Hamilton PS, Tompkins WJ. Quantitative investiga-tion of qrs detection rules using the mit/bih arrhythmiadatabase. Biomedical Engineering IEEE Transactions on1986;(12):1157–1165.
[12] Trahanias P. An approach to qrs complex detection usingmathematical morphology. Biomedical Engineering IEEETransactions on 1993;40(2):201–205.
[13] Pan J, Tompkins WJ. A real-time qrs detection algo-rithm. Biomedical Engineering IEEE Transactions on 1985;(3):230–236.
[14] Keselbrener L, Keselbrener M, Akselrod S. Nonlinear highpass filter for r-wave detection in ecg signal. Medical engi-neering physics 1997;19(5):481–484.
[15] Reynolds D. Gaussian mixture models. Encyclopedia ofbiometrics 2015;827–832.
Address for correspondence:
Hassan Adam MAHAMATLe2i UMR6306, CNRS, Arts et Metiers, Univ. BourgogneFranche-Comte, 9 Avenue Alain Savary,21000 Dijon, [email protected]