automobile radiator design and validation · 2018-11-29 · the design has been physically verified...
TRANSCRIPT

International Research Journal of Engineering and Technology (IRJET) e-ISSN: 2395-0056
Volume: 05 Issue: 11 | Nov 2018 www.irjet.net p-ISSN: 2395-0072
© 2018, IRJET | Impact Factor value: 7.211 | ISO 9001:2008 Certified Journal | Page 1358
AUTOMOBILE RADIATOR DESIGN AND VALIDATION
Ruchit Doshi1, Shakshi Himmatramka2, Janam Sanghavi3, Jahnavi Patel4, Vinit Katira5
1,2,3Graduate Student, Mechanical Engineering, DJ Sanghvi College of Engineering, Mumbai, India 4U.G. Student, Electronics and Telecommunications Engineering, DJ Sanghvi College of Engineering, Mumbai, India
5Assistant Professor, Mechanical Engineering, DJ Sanghvi College of Engineering, Mumbai, India ---------------------------------------------------------------------------***---------------------------------------------------------------------- Abstract:- The purpose of this research is to primarily design a cooling system for a formula styled race-car which is entirely designed, manufactured and tested by graduate students from colleges across the world. The primary requirements of the vehicle are to have high acceleration, low weights and an ability to endure. Keeping in mind the following requirements and some governing rules made by the sanctioning bodies, the students begin their design procedure. The engine used by us for the vehicle is a 4-stroke single cylinder 390 cc one, opted for its excellent power to weight ratio. The approach towards the design of the cooling system has not only been a theoretical one, but also a pragmatic one. This research begins with experimentally determining some important data of the engine. This data is used to determine the quantified requirements of the system during the various modes of vehicle operation. Based on the targeted values, the sizing of the radiator is done using basic heat transfer concepts. Further optimization is done using CFD analysis. The reason for not opting for a conventional wind tunnel is that it does not holistically validate the system's capability. This research involves the development of a procedure to validate the system in its operational state on the vehicle. Various sensors are deployed around the vehicle to acquire real time data which is further processed to determine the actual efficiency of the system. Based on the above approach, a fruitful way of validating the cooling system has been established and the co-relation between the expected and acquired results showed that both the values commensurate. The theoretical and CFD results were able to accurately predict the actual heat transfer at higher RPM and at lower RPM the predicted values were more than the actual heat rejection.
KeyWords: Heat transfer, CFD simulation, wind tunnel, on-track validation, data acquisition.
1. Introduction
Formula Student is an SAE affiliated student level design competition, where students across the world design and fabricate a formula styled race car. The car is required to be light weight, quick and enduring. The official team of our college has been participating in these competitions since 2014. A combustion power-train with a single cylinder 390 cc engine has been used to power the vehicle. The students are required to abide to the rule book made by the respective sanctioning bodies of the competitions. As per the rules, the coolant to be used is distilled water and hence this paper is based on the research carried out by us to design a custom cooling system for the vehicle. Basic heat transfer concepts along with C.F.D analysis will be used for the optimization of the same. The inputs for the calculations and further analysis have been experimentally obtained and the complete validation of the design has been physically verified using a standalone D.A.Q system.
2. Methodology:
Various experiments were performed to determine the engine characteristics. The data obtained from these experiments was then used for theoretical calculations, CFD and validation. Initially, the radiator was sized considering the engine load to cooling system by theoretical calculations. These calculations were also used to determine radiator performance at various air velocities passing through radiator and mass flow rate of coolant. These values were cross verified using CFD
simulations in Star CCM+. The radiator was then manufactured and tested practically with various sensors installed and data was logged in dynamic condition. Comparison is made between the above results to determine variation in actual performance and designed performance.
3. Flowchart:
Fig. 1: Methodology Flowchart
4. Experiments:
4.1. Experiment to determine engine load to cooling system:
The engine used for powering the vehicle had values of stock power and torque as 32 kW and 35 Nm respectively. Before starting the fundamental design and calculations, certain engine parameters are required. Hence, an experiment was performed for calculating the change in the temperature of the coolant across the engine at different crankshaft rotation speeds. A system comprising of the engine, two thermistors and a pressure cap in series was used as shown in the figure

International Research Journal of Engineering and Technology (IRJET) e-ISSN: 2395-0056
Volume: 05 Issue: 11 | Nov 2018 www.irjet.net p-ISSN: 2395-0072
© 2018, IRJET | Impact Factor value: 7.211 | ISO 9001:2008 Certified Journal | Page 1359
below for calculating the change the temperature of the coolant. The thermistor readings were logged with the help of a data logger. The ΔT has been used for calculating the cooling load of the engine.
Fig 1: Experimental Setup
Table 1: Temperature difference across engine at different engine RPM
Engine Speed
Coolant Temperature Sensor
(T1) (T2)
2500 70 70 68.5
3500 76 76.3 72.6
4500 78 77.8 73.7
5500 80 79.85 75.1
6500 82 82 76.6
7500 82 82.4 77.5
Chart 1: Temperature difference across engine at different engine RPM
4.2. Experiment to determine mass flow rate of coolant at various engine RPM:
This experiment was conducted to determine the mass flow rate of the water as a function of engine crankshaft rotation speed. The mass flow rate of water is varied
with the pump which is geared to the engine crankshaft. This test was hence performed to find mass flow rate of the water at different crankshaft rotation speed. The engine speeds at which the experiment was performed were from 2000 rpm to 7500 rpm. A digital flow-meter was used in series with the engine, radiator, two thermistors and a pressure cap. Following is the set-up of the experiment performed.
Fig 2: Experimental Setup
Table 2: Mass flow rate of coolant at various engine RPM
5. Theoretical Calculations to determine radiator sizing and performance at different load:
5.1. Formulae:
65
70
75
80
85
2500 3500 4500 5500 6500 7500Co
ola
nt
Tem
per
atu
re
Engine Speed in RPM
Temperature across the engine
T1
T2
RPM Mass flow rate (LPM) Mass flow rate (kg/s)
2500 10.78 0.18326
2800 13.76 0.23392
3500 14.2 0.24157
4500 19.79 0.33643
5000 21.65 0.36805
5500 22.575 0.38378
6000 23.5 0.3995
7500 27.57 0.46869
Engine

International Research Journal of Engineering and Technology (IRJET) e-ISSN: 2395-0056
Volume: 05 Issue: 11 | Nov 2018 www.irjet.net p-ISSN: 2395-0072
© 2018, IRJET | Impact Factor value: 7.211 | ISO 9001:2008 Certified Journal | Page 1360
5.2. Water-side calculations:
5.3. Air-side calculations:
√
5.4. NTU Method:
Where,
Height-H
Length-L
Width-W
Thickness-t
Cross-sectional area-Acs
Surface Area-As
Perimeter-P
Hydraulic diameter-Dh
Mass flow rate-m

International Research Journal of Engineering and Technology (IRJET) e-ISSN: 2395-0056
Volume: 05 Issue: 11 | Nov 2018 www.irjet.net p-ISSN: 2395-0072
© 2018, IRJET | Impact Factor value: 7.211 | ISO 9001:2008 Certified Journal | Page 1361
Discharge-Qd
Velocity-V
Reynolds Number-Re
Factor for Nusselt number-α
Nusselt number-Nu
Convective Heat Transfer Coefficient-h
Frontal area-A
Fin constant-mf
Corrected length-Lc
Fin density-ρf
Base surface area-Ab
Total base surface area-Abase
Conductive heat transfer co-efficient-k
Efficiency-η
Overall Efficiency-ηo
Overall heat transfer co-efficient-U
Number of transfer units-NTU
Capacity ratio-C
Effectiveness-ε
Temperature-T
Density-ρ
Dynamic viscosity-µ
Kinematic viscosity-ν
Prantdl number-Pr
Specific heat at constant pressure-Cp
Number-n
Velocity Inside the radiator-Vr
Dynamic pressure drop-Pd
Subscripts:
t-tube
f-fin
h-hot fluid(water)
c-cold fluid(air)
R-radiator
C-core
Known data:
Water parameters:
ρh=960.84kg/m3
µh=2.9×10⁻⁴kg/ms
kh=0.67862W/mK
Prh=1.7438
Cph=4.08×10³J/kgK
Air Parameters:
ρc=1.1459kg/m3
kc=0.0267W/mK
Prc=0.71317
νc=1.65×10⁻⁵
µc=1.89×10⁻⁵
Cpc=1.01×10³J/KgK
Tube parameters:
Wt=0.0166m
Lt=0.002m
tt=0.0003
Fin Parameters:
Hf=0.0001m
Lf=0.008m
ρf=189
Variable Parameters:
nt, nC, Hr, mh, Vc, nr
Using the above calculations, heat rejected by radiator is been calculated at different air velocities and engine RPM. The results of these calculations and engine load experimentation values were analyzed and accordingly radiator specifications were finalized.

International Research Journal of Engineering and Technology (IRJET) e-ISSN: 2395-0056
Volume: 05 Issue: 11 | Nov 2018 www.irjet.net p-ISSN: 2395-0072
© 2018, IRJET | Impact Factor value: 7.211 | ISO 9001:2008 Certified Journal | Page 1362
6. CFD Analysis of the Radiator:
The 3D model of the radiator was created in Solid Works and was exported as a single surface in the form of an IGS file. The initial designs were modeled as one section and features that didn’t take part in the internal flow were suppressed.
Meshing and CFD analysis were done using Star CCM+. Star CCM+ is a comprehensive engineering simulation package for solving problems involving flow (of fluids or solids), heat transfer and stress.
6.1. Geometry:
The core of the radiator was represented by a cuboid which was then given a porous media. The core is of the dimension from the theoretical calculations that is 255×210×30mm. The header above the radiator has an inlet pipe and the header below had the outlet pipe which directed the flow of water. Two cuboids were created in front and behind the radiator to represent the air region.
Before the meshing and selecting physical model, the inlet and outlet for the two fluids and Interfaces between different bodies were created. In order to set up different boundaries a new region was created.
6.2. Meshing:
The meshing models chosen for the flow analysis were
Trimmer and Surface Remesher
Fig 3: Geometry for CFD simulations.
Fig 4: Final mesh
6.3. Mesh:
In order to reduce the CPU time and the load on the computer, the core section of the geometric model was given a finer mesh then the other regions of the geometry.
The base size for the core section was set to 0.64m
The base size for the air region was set to 2.56m
6.4. Physical models:
For the radiator, the physical model was selected deciding the type of flow.
As there are two fluids in the analysis, different models were created.
Three dimensional
Gradient
Steady flow
Constant density
Segregated fluid flow
Turbulent
K-epsilon turbulence
Two Layer All y + Wall Treatment
Realizable K- Epsilon two Layer
Reynolds- Average Navier- Stokes
Segregated Fluid Temperature
Air physical model:
Gas
Water physical model:
Liquid
6.5. Boundary Conditions:
Coolant inlet Mass flow rate
Coolant outlet Pressure outlet
Air inlet Velocity inlet
Air outlet Pressure outlet
International Research Journal of Engineering and Technology (IRJET) e-ISSN: 2395-0056
Volume: 05 Issue: 11 | Nov 2018 www.irjet.net p-ISSN: 2395-0072
© 2018, IRJET | Impact Factor value: 7.211 | ISO 9001:2008 Certified Journal | Page 1363
6.6. Inertial and viscous resistance:
Water side resistance:
The pressure drop across the tube was calculated by Darcy-Wiesbach equation
Pressure drop =
Where,
fD= coefficient of friction = 0.0014 (Moody’s chart)
ρ = density = 960.84kg/m3
Dh =
= 1.45×10⁻³m
V=
Ht = 0.3m
Mass flow rate of water from engine
Mass flow rate of water
in a tube
Velocity of water in
tube
Pressure drop
0.3995kg/s 0.01kg/s 0.39m/s 505.19Pa
0.24157kg/s 0.00603kg/s 0.2363m/s 885.6Pa
To compute porous media coefficients
X= heat exchanger thickness through which pressure drop takes place
D= viscous coefficient
µ= viscosity
C= inertial coefficient
Ρ= Density
By substituting the values,
And solving simultaneously,
D= 86415557
C=110.7
Air side resistance:
This data was provided by the manufacturer
D=456
C=92
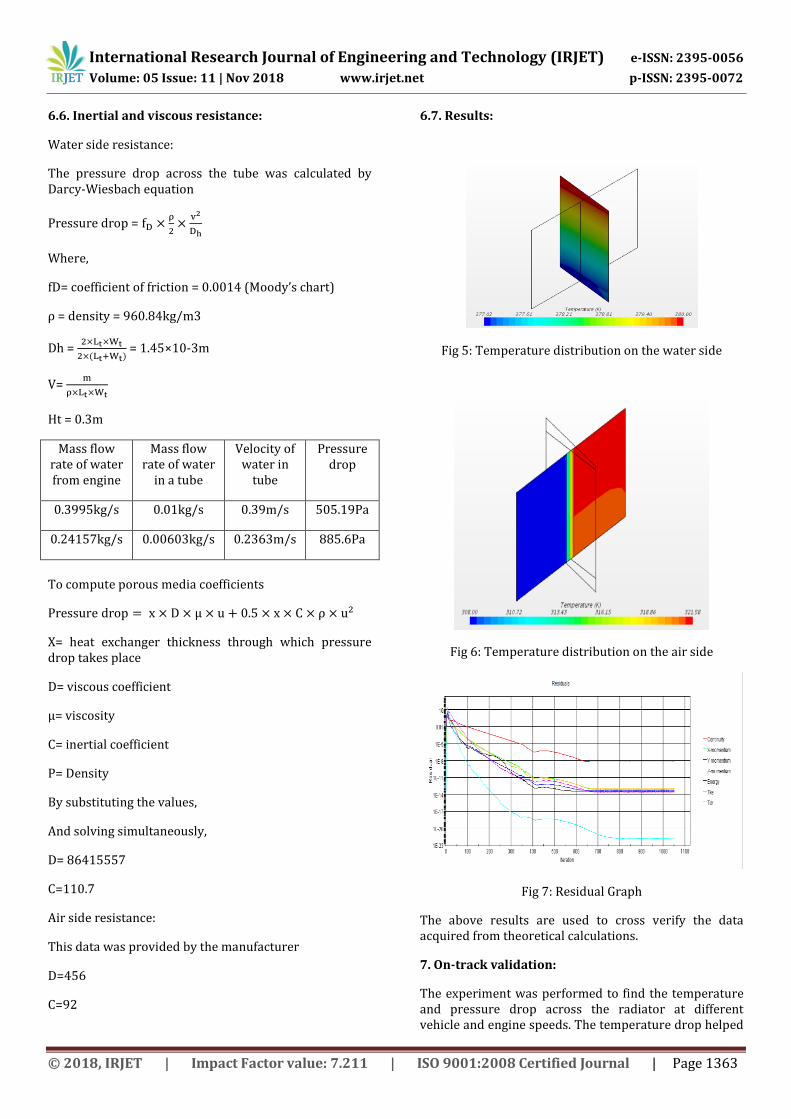
6.7. Results:
Fig 5: Temperature distribution on the water side
Fig 6: Temperature distribution on the air side
Fig 7: Residual Graph
The above results are used to cross verify the data acquired from theoretical calculations.
7. On-track validation:
The experiment was performed to find the temperature and pressure drop across the radiator at different vehicle and engine speeds. The temperature drop helped

International Research Journal of Engineering and Technology (IRJET) e-ISSN: 2395-0056
Volume: 05 Issue: 11 | Nov 2018 www.irjet.net p-ISSN: 2395-0072
© 2018, IRJET | Impact Factor value: 7.211 | ISO 9001:2008 Certified Journal | Page 1364
us determine the actual heat rejected by the radiator and the dynamic pressure difference was used to calculate the air velocity passing through the radiator.
The radiator was equipped with two thermistors, one at coolant inlet pipe and the other at coolant outlet pipe, both pipe having same diameter. Two differential pressure sensors one for static pressure drop and one for dynamic pressure drop were also installed in the radiator. To measure the dynamic pressure drop, the probes were positioned perpendicular to the airflow at the upstream and the downstream face of the radiator and to measure static pressure drop, the probes were positioned parallel to the airflow.
Fig 8: Probes position in radiator to measure dynamic and static pressure drop
The air velocity was calculated by dynamic pressure drop using the following equation,
Pd - Dynamic pressure drop
Pu – Static pressure drop
V - Velocity
ρ - Density
The sensors were connected to a data logger system and logged the data in the dynamic condition. The engine was initially fired at idle and then the car was made to follow a circular path of constant radius while keeping the engine speed constant. The procedure was repeated for different radii while keeping the RPM same so as to achieve various air velocity across the radiator. Then, the engine speed was changed and the procedure was redone. Hence, we obtained pressure and temperature drop values at various engine speeds and air velocities.
Fig 9: Thermistors’ position on radiator
Fig 10: Pressure sensors installed on the radiator.
8. Result and Conclusion:
Mass flow rate of coolant and air velocity through radiator, from the data acquired, were compared to that deduced by different theoretical methods. All the data was calculated, simulated and recorded at specific engine RPM and vehicle velocities.
It was observed that at lower vehicle speeds, the heat rejected by the radiator during practical experiment was almost similar to the calculated value of heat rejected and it was 5% lower when compared to the CFD results. As the vehicle velocity increased, the actual heat rejected by the radiator reduced and the difference between results acquired by different methods increased up to 25%. Therefore, the theoretical and CFD results were able to accurately predict the actual heat transfer at lower vehicle speeds and at higher vehicle speeds, the predicted values were more than the actual heat rejection. This was probably due to the separation of flow in the sidepod.

International Research Journal of Engineering and Technology (IRJET) e-ISSN: 2395-0056
Volume: 05 Issue: 11 | Nov 2018 www.irjet.net p-ISSN: 2395-0072
© 2018, IRJET | Impact Factor value: 7.211 | ISO 9001:2008 Certified Journal | Page 1365
Table 3: Temperature difference of coolant across radiator and cooling load values at different engine speeds and air velocities
Temperature Difference Load (kW) Temperature Difference Load (kW) Temperature Difference Load (kW)
7500 0.46869 4 2.6 4959 3 5722 2.53 4826
7500 0.46869 8 3.66 6981 4.1 7820 3.42 6523
7500 0.46869 12 4.4 8392 4.8 9155 4.13 7877
7500 0.46869 16 4.97 9480 5.4 10300 5.09 9709
6500 0.401 4 2.99 4879 3.5 5712 2.31 3770
6500 0.401 8 4.19 6838 4.8 7833 3.57 5826
6500 0.401 12 5 8160 5.7 9302 3.89 6348
6500 0.401 16 5.63 9188 6.1 9955 4.39 7164
5500 0.38378 4 3.11 4857 3.4 5310 2.27 3545
5500 0.38378 8 4.35 6794 4.7 7341 3.21 5013
5500 0.38378 12 5.19 8106 5.8 9059 4.37 6825
5500 0.38378 16 5.83 9105 6.6 10308 4.75 7419
Practical Expirement
RPM Mass Flow Rate Air Velocity
Theoritical CFD
Chart 2: Comparison of heat rejected by the radiator calculated by different methods.
9. Applications:
This research involved the development of a procedure to validate the system in its operational state on the vehicle. The use of this kind of dynamic wind tunnel testing allowed us to test the cooling system without the use of a traditional wind tunnel hence, getting more accurate results according to the relevant conditions.
This methodology can also be used for passenger cars, trucks as well as for cooling system design of electrical components such as motors, high power circuits, etc.
10. References:
[1]. Heat and Mass Transfer by R.K. Rajput
[2]. A Heat Transfer Textbook by John H. Leinhard
[3]. Perry's Chemical Engineers' Handbook by Robert H. Perry and Don W. Green
[4]. Industrial Heat-Transfer Calculations by Mohammad G. Rasul
[5]. Heat and Mass Transfer by Rudramoorthy, R
[6].Computational Fluid Dynamics for Engineers by Bengt Andersson, Ronnie Andersson, Love Håkansson, Mikael Mortensen, Rahman Sudiyo, and Berend van Wachem
[7].Star CCM+ tutorials https://thesteveportal.plm.automation.siemens.com/
3000
4000
5000
6000
7000
8000
9000
10000
11000
7500 7500 7500 7500 6500 6500 6500 6500 5500 5500 5500 5500
He
at R
eje
cte
d b
y R
adia
tor
(kW
)
Engine Speed (RPM)
Theoretical
Practical
CFD
[8]. Measurement and sensors fundamentals http://www.efunda.com/designstandards/sensors/sensors_home/sensors_home.cfm
[9]. Computational Fluid Dynamics: Principles and Applications by J. Blaze