automotive china production outlook - cdn.ihs.comcdn.ihs.com/www/pdf/20170228-eng-tao.pdf · china...
TRANSCRIPT

© 2017 IHS Markit© 2017 IHS Markit. All Rights Reserved.
China Production OutlookNew normal: The slowdown and stimulus in China
AUTOMOTIVE
Gao Tao, Manager, Great China Light Vehicle Production, 0086-21-2422 9116, [email protected]
28 February 2017 | Tokyo, Japan

Contents
© 2017 IHS Markit
Agenda 3
Regional economic outlook 4
GDP development Disposable income Exchange rate Urbanization Demographic structure
Fluctuation in 2015–18 10
Inventory pressure Turbulence in financial market Engine displacement development
Long-term development 15
Entering adjustment phase NEV development OEM growth distribution Module platform Brand expansion & Multi-brand Domestic capacity expansion COEM R&D development Sharing economy COEM milestone of autonomy
China Production Outlook / February 2016
2

© 2017 IHS Markit 3
Economic outlook
Presentation Name / Month 2016

© 2017 IHS Markit 4
China’s long-term GDPGDP growth decelerates smoothly in coming decadesChina GDP growth
0
2
4
6
8
10
12
14
16
1990
1991
1992
1993
1994
1995
1996
1997
1998
1999
2000
2001
2002
2003
2004
2005
2006
2007
2008
2009
2010
2011
2012
2013
2014
2015
2016
2017
2018
2019
2020
2021
2022
2023
2024
2025
2026
2027
2028
2029
2030
Gro
wth
rate
(%)
World GDP2016: 2.5%2017: 2.8%2018: 3.1%
China GDP growth2016: 6.7%2017: 6.4%2018: 6.2%2019: 6.1%6.0
4.0
2017 Spring Automotive Conference | 8 March 2017
© 2017 IHS Markit 5
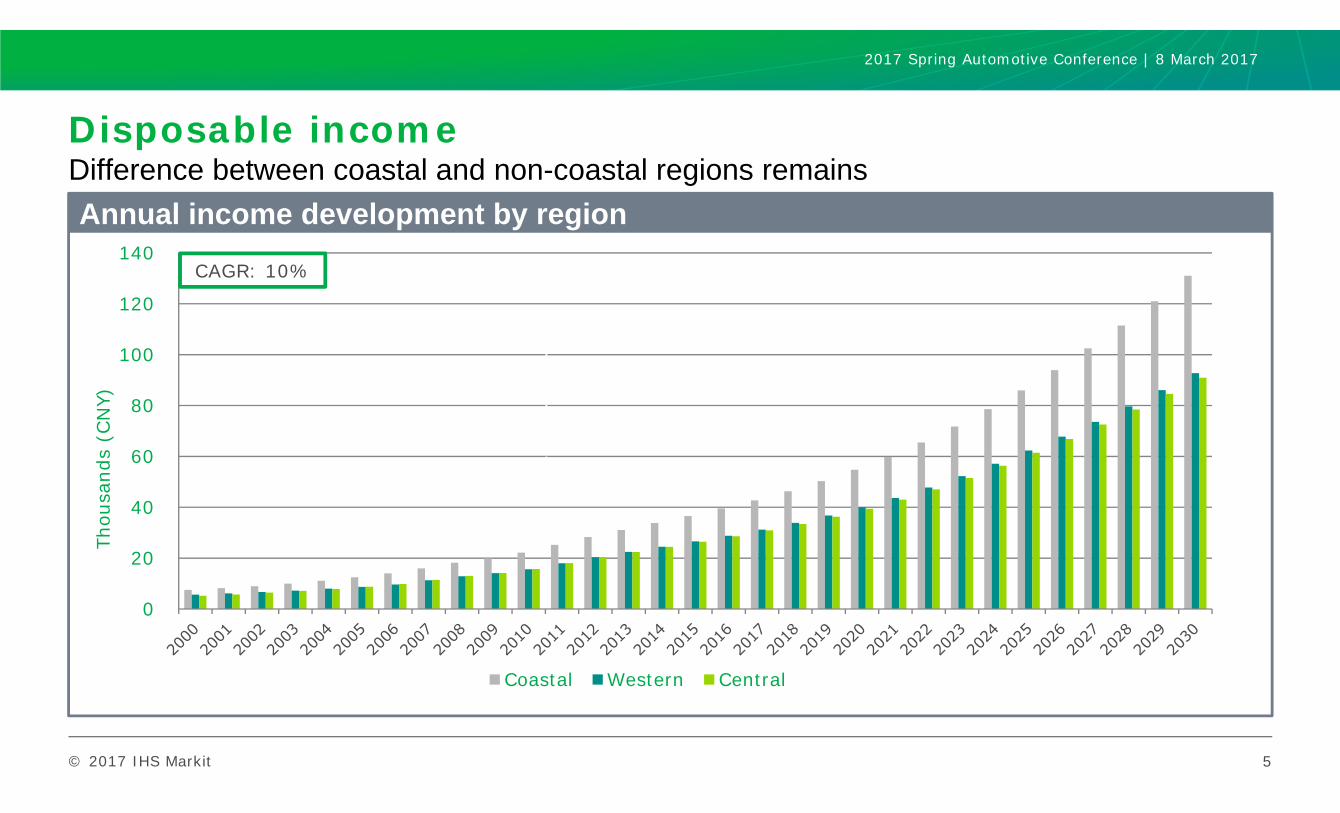
Disposable incomeDifference between coastal and non-coastal regions remainsgrowing rapidly generally; but slow down graduallyAnnual income development by region
0
20
40
60
80
100
120
140
Thou
sand
s (C
NY)
Coastal Western Central
CAGR: 10%
2017 Spring Automotive Conference | 8 March 2017

© 2017 IHS Markit
0.00
0.01
0.02
0.03
0.04
0.05
0.06
0.07
0.08
0.09
0
1
2
3
4
5
6
7
8
9
2000
2001
2002
2003
2004
2005
2006
2007
2008
2009
2010
2011
2012
2013
2014
2015
2016
2017
2018
2019
2020
2021
2022
2023
2024
2025
2026
2027
2028
2029
2030
CNY vs USD CNY vs JPY
Easy period for US & EU import-sourced models is overYuan is in new phase, making premium imports more expensive
6
CNY per currency unit
2017 Spring Automotive Conference | 8 March 2017

© 2017 IHS Markit 7
UrbanizationDeviation seen among different regions, with moderate growth expected to slowUrbanization rate
0%
1%
2%
3%
4%
5%
6%
7%
0
200
400
600
800
1,000
1,200
1,400
1,600
Urban population Rural population Urban popul. growth
Urbanization rate: 50%
Mill
ions
2017 Spring Automotive Conference | 8 March 2017

© 2017 IHS Markit 8
China’s demographic structureAmount of potential vehicle consumers is shrinking Share of demographic by age
0%
10%
20%
30%
40%
50%
60%
70%
80%
90%
100%
1950 1955 1960 1965 1970 1975 1980 1985 1990 1995 2000 2005 2010 2015 2020 2025 2030
0-19 20-59 60 up
Peak population in 2028: 1,416.4 million
61%
2017 Spring Automotive Conference | 8 March 2017

© 2017 IHS Markit 9
Fluctuation in 2015–18Recovery from recession by stimuli
Presentation Name / Month 2016

© 2017 IHS Markit
Inventory pressure since 2014
10
0
0.5
1
1.5
2
2.5
Jan Feb Mar Apr May Jun Jul Aug Sep Oct Nov Dec
2013 2014 2015
87%
7%2%4%
Sales structure
New vehicle After sales
Financial service Others
55%40%
5%
Margin structure
New vehicle After sales
Others
Mon
th
High inventory from Q4 2014 Pressure relief
Tax-cut policy started
Vehicle inventory level
Source: CADA Source: Gasgoo
Business structure of dealer
2017 Spring Automotive Conference | 8 March 2017
© 2017 IHS Markit
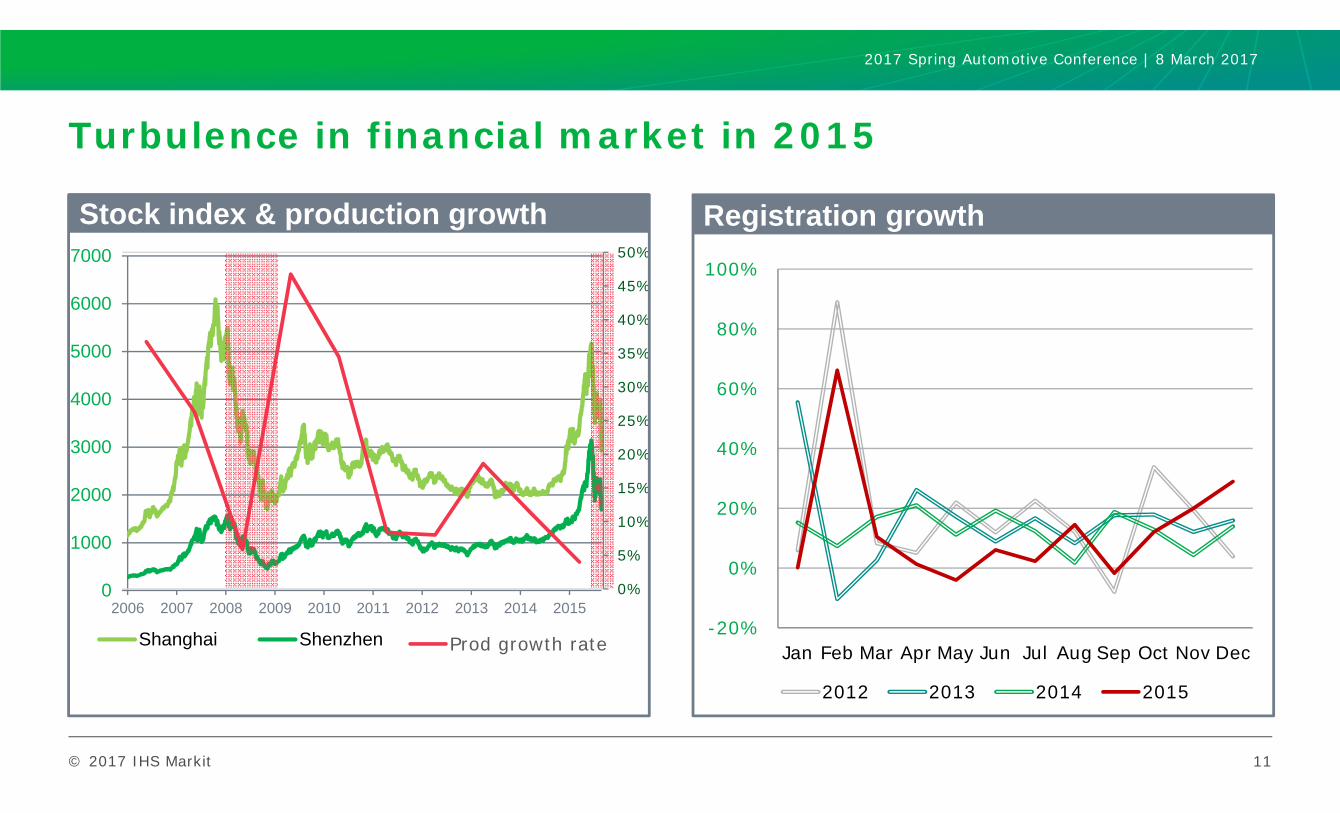
0
1000
2000
3000
4000
5000
6000
7000
2006 2007 2008 2009 2010 2011 2012 2013 2014 2015
Shanghai Shenzhen
0%
5%
10%
15%
20%
25%
30%
35%
40%
45%
50%
Prod growth rate
Turbulence in financial market in 2015
11
Stock index & production growth Registration growth
-20%
0%
20%
40%
60%
80%
100%
Jan Feb Mar Apr May Jun Jul Aug Sep Oct Nov Dec
2012 2013 2014 2015
2017 Spring Automotive Conference | 8 March 2017

© 2017 IHS Markit 12
Production development 2000–20Significant impacts by tax-cut stimulus policyAnnual volume and growth rate
0%
10%
20%
30%
40%
50%
60%
0
5
10
15
20
25
30
35
2000 2001 2002 2003 2004 2005 2006 2007 2008 2009 2010 2011 2012 2013 2014 2015 2016 2017 2018 2019 2020
Mill
ions
PC LCV Growth rate y/y
6%
Tax-cut policy as main driver
49%31%
3%
13%
3%0%
2017 Spring Automotive Conference | 8 March 2017

© 2017 IHS Markit
0
5
10
15
20
25
30
35
2000 2001 2002 2003 2004 2005 2006 2007 2008 2009 2010 2011 2012 2013 2014 2015 2016 2017 2018 2019 2020
Mill
ions
Engine share in policy stimulation periods
Europe 2017 production change, by type of shipmentsVolume trend and engine ratio
0
5
10
15
20
25
30
35
2000 2001 2002 2003 2004 2005 2006 2007 2008 2009 2010 2011 2012 2013 2014 2015 2016 2017 2018 2019 2020
Mill
ions
Ideal volume trend Actual volume trend
55%
Ratio of engine <=1.6 in passenger car sector
63% 62%
64%68%
70%
2017 Spring Automotive Conference | 8 March 2017

© 2017 IHS Markit 14
Long-term developmentWays to reach mature market
Presentation Name / Month 2016

© 2017 IHS Markit 15
China market enters adjustment phaseSlowing down gradually after 2019, a decline still not expectedProduction volume development
Growth phase Mature phaseAdjustment phase
0%
10%
20%
30%
40%
50%
60%
0
5
10
15
20
25
30
35
40
Mill
ion
s
PV LCV Growth rate y/y
6 million
2017 Spring Automotive Conference | 8 March 2017

© 2017 IHS Markit
OEM growth distribution 2016 to 2025 by body type
16
SUV
Sedan/Hatch
MPV
Rest of body type
General Motors+0.6 million+3.0% p.a.
Toyota+0.5 million+4.1% p.a.
Volkswagen+0.7 million+1.9% p.a.*
* p.a. = per annum
Geely+0.6 million+6.2% p.a.
Chery+0.3 million+5.2% p.a.
Renault-Nissan+0.3 million+2.7% p.a.
PSA+0.3 million+4.6% p.a.
Hyundai+0.3 million+1.6% p.a.
BAIC+0.3 million+4.1% p.a.
6.0+M
Rest of OEMs+2.1 million+2.2% p.a.
SUV still the strongest driver in the next decade. China’s main local OEMs will remain in over-average growth.
2017 Spring Automotive Conference | 8 March 2017

© 2017 IHS Markit
- 1 2 3 4 5 6 7 8 9
10 11 12 13
2011 2012 2013 2014 2015 2016 2017 2018 2019 2020 2021 2022 2023 2024 2025
Electric Plug-in hybrid Full hybrid Mild hybrid
Units: Million
+China-defined NEVs
xEVs=
China-defined NEVs
xEVs
Whole PVs
5 years CAGR 140%
131%
11%
2010~2015
49%
71%
5%
2015~2020
16%
30%
2%
2020~2025
17
NEV development
2017 Spring Automotive Conference | 8 March 2017

© 2017 IHS Markit
Modular platform of China brandsLocal OEMs are developing own modular platforms
Local brand ownedJoint venture & local cooperation
>30%
2017 Spring Automotive Conference | 8 March 2017

© 2017 IHS Markit
Brand expansion by joint venture and China brandsBrand diversification by local OEMs; further localization by joint venture OEMs PV Brand number
0
20
40
60
80
100
120
CY 2005 CY 2015 CY 2025Local brand JV non-Premium Premium brand
52
79
104
>20%
Production CAGR of premium brand
BAIC
Geely
GreatWall
Chery
Brilliance
Return of multi-brand strategy?
Production in 2025
Number of brands
9
5
3
4
5
SOP Nov2016
SOP June 2017
SOP April 2017
“Huarui”SOP April 2017
“Chery+Tata”SOP 2018
2017 Spring Automotive Conference | 8 March 2017

© 2017 IHS Markit
Domestic capacity expansion by China brandsMarket new entrants and NEV facilities as large contributors
20
1.3M
Harbin
Wuhan
Changzhou
ShangraoHangzhou
Ruili
Chongqing
Huanghua
BaojiZhenjiang
Miyun
Yangzhou
Urumqi
In 2016BAIC: Huanghua, Ruili, Zhenjiang, Miyun, ChongqingChangan: HarbinFDG: HangzhouHanteng: ShangraoJoylong: YangzhouDongfeng: Changzhou
Suzhou
DeqingGuiyang
Zhangjiakou
Huaian
Tianjin
Xushui
After 2016CH Auto: SuzhouDongfeng: Wuhan IIIFaraday: DeqingGAC: Urumqi, HangzhouGeely: Baoji, Zhangjiakou, GuiyangMinan: HuaianNEVS: TianjinWangxiang: HangzhouGreatwall: XushuiJAC: Wuhan
1.1M
NEV2016 Post 2016
2017 Spring Automotive Conference | 8 March 2017

© 2017 IHS Markit
R&D establishment by China brands overseasEstablishing new plants and R&D centres reflect COEMs’ ambitions
Production
R&D
BAIC
NEXTEV
BYD
Volvo
SAIC
GWM
ChanganJACVolvo
JAC
Changhe
SAICGWM Lifan
JACHaima
FotonSAIC
SAICChery
Foton
R&D spending in 2015
0
1
2
3
4
5
6
7
8
9
Bill
ion
EURO
Growth2015 vs 2011
40%31%
300%
60%
186%
2017 Spring Automotive Conference | 8 March 2017
© 2017 IHS Markit
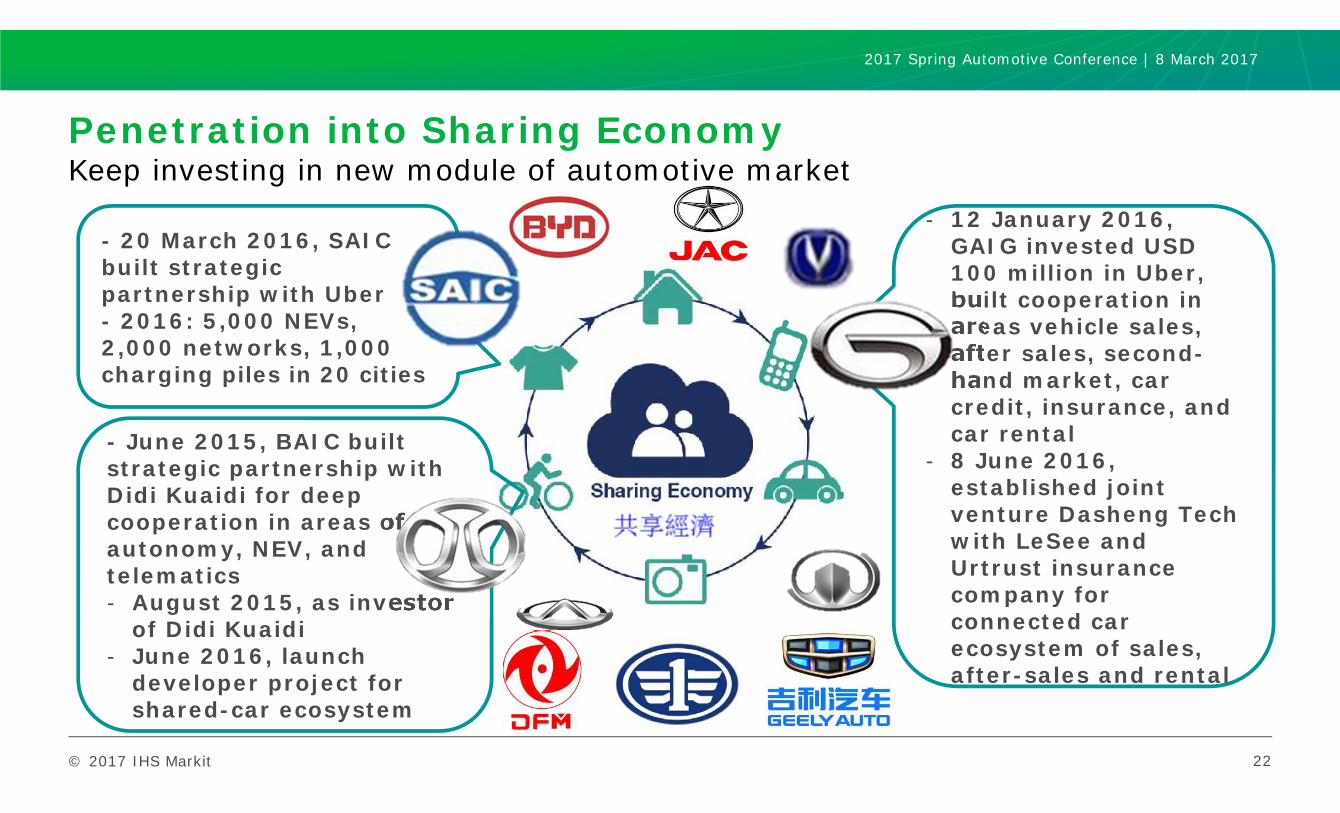
Penetration into Sharing EconomyKeep investing in new module of automotive market
22
- 20 March 2016, SAIC built strategicpartnership with Uber- 2016: 5,000 NEVs, 2,000 networks, 1,000 charging piles in 20 cities
- June 2015, BAIC built strategic partnership with Didi Kuaidi for deep cooperation in areas of autonomy, NEV, and telematics- August 2015, as investor
of Didi Kuaidi- June 2016, launch
developer project for shared-car ecosystem
- 12 January 2016, GAIG invested USD 100 million in Uber, built cooperation in areas vehicle sales, after sales, second-hand market, car credit, insurance, and car rental
- 8 June 2016, established joint venture Dasheng Tech with LeSee and Urtrust insurance company for connected car ecosystem of sales, after-sales and rental
2017 Spring Automotive Conference | 8 March 2017
© 2017 IHS Markit
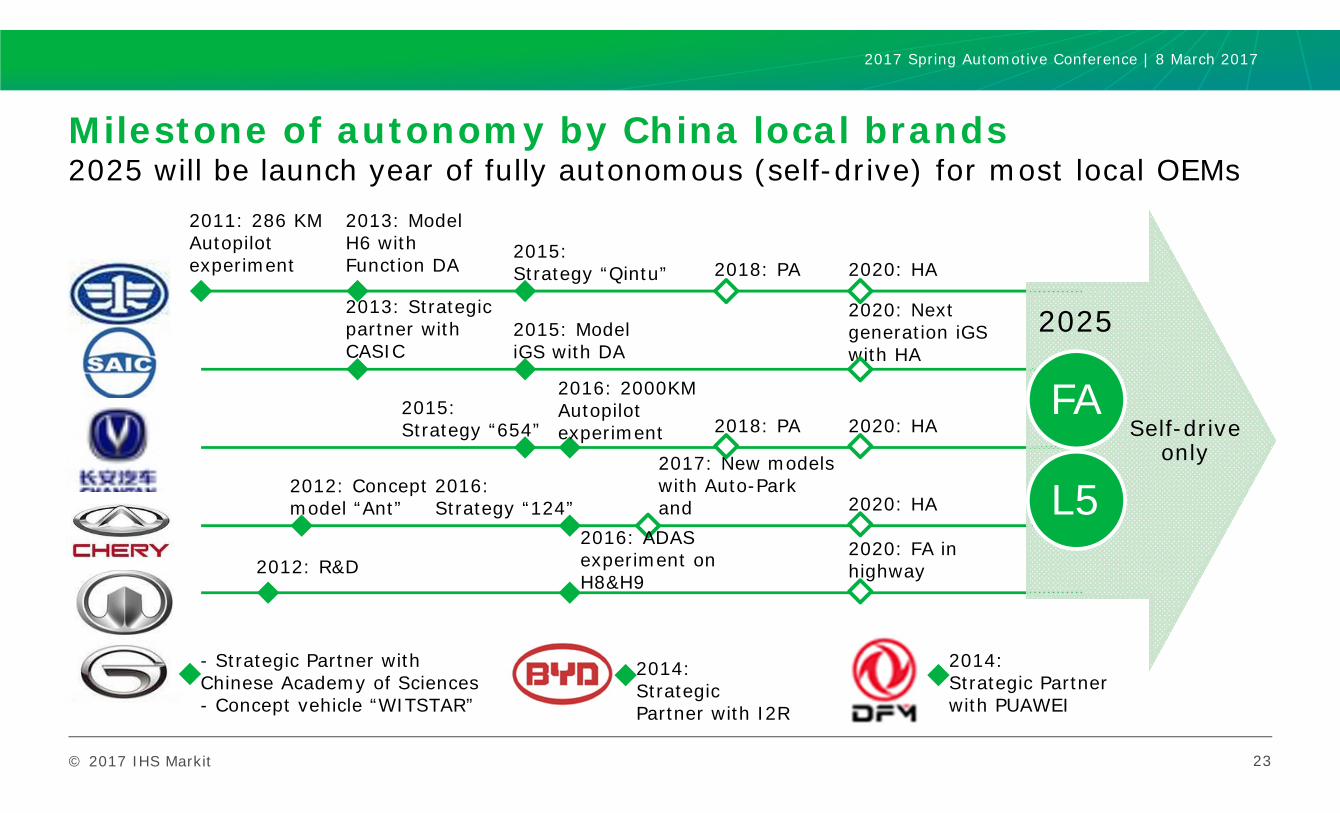
Milestone of autonomy by China local brands2025 will be launch year of fully autonomous (self-drive) for most local OEMs
23
2011: 286 KM Autopilot experiment
2013: Model H6 with Function DA 2018: PA 2020: HA
2015: Model iGS with DA
2020: Next generation iGS with HA
2016: 2000KM Autopilot experiment 2018: PA 2020: HA
2013: Strategic partner with CASIC
2015:Strategy “Qintu”
2015:Strategy “654”
2020: HA
2014:Strategic Partner with I2R
2014:Strategic Partner with PUAWEI
2017: New models with Auto-Park and
2020: FA in highway2012: R&D
- Strategic Partner with Chinese Academy of Sciences- Concept vehicle “WITSTAR”
2012: Concept model “Ant”
2016: ADAS experiment on H8&H9
2016:Strategy “124”
Self-drive only
FA
L5
2025
2017 Spring Automotive Conference | 8 March 2017

IHS MarkitTM COPYRIGHT NOTICE AND DISCLAIMER © 2017 IHS Markit.
No portion of this presentation may be reproduced, reused, or otherwise distributed in any form without prior written consent of IHS Markit. Content reproduced or redistributed with IHS Markit permission must display IHS Markit legal notices and attributions of authorship. The information contained herein is from sources considered reliable, but its accuracy and completeness are not warranted, nor are the opinions and analyses that are based upon it, and to the extent permitted by law, IHS Markit shall not be liable for any errors or omissions or any loss, damage, or expense incurred by reliance on information or any statement contained herein. In particular, please note that no representation or warranty is given as to the achievement or reasonableness of, and no reliance should be placed on, any projections, forecasts, estimates, or assumptions, and, due to various risks and uncertainties, actual events and results may differ materially from forecasts and statements of belief noted herein. This presentation is not to be construed as legal or financial advice, and use of or reliance on any information in this publication is entirely at your own risk. IHS Markit and the IHS Markit logo are trademarks of IHS Markit.
IHS Markit Customer Care:[email protected]: +1 800 IHS CARE (+1 800 447 2273)Europe, Middle East, and Africa: +44 (0) 1344 328 300Asia and the Pacific Rim: +604 291 3600
Thank you
Presentation Name / Month 2016